Embed Size (px)
Citation preview
Curse of Mis-alignment in Face Recognition: Problem and a Novel
Mis-alignment Learning Solution
Shiguang Shan1, Yizheng Chang
2, Wen Gao
1,2, Bo Cao
1, Peng Yang
1
1Institute of Computing Technology Chinese Academy of Sciences
2Department of Computer Science, Harbin Institute of Technology
{sgshan, yzchang, wgao, bcao}@jdl.ac.cn
Abstract
In this paper, we present the rarely concerned curse of
mis-alignment problem in face recognition, and propose a
novel mis-alignment learning solution. Mis-alignment
problem is firstly empirically investigated through
systematically evaluating Fisherface’s sensitivity to mis-
alignment on the FERET face database by perturbing the
eye coordinates, which reveals that the imprecise
localization of the facial landmarks abruptly degenerates
the Fisherface system. We explicitly define this problem as
curse of mis-alignment to highlight its graveness. We then
analyze the sources of curse of mis-alignment and group
the possible solutions into three categories: invariant
features, mis-alignment modeling, and alignment retuning.
And then we propose a set of measurement combining the
recognition rate with the alignment error distribution to
evaluate the overall performance of specific face
recognition approach with its robustness against the mis-
alignment considered. Finally, a novel mis-alignment
learning method, named E-Fisherface, is proposed to
reinforce the recognizer to model the mis-alignment
variations. Experimental results have impressively
indicated the effectiveness of the proposed E-Fisherface in
tackling the curse of mis-alignment problem.
1. Introduction
Face recognition (FR) researches have been motivated by
both their scientific values and wide potential applications
in public security, law enforcement and commerce.
Related research activities have significantly increased and
much progress has been achieved during the past few
years [1]. However, most of the current systems work only
under constrained conditions, even requiring the subjects
highly cooperative. Therefore, the general problems in FR
remain unsolved, especially under the practical
unconstrained conditions. Clearly, challenges lie in not
only the academic level but also the application system
designing level.
For a practical fully automatic FR system, face
detection, feature alignment and classification are three
indispensable steps. Indeed, much work has been done on
face detection, feature alignment and face recognition
respectively. However, we surprisingly noticed that little
attention has been paid to the seamless integration of these
steps into a complete system. To better concentrate on the
recognition problem, it has been an implied convention
that researchers in FR community always assume that the
facial features (generally the two eyes) in the input images
have been accurately localized, which is commonly
manually labeled in their experiments.
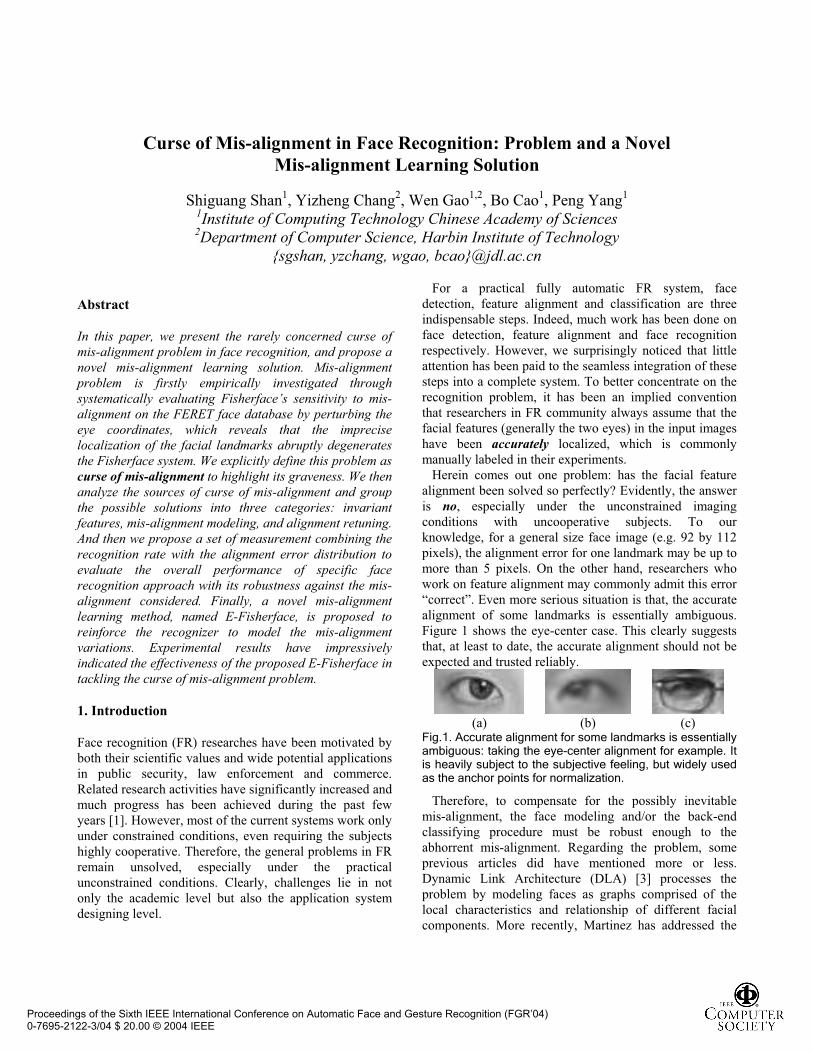
Herein comes out one problem: has the facial feature
alignment been solved so perfectly? Evidently, the answer
is no, especially under the unconstrained imaging
conditions with uncooperative subjects. To our
knowledge, for a general size face image (e.g. 92 by 112
pixels), the alignment error for one landmark may be up to
more than 5 pixels. On the other hand, researchers who
work on feature alignment may commonly admit this error
“correct”. Even more serious situation is that, the accurate
alignment of some landmarks is essentially ambiguous.
Figure 1 shows the eye-center case. This clearly suggests
that, at least to date, the accurate alignment should not be
expected and trusted reliably.
(a) (b) (c) Fig.1. Accurate alignment for some landmarks is essentially ambiguous: taking the eye-center alignment for example. It is heavily subject to the subjective feeling, but widely used as the anchor points for normalization.
Therefore, to compensate for the possibly inevitable
mis-alignment, the face modeling and/or the back-end
classifying procedure must be robust enough to the
abhorrent mis-alignment. Regarding the problem, some
previous articles did have mentioned more or less.
Dynamic Link Architecture (DLA) [3] processes the
problem by modeling faces as graphs comprised of the
local characteristics and relationship of different facial
components. More recently, Martinez has addressed the
Proceedings of the Sixth IEEE International Conference on Automatic Face and Gesture Recognition (FGR’04) 0-7695-2122-3/04 $ 20.00 © 2004 IEEE

imprecise localization problem by finding the subspace
that represents this error for each of the training images
[4]. Note that, perturbation method [5] and global affine
transformation correlation [6] have also been proposed to
address the similar problem in the OCR field. Yet, these
solutions are far from being systematical and deep. This
paper attempts to investigate the problem systematically
and quantitatively.
2.Curse of mis-alignment: problem, empirical
investigation, and category of possible solutions
Fisherface [2] has been recognized as one of the most
successful FR methods. Our static tests of Fisherface on
many databases also show its excellent performance
provided that the faces have been manually aligned
accurately. However, it is totally not the same case for our
practical system based on Fisherface, which has puzzled
us a lot. To investigate this strange phenomenon, we
collected many face images that have been incorrectly
recognized. The results showed that for most of them, the
centers of the eyes have been inaccurately localized with a
possible deviation of up to 5 pixels from their real
positions. Namely, the performance degradation mostly
resulted from the incorrect alignment. This suggests that,
to solve this problem, one should further develop more
accurate face alignment method; on the other hand, the
robustness of the face modeling and classification method
to mis-alignment must be greatly improved. To go deep
into the problem, we begin from evaluating the Fisherface
systematically.
2.1 Evaluating Fisherface’s robustness to mis-
alignment
Fisherface [2] is one of the most successful FR
technologies, which conducts Fisher Discriminant
Analysis (FDA) after PCA. To evaluate its robustness to
mis-alignment, we test it on the FB probe set from the
FERET face database. Fig.1 shows the structure of the
FERET standard face database we use to evaluate
Fisherface’s robustness to mis-alignment. Note that the
FERET face database has strictly distinguished the testing
set (composed of Gallery and Probe sets) from the training
set.
In the FERET face database, the coordinates of the eyes
in all the face images have been provided, which can be
used as the ground-truth alignment. In our face
recognition system, faces are normalized as shown in
Fig.2. Faces are firstly cropped out, as Fig.2 (c), by
placing the two eyes at fixed locations specified in Fig.2
(a). A mask, as shown in Fig.2 (d), is then covered over
the face region to eliminate the background and hairstyle.
Eventually, all faces are warped to the size of 64x64 as
shown in Fig.2 (e) from its original form as in Fig.2 (b).
Table.1 Structure of the FERET face database we use to evaluate Fisherface’s robustness to mis-alignment
Database#Pers
ons
#Ima
gesDescription
Training set (L) 429 1002 Near-frontal faces
Gallery
(G)1196 1196
Near-frontal faces
under normal lighting
Testin
g S
et
Probe
Set--FB1195 1195
Near-frontal faces
under Normal lighting
with different
expressions.
D
tDhD
bD
tD
hD
bD
(a) (b)
(c) (d) (e) Fig.2 Face normalization method in our experiments
To evaluate the Fisherface’s robustness to mis-alignment
systematically and quantitatively, we test the variance of
its recognition rate with the deliberated perturbation of the
eye coordinates of the probes in order to observe the
relationship between the recognition rate and the mis-
alignment degree. It is not difficult to understand that the
mis-alignment of the eyes is equivalent to the variation of
the affine parameters such as translation, rotation and
scale. Concisely, experiments are conducted to investigate
the influence of the variation of translation, rotation and
scale separately rather than their combination. Figure 3
illustrates some examples with normalization error due to
the mis-alignment of translation, rotation and scale, from
which much appearance variation can be observed. Note
that, nevertheless, in our experiments, the alignment of the
images in the training set and the gallery is kept precise,
that is, the PCA and LDA are both trained normally
without any perturbation.
The evaluation results are shown in Figure 4 with (a) (b)
and (c) representing the translation, rotation and scale
cases respectively. Note that, in figure 4 (b), each
graduation (about 4.2 degrees) of the horizontal axis is
caused by one pixel deviation of each eye from its ground-
truth position along the opposing vertical direction (that is,
Proceedings of the Sixth IEEE International Conference on Automatic Face and Gesture Recognition (FGR’04) 0-7695-2122-3/04 $ 20.00 © 2004 IEEE

one up, the other down). Similarly, in figure 4 (c), each
graduation (about 0.07 scale change) comes from one
pixel deviation of each eye from its ground-truth position
along the opposing horizontal direction (that is, one left,
the other right).
(a) (b) (c) Fig. 3 Normalization error due to mis-alignment
0%
10%
20%
30%
40%
50%
60%
70%
80%
90%
100%
- 4 - 3 - 2 - 1 0 1 2 3 4
Translation
(Pixel)
Recognition rate
(a)Translation
0%
10%
20%
30%
40%
50%
60%
70%
80%
90%
100%
- 16. 5 - 12. 5 - 8. 4 - 4. 2 0 4. 2 8. 4 12. 5 16. 5
Rotation(degree)
Recognition
rate
(b) Rotation
0%
10%
20%
30%
40%
50%
60%
70%
80%
90%
100%
0. 7 0. 78 0. 85 0. 93 1 1. 07 1. 15 1. 22 1. 3
Scale
Recognition
rate
(c) Scale
Fig. 4. Relationship between the rank-1 recognition rate of the Fisherface and the mis-alignment of translation, rotation and scale
From Figure 4, one can see clearly that the rank-1
recognition rate of the Fisherface method degrades
abruptly with the increase of the mis-alignment. For
example, 10 percents’ decrease is observed for a pixel
translation, while 20 percents for 4.2 degrees of rotation,
and almost 30 percents for 0.07 scale changing also
caused by a pixel deviation. Such abrupt degradation of
the performance is hardly acceptable for a practical face
recognition system, in which mis-alignment of one or two
pixels is almost unavoidable. Therefore, it is really a
problem that must be paid more attention seriously.
2.2 Problem analysis and possible solutions
To address the mis-alignment problem clearly and
highlight the significance of the problem, in this paper, we
explicitly define the “curse of mis-alignment” problem as
follows. We then discuss the sources of curse of mis-
alignment, as well as the possible solutions.
Definition 1: Curse Of Mis-Alignment (Hereinafter
abbreviated as COMA)
Curse of mis-alignment is defined as the abrupt
degradation of the recognition performance when small
mis-alignment occurs which is caused by the inaccurate
localization of the facial landmarks.
The purpose of alignment is to build the semantic
correspondence between the pixels in different images,
and eventually to classify by matching the pixels with the
same semantic meanings. Therefore, mis-alignment
implies that the classification may base on totally
meaningless matching. Figure 5 (a) through (c) illustrate
this point clearly in an extreme but intuitive way, in which
one attempts to match two uniform single-pixel rectangle
with one (red and dashed line) being the shifted, rotated,
and scaled version of the other (blue and real line).
Evidently, the matching would be meaningless even with
only one pixel of mis-alignment. Figure 5 (d) through (g)
show the similar case for face images, in which (e) is a
scaled version of (d), (f) is their blend and (g) is the result
of absolute subtracting (e) from (d). Much unexpected
difference appears that may lead to mis-classification
eventually.
(a) (b) (c)
(d) (e) (f) (g) Fig. 5 Meaningless matching caused by mis-alignment
Possible solutions to COMA can be divided into three
categories: invariant features, mis-alignment modeling,
and alignment retuning.
For invariant feature methods, one attempts to model
face images using mis-alignment invariant features to
achieve robust recognition. Gabor wavelet based local
features [3] have been proposed as such kind of feature.
The second approach would not rely on invariant feature,
but try to learn the mis-alignment into the face modeling
or classification. The method proposed by Martinez
belongs to this category, in which the gallery is augmented
by perturbation and modeled by Gaussian Mixture Models
Proceedings of the Sixth IEEE International Conference on Automatic Face and Gesture Recognition (FGR’04) 0-7695-2122-3/04 $ 20.00 © 2004 IEEE

(GMM) [4]. We have also worked on this method
previously [7].
Since COMA comes up from alignment error, the third
method naturally further retunes the alignment. A typical
method is the Global Affine Transform method [6].
However, it should be different from pure alignment
algorithms in that the retuning should rationally make use
of the feedback information from the matching or
classification procedure.
In addition, it is a natural choice to integrate these three
strategies for more robust algorithms.
3. Performance evaluation when considering mis-
alignment
Distinct algorithms would have different robustness to
mis-alignment. Hence, the pure rank-1 recognition rate,
when no mis-alignment occurs, would no longer be
appropriate for evaluating and comparison. Considering
two different algorithms A and B, how their recognition
rates vary with the degree of mis-alignment has been
drawn (tested using the method in section 2.1) in Figure 6.
As can be seen, under well-alignment situation, B’s
recognition rate is as high as 100%, while that of A’s is
only 92%. Traditionally, we would safely conclude that B
outperforms A. However, is it the fact? Our answer is
“NO”. This may seem somewhat anti-intuitive, but we
would soon demonstrate its correctness.
0
0. 1
0. 2
0. 3
0. 4
0. 5
0. 6
0. 7
0. 8
0. 9
1
- 3 - 2 - 1 0 1 2 3
Degree of misalignment
Reconitioin rate A
B
C
Fig.6 Relationship between the mis-alignment and the recognition rates of three FR methods A, B, and C
Let us consider how it would be if we integrate A and B
into a practical face recognition system. We further
assume A and B adopt the same frontal-end feature
alignment method, which is unavoidably non-perfect, but
with a Gaussian distributed mis-alignment from the
ground truth, that is, the alignment error satisfies:
),(~)( 2Np . (1)
where *),( PPd is the deviation, with P the localized
position and P* the ground truth. We then evaluate the
performance of different algorithms as follows:
Definition 2. Overall recognition rate considering mis-
alignment robustness is defined as:
drPr )()(*(2)
where is the degree of mis-alignment; restricts the
range of possible mis-alignment; )(P is the pdf of the
mis-alignment; and )(r represents the recognition rate
when mis-alignment occurs.
R* is in fact the weighted average of the recognition rate
with its corresponding mis-alignment probability.
Therefore, it is more appropriate than the pure single
recognition rate to evaluate the performance of a practical
system integrated by the feature alignment procedure and
the recognition procedure.
Nevertheless, it is also necessary to evaluate the
robustness of an algorithm to the mis-alignment
independent of its recognition rate. For example, consider
the algorithm C, whose recognition rates are 10% lower
than A’s, as shown in Figure 6. Intuitively, C should have
the same robustness to mis-alignment as A. To process
this case, we further define the following robustness
measurement:
Definition 3. Robustness to mis-alignment is defined as:
0
*
0
)()(
r
rd
r
rPR . (3)
where 0r is the recognition rate with perfect alignment.
R, ranging in (0, 1), measures the degradation degree of
a recognition method against the mis-alignment. A larger
R implies the recognition method be more robust (i.e. less
sensitive) to the mis-alignment.
The definition of the r* and R greatly facilitates the
evaluation of different algorithms when considering the
mis-alignment. Take A, B, and C in figure.6 for example,
assuming )1,0(~)( Np , their r* and R are shown in
table.2, from which we can evidently conclude that A
outperforms B when mis-alignment is considered. In
addition, one can see that C has the same robustness as A,
that is, RC= RA, though its r* is 10% lower than that of A’s,
which completely coincides with the intuition.
Table.2 Performance comparison between A, B, and C with the proposed evaluation measurements
Algorithms r0 (%) r*(%) R
A 92 82.3 0.895
B 100 79.5 0.795
C 82 72.3 0.895
Proceedings of the Sixth IEEE International Conference on Automatic Face and Gesture Recognition (FGR’04) 0-7695-2122-3/04 $ 20.00 © 2004 IEEE

4. Proposed E-Fisherface: a mis-alignment learning
solution
Mis-alignment leads to the divergence of the samples from
the same class, that is, it enlarges the within-class scatter
and reduces the between-class scatter to some degree. That
is why the Fisherface has degraded abruptly when mis-
alignment occurs with even very small deviations.
Accordingly, we propose a natural way to solve the curse
of mis-alignment problem by learning the appearance
variations due to mis-alignment, which we call “Enhanced
Fisherface” (hereinafter abbreviated as E-Fisherface),
which is essentially a training-reinforced version of the
original Fisherface method.
4.1 Design of the E-Fisherface method
Simply speaking, E-Fisherface firstly generates multiple
“virtual” samples from each sample in the training set by
perturbing the positions of the landmarks, such as the
centers of the two eyes. These “virtual” samples are then
fed into the training stage to compute the FDA, thus, the
mis-alignment can be modeled into the FDA to converge
the within-class samples and diverge the between-class
ones. The procedure is described in detail as follows:
4.1.1 Compute PCA from the original training set.
Gray-level image is commonly too high dimensional for
performing effective FDA, therefore, PCA is used prior to
the FDA. As to the training set for learning PCA, there are
two alternatives: one is the original training set; the other
is the augmented training set. Considering the computing
complexity, we choose to use the original training set. For
the FERET case, all the 1002 face images in the training
set are normalized (as described in section 2.1) and used to
compute PCA. The leading 400 eigenfaces are reserved to
form the Wpca for FDA.
4.1.2 Compute FDA from the augmented training set
For each face image in the training set, we then derive
multiple normalized face samples by perturbing its eye
coordinates from their ground-truth positions in a mode of
eight-neighbors deviation. As shown in Figure 7, each eye
has 9 positions to move. Therefore, totally 9x9=81 virtual
samples can be derived from one input example. Figure 8
illustrates some examples of the derived virtual samples.
Figure.7 The eight-neighbors for the eye center perturbation
Thus, for the FERET training set with 1002 images,
1002x81=81,162 examples are obtained. These face
images are then projected to the Wpca to reduce dimension
from 4096 to 400. And then the reduced PCA features are
used to compute the FDA matrix Wfda, which is expected
to have modeled the appearance variations, caused by the
mis-alignment, as within-class variations.
4.1.3 Recognize using the enhanced FDA
After the Wpca and Wfda have been computed, the
recognition process becomes a simple one, which is totally
the same as in Fisherface. Namely, all the images in the
gallery are normalized, projected to PCA, and converted
to FDA feature eventually. For each probe in the FB, it is
processed in the same way to get its FDA feature, and then
Figure.8 Examples of virtual face images derived from one training sample by 8-neighbors perturbation
the resulting FDA feature is matched through all the FDA
features in the gallery to determine the maximal similarity
as the final recognition results.
Note that the proposed method is very different from the
method proposed by Martinez [4] in that, 1) In our method,
perturbation occurs in the training stage to augment the
training set rather than the gallery in the testing stage as in
Martinez’s method; 2) In our method, FDA is computed to
learn the mis-alignment for all the face images to be
processed in the training stage, while in Martinez’s
method, Gaussian mixture models have to be learned for
each face image in the gallery. Therefore, our method does
not increase the spatial and temporal complexity that much
as Martinez’s method, except for the extra time for
training the FDA from the augmented training set.
4.2 Experiments and Comparison
We then test the proposed E-Fisherface method and
compare it with the Fisherface from the angle of their
robustness to the mis-alignment. Figure 9 and table 3
illustrate the comparison.
The comparison has evidently indicated that the
proposed E-Fisherface has much better overall
performance than the original Fisherface, except for a bit
decrease when the alignment is perfect enough. From
Figure 9, one can easily observe that the performance
curve of the E-Fisherface is much flatter than the original
Fisherface. Furthermore, from Figure 3, we can also
evidently find that the overall recognition rates of the E-
Fisherface are much higher than the original Fisherface
when considering mis-alignment robustness. Therefore,
we can convincingly conclude that the propose E-
Proceedings of the Sixth IEEE International Conference on Automatic Face and Gesture Recognition (FGR’04) 0-7695-2122-3/04 $ 20.00 © 2004 IEEE

Fisherface is more robust against the mis-alignment
especially for the rotation and scale cases.
5. Conclusions and future work
In this paper, the rarely concerned curse of mis-alignment
problem in face recognition is systematically investigated,
and a novel mis-alignment learning solution is proposed as
well. The main contributions of this paper include:
(1) Curse of mis-alignment problem is explicitly defined
to highlight its graveness through systematical
empirical investigation of the Fisherface’s sensitivity
to mis-alignment on the FERET face database by
perturbing the eye coordinates, which reveals that the
imprecise localization of the facial landmarks abruptly
degenerates the Fisherface system.
(2) We then analyze the sources of curse of mis-
alignment and categorize the possible solutions into
three categories: invariant features, mis-alignment
modeling, and alignment retuning.
(3) A set of measurement combining the recognition rate
with the alignment error distribution is proposed to
evaluate the overall performance of specific face
recognition method when its robustness against the
mis-alignment is considered and specific mis-
alignment distribution is given.
(4) Finally, a novel mis-alignment learning method,
named E-Fisherface, is proposed to reinforce the
Fisherface to model the mis-alignment variations.
Experimental results have impressively indicated the
effectiveness of the proposed E-Fisherface of tackling
the curse of mis-alignment problem.
(5) Our future work would focus on other solutions to
COMA problems, such as searching mis-alignment
invariant features, or retuning the alignment based on
the feedback of the matching confidence. The
combination of these methods should also be
considered.
Acknowledgement
This research is partially sponsored by Natural Science
Foundation of China under contract No.60332010,
National Hi-Tech Program of China (No. 2001AA114190
and 2002AA118010), and ISVISION Technologies Co.,
Ltd.
Reference
[1] R.Chellappa, C.L.Wilson, S.Sirohey, Human and
Machine Recognition of faces: A survey,
Proceedings of the IEEE, vol.83, no.5, 1995
[2] P.N.Belhumeur, J.P.Hespanha etc. Eigenfaces vs
Fisherfaces: recognition using class specific linear
projection. IEEE TPAMI, 20(7), pp711-720, 1997
[3] M.Lades, J.C.Vorbruggen, etc, Distortion Invariant
Object Recognition in the Dynamic Link
Architecture, IEEE Trans. On Computers, 42(3), pp
300-311, 1993
[4] A.M. Martinez. Recognizing Imprecisely Localized,
Partially Occluded and Expression Variant Faces
from a Single Sample per Class, IEEE TPAM, Vol.
24, No. 6, pp. 748-763, 2002
[5] Thien M. Ha and Horst Bunke, Off-Line,
Handwritten Numeral Recognition by Perturbation
Method, IEEE TPAMI, 19(5), pp535-539, 1997
0%
10%
20%
30%
40%
50%
60%
70%
80%
90%
100%
- 4 - 3 - 2 - 1 0 1 2 3 4Translation (Pixels)
Reconition
Rate
Fi sher f ace
E- Fi sher f ace
(a) Translation
0%
10%
20%
30%
40%
50%
60%
70%
80%
90%
100%
- 16. 5 - 12. 5 - 8. 4 - 4. 2 0 4. 2 8. 4 12. 5 16. 5
Rotation (Degree)
Recognition
Rate
Fi sher f ace
E- Fi sher f ace
(b) Rotation
0%
10%
20%
30%
40%
50%
60%
70%
80%
90%
100%
0. 72 0. 79 0. 86 0. 93 1 1. 07 1. 14 1. 21 1. 28
Scale
Recognition
Rate
Fi sher f ace
E- Fi sher f ace
(c) Scale Fig.9 Comparison between the Fisherface and the proposed E-Fisherface from the angle of robustness to mis-alignment
Table.3. Performance comparison of the Fisherface and the proposed E-Fisherface using the proposed evaluation measurement assuming )1,0(~)( Np
Mis-
alignment Methods r0 (%) r*(%) R
Fisherface 94.8 80.2 0.846 Translation
E-Fisherface 93.4 86.4 0.925
Proceedings of the Sixth IEEE International Conference on Automatic Face and Gesture Recognition (FGR’04) 0-7695-2122-3/04 $ 20.00 © 2004 IEEE

Fisherface 94.8 71.2 0.751 Rotation
E-Fisherface 93.4 87.0 0.931
Fisherface 94.8 70.8 0.747 Scale
E-Fisherface 93.4 82.9 0.887
[6] T.Wakahara, Y.Kimura, A.Tomono, Affine-
Invariant Recognition of Gray-Scale Characters
Using Global Affine Transformation Correlation,
TPAMI 23(4) pp384-395, 2001
[7] S.Shan, W.Gao, D.Zhao, Face Identification Based
On Face-Specific Subspace, International Journal of
Image and System Technology, 13(1), pp23-32,
2003
Proceedings of the Sixth IEEE International Conference on Automatic Face and Gesture Recognition (FGR’04) 0-7695-2122-3/04 $ 20.00 © 2004 IEEE