Embed Size (px)
Citation preview
CURTIN UNIVERSITY OF TECHNOLOGY
PERTH, AUSTRALIA
SCHOOL OF FINANCE AND ECONOMICS
Unit: Business 595
Name of Supervisor: Michael W.Thorpe
RESEARCH PROJECT
A STUDY IN THE EVOLUTION OF THE ROLE OF SMALL-SCALE INDUSTRIES IN THE EXPORT OF MANUFACTURES FROM INDIA -
A COMPARISONWITH OTHER ASIAN COUNTRIES,
ESPECIALLY WITH JAPAN AND KOREA
By
SANJEEV SABHLOK
Second Semester, 1992
Submitted on: 30.10.92
1

CONTENTS TABLE------------------------------------------------------------------------------------------------------------------------Chapter and Section Page Number Topic Number------------------------------------------------------------------------------------------------------------------------0.0 ACKNOWLEDGEMENTS VII
0.1 ABBREVIATIONS VIII
1.0 EVOLUTION OF SMALL-SCALE MANUFACTURING INDUSTRY WORLD-WIDE SINCE THE INDUSTRIAL REVOLUTION 1
1.1 Definition of small business1.1.1 Some different definitions1.1.2 The concept of small industry1.1.3 Significance of Small-business
1.2 An overview of industrial structure since the Industrial Revolution1.2.1 Pre-industrial production1.2.2 Advent of industrial revolution and
mass production
1.3 Post 1930s: reversal of trend?1.3.1 The debate on changing industrial
structure1.3.2 What do the statistics say?1.3.3 Emerging industrial structure
a tentative conclusion
1.4 What are the reasons for the continuance of the small-scale sector?1.4.1 Diseconomies of scale1.4.2 Minimum Economic Size (MES)1.4.3 Other factors
1.5 Arguments in favour of promoting small industry1.5.1 The idealistic argument1.5.2 The psychological argument1.5.3 The humanitarian argument1.5.4 The economic argument1.5.5 The de-centralisation argument1.5.6 The social argument1.5.7 The political argument1.5.8 The latent resource argument1.5.9 The technological argument
1.6 Hypothesis of this paper
2
2.0 RECOGNITION OF THE ROLE OF SMALL INDUSTRIES IN INDIA 19
2.1 Rapid increase in unemployment due to British policies2.1.1 Spinning industry2.1.2 Handloom industry
2.2 Champion of the dispossessed - Mahatma Gandhi
2.3 Outcome: recognition of the role of the small sector
2.4 Growth of small industry in India till independence
2.5 Questions about economic viability of the traditional cottage industry
3.0 POST-INDEPENDENCE DEVELOPMENT OF SMALL-INDUSTRY SECTOR IN INDIA 25
3.1 Definitional issues3.1.1 Village and Small-scale Industries (VSI)3.1.2 Small-scale and Ancillary Industries (SIDO)3.1.3 Tiny Sector (SIDO)3.1.4 Non-SIDO industry (Village or Cottage industry)
3.2 Post-independence thinking and policy on village and small industry
3.3 Allocation of funds
3.4 An overview of the administrative policies adopted for the SSI sector
3.5 A Detailed look at policy measures3.5.1 Tax exemptions3.5.2 Provision of physical infrastructure3.5.3 Reservation of production exclusively
to the SSI3.5.4 Forward and backward linkages
3.5.4.1 Credit and finance3.5.4.2 Technical assistance3.5.4.3 Allocation of raw materials, imported components and equipment
3.5.4.4. Power Subsidy 3.5.4.5 Marketing assistance 3.5.4.6 Scheme of DICs 3.5.4.7 Registration of SIDO units
3.5.5 Revival of the traditional sector
3.6 Evaluation of the assistance provided3.6.1 The “theoretical” quantum of assistance3.6.2 The reality of disbursement of incentives3.6.3 Multiplicity of agencies3.6.4 Agency to provide diversified services
3.7 Some consequences of these policies
3
3.7.1 Growth3.7.1.1 Growth in number of SIDO SSI units3.7.1.2 Growth in employment3.7.1.3 Growth in output3.7.1.4 Growth seen as being sub-optimal
3.7.2 Gate-crashing by capitalists3.7.3 Incentive to remain small3.7.4 Less sub-contracting3.7.5 High labour turnover in small industries3.7.6 Consequences for the traditional sector
4.0 EFFICIENCY OF THE SMALL-SCALE INDUSTRIES SECTOR WITH REFERENCE TO INDIA 52
4.1 Static efficiency arguments4.1.1 Productivity4.1.2 Capital efficiency4.1.3 Employment generation and Labour
Intensity4.1.4 Resource allocation and utilisation4.1.5 Appropriate Technology argument4.1.6 Balanced regional growth
4.2 Dyanmic efficiency arguments
4.2.1 Innovation4.2.1.1 General Innovation4.2.1.2 Technical efficiency4.2.1.3 Technology Transfer
4.2.2 Flexibility of Small Enterprise4.2.3 Seed-Bed Function of Small Enterprise
4.3 Conclusion
5.0 A LOOK AT THE SSI SECTOR IN JAPAN, KOREA AND OTHER ASIAN ECONOMIES, WITH REFERENCE TO EXPORTS, OVER THE 20TH CENTURY 64
5.1 A look at small-sector export performance world-wide with particular reference to Asia.
5.2 Japan
5.2.1 Definition of Small Enterprises in Japan5.2.2 Significance of SME in the economy of Japan
5.2.2.1. Number of enterprises5.2.2.2. Employees5.2.2.3 Value added
5.2.3 Growth of Small and Medium Enterprises5.2.4 Exports from small and medium enterprises in Japan5.2.5 Role of SMEs in the national economy5.2.6 Relationship with big industry
4
5.2.6.1 Exports paying for imports of capital machinery5.2.6.2 Sub-contracting
5.2.7 Government Assistance to SME5.2.7.1 Laws5.2.7.2 Management and Productivity5.2.7.3 Institutions to provide finance5.2.7.4 Tax reliefs5.2.7.5 Smaller Enterprise Agency under MITI
5.2.8 Problems of the SMEs in Japan
5.3 Korea
5.3.1 Industrial growth of Korea 5.3.2 Definition of small and medium enterprises in Korea
5.3.3 Role of small and medium enterprises in Korea5.3.4 Number of SMEs5.3.5 Employment5.3.6 Productivity5.3.7 Role of SMEs in export5.3.8 The comparative advantage in Korea5.3.9 Government policy on SMEs
6.0 AN OVERVIEW OF THE EXPORT POLICY OF INDIA SINCE 1947 94
6.1 A brief picture of India's export performance since independence
6.2 Factors determining exports from India since independence
6.2.1 Export Policies6.2.1.1 Import substitution6.2.1.2 Export promotion6.2.1.3 Import Policy6.2.1.4 Neglect of comparative advantage
6.2.2 The influence of industrial policy on export growth6.2.3 External constraint6.2.4 Other factors
7.0 ANALYSIS OF THE EXPORT PERFORMANCE OF THE INDIAN SMALL-SCALE INDUSTRY SECTOR 114
7.1 Statistics of small-industry exports from India
7.2 Trends emerging from available data
7.3 Major small-industries focusing on exports7.3.1 Readymade garments7.3.2 Leather manufactures7.3.3 Handicrafts7.3.4 Engineering goods
7.3.5 Shares of small-industry in various industry exports
7.4 Markets of small-industry exports
5
7.5 Institutional framework for small-industry exports
7.6 Export finance and insurance7.6.1 Short-term finance7.6.2 Guarantees7.6.3 E.C.G.C. cover against risks7.6.4 Forward exchange cover
7.7 Causes of poor export performance of the small-industry sector7.7.1 Skewed economy at time of independence7.7.2 Inward-looking strategies7.7.3 Domestic focus of Industry7.7.4 Growing domestic middle class markets7.7.5 Pervasive corruption
7.7.6 Reluctance to allow exchange rate to be determined by market forces7.7.7 High cost economy
7.7.8 Difficulties faced by small-scale industries in engaging in exports7.7.8.1 Lack of knowledge and skills for exports7.7.8.2 Poor quality of production
7.8 Steps taken by government to assist small-scale industries in exporting their goods
7.9 Effects of liberalisation of 1991 on small-scale industries7.9.1 Need to innovate and to improve quality7.9.2 Specific markets for small-industry7.9.3 Increase in sub-contracting7.9.4 Increase in exports
8.0 POLICY ISSUES EMERGING FOR SMALL-INDUSTRY EXPORTS FROM INDIA 132
8.1 Recognition of need of export driven growth
8.2 Strategic thinking and advantages
8.3 Recognition of the pivotal role of small industry in the economic growth strategy of India
8.4 Legislation on the rights of the small-scale industries
8.5 Need to do away with reservations
8.6 Upgrading industrial skills
8.7 Sub-contracting as a key strategy
8.8 Structural reforms and liberalisation
8.9 Rapic need to improve infrastructure including power
8.10 Thrust on primary and technical education
6
8.11 Other policy issues for government
8.12 Conclusion
REFERENCES 148
7
ACKNOWLEDGEMENTS
I wish to thank the High Commission of India, Canberra, and the Development Commissioner of Small-Scale Industries, New Delhi, for having promptly sent me some of the latest information on the small-scale sector of India, without which this study would have been incomplete.
I am also grateful to the painstaking look which my supervisor, Mr. Michael W. Thorpe, of Curtin University of Technology, gave to the draft output of this research project, and for his valuable comments and advice through the duration of this project.
Errors and ommissions are solely the responsibility of the undersigned.
30.10.92 (Sanjeev Sabhlok)
8

ABBREVIATIONS
AIMO All India Manufacturers OrganisationASI Annual Survey of IndustryCCS Cash Compensatory SupportCIER Centre for Industrial and Economic ResearchCMI Census of Indian ManufacturesDC (SSI) Development Commissioner (Small-Scale Industries)DGTD Directorate-General of Technical DevelopmentDIC District Industries CentreECGC Export Credit and Guarantee CorporationEEPC Engineering Export Promotion CouncilFASII Federation of Associations of Small Industries of IndiaFIEO Federation of Indian Export OrganisationsIDEI Institute for Design of Electrical Measuring InstrumentsJIT Just In TimeJPC Japanese Productivity CentreKOTRA Korea Trade Promotion CorporationLI Large IndustryMES Minimum Economic SizeMITI Ministry of Commerce and Industrial Trade (Japan)NSIC National Small Industries CorporationNIESBUD National Insitute for Entrepreneurial and Small Business DevelopmentNISIET National Institute of Small Industry Extension TrainingPPDC Product-cum-Process Development CentrePRS Personal Responsibility System (China)REP Replenishment LicenceRIPP Rural Industries Project ProgrammeSIDBI Small Industries Development Bank of IndiaSIDO Small Industry Development Organisation, IndiaSISI Small Industries Service InstituteSME Small and Medium EnterprisesSMI Small and Medium-scale IndustriesSSE Small-Scale EnterpriseSSI Small-Scale IndustriesSSMI Sample Survey of Manufacturing IndustryVSI Village and Small-Scale Industry
9
CHAPTER ONE
EVOLUTION OF SMALL-SCALE MANUFACTURING INDUSTRY WORLD-WIDE
SINCE THE INDUSTRIAL REVOLUTION
1.1 DEFINITION OF SMALL BUSINESS
1.1.1 Some different definitions
“Smallness” in business is a relative concept. But any discussion of the subject of small-scale manufacturing must begin with a look at a definition of this term, in order to understand the scope of its usage as well as ipoyts limitations, for purposes of comparing data across countries and over time.
Various countries have defined a small business differently, and these definitions have tended to vary over course of time. Hence we first take a look at some definitions to get an idea of the approaches taken to this question by different countries.
a) United States of America:
In the United States the definition used in the Small Business Act is “one that is independently owned and operated and that is not dominant in its field of operation” (Johns,1989:2). The Small Business Administration in US defines a small firm in terms of both employment, depending upon industry. Generally speaking, in the US a firm employing less than 500 persons would be considered small.
b) Japan:
In Japan, firms in mining and manufacturing, employing less than 300 persons, in wholesaling employing less and 100 and in retail and service, employing less than 50, are considered to be in the small business sector (Johns,1989: 2). We shall look into this definition in more details when we go to Chapter 5 (section 5.2.1).
c) England:
In England, the Bolton Committee (1972) fixed a ceiling of 200 employees in the manufacturing sector and 25 or less in construction, mining and quarrying.
d) Australia:
In Australia, there is no legislated definition on the size of a small business. At the same time, various studies have considered a manufacturing business small if it employed less than 100 persons and a non-manufacturing (service) business has been deemed to be small if it employed less than 20 persons (Johns, 1989:2). In particular, the Report of the House of Representatives Standing Committee on Industry Science and Technology on Small Business in Australia (1990) had this to say:
“The need for a definition:
The Committee concludes that a small business can be defined as:
10

* being independently owned and managed;
* being closely controlled by owner/managers who also contribute most, if not all, of the operating capital;
* having the principal decision making functions resting with the owner/managers.
... The Committee further concludes that a small business is one which employs up to:
* 20 people in non-manufacturing industries, and
* 100 people in manufacturing industries” (Standing Committee 1990: xiii).
The UK also does not have a legislated definition of small business, but the definition used by the Bolton Committee is often used.
e) India:
In India the definition of small industries has undergone changes over time, and is now primarily defined in terms of capital investment size; the field of activity is also taken into account. We will look into this matter in greater detail in Chapter 3 (Section 3.1).
f) World Bank:
The World Bank apparently considers different definitions. Among its recent definitions is the following:
“In the developing economies, we usually take `small' to mean less than 50 workers, when size is measured by employment. Within the small, we distinguish household manufacturing and workshops with up to 5 employees. Together we refer to them as cottage shops” (Little, 1970:300).
Thus most countries see small industry or small business either in terms of the number of persons employed or in terms of capital investment. Some take the field of activity also into account, and perhaps in some, a combination of all three aspects goes together. The advantage of using the number (of employees) criterion is that it requires little or no change in the face of inflation and other changes, but its major limitation is that it ignores capital intensity in industries. Even firms with very few employees can be actually large in real terms today, if they use a high degree of modern machinery. Cukor (1971: 61) has elaborated this issue:
“The line dividing small-scale industries from factories is not rigid, nor can the limits be traced by a single exclusive criterion. One criterion is, naturally, the manpower employed. But the value produced and the technology applied must also be taken into account. With highly productive equipment a smaller staff can produce a great deal. In this case a plant employing fewer people can be more like a factory in character than another one where more people are employed but produce less with simpler equipment.”
11
A few countries therefore prefer the use of capital employed as the main criterion for defining what is small in manufacturing. At the same time, “small business”, generally considered, includes the service sector and also retail trading. This is so in case of Japan, where they have the concept of small and medium “enterprise” rather than “industry”. In India, however, service industry is by and large excluded from the term “small-scale industry”.
1.1.2 The concept of small industry
We have noted above that various countries use slightly differing terms to mean the same or similar concept. These terms could be “small business”, “small-scale manufacturing”, “small and medium business”, “small-scale industries (SSI)”, “small and medium enterprises (SME)” and “small industry”. Hence we shall use these terms virtually interchangeably, depending upon the context, throughout this paper. “Small industry” is best treated as a concept rather than a rigid statistically measurable entity. Of course for statistical purposes, certain definitions are usually resorted to, which we shall have to keep in mind, depending upon the context.
According to K.T. Shah, “A Small-scale or cottage industry may be defined to be an enterprise or a series of operations carried on by a workman skilled in the craft on his responsibility, the finished product of which, he markets himself. He works in his home with his own tools and materials and provides his own labour or at most the labour of such members of his family, as are able to assist. These workers mostly by hand labour and personal skill, with little or no aid from modern power driven machinery, and in accordance with traditional technique. Such supplementary energy as is provided by animal power may add to the economy and efficiency of the industry. He works, finally, for a market in the immediate neighbourhood, that is to say in response to known demand with reference to quality as well as quantity” (cited in Mathur,1979: 3). But this definition has the defect of restricting the scope of small industries to mainly traditional modes of production. It would perhaps be more appropriate to pre-industrial household industry. However, it throws light on some of the important criteria of small production processes.
One would tend to support the brief and excellent description given by the Committee on Inquiry on Small Firms in England - also called the Bolton Committee Report, 1972 - which considered a firm to be small if it met three criteria:
“Firstly, in economic terms, a small firm is one that has a relatively small share of its market. Secondly, an essential characteristic of a small firm is that it is managed by owners or part-owners in a personalised way, and not through the medium of a formalised management structure. Thirdly, it is also independent in the sense that it does not form part of a larger enterprise and that the owner-managers should be free from outside control in taking their principle decisions” (Johns,1989: 1).
All we have to keep in mind is that due to the use of various statistical measures, it is not feasible to make satisfactory comparisons of the small business sector across countries and across time. Having said this, it should still be possible to make broad and generally valid derivations for purposes of policy by analysing this sector across different countries. This paper will strive to do precisely this, and shall consult secondary sources as its methodology.
1.1.3 Significance of Small-business
12

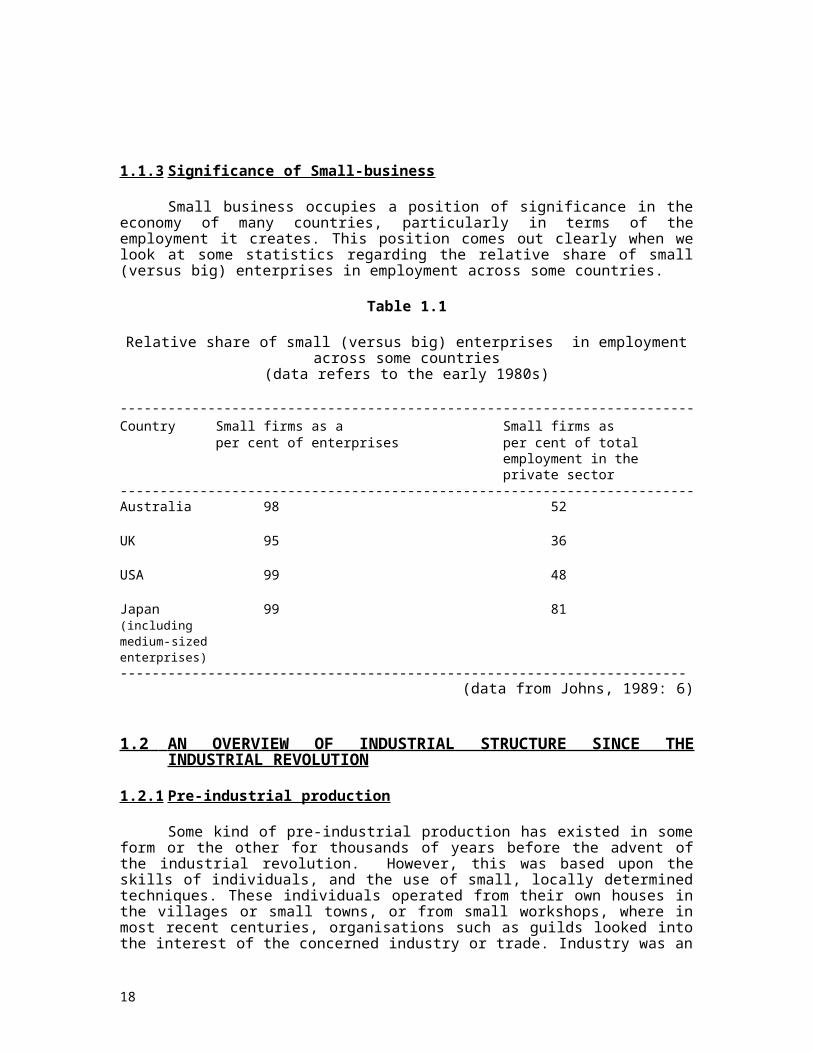
Small business occupies a position of significance in the economy of many countries, particularly in terms of the employment it creates. This position comes out clearly when we look at some statistics regarding the relative share of small (versus big) enterprises in employment across some countries.
Table 1.1
Relative share of small (versus big) enterprises in employment across some countries (data refers to the early 1980s)
------------------------------------------------------------------------Country Small firms as a Small firms as
per cent of enterprises per cent of totalemployment in theprivate sector
------------------------------------------------------------------------Australia 98 52
UK 95 36
USA 99 48
Japan 99 81 (including medium-sized enterprises)-----------------------------------------------------------------------
(data from Johns, 1989: 6)
1.2 AN OVERVIEW OF INDUSTRIAL STRUCTURE SINCE THE INDUSTRIAL REVOLUTION
1.2.1 Pre-industrial production
Some kind of pre-industrial production has existed in some form or the other for thousands of years before the advent of the industrial revolution. However, this was based upon the skills of individuals, and the use of small, locally determined techniques. These individuals operated from their own houses in the villages or small towns, or from small workshops, where in most recent centuries, organisations such as guilds looked into the interest of the concerned industry or trade. Industry was an offshoot of agriculture, and handicraft techniques were generally adopted. The kinds of tools used in the production process were simple, and did not see much improvement for long periods of time. Human power was at times supplemented with the use of animal power, but there were no major mechanical devices or electricity.
1.2.2 Advent of industrial revolution and mass production
The advent of the Industrial Revolution, dating from about the middle of the 18th century (Shepherd, 1990 : 221), saw the size of industry undergoing a major change, moving from the small, traditional business, to the larger ones, which were more capital intensive and mechanised. Additionally, labour had to move out from the villages to various places of work, the factories, leading to the phenomenon of rapid urbanisation. In these factories, production was
13
increasingly organised to achieve economies of scale in production. Initially, it appears that smaller firms predominated, as larger numbers of entrepreneurs entered into production. Industrialists took time to accumulate capital to expand to sizes now considered large. But the changes increasingly saw the firms growing larger.
The main causes of a change in industrial structure are (Shepherd,1990 : 222):
a) The advent of and use of hydro and other mechanical power, as well as of electricity.
b) The invention of a variety of new materials. The development of chemistry and physics had a dramatic influence on the range of raw materials available. Most of these materials, such as metals, chemicals, etc., were amenable to replication, on the large scale.
c) The transformation of transportation through the use of steam-powered railroads and ships. Trade and commerce became far more efficient than ever before. This led to, higher turnovers and lower profit per unit, increasing the purchasing power of the people, which fuelled demand and led to ever increasing production lots.
The reason for a quantum jump in the sizes of firms was of course Fordism. The coming of Ford in the beginning of the 20th century saw the introduction of assembly line manufacturing - now popularly known as “mass production”, which became the most prolific production technology the world has ever known (Hounsell,1984:1). Thus, during the period uptil the 1930s, the trend in the developed world was towards larger sizes as far as capital intensity is concerned. These changes provided technical economies of scale both at the plant level and in multiplant operations Shepherd (1990:222). This period saw also the substitution of skilled labour with semi-skilled, which was heavily specialised in specific areas of the production process, and the holistic view of the individual in the production process underwent a major change.
Academically, this period of increasing corporate sizes is of interest since the development of economics as a discipline dates to this period, as also the study of skills and techniques required to manage a much larger labour force and various coterminous activities, leading to the entire discipline of management.
1.3 POST 1930s REVERSAL OF TREND?
There is a continuous debate raging since a few decades regarding the changes taking place in the industrial structure. There are two views; one, which believes that the trend is towards the ever-increasing size of industry and the other, according to which there has been a reversal in trend and we are seeing the revival of the small industry, albeit in a changed form.
1.3.1 The debate on changing industrial structure
a) Increasing presence of small industry:
Shepherd feels that “after the 1930s, this tide appears to have waned or perhaps reversed, as several forces favouring small-scale technology have gained momentum” Shepherd (1990:222).
One of the main factors contributing to this has been the advance in communications, and particularly in electronics. According to Acs and Audretsch (1990:107), “With the
14
advent of numerical controls in the late 1940s, the potential emerged for reversing the 150-year old trend in machine tools favouring large-scale production”.
Thus, from somewhere in the middle of the 20th century, even large business has often become mechanised. The large firm has adapted numerically controlled machines to an even greater extent than the small scale. “One of the reasons why the implementation of flexible technology (made available by NC machines), may shift the firm-size distribution toward larger firms is the higher price for comparable machinery... Perhaps the relatively high cost of NC machines explains both their slow rate of diffusion as well as the bias in diffusion rates toward large firms” (ibid:107).
But along with this, much of the labour component has also been substituted by numerically controlled machines. There has thus been a steady shift in the deployment of labour from use of increasingly more labour to just that amount required to meet the economies of scale, using the state of the art technology. According to Acs (ibid), “the implementation of both programmable robots and NC machine tools is related to a shift in the size distribution toward small firms.”
Thus there is some evidence that firms are getting smaller, due to a change in the technology employed. However this change is not obvious enough to be observed universally, as was the case with mass production.
b) Stabilisation of role of small industry:
Cukor (1971), sees no relenting of the forces leading to larger sizes. “In the advanced countries, factory-type industry with larger plant sizes and scientifically based, continuously developing technology has almost entirely supplanted the small-scale forms in the production both of consumer goods and of materials and tools. Today's most dynamic, technologically sophisticated industries have not evolved at all from traditional small-scale technologies. Production of electrical energy, electronic equipment and plastics have developed under the conditions of large-scale production right from the start. Small-scale production is exceptional, and is maintained in order to secure the undisturbed supply of certain goods of artistic value (for example, needle-work and fancy leather goods)” (Cukor, 1971:61).
But he recognises that “... small industries have not entirely disappeared, but they have changed in character, or rather a new small-scale industry has come about which is a product of, and depends on, large-scale industry. Its main functions are servicing and repairing (of cars, radio, TV, buildings, etc.). To a smaller extent, it is performing special operations or turning out parts for the large-scale plants as a sub-contractor. This kind of modern small-scale industry is characteristic of a developed economy, but production of final products in this sector is not significant (Cukor,1971:62).”
Cukor then considers some statistics an surprisingly concludes that “It seems that in the developed countries the weight of small-scale industries within manufacturing is quite stable over the course of time, even if measured with the aid of various indicators.”
Thus, according to Cukor, the thrust towards larger sizes has been “neutralised” largely due to the intervention of sub-contracting, which as we shall see in the case of Japan, is indeed a very relevant factor.
c) Decreasing role of small industry:
15
The third view is that the share or presence of small industry is continually declining, except in a few pockets of the world. Little, et.al. (1987), feel that “There has been a relative decline of manufacturing establishments employing less than 500 workers for a long time, and the smaller the size class the greater the decline. But the eclipse of the small was especially pronounced from 1945-70 except in Japan, where the percentage of very small establishments (employing less than 21 workers) in the total actually rose slightly between 1960 and 1975” (Little et al,1987: 301). Further, “Although the decline (in the small enterprise sector) was general, the position reached around 1970 varied widely from country to country. Establishments with less than 200 workers accounted for between one-third and two-thirds of manufacturing employment, with no apparent relation to national income” (ibid).
Sen (1982: 124) feels that “In the West the capitalist mode overcame the pre-capitalist mode and in the course of its further development, large-scale enterprise gradually swallowed up small-scale industry. Wherever small-scale industry survived, they usually did so either as ancillary to large-scale industry or in areas which were not technically viable for the operation of the large-scale sector.”
But surprisingly, Little, et. al., ultimately add that: “Since 1970 the decline seems to have been arrested and even reversed, at least in the United Kingdom and the United States. ... After a long period of encouraging the formation of very large businesses, there has in recent years been a spate of legislation in favour of small firms, which are now widely believed to be essential to the continuing genesis of a desirable industrial size structure” (Little,1987:301).
1.3.2 What do the statistics say?
An attempt is made here to take a quick look at figures which could possibly aid in the understanding of the role of small business in the world today. There is obviously a major problem of availability of statistics in this sector, since many countries appear not to have collected census figures on the relative size of firms, even till the middle of the 20th century. For example, even in Australia, as in most other countries, there was no information available before 1974 on small business, when the Australian Bureau of Statistics first published information as at 30 June, 1969, regarding business enterprises classified according to employment size and industry class (Johns,1989:3). For India the position is quite similar, with the first all-India census of small industry being undertaken only in 1973.
The table given in the Annexure to this chapter (Ganguly,1985) looks at the proportion of manufacturing employment in small establishments in different countries.
a) Australia:
As there is no legislated definition, when we consider small firms as a percentage of total manufacturing employment, we find that in 1969, small business accounted for 32 per cent of total manufacturing employment. By June, 1980, there was a decline to 30.7 per cent, but by June, 1985, this had increased to 33.9 per cent (Johns,1989 : 8). But when we look at Ganguly's statistics we find that Australia had a high 60% of its employment in small business in 1963. If that be the case, then there has been a rapid decline in small firms in the 1960s, only to stabilise over the next two decades.
b) U.K.:
16
In UK, the similar statistics regarding share of small enterprises in manufacturing, amounted to 20.7 per cent in 1973, and increased to 24.3 per cent in 1980. Thus there is a marginal, increasing trend (Johns, 1989:8). Statistics in Ganguly appear to show different figures for the UK, but these show a stabilisation rather than an increase.
c) Other developed countries:
From Ganguly (1985) we see that in Japan, Switzerland, Italy, Spain, Belgium and Norway the proportion of manufacturing employment in small establishments has consistently ranged over a high increased over a high range of 51% to 68%. Others, such as South Africa, USA, Austria, Germany, ranged over a lower range of 30 to 40% and yet others such as Canada, have ranged in the 40s.
There is no definite trend visible across countries. In some, such as Japan, the share of small firms in employment has increased, in others it has declined (Sweden, for example). In others it has stabilised (the US,Canada, Italy, UK).
d) Developing countries:
In the developing countries, “small-scale handicrafts play an important part in the developing countries, within the existing and rather backward manufacturing industries, in comparison with the industrial countries” (Cukor (1971:pp 63-64). However, these handicrafts and household industries have declined rather steeply in the recent decades. “Household manufacturing ... has declined relatively in all the economies examined (Colombia, India, Korea, Malaysia, Philippines, Taiwan). Workshops have also declined in the economies that have increased industrial employment most rapidly (Colombia, Korea, Malaysia, Taiwan). They may have declined even in India, but this is uncertain... There has also been a relative fall of employment in small and medium-size factories (in the range of 5-100 workers) in the most rapidly industrialising economies (Colombia, Korea, Malaysia, Singapore, Taiwan). Korea is especially notable in that from 1963 to 1975 over 1 million persons were absorbed into manufacturing employment, 86 percent into establishments with over 100 workers.”(Little, et al,1987:300).
Yet, the role of household industry cannot be completely ignored. “cottage shop manufacturing still accounts for more than half of all manufacturing employment in the poorest countries (India, Indonesia, Philippines, and most African countries)” (ibid).
1.3.3 Emerging industrial structure: a tentative conclusion
From the limited data available, and keeping in mind the limitations of international comparisons, it can perhaps be concluded, that the trends are extremely mixed, but very broadly,
a) in developed countries, the percentage of small business to large has declined since the Industrial Revolution, but has by now apparently stabilised at around 30-50 per cent of their total employment in manufacturing industry. Thus, small firms are not showing any signs of disappearing, thus reversing the trend towards decline in small firms seen since the Industrial Revolution.
b) The situation in developing countries differs considerably, since these are in various stages of development, but there is a clear trend of the diminishing role of the traditional craft-type small industries, while at the same time, the non-traditional small-scale industry is increasingly becoming more important, with
17
manufacturing employment in small firms being over 50% of total manufacturing..
As we conclude this brief review of the debate raging on this issue, we take note of the fact that according to some, the 1930s mark the watershed with the trend towards larger industry was reversed, and according to some, it was the 1970s. Either way, recent thought clearly seems to be veering around to the view that the industrial structure in the developed countries is moving back towards greater emphasis on small industry, which has changed its characteristics to include NC machines as well as sub-contracting. In fact, there is now a debate about whether or not the large industry is a desirable part of the industrial structure at all. To quote from Robertson et al: (1992):
“The debate over the institutional forms most conducive to economic growth has intensified in recent years. In the mid-1980s, Michael Piore, Charles Sabel, and Jonathan Zeitlin challenged the notion that the growth of large businesses in twentieth-century Britain and the United States had been either necessary or desirable... they have contended that communities of skilled craftsmen are as capable of generating high standards of living as are giant, vertically-integrated firms.”
Nevertheless, as succinctly put by Robertson et al (1992), neither the small nor the vertically integrated large firm is the panacea for economic growth. In their view, “The menu of institutional alternatives is in fact quite large, and both firms and networks - of which there are several kinds - can be successful, growth-promoting adaptations to the competitive environment... The relative desirability of the various structures, then, depends on the nature and scope of technological change in the industry and on the effects of various product life-cycle patterns... the government's role ought to be facilitating rather than narrow and prescriptive, allowing scope for firms to develop organisational forms that are best adapted to their particular environments” (Robertson et al,1992:1).
1.4 WHAT ARE THE REASONS FOR THE CONTINUANCE OF THE SMALL SCALE SECTOR?
Now that we have seen that small business is not dying out, it is a matter of considerable interest to examine why this could be so. We have already examined NC machines and sub-contracting as the two chief causes of this phenomenon. But there are other causes too.
1.4.1 Diseconomies of scale
Shepherd (1990:217) points out the following three causes of diseconomies of scale:
a) Excessive specialisation:
Over-specialisation, which is a basic ingredient of mass production has led to increasing dullness in the jobs, and to a dysfunctional use of the human capital. Workers become alienated beyond a point and the chances of breakdowns increase. This causes diseconomies of scale.
b) Physical laws:
Often, beyond a point, physical laws militate against increased size, and this tends to put a stop to ever-increasing sizes in industry.
18
c) Management:
A very strong factor is that the increased size leads to greater delegation and the formation of bureaucratic structures. These structures tend to stifle communication and distort the information processes, which ultimately lead to dysfunctional responses and poor efficiency beyond a limited size.
1.4.2 Minimum Economic Size (MES)
Another approach to the question has been to examine the minimum economic size in various industries. The theory (or hypothesis) behind this is that if the size of industry is increasing, then the MES should be rather large. This approach - of examining MES - is unfortunately fraught with considerable limitations in the methods used, and the fact that MESs differ quite dramatically across industries. In spite of these limitations, it has been very approximately determined (Shepherd,1990:231) that the minimum economic size in the USA in most industries is about 2 per cent of the industry size. In other words, a usual modern industry can accommodate only about 50 firms, each of them operating at optimal efficiency.
But this is only an average, and except for certain “natural monopolies” such as railroads, electricity, telephones, etc., most of the other forms of industry have relatively small optimal sizes. For example, estimates show that the minimum efficient size required for setting up a flour mill, bread baking unit, machine tools, bricks, shoes, etc., is rather small (ibid:229). Thus, the optimality criterion also does not support huge sizes in industry.
1.4.3 Other factors
There are other possible reasons why the small business survives:
a) Life cycles and growth:
Often, a firm starts small, and then grows to its optimal size. Not all firms grow to their optimal size, but continue to survive nevertheless, possibly due to imperfections in the market. Since usually more firms start than fail in an economy each year, the number of small firms increases in the economy (Shepherd, 1990:200).
b) Tax laws and public policy:
Often tax laws and public policy favours small business and this leads to their relative increase (ibid:203).
c) Inefficiencies in markets:
Particularly in developing economies, transportation and other bottle-necks favour production which uses locally available raw materials and is targeted towards local or nearby markets. This implies a smaller firm size, since even sub-optimal sizes yield the industrialist adequate profits to stay in business. Not all inefficiencies have disappeared in the developed markets, and these, by the same token, tend to encourage the existence of small business even in relatively advanced countries.
d) Changing face of the worker:
19
The worker today, world-wide, being more educated and aware than ever before, has been showing more individualism than ever before. Therefore the trend today is to enrich the work environment of the worker by encouraging his creativity. This obviously requires a small-firm atmosphere. Further, in keeping with the trend towards individualism, many salaried workers are also leaving their jobs to set up small industries of their own.
e) Innovation of small business:
A very powerful reason for the continuing survival of small firms appears to be their innovativeness. We shall examine evidence on this issue in some more detail in Chapter 4.
We shall also look at some more reasons for the continuing survival of small firms in Section 5.2.3.
1.5 ARGUMENTS IN FAVOUR OF PROMOTING SMALL INDUSTRY
We have compiled below some arguments in favour of the small firm. These are mostly from Mathur (1979:12) and also include some interesting information by other authors. These arguments provide an interesting backdrop to this study. We will not, however, stop to examine the validity of these arguments, since that would take out of the range of this paper.
1.5.1 The idealistic argument
This view considers small industry as vital to preserve the “ideal village community”. One of the proponents of this view in India was Gandhi. Another well-known proponent of this argument is Schumpeter who wrote “Small is Beautiful”. Here “smallness” is preferred for the sake of its harmony with man and nature. Others include Proudhon, among others (Amsden,1989:161). This view is also termed as the “philosophical argument” by some authors.
1.5.2 The psychological argument
This argument is that small firms have a more human face and therefore generally result in better industrial relations with lower levels of unionisation. (Mike Scott in Rosa et al,1989: 80). This perhaps also leads to more creativity of the employees which leads to dynamic efficiency of the smaller firms.
1.5.3 The humanitarian argument
This approach sees in the small sector a great employment potential and the ability to reduce both unemployment and particularly poverty.
1.5.4 The economic argument
This argument looks into the relative efficiency of small-industry and finds that due to its ability to use labour-intensive technology it can play a useful role in the economy.
20
1.5.5 The de-centralisation argument
According to this argument, small-industry contributes to the diversion of rural savings into productive uses, and helps in a balanced regional development.
1.5.6 The social argument
According to this argument, small-scale enterprises are less exploitative and promote equitable distribution of income. In this connection, Sen (1982:123) points out that the reverse is often true. Small-scale units tend to be exploitative since labour is cheap. “Extraction of absolute surplus value is definitely higher in small-scale units than in large ones.”
It is also felt by some that small firms are more community based, and integrated into the local cultures. They are more responsive to the environment, both social and natural, and enable the broadening of community participation in economic activities (Rosa et al,1989:80).
1.5.7 The political argument
According to one view, cited in Sen (1982:124), government favours small-scale industry as a `guarantee of the maintenance of democratic institutions, an obstacle to the domination of trade unions, and a barrier to communism.' According to this view, the promotion of small industry is also a step against capitalistic concentration. This argument thus favours small industry on grounds of equitable growth, and reduction of monopoly.
1.5.8 The latent resource argument
This arguments seeks to tap the latent entrepreneur, who cannot be reached through large industry. In this view, small industry offers a potent tool to maximise the latent entrepreneurial and managerial resource of a country.
1.5.9 The technological argument
This argument emphasises innovation and the use of environment friendly appropriate technology through the small scale industry.
Thus there are several non-economic, or shall we say, “para-economic”, justifications available to the proponents of the small scale sector. We would of course restrict ourselves in this paper only to the economic aspects of the matter.
1.6 HYPOTHESIS OF THIS PAPER
We have seen in this chapter that a considerable evolution of the structure of industry has taken place since the Industrial Revolution and there is today a large body of opinion which sees a continuing and major role of the small enterprise, both in the developed and in the developing world. In fact, the Bolton Committee had this to say about this sector in UK. “We should regard the decline of the small sector past the point of economic viability as so great an evil that energetic discrimination to avert it would be justified.” This political importance of small business primarily seems to arise from its employment potential.
21
In the succeeding chapters we shall seek to examine another major aspect of small-industry, viz., its ability to be used for export promotion.
As developing countries go into export promotion, their strength appears to lie in the availability of labour which can be used to produce goods which the developed countries are no longer interested in producing for themselves. The comparative advantage of most of the developing nations clearly lies in their huge populations, i.e., in human capital. Now, there exist many areas of industrial production today which deploy labour to profitable use while at the same time not requiring heavy capital investment, such as the production of garments, leather products, small electrical and electronic goods, handicrafts, and customised ancillary products. Thus, there seems to be a large potential group of industries in developing countries where small-scale production can be competitive, globally.
The hypothesis of this paper is that there exists, today, a major role for goods produced by small-scale industries in international trade, for developing countries in general, and for India in particular.
To verify this, we shall examine the following evidence:
i) First, in Chapter 5 we shall examine a developed country which has actively promoted small firms for purposes of exports, namely, Japan.
ii) Next, again in Chapter 5, we will look into the approach taken by South Korea, a newly industrialised country, which has only recently overcome its developing country status. We would also try to examine the relative position of small industry in other Asian countries.
iii) Finally, in Chapters 6, 7 and 8 we shall look into India's trade and export performance and try to determine whether there has been a conscious and strategic effort to promote exports by promoting small enterprises, and what are the policy guide-lines, if any, which emerge from studying the strategies applied by Japan and Korea.
But before all this, we shall take a look into the background of Indian small-scale industry in the succeeding Chapters 2, 3 and 4.
22
CHAPTER TWO
RECOGNITION OF THE ROLE OF SMALL INDUSTRIES IN INDIA
In India, the impact of the Industrial Revolution took a long time to percolate to the rural areas where a majority of the people live even today. And hence in India we find what is known as a dualistic economy - one end of which is technologically advanced and the other, which is still anchored to the traditional non-industrial modes of production.
The trend towards replacement of traditional industry with modern has not been without its pain and tragedy: only, in the case of India, it was a long-drawn out process and the displacement of traditional skills by modern industry still appear to be taking place. The development of modern industrial enterprise in India is generally dated to sometime after 1850. From this time the Industrial Revolution began taking its toll on many of the traditional industries, such as spinning of yarn, weaving of textiles, production of sugar, etc.
2.1 RAPID INCREASE IN UNEMPLOYMENT DUE TO BRITISH POLICIES
British policy in India seems to have been made keeping in view the need to expand the market for the import of British goods into India. The little encouragement given to the building up of an industrial base in India was essentially based on the need of British industry to export not only finished goods but also some capital goods, such as machines and equipment, to India. One view is that “whatever little industrial development and state assistance was found in India was due rather to a few far-sighted individual officers than any considered general policy” (Pandey:4). Interestingly, the British Government in India was actively supported in this policy by Indian traders, moneylenders and richer sections which wished to corner the little benefits which came out of these policies themselves.
Thus it was easy for the British Government to focus on the needs of the mill sector, both in the case of spinning and weaving, unfortunately, to the detriment of the village sector. Various sections of the village economy were distressed by these policies at different times. Perhaps due to the skewed surpluses in capital goods production by British industry, a similar skewed growth in industry took place in India.
2.1.1 Spinning industry
Although the first (spinning) mill had been established in 1851, and by 1900 there were nearly five million spindles for spinning yarn, there were only 40,124 looms” (Tyabji,1989:118). The traditional yarn (hand spinning, also called khadi) industry was therefore put into dire straits, with huge mill capacities for yarn production. Further, there was no import duty on yarn. Mills could procure yarn from local sources as well as from abroad. And since Britain had a flourishing spinning industry by the middle of the 19th century, it was but to be expected that this entire issue became a politically sensitive one in India's freedom struggle (In fact it was only in 1922 that an import duty imposed on yarn, largely due to the efforts of M.K.Gandhi, whose work in this sector we will touch upon shortly).
2.1.2 Handloom industry
The famous story of the cutting off of the thumbs of the Dacca muslin weavers by the British to protect their own muslin industry is an illustration of the indifferent, and often cruel treatment meted out in the initial period of the industrial revolution by the British to the rural artisans of India.
23
But on the whole, the handloom weaver was not treated too badly and he continued to survive the British rule. Initially there was no import duty on foreign cloth either, but the traditional handloom weaver of India could survive. This was due to lower mill capacities in weaving as well as the low cost of yarn. Import duty was imposed on foreign cloth in 1896 @ 3.5 %. This import duty also led to the simultaneous imposition of a nominal excise duty on Indian mill-made cloth @3.5 %, perhaps with the intent of making the import of British textiles competitive. Both these duties were in favour of the handloom weaver. The import duty on cloth was subsequently increased, in the First World War, to 7 1/2 %, and then successively to 11% and 15% in 1921 and in 1930.
In 1926 the excise duty on Indian mill-made cloth was removed. This signalled the advent of difficult times for the handloom weaver.
Fundamentally, therefore, we see that the British policies, not being actively directed towards the benefit of the rural, unorganised Indian artisan, led to the creation of a large unemployment problem in the rural areas, and to the impoverishment of the artisans whose skills in the pre-Industrial Revolution era had made India one of the most famous and rich civilisations in history.
2.2 CHAMPION OF THE DISPOSSESSED - MAHATMA GANDHI
It is difficult to understand the different path of industrial and general economic development taken by India unless one understands the influence that Gandhi had on India during the major part of this century.
The decline of the traditional industry, without at the same time being supplanted by adequate modern industry which employed those thrown out of work, led to a rapid impoverishment of the village economy, as seen above. This became a topic of debate among the intellectuals of the Swaraj (self-rule) movement in the early part of this century, and many books were written on this phenomenon.
At this time, there emerged upon the Indian scene a champion of the dispossessed - M.K.Gandhi, also called “Mahatma” Gandhi (“Mahatma” for “great soul”). He was a champion of the poorer sections of the India. One of the most significant economic thrusts given by him in India was that of focusing the attention of the Government of India on the importance of cottage industry in the Indian economy. He firmly believed that for a country of the size of India, development had to take place in self-sufficient village units, each with its own set of cottage industries.
1. Gandhi first raised the issue of revival of handlooms and khadi in 1908 in the journal “Hind Swaraj”. Not that he knew much about these industries at that time. In fact he wrote, “I do not remember to have seen a handloom or a spinning wheel when in 1908 I described it in Hind Swaraj as the panacea for the growing pauperism of India” (Little,1987:22).
2. The first major political step in this direction, at the behest of Gandhi, was taken in 1919, when at the session in Amritsar, the Congress resolved to recommend, `a revival of the ancient industry of hand-spinning and hand-weaving.' The following year, during the civil-disobedience movement, a boycott was placed on foreign cloth from all sources and also a ban on British goods of all kinds. Thus the resuscitation of the almost vanished
24
craft of khadi became a major political symbol. Some would even say that it became a cultural symbol (Little,1987:22).
Even today, Indians flock to khadi showrooms all over the country in search of their “identity”. This has meant that in the domestic economy, the “ethnic” khadi industry has been growing continuously, and has almost become a fashion with the elite.
3. The next formal move - again at the behest of Gandhi - towards the focus on the smaller industries came in the Working Committee resolution after the suspension of civil disobedience: “The Working Committee is of the opinion that the activities of Congress organisations relating to Swadeshi shall be restricted to useful articles manufactured in India through cottage and other small industries” (Tyabji,1989:119).
4. This period, of the 1920s and 1930s, also saw the establishment of various organisations for small artisans. These included the All-India Spinners Association in 1925, and the All-India Village Industries Association in 1934. In most of these developments, Gandhi played a crucial role.
2.3 OUTCOME RECOGNITION OF THE ROLE OF THE SMALL SECTOR
1. All this finally led in 1938 to the setting up of a subcommittee on Rural and Cottage Industries under the National Planning Committee. “From that point onwards it was recognised with varying degrees of sincerity, that the small commodity and early capitalist forms of industry would have not only to be protected through State action, but their contribution to employment and output in the economy had to be increased on an absolute if not relative basis” (Tyabji, 1989:120).
2. In 1941 the Government of India formed the Fact Finding Committee on Handlooms and Mills, intended to resolve and reconcile the conflicting interests of the handloom and mill industries (Tyabji, 1989:126).
2.4 GROWTH OF SMALL INDUSTRY IN INDIA TILL INDEPENDENCE
Simultaneously, there were forces which began to recognise the need to encourage the small-scale sector in non-traditional industries. This led to the increase in the small-industry sector in India, as reflected in the following tables:
Table 2.1
Growth of Small Enterprises in India, 1917 to 1947 ------------------------------------------ Year Number of Enterprises ----------------------------------- All Small % Enterprises Enterprises ------------------------------------------- 1917 4827 538 11.1 1929 7729 1354 17.5 1939 8973 1579 17.6 1947 11961 2990 25.0 -------------------------------------------
(Source: Tyabji,1989:124)
25
Note: Small enterprises in the above table are those that employ between 20 and 30 workers on an average.
Table 2.2
Share of Manufacturing Income of Small Scale Sector(1938-1939 prices)
-------------------------------------------------------- Year Total Income from Proportion Manufacturing small Income scale sector % (Rs.million) (Rs.million) -------------------------------------------------------- 1900-1901 1549 1251 80.8 1910-1911 2135 1565 73.3 1920-1921 2066 1337 64.7 1930-1931 3212 2233 69.5 1940-1941 3742 1963 52.5 1946-1947 4115 1942 47.2 --------------------------------------------------------
(Source: Tyabji,1989:124)
Note: in the above table, small-sector refers to units which were exempt from the Factories Act, i.e., employed less than 20 workers with power, or did not use power.
The Tables 2.1 and 2.2 show that whereas the proportion of small scale sector in the economy increased in the first half of the twentieth century in India, its contribution to manufacturing income declined, since large-scale industries were set up during this period, and their contribution to income went up rapidly.
We shall however, not be able to compare these statistics with post-Independence statistics, since the definition of small-sector industry changed after independence.
2.5 QUESTIONS ABOUT ECONOMIC VIABILITY OF THE TRADITIONAL COTTAGE INDUSTRY
Traditional cottage industry, no matter to what extent it is encouraged by government, presents various problems, which have plagued policy makers:
a) Inability of khadi and handlooms to meet the demand for textiles. Whereas handloom industry was able to show some sign of revival due to the efforts of Gandhi, the impact of the khadi movement was largely political, in terms of mobilisation of the poorer sections of the masses, rather than economic. It is no longer even considered viable in the context of present Indian economic and political situation to consider whether handspinning can replace mill-spinning.
b) Effects of protectionism: In the 1920s, the only way to promote the dying traditional sector was by imposing a social ban on the use of imported cloth, which Gandhi and the Congress duly recommended. But the logical outcome was inadequate supply of locally produced handloom cloth, made from hand-spun khadi. This naturally led to the allowing of the use of mill-spun yarn for handloom weaving by Gandhi. As Tyabji (1989:115)
26
points out, `As a matter of fact, Indian mill-owners benefited far more from the ban on foreign cloth, than spinners and weavers did from the khadi movement.'
This problem has manifested itself more severely after independence, with the concept of protectionism being spread over practically the entire Indian industry. Domestic industry has become pampered and inefficient. The adverse consequences of this protectionism will also be discussed in later sections (Sections 3.7.3, 6.2.2).
c) Ostensibly, one of the other reasons for promoting the khadi sector by Gandhi and the Congress was the prevention of accrual of monopolistic profits by the large mill-owners. Though not stated explicitly in the initial phases of the development of the small-industry political framework, this was nevertheless more explicitly recognised over the course of time. Unfortunately, it cannot be stated even today whether the benefits of small industry incentives are not often garnered by the larger industries (Section 3.7.2).
With this brief look at the development of small-industry sector in India since the Industrial Revolution, we now look at the post-independence efforts in this direction.
27
28
CHAPTER THREE
POST-INDEPENDENCE DEVELOPMENT OF THE SMALL-INDUSTRY SECTOR IN INDIA
3.1 DEFINITIONAL ISSUES
First of all we take a look at the definitions of the small and village industry sector since India became independent in 1947, to create the framework for further discussion.
3.1.1 Village and Small-scale Industries (VSI)
The first thing to note is that in India, the small-scale sector does not include general business such as trading and retailing. It specifically focuses on manufacturing, and some service industries.
Small-scale industries are considered under two groups in India and are collectively known as village and small-scale industries. “Modern small-scale industries and unorganised traditional industries are known as Village and Small Industries (VSI). VSI sector is divided into eight sub-sectors. Small-Scale Industries and Powerlooms represent Modern Small Scale Industries and Khadi, Village industries, Handlooms, Sericulture, Handicrafts and Coir represent the Traditional Industries” (India 1991:653).
The SIDO, or the Small Industries Development Organisation, is responsible for the modern small-scale industries and the powerloom sector, with separate Boards looking after the other six sectors of VSI. Therefore the two groups of industries are also known as SIDO and non-SIDO industries. Within the SIDO category there are three sub-categories - the tiny, small-scale and ancillary units.
Thus the following classification of small industry exists in India:
Village and Small-Scale Industry |
-------------------------------------------- | |SIDO non-SIDO
(modern) (traditional) | |
--------- --------------------------------------- | | | || | |
Modern Powerloom Khadi Village Handlooms |Sericulture
| i) Ancillary |Handicrafts ii) Small-scale | iii) Tiny | Coir
We shall primarily look at the SIDO industries in this paper, and wherever necessary, shall briefly touch upon aspects of the traditional industry.
3.1.2 Small-scale and Ancillary Industries (SIDO)
29
We look at the definitions chronologically.
* In 1953, all undertakings with a capital investment of up Rs.0.1 million were recognised as small-scale.
* This limit was raised to Rs.0.5 million in 1956. Initially the government grouped small-scale industries into two categories - those using power and employing less than 50 persons, and those not using power and employing less than 100 persons.
* The employment criterion was extended in 1959 to allow use of 50/100 persons per shift.
* The employment criterion was removed altogether in 1960. At about this time, the concept of ancillary units seems to have been introduced. The current definition of these units is that “An Ancillary Industrial Undertaking is one which is engaged or is proposed to be engaged in the manufacture or production of parts, components, sub-assemblies, tooling or intermediaries or the rendering of services and the undertaking supplies or renders or proposes to supply or render not more than 50 per cent of its production or services, as the case may be, to one or more other Industrial Undertakings” (India 1991:654). In addition, the ancillary units also have an investment limit. This was raised to Rs.1 million in eight selected industries.
* In 1966, small enterprises were defined as those which employed a fixed capital investment of less than Rs.0.75 million and all kinds of ancillaries those which employed less than Rs.1 million.
* In 1975 the ceilings of investment were further raised to Rs.1 million in the case of small scale units and Rs.1.5 million in the case of ancillaries.
* This limit was subsequently revised to Rs.2 million and Rs.2.5 million respectively in 1980 (estimated to be between $200-$250,000 by Little:297).
* In 1985 the ceiling was further raised to Rs.3.5 million in the case of small-scale units and to Rs.4.5 million in the case of ancillaries (Tyabji,1989:pp 175-177).
* On the 2nd of April, 1991 the limits were further raised and the present situation is as follows:
“Investment limit in terms of fixed assets in plant and machinery in the definition of Small-scale Industrial Undertakings ... is as under:
a) Small Scale Industries Rs.60 lakh Undertaking (Rs.0.6 million)
b) An Industrial Undertaking Rs.75 lakh referred to in (a) above which (Rs.0.75 million) undertakes to export at least 30 per cent of its annual production by the end of the
30
third year from the date of its commencing production.
c) Ancillary Industrial Rs.75 lakh Undertaking (Rs.0.75 million)”
(Source:India 1991:654)
3.1.3 Tiny Sector (SIDO)
* In 1977, a further sub-sector of the small-scale sector was created - the tiny sector. This was defined to be those units which had an investment in plant and machinery of less than Rs.100,000, and located in a village/town with population of less than 50,000 according to the 1971 Census.
* In 1981, this limit was raised to Rs.200,000.
* A further enhancement of this limit to Rs.500,000 has taken place in 1991 (India's New Economic Policies: Small Scale Industries,1992:2).
3.1.4 Non-SIDO industry (Village or Cottage industry)
The non-SIDO industries predominantly use manual processes and traditional methods. They also make traditional products. These units are defined in different ways by different Boards. We shall not look into details of these definitions here, since, as already mentioned elsewhere, the focus of this paper is on SIDO industries. However, in general, “(non-SIDO industries) are almost entirely household enterprises (employing little or no hired labour); most of them derive their raw materials from local sources; and they sell most of their products in local markets. They are in sum, small-scale, rural, localised and technically backward” (Dutt,1981: 534).
3.2 POST-INDEPENDENCE THINKING AND POLICY ON VILLAGE AND SMALL INDUSTRY
The influence of Gandhi and his emphasis on cottage industry, which we have examined in Chapter 2, played a continuing role even after independence. This meant that while there was some recognition of, and recognition given to the role of traditional industry, there was a real neglect of the modern small-scale sector.
Secondly, Nehru, India's first Prime Minister, while appreciating the emphasis on cottage industry, primarily for the sake of providing employment, himself strongly believed in large industry. He was primarily a liberal socialist at heart. The influence on Nehru can be traced back to the Fabian Socialists and later on, to his fascination for the public sector of the USSR. Accordingly, he focused his energies and the resources of the country on the development of heavy capitalistic industry, particularly in the public sector. But Tyabji (1989: 126), a Marxian economist, feels that during the post-independence period, “the spirit of Gandhism was abandoned, largely due to the compulsions of the capitalist development strategy.” This statement is a bit surprising, since Gandhi was more of a capitalist than Nehru, and by abandoning Gandhi, Nehru was to some extent abandoning capitalism.
What emerges essentially, therefore, is that India was paying lip-service to traditional industry, without being convinced of its significance (see Section 2.5), while attempting to set up
31
large-scale industry, thus leaving out the modern small-scale sector out of the picture completely. This sector appears to have been nobody's baby, and to a large extent this holds true, even today.
More appropriate in this regard are the views of Mahajan, who states, “It is interesting to find that India's interest in modern small industries began only after the experts from foreign countries visited this country and strongly recommended the setting up of modern small units, which in their opinion, were ideally suited for a densely populated economy like India, with a serious dearth of financial and technical resources. The reference here is to the visits by Ford Foundation Team (of America) and the team of Japanese experts in the early fifties. More than anything else, it was the publication of the Ford Foundation Report which made this country of the vast production and employment potential of the modern small industrial units. Also, the studies made by the foreign expert, George Rosen, in the fifties, had rendered an equally useful service for the growth of small industries.
“Notwithstanding that the team of Ford Foundation has made very useful suggestions for the promotion of small industries and that the country also picked up quite a few of these (for instance, those relating to the setting up of central and regional institutes), a full dressed development of small industries had to wait until a decade or so after the publication of the Report. This, of course, was due to the fact that India was not as yet prepared to accept small industries to serve as a good middle path between large industries on the one hand and cottage industries on the other “ (Mahajan,1983 :208).
With the above discussion in mind, we now describe below, chronologically, the evidence of policy-level thinking on small-industry in post-independence India.
1. In 1947, the Cottage Industries Board was established to emphasise the development of the cottage industrial units, based on the recommendations of the Industrial Conference held in December, 1947.
2. In 1950, the Fiscal Commission pointed out that “In most of these (small scale) industries, the proprietors are middle class people who have had adequate practical training in the conduct of their business and are familiar with the technical process of the industries. As a source of employment to the middle class people the social importance of these industries is out of all proportion to their relative strength in the industrial sector, and we feel that State should take special interest in their promotion and development” (cited in Tyabji,1989:126).
3. In 1952, the Cottage Industries Board was split into 3 separate boards for Khadi and Village Industries (KVIB), Handicrafts and Handlooms. The former was constituted from the All-India Village Industries Association and the All-India Spinners Association.
4. In 1954, a Small Scale Industries Board (SSIB) was set up to encourage the development of those small units not covered under the existing boards.
4. In 1955 the Village and Small Industries Committee (also called the Karve Committee) was constituted by the Planning Commission. This committee was influenced by Gandhian thought and considered the industrial structure to be a pyramid with the decentralised small-scale industry at its base. There is an opinion which sees this as the last time when the Gandhian view was actually the basis of discussion of the small and village industry sector. After this the Nehruvian model became predominant (Tyabji,1989:195).
32
5. In 1955, the Mahalanobis Model for the Second Five Year Plan was formulated and it envisaged that the supply of consumer goods would be met by cottage and small scale industries. This was essentially a formalisation of the thinking of Nehru (Little, 1987: 31).
6. Various high-level committees have been constituted which have recommended various incentives to this sector. These reports include:
a) Report on Small Industries in India by the International Planning Team - the Ford Foundation (1955), commissioned by Ministry of Commerce and Industry (Tyabji,1989:137). This committee considered only what is now known as the SIDO industries. Its most important recommendations were:
i) establishment of Regional Institutes of Technologyii) establishment of a Small Industries Corporation.
These recommendations were accepted by the Government, but as we have seen above, it took nearly a decade to implement these sincerely.
b) Report of the Village Industries Evaluation Committee (1959), commissioned by the KVIB.
c) Report of Japanese Delegation on Small Scale Industries (1959), commissioned by the Ministry of Commerce and Industry.
d) Rural Industries Planning Committee (1961), commissioned by the Planning Commission. This Committee examined the possibility of establishing rural industrial estates, and these were ultimately established under the Rural Industries Project (RIP) (Tyabji,1989:146). We look at the RIP in detail later in this chapter.
e) Report of the International Perspective Planning Team (1963), commissioned by the Ministry of Industry.
f) Report of Indian Productivity Team, Small Scale Industries in U.S.A., West Germany, Sweden and Japan, commissioned by the National Productivity Council.
g) Report of the Khadi and Village Industries Committee (1968) (commissioned by the Ministry of Commerce)
h) H.S.Bhat Committee was set up in 1973. Some of its recommendations were:
i) development of infrastructure on priority basis;ii) promotion of regional industrial development centres;iii) implementation of effective measures to enable the supply of raw
materials;iv) reinforcement of tax concessions to new entrepreneurs (Little,1987:25).
7. The 1956 Industrial Policy Resolution was of the view that “(small-scale industries) provide immediate large scale employment, they offer a method of ensuring more equitable distribution of the national income and they facilitate an effective mobilisation of resources of capital and skill which might otherwise remain unutilised. Some of the
33
problems that unplanned urbanization tends to create will be avoided by the establishment of small centres of industrial production all over the country” (cited in Tyabji, 1989:140).
8. The Industrial Policy Statement of 1977 strengthened protectionism and reservations for the small scale sector. It stated that any product which could be produced by cottage and small industry should be exclusively produced within this sector (Little,1987: 25).
9. The Industrial Policy Statement of 25th July, 1991, practically abolished industrial licensing, including in the small-scale sector, but reservations for the small-sector have continued. (India's New Economic Policies: Changes in Procedures regarding Industrial Policy. Ministry of External Affairs, New Delhi. Year not mentioned) In addition, various steps have been taken to resolve some of the persistent problems faced by the small-scale and tiny sector, such as:
i) relaxation from certain provisions of the labour laws,ii) easier access to institutional finance,iii) preference in land allocation and power connection,iv) supply of risk capital to small-scale sector,v) factoring services for bills of small industries to be provided through the Small
Industries Development Bank of India (SIDBI),vi) equity participation by medium and large industry upto 25% is now allowed in
the small-scale industries,vii) Upto 15% of equity for tiny units would be provided by the National Equity
Fund,viii)Various schemes to upgrade the availability of technology to the small units have
been commenced,ix) Priority to small/tiny units in allocation of indigenous and imported raw
materials,x) greater stress on subcontracting, etc.
3.3 ALLOCATION OF FUNDS
As already indicated above, due to Nehru's predominant interest in heavy industry, the real resources allocated to the small scale sector remained minimal (Little,1987:31). An amount of Rs.420 million of public sector funding was allocated to this sector in the first five-year plan. This increased, largely due to the Karve Committee Report of 1955, to Rs.1.87 billion in the second five-year plan. During the third plan, Rs.2.41 billion was spent. In the fourth five-year plan, an amount of Rs.2.51 billion was estimated. This was steeply increased to Rs.5.1 billion in the fifth five-year plan, and further, more steeply to Rs.14.1 billion in the sixth five-year plan (Dutt,1981:542).
These figures can be seen in the true perspective when compared with the investment in the other industries. In the first five of the five-year plans the public sector outlay on village and small-industry programmes was 2.1, 4.0, 2.8, 1.5 and 1.3 per cent of the total size of the plan, compared with 2.8, 20.1, 20.1, 18.2 and 17.4 per cent for the “organised” large industry, including minerals (Little,1987:25). “In the Sixth Five Year Plan, projected government outlays for the sector were only about 2 percent of total projected outlays. If planned and actual outlays for large and medium-sized enterprises are compared with those of small enterprises, more than 85 percent of total direct government expenditures for all industry was for the large units and just 10 to 15 percent was for smaller ones” (Rosen,1988:52).
34
Further, it is worth noting that out of this small allocation of funds to the small industry, the bulk, of 60 to 70 per cent, went to the traditional, non-SIDO sector (Little,1987:25).
3.4 AN OVERVIEW OF THE ADMINISTRATIVE POLICIES ADOPTED FOR THE SSI SECTOR
The structure of government organisations to look into the needs of the small-scale sector as of today is succinctly summarised below in a recent government publication:
“A new Department called Small-Scale Industries and Agro and Rural Industries has been created in the Ministry of Industry headed by a Secretary to the Government. The office of the Development Commissioner (Small-Scale Industries) headed by the Development Commissioner (SSI) and Ex-officio Additional Secretary functions under the new Department as the nodal agency for formulating, co-ordinating and monitoring the policies and programmes for promotion and development of Small-scale Industries in the country. .. It provides a comprehensive range of facilities and services including consultancy in techno-economic managerial aspect training, common facility services, common processing and testing facilities, tooling facilities, marketing assistance, etc., to Small-scale units. The office of the DC (SSI) commonly called SIDO (Small Industries Development Organisation) provides these services through a network of 27 Small-Industries Service Institutes (SISIs), 37 Branch Institutes, 37 Extension Centres, Four Regional Testing Centres, One Product cum-Process Development Centre (PPDC) at Ranchi, Two Central Footwear Training Centres, Four Production Centres and 19 Field-Testing Stations (out of 19 FTS one has been transferred to Goa Government) in areas of concentration of specific types of industries.
“In addition, there are also specialised institutions like Central Institute of Tool Design, Hyderabad, Central Tool Room and Training Centre, Ludhiana and Calcutta, Central Institute of Hand Tools, Jalandhar, Hand Tool Design Development and Training Centre, Nagaur, Institute for Design of Electrical Measuring Instruments (IDEI), Bombay, Integrated Training Centre, Nilokheri, National Institute of Small Industry Extension Training (NISIET) Hyderabad, National Institute for Entrepreneurial and Small Business Development (NIESBUD), New Delhi, Product-cum-Process Development Centres for Foundry and Forging at Agra and ... Sports Goods and Leisure Time Equipment at Meerut and Electronics Service and Training Centre, Ramnagar (UP) which provide training and technical services in specialised fields” (India, 1991:652).
3.5 A DETAILED LOOK AT POLICY MEASURES
Now we take a detailed look into the administrative policies adapted by government towards this sector.
3.5.1 Tax exemptions
i) Tax imposed by central government:
35
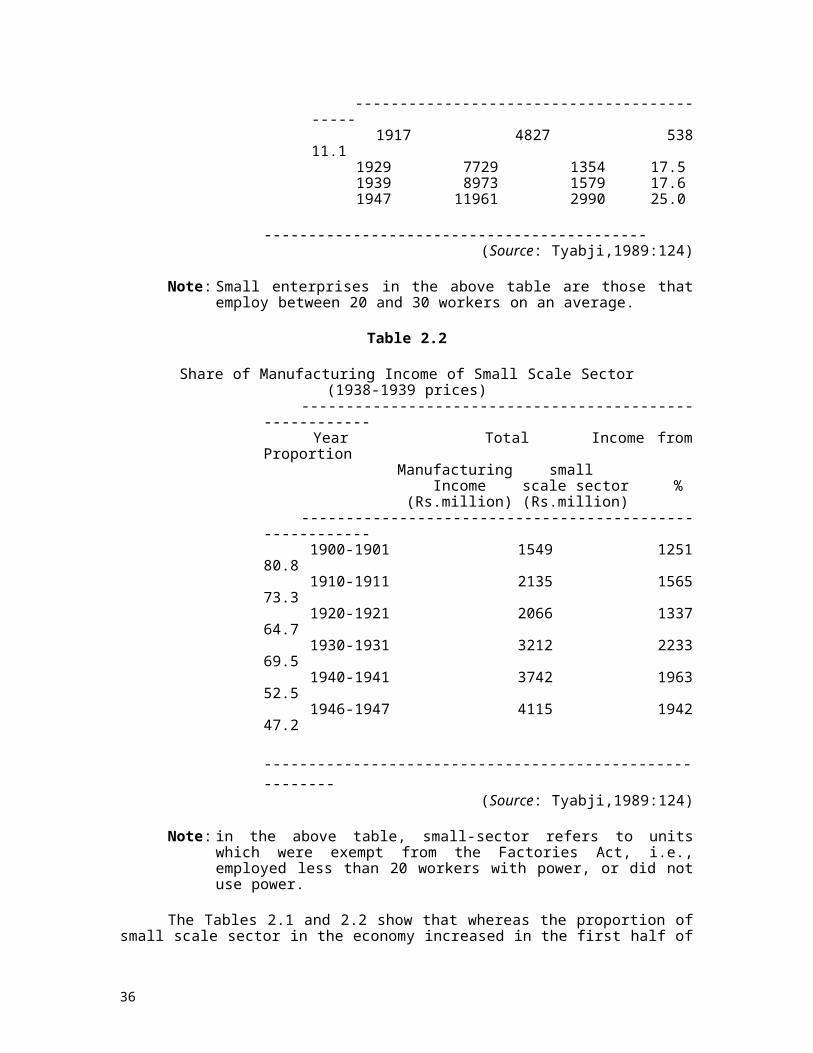
The central government imposes excise duty on production. The rates of excise in the Indian economy generally range from 10 to 100 per cent, the higher rates being imposed on luxury and consumer goods and the lower on intermediate and capital goods (Little,1987:27). Exemptions on the excise duties generally represent a high subsidy and incentive. A study by S.K.Tulsi (cited in Rosen,1988:59) has found that out of the various incentives given to small industries, the exemption of all or part of the output of the producing units from central excise tax is the most important.
ii) Taxes imposed by state governments:
The state governments generally impose two major types of taxes: (a) the sales tax on sales of output and (b) the turnover tax on purchase of inputs. The state tax exemptions are usually a lower form of subsidisation than the central tax exemptions.
One of the consequences of these exemptions has been that the growth of small firms beyond the upper limits fixed for the small scale sector has been generally economically prohibitive, except in those few firms which had otherwise got a comparative advantage in factors of production or in technology, and which believe that they will survive competitively as a medium-scale industry. Thus, often, instead of becoming a bed of seedlings which would grow bigger, the small scale sector has tended to remain at a lower level than its potential (Little,1987:32). We discuss this problem in more detail in Section 3.7.3.
3.5.2 Provision of physical infrastructure
i) Decentralisation versus conglomeration:
The view that small and village industries promote decentralised development was first stated by the Karve Committee in 1955 and continues to hold ground at the policy level in the provision of decentralised physical infrastructure in the form of urban and rural industrial estates.
Thus, there is a feeling that the small scale sector is largely decentralised, but this is not borne out by facts. For example, whereas most of the less used and low productive handlooms are diffused in the villages in many states, the more commercial looms are concentrated in a few small towns across the country. This conglomeration is even more obvious in the case of modern small-scale industry such as ready-made garments and leather goods production. The primary reason that appears to favour agglomeration is the need to achieve economies in the supply of raw materials, services and marketing outlets (Little,1987:24).
The modern small-scale industry in particular requires practically all the infrastructure needed by a modern large-scale industry. The government does not seem to have recognised this, and even today there is emphasis on decentralisation of this sector.
ii) Industrial sheds:
The government took up a programme of establishing industrial estates to decentralise industrial production. Uptil March, 1974, 455 industrial estates were functioning in the country, with 347 in urban areas and the remaining 108 in
36
rural areas (Dutt,1981:542). Of these the urban estates have generally been more successful (Little,1987:24), as should be expected, since these were closer to other facilities needed by the modern small-industry sector.
In fact this programme has been fairly successful. According to Mahajan (1983:216), “while by the end of 1976, there were hardly two per cent of units out of the total 600 thousands registered with the Directorate of Small Industries functioning within the industrial estates, their contribution to gross output was 8.2 per cent ... This shows that units located in industrial estates are showing better performance than units outside. Thus it would be beneficial for the economy as a whole, and for the rural sector in particular, that more and more of small units are attracted to industrial estates.”
But there is lot left to be done in this on-going programme. “if the Government is really keen to take small industries to rural areas, then, some advance investment has to be made in creating minimum of basic facilities, otherwise small units would not be attracted to these areas...” Mahajan (1983:215)
iii) Rural Industries Project Programme (RIPP)
The decision to launch the Rural Industries Project Programme was taken in 1961. It was envisaged to be a massive programme for rural industrialisation on modern lines (Mahajan, 1983: 219-220). Unfortunately, the critique of this programme, as provided by the Planning Commission in its draft sixth Plan, shows that there have been deviations in the implementation of the programme. First, part of the assistance was provided to the larger amongst the small scale units. Second, the RIPP was implemented in towns which were excluded from the purview of the scheme. Third, rural artisans did not receive adequate assistance, particularly in respect of technical advice, credit, training and marketing.
3.5.3 Reservation of production exclusively to the SSI sector
Reservation for the small scale sector derives from the Mahalanobis model which visualised the small and household industry producing consumer goods, while the factory sector produced capital and intermediate goods. This concept in some form or other still strongly influences the policy makers in India till today (Little,1987:22).
Reservation here means that the product in question is exclusively reserved for production in the small scale sector. Reservation started in the early 1950s, by reserving certain types of dhotis and sarees (a kind of dress worn by the people) in the handloom sector. By 1967, as many as 46 items had been reserved for SIDO industries (apart from other reservations for the handloom sector). By 1977 this had increased to 504 items and by 1980, this increased to 807 items. This list has been slightly modified and expanded in 1991.
The main consequence of this policy has been that better quality goods of the same type are generally produced in the large-scale sector, and the inferior quality goods, meant for mass consumption, produced in the small-scale sector. This therefore, surely cannot be a solution to the problem of development.
In addition, fundamental questions about the implications of the reservation policy remain to be answered: Does a unit producing goods in a reserved sector become
37

disqualified from producing such a good once it becomes profitable and expands into large scale production? Does that unit have to close down or deliberately prevent itself from growing? No literature on this subject was found, but surely reservation must be preventing many units from growing to their optimal size, and also militates against the `seed-bed' function of the small sector. Reservation must therefore be viewed as a questionable policy.
3.5.4 Forward and backward linkages
3.5.4.1 Credit and finance
While the government does not directly provide credit to the small scale sector, it does lay down policy for the Reserve Bank and other banks from time to time in this regard.
a) Credit disbursed:
To boost credit to small-scale industry, the Reserve Bank of India started the credit guarantee scheme in 1960. According to this scheme, the Reserve Bank of India took upon itself the role of a guarantor for the advances (both working capital and fixed capital) which are not recovered by the commercial banks. “Credit provided by banks to Small-scale industries is treated as credit to `priority sector'. Commercial Banks are required to lend 40 per cent of their total loans to priority sector of which 15 to 16 per cent is required to be in the form of direct agricultural advances and the rest can be to Small-scale Industry, small business, small transport operators, indirect agricultural loans, etc” (India 1991:655).
There has been a considerable progress in this field. A survey of West-Bengal, carried out in 1965-66 (cited by Little,1987:291) showed that only a minute fraction of the SSIs surveyed had ever heard of, let alone used, any of the sources of financial assistance. By 1980, a survey showed (cited by Little,1987:292) that as over half of the SSI surveyed in Bombay had received loans from commercial banks. Table 3.1 summarises the position of credit disbursement:
Table 3.1
Credit disbursement to small-scale industry----------------------------------------------------------------------Year Amount No.of %age of %age
disbursed enterprises industrial bank(Rs. to whom credit creditbillion) disbursed
----------------------------------------------------------------------1967 6.6%June 1969 2.86 57,0001971 12.20 301,000Dec.1977 17.21 14.4% 11.0%June 1981 34.06 13.2%March 1989 131.30 16.8%-----------------------------------------------------------------------
Source:Dutt,1981:541;Little,1987:292,293;India,1991:655
38
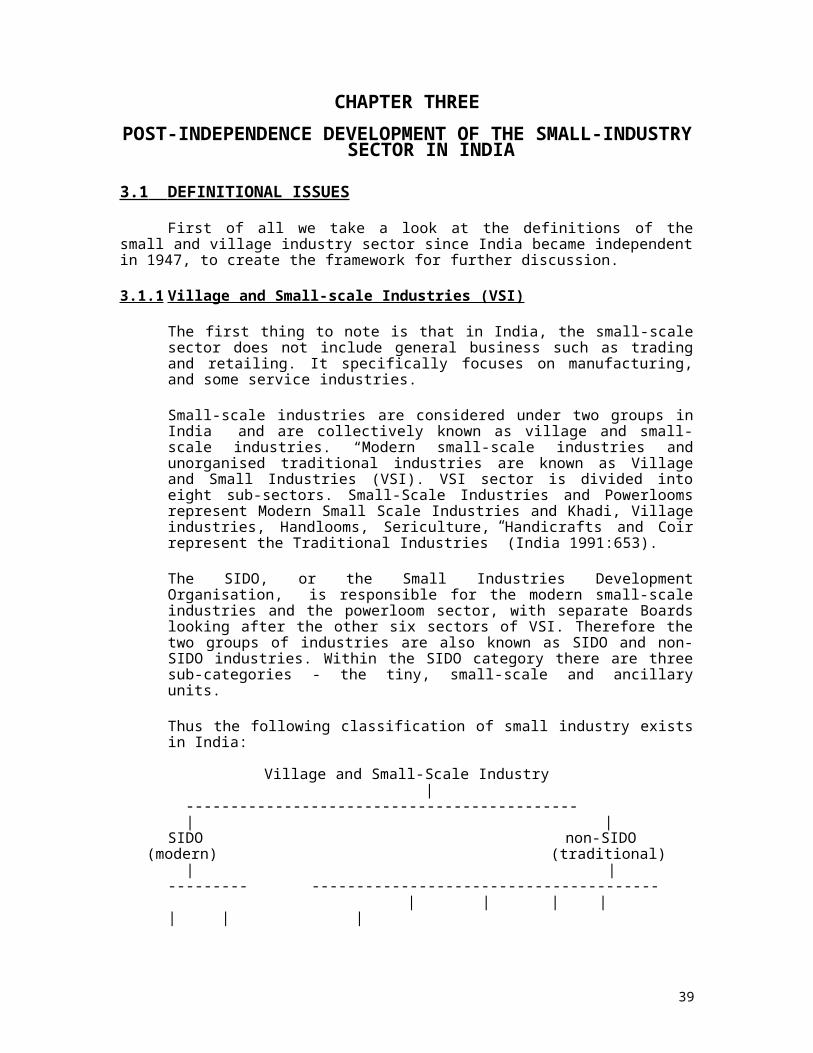
In addition to the bank finance, the State Financial Corporations also loaned an amount of Rs.8 billion to small-scale industries during 1989-90 (India 1991:655).
Thus there has been a fairly dramatic rise in commercial bank credit advanced to the small-scale sector, particularly in the 1980s.
b) Amounts defaulted:
Various studies over the years have confirmed that the small-scale entrepreneur is eminently honest, enterprising and credit-worthy (Dutt,1981:541). However, with the increasing amount of loans being given to the small-scale enterprises, the position appears to be changing. Till June, 1977, the amount defaulted by the SSI sector was less than 5 per cent of total loan. This increased to 10 per cent by December, 1980 (Little,1987:294). But this had increased alarmingly to 37.9 per cent by March, 1989, fuelled by shoddy implementation of the government directive to banks to advance credit to the small-scale sector.
However, Little, et al, believe that these figures are still rather low compared with most developing countries, in which default has often become “almost the rule” (Little,1987: 297).
c) Inadequacy of working capital credit:
In spite of the gains in improving credit to the small scale sector, it would perhaps still be true that a large amount of funds for the small sector are provided by the informal sector, comprising friends, relatives, moneylenders, and smaller banks. The rates of interest by this sector are generally higher than commercial banks, but since they do not seek collateral, they seem to be popular for financing short-term capital needs of the small-enterprise sector (Little,1987:295). But when we realise that for the small-scale sector (Mellor,1976:128), working capital is in fact more important than fixed capital, primarily on account of its labour intensity, it is a matter of concern that the banking sector has not been able to fulfil these requirements more competitively.
d) Smallest firms neglected:
Another factor to be kept in mind is that about half the finance mentioned above goes to the larger of the small enterprises, employing more than 50 persons. The very small, with less than 20 employees, still receive a disproportionately small portion of bank finance compared to their contribution to employment or to value added (Little,1987:297).
e) Marginal cost of capital and the new firm:
In general, Little, et. al., conclude that the “marginal cost of capital, though variable, is generally high for new firms and that this must make for labour intensity... Thus ...the functioning of credit markets tends to make small and especially new firms more labour-intensive than larger ones” (Little,1987: 298).
3.5.4.2 Technical assistance
39
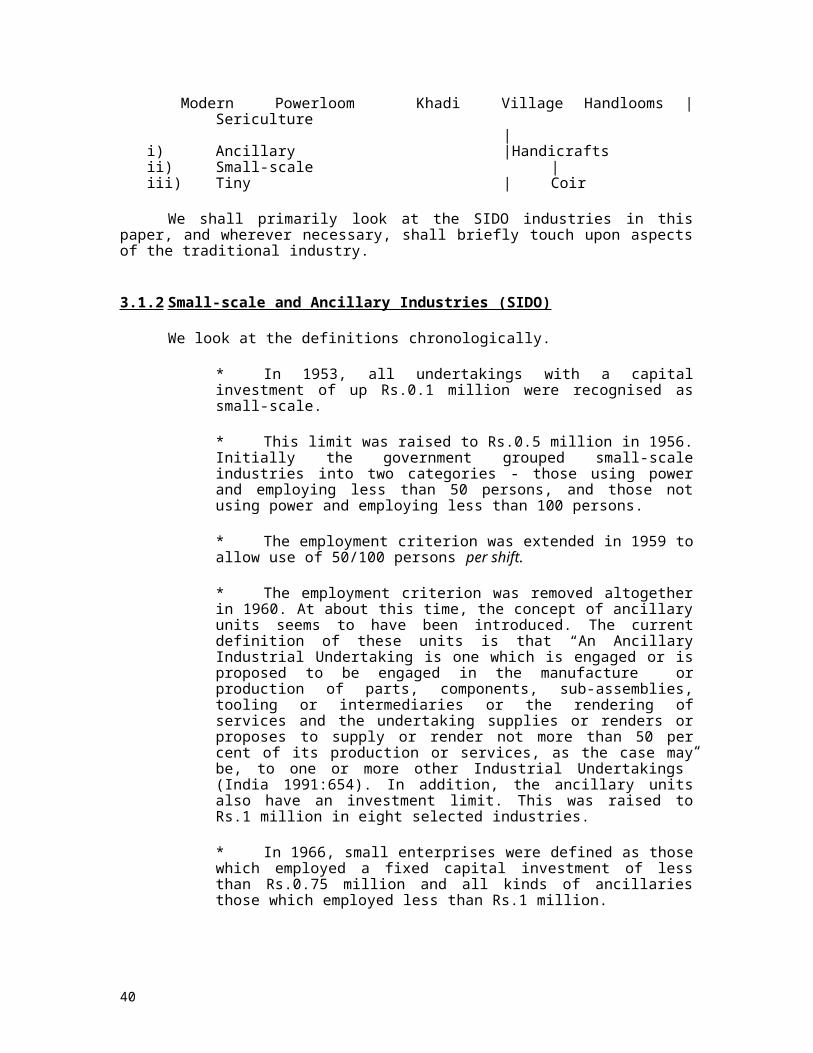
Technical assistance is provided to the SSI sector by the Small-scale Industries Service Institutes (SISI) of the SIDO. Assistance is also provided in terms of common facility workshops in industrial estates (Dutt,1981:542). During 1972-3, technical assistance was provided to 100,413 entrepreneurs (Sen,1982:122). Later figures are not available.
3.5.4.3 Allocation of raw materials, imported components and equipment Priority in allocation of scarce raw materials has been given to small-scale industries in comparison with large-scale. This allocation is generally controlled by the State Directorates of Industries and implemented at the local level through the District Industries Centres. We shall discuss the allocation of imported raw materials in some more detail in Chapter seven.
3.5.4.4 Power Subsidy
Some states have been giving direct subsidy to small-scale units on electricity consumed.
3.5.4.5 Marketing assistance
There are two kinds of assistance provided:
a) Price preference. Whenever government departments make purchases, they give a preference to the small industry products provided their sale prices are upto 15 per cent above that of the rest of the market.
b) Co-ordinated purchases for government departments. This is done through the National Small-Scale Industries Corporation (NSIC) which was set up in 1955, which also carried out other activities, such as providing machinery to small-scale sector on hire-purchase. A total of 382 items were reserved for purchase by government from the small-scale sector by 1980 (Tyabji,1989:179).
3.5.4.6 Scheme of DICs
The scheme of District Industries Centres (DICs) was started with the intention of removing bottle-necks in the supply of raw materials, credit, machinery and spare parts (Dutt,1981:544). It acts as the one-window where the small-scale entrepreneurs can get access to information and facilities on various assistance available to them. Thus, the DICs Programme “provides a focal point at district level for promotion of small, tiny village and cottage industries, widely dispersed in rural and semi-urban areas and aims at providing all essential services and support as far as possible at pre-investment, investment and post-investment stages at district level... The total number of Approved DICs now stands at 422 which covers 431 Districts. Four Metropolitan Areas are outside the purview of this programme” (India 1991:655).
Unfortunately, “there is a perception that the relevance of the technical advice offered by promotional agencies is limited by their staff's lack of technical expertise and experience. Thus ... the information they provide may be second-hand, nonspecific, and out of date” (Little,1987:31).
3.5.4.7 Registration of SIDO units
40
Until the early 1970s it was not necessary for a small-scale unit to be registered with the SIDO to avail of various concessions. But this led to difficulties in compiling statistics on the small-scale sector. Accordingly, it thereafter became necessary for all small-scale units, which desire to avail the fiscal and other benefits, to be registered with the SIDO. This registration is carried out in each district of the country at the District Industries Centre, and these units are deemed to have been registered under the Directorates of Industries of the various states. Of course, this registration is purely voluntary (Little,1987:31).
3.5.5 Revival of the traditional sector
The impact of Gandhian thought on the policy making level in this sector in India has been vividly stated by Little, et al (1987:22): “No other country has revived that then greatly expanded during a half century both very primitive methods of making cloth, sugar, soap and other products, and also equally primitive methods of processing cereals and vegetable oils.” Therefore in this particular aspect, “India is trying to swim against the tide of history” (Little,1987:17). This is of course true primarily in case of the non-SIDO sector.
In the other, “modern” sector, the policies have often tended to promote innovation and use of the better technology. Increasingly, therefore, “in terms of organisation and techniques of production, small-scale industry has closer affinity with large- and medium-scale counterparts than with village household industries” (Sen,1982:119).
3.6 EVALUATION OF THE ASSISTANCE PROVIDED
3.6.1 The theoretical quantum of assistance
The gross quantum of assistance provided to small firms varies from state to state and from industry to industry. Little et al (1987:28) have cited data to show that the sum of financial incentives as a percentage of the value of the output ranged from 21.1 per cent in the case of hand-tools industry in Rajasthan to 45.5 per cent in the case of cosmetics and toilet preparations in the case of Uttar Pradesh, in 1980. These figures take into account the maximum incentives available, including price preference ranging from 15 per cent to 20 per cent (which is available to the firm only on the purchases made by government of its products).
Thus, by and large, the incentives, theoretically, have been large enough to offset various drawbacks faced by a small entrepreneur, and should thus have promoted a much faster pace of growth in this sector than actually took place.
3.6.2 The reality of disbursement of incentives
This is because, unfortunately, the reality is quite different from the “theory”. An evaluation of incentives by R. and D.Taub, cited in Rosen (1988:60), has shown that because of the complexity of the system and the `baksheesh' element (bribery, corruption), the small entrepreneur has hardly been able to take advantage of the incentives. Most of the incentives have therefore been cornered by those “who had extensive investments elsewhere; they hoped that a small (unit) would help (protect) them against onerous ... pressures from the government elsewhere” (Rosen, 1988:60).
41
This has led to a position where a large number of successful small enterprises have resolutely refused to take any help offered by government, “to keep government officials from gaining entry into (their) operations” (Rosen,1988:61).
Thus, the administration of disbursement of these incentives has left a lot to be desired. In fact, due to the faulty delivery mechanism, the intended subsidies have turned out to be a greater burden on the common man in the form of higher taxation (required to raise resources for these subsidies), rather than a boon to the small entrepreneur. The negative effect of the mal-administration of these subsidies needs to be examined through research. Perhaps a case will then emerge for the abolition of these subsidies altogether.
3.6.3 Multiplicity of agencies
A significant point made by Mathur (1983:238), is that “a great promotional handicap to the new entrants is the multiplicity of agencies in the field of small industry... In Agra region itself, six commercial banks, besides the State Bank of India, have been providing finances for the long and short term needs of the industry. In addition, the industrial Cooperative Bank, State Financial Corporation, National Small Industries Corporation, Small Industries Development Organisation, Small Scale Industries Development Corporation, Trade Development Authority have been assisting the industry under various aid patterns. These patterns of aid are neither simple, nor within the reach of an entrepreneur or ordinary means...
“The existence of multiple agencies in the small sector has, therefore, been a source of confusion to the new entrants. The young technically qualified and educated entrepreneurs, who wish to make a debut in an industrial career get frustrated in their efforts, after running from pillar to post and withdraw from the scene. This is not a happy situation... There appears to be an imperative need for providing all institutional aid to the small entrepreneur `under one roof'. The case for setting up of a single development agency for the small industries is, therefore, self evident” (Mathur,1983:238).
3.6.4 Agency to provide diversified services
Another important issue raised by Mathur is that “Setting up of a new industrial unit requires the attention of an entrepreneur on so many diversified fronts, that he is unable to do justice to any one of them. The arrangement of land, its registration with the local authority, engaging an architect or engineer for the designs, submission of plans to the Development Authority or local body concerned, construction of factory building, registration under Factory or Shop Act, clearance from the Factory Inspector for the safety aspects and sanction of electric power, are some of activities that have to be completed even before the unit is even set up. At the same time the entrepreneur has to run about to register his unit with directorate of industries and under sales tax Act before he can actually start assembling plants, etc., in his unit.
“The industrialists in the upper financial slab can afford to obtain the expert consultancy and contracting agencies to carry out the job for them but a small enterpriser is hard put, facing these odds. It would, therefore, be desirable to encourage promotional agencies to carry out these jobs on reasonable payments. Such agencies could provide a valuable promotional service to the small industrialists (Mathur,1983:243).
Thus, there is evidence to show that Indian incentives for the small scale sector have mostly been created without any co-ordination between the implementing agencies. Further, many of the incentives have been inefficiently administered and thus have been largely
42
ineffective, or even counterproductive. There is therefore a major need to review these incentives, particularly their inter-linkages and inter-relationships, by considering everything from the point of the view of the entrepreneur.
3.7 SOME CONSEQUENCES OF THESE POLICIES
In spite of this not very flattering evaluation of the incentives, it must be admitted that at least part of the success seen in the field of small-scale industries must be attributed to government intervention. The government of India has of course taken a rather self-congratulatory view of its performance:
“The (small-industry) Sector today occupies a position of unique importance in the Economy of the country. Village and Small-scale Industries taken together account for about 49 per cent of total industrial production and contribution of industries falling under the purview of Small Industries Development Organisation is about 35 per cent” (India 1991:654).
But as we have see, things are not as they appear. We shall now take a look at the consequences of the policies followed by the Government of India since the past forty years.
3.7.1 Growth
Initially, data on this sector was collected under the CMI series (Census of Indian Manufactures), which studied those units which used power and employed more than 20 workers. Data under these series covers the period 1946 to 1958. Simultaneously, from 1949 to 1958, data on industries using power and employing more than 10 workers, and on units without power employing more than 20 workers, was collected under the Sample Survey of Manufacturing Industry (SSMI). Both these series were amalgamated under the Annual Survey of Industry (ASI) from 1959, and this series is available till today (Tyabji,1989: 162).
As is apparent when we look at the focus of the above surveys, data on the small sector was rather difficult to come by for a long time. This deficiency has been largely overcome by the Censuses of Small Industrial Units which were carried out in 1973-74 and recently in 1987-88.
3.7.1.1 Growth in number of SIDO SSI units
The number of registered units in the small scale- sector by the SIDO went up from 36,109 in 1961 to 318,000 in 1972 (Dutt,1981:534). In 1973, there were 409 thousand registered units. This increased to 805 thousand in 1979, 1.055 million in 1982, 1.355 million in 1985 and to 1.592 million in 1987 (Table B.11, CIER's Industrial Databook).
a) bogus registrations:
Unfortunately, the first Census of Small Industrial Units detected that nearly half of the small-scale units were bogus (Dutt,1981: 535). “It was estimated that in 1980 approximately one-third of the 300,000 small-scale units registered with State Directorates of Industry were either not traceable or were closed” (Rosen,1988:56). Similar trends have emerged in the Second All India census of small-scale industrial units, launched in March, 1988 (India, 1991:656), and completed only in 1991 (this fact of there being bogus units is from my personal knowledge in my recent capacity as Director of Computer Applications of Assam, India).
43
The problem of bogus registrations of firms as small-scale industries with the SIDO appears to have arisen largely due to the incentives offered to this sector. At one time, it was possible to make a quick pile by simply registering as a small-scale unit, getting the raw materials and trading these to the large-scale units at a profit. Perhaps some of these bogus registrations were promoted by the large-scale sector itself. With scarcities reduced, it is now largely due to the incentive to avail of subsidised loans which are available under programmes such as SEEUY and SEPUP (subsidy based loan schemes for poor entrepreneurs) that bogus units with no intention to produce, are registered.
As a method of reducing the negative consequences mentioned above, some suggestions have been aired from some time that there should be a time-ceiling on the subsidisation of the small-scale sector. One of the Development Commissioners of Small Scale Industries, in 1975, felt that “there was immediate need for limiting the concessions and facilities for a period of 10 or 15 years which would,” he felt, “go a long way in breaking the trend of `once a small industry always a small industry'“ (Tyabji,1989:180).
Unfortunately, not much action has actually been initiated in this matter, perhaps because of political compulsions, and the negative effects of the developmental policies still continue.
b) Sickness in small-industry sector:
Sickness of a small firm is not a well-defined term, but is used generally to mean a firm which is going in losses for some time, and is likely to close down unless revived by some means. Of the 300 thousand small units registered as of June 1980, about 21,000 were estimated to be sick (Rosen,1988:56). Further, the number of sick industries has been rising rapidly since 1980.
c) Many units not being registered:
Whereas there is a problem of a large bulk of the registered units not being in existence, there is also another, opposite, problem observed by some researchers in some parts of the country, viz., “Not all the units are registered with the Director of Small-scale industries or the Small Industries Development Organisation. A sample survey reveals that at least 50% of the units are not registered. This non-registration, in most of the cases, is deliberate as the owners avoid compliance with statutory obligations. Absence of registration ... leads to incomplete statistics, which adversely affects the planning of assistance to the industry” (Mathur, 1983:237).
Thus the statistics relating to number of small units can often be an inadequate picture of the number of small-scale units in the country.
3.7.1.2 Growth in employment
There is some difficulty in determining the correct figures of employment in the SSI sector from the data available. In 1960, 92 per cent of all registered factories were in the small-scale sector, and employed 1.33 million persons, which was 38 per cent of total industrial employment (Sen,1982:120).
The Sixth Five Year Plan (1978-83) document stated that “the number of persons employed in the principal traditional industries is estimated at about 14 million including about 5.7 million in the handloom industry and about 3.6 million in sericulture. Modern small-scale industries are estimated to provide full-time employment to about 2.8 million
44
persons” (Dutt,1981: 534). On the other hand, available data (CIER's Industrial Handbook, 1991-92: Table B.14) shows that in 1979-80, there were 6.7 million people employed in the small scale sector. This is 7.3 million less than the estimate made in the Sixth Five Year Plan. The discrepancy could have arisen due to the Planning Commission considering only `full-time' employees of the small-scale sector.
On the other hand, the data published by the SIDO seems to indicate that the figures in the CIER's tables relate only to the SIDO industries. As per the SIDO, 2.7 million persons were employed in the SSI sector in 1965 and this rose to 3.3 million in 1971. These figures are compatible with figures found in the CIER'S Databook. The position in 1989-90 is that 11.96 million people are employed in the SSI sector (CIER's Industrial Handbook, 1991-92: Table B.14).
Thus we can conclude that there were about 12 million people working in the modern small-scale industry sector in India in 1990, with another 20 million or so (very approximate estimate, in absence of reliable data), working in the village industry sector.
3.7.1.3 Growth in output
“Because of the many types of assistance provided by central and state government agencies the rate of growth in small-scale industry has been spectacular” since 1956 (Sen,1982:120). These growth rates have varied between 25 to 50 per cent per annum.
Table B.14 of CIER's Industrial Databook, 1991-92 shows that the total output of the VSI sector in 1973-74 was Rs.136 billion at current prices and this increased to Rs.1001 billion at current prices in 1989-90. “By 1976, the small industries accounted for more than 40 per cent of the total production” (Sen,1982:120). The output of the village sector grew 5.38 times in nominal terms during this period, whereas that of the modern small-industry sector grew by 7.36 times in the same period (Note: these figures are only approximations, since CIER has used different price indices in its data over the period 1973-1990).
There is other evidence also to show that “there has been a large expansion of activity by some types of small-scale enterprises in recent years. Three such industries are powerloom textiles, leather footwear, and chemical detergents. .. Before the mid-1960s, most of the machine-produced cotton cloth was manufactured in large composite mills combining motor driven spinning and weaving operations. The share of these large mills in such cloth production has gone down sharply, however, so that by the 1980s they produced less than 40 percent of the total output, while the powerloom sector produced over 60 percent. The powerloom units have at most four motorisized looms and employ no more than nine workers in a small house or shed. Such units need not register and they thereby escape the labour laws faced by the large mills. They also avoid the strong textile unions of the large mills; unregistered, they are also frequently secret, escaping any taxation” (Rosen,1988:57).
3.7.1.4 Growth seen as being sub-optimal
There is some evidence based on studies carried out by V.K.R.V.Rao and Sandesara to show that the growth of output of small enterprises in India from 1951 to the late 1970s was lower than that from large enterprises (cited in Rosen,1988:55). Thus there is a view that this sector has advanced less rapidly than the rest of the industrial sector (Mellor,1976:124).
45
According to this view, the general lack of demand for consumer goods, scarcity of raw materials and poor infrastructure hit the small-scale sector particularly hard in the intitial years of independence. The result was that many of the small entrepreneurs concentrated more on trading activities than on improving production methods (Mellor,1976:129).
Secondly, most of the resources were being channelled to the large-scale (primarily public) sector. Whatever little facilities were given to the small and medium sector were appropriated by the upper end of these sectors, leaving the tiny sector with practically no assistance from government. We shall see more on this when we look at the distorted implementation of the allocation of imported raw materials to small industry in Chapter seven.
3.7.2 Gate-crashing by capitalists
One of the serious problems caused by the large fiscal incentives to the small-scale sector is “gate-crashing” of the large-scale sector into the small. The Development Commissioner of Small Scale Industries, in 1975, “regretted that some people with adequate financial and other resources had started small industries and have also availed themselves of the various concessions and facilities under the small industries programme “ (Tyabji,1989: 184).
This problem has been attended to by allowing 25% equity holding by a large company in the shares of a small-scale company under the new rules of 1991. This has in effect regularised the “gate-crashing”.
3.7.3 Incentive to remain small
It is a fact that “very few firms are ever going to grow even to medium size, let alone to a challenging size. Most small businessmen lack the drive, imagination, and managerial ability, as well as the ambition and luck, required to set a small business on a strong growth path.” (Little,1987:19). But there is a serious problem in the methods of promotion of small industry as carried on in India, in that better management and innovation is rewarded with complete loss of privilege, by forcing the better performers out of the small-industry bracket, making them lose a huge pile of incentives.
“This creates a powerful incentive to stay small - or to seem small. It is remarkable that almost no enterprise in India voluntarily declares itself to have grown out of the small-unit category, and a good many have to be weeded out, kicking and bawling, by the government” (Lucas,1988:174). Some authors feel (Sen,1982:121) that the various measures implemented by government have obstructed the free development of capitalist forces, and have led to the undue enlargement of the small-scale sector rather than facilitating its gradual absorption into the large-scale industry.
Little reiterates this point, “The growth of firms beyond the limit of the ceiling is economically almost prohibitive. Not only would small firms have to cope with a much more difficult licensing policy, but they would also have to contend with higher labour costs (including wages and fringe benefits as laid down by labour laws) and substantially higher excise duties. The result has been that although the potential for the growth of units within the small-scale sector has bene fairly high, the opportunity for such firms to grow organically into successful large firms has been severely limited” (Little,1987:31).
The method adapted by the well managed units (which are the ones likely to become medium sized) to circumvent the issue is to split the small-scale unit as soon as it appears to be
46
growing above the definitional ceilings into more small-scale units. Though the extent of this practice is not known, it does represent a method of availing undue benefits from government, and there is impressionistic evidence of its existence (Tyabji,1989:182). This could be one of the reasons for the existence of the problem of multiple ownership of various small-scale industries by the same owners (Tyabji,1989:181).
3.7.4 Less sub-contracting
Mellor (1976:130) has emphasised, based on a study by Van der Veen in Gujarat (1973), that public policy must recognise the linkages between small and large industry. “In a closed economy, it is difficult for small-scale industry to grow without a complement of large firms” since “small firms “buy great quantities of intermediate products from large firms.” This is the typical sub-contracting model. Unfortunately, the policies adopted have not in any way succeeded in establishing a large sub-contracting system.
Rosen (1988:63) mentions that when he first visited India in 1955-56, subcontracting was almost totally absent. There is much more subcontracting now (in the mid-1980s) than was there earlier. However, it has not reached high levels as in Japan. Rosen identifies as the primary reason the fact that in India consumer goods are not produced in large quantities, and in the major Indian industries such as steel and heavy chemicals, subcontracting is not a very viable proposition. He visualises that with the growth of Indian consumer goods industries there will be an increasing scope for subcontracting.
Further,”the rising costs of capital in recent years and the differential in labour costs for large and small firms have contributed to the spread of subcontracting” (Rosen,1988:66). “A ... study estimated in 1983 that `a worker in a big modern factory earns two or three times as much as an unorganised sector worker with the same title ... and he has security and fringe benefits'“ (Rosen,1988:67). Thus we see situations developing in India which are likely to lead to the proliferation of subcontracting in the 1990s.
Rosen finds that there is one major hindrance to the development of subcontracting in India, viz., the absence of a law protecting the small enterprises from the large. Such a law exists in Japan, and “such legislative protection for the smaller firm ... might well be more valuable to the growth of the small Indian firm than some of the existing reservations and concessions.”
3.7.5 High labour turnover in small industries
Rosen cites a study by Taub which found high turnover in the small-scale sector (Rosen,1988:71). Workers come to the small-scale units as apprentices from villages, acquire skills and move on to other small and then large industries where their skills are duly compensated, and finally, they seek employment in public sector companies, where job security is very high. Thus small-enterprises appear to be the training grounds for new persons coming from rural and semi-urban areas. This must definitely be adversely affecting the long-term planning function in small firms, though it is difficult to say whether this consequence can be attributed to any government intervention.
3.7.6 Consequences for the traditional sector
Some studies are available on the subject of the consequences of the modern sector and the policies mentioned above on the household sector in the rural areas. “In the overwhelming number of industries, the decline in household employment is matched by an increase in non-household employment... Capitalist enterprises are coming up in the rural areas, even though they may not match the rate of decline of the pre-capitalist enterprises; and rural manufacturing
47
employment as a whole may be declining” (Tyabji,1989:170). Thus the strength of “capitalist enterprises” had uniformly increased in the rural areas between 1961 to 1981 (Tyabji:1989:173).
It can be seen therefore that the structure of small industry in India has been changing over time, largely on account of the policies adopted.
In the next chapter we take a look at the relative efficiency of the small scale sector vis-a-vis the large-scale sector.
48
CHAPTER FOUR
EFFICIENCY OF THE SMALL-SCALE INDUSTRIES SECTORWITH REFERENCE TO INDIA
Many arguments and theories have been put forward and debated on the relative merits of the small versus the large sector. We have considered these broadly in Chapter one (Section 1.5). Here we shall look into the one of the economic arguments: the issue of comparative efficiency between the large and the small-scale sectors. The chief of these arguments are: (Little,1987: 18)
4.1 STATIC EFFICIENCY ARGUMENTS
As per this argument, small industries lead to better allocative efficiency in the economy. They help in the maximisation of national output given the factors of production. In this context, it is felt that smaller industries are disadvantaged in terms of higher capital costs (higher interest rates, own savings), but they gain in terms of lower labour cost.
The questions to be examined here are:
4.1.1 Productivity
It has been uniformly found across the world that small-scale units are less productive than large scale units. The following evidence is proffered:
* In Japan, it is seen that productivity is clearly higher in larger firms. Firms with size of 1000 or more employees had a productivity of 100, whereas firms with size 30-49 workers had productivity of only 46.1 (Hagashi,1990:23).
* In Korea, “Labour productivity rises from the smallest class, 5-9 workers, up to size class 200-499. Capital intensity rises almost monotonically up to the largest size” (Little,1987:108).
* For India, a survey by the Central Statistical Organisation in 1967 found out that the productivity in large-scale industry is much higher per unit of labour than in small-scale industry (Sen,1982:121).
At the same time, it is worthwhile keeping in mind that “there are large variations in levels of productivity between and within each of the small industries” (Singh, 1974:110). An associated issue is that according to Staley and Morse (1965), cited in Naya (1985), SMI are more likely to be found in industries where economies of scale are not the major consideration, such as in precision handwork, finishing of machines, and other areas where sub-contracting is possible, due to the greater labour intensity of the process. SMI are more efficient once an industrial structure of an economy is diversified enough to require smaller product runs, and perhaps even customised goods. This complementarity between large and small units has been successful in Japan, and to some extent in Korea, as we shall see in Chapter 5.
SMI are also seen to be more efficient in many industries processing raw materials which are distant from the consumer centres. Examples could be the processing of perishable goods which cannot be transported to long distances to bigger factories. For these reasons more small-industry is likely to be found in rural areas, promoting off-farm employment.
49
4.1.2 Capital efficiency
When we examine the question of capital efficiency of the small versus the large sector, the following findings are available:
* According to studies cited by Dutt (1981:534) it has been shown that the capital output ratio of the small-scale sector in India, in 1971, was 1:8.5 - which was much higher than the ratio of 1:1 in the large scale sector. In other words, the small scale sector utilises capital more productively than the larger sector.
* Other studies do not show such results. We quote below extracts which show the sum and essence of these findings.
i) Dhar and Lydall's studies (1961):
“One of the earliest studies on the relative efficiency of small scale industries in India was undertaken by Dhar and Lydall. They compared output-capital ratios for a number of reasonably homogeneous industry groups, each depicting size variation. Two sets of exercises were carried out, one for nine industries using the CMI data for 1956 and the other for fifteen industries using data from studies of the Perspective Planning Division. Comparing the output-capital ratio for units employing 20 or more persons, it was found that the output-capital ratio for units employing more than 20 persons does not fall with size. Rather, in certain cases, it rises with size. For factories employing less than 20 persons, it was found that the output-capital ratio for such units was higher than those immediately above them (20-49 employment range) but not necessarily higher than large scale units. Accordingly, they concluded that small scale units (in the modern sector) are, in general, more capital using than their counterparts in large scale. In the words of Dhar and Lydall, `The figures suggest that, in general, the most capital-intensive type of manufacturing establishment is the small factory using modern machinery, and employing upto 50 workers'(Suri,1988:96).
ii) Hajra and Sandesara's studies:
“Similar findings were reported in the studies of Hajra and Sandesara” (ibid)
iii) Mehta's studies:
Both the above studies took employment as the criterion for size. “This was questioned by Mehta, who pointed out that the classification of factories based on employment does not show the productivity level of small scale units properly, since ailing or sick large scale units employing only a skeleton staff or new units undergoing teething troubles may get classified in the small size group. For his analysis, Mehta used the ASI data for thirty-two industries for the period 1960-63. .. It was observed in Mehta's study that in almost all cases, the capital-labour ratio rises with size and the output-capital ratio falls with size” (ibid)
Thus these findings conflict with each other.
50
iv) Bhavani (1980):
Another study, by Bhavani (1980) found that “in a fairly large number of small scale industries, ... both capital and labour productivities are lower than those in large scale units” (Suri,1988:100).
v) The U-curve of capital efficiency:
“contrary to the hypothesis, and as in Colombia, it (capital productivity) rises less fast than labour productivity up to size class 5 (100-199 workers). It is notable that it is virtually constant in the range 10-200 workers. Capital productivity is virtually constant in the range 5-50, but then rises dramatically in the range 50-200 workers, before falling back again (though not to the level of the range of 5-50 workers), showing the inverted U already observed in Japan and elsewhere” (Little,1987:108). In Thailand, as in Colombia, “capital intensity is relatively high in the smallest size class. It varies rather little until the size class 200 or more is reached, when it leaps. The inverted U of capital productivity is ... evident” (Little,1987:110).
Thus on grounds of capital efficiency, the evidence is not uniform and needs further investigation.
4.1.3 Employment generation and Labour Intensity
The Karve Committee emphasised the employment efficiency in its report. But according to Little et al, unfortunately, “important positions were ... taken up without any investigation of the extent to which different industries and techniques would produce output with more labour and less capital or of the relation between size and technique” (Little,1987:25).
* Small-sector does not provide more employment:
Sen (1982:122) feels that the argument of the government that the small-scale industry sector promotes employment was effectively repudiated by P.N.Dhar and F.H.Lyndall who, in 1961 said:
The principal argument put forward in favour of small enterprises is that they `give employment'. This, although true, is irrelevant, since the problem facing India is how to save capital and other scarce resources, not how to use abundant resources. ... Within the modern sector of manufacturing industry - with which we are primarily concerned - available evidence suggests that small factories use more capital and more labour per unit of output than large factories. The difference in the output-capital ratios is particularly marked when account is taken of the fact that large factories can more easily be organised on a multi-shift basis than small factories. From the point of view of saving capital, medium or large multi-shift factories give the better results, and small factories usually the worst.”
Further, Tarlok Singh (1974:110) is of the view that from the point of view of stability of employment, the small sector as a whole presents many uncertainties. This is due to the characteristics, particularly of the traditional industry such as handlooms, coir, sericulture, etc. In many of these industries, employment available is generally part time
51
in a bulk of the industry, and the worker has to supplement his or her income with cultivation and agricultural labour.
* Small-industry is indifferent to employment generation:
Little feels that small-industry is not particularly efficient in employment generation. According to Little in Suri (1987:128), “the differences in labour intensity between normally operating firms within any narrowly defined industry are very small compared with the differences to be found between the average labour intensity of different industries. Changes in the composition of output would do much more to increase the demand for labour than supply side intervention designed to change the establishment size structure of particular industries.”
* Small-industry does promote employment generation:
i) Naya (1985)
According to Naya (1985), “Some empirical evidence has shown that small-scale industries use more labour-intensive production technologies than large-scale enterprise, making them suitable to the capital-scarce, labour-abundant, developing countries. A World Bank study (1982), for example, found that relative labour intensity was roughly 4 to 10 times higher for small firms in India, Colombia, Mexico, and the Philippines ... Although few data are available, in general, it appears that SMI do have a greater overall, as well as direct, employment effect than large-scale industry.”
ii) R. Venkataraman (mid-1960s):
The former Member of the Planning Commission of India and later President of India, Mr. R.Venkataraman, stated in the mid-sixties:
“Data reveal that while the output employment ratio (which can serve as a measure of productivity) is the lowest in the small-scale sector, employment generating capacity of the small sector is eight times that of the large-scale sector. But what is still more striking and significant is that the net output-capital ratios of the small and medium sectors work out to 4 and 3.2 times that of the large scale sector in 1965” (Dutt, 1981: 779)
iii) Dutt (1981):
Dutt (1981:779) shows that in India there is no conflict between the employment and output objectives.
52
Table 4.1
Capital, Employment and output in India in 1974-75 (figures in Rs.)
--------------------------------------------------------------- Industrial sectors Small Medium Large
----------------------------------------------------------------1. Fixed capital 3,706 7,935 30,536
per employee (K/L)
2. Value added per 4,790 8,785 13,736unit of employment(O/L)
3. Value added per 1.29 1.11 0.43unit of fixed capital (O/K)
---------------------------------------------------------------Source: Dutt (1981:799)
According to Dutt, there is no conflict between employment and output objectives since labour intensive techniques do not result in lower output-capital ratios. According to him, therefore, there is a case for further expansion of activity in the small-industry sector.
iv) Charan Singh (1978)
Charan Singh, who was also the Prime Minister of India for a brief period, was a firm believer that small-sector promoted employment. He stated, in his book, “India's Economic Policy” (1978), as cited by Tyabji (1989:195):
The real choice in our country is not so much between large and small scale industry, as between power driven industry (large and small) on the one hand and cottage industry on the other. Only the latter can provide gainful employment to the millions in the villages who are busy during the sowing and harvesting seasons, but are idle for the rest of the year.
In this matter, therefore no simple outcome in policy is possible. Whereas the view of Dhar and Lyndall would perhaps be true in the long run, i.e., once poverty is removed from India, and therefore it is perhaps necessary to pay greater attention to increased productivity and economic efficiency, in the short run it is important to strengthen the small sector which is often localised, and provides at least gainful part-time employment to a person who would otherwise not be able to get full-time productive employment for the entire family in an urban multi-shift large company.
The analysis of Seiji Naya also reinforces this view. “It is therefore important that more attention be paid to the role of small-scale industries in the development process” (Naya, 1985).
4.1.4 Resource allocation and utilisation
53
There is a view that reservations for the small-scale sector are increasingly becoming sub-optimal as far as resource allocation in the economy is concerned. It is felt by Sen (1982:121) that “many of the items exclusively reserved for it could easily, and probably more efficiently, have been produced by private large-scale industry.” Thus, for the country as a whole, optimal resource allocation and utilisation becoming difficult, as per this view.
4.1.5 Appropriate Technology argument
There is a view that small industries are more appropriate, either environmentally, or to particular economic conditions. The former viewpoint is that small industry is by and large more decentralised, based on local raw materials and causes less degradation and pollution. The latter view is that small industry uses more appropriate technology for economically backward areas/ regions, being simpler and more based on local innovation. There is not much evidence available on either side of the picture.
4.1.6 Balanced regional growth
The Industrial Policy Resolution of 1956 recognised this as one of the main objectives of promoting small industries. This was advised mainly as an antidote to urban congestion (Tyabji,1989:142). This view was reinforced by the Third Plan Working Group on Small Scale Industries, which suggested the use of industrial estates as a tool for regional industrial planning (Tyabji,1989:146). In the view of Tarlok Singh (1974:112), “small industries can do much to assist balanced economic growth within each region and also safeguard existing employment, while providing for a steady increase in productivity.” Not much evidence exists on this subject to come to a definite conclusion whether the objective was sustainable, and if so, whether it has been successful.
4.2 DYNAMIC EFFICIENCY ARGUMENTS
Dynamic efficiency refers to those arguments whereby small industry is seen to be a contributing to the growth of technology and to perform a vital seed-bed function. We shall now look into these arguments:
4.2.1 Innovation
4.2.1.1 General Innovation
Some of the findings in this connection are:
* OECD papers (1982):
As the OECD background papers (1982:12) show, SMEs (small and medium enterprises) have, until recently, made a remarkable contribution towards the progress of technology. But in the past few decades, the conditions of technological progress have changed, as per the OECD report. According to this view, about 40 large firms world-wide are now responsible for more than half of all industrial R & D expenditure. This means that SMEs have much less access to research funds than ever before in history. But even in these times, research has shown that small enterprises can be relatively innovative. For example, a third of the firms with less than 500 employees in the USA innovate. In France, about 15% of the small firms innovate, whereas about 10-15% of the German small firms have been innovative (OECD report,1982:27)
54
* Birch (1979):
Acs (in Judd et al,1988:42) has quoted a study by Birch (1979) which found that whereas large corporations using mass production technologies were experiencing serious difficulties since the 1970s, with the Fortune 500 companies having lost about 5 million jobs between 1970 and 1985, smaller firms were far more successful in the areas of job creation and innovation. Even in the case of steel production, earlier thought to be a large-scale sector, in the USA in the recent years, due to flexible technology, mini-mills have “established more or less complete dominance in several product lines, and, in these markets, the integrated firms now exist by the will of the mini-mills rather than the reverse” (Judd et al,1988:44).
* Gellman Research Associates (1982):
A study in 1982 by Gellman Research Associates found that out of 563 firms which produced 635 product innovations during 1970-78, as many as 226 (40%) were classified as small (Judd et al,1988:43).
* Edwards (1984):
Another study by Edwards in 1984 found that the propensity to innovate in small firms is more than of large firms. It found that innovations per employee were 2.4 times more in case of small than in large firms (i.e., small firms allow for more creativity from employees), whereas the average period between invention and innovation was about 4.3 years in both small and large firms (Judd et al,1988:43).
* Indian firms:
Literature on this subject for the Indian firm could not be found, but based on my knowledge of the sector in Ambala (located in Haryana), which exports scientific instruments, and Ludhiana, which exports hosiery goods, hand-tools and other manufactures, there is some reason to believe that in India, much innovation originates in the smaller firms, with larger firms primarily engaging in technology transfer either from abroad or from the larger research institutions in India.
4.2.1.2 Technical efficiency
Extracts regarding some findings are quoted below:
* Page (1984)
As far as technical efficiency in the small-industry sector of India is concerned, measured by Page (1984), it has been found that there is a “significant positive relationship between technical efficiency and firm size in only one case, namely, machine tools” (Suri,1988:102).
* Little:
55
“Size, as measured by the number of workers, is a very poor indicator of anything of economic or social significance. But insofar as the evidence suggests anything, it is that the small (<50 workers) and, especially, the very small (<10 workers) are very often both technically and socially inefficient as compared with larger enterprises, especially those of medium size (50-499 workers)” (I.M.D.Little in Suri,1988:127).
* Bishwanath and Golder:
Bishwanath and Golder in Suri (1988:102) conclude that “Considering the available empirical evidence on the question of relative efficiency of small scale industries in India as a whole, it may be concluded that, although small scale industries may not be relatively inefficient in general, there are industries in which small scale units are inefficient compared to large scale units and such industries constitute a sizeable part of the small scale sector.” However, it is felt that “Even if small scale units are inferior (in some cases) in terms of technical efficiency, they may be far superior in allocative efficiency so that the economic efficiency of small scale units may be as high as that of large units” (Suri,1988:117).
* ADB study (1984):
Data on efficiency, as can be seen from the above discussion, is very mixed. Naya (1985:158) quotes an ADB (Asian Development Bank) study (1984) which found that “even at prevailing prices, uncorrected for possible distortions in favour of large-scale industry, small- and medium-scale establishments were more efficient than large-scale enterprises in about half of all industrial subsectors.”
These contradictory findings imply that more research is required to firmly establish the relative efficiency of the small versus the large industry sector.
4.2.1.3 Technology Transfer
Technology transfer can also be considered to be a form of innovation. The OECD study (OECD,1982:27), while referring to SMEs in Australia, showed that the innovation rate is rather high, with 39% of the SMEs in Australia innovating. But “many of these products may consist of imports which, in view of Australia's special position, are novelties for this country but already exist in other parts of the world.” This is the area of technology transfer. As we will show in the chapter on Japan and Korea, both these countries, no matter how innovative otherwise, have resorted heavily to technology transfer throughout their growth process, in order to be able to further innovate. Thus, technology transfer should be considered as a part of innovation.
If this be so, then there is some evidence in India that small industries are disadvantaged when it comes to buying technology due to the operation of the following factors (Lucas,1988:167):
i) high price:
Studies in India show that there is excess demand for technology and that sellers are in a position to push up the price (Lucas,1988:168). This obviously means that small industries, which are not particularly strong in their capital mobilisation ability, are disadvantaged compared to the larger industries. Of course there is the aspect of supply of vintage technology. Technology suppliers are generally forced to
56
supply their future past vintages at a lower price than their future vintages. Of course due to excess demand for technology, the actual price of a particular technology depends on various circumstances.
(ii) Preference of sellers to sell to large buyers:
“Suppliers prefer to sell technology to buyers who will win the largest national market for it. Hence supply of technology to larger firms is greater than to small firms” (Lucas,1988:167).
4.2.2 Flexibility of Small Enterprise
Acs in Judd et al (1988:42) shows that one of the reasons for the existence of the small firm is its use of more general-purpose machinery than a mass-production type large industry, enabling it to respond flexibly to the changing business environment and perhaps, in some measure, to customise its products. It is primarily due to this capacity, feels Acs, that small firms have stolen the show after the oil crisis of 1973 all over the world. The global volatility in prices, exchange rates, wages, etc., has meant that the mass-production firm has been unable to respond with the efficiency required, whereas the small firm has been able to modify its strategies quickly and reap the benefits, with the result that globally, the small industry seems to be on the ascendent after the mid-1970s. Acs has shown (Judd et al,1988:42) that the introduction of numerically controlled machines at relatively low prices has further boosted the relative flexibility of the small sector and has resulted in a more efficient response to the fast changing circumstances.
4.2.3 Seed-Bed Function of Small Enterprise
* In favour:
As per this argument, the presence of small enterprise in a country is essential for there being net growth in the industrial sector. The newly established small industries can be considered to be a seed-bed from which some will reach the medium and still fewer will reach the large-scale sizes.
* Against:
The contrary view is that all big industry did not start small. As shown in chapter one, there is a tendency for most of the large industry today to start large, at the level where the economies of scale are reaped, rather than starting small and growing in size.
It is difficult to support either view, since both seem to be valid depictions of what is taking place in real life.
4.3 CONCLUSION
This chapter has briefly examined the various issues involved in determining the efficiency of the small-scale versus the large-scale sector. The matter is extremely complex, with different findings leading us in different directions. More importantly, it is necessary to realise that there are no open and shut clues regarding efficiency of these sectors, and until then, each policy maker will have to make his or her own interpretation of these findings.
57
CHAPTER FIVE
A LOOK AT THE SMALL SCALE INDUSTRY SECTOR IN JAPAN, KOREA AND OTHER ASIAN ECONOMIES, WITH REFERENCE
TO EXPORTS, OVER THE 20TH CENTURY.
In this chapter we shall take a brief look at the profile of small and medium scale industries in Asia, and then focus on Japan and Korea.
5.1 A LOOK AT SMALL-SCALE SECTOR EXPORT PERFORMANCE WORLD-WIDE WITH PARTICULAR REFERENCE TO ASIA
There is a view that “international trade tends to be the preserve of large firms” (Cortes,1987:27). In their opinion, as expressed in a World Bank study on Colombia “SMI is unlikely to play a significant role in a developing country economy that is heavily engaged in the export of manufactured goods.” They hasten to add, however, that “in some countries, exports of products from small firms are facilitated by a strong intermediary system. Japan's trading houses have historically been a case in point. In other countries, when large producers move into world markets, their domestic markets may be partly taken over by smaller producers; those export activities may in turn be stimulated by the difficulty of competing in the domestic market. Despite such qualifications, heavy involvement in foreign trade in manufactured goods is likely to be associated with a size structure inclined toward LI (large industry)” (Cortes,1987:27).
In the case of Colombia, the evidence is that small industry sector is dynamic and growing in the domestic sector (Cortes,1987:208), but is lagging behind in the export sector. “Manufactured exports, which reached significant levels during the 1960s and the 1970s, appear also to be concentrated in the large firms. In 1970, twenty-four firms (ten of them foreign owned) accounted for 62 percent of manufactured exports (excluding sugar). Figures for more recent years are not available. ... Why they (LI) ... export a higher share of output than smaller, more labour-intensive firms do is (not very) ... clear. Possible causal factors include the advantages of size for winning contracts in international markets and perhaps a tendency for firms with foreign involvement, which are also usually large, to export a higher share of output than locally controlled firms” (Cortes,1987:78).
Thus it appears that SMI are generally disadvantaged in comparison to large-scale industry when it comes to exports. According to Harper (1984:132) larger firms are better able to utilise the concessions given in various developing countries for exports. “Given equal familiarity with official procedures, it takes as long to claim for a large sum as for a small one; most small businesses export small quantities and their managers are not familiar with procedures. They are thus able to take advantage of concessions of this sort.” The same holds true in India and in order primarily to overcome this constraint, various large firms have begun acting as intermediaries for small business in the export sector (as we shall see in Section 7.5). Harper (1984:126), however, warns against the government itself stepping into the marketing activities, instead of encouraging the small businesses to themselves handle their problems.
Surprisingly, data for Asia shows that small and medium enterprises seems to be playing a dynamic role in Asian economies, both in domestic production as well as in the export sector. In Asia, by and large, a significant part of manufacturing takes place in the small and household sector. The following data adapted from Naya (1985:150) confirms this:
Table 5.1
58
Relative importance of SMI in Asian countries------------------------------------------------------------------Country Year firms %age of
employing value addedfrom 5-99 againstpersons as %age total valueof all addedmanufacturing firms
--------------------------------------------------------------------Indonesia 1975 97.4 25.7Malaysia, West 1973 88.1 31.1Philippines 1975 95.3 14.4Thailand 1964 96.2 -
1980 96.5 41.7Singapore 1973 90.0 22.9Taiwan 1971 92.9 20.2Japan 1973 95.6 35.4Korea 1973 91.8 16.9------------------------------------------------------------
Thus, SMIs account for more than 90% of all firms in most Asian countries, but when it comes to employment and value added, their contribution is much lesser. Naya finds that “the importance of cottage industries has declined for most of Asian countries as the economy developed, though SMI continued to be dominant.” (Naya:158)
When it comes to exports from the SMI sector, Naya (1985) found that in Singapore, “SMI are highly efficient and contribute strongly to exports. Census data for Singapore reveal that in 1978, establishments with 10-29 employees exported 24 percent of their total sales, while establishments with 30-49 workers exported 43 percent.” (Naya,1985:159)
But the results of Singapore are not representative of Asia in general. “Even in export-oriented economies such as Taiwan and South Korea, the demand for products of SMI is primarily in the domestic market. A 1975 survey found that less than 20 percent of the output of SMI in South Korea was exported, with increases in the share of exports as firms size increases ... According to sample survey results, the SMI of Thailand and Malaysia were not far behind, with SMI exporting more than 20 percent of output in Thailand and approximately 12 percent in Malaysia... Exports of SMI in the Philippines and Indonesia were negligible in size and concentrated in traditional craft industries” (Naya,1985: 159)
But even though the Korean firms seem to be exporting only about 20 percent of what they produce, their role in the exports from Korea has been rapidly increasing. “Small firms in Korea accounted for 19% of exports in 1963 but this had increased to 36% by 1978; the average rate of growth in Korea's manufactured exports was 42% a year during this period, but small firms' exports grew at 51% a year (Harper,1984:131).
The reason for the growing significance of Asian (and perhaps other) SMI in exports arises, according to Malcolm Harper, from their greater use of labour, giving them an overwhelming comparative advantage in exports. For example, “in 1976 industrial wages in Thailand were one-fifteenth of those in the United States and in 1980 a labourer in Kenya earned about the same proportion of a British unskilled worker's wages” (Harper,1984:131).
59
“A striking feature of Taiwan's export expansion is that it was based to a great extent on exports of processed imported materials... By importing land-intensive materials (such as timer and raw cotton), processing them, and exporting the resultant products, Taiwan was in effect exporting its labour, skills, and capital, without having to draw on its own scarce supplies of land” (Little, 1970: 254). Further, “Taiwan's export success was ... due to a large number of factors, but among these the economic policies followed by the Government were certainly important (Little,1970:254).
“Hong Kong provides a striking example of a country which has been able to achieve immense success with its exports of manufactures from the base of a tiny domestic market and without any protection for that market or financial aids for exporting. Her exports, to an even greater extent than Taiwan's, are processed imported materials” (Little, 1970:260). A UNCTAD study cited by Little (1970:260) states, `The government has promoted the establishment of industries in Hong Kong through the provision of basic infrastructural facilities including electric power, water supply, industrial sites and workers' housing. The development of industrial estates ... has set a model for many other developing countries in Asia.'
A brief look at China will not be out of place here, since an excellent comparison of Indian and Chinese policies for the small industry sector has been carried out by Inderjit Singh (1990), and throws considerable light on the reasons for the relative slow growth of Indian SMI in comparison to China's. We quote Singh on this subject below:
“The different approaches to rural industrialisation taken in India and China have been examined by Sigurdson (1978). He points out that both countries recognise the need to develop nonfarming activities through rural industrialisation and both have some 20 million people engaged in rural industrial activities.
“Industrial activity in India's rural sector is dominated by traditional, household-based artisanal handicrafts, together with a modest but growing non-household sector; China's rural industries are run mostly by collectively owned units.
“India has tried to preserve village and artisanal activities based on Gandhian traditions. To this end, it has imposed quotas, differential pricing, preferential treatment for credit and raw materials, and a `reserved' listing of goods that can be produced only by this sector. As a result, primitive (and not necessarily appropriate) technologies involving limited use of machinery and power have been preserved at the cost of more efficient alternatives. It has also meant that new skills have not been learned, new occupations have been discouraged, and low labour productivity has been institutionalised. The integration of these household units with other industrial processes is minimal; they have consequently not been exposed to any modernising influence.
“In China, by contrast, under the communes, the collectivisation of household and village industrial and artisanal activities meant that the 20 million people in the rural industrial sector in 1973 were employed in modern or semimodern industrial activities as part of an overall program for rural modernisation... Levels of technical development and skills were consciously upgraded, and access to modern tools, machinery, and power were encouraged. The long-term benefits of skill formation have outweighed the costs of production equipment. This systematic organisation of rural industrial activity continues under the personal responsibility system (PRS)” (Inderjit Singh,1990: 256)
60
“The basic approaches underlying rural industrialisation programs are thus quite different in the two countries. China emphasises upgrading village crafts by transforming their technologies, while India preserves outmoded and stagnant production methods for their own sake, regardless of their high opportunity costs when compared with more appropriate systems.
“Secondly ...The Chinese have thus not been victims of the obsession to use labour at any cost that has prevented Indian rural industries from choosing more productive and efficient techniques. Rural industrialisation has rightly been seen not as providing employment opportunities for certain rural groups ... but rather as an integrated function of a modernisation program designed to upgrade the rural economy as a whole.”
“Thirdly, rural industries in India are considered in isolation both from urban industries and from programs for regional rural development. Rural industrialisation is organised in an economic vacuum. Vertical integration and linkages with urban industries through subcontracting are missing; there is no overall plan for meeting local needs through local production. .. In China rural industries are part of both an overall industrial strategy and an integrated rural strategy based on the TVE system. Not only is considerable attention paid to producing for local needs by local units using local raw materials and skills, but also the interdependence of units is planned for and promoted through links within counties, between counties, and with higher-level enterprises” (Inderjit Singh,1990:256).
With this background on Asian SMIs, particularly in relation to exports, we now turn for a detailed look at Japan and Korea.
5.2 JAPAN
Storey (1983:62) shows the “dominance of the small firm in the Japanese economy, in terms of both employment and numbers of enterprises. These facts may contrast with the casual observer's view of the Japanese economy, whose impressions are formed from Japanese export performance where large manufacturing firms figure very prominently.” Further, “large-scale, `modern' firms have never formed more than an enclave in an economic landscape populated by small firms” (Storey,1983:81).
As we see elsewhere, in spite of the commonly view of the dominance of large firms in the export sector of Japan, the fact is that small and medium enterprises produced 52.1 percent of the goods exported by Japan in 1980, and in addition, small enterprises supply about 20 percent of the components of the large sector. Further, the exports do not tell the complete story of Japan's economy. Japan exports only about 16 percent of its output (compared with 36% of output by Korea) (Kang,1989:49). Thus small and medium enterprises have a large role to play in the domestic economy as well.
This shows at a glance the amazing predominance of the small and medium enterprise sector in the Japanese economy, which is described in some detail below. But first a look at the context of Japan's growth is relevant.
As Vepa (1967:213) points out, “In a study of the development during the last 100 years of her (Japan's) growth one can see broadly two phases: the phase which began with the overthrowing of the Tokugawa Shogunate, the abolition of the Samurai and restoration of the boy
61
Emperor Meiji in 1868 which put Japan on the road to a new life and a new era of prosperity, and the second which began with the defeat of Japan by the Allies in 1945.
“In the decades just after Meiji restoration, Japan sent a large number of her youth abroad to study Western techniques and also invited considerable number of experts and educators who helped considerably in the development of the country” (Vepa:217). Thus, the Japanese economy was opened to the influence of science in a much larger and well-planned manner than any other Asian country.
Apart from encouraging the learning of foreign science and technology, the Meiji government in the early 1870s had directly fostered purchase of the latest, foreign machinery for its domestic textile industry. A notable success of this period was the private Osaka Spinning Mill. Government owned cotton mills performed relatively poorly in comparison. In order to pay for the purchase of the imported machinery, the government began to encourage exports of raw silk from Japan. At around 1880, government, in a pragmatic move, began to sell its losing industrial enterprises to private entrepreneurs. In 1887, the Nagasaki Shipyards were sold to Mitsubishi, and the government-owned coal mines were soon sold to Mitsui. This does not mean that the government did not lead in industrial development. In 1895, the government established its own steel mills, the Yawata Iron and Steel Works. This mill was to be the main supplier of steel for the shipbuilding and armaments industries in Japan in due course. In the meanwhile, the deflationary Matskata fiscal policies, had led to the “primitive accumulation” of capital (Kodansha Encyclopaedia: Vol 3:298). The sum total of these policies was the emergence of enormous business combines (zaibatsus) by the end of the 19th century. Thus the period from the 1880s till approximately 1910 can be said to have seen the industrial revolution in Japan.
The fundamental feature which seems to have distinguished the Japanese industrial revolution was the positive and pragmatic role played by the government. Enlightened self-government was thus among the many factors which led to the relatively rapid growth of industrialisation in Japan. “It was through Government management first and later through powerful industries with Government affiliation that the establishment of modern industrial growth was carried out” (Vepa,1967:44). “The process of industrialisation in Japan was more rapid and persuasive and produced lesser dislocation than in other countries of Asia” (Vepa,1967:217).
It is worth noting at this point that industrialisation in India and Japan began almost at the same time, with India in fact preceding Japan by a few years. India got its first railway five years before Japan, and India's textile industry was well advanced when Japan began her industrial growth.
* The major constraint faced by India, it appears, was the negative influence of the colonisation of India by the British, who never allowed India to become an industrial power.
* But through this all, Vepa identifies education as the chief distinguishing feature which resulted in Japan's rapid growth, compared with India. In fact, by 1906, school attendance in Japan had reached 96% of all children of school-going age, whereas India, has not come anywhere near this figure even today, 45 years after its independence (See Annexure to this chapter).
This view is reinforced strongly by Dore (1971:12), who also adds that “secondary education in Japan did not receive much attention until the level of diffusion of primary education had reached a high level...Similarly the big spurt in university education did not take place until something like 15% of the age
62
group was going to secondary school. This is in marked contrast with other countries today which can have 25% going to secondary school when there are still only 60% going to primary school. The difference is important, because what produced Japanese economic growth was ... the ground swell of small innovations by the people who were educated at least to the point of being receptive to the new ideas which the government was promoting and who could occasionally innovate themselves.”
The post-independence India is doing something for this but has nowhere reached the level of education which Japan had reached a hundred years ago.
* Another factor of great significance is the sense of nationalism and patriotism which the Japanese had (Dore,1971:9), compared with that of India where, particularly in post-Independence times, its ancient political and religious heterogeneity have created problems where nationalism is not always the driving force.
Thus, by the end of the 19th century, Japan had become economically far more powerful than India. However, we must keep in mind that the growth rates which have been seen in Japan after the World War II were never seen before. Even in 1965, in spite of the rapid growth of the past 80 years, Japan's GDP was only 1.8 times that of India. But by 1989, this had exploded to over 12 times that of India (this figure I had noted down from a World Bank country study on India, 1991, but do not have the exact reference with me now). It is therefore tens of times more difficult for India to catch up with Japan now than it would have been 45 years ago.
An underlying aspect of this revolution, of concern to us, was the small-enterprise policy of the governments of Japan. The “cumulative impact of small improvements in technology which are not a wide departure from traditional methods nor require heavy capital outlays in investment” (Vepa,1967:221) appears to have been a part of the industrial scene of Japan since the Meiji era. “The development of small enterprises was a key-stone of the entire economic growth of the country and it was the wide diffusion of ownership and entrepreneurship in the country that is a significant factor in Japan's rapid growth as an industrial power” (Vepa,1967:222). In the minds of the policy makers in Japan, there does not appear to have been any dichotomy between the development of the large industrial sector and the small enterprise sector.
“After the Second World War, Japan lost 45% of her territories including Taiwan, Korea and Sakhalin. Her economy was thrown into confusion and the demobilised soldiers and repatriated settlers had to be rehabilitated.” (Vepa,1967:159). But by rapidly learning to adapt the superior western technology which been the cause of its defeat, and fuelled by foreign aid from USA and the fact that it had no need to spend on defense, Japan soon overcome the set-back of the War. In fact by 1951, the volume of production attained was greater than the pre-War volume for the first time since 1944 (Vepa,1967:46).
The the post-World War II period saw the rapid growth of Japan. The policies followed by government were intended to promote import of technology and export of its goods; these policies were aided by various tax preferential measures. Of significance is the policy of promoting technical collaboration. The government was liberal in the matter of royalties and fees (Vepa,1967:215), which led the Japanese industry to reap a rich harvest of superior technology in all its industries. The Japanese negotiated 42,000 technology contracts between 1951 and 1984 (Kang,1989:54). The annual growth in Japan in the post-War period 1948 to 1964 was 9.3%, with most of this growth taking place after 1958.
63
5.2.1 Definition of Small Enterprises in Japan
i) In Industry: According to the Small Business Law (or the Basic Law Relating to Small and Medium-sized Firms) of 1963, a small/ medium enterprise (SME) was defined as an enterprise having a capital or a total investment of not more than Yen 50 million or regular employees numbering not more than 300 (Vepa,1967:38). This limit was increased to Yen 100 million in paid-in capital in 1972, with the limit of employees remaining the same. Within this overall limit of 300 employees, the small firms (as opposed to medium-scale firms) are defined as those with 20 employees or less (Storey,1983:47).
In India, as per Vepa, at the time of his writing his book (1967), the limit of capital for a small industry was an equivalent of Yen 37.5 million (excluding land and buildings). Comparisons at today's exchange rates are not readily available.
(ii) In Mining: In 1963 an SME in this sector was defined as one with capital of not more than Yen 50 million or regular employees of not more than 1000 (Vepa,1967:39). It appears that this definition was later changed to a limit on capital of Yen 100 million or workers less than 300, yet at the same time, the limit of 1000 continues to exist for certain cases of “co-operation between firms, such as in the ceramics industry (Storey,1983:47); and
(iii) In Commerce and Services: An SME in this sector had to have capital of not more than Yen 10 million or regular employees not more than 50. This limit was raised to 100 in the case of wholesalers, but retained at 50 for retailers (Kodansha,1983:203). It appears that the capital limit was raised later to Yen 30 million in case of wholesalers. Further, the limit for `small' firms in this sector was legally set at 5 employees (Storey,1983:48).
The following points regarding the definition are worth noting here:
i) The definition used is comprehensive with the term `small enterprise' covering not merely industry but mining, trade and even services. This is quite different from India's position, where only the manufacturing sector is considered for promotion by government.
ii) The criteria for different types of small business vary considerably. For example, in mining upto 1000 employees is considered small.
iii) The determining criteria appears to be the number of employees, i.e., the limit is not set by capital invested but by the number of employees. For example, the key to an average small enterprise appears to be the 300 employees rather than the capital investment of Yen 100 million.
As Vepa has stated: “In fact, in our visits, we were struck repeatedly by the large magnitude of the investment and volume of turnover of an enterprise which was technically eligible for assistance under the small business programme because of the specification of 300 employees in the definition. Sometimes an industry which had received such assistance might have outgrown even this criterion but it continues to receive assistance provided for it originally although no new assistance is given to such an enterprise. In fact, it may be broadly commented that the term `small business' often includes medium-ranking enterprises. While in India and most Asian countries, such
64
enterprises are dealt with as belonging to the large industry category, in Japan, they are classified along with the small enterprises. This is perhaps due to the fact that the Japanese word for small business `Ckusho-Kigyo' is literally translated not merely as small enterprise but `small and medium enterprise' (Vepa,1967:39).
5.2.2 Significance of SME in the economy of Japan
Data placed below shows that small and medium enterprises predominate in production and employment in Japan's private sector.
5.2.2.1. Number of enterprises
In 1960, Japan had 3.2 million small enterprises. This represented 99.4% of the total number of establishments in the country (3.22 million). The bulk of small enterprises in Japan were family-owned and managed and were largely in the field of trading and services. There were 1.75 million trading, and 0.65 million services establishments (Vepa,1967:41).
In 1963, there were 4.01 million; in 1966, 4.35 million; in 1969, 4.78 million; in 1972, 5.20 million; in 1972, 5.52 million and in 1978, 5.99 million SMEs in Japan (Storey,1983:49).
In 1981 the SMEs still constituted an amazing 99.4 percent (a numerical total of 6,229,572) of all firms in Japan. Out of this there were 837,098 manufacturers, 3,011,250 wholesalers and retailers, 1,334,709 service industries, and 1,015,279 others. (Kodansha,Vol 7,1983: 203)
It is also worth noting the important role played by the `miniature' enterprises (with less than 30 employees) which form the bulk of the Japanese SMEs. In 1960, 2.45 million (78% of the SMEs) were managed by the owner and his family, and had less than four employees (Vepa,1967:41). In most industrial sectors, smaller or family-owned enterprises are dominant in number. In manufacturing, for example, very small enterprises, with fewer than 20 employees, constituted almost 90 percent of the total. In the 1950s and 1960s, according to Vepa (1967:43)
“These enterprises are distinguished by their traditional, obsolete techniques and low productivity. However, they performed the important function of absorbing the surplus labour in the country whose unemployment might have otherwise upset the country's political and social structure. These miniature enterprises, in spite of their many limitations and disadvantages, have become an integral part of the country's economy and undertake the partial manufacturing of parts thus forming the vanguard of the economy” (Vepa,1967:43)
There was a time in about 1960 when the wage rates in miniature enterprises were as low as 30% of the wages in the larger enterprises (Vepa,1967:43). This created a `dual structure' economy with a trend towards “polarisation of the Japanese economy into a capital-intensive high-productivity, high-wage sector and the other, the reverse of it” (Vepa,1967:44).
From the 1960s uptil the mid-1970s, an acute labour shortage was seen in Japan. This manifested itself through an inadequate supply of middle and high school graduates. The SMEs were thus forced to raise wages, which helped reduce the “dual structure” of
65
wages. Lastly, since 1976, the large industry sector, being forced by the Oil Crisis of 1973 to become competitive, reduced their recruitment and commenced a programme of `rationalisation' which included greater emphasis on the well-tested JIT (just-in-time) approach. This increased emphasis on sub-contracting through SMEs (Storey,1983:61). Apart from this, the productivity of SMEs also improved remarkably during this period and ultimately, the differential between small and large firms has reduced and perhaps does not exist today in a substantial measure (Kodansha,1983:204).
5.2.2.2. Employees
In 1962, 78% of all the employees in Japan, or a total of 17.2 million persons were engaged in small enterprises (Vepa,1967:41). Further, 52 percent of employment was in establishments smaller than 100 workers.
Only 32% of its employees worked in establishments of greater than 300 persons. This figure held firm even in 1971 (Little,1987:81). In comparison, West Bengal (a state in India), Taiwan, and Korea have more than this in establishments of 500 workers or more (Little,1987: 81).
By 1981, the number of employees in the SMEs had actually increased to approximately 37.2 million workers and accounted for 81.4 percent of the total labour force (Kodansha,1983:203).
Let us briefly consider the profile of the employees and the labour market.
“On the supply side ... most workers in Japan want to secure employment contracts, wages or salaries which fluctuate little and whose trend is upward ..., security of tenure and fringe benefits... These benefits are usually only provided by the large firm... It is clear that the majority of workers find employment in the small firm sector where few of the above advantages can be expected. On the demand side ... large firms traditionally recruit almost exclusively from the ranks of new high-school and university graduates... They take the cream of each cohort, whilst small firms find themselves in competition for the rest” (Storey,1983:60).
This was particularly true from the 1960s to the mid 1970s, as mentioned above.
5.2.2.3 Value added
Value added by Japanese SMEs in 1980 accounted for 56.9 percent of the national total, compared with 36.8 percent in the United States (1972) and 23.8 percent for British firms with less than 500 employees (1968) (Kodansha,1983:203).
5.2.3 Growth of Small and Medium Enterprises
From 1963 to 1978, SMEs increased by about 1.9 million from 3.9 million at an annual rate of 2.1 percent (Kodansha,1983:203).
“The oil crisis of 1973 was followed by a sudden slow-down in economic growth. The ... problem resulted from the appreciation of the yen, which not only decreased exports in both value and quantity, but also allowed products of developing countries to make inroads into domestic and overseas markets.
66
However, many small and medium enterprises survived these economic vicissitudes, and some of them attained remarkable growth in spite of unfavourable circumstances” (Kodansha, 1983: 203).
Storey asks, “Why is it that small and medium-sized firms have been able to survive and even to increase their numbers in most sectors so as to defend their proportional position amongst all firms?” (Storey,1983: 60).
This continuing increase of SMEs can be largely attributed to the following factors:
- the peculiar growth of the inter-relationship between the large and small industries, particularly due to the changing labour market scenario, as described above; (Storey,1983:61)
- the rapid expansion of industries which based their JIT (just-in-time) system of materials on subcontractors (Kodansha,1983:204).
- marketing specialities such as fashion goods which only small firms can provide (Kodansha,1983:204);
- expansion of markets for goods and services based on high technology; and the growth of the service sector (Kodansha,1983:204);
5.2.4 Exports from small and medium enterprises in Japan
Amsden (1989:181) points out that small-scale firms were the principal exporters in the early stages of Japanese industrialisation. In the 1920s,
“Despite the strategic importance of the modern zaibatsu enterprises, medium and small factories employed the overwhelming majority of Japan's industrial workers. Even more important, the zaibatsu firms produced primarily for the domestic market, but the medium and smaller enterprises concentrated on production for export. With a few exceptions such as rayon, silk yarn, and cotton textiles, where large enterprises were also strong exporters, medium and small manufacturers of sundries such as bicycles, potteries, enamelware, canned goods, hats, silk textiles, and so forth were contributing from 50% to 65% of all of Japan's exports. And they were losing money doing it” (Amsden,1989:181).
In 1953, smaller factories of Japan were estimated to be responsible for about 60% of all exports. (Amsden, 1989:181) The importance of SMEs in the export driven economy of Japan, which was first recognised in the aftermath of the World War II, has continued till today. 52.1 percent of Japan's total exports of manufactured goods in 1980 were produced by SMEs.
This compares with 36.6 percent in the United States (1977: enterprises with fewer than 250 employees) and 27.9 percent in Great Britain (1968:enterprises with fewer than 200 employees) (Kodansha:203).
SMEs focused in traditional fields such as textiles, toys, crafts goods by utilising their labour-intensive character till the 1960s, as pointed out by Vepa (1967:43).
5.2.5 Role of SMEs in the national economy
67
In the initial stages of the industrial revolution in Japan, small enterprise was initially not accorded particularly high importance by government. But there was a natural comparative advantage in favour of Japan's traditional small industries on account of existence of cheap labour derived from the low productivity of agriculture. Hence these existed and survived without much government patronage.
About the period after the First World War, the disparities between small enterprises and the large enterprises began to accentuate in productivity and wages and the dual structure of the economy arose and became a social problem. A major reason for its arising was that the pre-War Japanese government had great militaristic needs which led to a great emphasis on large industries (Vepa,1967:45).
After the World War II the importance of encouraging the small enterprises through specific policy measures began to dawn on the Japanese government. The contributions of the SMEs were too obvious to be ignored. For quite some time after the war, they performed a vital social function by absorbing many jobless people. Further, they earned valuable foreign exchange credits be exporting such products as textiles, toys, watches, and Christmas decorations. In fact the SMEs accounted for well over 50 percent of Japan's total exports. The excellent performance of SMEs perhaps focused the attention of government to this sector and many measures in favour of SMEs were introduced subsequently, which we shall touch upon below.
After the immediate reconstruction of Japan was over by 1955, the SMEs further consolidated the work done, this time with government support. This situation improved as the Japanese economy entered a high-growth stage in the late 1960s, and then a lower-growth stage after 1973. In the sector of manufacturing industries, the contribution of SMEs to the growth of shipments in the 20 years from 1956 to 1976 was 51.5 percent, and their contribution to increase in employment over the same period was 70.1 percent (Kodansha,1983:203).
“It is the very size and importance of the small firm sector which accounts for the longer history and deeper concern shown for it amongst the social scientists as well as economic bureaucrats and politicians in Japan. The health of the small firm sector has, in a variety of ways, a very great deal to do with the health of the domestic economy as a whole” (Storey,1983:62).
5.2.6 Relationship with big industry
5.2.6.1 Exports paying for imports of capital machinery
Vepa (1967:43) has mentioned that “it is the export ability of the Japanese small industry that has enabled in the past the large industry to import vital equipment and machinery; and even today, the bulk of raw material imports essential for Japanese heavy industry are paid for by the exports from the small enterprise sector.”
5.2.6.2 Sub-contracting
There are a large number of small enterprises subsidiary to the large industry. The report of the MITI in 1976 (Storey:82) estimated that about 60 percent of all small and medium enterprises are shikauke kigyo (sub-contractors), i.e., controlled to varying extents by large companies. This control is exercised through the supply of parts or semifinished goods and occasional financial or technical assistance.
68
“On the average, subcontractors supply as much as 19 percent of all purchases by large corporations. Parent companies ... take advantage of their subcontractors by utilising the subcontractors' low labour costs, economising on capital investment, and passing on to subcontractors the financial burdens caused by increased inventories or by delayed customer payments. Recently, only the third of these advantages has been maintained, while the first two have lost their relative importance because of a smaller wage differential between large and small firms and greater increases in labour costs than in capital costs.(Kodansha:203)
A comprehensive analysis of the sub-contracting system is given by Broadbridge (1966).
5.2.7 Government Assistance to SME
The problems of the small enterprise began to be addressed seriously by the Japanese government only during the period 1955-1961. This period saw the remarkable expansion of the Japanese economy supported by technological innovation and modernisation. During this period, the distinction between the small and large enterprise, and their inter-relationships began to be given more attention by the government as well as by universities (Vepa,1967:46). Japan's system for assisting SMEs, as built over the period 1963 till today, is probably one of the most extensive of its kind in the world. It includes, among others, financial assistance for modernisation, management consultation services, precautionary measures against possible bankruptcy, and guidance for organising cartels.
5.2.7.1 Laws
The major legislation which started the process of promotion of SMEs was the “Basic Law of Small Enterprises”, passed in 1963. This was a comprehensive policy statement of Japan's promotional efforts in favour of small enterprises.
Japan has also promulgated the following laws in favour of small enterprises:
- law on formation of Small Enterprise Organisation- Small Enterprise Cooperative Law- Shopping Districts Development Cooperative Law- Law on Formation of Societies of Commerce and Industry- Smaller Enterprise Modernisation Subsidy Law- Small Business Investment Company Law- Small Enterprise Modernisation Promotion Law- Law Concerning Management and Technical Improvement of Smaller
Enterprises- Small Enterprise Retirement Allowance Mutual Aid Law- Law Concerning Employment Promotion Projects Corporation- Minimum Wages Law- Law pertaining to the Federation of Private Monopoly and Maintenance- Law in Prevention of Postponement of Payments to Sub-contracts- Department Stores Law- Law on special measures to adjust retail business- Central Bank for Commercial and Industrial Cooperatives Law- Small Enterprise Finance Corporation Law- People's Finance Corporation- Small Enterprises Credit Insurance Corporation Law
69
Vepa (1967:pp.55-62) gives a detailed description of these laws. A notable feature of these laws is that they are followed uniformly all over the country. “Most policies are laid down by the national government and the prefectural governments follow the guide-lines. So there is no variation between the assistance a small enterprise businessman receives in Kyushu or Shikoku. This ... makes for uniformity and greater mobility of business which enables it to go wherever it is most profitable to do so” (Vepa,1967:223).
5.2.7.2 Management and Productivity
Among the more important measures of promotion which needs to be mentioned is the productivity and management movement in Japan which was formalised in 1955 with the establishment of the Japanese Productivity Centre (JPC). This movement included the technical exchange of professors, industrialists and trainees between the United States and Japan. Various modern management techniques in marketing, industrial engineering, materials management, etc., were introduced into the Japanese industry and adapted for use in Japan. Japan Productivity Centre has been providing, inter alia, technical and management guidance to small business (Vepa,1967:161). The JPC had, in early 1960s, as many as 30 management consultants in different functional areas, with wide practical knowledge. The services provided to the small enterprises included training, problem-solving for small enterprise, and general consultancy. Also, the JPC sends teams of small enterprises managers to different countries, to expose them to the economic situations in different countries. The JPC also widely disseminates knowledge and acts as the documentation centre for knowledge on productivity and industry.
5.2.7.3 Institutions to provide finance
For the modernisation of small enterprise, the government set up several institutions to assist small enterprises in finance.In addition to loans given by the government, the Small Business Finance Corporation and the Development Bank provide different kinds of loans to the small entrepreneurs, primarily for equipment modernisation and long-term operating funds. The People's Finance Corporation which focuses its activities on small-scale and family-owned firms. The Central Bank for Commercial and Industrial Cooperatives, makes loans available to its members. All of these institutions provide loans with relatively favourable rates of interest and repayment terms.
5.2.7.4 Tax reliefs
The tax system is intended to provide relief and encouragement to SMEs. Corporate tax for small firms is 28 percent for undistributed profits and 22 percent for dividend credits when annual income does not exceed Yen 7 million, as compared with 40 percent and 30 percent, respectively, for large corporations. (Kodansha:204) Special depreciation allowances for bad debts are also available.
5.2.7.5 Smaller Enterprise Agency under MITI
The MITI (Ministry of Commerce and International Trade), established, in 1950, the Chusho-Kigy-Cho, or the Smaller Enterprise Agency. It functions as a Bureau under the MITI. A look at the budget of this Agency in 1964 is instructive (Vepa,1967:53):
Components of the Budget Percentage allocation
-----------------------------------------------------------
70
Loans for modernising small enterprises 38.9Industrial estates 15.5Joint facilities 8.6Small size enterprises 12.1Cooperatives of retail shops 6.5Commercial estates 3.8Guidance activities 3.2Working expenses for the Nippon Institute
for Small Enterprises 2.8Building of shopping districts 2.1Working expenses of National Federation
of Central Societies of Smaller Enterprises Association 0.9
Integration of companies 0.6Export promotion 0.4Training of management and technical
experts 0.7Others 3.9
---- 100.00
The total amount allocated was 11.56 billion Yen.
Thus the chief strategy seems to be to promote expansion and modernisation of the small enterprise sector by means of giving low cost loans.
The second strategy is to promote the `settlement' of industrial estates. These estates differ from those in India by being more in the nature of re-settlement of existing enterprises to an area outside the urban limits.
It will be relevant here to mention that MITI has all along played a vital role in the development of Japan. It has been termed as the 'pilot agency' by some (Johnson,1982:26). MITI has “the greatest concentration of brain power in Japan”, according to a journalist.
5.2.8 Problems of the SMEs in Japan
It is considered by some that poor management - particularly in planning, marketing, and technological development - is a problem associated with small business in Japan. But SMEs, who are often technically assisted by large industry, have by and large grown in size and overcome the problem of weak management capability. “Thus, while wage, productivity, and skills differentials between small and large firms still exist, they are now much less conspicuous, and small firms sometimes show high levels of productivity and management skill.” (Kodansha, Vol.7, 1983:203)
5.3 KOREA
Amsden (1989:27) has given a concise economic history of Korea. The Yi dynasty ruled Korea from 1392 to 1910. This was a relatively weak monarchical system, which operated as a tributary to the Ming Dynasty of China since its taking power. During this period, Japan twice attempted to invade Korea. The first attempt was in 1592-1598 but was averted. In 1876, the Japanese once again looked towards Korea and forced Korea to sign trade and other treaties, consequent upon which the yen became the currency of Korea. Tariffs were imposed against
71
Korean goods and Japan found a useful market for its domestic products. In 1894 a peasant uprising in Korea was suppressed with the help of the Chinese. In 1905, Japan declared Korea its protectorate. Ultimately, in 1910, Japan formally annexed Korea. Japan's advent saw the abolition of slavery, the codification of the civil law, creation of infrastructure and development of commerce. But it appears that just as was the case with India, colonialism left Korea technologically far behind. Japan developed some large industry in Korea (Vepa,1967:186) but the general industrial base was kept weak. There was hardly any entrepreneurship. The Korean capitalists and academia were kept on the fringes of Japan's economy and were discriminated against at managerial and supervisory levels. Whatever little industry was set up in Korea (in the 1930s), was with the intention of strengthening its war machinery.
There is one particular feature of this colonialism that distinguishes it from British colonialism of India. The Japanese (with a vested interest, no doubt), fostered the growth of formal education, even university education, in Korea. This emphasis was “unusually high by colonial standards” (Amsden,1989:33).
Japan left Korea in 1945. But the Japanese had left it very weak, and within a few years, Korea fell prey to the Great Powers. Both Russia and the US established political outposts in Korea. The Korean War finally began in June, 1950 and ended in 1953 with the division of Korea into two geographically and ideologically separate parts.
We are presently concerned largely with the fate of South Korea. “When the Korean economy was resuscitated in the 1950s, it bore some unique features but many familiar marks of colonial distortion. There was overcapacity in textiles and light manufactures and undercapacity in basic industry. There were a large number of small-size firms but a hiatus in the large-scale category” (Amsden,1989:34). On the other hand, Vepa is of the view that “although heavy industries have been developed to some extent by the Japanese, the small industries sector has remained weak and backward. It is only in recent years after independence has been achieved and peace has been won, that the country is actively promoting the growth of small industries” (Vepa,1989:186). It appears that the entire industrial base was rather weak, and in some ways akin to what India inherited after independence.
From 1953, the progress of Korea deviates from that of India. This was due to the heavy foreign aid received from the United States during the First Republic (1948-1960). Venality and political connections led to the unequal distribution of the `spoils'. Fraud became rampant. This “provided the basis for the emergence of an altogether new entrepreneurial element, less conservative in outlook ... and far more growth oriented” (Amsden,1989:39). “These subsidised entrepreneurs were generalists, devoted to moneymaking in whatever industry the opportunity arose... As the high-aid era drew to a close, the embryo of a new social, economic and political force had been conceived” (Amsden,1989:40). By 1959, after a high growth decade, the economy was deeply into depression, due largely to the winding up of aid. In April, 1960, the Republic fell. Ultimately, in May, 1961, the military junta took over power, with General Park Chung Hee presiding over the `Golden Age of Growth' till 1979 when he was assassinated. (He was formally elected civilian President in 1964). Park Chung Hee professedly followed the example of the Meiji restoration in framing his own policies (Amsden,1989:52).
The decade of the 1950s and early 1960s was therefore a very turbulent one for Korea, and differs considerably from the carefully measured progress of India. But precisely for the turbulence, perhaps Korea was able to throw up a leader of great vision who radically transformed Korea.
The GDP of Korea was 1/20th of that of India in 1965. By 1989, it became equal to that of India (personal notes made from World Bank country study on India, 1991:exact reference not
72
available at present). At this rate the GDP of Korea should become double India's size within five years.
5.3.1 Industrial growth of Korea
“If Japanese growth has been called miraculous, Korea's development has to be one of the most amazing economic feats of history” (Kang,1989:46).
In 1962, the per capita GNP of Korea was $87. By 1987, this had reached $3132. Comparisons show that the growth rates of Korea were one of the highest shown by any nation in the world in the past thirty years. Between 1975-79 the growth in GNP almost touched 10% (Kang,1989:45), and between 1980-84, it slowed down to 5.3 percent but was still higher than that of Japan and of course the US.
Korea has hardly any major natural resources. Its only asset is its population, 42 million in 1989 (Kang:47) Korea is a debtor nation. Its foreign debt in 1987 was $36 billion, whereas Japan has been running current account surpluses since many years.
Thus Korea has been borrowing in order to finance its growth. An illustration is its famous company Samsung, which grew 14 times in just 10 years: this company has a debt-equity ratio of 3:1. Thus its growth has been fuelled by heavy borrowing. Kang feels that “if it didn't take the high-leverage route, it could not grow fast enough to kick itself out of the less-developed status” (Kang,1989:50).
The following are some of the factors behind the success of Korea:
* Liberalisation of the economy between 1959 and 1967: Korea began the 1950s by following the general norm of developing countries in favour of import substitution. But from 1959, certain export promotion measures were adapted. In 1961 and 1964, the exchange rate was brought closer to the free-trade exchange rate. Soon, import controls were also relaxed. Finally, in 1973, many export incentives were abolished after an exchange rate adjustment (Balassa,1982:214). But even by 1965, a bulk of the reforms had taken place, and the Korean economy was one of the most open economies in terms of its trade policies. “By maintaining the exchange rate near the free-trade level and granting exporters free access to imported inputs, the government has provided, on the average, almost equal incentives to produce for domestic sale and for export” (Balassa,1982:270).
* Education: Korea is 97.5% literate. We have seen above how the seeds of this favourable situation were placed by the Japanese during the first half of this century. This broad educational base is therefore very similar to that prevailing in Japan, though quite different from India's position. Since the 1950s, Korea sent many of its economists to study in top US institutions, which helped the government to frame the best possible policies (Kang,1989:54) Further, Korean firms use the services of Koreans settled abroad even today to go up the learning curve. The impression gathered is that Koreans are very hungry for the latest knowledge (Kang,1989:93).
* Reduced population growth: To get out of the vicious cycle of poverty, with more mouths to feed overwhelming the economy, the Korean government introduced various programmes such as favourable finance for housing if the head of the household
73
underwent vasectomy. This has kept Korea's population growth to between 1.2 to 1.6 percent (Kang,1989:54) With India's growth rate being over 2 per cent per annum even today, there are obvious problems in increasing per capita incomes.
* Labour market: The wage rates of Korea are less than 20% of that of Japan (average of $4,224 against Japan's $22,458 in 1987) (Kang,1989:51).
`Additionally, this labour force is reportedly very industrious. “The Koreans, believe it or not, make the Japanese look lazy” (Kang,1989:51). One reason is that jobs are relatively scarce due to high unemployment. The labour is also relatively less demanding: it was only after the labour unrest of 1987 that the workers became entitled to overtime and wage increases.
* High concentration of industrial structure: Surprisingly, Korea's model of growth is large-industry based. It is amazing that in 1984, it took only five largest conglomerates to make up half of Korea's GNP, with Samsung's revenue touching 6.4 percent of Korea's GNP in 1980. Thus capital intensity and scale have played a very important role in Korean industrial growth. This appears to be one of the reasons for the relatively higher unemployment in Korea than in Japan. Further, this makes the entire economic structure very fragile and vulnerable, whereas Japan's network and connections between large and small industry allow for continuous innovation as well as acting as a social buffer.
* Import of technology: Korea also followed the pattern of Japan in the import of technology: between 1962 and 1985, it imported $1.3 billion worth of technology. (Kang,1989:54).
* “Export or die”: In a way very similar to Japan of the 1950s, Korea has a very strong orientation towards exports reflected in this phrase. In 1964 the Korea Trade Promotion Corporation (KOTRA) was formed to promote exports and to do market research. Psychological incentives were also put into place. From 1969 the exporters were graded into four categories on the basis of export performance. The highest export achievements bring the national medal of honour, public presidential commendation, and material benefits including relaxation of tax surveillance. The strong system of export incentives propelled the Korean economy onto a growth path (Balassa,1982:216). Manufactured exports, which constituted 14 percent of commodity exports in 1960, increased to 82 percent of the total in 1975.
* Strategic industry: This is a concept initially developed by Japan, and perfected by Korea. Korea has a system of targeting industries as strategic, based on their export potential, prospects for domestic demand, minimisation of raw materials dependency and minimisation of trade friction, etc. Analysis showed Korea that electronics was one such industry where it could go `full throttle' ahead. The primary reason for this was the comparative advantage enjoyed by Korea in relation to most other developing countries, of its high literacy rate, and relative absence of raw material constraints, among others.
Accordingly, the electronics industry in Korea has seen an explosive growth. In the mid-1960s, the industry's income was about $10 million, and this exploded to an astounding $10 billion by 1987 - a thousand times. Now, Korea is shifting its strategic thrust from consumer electronics to industrial electronics, and may reap similar rewards in the coming decade (Kang,1989:86).
* International Sub-contracting and Partnering: In many fields of technology, product life-cycles are getting extremely short and foreign companies, from the US and Japan are
74
actively entering into sub-contracts or partnerships with Korean firms to produce goods for the consumer markets, which are ultimately sold under the foreign company's brand name. This is because of the comparative advantage which Korea has developed in the labour market over the past thirty years. This international sub-contracting is generally carried out by the large conglomerates (Kang,1989:91).
5.3.2 Definition of small and medium enterprises in Korea:;
Moving to the small-scale sector in Korea, we first take a look at the definition. At the time Vepa wrote his book, the definition of small and medium enterprise (as given in Article 2 of the Enforcement Decree of Small and Medium Industries Cooperative Law of Korea) was:
(i) an enterprise in the business of manufacturing with less than 200 employees or total assets of less than 50 million Won (1 US$ = 270 Won) or
(ii) an enterprise in the business of mining with less than 300 employees or total assets less than 50 million Won. In practice, the number of employees tends to be the chief criterion: the petty enterprises employ 5-9 persons, the small enterprises 10-49 persons, the medium enterprises from 50-199 persons (Vepa,1967:186).
5.3.3 Role of small and medium enterprises in Korea
We find that in Korea, the top 30 conglomerates employ a quarter of the labour force. But where does that leave the rest of the 75%, specially in view of the fact that the value added by these 30 conglomerates could be a major part of the national income. In fact, the SME sector in Korea was and continues to be of far lesser significance than that in Japan, to the extent that “small-scale firms ... have faced government discrimination during the heydays of heavy industry and rapid growth” (Amsden,1989:181). However, Amsden adds, “Nevertheless, the modern industrial enterprise in several key sectors in Korea would have been hard pressed to expand without it (the SMEs)” (Amsden,1989:164). Accordingly, the government of Korea has begun to look into the role of the SMEs more carefully. We will touch upon this shortly.
5.3.4. Number of SMEs
“According to the 1963 census of the Korean Reconstruction Bank, the number of small and medium enterprises is 19,253, representing 98.5% of the total number of enterprises and employing 62.2% of all employees in industry. The value added and total production of such enterprises are 49.7% and 56.6% of the entire mining and manufacturing sectors” (Vepa,1967:186).
“...figures for the Republic of Korea in 1975. It is possible to produce an estimate of the proportion employed in household manufacturing ranging from 7 to 29 percent depending on whether temporary workers (even for an hour a week) are excluded or included. Nonhousehold workshop (1-4 workers) employment is firmer, and the proportion lay between 7 and 9 percent (producing approximately 3 percent of the value added by factories) (Ho 1980, table 2-1)” (Little,1987:71).
“(India's) 69 percent in cottage-shop establishments would be a reasonable guess to compare with 14-36 percent for Korea, 43 percent for Colombia, 63 percent
75
for the Philippines,... and with rough estimates of 1 percent, 7 percent and 14 percent for the United States, Germany and Japan” (Little,1987:73).
“In the case of the latter (Korea), shifting the definition of a small establishment from less than 50 to less than 100 workers, we find that small-establishment industries accounted for only 39 percent of employment in all small establishments in 1975” (Little,1987:77).
5.3.5 Employment
We quote figures and tables directly from Little, who describes these rather well.
“(from table 6-4) It can be seen that in Korea small-establishment industries account for only 41 percent of employment in small factories, compared with 70 percent in the case of India.” (Little,1987:78-79)
Table 5.2(Table 6-4 of Little, cited above)
Share of employment by Industries of Different Configuration, India and Korea----------------------------------------------A B C D E F G----------------------------------------------75-100 35 30 22 114 17 550-74 34 40 30 61 24 1025-49 28 23 31 86 39 270-24 18 7 17 112 20 58Total 115 100 100 373 100 100-----------------------------------------------
Source: Little,1987:79.where:
A= Percentage of workers in units of less than 100 workersB= India (1972-74): Number of industriesC= India (1972-74): Percentage of employment in ASI units of less than 50 workersD= India (1972-74): Percentage of employment in all unitsE= Korea, 1971:Number of industriesF= Korea, 1971:Percentage of employment in units of 10-49 workersG= Korea, 1971:Percentage of employment in all units
“The industries which were both small-establishment oriented and provided much employment (over 5,000 persons) in Korea were grain milling, rice wine, sawmills, building materials, and printing” (Little,1987:78)
Table 5.3(Table 6-5 of Little, cited above)
Nonhousehold Manufacturing Employment by Employment Size of Establishment
----------------------------------------------------------------------Location Tiny Small Medium Large
Workers: 1-4 5-49 50-499 >500
76
----------------------------------------------------------------------Korea, 1958 n.a 54.0 34.0 12.0Korea, 1973 7.9 22.0 31.6 38.5USA, 1971 1.2 14.1 43.7 41.0------------------------------------------------------------------------
Source: ibid
“where manufacturing has grown very fast (Korea), factories with 10-99 workers have increased employment more slowly than have larger ones” (Little,1987:13).
“In Korea in 1973, 9 percent of units in the size group 5-49 workers cited financial institutions as the main source of start-up finance, more than elsewhere. Thirty-two percent started with less than $2,500, and 82 percent with less than $25,000. The mean employment was 13. One-quarter looked to outside sources for working capital, mainly to banks, but also to suppliers and friends and relatives. The larger the size, the larger the share of institutions. About one-third of investment was financed from outside sources, much less for the smallest units” (Little,1987:284).
“Manufacturing establishments in India with over 500 workers account for a higher share of total factory employment in units of over 20 workers than in the United States and far higher than in Japan, Korea or Taiwan, despite the rapid growth of large-scale industry in these countries in the past twenty years. Similarly, the medium range of 50-500 workers accounts for well over half of total factory employment in these countries, while in India it accounts for less than a third” (Little,1987:302).
“(data) indicates ... that their (SMEs) employment share is decreasing. Korea's small- and medium-size firms (with fewer than 500 workers) employed as much as 88% of the work force in 1958, down to only 63% in 1983” (Amsden,1989:181).
The unemployment rate of Korea has fallen from 8.3 percent in 1962 to 4.1 percent in 1975. Balassa (1982:264) quote a study which showed that between 1960 and 1970, the growth of exports was responsible for 38.3 percent of growth of employment in manufacturing and 32.7 percent of the growth of total employment.
5.3.6 Productivity
“Capital productivity in Korea peaked in the range 50-500 workers in two-thirds of the industries. We found further evidence in Colombia, India, Japan and Taiwan that capital productivity tends to be highest in medium-size establishments” (Little,1987:305).
“Total factor productivity is a better measure of efficiency in the use of factors of production than capital productivity alone. Results based on the Korean census show that in about half the industries examined this measure peaked in the range of 50-500 workers. In only about 5 percent of industries did it peak in the smallest size class” (Little,1987:305).
5.3.7 Role of SMEs in export
77
Some evidence shows that “In South Korea, the export-oriented small and medium industries increased their share from 14.7 per cent of the total exports in 1965 to 41.6 per cent in 1970” Desai (1983:143). This indicates that there has been a rapid increase in the role of small-scale industry in exports from Korea.
However, other evidence does not seem to ratify this. Amsden (1989:181) observes that “contrary to the historical pattern in Japan, small firms in Korea serve the domestic market, and large firms export. According to Samuel Ho, who in 1980 wrote about small-scale enterprises (SSEs) in both Korea and Taiwan, `because most SSEs produced primarily for the domestic market, the export promotion policies did not in general directly affect the small-scale sector.”
We quote further from Amsden (1989:181)
“Youngil Lim's analysis of data from the Small and Medium Industries Bank in Korea suggests that its clients typically export between 10% to 20% of their output, whereas in the aggregate, Korea's exports amount to approximately 35% of output (1981). In a study of over 500 small- and medium-size firms in the machinery sector, Jae Won Kim found that approximately 60% did not export at all (1983). Small- and medium-size firms in Korea appear to be marginal exporters in spite of the fact that they account for a large share of employment, as do small firms in Japan.”
5.3.8 The comparative advantage in Korea
“The determinants of comparative advantage are many and complex. They include elements such as natural resource endowment, labour skills, and learning-by-doing and other dynamic phenomena” (Balassa,1982:261). Balassa has hypothesised that the comparative advantage of Korea lay in labour-intensive as opposed to capital intensive activities, and tested this hypothesis using available data. It was found that
i) Korea's manufactured exports were more labour-intensive than its imports throughout 1960-68.
ii) Korea's manufactured exports have become more labour intensive over time, both in absolute terms and relative to manufactured exports (Balassa,1982:263) “Exports have thus proved to be a powerful engine of economic growth and, because of their labour intensity, have contributed greatly to rapid employment growth, which in turn has no doubt been a major factor in maintaining a relatively even distribution of consumption” (Balassa,1982:270).
Thus data suggests that Korea did follow its comparative advantage with the expansion of the manufacturing sector. “Thus Korea provides an almost classic example of an economy following its comparative advantage and reaping the gains predicted by conventional economic theory” (Balassa,1982:273).
5.3.9 Government policy on SMEs
As seen from the views of Park Chung Hee cited above, it appears that the effort of the Korean government has been largely to attempt to introduce the subcontractor system in order to link the small and large industry together. As a result of this, “the most striking similarity between the small- and medium-scale sector of Japan and that of Korea is subcontracting involvement in the automobile, shipbuilding, machinery, and electronics industries. Being older and operating in a larger domestic market, the Japanese subcontracting system in the automobile
78
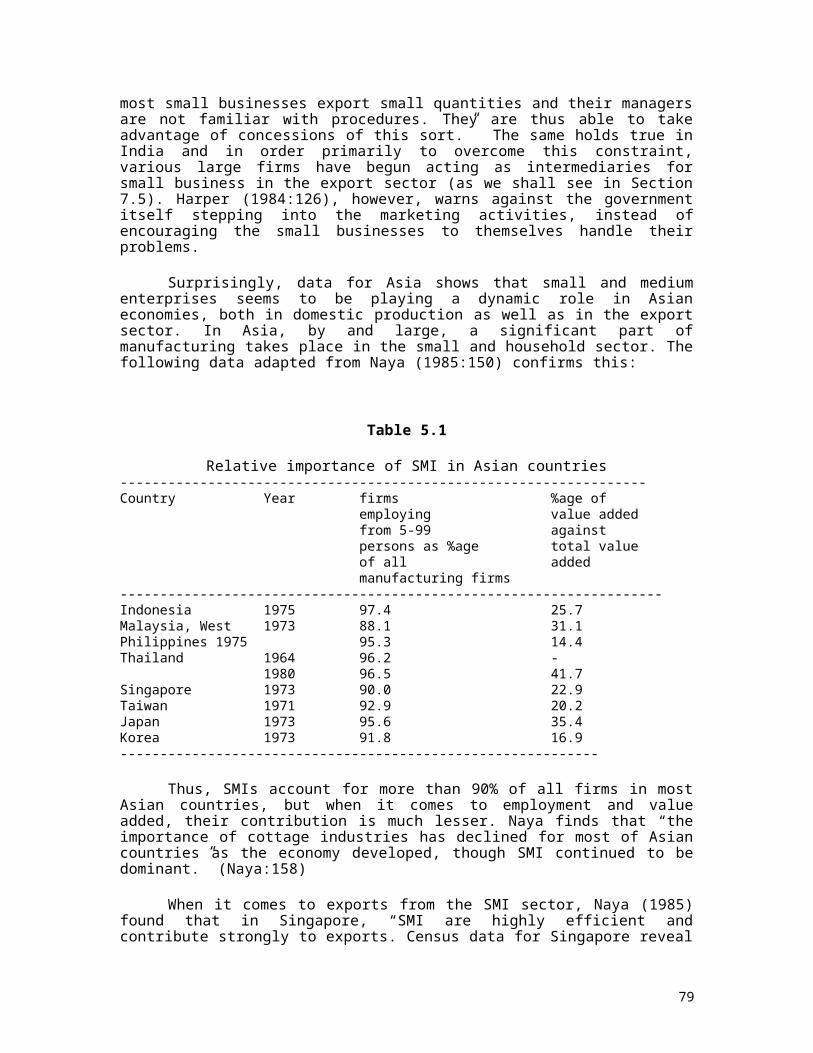
sector is more highly articulated than Korea's, and it involves several layers of subcontractors. However, the two systems closely resemble each other... they are directly linked through technology transfer and both operate on the basis of a just-in-time inventory system” (Amsden,1989:183).
Government of Korea has increasingly been recognising the importance of small firms for purposes of generating employment and innovation. Government has accordingly taken up schemes to provide funding, technical assistance, reserving business segments for small business, and attempting to create networks between large and small sector as done in Japan (Kang,1989:36).
“For improving the managing techniques in the field of small and medium industries, the Ministry of Commerce and Industry publishes major management indicators and gives technical and managerial guidance to selected modern firms. For ensuring quality control, the Ministry of Industry provides subsidies to cooperatives for establishing modern testing facilities. In addition, the Ministry is studying the policy of intensive promotion of prospective industries, establishment of credit facilities and other necessary measures to support small industries” (Vepa,1967:186).
79
CHAPTER SIX
AN OVERVIEW OF EXPORTS FROM INDIA SINCE 1947
“India has trade links with practically all the countries of the world. Exports cover over 7,500 commodities to about 180 countries while imports from about 135 countries account for over 6,800 commodities. From April, 1987 onwards, India adopted Customs Cooperation Council's Harmonised Commodity Description and Coding System for its trade classification with suitable extension to meet domestic needs by which it is now possible to record trade information at much more disaggregated commodity levels.(From India 1991, Chapter 21 (Commerce), p.671)
6.1 A BRIEF PICTURE OF INDIA'S EXPORT PERFORMANCE SINCE INDEPENDENCE
India became independent on the 14th of August, 1947. The share of India in the total world exports declined from 2.5 per cent in 1948 to 2.1 per cent in 1951 (at the start of the socialist planning process), to 1.5 per cent in 1955 (at the end of the First Five Year Plan), to 1.2 per cent in 1961 (at the end of the Second Five Year Plan) and to 0.9 per cent in 1966 (at the end of the Third Five Year Plan). (Bhagwati,1970:370) This share declined further to 0.65 per cent in 1970 and to 0.42 per cent in 1980. Since 1980 upto 1984-85 India was able to maintain, and even marginally recover, at a level somewhat less than 0.5 per cent (Deepak Nayyar in Lucas, 1988: 219).
In the 1950s, India had been the leading industrial exporter among the developing countries. By the late 1970s, India fell back to the seventh place (Weinmann,1986:85).
Over the first two decades after independence, the policy followed was primarily inward looking, seeking to promote import substitution, and very little emphasis was placed on export promotion. The 1950s therefore experienced a stagnation in export earnings, thus causing India to loose a major share of its world markets. In the 1960s, a distinct improvement took place, with exports registering a growth of slightly above 4 per cent per annum in terms of both value and volume. As we shall see, 1966 marked the watershed in Indian exports. In the 1970s there was a slight improvement as exports showed a growth of over 6 per cent per annum in terms of volume and nearly 16 per cent per annum in terms of value (Lucas,1988:219).
The following table illustrates the above at a glance:
Table 6.1
Export performance of India---------------------------------------------------------------At year A B C Dend ----------------------------------------------------------------1948 2.501950-51 6.06 2.101955 1.501960-61 6.42 1.33 112.3 1.191966 0.901970-71 15.35 2.03 280.7 0.72
80
1974-75 33.28 3.93 777.7 0.501975-76 39.41 4.39 788.1 0.561979-80 58.01 6.70 1475.9 0.451980-81 67.10 8.43 0.421981-82 78.05 8.71 1982-83 88.03 9.411983-84 97.70 9.491984-85 117.43 11.07 1985-86 108.94 8.65 0.451986-87 124.51 10.201987-88 157.41 12.281988-89 202.95 15.451989-90 276.81 17.62 ?1990-91 19.30------------------------------------------------------------
Here, the columns are:
A: Total Indian exports in Rs. billionB: Total Indian exports in US $C: Total world exports in US $D: Percentage share of India's exports to world exports
Sources: Desai (1983:137), Table Z.25 of CIER's 1991-92 Industrial Databook
Note: Conversion of total Indian exports from Rupees to dollars has been made in Col. B (from 1980-81 onwards) at approximate exchange rates, taken from Table Z.25 cited above.
Data on exports for 1990-91 is taken from India Today, October 15, 1992:84.
The marginal improvements seen in the export sector over the 1970s and 1980s could not wipe out the drastic loss in world export share that India suffered in the 1950s and 1960s, as reflected in the overall position of India in world exports which was 0.6% in 1971, but declined in 1980 to 0.4% and picked up to only 0.5% in 1985. (CIER's Industrial Databook, 1991-92: Table Z.13).
India's exports amounted to 5.47% of GNP in 1980-81. Thakur (1991:177) has shown that the percentage ratio of exports to GNP sharply reduced from 10 to 11 per cent before 1950 to as low as 3 to 5 per cent from the period from the Second Plan onwards.
We have not felt it necessary to take a look at the growth rates of exports over various years, since these have fluctuated, and we are interested in this paper only in the holistic picture of the export performance of India, rather than its detail. However, a major-commodity-wise breakup of exports from India, in the form of a table from Lucas (1988:246) is given in the Table 1 in the Annexure to this chapter.
This is the essential story of India's export performance since independence. While world trade has expanded phenomenally after the World War II, India's share of this ever-increasing pie was declining.
Not all developing countries suffered a similar decline in these 40 years. In fact most of them have performed rather impressively during this period. The Table 2 in the Annexure to this
81
chapter illustrates this. It considers the export performance since 1970 of various countries including Argentina, Brazil, China, Hong Kong, Malaysia, Mexico and South Korea. It can be seen that in 1970 India's exports of approximately $2 billion were only slightly lower than the exports of Brazil, China and Hong Kong but significantly higher than the exports of others. But by the mid-1980s, apart from Argentina whose export performance was roughly at par with that of India, the other countries had shown superior results.
The following table illustrates some major comparative data on export performance of India in comparison with some other countries:
Table 6.2GDP and exports of a few countries
----------------------------------------------------------------------Year/s Korea India China Japan----------------------------------------------------------------------
A. Value of exports (in US$ billion):
1990 64.84 17.97 62.09 286.77
B. Exports as a percentage of GDP:
1965 9% 4% 4% 11%1990 32% 8% 18% 11%
C. Growth rate of exports:
1965-1980 27.2% 3% 4.8% 11.4%1980-1990 12.8% 6.5% 11.0% 4.2% -----------------------------------------------------------------------
Source: World Development Report,1992 (Oxford Univ.Press)
We see that India stands out as the country with consistently poor performance in the export sector when compared with other countries.
Given below are two tables which give details of the export performance and the growth in GDP of the above four countries.
Table 6.3
Export performance of four countries---------------------------------------------Year Exports (US$: millions) India Korea Japan China--------------------------------------------- 1938 614 249 1109 170 1948 1387 19 258 104 1958 1222 17 2877 1960 1963 1626 87 5452 1967 1613 320 10442 1968 1761 455 12972 1969 1835 623 15990
82
1970 2026 835 19319 2260 1971 2034 1068 24019 1972 2415 1624 28591 1973 2935 3225 36926 5820 1974 3906 4460 55536 1975 4355 5081 55840 7260 1979 7850 15055 103045 13659 1980 8378 17505 129812 18270 1981 8373 21254 152016 22007 1982 8807 21853 138911 21913 1983 8713 24445 146668 22150 1984 9874 29245 170107 24871 1985 8750 30283 175683 27343 1986 9187 34714 209153 31064 1987 11596 47281 229224 39542 1988 13182 60696 264915 47650----------------------------------------------Source: Statistical Year Books, 1975 and 1987, of the United Nations, New York, published in 1976 and 1990 respectively.
Table 6.4
Gross Domestic Product of four countries---------------------------------------------Year |GDP |India Korea Japan China |b.rupees t.won t.yen b.yuan
| Renminbi ---------|------------------------------------ 1960 | 0.23 14.13 1963 | 185.40 0.46 21.78 1967 | 305.90 1.19 37.80 1968 | 315.90 1.50 44.79 1969 | 350.30 1.95 51.83 1970 | 381.50 2.43 61.45 1971 | 406.70 2.96 69.37 1972 | 441.70 3.58 79.65 1973 | 4.52 96.90 1974 | 6.18 113.86 1975 | 787.61 10.22 148.33 250.3 1979 | 1980 | 1358.12 37.92 240.18 368.8 1981 | 1594.20 47.02 257.36 394.0 1982 | 1775.88 52.91 269.63 426.1 1983 | 2066.81 61.00 280.26 473.0 1984 | 2305.91 68.87 297.95 565.0 1985 | 2625.91 75.51 316.30 703.1 1986 | 2934.08 86.65 330.03 788.7 1987 | 3304.64 99.79 343.24 932.1-------------------------------------------------Source: Statistical Year Books, 1975 and 1987, of the United Nations, New York, published in 1976 and 1990 respectively (Note: b=billion; t=trillion)
83
Unfortunately, it is difficult, given the above information, to make a comparison in the growth rates of GDP between countries and to co-relate these figures with those of exports. But it is clear that India did not follow the export-driven growth strategy, and ultimately has lagged behind very badly in this field of economic development.
It is also worthwhile reproducing a small table taken from India Today which shows the relative position of India's exports compared with other countries today (presumably as of 1991, since the exact date is not given). We observe that India fares rather poorly even in relation to small countries such as Malaysia and Indonesia.
Table 6.5Some export figures
--------------------------------------------Country Exports (in US $ billion)--------------------------------------------China 71.9Malaysia 34.7Brazil 31.4Indonesia 29.4Thailand 28.1India 19.3--------------------------------------------
Source: World Bank Statistics, as quoted in India Today, October 15, 1992:84.
It is thus relevant to analyse the causes of this poor export performance of India. Was it due to the export policy of India, or was it due to circumstances beyond the control of India?
6.2 FACTORS DETERMINING EXPORTS FROM INDIA SINCE INDEPENDENCE
Exports are influenced by both the industry and trade policies of a country. The monetary policy which determines the exchange rates makes for the attractiveness or otherwise of exports. The industrial policies, including the exit policies (for enabling closure of industries which are not viable), influence the level of technology used and the use of factors, which lead to the consequent advantages or disadvantages in price and quality terms. And general export promotion policies influence the attention the industrialists and other producers will give to exports vis-a-vis the domestic trade.
For our purposes here we shall not restrict the discussion to an analysis only of the export promotion or import substitution policies, but shall consider also the monetary and fiscal policies and the industrial and agricultural policies.
6.2.1 Export Policies
6.2.1.1 Import substitution
India has placed a considerable emphasis on import substitution practically from the beginning of its independence in 1947. This was also the case with most other post-colonial countries. As pointed out by Weinmann: “the domestic orientation of India's trade policy ... aimed at making the country virtually independent of trade with industrialised countries” (Weinmann,1986:82). There was an associated “pessimistic neglect of exports during the 1950s”
84
(Lucas,1988:231), which could be best described as a discrimination against exports. High taxes were imposed on traditional Indian exports during this period. “(This) could be responsible for the loss of shares of traditional Indian exports in the world market” (Weinmann,1986:84).
Thus “In India the import substitution strategy has been implemented systematically. National industrial development was protected by relatively high tariffs (up to 450 per cent) and import quotas up to absolute import bans against particular categories of goods. During the late 1960s, effective protection ranged from 40 to 640 per cent” (Weinmann,1986: 85).
Bhagwati and Desai have very critically analysed the planning of the economy of India in the 1950s. While commenting on the famous Professor Mahalanobis, who was given the privilege of formulating the model for India's Second Five Year Plan (1956-61), they say that “Professor Mahalanobis, who was not an economist but a physicist by training, implicitly assumed a closed economy or a situation of stagnant export earnings through inelasticity of export demand” (Bhagwati,1970:368). This led, among other things, to considerable export pessimism in the Indian planning process and the decline in Indian export performance took place between 1956-66, rather than in the first Five Year Plan, when the “modest level of Plan expenditure and the Korean War combined to make export performance satisfactory” (Bhagwati,1970:369). But ultimately, “the domestic policies of the Indian Government, via export controls and quotas, export duties, inflationary pressures, and other policies aimed at promoting domestic consumption, were responsible for inhibiting the expansion of export earnings” (Bhagwati,1970:378). It was not until the mid-1950s that export taxes on jute and cotton textiles were removed (Little,1970 : 266).
These policies had various consequences. Among them, the development of a relatively diversified, capital intensive industrial base in India. But there were adverse consequences too. These policies led to the rise in the relative costs of Indian production, and also the increasing profitability of the home market (as studied by Manmohan Singh in “India's Export Trends” in 1964. Mr Singh is the current Finance Minister of India). Further, import requirements for industrialisation were so substantial that, in spite of increasing development assistance, foreign exchange bottle-necks made expansion of exports a necessity. This led ultimately to a re-thinking on the subject.
6.2.1.2 Export promotion
a) 1950s:
The initial inward-lookingness of the 1950s was finally modified to some extent in the late 1950s. This was attempted through an administrative mechanism “which introduced increasingly comprehensive and complicated promotion measures... Instead of stimulating exports, the constant change and consequent uncertainty created by the complex export promotion mechanism hindered the development of a long-term export orientation policy for the Indian enterprises” (Weinmann, 1986 :82). A consequence was that entrepreneurs began to engage in trade and attempt for windfall profits based on exploiting administrative lacunae rather than engaging in the export business. “The industry's lack of competitive ability, mainly due to frequent input bottle-necks or defects in domestic technologies, could not be compensated by the bureaucratic promotion measures for exports.... Some instruments of promotion might have even damaged the capacity of Indian export products to compete on an international level. Export obligations that force enterprises to export before they are able to cope with international standards of quality and delivery reliability are particularly to blame” (Weinmann,1986:83).
85
b) 1960s
Towards the early-1960s, there dawned a realisation that these ad hoc policies were doing great harm to the Indian economy. Finally, towards the end of the Third Five Year Plan period (mid-1960s), some systematic subsidisation of exports started. Bhagwati and Desai (1970:467) contend that “while the Third Plan witnessed a major shift towards export subsidization, export promotion policies were inefficiently designed and implemented.”
c) 1966: the watershed
According to Bhagwati et al these policies did ultimately change significantly in the direction of greater efficiency with the devaluation of the rupee from Rs.4.76 per dollar to Rs.7.50, i.e., by 36%, in June, 1966. This was accompanied by a significant reduction in import duties, the elimination of the import entitlement schemes, and the removal of the lucrative export subsidies. Unfortunately, some of the export subsidies again came back after various groups lobbied for the same. Further, “export taxes were introduced on tea, jute manufactures, tobacco, coffee, and some other products.” (Little, 1970:267)
It is thus from 1966 that it observers feel that the Indian industry in general and the small scale industries in particular began to look outwards and pay some attention to exports, rather than on trading in scarce raw materials.
d) 1970s:
Major policies for export promotion were designed in 1970s. These policies had a dual set of objectives: one, to provide compensation for the disincentives of the domestic economic policies and two, to provide an incentive for products and market development (Lucas, 1988:225). These measures comprised the following instruments:
1. Duty Drawback System
2. Cash Compensatory Support (CCS)
3. Making export credit available at a concessional rate.
4. Income tax rebates related to export earnings.
5. Replenishment Licences (REP) which allow special entitlements to importable inputs by exporters.
The devaluation and the export promotion policies yielded results when, in 1972-73, for the first time since independence, India achieved a surplus balance of trade. The subsequent oil price hike in 1973 and later in 1979 have again reversed the improving trend, but India has not looked back again to the earlier regime of a totally closed economy (Dutt,1981:633).
Need to further emphasise exports:
The suggestions of Robert E.B.Lucas (Lucas,1988:190) are of relevance for the coming years:
86
“To rely on domestic markets alone to generate demand for industrial goods, and especially for the more labour-intensive industrial goods, is thus not very promising in the current environment. To achieve the kind of industrial growth targeted in the Seventh Five-Year Plan (1985-90), manufactured exports must be taken more seriously than in the past. A common argument in this sphere is that India is such a large country that exports must always be comparatively unimportant, in contrast to some of the often-cited East Asian success stories. But although it is true that for large countries exports will always be a smaller fraction of GDP, this does not deny their importance as a source of demand, for what matters is the potential for increasing demand on the margin and the multiplier effects of such increases. Moreover, the comparatively low ratio of exports to GDP in India is not only a result of being a large country but of the neglect of exports in the past” (Lucas,1988:190).
Further, according to Lucas, “... a policy design based on a simple view of infinite price elasticity of demand for all of India's manufactured exports is also inappropriate. Lucas reports a very wide range of estimated price elasticities of world demand for various manufactured exports from India. In cotton textiles and miscellaneous textile product exports of an infinite elasticity of world demand cannot be rejected, up to the level of present foreign quota limits. Thus, for example, how effective will be the increase which occurred at the end of June 1986 in the cash compensation rate for textile exports depends entirely upon the ability of the mill sector to respond in product lines where quotas are not now binding. But in other spheres world demand is far less responsive to price cuts by Indian exporters, probably because of nonprice competitive elements in world markets, such as delivery time, reliability and quality” (Lucas,1988:191).
6.2.1.3 Import Policy
In the period 1959-60 to 1969-70, except for edible oils, the ratio of imports to domestic production fell sharply out of 22 categories of commodities - especially in chemicals and engineering goods. Imports were effectively diminished: the ratio of imports to GNP reduced from 10.8 to 13.7 per cent before 1950 to between 4.4 and 7.7. per cent during the period from the Second Plan onwards (Thakur,1991:177). This decline was at an exponential trend rate of 3.4 per cent per year from 1961-62 through 1973-74, rendering India an extremely closed economy with imports being only 5 percent of GNP by the end of this period (Lucas,1988:186).
Thus the import policy of India since the 1950s has predominantly been influenced by the policy of conservation of foreign exchange through severe controls on imports. Imports have therefore been allowed only through licences and a rigid system of applications, approvals and clearances.
Bhagwati et al showed at length the various adverse consequences of this import regime of India in the 1950s and 1960s:
“(1) delays; (2) administrative and other expenses; (3) inflexibility; (4) lack of coordination among different agencies; (5) absence of competition;
87
(6) bias towards creation of capacity despite under-utilization; (7) inherent bias in favour, ceteris paribus, of industries with imported as distinct from domestically produced, inputs;
(8) anticipatory and automatic protection afforded to industries regardless of costs; (9) discrimination against exports; and (10) loss of revenue” (Bhagwati,1970:312).
This system of import licences had many adverse consequences for the small industries in India. Bhagwati et al found that “there are great many reasons to conclude that the control system discriminated against the small-scale sector” (Bhagwati,1970:302). It was found in one of the sample investigations carried out by the International Perspective Planning Team (1963) that “large firms received 85 per cent of their one-shift requirements, whereas their smaller rivals received only 33-40 per cent of their one-shift requirements” (Bhagwati,1970:303).
Fundamentally, for the small entrepreneur, one of the most important costs was “the social cost implicit in diverting entrepreneurial interests away from improvements in production and investments towards `getting past controls' as a more efficient method of increasing profits” (Bhagwati,1970:321). Further, often the entrepreneurs were forced to rely on inferior-quality domestically produced inputs which led to consequent inferior outputs which were not competitive in the world markets (Bhagwati,1970:331).
In this connection, the following issues affecting the small industries in particular are worth noting. Bhagwati and Desai cited various studies (Bhagwati,1970:299) which showed that:
1. The system of verifying the import applications by the State Directorates of Industries (who, as we shall see in the next chapter, looked after the development of small-scale industries), was flawed by many weaknesses:
a) “Except for Mysore, no scientific or systematic method is followed in assessing the demand.”
b) Even if scientific methods such as sampling, are followed, there are too many units, with diverse demands, in the small-scale sector, and it is not feasible for any run-of-the-mill department to handle these demands efficiently.
c) The International Perspective Planning Team on Small Industries (1963) found that “(in one of the states) 26 per cent of all allocations went to non-operating or `bogus' firms obviously for resale in the black market” (Bhagwati,1970:299)
2. The case with the Directorate General of Technical Development (DGTD) was not much better with “the same lack of any systematic information with respect to stock position, works in hand, capacity and capacity utilization at both unit and industry levels, (affecting) ... the allocation of total import quotas” (Bhagwati,1970:302).
Thus, the overall industrial performance was adversely affected by such policies, and in particular, the small-industries sector, which, as we shall see in the case of Japan, should have been promoted actively as the spearhead of export growth, was discriminated against by these strategies.
These factors have led the Indian economy having closed itself from the rest of the world for a considerable period, thus losing touch with technological development and breeding a complacent domestic industry and economy, which was unable to rise to levels of efficiency required to compete in the international market. This is best illustrated by the condition of the
88
vehicles market in India. Even today Indian industry produces the same vehicles which were produced by the industrialised world thirty to forty years ago. Weinmann (1986:71) shows how India's import substitution and inward looking policies have hurt it extensively in comparison to Japan.
“The (Indian) car industry was unable to achieve economies of scale comparable to the mass production in the developed world, and the indifference shown towards exports did nothing to encourage modernization of the available range of car types or to lower costs and prices. Compared to Japan, the increasing outdatedness of the Indian automobile industry becomes evident. During the early 1950s, India started off with an automobile industry equal to that of Japan; in the early 1980s, the Japanese produced about 6 million units per year, whereas the Japanese produced about 6 million units per year, whereas the Indian output lagged behind with 100,000 units, of which 30,000 were passenger cars” (Weinmann,1986:71).
But import substitution has definitely not been an unmitigated disaster. It appears that in certain spheres such as production of scooters and trucks, India's import substitution has paid off fairly good dividends. “In 1960 a bilateral agreement without capital participation with the Italian technology donor (Piaggio) was signed. The manufacture of scooters for the large Indian market, protected from international competition, was so successful that Bajaj soon reached a production volume equal to that of the parent company. With the expiry of the bilateral agreement, the Indian firm began to test its competitiveness on the export markets in Asia. The Indian Vespa was so successful that its Italian predecessor was soon outstripped” (Weinmann,1986:77).
“A second example of successful technology assimilation developing up to the capacity for competitive exports is the Tata company's lorry project. In 1954 TELCO (Tata Engineering and Locomotive Company) signed a bilateral financial and technological agreement with Diamler-Benz to manufacture Diesel lorries and buses... A 15-ton truck was developed independently.... TELCO lorries, due to their robustness, simple handling and maintenance, have found buyers in other developing countries including the Middle East oil countries. Since the end of the 1970s, TELCO has been exporting about 10 per cent of its output. TELCO has even started exporting its own technology. At first, an assembly plant for trucks was erected in Malaysia. Further projects in other developing countries and in Saudi Arabia are to follow. ... TELCO has become one of the first multinational enterprises in the Third World” (Weinmann,1986:78).
A possible lesson from this is that import substitution could possibly be successful in those areas where the domestic market is large enough to encourage economies of scale and is also where certain large companies, using the best management and technology, strive actively for innovation and R & D.
It is not as if the planners have been unaware of the above limitations. To overcome the adverse consequences of import substitution, some kind of import liberalisation has been taking place over the years, particularly since the late 70s.
“increased exports, remittances and other invisible earnings began to swell the foreign exchange reserves and import restrictions began to be relaxed. At first, import liberalisation was tentative, but after 1978-79 with the expansion of open general licensing and the second oil price shock, the import bill grew rapidly. This was chiefly comprised of oil imports, but after 1980-81, oil imports fell
89
both in nominal and real terms and this has allowed a decline in the aggregate propensity to import to 8.4 per cent of GPP by 1984-85, although other components of the import bill have increased rapidly as quota limitations have been relaxed” (Lucas,1988:186).
“Unfortunately, both these phases of import liberalisation did not do much to accelerate industrial growth. It was only when the import liberalisation was accompanied by partial relaxation in industrial licensing that industrial growth picked up” (Lucas, 1988:187).
The recent liberalisation has been a step in the direction to open up the Indian economy to some extent. But there is still a long way to go before the sheltered domestic industry is able to find itself able to diversify and compete with the rest of the world. We discuss this liberalisation in some detail in chapter six.
6.2.1.4 Neglect of Comparative Advantage
As per the neoclassical theory of trade (quote Porter) it is felt that the export policies of a country should be based primarily on the comparative advantage that nation enjoys with reference to its costs of production. But there is evidence to show that India, instead of exploiting its natural advantage in many spheres, changed the policies to encourage industrial growth by subsidising capital imports to the detriment of raw material imports wherever required, and thus allowed its advantage in industries such as textiles, to be frittered away.
This had its most pronounced influence in the 1950s. In the 1960s also, whereas some attention was given to exports from the non-traditional sector, there was a considerable neglect of the traditional exports and other promising new exports (Lucas,1988:232).
According to this view India's development strategy, at least until 1974-75, involved across-the-board import substitution in virtually all spheres of manufacturing regardless of comparative cost advantage. Further, the import liberalisation and industrial delicensing of the mid-1980s have remained, according to Lucas (1988:187), “quite selective in scope and there seems little evidence that this selectivity is being designed to encourage labour-intensive activities specifically or to reflect comparative cost advantage more generally” (Lucas,1988,186). In other words there is till today a rather poor perception in the Indian policy makers of the need to identify the areas of comparative cost advantage and to promote these rapidly.
In a way therefore, “India is ignoring the phase of concentration on labour-intensive industrial goods exports, in which the developing countries have comparative advantage over industrial countries” (Weinmann,1986:89) .
This brings us to a peculiar feature of Indian exports. In 1982-83, for example, the share of industrial goods in total exports was as high as 43.8 per cent, compared with the share of manufacturing of only 16 per cent in GNP) (Weinmann,1986:87). Further, India seems to have developed a “competitive advantage as a supplier of technology goods of medium complexity” and exported more than 60 per cent of its engineering goods in 1976-77 to developing countries, which are unable to produce these goods themselves, and find the latest technologies from industrial countries too complex or too costly (Weinmann,1986:88). Mr. M.S.Caprihan, Vice-Chairman of EEPC (Engineering Export Promotion Council) of India, in India Today of September 15, 1992 (p.97) has staked a claim that “India is now well poised to enter the 21st century as a leading industrial nation.”
90
Though there has been a neglect of this comparative advantage, there is an alternative view according to which:
“India's industrial development is obstructed by so many administrative, political and infrastructural constraints that the divergence from specialisation efforts advocated by the theory of comparative advantage cannot be taken as the major cause for slow growth. Overcoming these constraints would have a far greater impact on industrial dynamism than any attempts to reallocate resources according to neoclassical specialisation theories.
“With the new round of technological progress (micro-electronics) leading towards automated production in many industries, the discrimination between labour- and capital-intensive industries to identify the respective specialisation advantages of the developing and developed countries is losing significance. If this diagnosis is correct - i.e., specialisation of the developing countries in labour-intensive industries alone cannot guarantee lasting comparative advantages because these are undermined by technological development in industrial countries - the question would no longer be whether the developing countries should specialise in labour- or capital-intensive industry but on how a process of industrialisation can be brought about to create the technological prerequisites necessary for a high transformation capacity of the economy and link it with the technological progress in industrial countries. The concept of a country's capacity to transform, i.e., its ability to adjust to new competitive conditions based on technological developments and compete in a rapidly changing world economy, has been elaborated by Kindleberger. Not static comparative advantages but the ability to achieve continually new positions of competitive advantage will carry weight in the long term. The latest technological developments in industrial countries reveal the risks of an exclusive specialisation in labour-intensive industries. Future export possibilities for developing countries are bound to decrease in these areas.
“Within the frame of these circumstances India's industrialisation strategy appears in a more favourable light than when it is judged by the orthodox theory of foreign trade” (Weinmann,1986: 91).
It is not easy to reconcile the two views on India's use of its comparative advantage. We seek to reconcile these views at a later stage by looking into the Japanese system of selection of strategic industries, and the possibility of adoption of such a system in India.
6.2.2 The influence of industrial policy on export growth
The following statement from Bhagwati et al (1970:500) is extremely relevant even today, though it was written way back in 1970:
“India's experience has also a direct bearing on the strategy of development which consists in the generation of booming industrial investments by cutting off imports and offering sheltered markets indiscriminately... Offered as a prescription, such an approach negates the very meaning of planning and leads to an indiscriminate of planning and leads to an indiscriminate growth of industries regardless of costs. And, once these industries have taken root, it is extremely difficult to revert to efficient policies. You cannot have `growth' first and `efficiency' next' the two processes have to go hand in hand... The nature and results of Indian experience ... ought to disabuse economists and policy-makers
91
of the attractiveness of such simplistic solutions to development: there are no short-cuts to sustained and efficient growth.”
India pursued a very restricted industrial policy for a long time. The major components of this policy which had an adverse influence on exports were the following:
a) A conscious effort to expand the public sector. This sector was a largely inward looking sector, with administered prices tending to distort the functioning of the market system. Prices of most of the raw materials such as steel, coal, and fuel became exorbitant in comparison to the world free prices, since these goods were controlled by the government. Ultimately, most of the industries could not overcome this price disadvantage and the exportabilty of their products declined considerably.
b) Licensing. This was intended to limit the growth of monopolies, to effect dispersal of industries to the various backward regions of the country, and to bring the growth of various industries in keeping with the overall “Plans” of the country. Unfortunately, the loopholes in this system were exploited and led to the pronounced increase in corruption. Further, in the fast moving sphere of industrial development, the focus on details of quantum of production and on prices diverted attention from the more pressing problems of overall development of technology and skills for industrial growth and consequent promotion. These policies also prevented the achievement of the economies of scale in the concerned sectors, thus pricing the manufactured goods out of the export market.
c) Curbs to prevent monopolies. Some of these Curbs were extremely counter-productive, such as the ones on reservation of certain sectors of production in the small-scale and even village sector. No doubt these were well-intended since they were meant to protect the poorer sections who lived in villages and who had little access to capital. But two negative aspects led to these Curbs becoming counter-productive: firstly, the Curbs bred corruption, and devious methods of the big industrialists entering into the small sector through “benami” dealings; and secondly, it was forgotten that whereas India may try to provide some rather expensive protection to the small producer at the expense of efficiency, yet the world as a whole did not provide such subsidies, and ultimately the costs of production by the small producer of such goods which were reserved for them, became higher than what could be exported.
d) Inspector-Raj system: This was a most negative aspect of the industrial policy system. Most industries were burdened with various kinds of legislation, almost each of them having its own set of inspectors and a large bureaucracy. The industrialist had thus to incur high costs in maintaining his survival and the status quo and could not focus on the positive issues of development and technology. Essentially, all this arose from the socialistic mode of thinking, under which mode, all industrial activity was equated with capitalism and all agricultural activity with socialism, forgetting that there are a large group of essential industrial activities just as there is a group of agricultural activities which are not necessarily to the benefit of the nation.
Recently, in 1991, there has been a major liberalisation of the Indian industrial policies, but the trade policies have not yet been equally liberalised. It is however, extremely important that liberalisation of one of these policies cannot take place without at the same time liberalising the other (Lucas, 1988:188).
92
6.2.3 External constraints
According to Deepak Nayyar (Lucas,1988:232), research seems to have established fairly conclusively that external constraints have by and large not constrained the growth of India's exports. On the contrary, the analysis of Nayyar has shown that “external factors had a very favourable impact on export performance during the period 1970-71 to 1970-78.
At the same time, it is being felt that from the 1980s, ceilings on exports have been placed by foreign countries, such as the MFA (Multi Fibre Agreement), which places restrictions on the export of clothing. Apart from the usual tariff barriers, even non-tariff barriers have played a role in preventing India's exports, such as the constraints placed by the concerned countries on marine exports to the USA, oil cakes to the EEC and meat to the Middle East.(Lucas. :233). The increasing pressures of external competition and restrictions will be felt in the coming years, as foreign importers demand generous credit terms and price discounts, with the global slow-down in growth.
6.2.4 Other factors
a) The fiscal policies have contributed considerably in outpricing Indian goods out of the international markets. The excise and other tax rates are very high.
b) High domestic demand. This has had a particularly important effect on agricultural exports.
c) Poor quality of marketing: The quality of marketing has a major influence on exports from a country. India, apart from having poor quality of products, has also had a rather poor quality of marketing, thus leading to poor performance of exports.
d) Poor productivity: Low labour and capital productivity has led to higher prices and thus goods produced, even if these are of acceptable exportable quality, are priced out of the market.
e) Poor management: A widespread malaise is the generally poor quality of management. This influences all aspects of production, including quality of products, timeliness of supply, technological change, and proper marketing strategies.
93
CHAPTER SEVEN
ANALYSIS OF THE EXPORT PERFORMANCE OF THE INDIAN SMALL-SCALE INDUSTRY SECTOR
“The Small Scale Industrial Sector has emerged as a dynamic and vibrant sector of the economy during the eighties. At the end of the Seventh plan period, it accounted for nearly 35 per cent of the gross value of output in the manufacturing sector and nearly 40 per cent of the total exports from the country. It also provided employment opportunities to around 12 million people” (India's New Economic Policies,1992: 2).
As we shall see from the table below, this data refers to the entire village and small-scale industry sector, and not to the modern or SIDO SSI sector alone. The SSI sector alone produces about 30% of the total exports from India. Nevertheless, in the overall context of India's exports, this is a creditable performance, with the large manufacturing sector performing very poorly. Most of the balance 60% of India's exports are constituted of primary produce in agriculture and minerals, such as cashew, tea, coffee, spices, rice, oil cakes, iron ore, etc. (India 91:675).
7.1 STATISTICS OF SMALL-INDUSTRY EXPORTS FROM INDIA
The exercise of breaking down the export figures into the respective small-industry component is an extensive exercise carried out in India by the SIDO which compiles information from the various Export Promotion Councils, the Marine Products Export Development Agency, the Agricultural and Processed Foods Export Development Agency, the Tobacco Board and the Spices Board, as well as information from the Commerce Ministry.
Data upto the year 1989-90 was available with the SIDO till September, 1992, and the later figures were still being compiled. Hence, the information furnished in this chapter is up-to-date till 1989-90.
Table 7.1
The export performance of the modern small scale sector of India
---------------------------------------------------------------------At year A B C D E Fend * **---------------------------------------------------------------------1950-51 6.061960-61 6.421970-71 15.351972-73 3.05 19.70 15.51973-74 3.93 25.23 15.61974-75 5.41 33.28 16.41975-76 6.29 39.41 16.01976-77 8.78 51.42 17.11979-80 12.26 22.80 58.01 39.301980-81 16.43 2.06 67.10 24.48 1981-82 20.71 2.31 78.05 26.531982-83 20.97 2.24 88.03 23.821983-84 21.59 2.09 97.70 22.09 1984-85 25.80 2.43 45.57 117.43 21.97 38.80
94
1985-86 27.69 2.19 52.08 108.94 25.41 47.801986-87 36.48 2.99 56.27 124.51 29.29 45.191987-88 43.73 3.41 61.89 157.41 27.78 39.311988-89 54.90 4.18 74.44 202.95 27.05 36.671989-90 76.26 4.85 276.81 27.55------------------------------------------------------------------------
A: Exports (Rs. billion) of modern SSIB: A in billion US $C: Exports (Rs.billion) including handlooms,
sericulture, handicrafts and coirD: India's total exports (Rs. billion)E: SSI exports as a percentage of total exportsF: VSI exports as a percentage of total exports
(Source: the data above has been extracted from tables B.14 and Z.13 in the CIER's Industrial Databook 1991-92, from Table 21.1, p.671, India 1991, published by Government of India, and Table IV received from SIDO in October, 1992. Some data was also extracted from Desai, 1983:315)
* Though not a very accurate estimate, column B is derived from the table Z.25 in CIER's Industrial Databook, 1991-92, which gives the rupee values of world currencies from 1980 onwards.
** In column C, figures are not very accurate. As derived from Table B.15 of CIER's Databook, figures for 1986-87 are anticipated figures, for 1987-88 are provisional figures and for 1988-89 are targeted figures. Obviously, there is an error in these figures, else there would not have been a sudden drop in the percentage of total VSI exports to total exports from 47% to 36% in just three years.
7.2 TRENDS EMERGING FROM AVAILABLE DATA
The following points emerge from the above and other associated data. No statistical analysis has been applied on the above data since the complete series was not available. However, qualitative analysis has been carried out.
1. If the US dollar equivalent is taken as a crude estimator of the real growth in exports of the small-scale sector, then we find that in the first half of the 1980s, there was a total stagnation, but it picked up rapidly in the second half.
2. The share of the SSI sector of India in the total export performance has been rising over the past two decades, rising from about 15.5% of total exports in 1972 to 24.48% in 1980 and to 27.55% in 1989. This increase seems to have been at the expense of a) the traditional handicrafts sector, b) the large scale manufacturing sector and c) the traditional primary sector. Desai has mentioned that “More than 1000 different products manufactured by small-scale units are exported to Asian and African countries, the U.S.A., Japan, the U.S.S.R., and the U.K” (Desai, 1983: 137).
As a percentage of their total output, in 1971-72, small scale industries exported 6 per cent of the entire goods they produced (Dutt,1981:536). By collating a limited amount of data, the following table emerges.
Table 7.2
95
Percentage of output exported by the SSI---------------------------------------------At year A B Cend ---------------------------------------------1971-72 6.001973-74 3.93 72.0 5.451979-80 12.26 216.35 5.661984-85 25.80 505.20 5.101985-86 27.69 571.00 4.84
A: Exports (Rs. billion) of modern SSIB: Total output of the modern SSI (Rs. billion)C: Percentage of total output exported
(Source: the data above has been extracted from table B.13 in CIER Databook, and by using data given in Table 7.1)
Thus we see that though the real value of small-sector exports have been rising, exports constitute only a small part of the activities of the small-industry sector, and in fact, the percentage of output exported is continuously declining over the past two decades.
We consider some data on the entire VSI sector in section 7.7.3, which shows a slightly different picture.
3. The percentage share of the traditional industrial goods such as handicrafts appears to have declined in the 1980s. Of course the data on this is not fully reliable, as it includes certain projections.
4. The contribution to exports of the small scale sector seems to have been more positive than the contribution of the large scale sector. This is not borne out clearly from the above table. For this, an attempt was made to look at other data, and it was determined that there was a rapid decline in the world share of exports in cotton woven fabrics (produced primarily in the large industry sector) from 6.8% in 1970 to 5.3% in 1980, and 3.4% in 1987. (CIER's Industrial Handbook: Table Z.13). This is an indicator that the relative performance of the large industry sector of India in comparison to the small industry sector, at the world level, is becoming more indifferent. The shelter provided by the domestic economy seems to have contributed primarily to this poor performance by the large scale industry.
It is interesting to note that though the small-industry output has grown at a slower pace than large-industry output (see Chapter three), its contribution to exports has grown at a much higher pace than of large industry.
7.3 MAJOR SMALL-INDUSTRIES FOCUSING ON EXPORTS
The following data gives the breakup of the modern small-industry products which are exported.
Table 7.3
96
Product groups which are exported by modern small-scale industry in India
------------------------------------------------------------ Exports for the years
Product group 1987-88 1988-89 1989-90 G H------------------------------------------------------------Ready-made garments 18.00 20.50 31.25 41.0 52.4Finished leather prodt 8.98 11.85 15.06 19.7 27.1Basic chemicals,pharma 3.31 6.81 11.76 15.4 72.7Engineering goods 3.15 4.00 6.18 8.1 54.5Cashew liquid 2.38 2.46 3.16 4.1 28.4Processed foods 2.10 2.63 3.09 4.0 17.4Marine products 3.07 3.44 2.07 2.7 -40.0Chemicals and allied 0.60 0.84 0.97 1.3 15.3Woollen garments 0.60 0.70 0.86 1.1 24.1Sports goods 0.31 0.38 0.55 0.7 43.9Plastic products 0.17 0.39 0.48 0.6 24.2Processed tobacco 0.15 0.12 0.20 0.3 70.0Spice oils 0.13 0.16 0.19 0.2 18.6Semi-finished leather 0.58 0.36 0.17 0.2 -53.2Lac 0.15 0.17 0.16 0.2 -5.5Rayons synthetics 0.06 0.09 0.12 0.2 30.3------------------------------------------------------------Total SSI exports 43.73 54.90 76.26 100.0 38.9------------------------------------------------------------
Source: SIDO, 1992Columns:
G: Percentage share of product in total SSI exports.H: Growth rate over previous year in nominal terms.
We see therefore that under the current product mix, four products account for 84.2 per cent of SSI exports. These products are: readymade garments, finished leather and leather products, basic chemicals and pharmaceuticals, and engineering goods. This product mix has remained broadly similar over the past two decades, as deduced from the data given by Desai (1983:315).
If we look at some figures of exports from certain industries which are predominantly small-scale, the growth becomes more clear:
7.3.1 Readymade garments
The exports of cotton apparel were worth Rs.45 million in 1965-66. Consequent to the devaluation of the rupee, these increased to Rs.300 million in 1972-73, to Rs.970 million in 1974-75, Rs.1.45 billion in 1975-76, and Rs.2.57 billion in 1976-77 (Dutt,1981: 638). Figures for recent years are in the table above.
The size of readymade garment exports from India has only a few years ago overtaken the handicrafts exports from India. Further, the share in world exports of apparels and clothing accessories increased from almost nil share in 1970 to 1.8% in 1980 and 2.6% in 1987 (CIER's Industrial Databook, 1991-92: Table Z.13). Thus, the continuing growth of the ready-made garment sector is conclusive proof that the comparative advantage of
97
India in labour is being increasingly being put to use. Unfortunately, all this growth has taken place in spite of inadequate government promotional policies. India exports primarily the lower range of ready-made garments, not the well-designed and expensive ones. Thus the per-unit profitability in readymades is very low. Had there been emphasis on proper training of manpower and use of only computerised sewing machines, rather than the mix of manual and computerised machines which is in place today, India would surely have done even better in this area where its comparative advantage is phenomenal.
7.3.2 Leather manufactures
Exports of leather and leather manufactures increased from Rs.1.19 billion in 1969-70 to Rs.2.15 billion in 1977-78 (Dutt,1981:638). Recent figures are given above. This sector has also grown because of India's comparative advantage of labour. But again, this industry has become highly computerised and mechanised over the past decade, and India has not kept pace with this, except in a few pockets. Further, design training is not adequate to compete with the rapidly changing pattern of international designs.
7.3.3 Handicrafts
Whereas we did not consider it necessary to show data on traditional goods in tabular form, since this area is not the major thrust of the paper, handicrafts still account for a large portion of the village and small industry exports. Recent figures are not available, but were projected to about Rs.30 billion for 1989-90, just slightly lower than ready-made garments exports. This sector has been losing out to other, non-traditional industry and there is no doubt that though this is a labour intensive industry, it would not be able to fuel export growth for much longer. Carpet making is becoming a highly capital industry internationally, and the developed countries are able to produce their own carpets now. Therefore the traditional designs are losing out in terms of market demand. Further, traditional carpets are expensive and not as durable as machine-made carpets. Therefore, if India has to pursue this sector in the long run, it must also mechanise immediately, or this sector will ultimately perish.
It is noteworthy that khadi, the industry promoted by Gandhi, plays no role in export markets.
7.3.4 Engineering goods
“During 1976-77, small-scale industries contributed as much as 58% of the exports of marine products, 90% of woollen hosiery, 74% of agarbatties, 80% of finished leather and manufactures, 52% of plastic products, 92% of cashew kernels and cashewnut shell liquid, 80% of rayon and synthetic products and 20% of engineering goods registered with the Councils. Besides, significant exports are made in the form of parts and components of items assembled and exported by large-scale exporters” (Desai,1983:315).
7.3.5 Shares of small-industry in various industry exports
The industries in which the small-scale sector has been playing plays a major role as a percentage of exported output, are agarbattis, finished leather and leather products, marine products, rayon and synthetics, cashew kernels and cashewnut shell liquid, E.I. tanned hides, processed foods and readymade garments, etc. In these industries the large-scale industry plays an insignificant role.
98
Table II of SIDO (given in the Annexure to this chapter) gives details of the above shares. One would however, shy from considering these to be the only major possible sectors for small-industry growth. There is great importance for Indian small-scale industry to enter the electronics, computer software and hardware, electric consumer goods and such modern industries where innovation is of greatest importance. India will have to be content with a marginal role in international exports unless it expands directly into modern technology based goods. Further, as already mentioned above, India is likely to lose its shares even in sectors such as leather goods unless it mechanises most of its operations to improve quality at the least cost. There is no substitute to technological improvements if Indian small-industry has to participate actively in the global markets.
7.4 MARKETS OF SMALL-INDUSTRY EXPORTS
As much as 63 per cent of the exports from the SSI sector were directed to the USA, the UK, the USSR and Japan (Dutt,1981:536). No more recent data on this aspect could be procured.
7.5 INSTITUTIONAL FRAMEWORK FOR SMALL-INDUSTRY EXPORTS
The government has set up the following institutions to promote and maximise export earnings in general. These include:
(i) Export Promotion Councils and other commodity organisations.
(ii) Service organisations like
- Indian Institute of Foreign Trade, - Trade Development Authority, - Federation of Indian Export Organisations (FIEO), - Small Industries Development Organisation, - Export Credit and Guarantee Corporation,- Export Inspection Council, - Freight Investigation Bureau, - Directorate of Drawback, etc.
(iii) trading-cum-service organisations like - State Trading Corporation, - National Small Industries Corporation, - State Small Industries and Exports Corporations.
Desai feels that there is greater need to co-ordinate the activities of these organisations.
“These organisations can function effectively to help the small entrepreneurs only when there is an apex body at the national level to co-ordinate the activities of their organisations vis-a-vis the small entrepreneurs. The Marketing Division of the Small Industries Development Corporation (SIDO), which has been created to provide guidance to small-scale units in internal marketing, external marketing and market intelligence, should assume the role of their national body. In the course of time, this Division should be developed into an apex organisation to direct the efforts of small exporters. The Marketing Division of SIDO, moreover, should have a strong network at the regional level. Otherwise, at the national level, it may tend to become
99
monolithic and may not fit into the decentralised set-up of the small-scale sector (Desai,1983: 171).
One cannot but agree to such a recommendation, which seeks to provide a strategic approach to the entire export management process for the small-scale sector.
(iv) Export Houses in Private Sector, and Associations like:- Federation of Associations of Small Industries of India (FASII), - All India Manufacturers Organisation (AIMO) (Desai,1983:315).
One must dwell on the export houses a little more. Their growth has been only a recent phenomenon. A recent article in India Today (India Today, September 15,1992:70) has shown that the number of export/trading houses has gone up from 4 in 19981-82 to 172 today. Almost every major domestic corporation has opened its own trading house, with annual turnover touching nearly Rs.5 billion, or about $200 million in some cases. Their strength lies in their ability to tie up both the forward and backward linkages in export, from liaison with international trading houses and getting orders, to accessing domestic producers, often spread all over the country in the small scale sector, and possessing the corporate strength to receive export finance on tap from banks, as well as being managed professionally. In fact, “trading houses bank on small scale units to procure anything between 50 and 80 per cent of total goods traded.”
Unfortunately, it is here that the problem with small-scale sector comes up, in that international trading often requires huge order sizes, and small-scale units, even if quite competitive, are unable to produce such orders at short notice. Perhaps over the course of time, such small units whose products are in greater demand will be able to expand production and grow larger. Thus, the advent of export houses in India's economic scene could be a major cause of the rapid increase in exports from the small-scale sector in real terms which has been observed in the 1980s.
7.6 EXPORT FINANCE AND INSURANCE
The following are the main methods of finance and insurance, etc., available to a small-scale exporter (Desai,1983:317).
7.6.1 Short-term finance
Short-term credit provided for purposes of exports is of two types:
i) Pre-shipment or packing credit. Packing credit refers to any loans to an exporter financing the purchase, processing, manufacturing, or packing of goods meant for export orders. The credit can be given on the strength of either a letter of credit opened in favour of exporter by a buyer abroad or a firm export order.
ii) Post-shipment credit.
Such finance, including for medium term, is provided mainly by the State Bank of India and other banks. The Reserve Bank of India and Industrial Development Bank of India refinance short and medium-term loans respectively.
7.6.2 Guarantees
100
Banks also provide guarantees of various types, e.g., guarantee in lieu of earnest money, export performance guarantee, etc., for the exporters.
7.6.3 E.C.G.C. cover against risks
The Export Credit and Guarantee Corporation provides coverage against default in payment by overseas buyers as well as against other kinds of risks.
7.6.4 Forward exchange cover
There is a scheme being operated by the Reserve Bank of India under which exporters can seek protection against the foreign exchange transaction risk.
7.7 CAUSES OF POOR EXPORT PERFORMANCE OF THE SMALL- INDUSTRY SECTOR
Whereas we have seen that there has been some noticeable increase in the real growth experienced by the small-scale industry exports over the 1980s, yet the performance has been trifling by international comparison. Today, one Japanese company, Toyota, has more money in the bank ($20 billion) than India's total exports. And in spite of the notable performance, India's ready-made garment exports amount to only $1 billion per year at current exchange rates (or maybe $1.5 billion, presuming that there has been rapid growth in this field since 1989-90). Clearly, something has gone wrong. And whereas adequate information is not available here to analyse this issue thoroughly, some tentative issues have been noted. Some of these have already been discussed in Chapter six, but we take a look again at those issues, this time in the context of small industries in this section.
7.7.1 Skewed economy at time of independence
At the time of India's independence, the economy was characteristically skewed, with surpluses in a few industrial sectors, but largely scarcities in most of the others. The consequence was that the incentives formulated by the various Plans were in favour of stabilising and diversifying production to meet the needs of domestic markets, and producing adequate goods of various types to alleviate scarcities.
As we have seen in Chapter 3, there was practically no modern small industry sector, and the village or traditional sector was also declining. The policies formulated were therefore oriented towards the development of these sectors. However, India's emphasis on large industry to the detriment of small industry proved very expensive since the large industry began to become excessively inefficient and uncompetitive in the sheltered environment offered to them, to the extent that today, the large industry sector is in a very miserable position as the gates of the Indian economy are being opened almost by force by IMF conditionalities.
However, the small scale sector is in a relatively better position and could become the source of great industrial growth in the 1990s if properly guided and encouraged.
7.7.2 Inward-looking strategies
i) As we have seen in Chapter 6 there was a positive discouragement of exports in the first two decades after independence, for various reasons. This included prevention of most of foreign industry from establishing a base here, and thus
101
deprived India from having foreign equity capital as well as technology at low cost, which many other countries seem to have adopted gladly.
ii) Then there were the large number of fiscal and other supportive benefits offered for domestic performance, both in the small and in the large sector, which enabled the more efficient of them to make adequate profits within the large national market itself.
iii) The high tariff rates in India and the very high effective protection rates in India have meant that Indian industry has been sheltered from international competition and has increasingly became more flabby and uncompetitive technically. This definitely reflected very adversely in its export performance. Todaro (1989:442) cites figures showing that the effective protection rate (from imports) in Korea was -1% somewhere around 1987, whereas for India the figure was 69%, which is of course lower than Pakistan (356%) and Uruguay (384%).
The Korean economy's performance can be attributed in no small measure to this forced energising of the industry by throwing the country open to competition, or even welcoming competition (as can be seen by the negative protection rate), which has meant that industry very rapidly learnt the tricks of the game and became very viable in the international markets.
7.7.3 Domestic focus of Industry
The primary focus of industry in general and small-industry in particular has consequently been on the domestic markets since independence. This can be seen from the following table, which expands the information already given in Table 7.2:
Table 7.4
Output and exports of VSI------------------------------------------At year A B Cend ------------------------------------------1973-74 5.41# 136.00 3.971979-80 12.26 335.38 3.651984-85 25.80 657.30 3.921985-86 27.69 730.58 3.791986-87 36.48 775.56 4.701987-88 45.35 839.91 5.40------------------------------------------
A: Exports (Rs. billion) of VSI B: Production of VSI in Rs.billion C: Percentage of production exported
# the figure of exports is for 1974-75
Source: extracted from tables B.13 and B.14 in the “CIER's Industrial Databook 1991-92”, published by Centre for Industrial and Economic Research, New Delhi.
102
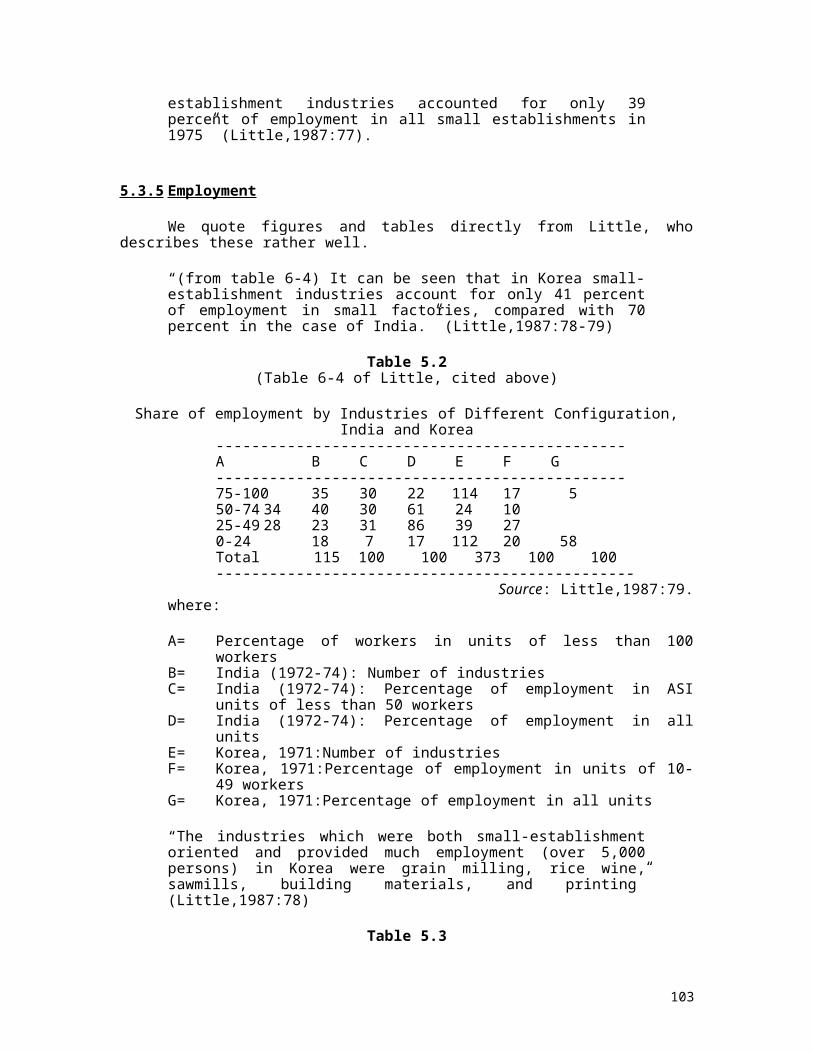
The above data shows clearly that Indian small-scale industries have not till now felt any major need to move into more challenging areas since their basic profitability has all along been met from the domestic sector alone.
7.7.4 Growing domestic middle class markets
The inward-looking character of industry has been further reinforced by the steady growth in marketing opportunities presented by the Indian middle class, specially after the mid-60s. The Indian middle class now numbers over 100 million, and their purchasing power has increased considerably (as cited by Marika Vicziany in IOCPS,1991:13). This market presents great attraction to both the small and large industry.
7.7.5 Pervasive corruption
The economy of controls and licences had effectively strangulated individual enterprise and bred perhaps one of the most corrupt bureaucratic systems in the world. One of the easiest ways to make money in this system is to bribe the officials and ministers, a vast majority of whom have become corruptible. Whereas one viewpoint is that corruption helps to speed things along and is thus acts as “oil” for the economic engine, there is actually no substance in such thinking. The small-industry sector in particularly has suffered seriously from this corruption. Many of the subsidies which are otherwise entitled to them, have been pocketed by the officials disbursing these subsidies. The same holds true of low-interest loans which are given by banks under policy directions to the small industries.
Consequently, when the cost of capital has become so high, many small industries are unable to produce economically for the export sector, and has been forced to dump low-quality goods in the domestic high-price sector.
This is hopefully changing now, with the rapid delicensing and reduction in controls since 1991. As we shall examine in some detail in Chapter Eight, there is need to totally delicence production and to eliminate reservation, which would eliminate most of the causes of corruption.
7.7.6 Reluctance to allow exchange rate to be determined by market forces
One of the important factors that appears to have played a role in the slow growth of exports seems to be the over-pricing of the Indian rupee. No exact figures for this could be traced out, but a look at data furnished by Todaro (1989:439) shows that most of the developing countries which performed badly in the export sector had from 50 to 100 percent degree of overvaluation of the currency compared with countries such as Taiwan, Colombia, etc., which had between 10 to 20% overvaluation only.
This overvaluation of the Indian rupee seems to have been present in the Indian economy in spite of the 1966 devaluation and the later steady decline after the pegging of the Indian rupee to a basket of currencies in .... Consequently, Indian exports were made more difficult, since local wage rates were already high compared with the relative productivity.
The recent two devaluations of the rupee in 1991 have eased the situation considerably and the rupee has dropped by about 23%, thus reducing the overvaluation, though not
103
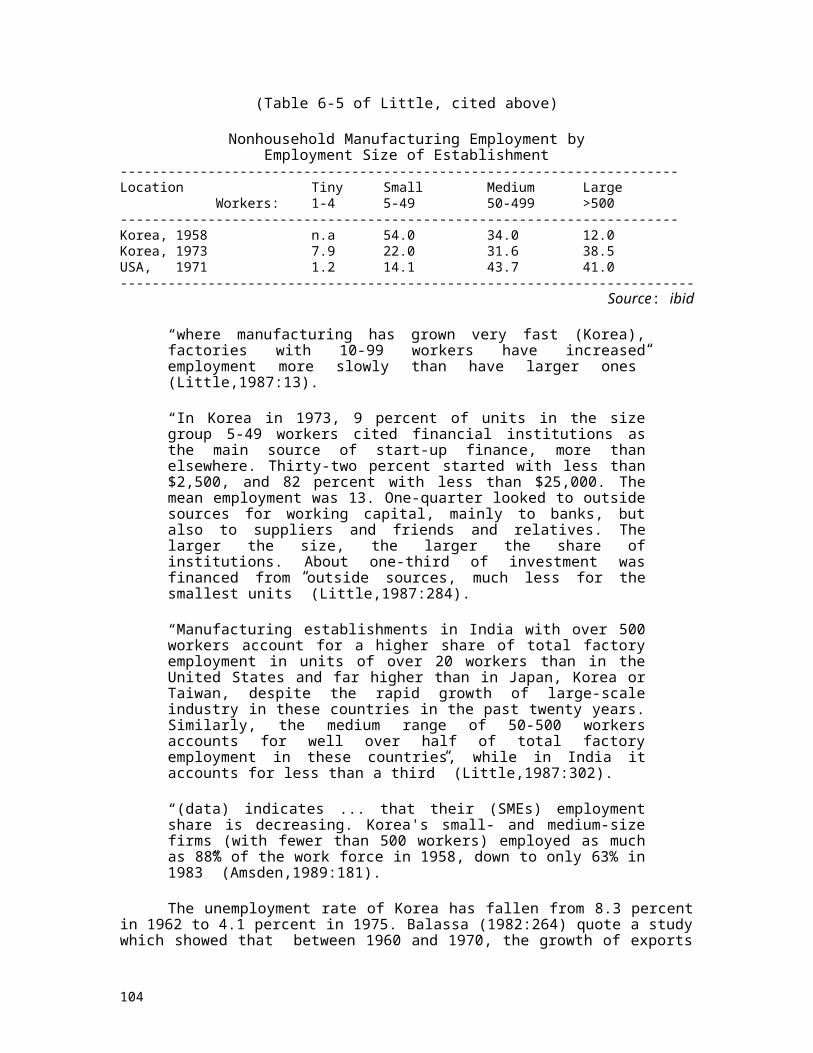
totally eliminating it. This is because there is still a differential of about 15% between the official exchange rate and the rate determined by the foreign exchange dealers.
7.7.7 High cost economy
In many ways, India is a high-cost economy in spite of being a poor country. Most of the inputs are available at much higher cost than what is available to producers in other countries. When inputs prices are high, the output would be obviously higher. This is due to:
i) Inefficiency of the domestic public sector which, instead of reaching “commanding heights” in the economy, has actually “commandeered” the economy to unionised labour markets, poor capacity utilisation and an economy of scarcities of essential raw materials.
ii) High import duties on essential inputs. This has already been touched upon elsewhere.
7.7.8 Difficulties faced by small-scale industries in engaging in exports
Apart from the above exogeneous factors, there are some internal limitations with the small-scale sector in engaging in exports.
7.7.8.1 Lack of knowledge and skills for exports
Desai acknowledges that
“Many a small-scale unit who have the desire to export are unable to do so due to limited resources and possibly due to ignorance in respect of foreign markets, the complex procedures and formalities for securing the various export assistance benefits, credit requirements, packaging, quality standards, shipping and freight, etc. (Desai,1983:170).
Thus, “Small-Scale industries are generally inhibited in undertaking exports due to some of their basic limitations such as lack of adequate resources, inadequate knowledge of export marketing operations, absence of suitable system to maintain enduring contacts with overseas buyers and to disseminate export inquiries and information, lack of common facilities for testing and introducing quality control and standardisation, etc. These handicaps can be overcome if small firms export their products either through recognised export houses or collectively organise their own consortia for exports” (Desai,1983:318).
We have seen above how export houses have stepped into the scene now, and how these limitations of the small-scale industries are on the way to being overcome.
7.7.8.2 Poor quality of production
Desai has mentioned this problem lucidly:
“It is a matter of regret that complaints still continue to come from buyers abroad about the quality of our goods and supplies being made
104
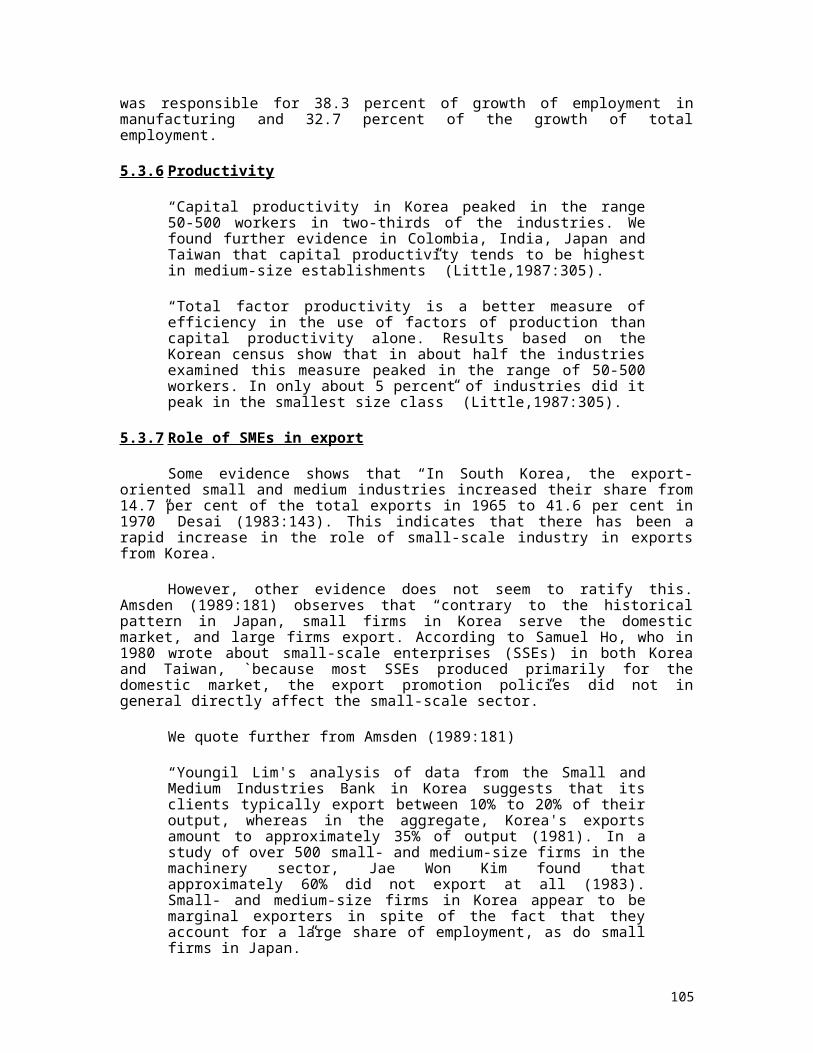
not according to approved samples despite the good work done by the Export Inspection Council. The fault is not of the council but of the absence of selectivity amongst our exporters some of whom consider quality control a mere fad. Unless we ensure a priority for quality and standards in the export trade, complaints will continue to come. Quality control should now be extended to cover packaging as well. Carelessly or shoddily packaged goods are as much a deterrent to our exports as the poor quality of the product itself. What is gained by quality control of the product can well be lost through poor presentation” (Desai,1983:170).
7.8 STEPS TAKEN BY GOVERNMENT TO ASSIST SMALL-SCALE INDUSTRIES IN EXPORTING THEIR GOODS
Whereas one does not have a very recent picture of the steps taken in India to give a major thrust to small-scale exports, the following were some of the things noticed by Desai in 1983.
“With a view to promoting the exports of the small-scale sector, the following steps have been initiated:
i) The existing export promotion councils have been re-organised to give adequate representation to the small-scale sector in the executive bodies, sub-committees and sales-committees of these organisations.
ii) Regional offices of the export promotion councils have separate panels for rendering all types of assistance to SSI units.
iii) Whatever information is provided by the export promotion councils to industrialists is processed by the councils themselves before it is disseminated among small entrepreneurs ... In its report, the Committee on Import and Export Policies and Procedures has suggested the formation of separate panels exclusively for the development of SSI exports in the respective export promotion councils” (Desai,1983:171).
7.9 EFFECTS OF LIBERALISATION OF 1991 ON SMALL SCALE INDUSTRIES
There are signs that the domestic deregulation (India Today: 31st August, 1992) is going to yield fairly dramatic returns, if continued with the same vigour with which these steps have been initiated. By allowing the conversion of 60% of the foreign exchange earned by exporters at market prices, there is now a much greater incentive to the exporters, and this step has simultaneously eased the black market for foreign exchange considerably. Complete convertibility of the foreign exchange earnings at the market price, a policy which was in vogue in Korea even in the early 1960s, would act as a greater incentive to the exporters, and should be aimed for, as early as possible.
There are signs that foreign investment is picking up. The August 15 issue of India News, has pointed out the latest issue of the US Commerce Department's magazine has “urged American investors to increase their investment in India... It warned that if US companies fail to notice changes underway in South Asia, they are at risk of losing out to their competitors.”
105
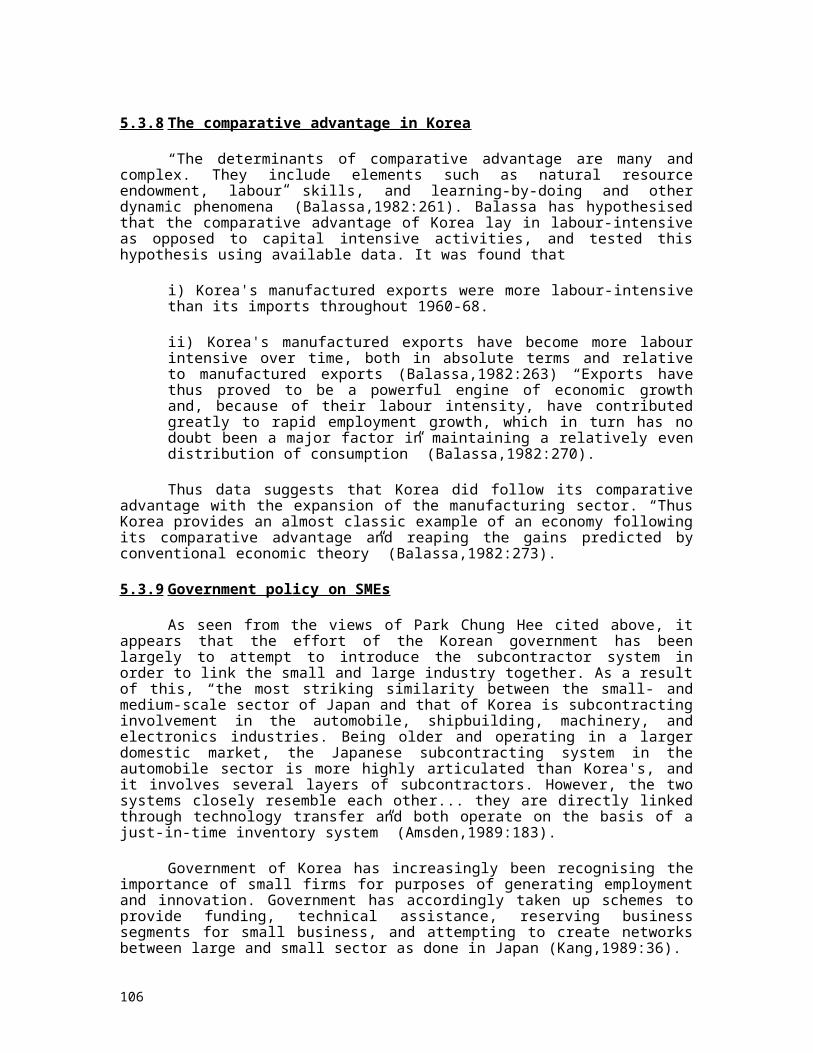
What will be the consequences of these changes on the small-scale sector in India? One can think of the following:
7.9.1 Need to innovate and to improve quality
The increased competition from the entry of international multinational companies would mean that the small-scale sector will have to become increasingly better managed and innovative in order to survive and compete, particularly for the middle-class markets domestically, where the multinationals are likely to flood low-cost consumer products within the next couple of years.
The small-scale sector is of course likely to survive, in spite of the increased competition. This is because of the dynamism and innovativeness which it has exhibited over the past thirty years or so, by performing well both in the domestic and international sectors in spite of the heavy constraints put on industry in general in India.
But the quality consciousness will have to increase to a very high level, since international standards will enter in many areas and people's expectations will rise proportionately. This is an excellent sign. Hopefully, after a few years of turmoil, the small-industry sector will become capable of standing up to competition in its own right, and many of the small units will become much larger, fuelled by export growth.
7.9.2 Specific markets for small-industry
Small industries have generally operated in product areas which are different from those which attract large-scale production. Foreign multinationals are unlikely to enter into the production of small, labour-based items. Thus the vast area of apparel production, leather goods, spices and food processing, etc., appear to be wide open to the small sector to operate in, in spite of the coming in of foreign companies.
7.9.3 Increase in sub-contracting
There is likely to be a major change in the operation of some industrial sectors where small-industry will be displaced by multinational competition. In such sectors its only hope for survival will be to increasingly engage itself in sub-contracting.
This would be a painful process in some cases, involving retrenchment of some of the existing workers, and re-machining of many small industries, to become capable of getting contracts from the large industry.The Government of India (India's New Economic Policies, 1992: 5) states that
“Government recognises the need to widen and deepen complementarity in production programmes of large/ medium and small industrial sectors. Parts, components, sub-assemblies, etc., required by large public/private sector undertakings would be encouraged for production in a techno-economically viable manner through small scale ancillary units. Industry associations would be encouraged to establish sub-contracting exchanges, in addition to strengthening the ones under the SIDO.”
Hopefully the details of this would be worked out in order to adequately meet the requirements of the changed circumstances. The model offered by Japan in sub-contracting appears to be a necessary part of the over-all growth of the small scale sector.
106
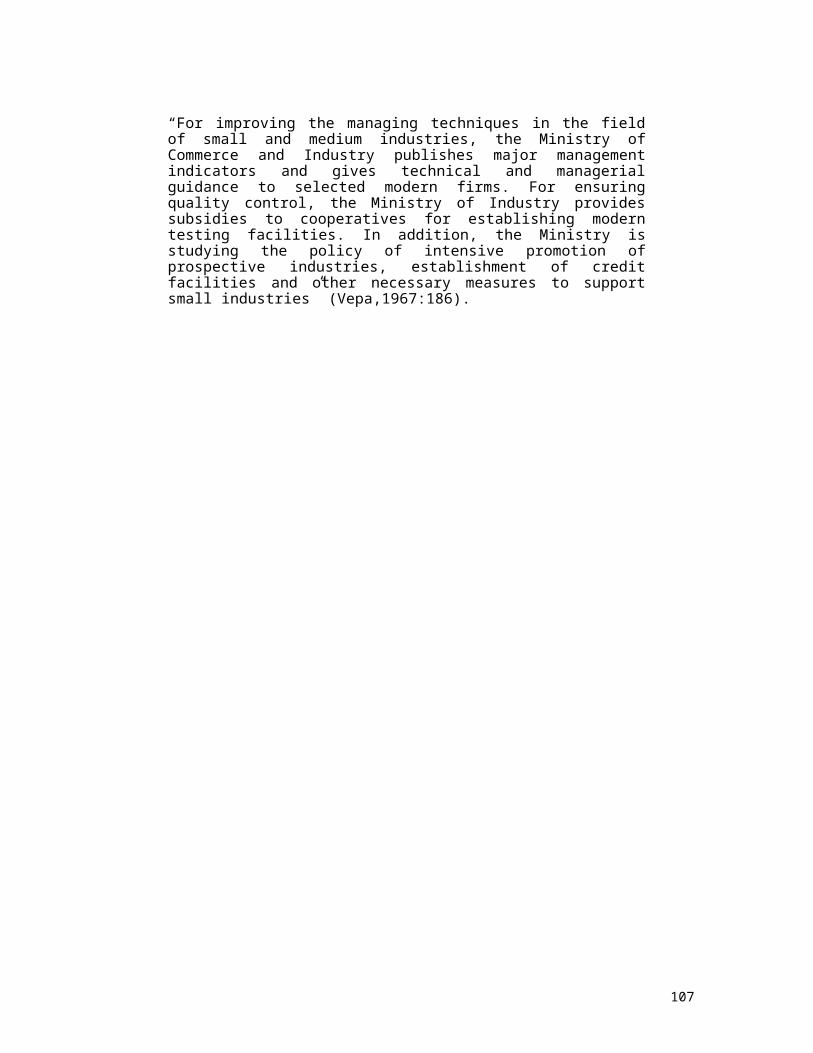
7.9.4 Increase in exports
The latest policy of the Government of India states that “SIDO has been recognised as the nodal agency to support the small scale industries in export promotion. An Export Development Centre would be set up in SIDO to serve the small scale industries through its network of field offices to further augment export activities of this sector” (India's New Economic Policies,1992: 5).
With increased domestic competition, the small industry would have to necessarily branch out internationally on a much larger scale than ever before, where its latent comparative advantage will become its strength.
107
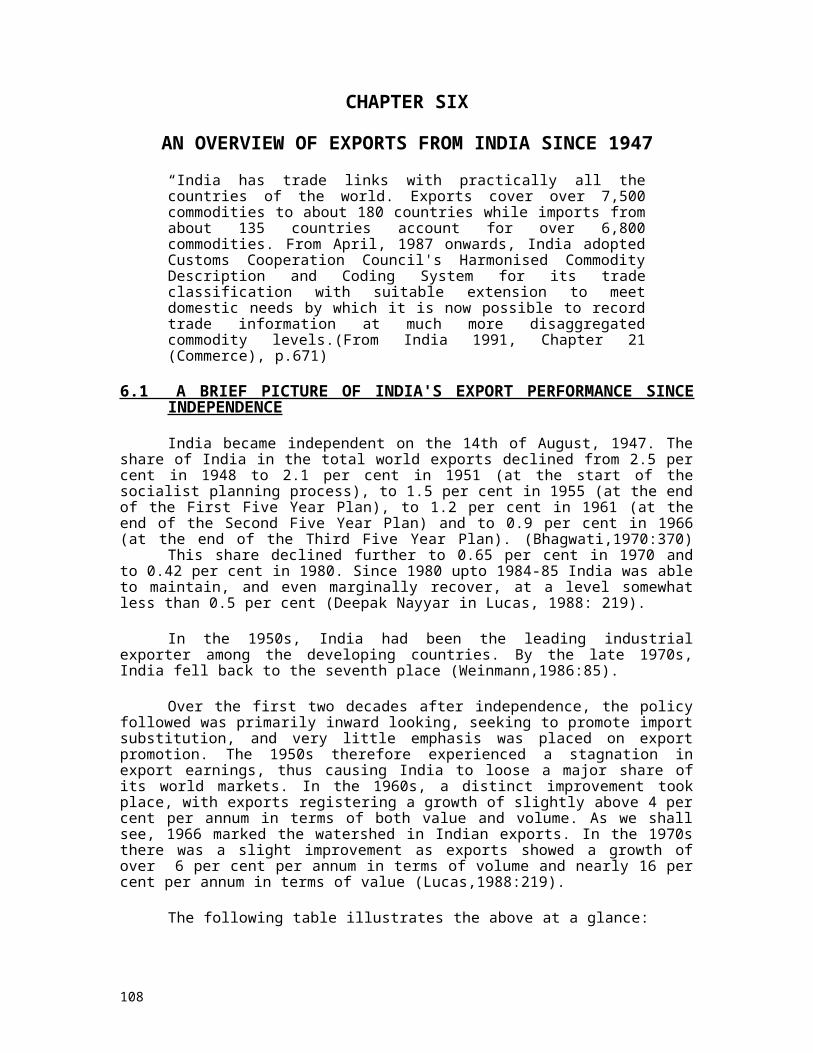
CHAPTER EIGHT
POLICY ISSUES EMERGING FOR INCREASING SMALL-INDUSTRY EXPORTS FROM INDIA
“As there is a choice of ends, so also is there a choice of means. Each society has to work out its own means of achieving whatever it sets as its goals, and it works them out first of all in the light of its own cultural endowment and secondly in the light of the changing international environment, of the changing pattern of opportunities and constraints that the environment presents. There just aren't any single model which can command immediate imitation ... Let me not be thought to say that history is useless. On the contrary, I think that the comparison of different historical patterns can teach us a lot. It can teach us to harbour healthy doubts about the prescriptions which are often ethnic-centricably derived by westerners from the history of the West. And it can also give some idea of the very wide range of alternative possibilities” (Dore:18).
As Dore has aptly shown above, the interest in studying comparative economics is certainly not to derive any one correct “model” for development. When we look at the small-scale industry in India with reference to Japan and Korea, among others, it is not with a desire to replicate the processes and practices followed there, but to understand the economic causalities and thus to introduce the correct mixture of policies which would be suitable to a country.
The objective for the 1990s for the small-scale industry sector in India has been identified by the Government of India as:
“to impart vitality and growth-impetus to the sector to enable it to contribute its mite fully to the economy, particularly in terms of output, employment and exports” (India's New Economic Policies,1992:2).
According the Government of India, “The sector has been substantially dilicensed. Further efforts would be made to deregulate and debureaucratise the sector.” (ibid:2) These objectives are unexceptionable, and the stated method of debureaucratisation is equally in the right direction. Much can be expected to emerge from these sentiments in the next few years.
But it is not clear whether there has been any strategic thinking about the processes required for the actualisation of these objectives. For, without a clear conceptualisation of the processes which will have to be put into place, there is little hope that the declared objectives will remain little more than altruistic intentions without the necessary punch to deliver results.
While the information and analysis of the previous few chapters cannot possibly yield comprehensive for the small-scale sector, certain policy issues seem to emerge either directly or indirectly, as being more important than others, which need to be analysed from a strategic point of view in relation to the internal and international environment.
8.1 RECOGNITION OF NEED OF EXPORT DRIVEN GROWTH
For a long time India had a huge confusion on whether it should be self-reliant or go in for active trade. Hopefully, by now, forty five years after independence, it should be adequately clear to India that there was actually no substitute to export and trade driven growth. The success of most of the South East Asian countries in the past thirty years or so has been fuelled by export growth, as we have seen in Chapter 5. Even China has recognised this and today, its total exports are worth US$ 71.9 billion compared with India's performance of US$ 19.3 billion (India Today,
108
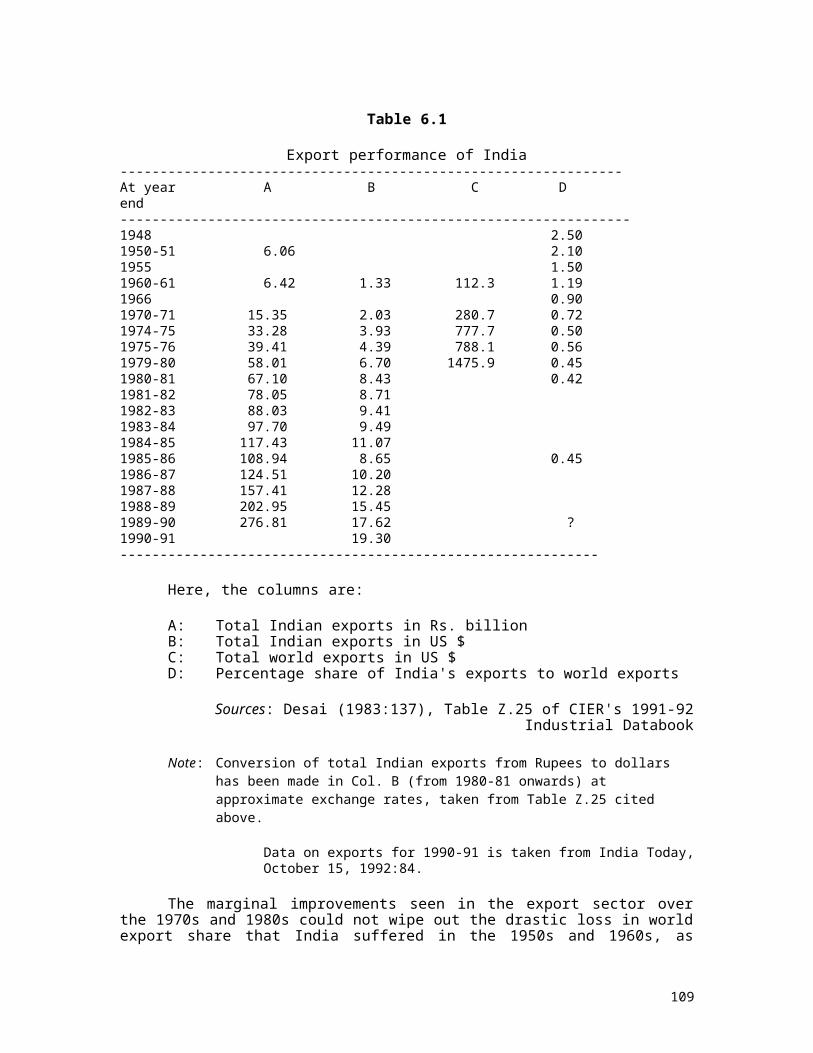
Oct.15, 1992: 84), and consequently, China has less foreign debt than India as well as associated benefits of much higher GDP growth and lower inflation.
Recent evidence has also much to commend this approach. Attri (1991:35) has established that “foreign trade plays an important role in the industrialisation of the country. Export sector happens to be the next important sector, after domestic demand, in the determination of industrial growth.” This is clearly confirmed by According to Biswas (1991:57), who finds that “The econometric result shows that in Indian context, causality runs one way, i.e., export growth causes growth of national income. This lends support to the hypothesis that export can help economic growth of a country.” Of course, he adds, “To the extent that domestic market conditions are neglected by an emphasis on export oriented industrialisation strategy, it involves larger inequality in the distribution of income and growing unemployment.” This negative aspect therefore requires to be addressed by other suitable measures while pursuing the export-driven growth strategy.
There is always some concern expressed at the policy levels about the increasingly competitive and protected world environment and the difficulty that is likely to be faced in India entering as a major player in the game. But there is evidence that India has fared well as determined empirically by Attri (1991:33), who found “that there is sufficient demand for exports of India in the rest of the world, and the growth of our exports is not constrained by the lack of foreign demand for our exported products.” However, he adds, “there is presence of distortion in the various sectors of the economy and especially lack of price-competitiveness of our exports which seems to have affected the export expansion adversely.”
India must thus make it clear at all levels that its primary focus has to be on exports, and not on some illusory inward-looking self-reliance. No one country can hope to survive without sharing its best features with the rest of the world, while at the same time procuring the benefits of the work of the five billion human beings on this planet.
8.2 STRATEGIC THINKING AND ADVANTAGES
One particular feature of India's export policy that comes out is the almost entire lack of strategic thinking. It appears that there is an ad hoc approach, which does not consider the strengths and weaknesses of the economy and its participants. This brings us to the very important issue of competitive advantage.
“Competition is at the core of the success or failure of firms. Competition determines the appropriateness of a firm's activities that can contribute to its performance, such as innovations, a cohesive culture, or good implementation. Competitive strategy is the search for a favourable competitive position in an industry, the fundamental arena in which competition occurs. Competitive strategy aims to establish a profitable and sustainable position against the forces that determine industry competition” (Porter,1985:1).
“Competitive advantage grows fundamentally out of value a firm is able to create for its buyers that exceeds the firm's cost of creating it. Value is what buyers are willing to pay, and superior value stems from offering lower prices than competitors for equivalent benefits or providing unique benefits that more than offset a higher price. There are two basic types of competitive advantage: cost leadership and differentiation” (Porter,1985:3).
It appears that industry in India in general will now have to take a global approach to competition when contemplating building a competitive advantage. What is being sold in the
109
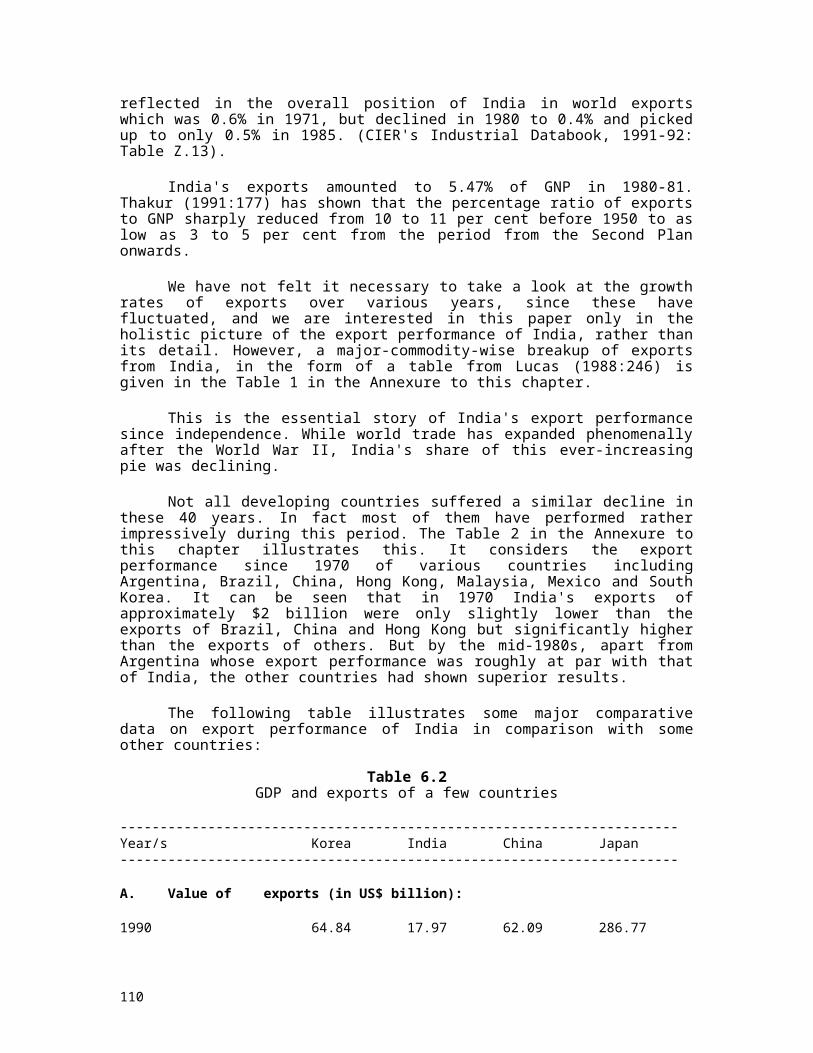
markets in different parts of the world must go into the calculations of the small firms which wish to extend their reach into the export markets. This obviously requires comprehensive information and can also be expensive. But this part of market research and strategic analysis has necessarily to be provided by some nodal organisation for each industry, or otherwise the current unprofessional and ad hoc position will continue indefinitely. Of course, Export Promotion Councils in different industries already exist for this purpose, but these have to be made far more professional and information-driven, apart from being manned by persons from the concerned industry itself, rather than by government bureaucrats, as is often the case at present.
The overall need for India to specialise in a few chosen industries, including in particular for the small-scale sector, cannot be over-emphasised. There is a pressing need to identify strategic industries, particularly as done by Korea, in which India will have to boldly attempt to dominate the world markets within a specified time frame. This strategic thinking will help the policy makers focus on those areas which maximise the comparative advantage of the country. The present dissipation of energies in all directions is neither relevant from the economic point of view nor appropriate in the international context. The private sector has to be involved in working out a consensus in this direction, since it is this sector that will ultimately have to take the burden of taking the bull by the horn and facing international competition in the selected industries.
In identifying strategic areas for export, it would be essential to consider the price responsiveness of world demand:
“The design of an appropriate export program may require a careful consideration of the price responsiveness of both world market demand and of Indian supply in various export categories. In other words, the current policy of identifying “thrust areas” for export targeting and cost reduction could, if well executed, prove much more effective than a simple devaluation in enhancing export earnings. Though, on the other hand, the dangers in designing a “scientific,” highly tuned trade policy package are well-known and the costs of error may be prohibitive (Lucas,1988:191).
On the fact of it, the one area of India's comparative advantage is its huge labour force. But this is very often an undeveloped advantage because most of our labour force is either uneducated or, comparatively ill-educated, and this cannot do much good to anyone. Thus, large-scale training programmes have to be built up for the labour in the selected industries. Whereas the private sector will have to take up the brunt of becoming competitive, the government will be required to spend the optimum time and money in training the labour force for this purpose. There is clearly no substitute to a regular brain-storming and interaction between government and industry, including the small-scale industry associations.
The strategic analysis of comparative advantage will make it clear to the policy makers that it is of utmost significance to do certain things. One of these things is the provision of raw materials cheaply to the small-scale sector, including products such as steel, if necessary by importing the same, to enable it to exercise its advantage of cheap labour and export the finished products. Mellor (1976:130) gives the comparative picture of Taiwan's policies in this connection, which has seen rapid growth of exports due to its liberal import policies.
8.3 RECOGNITION OF THE PIVOTAL ROLE OF SMALL INDUSTRY IN THE ECONOMIC GROWTH STRATEGY OF INDIA
110
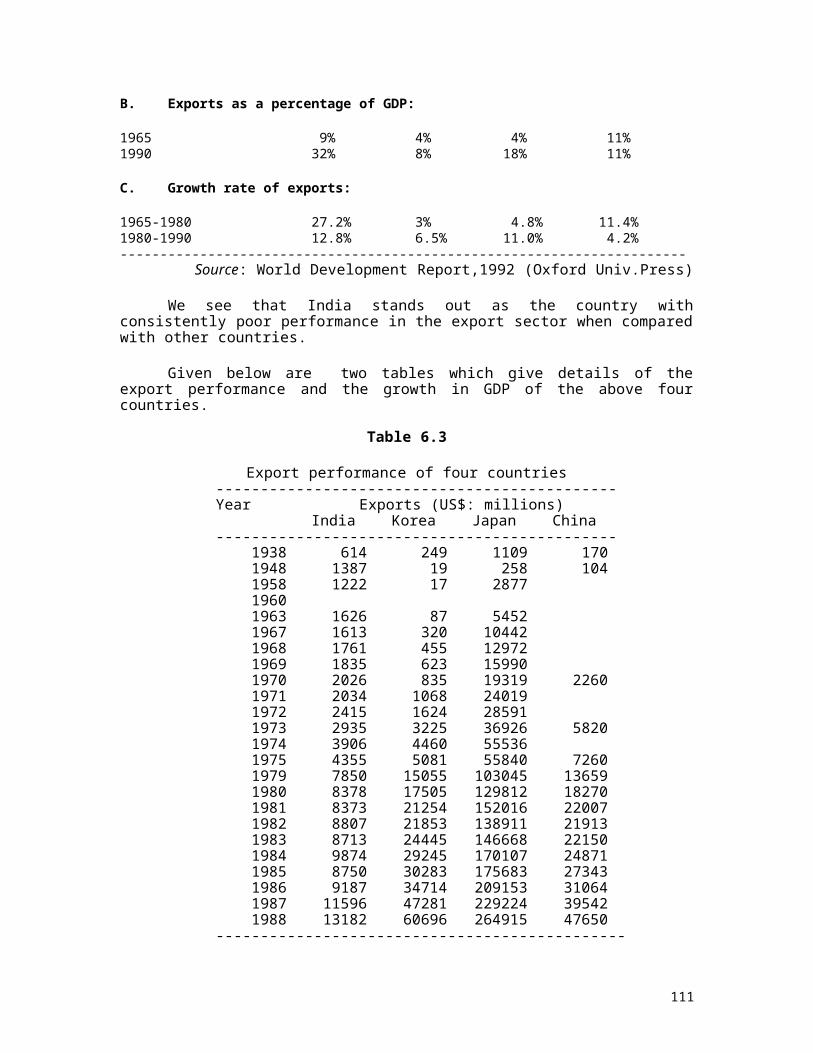
In spite of the improvements in the past few years in the thinking towards small scale industries, one still feels that the government has not yet fully appreciated the importance of the small sector in its growth and export strategies. As Mahajan (1983:210) points out:
“One feels that India has laid a far greater emphasis on the supply side (mainly creating capacities in basic and heavy industries), than on demand (i.e., on the capacity of the economy to absorb the output of these industries). This has also been one of the principal reasons for the under utilisation of capacity in the key industries. This in other words, means that if there had been a proper synthesis between demand and supply functions, through investment balance between consumer and capital goods industries the economy would have made a better use of its resources and also industrial capacities in existence. It was because of an excessive involvement with heavy industries and inadequate attention given to modern small industries, that the Indian economy has been facing an ever rising curve of unemployment all along. ...
Here it is significant to note that demand in the economy can also be created through exports, as we have seen happening in many South-East Asian economies. A great advantage to small industries in the export market is that they will find greater opportunity to produce smaller product runs and customised goods in the export markets, where there is already considerable differentiation. Japan, China, Hong Kong, Singapore and to some extent Korea, have definitely developed in this direction.
Thus the major conclusion that one can arrive after studying the economic growth of various newly industrialised countries is that the small business is fundamental to economic growth and employment. Any further neglect of this sector in India would be at the peril of having ever- mounting unemployment and increasing distance from the rest of the world in economic growth indicators.
8.4 LEGISLATION ON THE RIGHTS OF SMALL-SCALE INDUSTRIES
Many years ago, Vepa (1967:223) pointed out an extremely relevant issue: “Perhaps the most significant feature of the small enterprises field (in Japan) is the number of legislations that have been passed in relation to various aspects of such development. As many as 20 to 25 laws have been enacted besides a host of executive decisions bearing on all aspects of small enterprises...In India, apart from vague references to the need for promotion of small industries in the Constitution of India (1950) and the Industrial Policy Resolutions of 1948 and 1956, there is no comprehensive policy statement of Government's attitude towards the role of small industries in the industrial sector of the country...In Japan ... there are no different sectors which work against each other, the small and large industries form a complementary sector and are inextricably tied to each other.”
We have also discussed Rosen's view in Section 3.7.4, according to which one of the causes of the poor growth of sub-contracting in India is the absence of legislation protecting the small firm.
Unfortunately, in spite of the above suggestion, not much legislation defining the role of the state in relation to small-industry growth has emerged till now. It is essential that the rights of the small-scale entrepreneur are codified and made justiciable. This will build the confidence of many people who are otherwise undecided about entering this sector.
8.5 NEED TO DO AWAY WITH RESERVATIONS
111
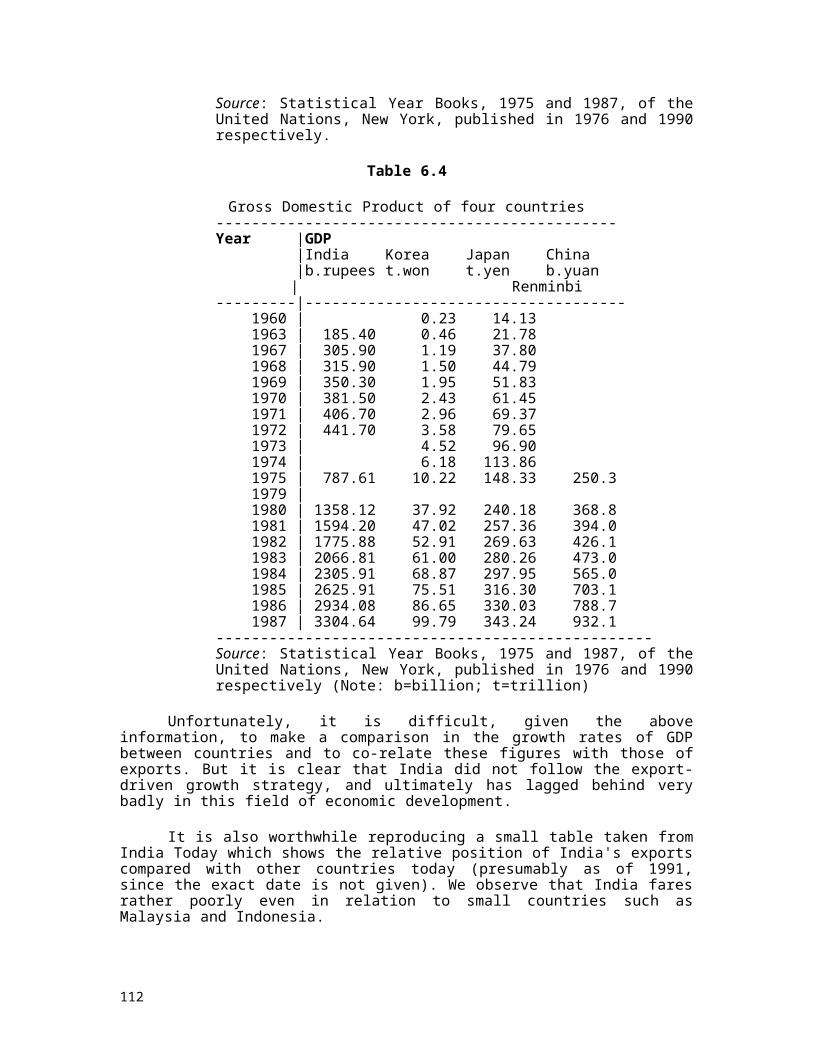
Though a casual look at the above two points would appear to indicate that special shelter is required by the SSI in areas where it can best operate, the intention of these suggestions is far from this.
The success and merits of promoting small-scale enterprises by limiting capacity in the factory sector have been quite questionable. Thus, it is not obvious the restrictions on new cotton mill capacity have truly helped the handloom industry. Indeed, if India had taken her textile exports more seriously, rather than focusing on a zero-sum game for domestic demand for cloth, both mill and handloom production might have been promoted (Lucas,1988: 187)
“in order to raise the competitive position of small units, a more refined way would be to offer liberal subsidies, fiscal and transport concessions to these units than put a curb on the growth of large units; (the fact that the reservation of production of a large number of items - running as high as 128 - exclusively for small units, has not produced any favourable results so far - rather, it has deprived the country from obtaining these goods at comparatively cheaper prices from alternative sources, clearly shows that merely the reservation of production by small units would not solve the problem. Further, instead of gaining from the experience of the Fifth Plan, the Sixth Plan makes a record reservation of items to be developed in the small sector - the list runs to cover 500 items which is over three times the items reserved in the Fifth Plan. This is certainly going to be an inefficient and costly way of development” (Mahajan,1983:228).
Actually, if selection of strategic industries for the SSI is done carefully, there would be no need to suppress competition from any level, since the presumption is that the small scale sector has a competitive advantage in that sector, and others can enter only at their own risk. A marginal premium on employment generation in the form of lower taxes for the small-scale sector could be built into the system, as suggested by Mahajan, but otherwise, a fully competitive economy is called for. The main issue here is that if small-scale industry cannot be made to be competitive within India, what is the possibility of its becoming competitive globally? By allowing free competition between the large and small sector, only the best firms would survive, and export, and thus grow against increasing international competition. And only growing firms can provide employment, not sick and dying firms, sheltered behind a veil of reservations.
Further, if the reservations and price preferences given to the small-scale sector were reduced or eliminated, then, apart from competing with the large sector within the country, the small sector would also have a natural reason to look outside the country to the world markets where the true comparative advantage of these small scale industries, i.e., in labour, would be manifest and convert the stagnancy into dynamic growth. It is also possible that various permutations would arise, with sub-contracting in those areas of an industry where the small-sector has an advantage.
The main thing to be avoided at all costs is inefficiency in utilisation of resources. “Inefficient small-scale industry should not be promoted simply on the grounds of higher labour absorption. In some cases, economies of scale and quality considerations may favour a more capital-intensive, large scale production process. Economic efficiency should be a primary consideration” (Naya, 1985:151).
As also raised elsewhere, there is also the matter of reservations perennially preventing the efficient small industries from growing large in that reserved industry. There are many reasons why small industry in India prefers to remain small, and not one of these reasons can be economically justified. And of course, these reservations encourage the notorious and shady
112
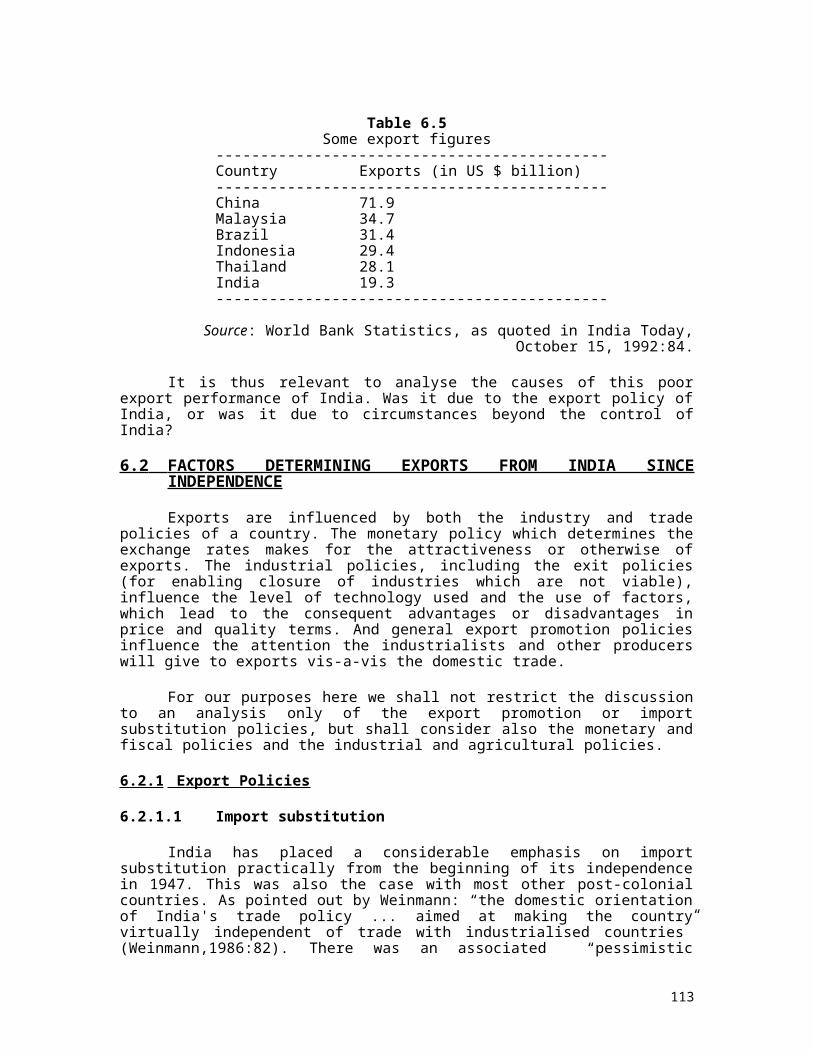
relationships between the lower level bureaucracy, large-scale industry and the small-scale units, which are best buried for ever.
Therefore, just as India has finally abolished the disastrous industrial licensing system in 1991, so must the devious reservation policy for the small-scale sector be permanently consigned to history.
8.6 UPGRADING INDUSTRIAL SKILLS
“Initially, the Government worked on the premise, that the encouraging of cottage industries was only going to be a short term approach to the unemployment problem and the moment heavy industry was firmly rooted, it would be possible to get away from cottage industries. However, once encouraged it became difficult to get away from cottage industries and all those technically inferior techniques, that are employed in these industries, continue to dominate the economy. ... The country has learnt the hard way (which, probably, with a little foresight could have been avoided), that the ever worsening employment situation could not be effectively dealt with by setting up of collage industries. The Government, after the initial blunder, has been very keen to develop infrastructure for the growth of small industries, using modern techniques of production” (Mahajan,1983:210).
It is interesting to note that China has taken a lead over India in this regard. As pointed out by Rosen (1988:69), “On my own short visit to China, I visited large handicraft factories, one making woven carpets and another jade products, where the work was done by hand without sacrificing advantages of size and in what seemed to be good working conditions. This might be achieved in India as well, I would think.” A consequence of the policies adopted by China has been that China's exports are being increasingly well-received in international markets.
Thirty years ago, an American, John P. Lewis, had suggested precisely this approach to India (Lewis,1964:58). He had emphasised the need:
1. To encourage the development of indigenous alternative technologies through innovation so that use of labour is increased without affecting efficiency.
2. To disseminate information on the latest range of technologies in the world to people who make investment decisions so that they can use this information innovatively.
Sadly, these excellent suggestions were not heeded to, and even today there is no conscious effort to improve the information availability to the entrepreneur, and make special efforts to encourage innovation in industry and in technology in general. Some government sponsored research institutions are available which perform very poorly but no efforts to encourage the large body of small industry entrepreneurs to be innovative have been put into place. This needs to be incorporated at the strategic level, for without innovation there can be no development, particularly at this stage when India is lagging behind technologically in key export areas.
Lewis also felt that:
“the cottage-industries programme had the virtue of ostensibly adding to consumer supplies as much as it added to consumer demand... its principal
113
contribution was not to add to total real income but simply to redistribute some of it in favour of some of the otherwise unemployed” (Lewis,1964:66).
There is thus a considerable cause of concern about the continued patronage of traditional cottage industries programmes. These programmes do not appear to have brought out the radical change in improvement of lifestyles of the rural poor that has been brought about by the improvements in agriculture, or by production of relatively cheap and durable consumer goods which have now almost totally dominated the rural markets.
There is clearly some justification for preserving the old cultural practices and skills of the Indian populace, but there is no further scope for expanding the markets for these products, unless, perhaps, a qualitative change in these products takes place in which these goods are designed using innovative materials which have better finish, quality and life.
8.7 SUB-CONTRACTING AS A KEY STRATEGY
It can be argued that one of the most appropriate form of production in the modern industrial world would be achieved with large industry having a core group of permanent workers, and by sourcing its inventory and manpower requirements to a well-trained group of “ancillary” workers, who are not paid by it, but closely enmeshed in its training and development and R & D programme. This means that the disadvantages of `dualism' seen in the Japanese sub-contracting system would be partially reduced, through a more symbiotic relationship between the two categories of workers.
Now that India has allowed large industry to participate upto 25% in the equity of ancillaries, it is perhaps desirable to give the large industries some promotional advantages such as some excise duty rebates in case they subcontract more than 50% or so of their inventories to ancillary units. This would encourage the development of sub-contracting, without which the small-scale sector cannot grow to its potential, as it would be left out of major industries.
8.8 STRUCTURAL REFORMS AND LIBERALISATION
The delicensing of the Indian economy of 1991 has fulfilled some of the essential requirements for structural reform of the economy. These reforms have taken place too recently to allow an objective evaluation, particularly with reference to the small-scale industry performance. But S.L.Rao, the Director-General of the National Council of Applied Research, India, feels that “The flow of foreign investment has increased to much higher levels than ever before.” Also, “Many surveys of business expectations show that businessmen are more confident of the future, though they are worried about the present” (India Today: August 31, 1992:117).
Some recent writings on this subject (Jain:1992), however, point out that the reforms have not been implemented in the right spirit, particularly at the lower levels of the administration. One has not yet seen the kind of radical change required in the system percolate to the field level. Most of the rules have not yet been modified, and complexity of an amazing nature persists in simple activities. Bureaucratic systems and indifference, as well as corruption in dispensing the government facilities continue as before. Even the “prime minister feels that things are not changing at the operational level” (cited in Jain,1992).
i) Urgent need for administrative reform:
114
It is obvious that without administrative reform and the total elimination of the `inspector raj' referred to earlier, there will continue to be little reason for potential entrepreneurs to risk their life's fortunes to move into industry.
A totally transparent system of processing applications by small-scale industry entrepreneurs has to be put into place, which is completely objective, time-bound and corruption-free. This is essential administrative requirement, without which not much progress can be made.
That the government is fully aware of this is borne out by its statement: “The persistent complaint of small scale units of being subjected to a large number of Acts and Laws, being required to maintain a number of registers and submit returns, and face and army of inspectors, would be attended to within a specified time frame of three months” (India's New Economic Policies: Small-Scale Industries, 1992). Follow-up action on this has not yet percolated to the field, and needs to be speeded up, lest the momentum of reforms is lost.
ii) Both cost reductions and supply increases in identified thrust or strategic areas will require access to imports on a competitive basis. The distortions in the system of allocation of imported raw materials to small-scale units needs to be addressed vigorously.
iii) Reform of the exchange rate mechanism:
The recent exchange rate liberalisation through partial convertibility of the rupee has improved the advantage to the exporters. This stop-gap improvement needs to be culminated by complete convertibility of the rupee into hard currencies at market rates. This complete convertibility was responsible for providing a major incentive to exporters in the case of Korea in the 1960s, and there is no reason why this should not similarly motivate entrepreneurs in India.
iv) Reform of the labour market:
A major area of reform left completely untouched by the recent reforms is the reform of the labour market. In this area, it is essential that mechanisms be built to divert the surplus high cost labour in large industries to the small scale sector. The effective cost of labour in India is comparatively higher in terms of its productivity. This encourages the use of more capital-intensive techniques by industrialists, and also prevents innovation in appropriate technology, ultimately limiting industrial employment and hurting export competitiveness.
The labour unions have to be taken into confidence and made responsible for the reform of the labour market. Unless the organised labour works with the same objectives as the national leadership, there are sure to be major weaknesses in building a suitable environment for rapid industrial growth.
v) Continuation of reform:
Unfortunately, the latest figures show that exports have been increasing in 1991-92 only at a trend rate of 32% compared with the increase in imports of 42% (India Today, October 15, 1992:90). This indicates that the economy has not responded as expected to the liberalisation. Perhaps there is going to be a lag in the achievement of expected results. It takes more than one year to clear up the hurdles created by years of economic
115
mismanagement. The fact that immediate results have not been upto expectations will cause vested interests to attempt a reversion to the earlier system. But reforms has to be continued in spite of such interests, since there is a large lag between the reform and its results, as many people are watching it and waiting for its stabilisation. These people will invest only when assured that these are permanent policy changes.
8.9 RAPID NEED TO IMPROVE INFRASTRUCTURE INCLUDING POWER
Though we have not looked at this problem elsewhere in this paper in detail, it is a general problem applicable to almost all sectors of the Indian economy, viz., poor roads and communications, poor availability of power, and difficulty in availability of information and technology. Thus,
“another factor, which retards the development of small industries and also limits their organising capacity, is the lack of basic facilities - transport, communications, and power - in small towns and rural areas, which are the obvious centres of growth of small industries. No wonder, therefore, that small industries continue to use outmoded methods of production and are not in touch with the latest development in the market” (Mahajan,1983:229).
This problem is very serious since sub-contracting and many other measures will not work unless the associated facilities and conditions are provided:
“(The) lack of sub-contracting, on which much emphasis has been put by the various learned economists (including George Rosen and the Japanese Delegation on Small Industries), appears to be intimately linked with the provision of basic facilities and improvement in the organisation of small industries. If Japan has been able to make a successful use of the sub-contracting system, it owes much to the existence of excellent facilities ... (which helps in the running of the JIT system)” (Mahajan, 1983:229).
The availability of power in particular is very erratic, and of poor quality.
“Shortage of electric power is a country-wide problem today. It has to be admitted that in spite of twenty one years (at the time when the author wrote this piece) of our planned development, we have not been able to resolve this problem. The inadequacy of power and frequent load shedding do not allow the industries to run even one shift regularly. As a result, the output of small units using electric power cannot be made financially viable” (Mathur,1983:242).
The infrastructure has to be provided by government either independently or through close co-ordination with large industry as was done in Japan by MITI. The wasteful exercise undertaken by government in attempting to manage public sector undertakings even in consumer goods areas, must be abandoned and government should focus its attention on infrastructure.
While on the subject of infrastructure reform one should not forget to mention the great need for rapid expansion in urban planning and development. The mess made by India due to the complete neglect of urban planning after the British left India in 1947 has now become so severe a bottle-neck that optimal development is not possible in this environment. Proper zoning, planning and rigid adherence to rules will have to be enforced in urban areas, and wherever industry is allowed to operate.
116
8.10 THRUST ON PRIMARY AND TECHNICAL EDUCATION
We have seen clearly in the case of Korea and Japan that primary education was a precursor to rapid industrial and general economic development. In India the position is deplorable, with a majority of the population still unable to read and write. It is also critically vital for the government to promote high level technical skills required for factory type production, through a massive thrust on technical education. A suggestion on this point has already been made above. There is hardly any need to show the very strong correlation between education and the ability of the populace to absorb higher skills and analytical and innovative abilities.
Thus it should be extremely obvious to all concerned that no amount of liberalisation and reform will have a positive effect unless the population has been educated and trained to utilise these opportunities.
8.11 OTHER POLICY ISSUES FOR GOVERNMENT.
Other useful, though relatively less strategic issues for the Government would include:
i. Maximising its existing human capital
India has a large body of educated middle class, which is unfortunately lured away by the government by the sinecures offered by it. This middle class has a considerable potential but when allowed to work in government, it is generally underutilised, and does not actively participate in the production process. It is therefore necessary for the government to utilise its existing stock of managers optimally. It would be possible and desirable for the government to provide incentives to a certain ratio of its middle level staff to quit government service and start small industries. This would not only reduce the huge wage bill of government, but also maximise the use of the limited stock of its human capital, who will put their skills to better use.
ii. Simplification of export procedures:
“the need to streamline and simplify the procedures involved in exports and in claiming export assistance, so that the small industrialists do not have to face procedural delays and hardships which act as deterrents in undertaking exports” (Desai,1983:170).
iii. Quality Control:
“There is hardly any quality control over the goods produced by them, which naturally limits their marketing to the immediate neighbourhood. It is thus peculiar that while India should lay emphasis on the earning of foreign exchange to reduce the widening gap in her balance of payments, she be satisfied with the quality of goods turned out by small industries, and not adopt sufficient measures to improve quality. But quality improvement will only occur when there is improvement in the basic organisation of small industries, and the latter, in no small extent, depends on the vigour with which small towns and rural areas are brought within the fold of modern distribution” (Mahajan,1983:229).
iv. Organising capacity of small industry:
117
“If we can improve the organising structure of small industries ... we shall have, to a great extent, paved the way for their being accepted more liberally by the existing financial institutions” (Mahajan,1983:228).
v. Entrepreneurship development in schools:
Another excellent point raised by Mathur, and which could be looked into by government is: “It is also absolutely essential that our young men get an industrial bias when they are at the school stage. Very little has been done, so far, towards including entrepreneurial ability among young men as a part of their education” (Mathur,1983:240).
vi. Exposure of entrepreneur to marketable goods:
There is also a feeling that the entrepreneur in India is very often not aware of what actually sells in the developed markets. A possible method of overcoming this problem would be to purchase samples, on a regular basis, of the goods which sell in supermarkets abroad and to hold permanent exhibitions of these goods in every district headquarter, as well as the major business towns and cities, so that the entrepreneur is aware of the kind of competition he faces in the world today.
8.12 CONCLUSION
The essential recommendation at this stage of India's economic growth would therefore be for government to completely focus on providing infrastructure and general incentives to industry, and allow the market economy and fair competition to determine the best and most efficient of the lot. By forcing the sluggish Indian industry to compete with the world and within itself, the best creative human instincts of a population of 800 million people will be unleashed and it should not take long for this `sleeping tiger' to awake and prove its worth in the world.
118
REFERENCES
Acs, Zoltan J. and Audretsch, David B. (1990) Innovation and Small Firms. The MIT Press, Cambridge, Massachussets.
Amsden, Alice H.(1989) Asia's Next Giant: South Korea and Late Industrialization. Oxford University Press. New York.
Attri, V.N. (1991) Industrialisation in India: An Export Oriented Approach. The Indian Economic Journal. Vol 88. Jan-March 1991. Bombay.
Balassa, Bela.(1982) Development Strategies in Semi-industrial Economies. World Bank: John Hopkins University Press, Baltimore.
Behari, Bepin. (1976) Rural Industrialisation in India. Vikas Publishing House Pvt. Ltd. New Delhi.
Bhagwati, Jagdish N. and Desai, Padma. India: Planning for Industrialisation. 1970. Published for OECD by Oxford University Press, Bombay. (available: to cite)
Biswas, Basudeb. (1991) Export and Economic Growth in India: Emperical Evidence. The Indian Economic Journal. Jan-Mar. 1991. Bombay.
Broadbridge, Seymour. Industrial Dualism in Japan: A Problem of Economic Growth and Structural Change. 1966. Aldine Publishing Company, Chicago.
CIER's Industrial Databook, 1991-92. Centre for Industrial and Economic Research, New Delhi.
Cukor, Gyorgy. (1971) Strategies for Industrialisation in Developing Countries. C.Hurst and Co. London.
Cortes, Mariluz; Berry, Albert and Ishaq Ashfaq. (1987) Success in Small and Medium-Scale Enterprises: the Evidence from Colombia. Published for the World Bank by Oxford University Press, New York.
Desai, Vasant. (1983) Problems and Prospects of Small-Scale Industries in India. Himalaya Publishing House, Bombay.
Dore, R.P. (1971) Japanese Industrialisation and the Developing Countries: Model, Warning or Source of Healthy Doubts? Occasional Paper No.8. Institute of Southeast Asian Studies, Singapore.
Dutt, Ruddar and Sundharam, K.P.M. (1981) Indian Economy. 18th edn. S.Chand and Co. New Delhi.
Guha, Ashok (ed). (1990) Economic Liberalisation, Industrial Structure and Growth in India. Oxford University Press. Bombay.
Hagashi, Chikara and Lauter, Peter, G. (1990) The Internationalisation of the Japanese Economy. 2nd edn. Kluwer Academic Publishers, Boston.
119
Harper, Malcolm.(1984) Small Business in the Third World: Guidelines for Practical Assistance. John Wiley, Chichester.
Hounsell, David A. (1984) The American System to Mass Production: 1800 - 1932. The John Hopkins University Press, Baltimore.
House of Representatives Standing Committee on Industry and Science & Technology, Report by. (1990) Australian Government Publishing Service, Canberrra.
India, 1991. Publications Division, Government of India, New Delhi.
India's New Economic Policies: Small Scale Industries, 1992. Ministry of External Affairs, Government of India, New Delhi.
India News. High Commission of India, Canberra.
India Today. A fortnightly newsmagazine, published from New Delhi.
IOCPS Briefing Paper Number One. India: Prospects for the Future. Indian Ocean Centre for Peace Studies, University of West Australia. June 1991.
Jain, Sunil (1992) Now You See It, Now You Don't. India Today, July 31, 1992.
Johns, L.; Dunlop, W.C. and Sheehan, W.J. (1989) Small Business in Australia; Problems and Prospects.3rd edn. Allen and Unwin, Sydney.
Johnson, Chalmers. (1982) MITI and the Japanese Miracle - The Growth of Industrial Policy, 1925-1975.Stanford University Press, Stanford.
Judd, Richard J., Greenwood, William T. and Becker, Fred W. (ed) (1988) Small Business in a Regulated Economy: Issues and Policy Implications. Quorum Books, N. York.
Kang, T.W. (1989) Is Korea the next Japan? The Free Press, New York.
Kodansha Encyclopaedia of Japan, Vol 7. 1983. Kodansha, Tokyo.
Lewis, John P.(1964) Quiet Crisis in India. Anchor Books. New York. 1964.
Little, Ian; Scitovsky, Tibor and Scott, Maurice.(1970) Industry and Trade in Some Developing Countries: A Comparative Study. Published for the OECD by Oxford University Press, London.
Little, Ian M.D., Muzumdar, Dipak and Page,Jr.,John M. Small. (1987) Manufacturing Enterprises - A Comparative Study of India and Other Economies. World Bank. Oxford University Press.
Lucas, Robert E.B., and Papanek, Gustav F. (ed) (1988) The Indian Economy - Recent Developments and Future Prospects. Westview Press/ Boulder and London., Colorado.
Mahajan, V.S. (1983) Studies in Indian Economy. Deep and Deep Publications, New Delhi.
Mathur, S.P. (1979) Economics of Small-Scale Industries. Sundeep Prakashan, Delhi.
120
Mellor, John W. (1976) The New Economics of Growth - a strategy for India and the Developing World. Cornell University Press. London.
Naya, S. (1985) The Role of Small Scale Industries in Employment and Exports of Asian Developing Countries. Hitosubashi Journal of Economics. Dec. 1985.
OECD (Organisation for Economic Co-operation and Development). (1982) Innovation in Small and Medium Firms.
Pandey, Prabha Shanker. (year not indicated) Impact of Industralisation on the Rural Community. Research. Delhi.
Porter, Michael E.(1985) Competitive Advantage: creating and sustaining superior performance. Free Press, New York.
Rao, R.V. Small Industries and the Developing Economy in India. 1979. Concept Publishing Co. New Delhi.
Robertson, Paul L. and Langlois, Richard N. (1992) Innovation, Networks and Vertical Integration. Paper presented to the Conference of Industry Economics, The Australian National University, 16-18 July, 1992.
Rosa, Peter; Birley, Sue; Cannon, Tom and O'Niell, Ken (ed) (1989) The Role and Contribution of Small Business Research. Avebury, Aldershot.
Rosen, George.(1988) Industrial Change in India: 1970-2000: Present State of Indian Manufactures and Outlook of the Same. Riverdale Co. Inc. Publishers. Maryland.
Sen, Anupam.(1982) The State of Industrialization and class formations in India - a neo-Marxist perspective on Colonialism. Routledge and Kegan Paul. London.
Shepherd, William G. (1990) The Economics of Industrial Organisation. 3rd edn. Prentice Hall, New Jersey.
Singh, Inderjit. (1990) The Great Ascent: the Rural Poor in South Asia. World Bank. John Hopkins University Press, Baltimore.
Singh, Tarlok. (1974) India's Development Experience. 1974. St.Martin's Press, New York.
Storey, David J. (1983) The Small Firm: an International Survey. Croom Helm, London and St. Martin's Press, N.York.
Suri, K.B. (ed) (1988) Small Scale Enterprises in Industrial Development: The Indian Experience. Sage Publications, New Delhi.
Thakur S.Y. (1991) Indian Economic Development: Retrospect and Prospect. 3rd edn. Sterling Publishers Pvt.Ltd., New Delhi.
Todaro, Michael P. (1989) Economic Development in the Third World. 4th edn. Long Man, New York.
121
Tyabji, Nasir. (1989) The Small Industries Policy in India. Oxford University Press.
Vepa, Ram K. (1967) Small Industries in Japan. Vora and Co. Publishers Pvt. Ltd. Bombay.
Weinmann, Jurgen. (1986) India in Transition: Industrialisation, Industrial Policy and Economic Cooperation. Allied Publishers Pvt Ltd., New Delhi.
Yamanaka, Tokutaro. (ed) (1971) Small Business - in Japan's Economic Progress. Asahi Evening News.
122