Embed Size (px)
Citation preview
Logistics Impact on Industrial Development – Update 2015
Prepared By: Curtis D. Spencer, PresidentIMS Worldwide, Inc.

Today’s Agenda
• All of you already know how Logistics Impacts Industrial Real Estate!
• This is the 2015 Refresher.
• What happened in 2014 to set us up for 2015?
– Imports and Exports, Unions vs. Management, BIG SHIPS
– E-Commerce, The Next Cycle
– Re-shoring and manufacturing in North America –Continuing in Basic Robust, Manufacturing: Steel, Chemicals, Plastics, Autos, others
www.imsw.comForeign Trade Zone, Logistics and Supply Chain Consulting
Imports and Exports
www.imsw.comForeign Trade Zone, Logistics and Supply Chain Consulting

Global Shipping Trade Routes
www.imsw.comForeign Trade Zone, Logistics and Supply Chain Consulting
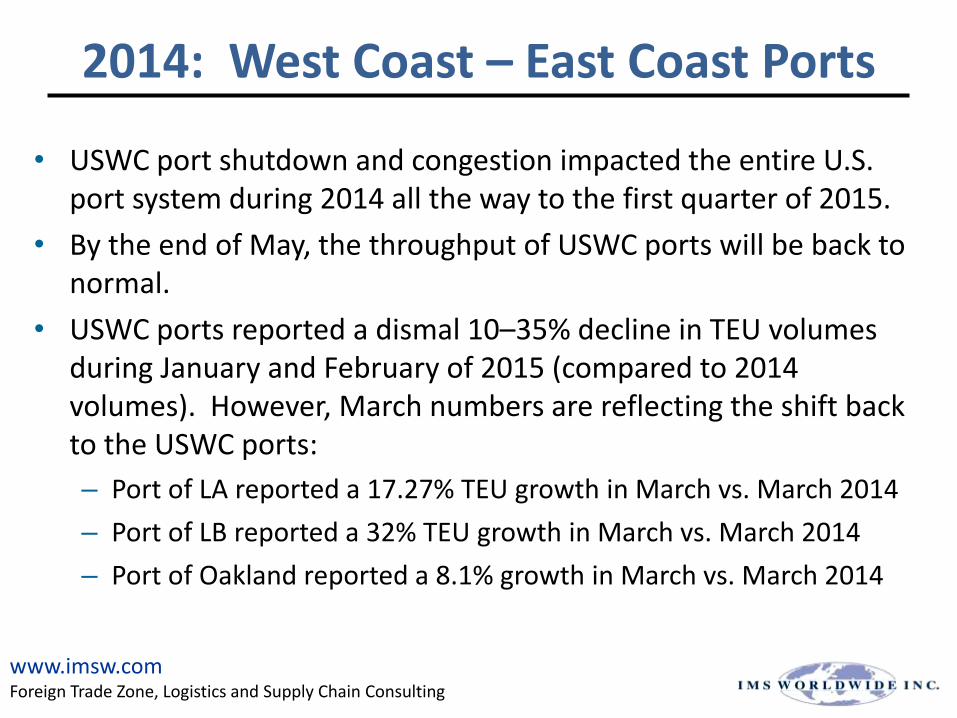
2014: West Coast – East Coast Ports
• USWC port shutdown and congestion impacted the entire U.S. port system during 2014 all the way to the first quarter of 2015.
• By the end of May, the throughput of USWC ports will be back to normal.
• USWC ports reported a dismal 10–35% decline in TEU volumes during January and February of 2015 (compared to 2014 volumes). However, March numbers are reflecting the shift back to the USWC ports:
– Port of LA reported a 17.27% TEU growth in March vs. March 2014
– Port of LB reported a 32% TEU growth in March vs. March 2014
– Port of Oakland reported a 8.1% growth in March vs. March 2014
www.imsw.comForeign Trade Zone, Logistics and Supply Chain Consulting
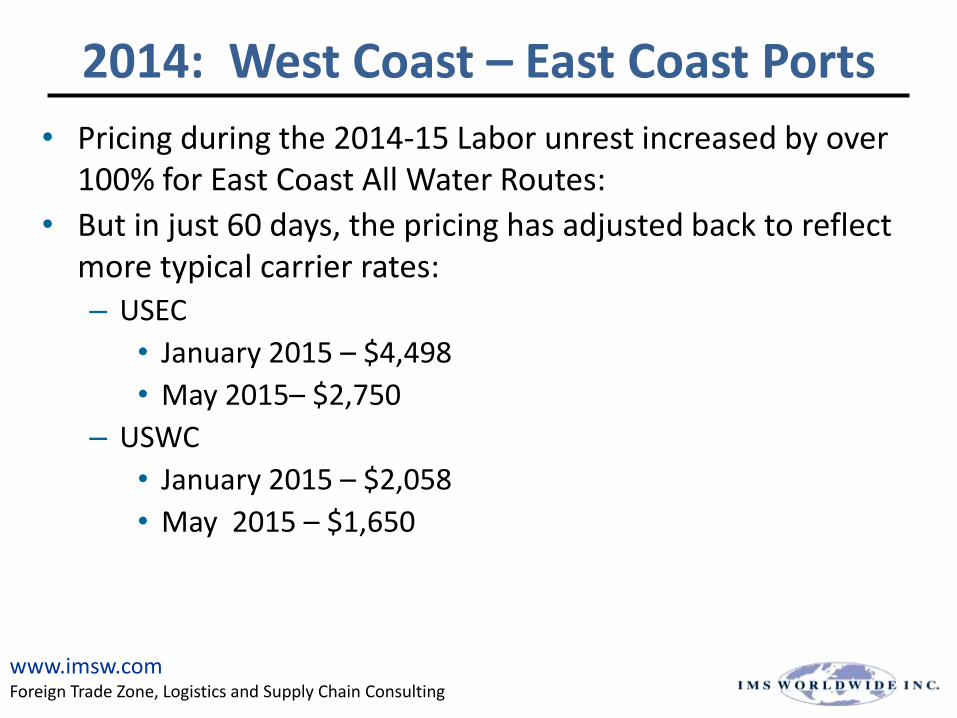
2014: West Coast – East Coast Ports
• Pricing during the 2014-15 Labor unrest increased by over 100% for East Coast All Water Routes:
• But in just 60 days, the pricing has adjusted back to reflect more typical carrier rates:– USEC
• January 2015 – $4,498
• May 2015– $2,750
– USWC
• January 2015 – $2,058
• May 2015 – $1,650
www.imsw.comForeign Trade Zone, Logistics and Supply Chain Consulting
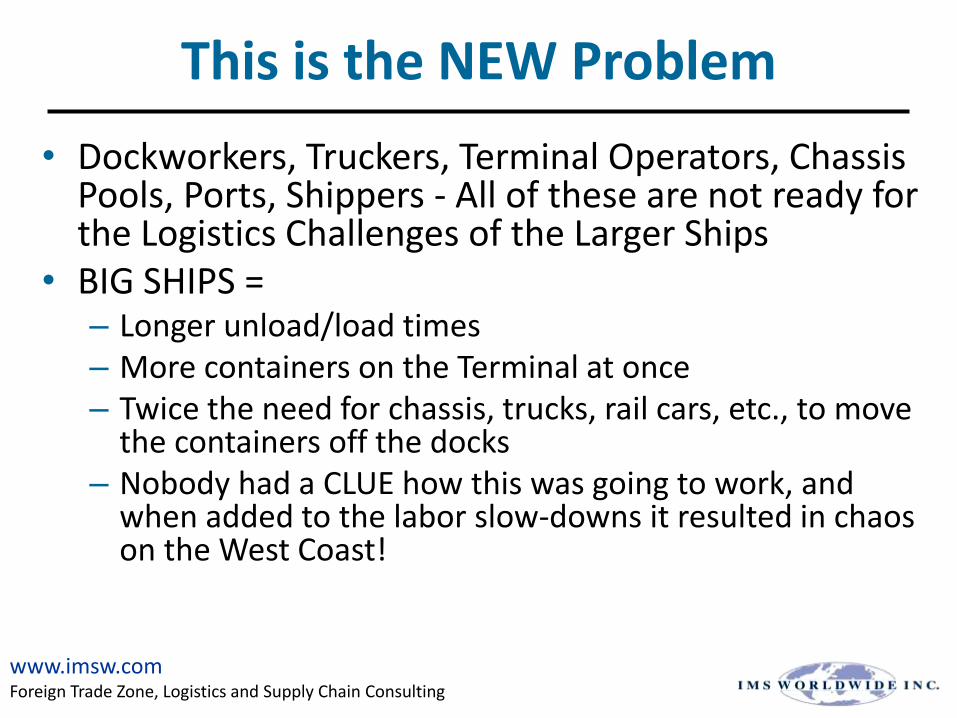
This is the NEW Problem
• Dockworkers, Truckers, Terminal Operators, Chassis Pools, Ports, Shippers - All of these are not ready for the Logistics Challenges of the Larger Ships
• BIG SHIPS =– Longer unload/load times– More containers on the Terminal at once– Twice the need for chassis, trucks, rail cars, etc., to move
the containers off the docks – Nobody had a CLUE how this was going to work, and
when added to the labor slow-downs it resulted in chaos on the West Coast!
www.imsw.comForeign Trade Zone, Logistics and Supply Chain Consulting
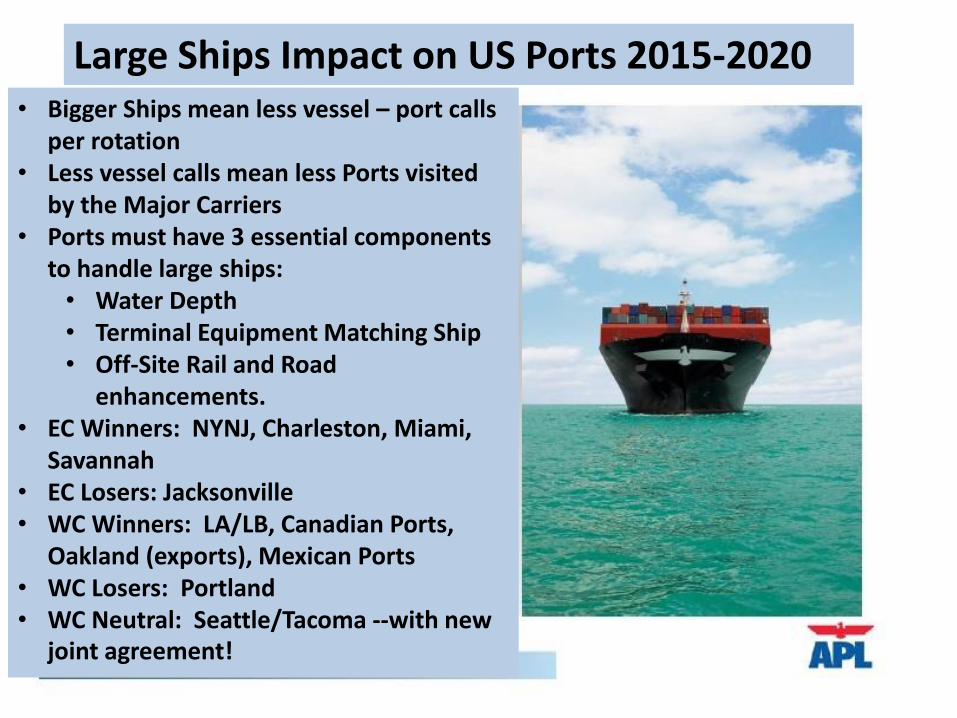
• Bigger Ships mean less vessel – port calls per rotation
• Less vessel calls mean less Ports visited by the Major Carriers
• Ports must have 3 essential components to handle large ships:• Water Depth• Terminal Equipment Matching Ship• Off-Site Rail and Road
enhancements.• EC Winners: NYNJ, Charleston, Miami,
Savannah• EC Losers: Jacksonville• WC Winners: LA/LB, Canadian Ports,
Oakland (exports), Mexican Ports• WC Losers: Portland• WC Neutral: Seattle/Tacoma --with new
joint agreement!
Large Ships Impact on US Ports 2015-2020
`
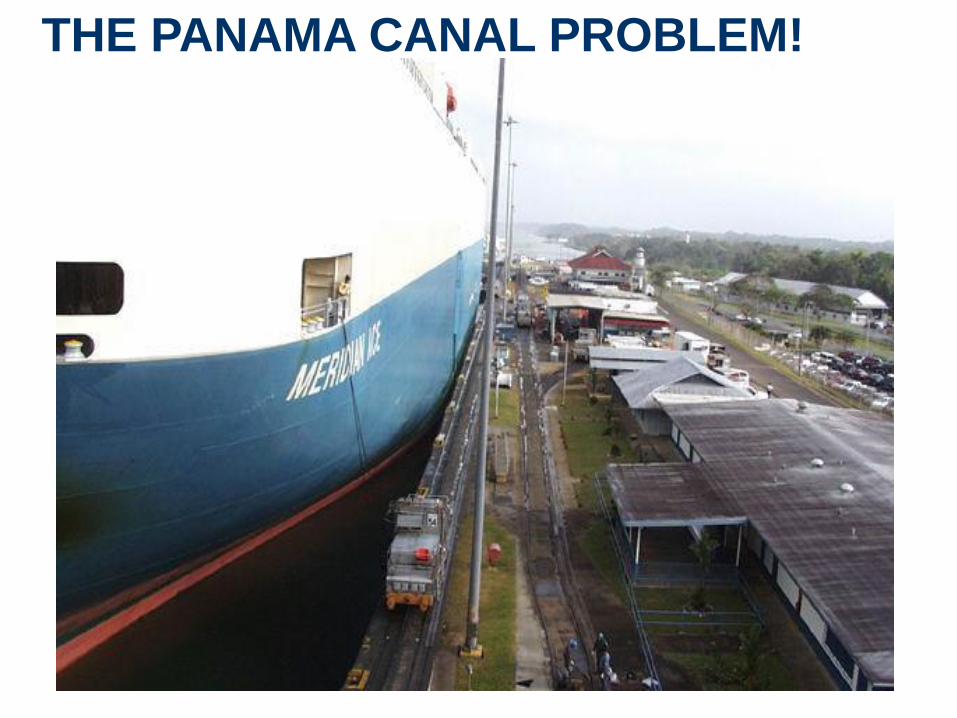
THE PANAMA CANAL PROBLEM!
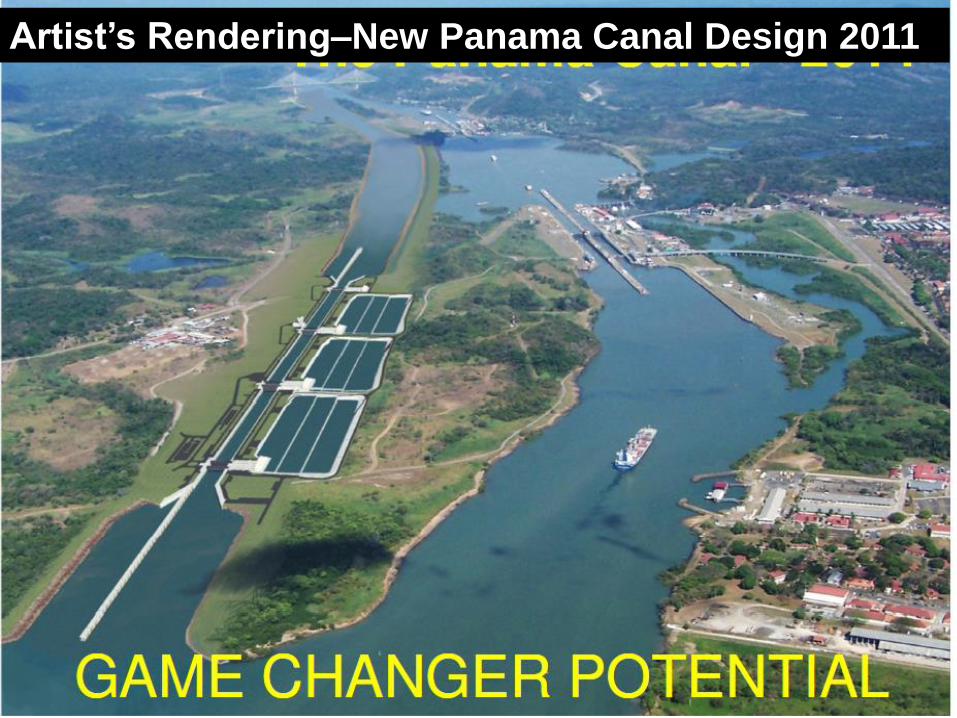
Artist’s Rendering–New Panama Canal Design 2011
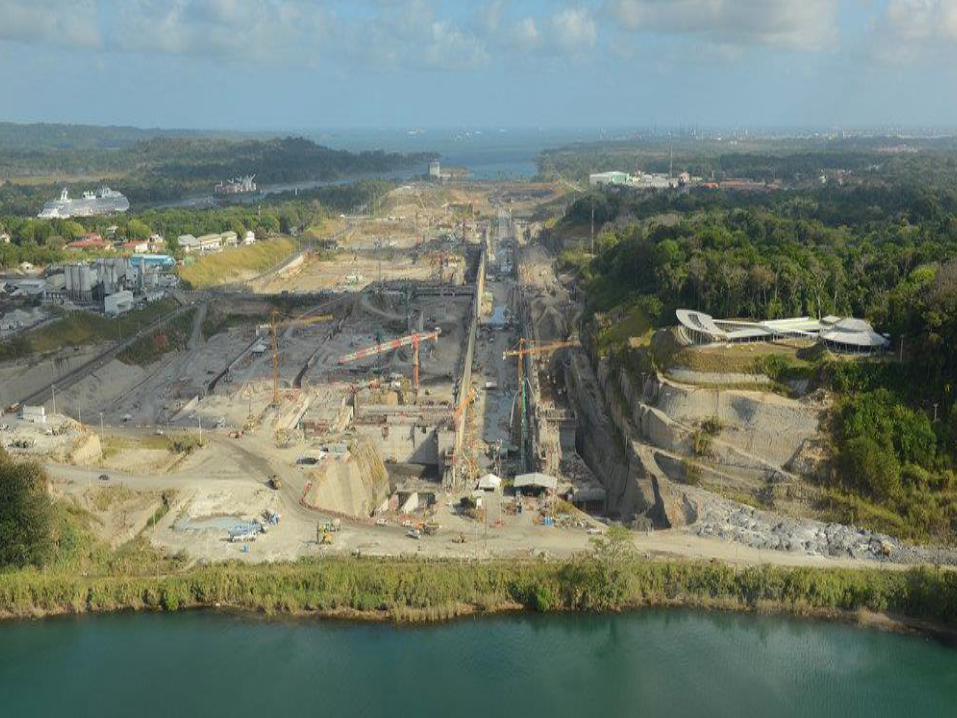
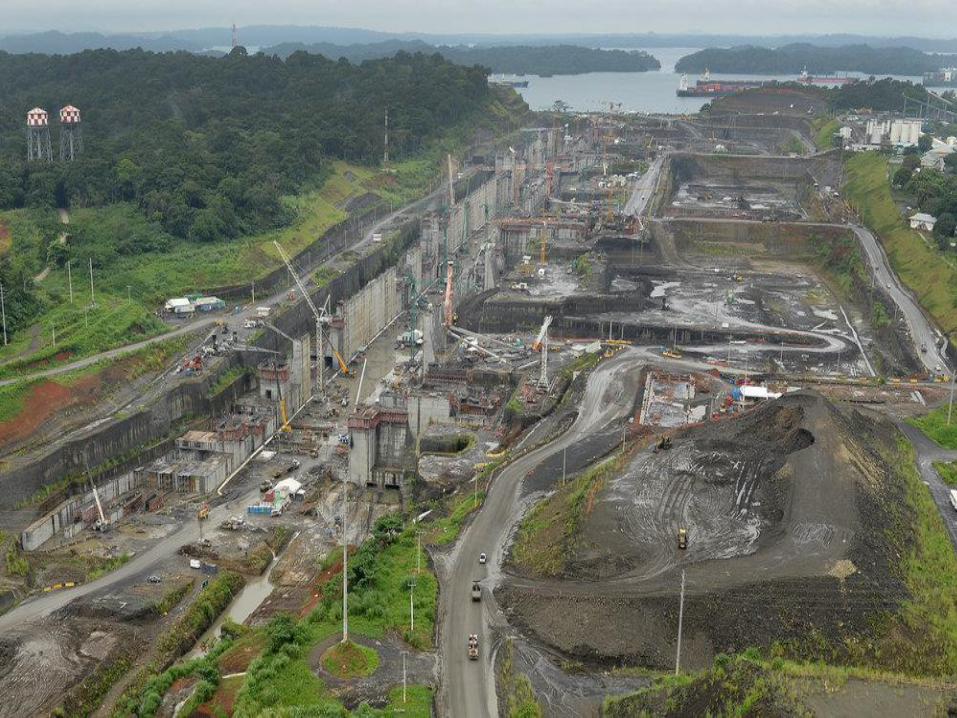
Panama Canal Update: April 2015 Key Milestone with Installation of Final Gate
• The Panama Canal Authority (ACP) announced in April a key milestone: The installation of the sixteenth and final gate for the new locks on the Pacific side of the Canal (April 13th)
• ACP reports that “the Expansion is 85% complete”
• The installation process began at 12:00 PM (Panama Time) on the south end of the Canal’s Pacific locks, which connect directly to the ocean.
– The final gate is one of the heaviest and weighs 4,232 tons, or roughly 8.5 million pounds.
– It measures 57.6 meters wide by 10 meters long and 33 meters high.
• The installation of all eight gates on the Atlantic side of the Panama Canal was completed earlier this year on April 1.
www.imsw.comForeign Trade Zone, Logistics and Supply Chain Consulting
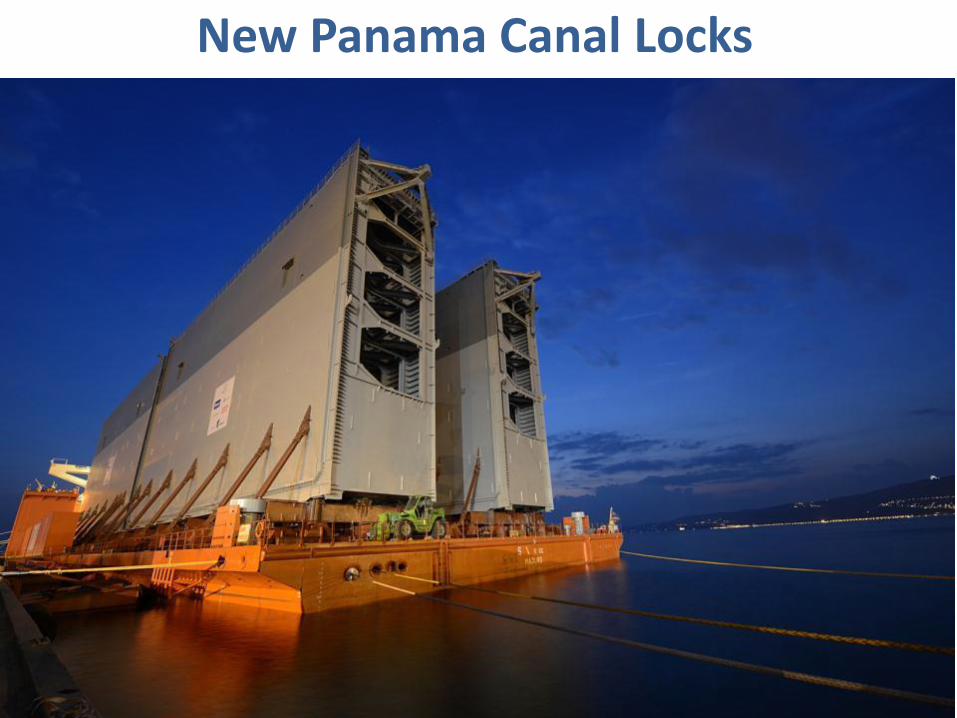
New Panama Canal Locks
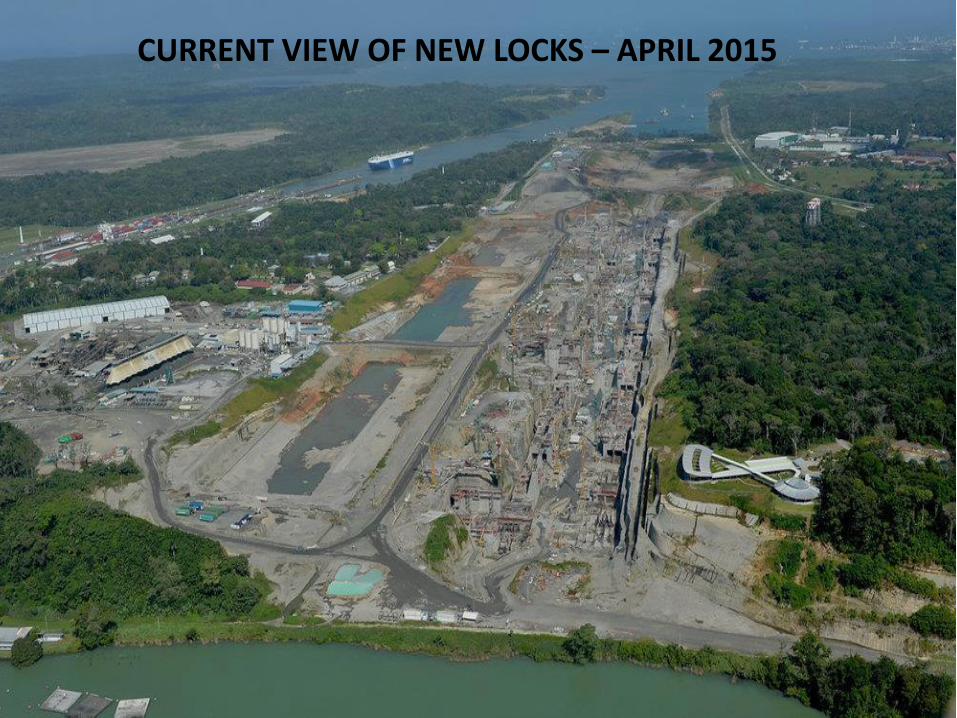
CURRENT VIEW OF NEW LOCKS – APRIL 2015
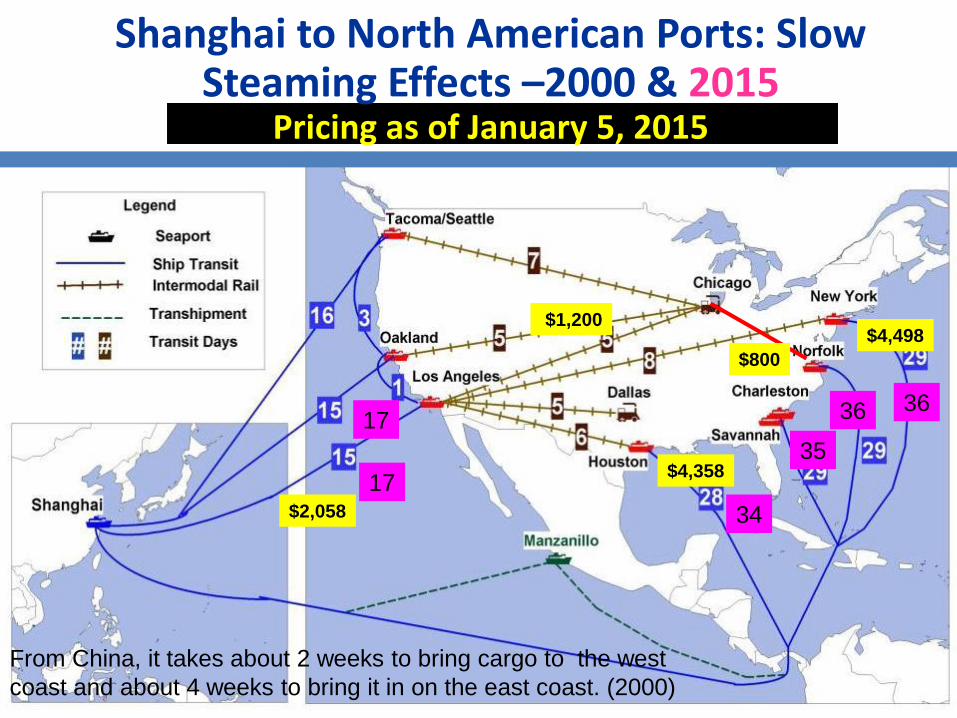
Source: ShipmentLink.com (Evergreen) Sailing SchedulesFrom China, it takes about 2 weeks to bring cargo to the west
coast and about 4 weeks to bring it in on the east coast. (2000)
35
17
34
36 36
17$2,058
$4,498
$4,358
Shanghai to North American Ports: Slow Steaming Effects –2000 & 2015
Pricing as of January 5, 2015
$1,200
$800

Source: ShipmentLink.com (Evergreen) Sailing SchedulesFrom China, it takes about 2 weeks to bring cargo to the west
coast and about 4 weeks to bring it in on the east coast. (2000)
35
17
34
36 36
17$1,650
$2,750
$2,685
Shanghai to North American Ports: Slow Steaming Effects –2000 & 2015
Pricing as of May 2015
$1,200
$800
E-Commerce: Driving New Industrial!
www.imsw.comForeign Trade Zone, Logistics and Supply Chain Consulting
0
500
1,000
1,500
2,000
2,500
3,000
3,500
4,000
2009 2010 2011 2012 2013 2014 2015 2016 2017 2018 2019 2020 2021 2022 2023 2024 2025
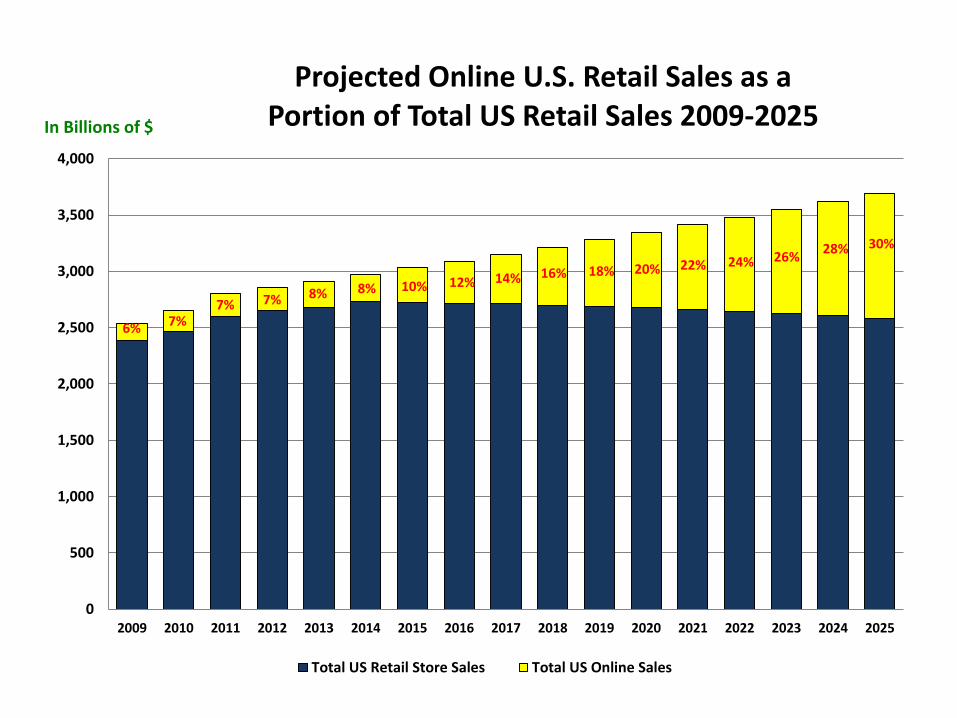
Projected Online U.S. Retail Sales as a Portion of Total US Retail Sales 2009-2025
Total US Retail Store Sales Total US Online Sales
In Billions of $
6% 7%7% 7% 8% 8% 10% 12% 14% 16% 18% 20% 22% 24% 26%
28% 30%

E-Commerce Impact on Industrial
• “60 tenants are currently seeking big box warehouses of one million square feet or more nationwide” JLL, January 8, 2015
• The E-Commerce generation of industrial is up to 5 times more labor intensive than traditional retail/distribution: more parking, mezzanine build-outs and increased automation are some of the features difficult to retrofit to older buildings, but many can be converted. (Area Development Magazine, 2013)
• Alibaba-in 2013, their T-mall shopping network reached $240 billion-that is triple the size of eBay and twice the size of Amazon
• Alipay the online payment system handled more than three times the amount of mobile payments processed by PayPal. (WSJ, May 15, 2014)
www.imsw.comForeign Trade Zone, Logistics and Supply Chain Consulting
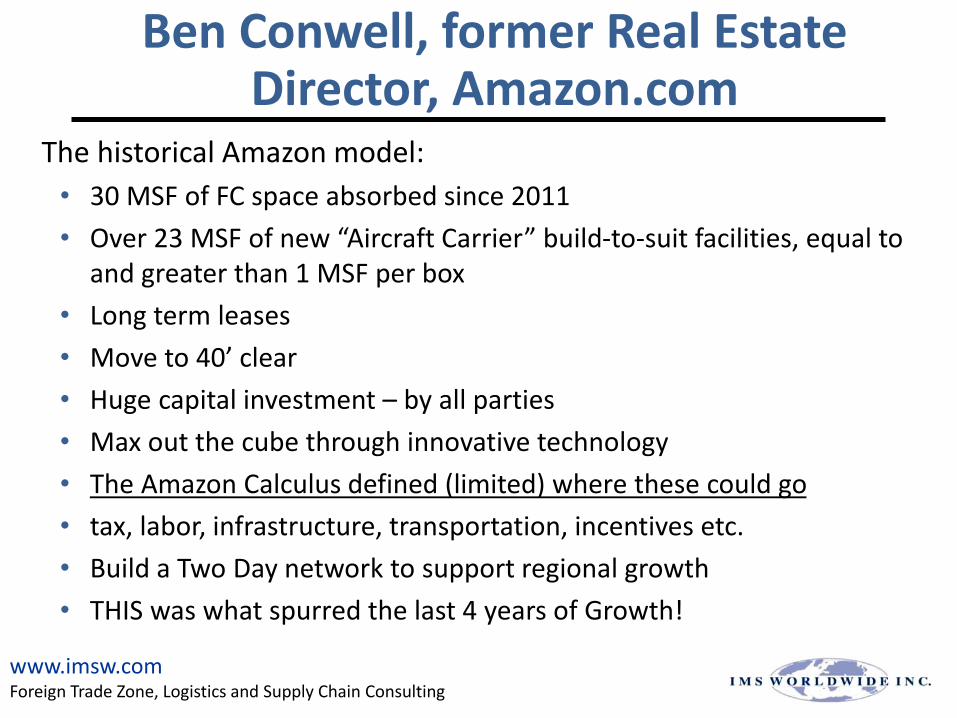
The historical Amazon model:
• 30 MSF of FC space absorbed since 2011
• Over 23 MSF of new “Aircraft Carrier” build-to-suit facilities, equal to and greater than 1 MSF per box
• Long term leases
• Move to 40’ clear
• Huge capital investment – by all parties
• Max out the cube through innovative technology
• The Amazon Calculus defined (limited) where these could go
• tax, labor, infrastructure, transportation, incentives etc.
• Build a Two Day network to support regional growth
• THIS was what spurred the last 4 years of Growth!
Ben Conwell, former Real Estate Director, Amazon.com
www.imsw.comForeign Trade Zone, Logistics and Supply Chain Consulting
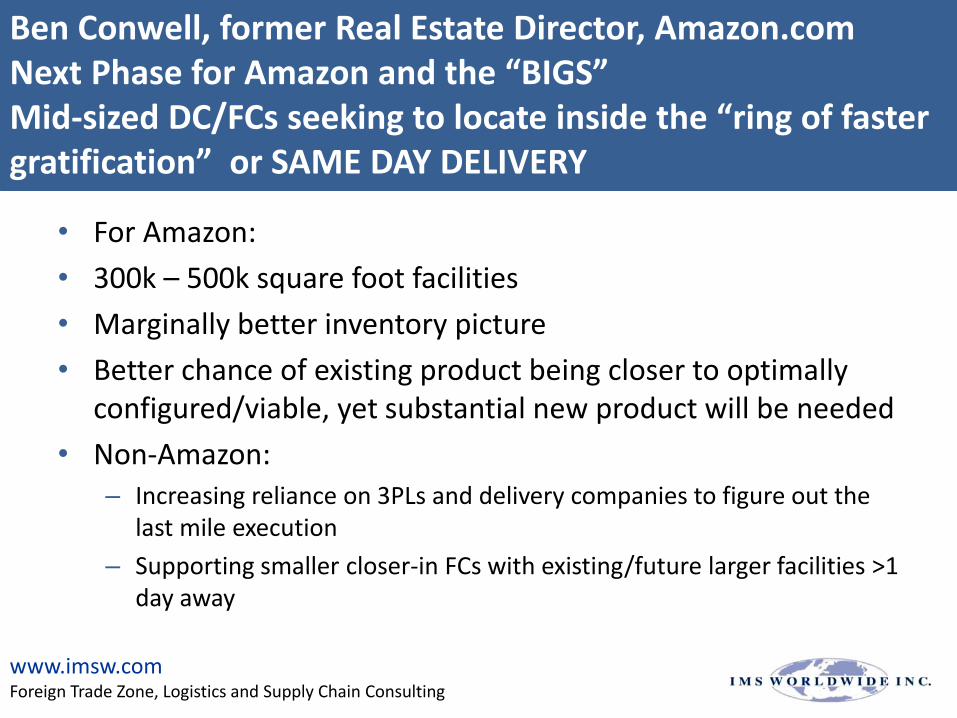
Ben Conwell, former Real Estate Director, Amazon.comNext Phase for Amazon and the “BIGS” Mid-sized DC/FCs seeking to locate inside the “ring of faster gratification” or SAME DAY DELIVERY
• For Amazon:
• 300k – 500k square foot facilities
• Marginally better inventory picture
• Better chance of existing product being closer to optimally configured/viable, yet substantial new product will be needed
• Non-Amazon:– Increasing reliance on 3PLs and delivery companies to figure out the
last mile execution
– Supporting smaller closer-in FCs with existing/future larger facilities >1 day away
www.imsw.comForeign Trade Zone, Logistics and Supply Chain Consulting

Ben Conwell, former Real Estate Director, Amazon.comMedium to large sortation centers within major urban centers to accelerate delivery and mitigate risks
• Amazon– Biggest operations bet of 2014 – mitigate risks of delivery providers’
potential disruption: avoid 2013– 18 SCs online by peak carefully located to optimize impact– AN SC IS THE SHIPPING BAY TAKEN OUT OF THE 40 FT BOX AND
SEGREGATED– 150k to almost 600k square feet– Enabled Sunday delivery with USPS, and more– Better control their own destiny– Volumes through the network year 1 were mind-blowing – The Model Worked!
• Non-Amazon– Further enhancement of 3PLs’ and carriers’ sortation networks– Not just investment within the existing footprint: better AND bigger
www.imsw.comForeign Trade Zone, Logistics and Supply Chain Consulting
Ben Conwell, former Real Estate Director, Amazon.com
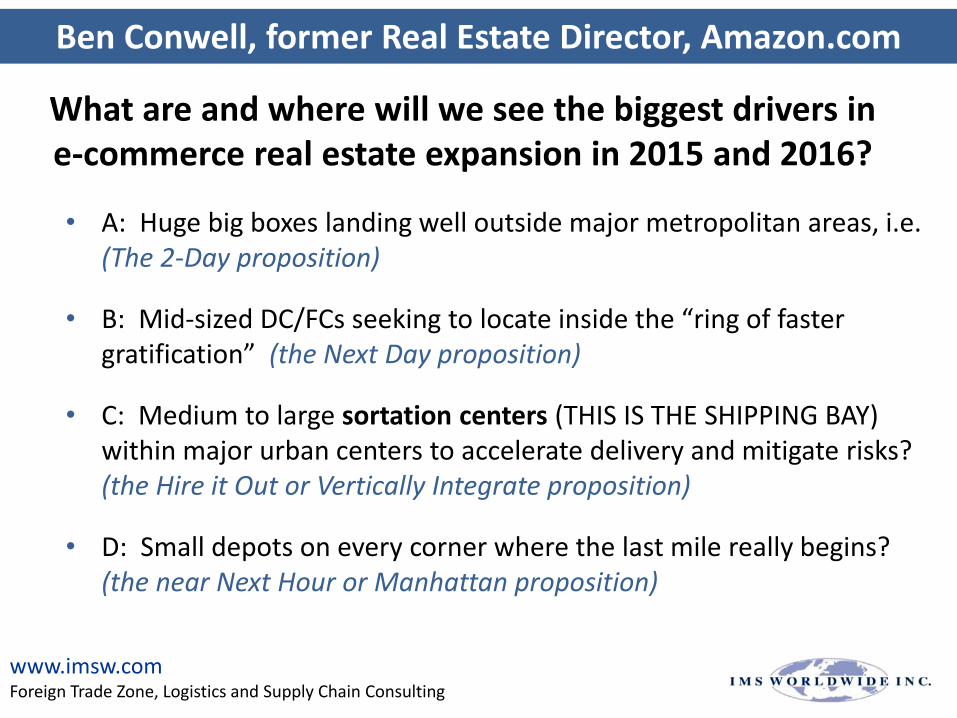
What are and where will we see the biggest drivers in e-commerce real estate expansion in 2015 and 2016?
• A: Huge big boxes landing well outside major metropolitan areas, i.e. (The 2-Day proposition)
• B: Mid-sized DC/FCs seeking to locate inside the “ring of faster gratification” (the Next Day proposition)
• C: Medium to large sortation centers (THIS IS THE SHIPPING BAY) within major urban centers to accelerate delivery and mitigate risks? (the Hire it Out or Vertically Integrate proposition)
• D: Small depots on every corner where the last mile really begins? (the near Next Hour or Manhattan proposition)
www.imsw.comForeign Trade Zone, Logistics and Supply Chain Consulting

Re-Shoring & US-NA Manufacturing
www.imsw.comForeign Trade Zone, Logistics and Supply Chain Consulting
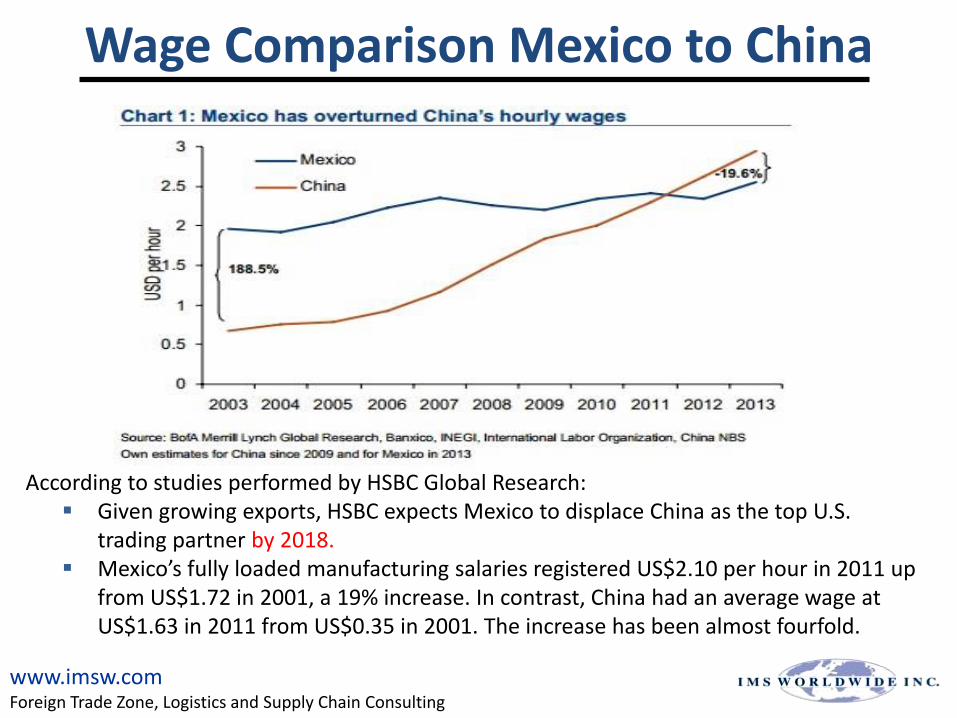
Wage Comparison Mexico to China
According to studies performed by HSBC Global Research: Given growing exports, HSBC expects Mexico to displace China as the top U.S.
trading partner by 2018. Mexico’s fully loaded manufacturing salaries registered US$2.10 per hour in 2011 up
from US$1.72 in 2001, a 19% increase. In contrast, China had an average wage at US$1.63 in 2011 from US$0.35 in 2001. The increase has been almost fourfold.
27www.imsw.comForeign Trade Zone, Logistics and Supply Chain Consulting

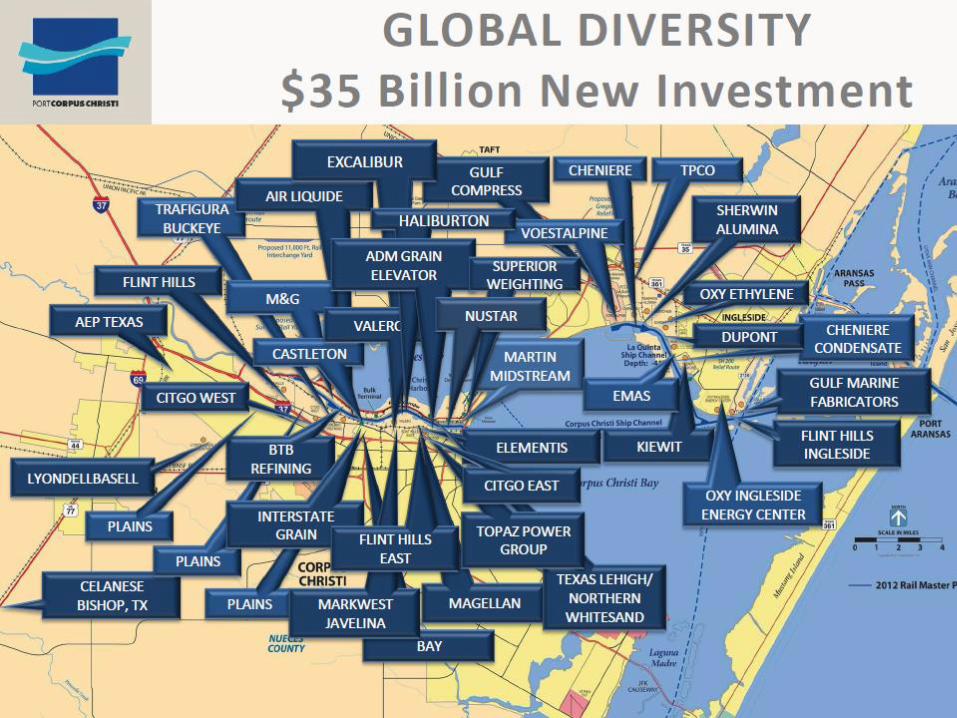
Foreign Direct Investment (FDI) in Mexico
28
Wal-Mart is opening new stores nation-wide - $958M
2011 Major FDI Projects
SOURCE: ProMexico and Secretaria de Economia de Mexico
• Foreign Direct Investments in Mexico in 2011 reached approximately $19.5 billion dollars:
• New Investments: $8 B
• Reinvestments: $7.4 B
• Exchange of Investment: $3.8 B
• From 2007 to 2011, FDI in Mexico has totaled more than $113 billion dollars
• 2011 Investments focus on: Manufacturing, Finance, Retail, Aerospace, Automotive, Appliances & Wind Energy
Siemens: $300M
Nissan:$2B
Rubenius:$4B
Cannon Power Group:$2.5B
Ternium:$1B
Volkswagen:$836M
Honda:$800M
Dupont:$500M
Mazda:$500M
Eurocopter:$450M
Goldcorp:$400M
Iberdrola:$365M
Posco:$300M
Prenea:$300M
Navistar International:$300M
Walmart:$131M
Unilever:$100M
Bridgestone:$100M
Bodycote:$100M Hawker Beechcraft:
$52M
NUCOR:$75M
www.imsw.comForeign Trade Zone, Logistics and Supply Chain Consulting
1.22
1.852.04
2.202.35
2.60
3.000.28
0.41
0.42
0.40
0.40
0.42
0.48
1.50
2.26
2.462.60
2.75
3.02
3.48
2009 2010 2011 2012 2013 2014 2015
Export Domestic Total
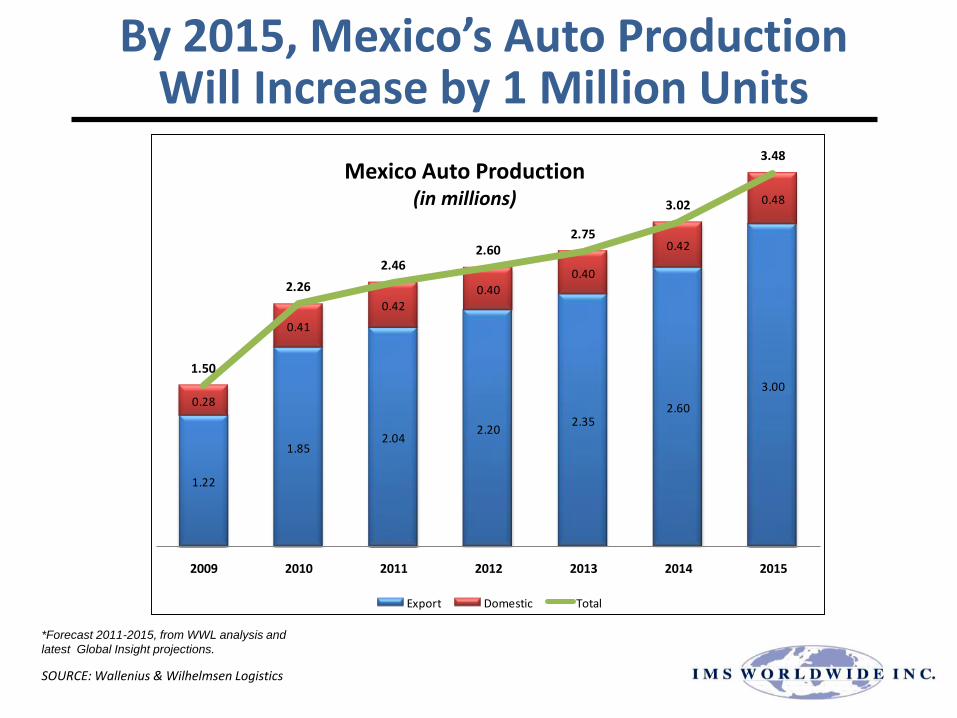
By 2015, Mexico’s Auto Production Will Increase by 1 Million Units
29SOURCE: Wallenius & Wilhelmsen Logistics
*Forecast 2011-2015, from WWL analysis and
latest Global Insight projections.
Mexico Auto Production(in millions)

Shale, Resin and Plastics - 2015
• 225 new Plants or expansions in petrochemical processing – 75% in the Gulf Coast
• Cumulative capital investments totaling $138.0 billion in the United States
• By 2020, the cumulative impact will boost real GDP by 2.0% to 3.3%
• Creating from 2.7 million to as high as 3.6 million new jobs
• 62% of this investment is foreign direct investment
• 22 Billion pounds of PP/PE new production coming by 2020
Source: American Chemistry Council
www.imsw.comForeign Trade Zone, Logistics and Supply Chain Consulting
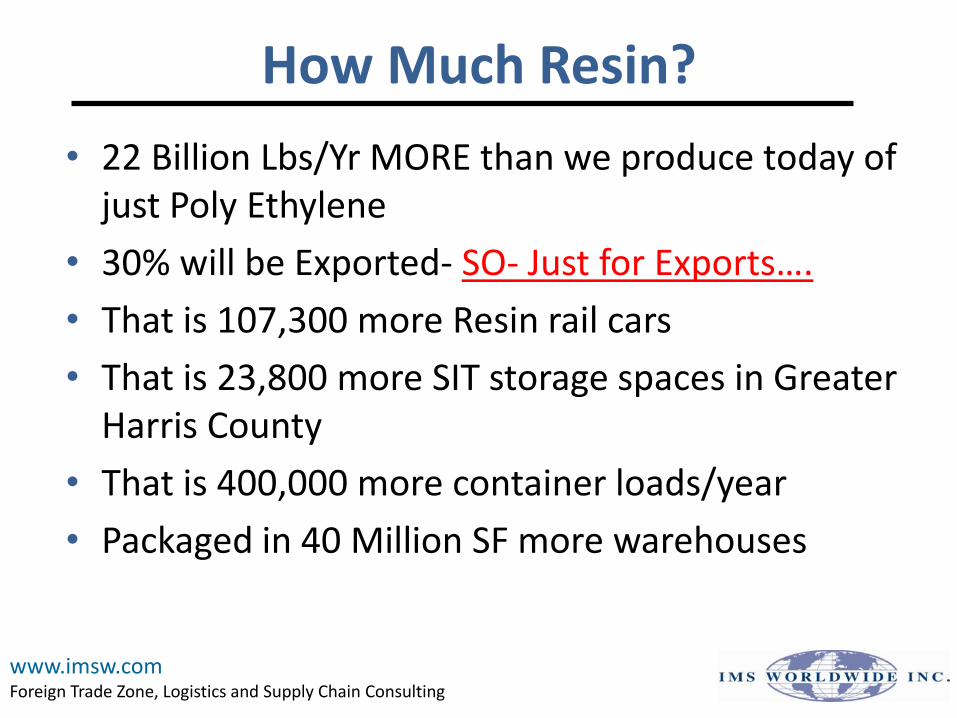
How Much Resin?
• 22 Billion Lbs/Yr MORE than we produce today of just Poly Ethylene
• 30% will be Exported- SO- Just for Exports….
• That is 107,300 more Resin rail cars
• That is 23,800 more SIT storage spaces in Greater Harris County
• That is 400,000 more container loads/year
• Packaged in 40 Million SF more warehouses
www.imsw.comForeign Trade Zone, Logistics and Supply Chain Consulting
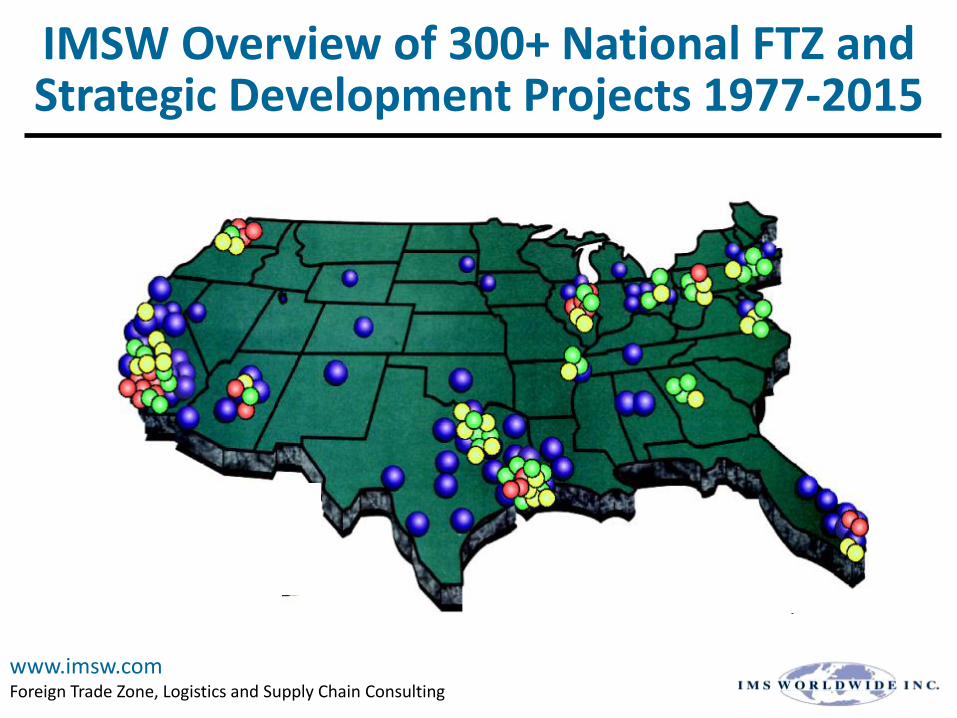
IMSW Overview of 300+ National FTZ and Strategic Development Projects 1977-2015
www.imsw.comForeign Trade Zone, Logistics and Supply Chain Consulting
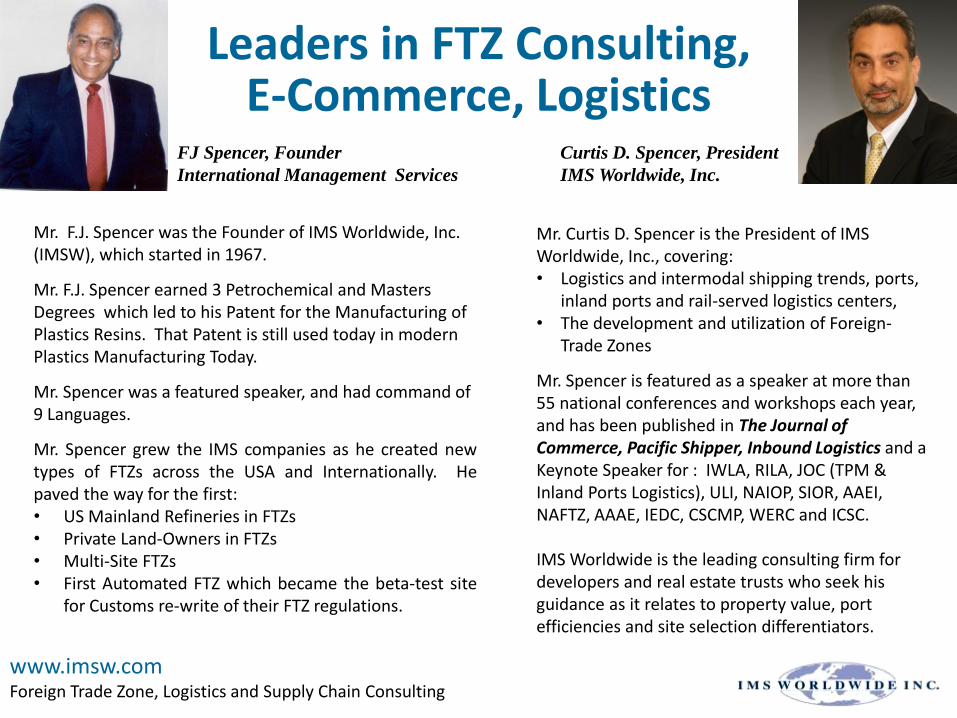
Leaders in FTZ Consulting, E-Commerce, Logistics
Mr. Curtis D. Spencer is the President of IMS Worldwide, Inc., covering: • Logistics and intermodal shipping trends, ports,
inland ports and rail-served logistics centers,• The development and utilization of Foreign-
Trade Zones
Mr. Spencer is featured as a speaker at more than 55 national conferences and workshops each year, and has been published in The Journal of Commerce, Pacific Shipper, Inbound Logistics and a Keynote Speaker for : IWLA, RILA, JOC (TPM & Inland Ports Logistics), ULI, NAIOP, SIOR, AAEI, NAFTZ, AAAE, IEDC, CSCMP, WERC and ICSC.
IMS Worldwide is the leading consulting firm for developers and real estate trusts who seek his guidance as it relates to property value, port efficiencies and site selection differentiators.
Curtis D. Spencer, President
IMS Worldwide, Inc.
FJ Spencer, Founder
International Management Services
Mr. F.J. Spencer was the Founder of IMS Worldwide, Inc. (IMSW), which started in 1967.
Mr. F.J. Spencer earned 3 Petrochemical and Masters Degrees which led to his Patent for the Manufacturing of Plastics Resins. That Patent is still used today in modern Plastics Manufacturing Today.
Mr. Spencer was a featured speaker, and had command of 9 Languages.
Mr. Spencer grew the IMS companies as he created newtypes of FTZs across the USA and Internationally. Hepaved the way for the first:• US Mainland Refineries in FTZs• Private Land-Owners in FTZs• Multi-Site FTZs• First Automated FTZ which became the beta-test site
for Customs re-write of their FTZ regulations.
www.imsw.comForeign Trade Zone, Logistics and Supply Chain Consulting
Thank You!
QUESTIONS?
www.imsw.comForeign Trade Zone, Logistics and Supply Chain Consulting
2015
JEREMY GILES President, Central Region
MAY 14
Drivers of Global Growth
37
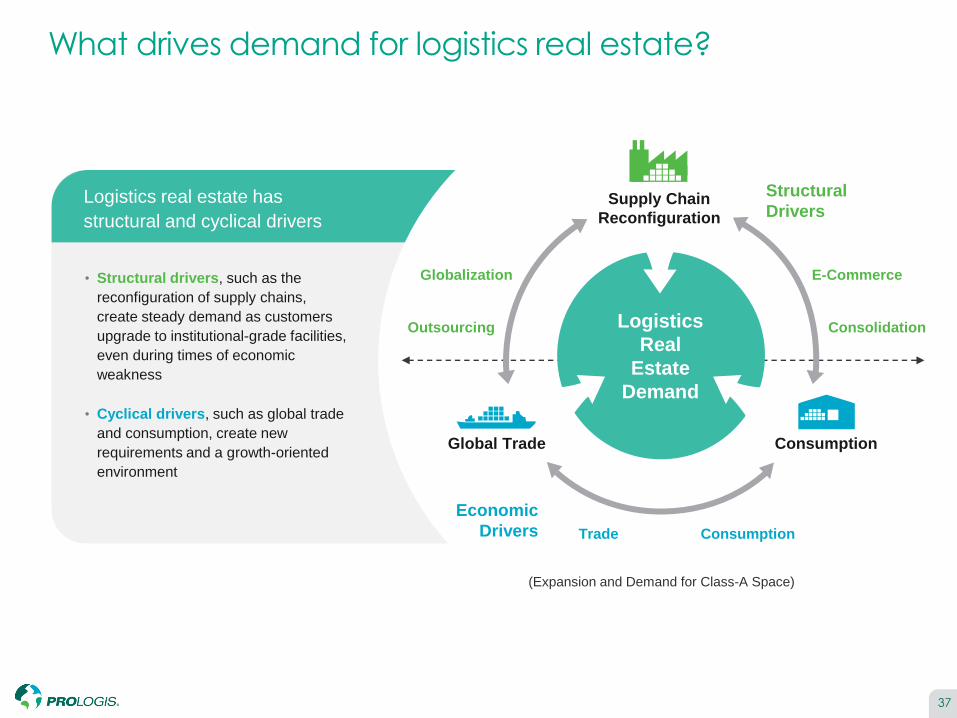
What drives demand for logistics real estate?
• Structural drivers, such as the
reconfiguration of supply chains,
create steady demand as customers
upgrade to institutional-grade facilities,
even during times of economic
weakness
• Cyclical drivers, such as global trade
and consumption, create new
requirements and a growth-oriented
environment
Logistics real estate has
structural and cyclical drivers
Logistics
Real
Estate
Demand
Consumption
Supply Chain
Reconfiguration
Global Trade
Trade Consumption
Globalization
Outsourcing Consolidation
E-Commerce
Economic
Drivers
Structural
Drivers
(Expansion and Demand for Class-A Space)
Logistics
Real
Estate
Demand

38
Macro & Mega Trends Driving Logistics
Source: U.S. Bureau of Economic Analysis, Prologis Research
0%
2%
4%
6%
8%
10%
12%
14%
198
0
198
5
199
0
199
5
200
0
200
5
201
0
imports
Trade as a % of economic activity, U.S.
Source: U.S. Bureau of Economic Analysis, Prologis Research
60%
61%
62%
63%
64%
65%
66%
67%
68%
69%
70%
198
0
198
5
199
0
199
5
200
0
200
5
201
0
Consumption as a % of economic activity, U.S.
Source: United Nations
Growth in urban as a % of total World population
(Bn people)
Source: Goldman Sachs
E-commerce as a % of store-based retail, U.S.
FORECAST
0%
2%
4%
6%
8%
10%
12%
200
0
200
1
200
2
200
3
200
4
200
5
200
6
200
7
200
8
200
9
201
0
201
1
201
2
201
3
201
4
201
5E
0%
10%
20%
30%
40%
50%
60%
70%
80%
0.01.02.03.04.05.06.07.08.09.0
10.0
195
0
195
5
196
0
196
5
197
0
197
5
198
0
198
5
199
0
199
5
200
0
200
5
201
0
201
5
202
0
202
5
203
0
203
5
204
0
204
5
205
0
Rural Urban % Urban
GlobalizationTrade to continue growing at a multiple of GDP
ConsumptionAffluence in emerging markets drives sizable consumer classes,
requiring new facilities
UrbanizationCustomers locating within/adjacent to population centers; higher
barriers to entry
Shifting Retail FormatsOmni-channel and e-commerce emphasize sophisticated supply
chains
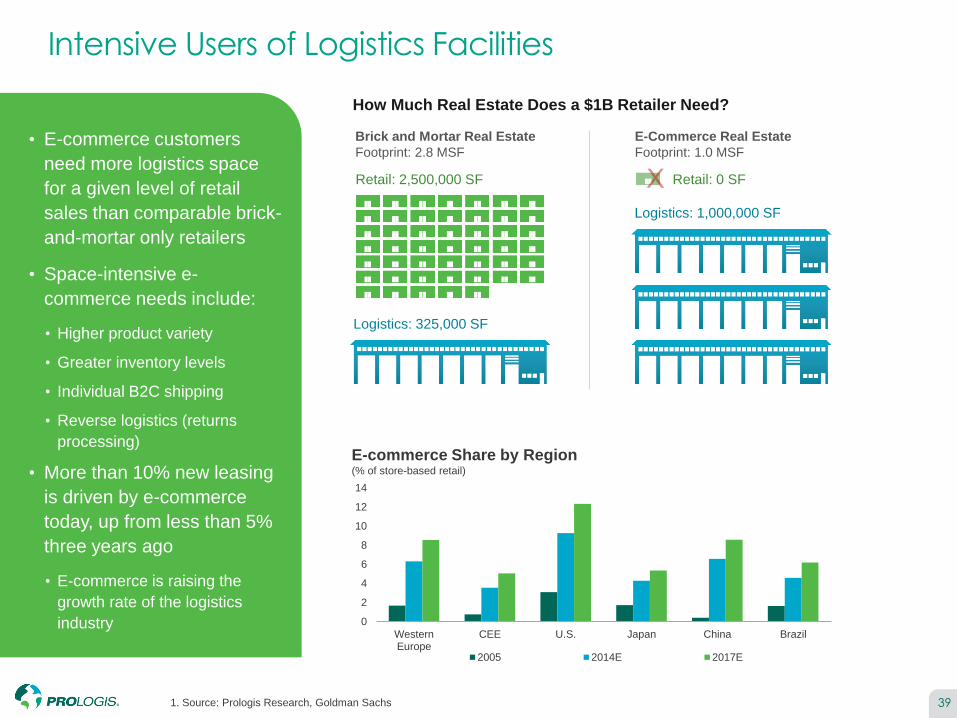
Intensive Users of Logistics Facilities
1. Source: Prologis Research, Goldman Sachs 39
• E-commerce customers
need more logistics space
for a given level of retail
sales than comparable brick-
and-mortar only retailers
• Space-intensive e-
commerce needs include:
• Higher product variety
• Greater inventory levels
• Individual B2C shipping
• Reverse logistics (returns
processing)
• More than 10% new leasing
is driven by e-commerce
today, up from less than 5%
three years ago
• E-commerce is raising the
growth rate of the logistics
industry 0
2
4
6
8
10
12
14
WesternEurope
CEE U.S. Japan China Brazil
2005 2014E 2017E
E-commerce Share by Region(% of store-based retail)
Retail: 0 SF
Logistics: 1,000,000 SF
Retail: 2,500,000 SF
Logistics: 325,000 SF
Brick and Mortar Real Estate
Footprint: 2.8 MSF
E-Commerce Real Estate
Footprint: 1.0 MSF
How Much Real Estate Does a $1B Retailer Need?
40
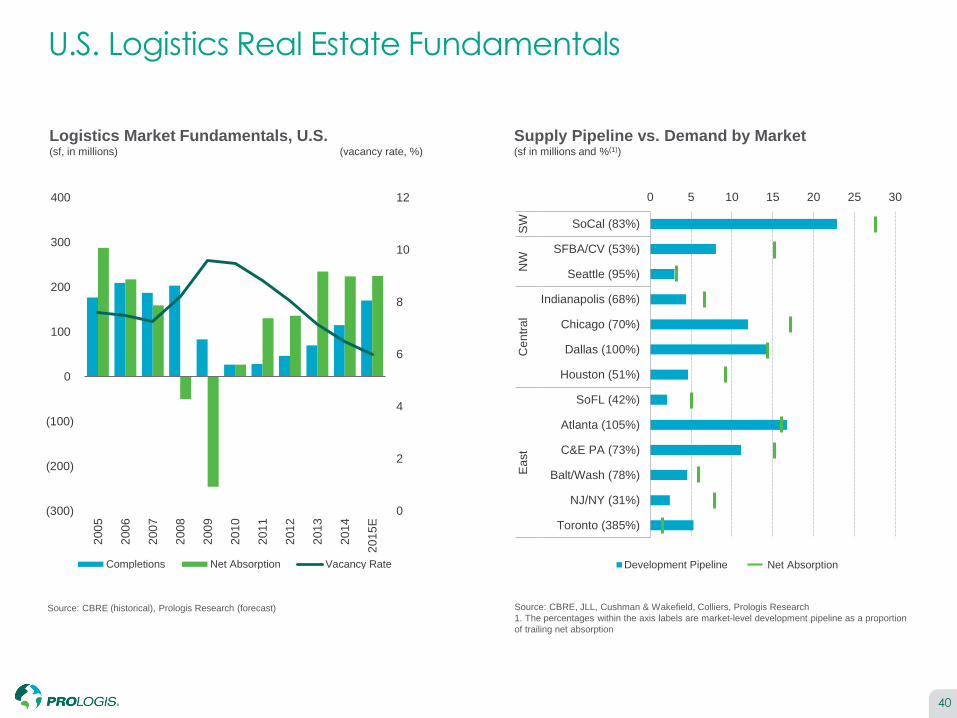
U.S. Logistics Real Estate Fundamentals
Source: CBRE, JLL, Cushman & Wakefield, Colliers, Prologis Research
1. The percentages within the axis labels are market-level development pipeline as a proportion
of trailing net absorption
Supply Pipeline vs. Demand by Market(sf in millions and %(1))
Logistics Market Fundamentals, U.S.(sf, in millions) (vacancy rate, %)
Source: CBRE (historical), Prologis Research (forecast)
0
2
4
6
8
10
12
(300)
(200)
(100)
0
100
200
300
400
200
5
200
6
200
7
200
8
200
9
201
0
201
1
201
2
201
3
201
4
201
5E
Completions Net Absorption Vacancy Rate
0 5 10 15 20 25 30
Toronto (385%)
NJ/NY (31%)
Balt/Wash (78%)
C&E PA (73%)
Atlanta (105%)
SoFL (42%)
Houston (51%)
Dallas (100%)
Chicago (70%)
Indianapolis (68%)
Seattle (95%)
SFBA/CV (53%)
SoCal (83%)
Ea
st
Cen
tra
lN
WS
W
Development Pipeline Net Absorption
41
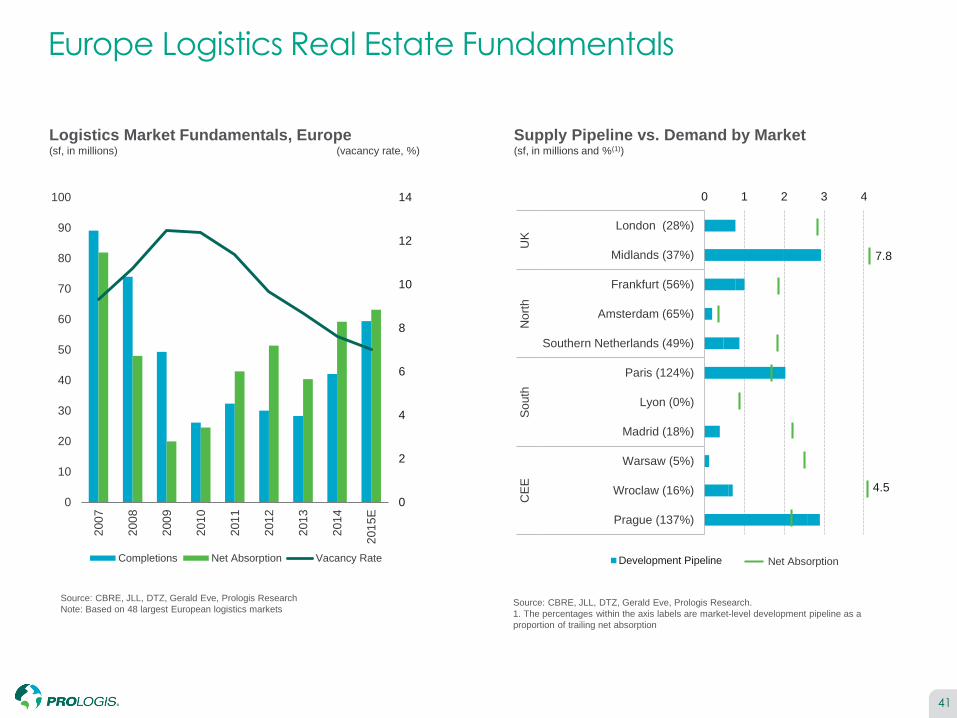
Europe Logistics Real Estate Fundamentals
Logistics Market Fundamentals, Europe(sf, in millions) (vacancy rate, %)
Supply Pipeline vs. Demand by Market (sf, in millions and %(1))
Source: CBRE, JLL, DTZ, Gerald Eve, Prologis Research
Note: Based on 48 largest European logistics marketsSource: CBRE, JLL, DTZ, Gerald Eve, Prologis Research.
1. The percentages within the axis labels are market-level development pipeline as a
proportion of trailing net absorption
0
2
4
6
8
10
12
14
0
10
20
30
40
50
60
70
80
90
100
200
7
200
8
200
9
201
0
201
1
201
2
201
3
201
4
201
5E
Completions Net Absorption Vacancy Rate
0 1 2 3 4
Prague (137%)
Wroclaw (16%)
Warsaw (5%)
Madrid (18%)
Lyon (0%)
Paris (124%)
Southern Netherlands (49%)
Amsterdam (65%)
Frankfurt (56%)
Midlands (37%)
London (28%)
CE
ES
outh
Nort
hU
K
Development Pipeline Net Absorption
7.8
4.5
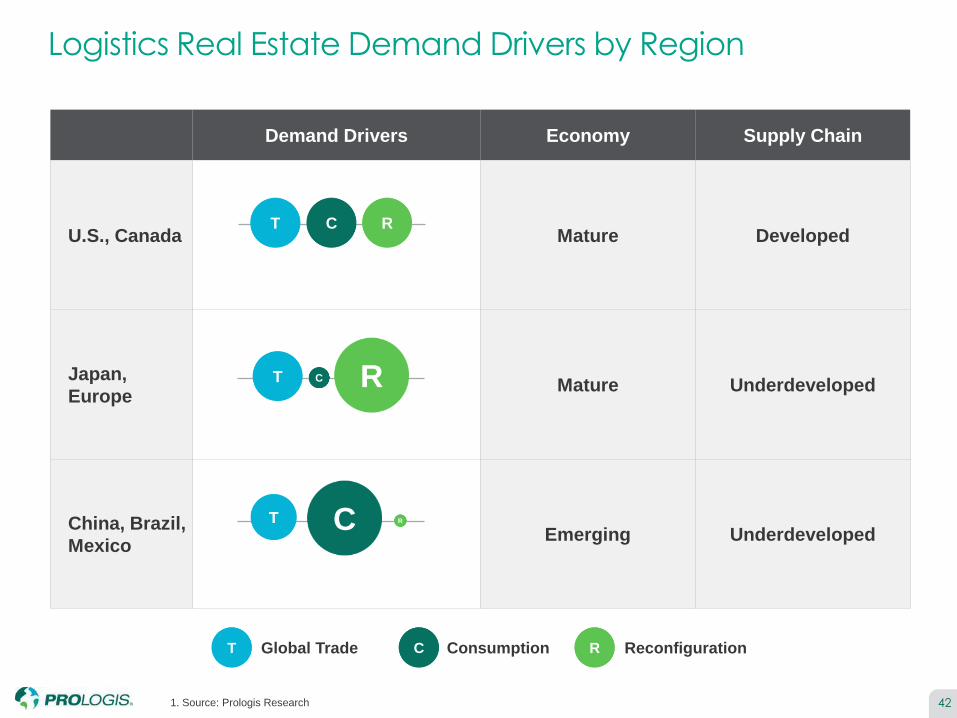
421. Source: Prologis Research
Logistics Real Estate Demand Drivers by Region
Demand Drivers Economy Supply Chain
U.S., Canada Mature Developed
Japan,
EuropeMature Underdeveloped
China, Brazil,
MexicoEmerging Underdeveloped
CT R
CT R
CT R
ConsumptionGlobal Trade ReconfigurationT C R
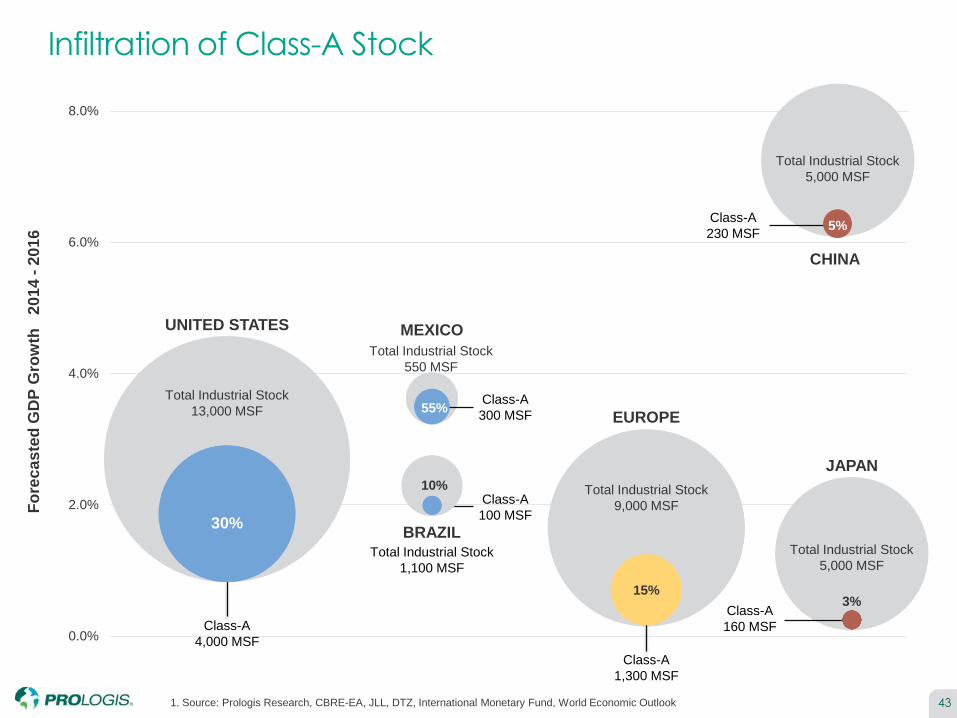
431. Source: Prologis Research, CBRE-EA, JLL, DTZ, International Monetary Fund, World Economic Outlook
Infiltration of Class-A StockF
ore
ca
ste
d G
DP
Gro
wth
2
01
4 -
20
16
0.0%
2.0%
4.0%
6.0%
8.0%
Class-A
4,000 MSF
UNITED STATES
EUROPE
JAPAN
Class-A
1,300 MSF
Total Industrial Stock
9,000 MSF
Class-A
160 MSF
Total Industrial Stock
5,000 MSF
3%
Class-A
300 MSF
Total Industrial Stock
550 MSF
Class-A
100 MSF
Total Industrial Stock
1,100 MSF
10%
MEXICO
BRAZIL
15%
55%Total Industrial Stock
13,000 MSF
30%
Class-A
230 MSF
Total Industrial Stock
5,000 MSF
CHINA
5%

44
Current 2015 Development Underway