Embed Size (px)
Citation preview
Journal of Neuroscience Methods 152 (2006) 116–129
Custom-designed high-density conformal planar multielectrode arraysfor brain slice electrophysiology
Ghassan Gholmieh a,∗,1, Walid Soussou b,1, Martin Han a,c,1, Ashish Ahuja c, Min-Chi Hsiao a,Dong Song a, Armand R. Tanguay Jr. a,b,c, Theodore W. Berger a,b
a Department of Biomedical Engineering, University of Southern California, Los Angeles, CA 90089-1451, USAb Neuroscience Program, University of Southern California, Los Angeles, CA 90089-2520, USA
c Department of Electrical Engineering, University of Southern California, Los Angeles, CA 90089, USA
Received 10 November 2004; received in revised form 20 July 2005; accepted 30 August 2005
Abstract
Multielectrode arrays have enabled electrophysiological experiments exploring spatio-temporal dynamics previously unattainable with singleelectrode recordings. The finite number of electrodes in planar MEAs (pMEAs), however, imposes a trade-off between the spatial resolution andthe recording area. This limitation was circumvented in this paper through the custom design of experiment-specific tissue-conformal high-densityphsd2efpo©
K
1
anteareJ
H2
0d
MEAs (cMEAs). Four configurations were presented as examples of cMEAs designed for specific stimulation and recording experiments in acuteippocampal slices. These cMEAs conformed in designs to the slice cytoarchitecture whereas their high-density provided high spatial resolution forelective stimulation of afferent pathways and current source density (CSD) analysis. The cMEAs have 50 or 60 �m center-to-center inter-electrodeistances and were manufactured on glass substrates by photolithographically defining ITO leads, insulating them with silicon nitride and SU-8000 epoxy-based photoresist and coating the etched electrode tips with gold or platinum. The ability of these cMEAs to stimulate and recordlectrophysiological activity was demonstrated by recording monosynaptic, disynaptic, and trisynaptic field potentials. The conformal designs alsoacilitated the selection of the optimal electrode locations for stimulation of specific afferent pathways (Schaffer collaterals; medial versus lateralerforant path) and recording the corresponding responses. In addition, the high-density of the arrays enabled CSD analysis of laminar profilesbtained through sequential stimulation along the CA1 pyramidal tree.
2005 Elsevier B.V. All rights reserved.
eywords: Planar; Conformal; High-density; Multielectrode array; Current source density analysis; Hippocampal slice
. Introduction
The capability of simultaneously recording electrical activityt multiple sites in vitro has enabled investigations of neuronaletwork dynamics previously not possible with single elec-rode recordings (Droge et al., 1986; Singer, 2000; Soussout al., in press; Warland et al., 1997). Planar multielectroderrays (pMEAs) present one currently available technology toecord from multiple neurons simultaneously in vitro (Duportt al., 1999; Egert et al., 1998; Gross and Schwalm, 1994;ahnsen et al., 1999; Jimbo and Robinson, 2000; Novak and
∗ Corresponding author at: University of Southern California, 3614 Watts Way,NB 403, Los Angeles, CA 90089-2520, USA. Tel.: +1 213 740 8061; fax: +113 740 5687; mobile: +3109770589.
E-mail address: [email protected] (G. Gholmieh).1 These authors contributed equally to this paper.
Wheeler, 1988; Oka et al., 1999; Stoppini et al., 1997). Thedistribution of pMEA electrodes captures the spatio-temporaldynamics of neuronal activity, while their transparent con-ductive leads permit microscopic visualization of the relativeposition of the tissue with respect to electrodes. Planar MEAelectrodes can be used for both recording and stimulation,thereby providing self-contained sterile systems with no needfor external electrodes (Gross et al., 1993; Novak and Wheeler,1988).
Low cost of photolithographic fabrication coupled withadvances in signal acquisition hardware and fast computerswith large data storage, has led several groups to independentlydevelop their own pMEAs. These investigators developedthin-film pMEAs in a variety of configurations to monitorextracellular electrophysiological activity in acute and cul-tured slices from different brain areas: retina (Grumet et al.,2000; Meister et al., 1994), spinal cord (Borkholder et al.,
165-0270/$ – see front matter © 2005 Elsevier B.V. All rights reserved.oi:10.1016/j.jneumeth.2005.08.021
G. Gholmieh et al. / Journal of Neuroscience Methods 152 (2006) 116–129 117
1997), and hippocampus (Boppart et al., 1992; Egert et al.,1998; Heuschkel et al., 2002; Novak and Wheeler, 1988;Oka et al., 1999; Thiebaud et al., 1999). In addition, severalcommercial planar multielectrode recording systems haverecently become available such as MEA60 from Multi ChannelSystems, Reutlingen, Germany and MED64 from Panasonic,CA, USA.
The advantages offered by pMEAs over traditional extra-cellular pulled-glass or sharp-wire electrodes depend on thenumber of electrodes, which is limited by current technologicalconstraints, such as electrode and lead overcrowding, cross-talk,connector design, and data acquisition. These limitations createa trade-off between spatial sampling resolution and coveragearea, preventing stimulation and recording from every locationof a tissue preparation. Most of these currently available pMEAshave electrodes distributed in square matrix configurationswith relatively large inter-electrode spacing (greater or equal to100 �m). Since neural cytoarchitecture changes dramaticallyin the spatial domain in a non-symmetrical fashion, theselow-density geometrically regular electrode arrangements donot provide the necessary resolution for selectively stimulatingafferent pathways or flexibility in recording from small subre-gions. Furthermore, the low electrode density does not permitadequate current source density (CSD) analysis (Freeman andNicholson, 1975; Nicholson and Freeman, 1975; Nicholsonand Llinas, 1975; Wheeler and Novak, 1986). Therefore,tticia
afoctcaalf3saddCfttt
sah
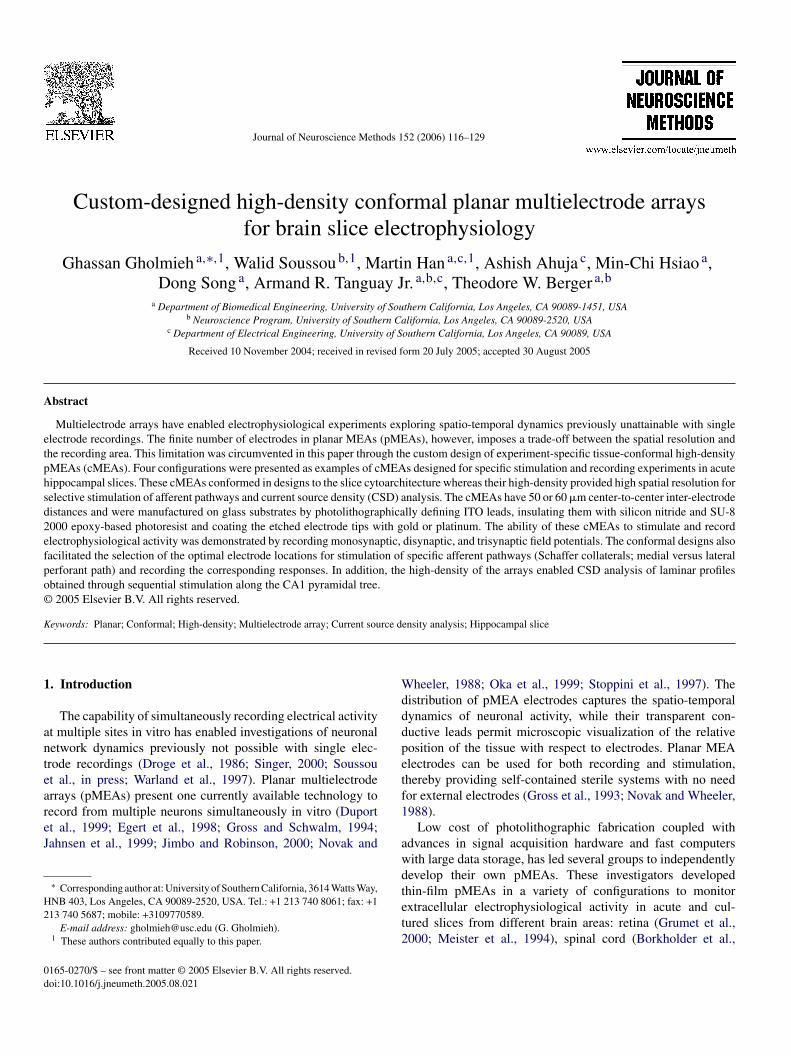
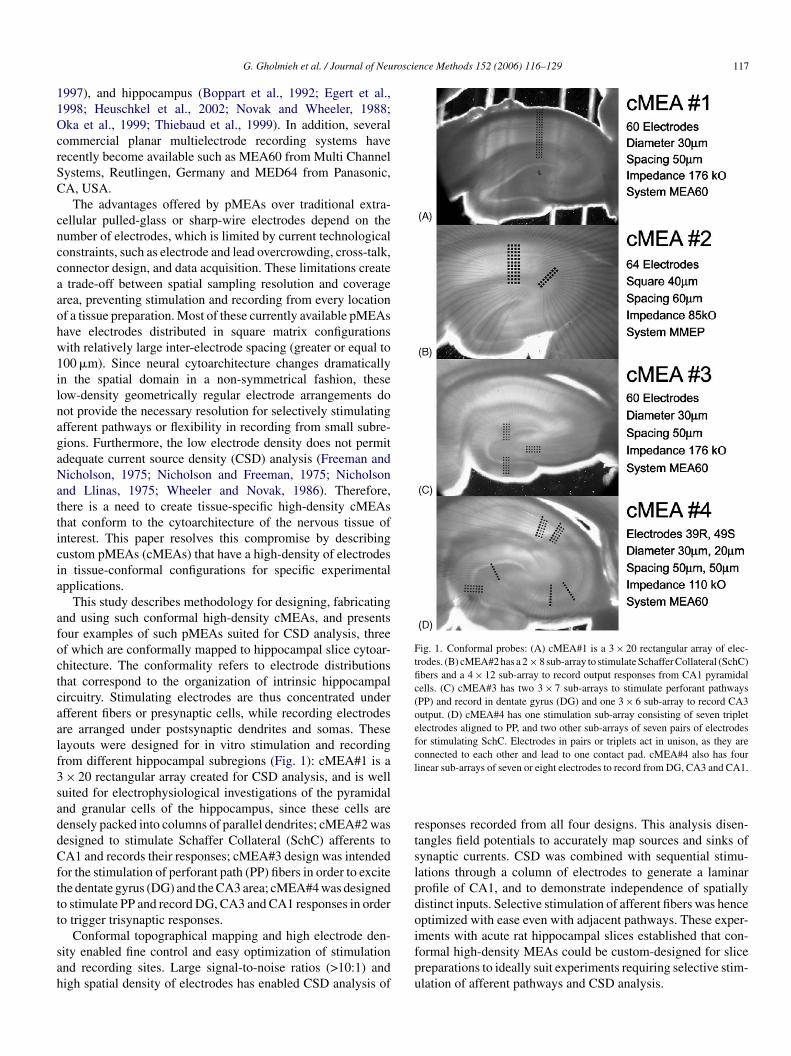
Fig. 1. Conformal probes: (A) cMEA#1 is a 3 × 20 rectangular array of elec-trodes. (B) cMEA#2 has a 2 × 8 sub-array to stimulate Schaffer Collateral (SchC)fibers and a 4 × 12 sub-array to record output responses from CA1 pyramidalcells. (C) cMEA#3 has two 3 × 7 sub-arrays to stimulate perforant pathways(PP) and record in dentate gyrus (DG) and one 3 × 6 sub-array to record CA3output. (D) cMEA#4 has one stimulation sub-array consisting of seven tripletelectrodes aligned to PP, and two other sub-arrays of seven pairs of electrodesfor stimulating SchC. Electrodes in pairs or triplets act in unison, as they areconnected to each other and lead to one contact pad. cMEA#4 also has fourlinear sub-arrays of seven or eight electrodes to record from DG, CA3 and CA1.
responses recorded from all four designs. This analysis disen-tangles field potentials to accurately map sources and sinks ofsynaptic currents. CSD was combined with sequential stimu-lations through a column of electrodes to generate a laminarprofile of CA1, and to demonstrate independence of spatiallydistinct inputs. Selective stimulation of afferent fibers was henceoptimized with ease even with adjacent pathways. These exper-iments with acute rat hippocampal slices established that con-formal high-density MEAs could be custom-designed for slicepreparations to ideally suit experiments requiring selective stim-ulation of afferent pathways and CSD analysis.
here is a need to create tissue-specific high-density cMEAshat conform to the cytoarchitecture of the nervous tissue ofnterest. This paper resolves this compromise by describingustom pMEAs (cMEAs) that have a high-density of electrodesn tissue-conformal configurations for specific experimentalpplications.
This study describes methodology for designing, fabricatingnd using such conformal high-density cMEAs, and presentsour examples of such pMEAs suited for CSD analysis, threef which are conformally mapped to hippocampal slice cytoar-hitecture. The conformality refers to electrode distributionshat correspond to the organization of intrinsic hippocampalircuitry. Stimulating electrodes are thus concentrated underfferent fibers or presynaptic cells, while recording electrodesre arranged under postsynaptic dendrites and somas. Theseayouts were designed for in vitro stimulation and recordingrom different hippocampal subregions (Fig. 1): cMEA#1 is a× 20 rectangular array created for CSD analysis, and is well
uited for electrophysiological investigations of the pyramidalnd granular cells of the hippocampus, since these cells areensely packed into columns of parallel dendrites; cMEA#2 wasesigned to stimulate Schaffer Collateral (SchC) afferents toA1 and records their responses; cMEA#3 design was intended
or the stimulation of perforant path (PP) fibers in order to excitehe dentate gyrus (DG) and the CA3 area; cMEA#4 was designedo stimulate PP and record DG, CA3 and CA1 responses in ordero trigger trisynaptic responses.
Conformal topographical mapping and high electrode den-ity enabled fine control and easy optimization of stimulationnd recording sites. Large signal-to-noise ratios (>10:1) andigh spatial density of electrodes has enabled CSD analysis of

118 G. Gholmieh et al. / Journal of Neuroscience Methods 152 (2006) 116–129
2. Materials and methods
Conformal pMEAs that are hippocampal tissue specific werefabricated. These conformal pMEAs were built to fit into twoMEA setups in order to speed up the functional characterizationand demonstrate the transferability of the technology.
2.1. Conformal pMEA design and fabrication
Cytoarchitectural measurements were taken from 5 to 10photomicrographs of hippocampal slices (8–10 weeks old rat).Pyramidal cell layers were extracted and experiment-specificpMEA layouts were superimposed using image analysis soft-ware (Illustrator, Adobe, CA, USA). Small groups of electrodeswere arranged in sub-arrays perpendicular to their target’s celllayer. These electrode arrangements were then laid out usingCAD software (L-edit software, Tanner Inc.) where leads andcontact arrangements matching one of the electrophysiologyrecording setups were added for mask design. The cMEAs werethen manufactured using standard photolithographic techniquesfor the selective patterning of the individual layers of the deviceon a glass substrate. The end product had ITO leads insulatedwith silicon nitride and SU-8 with the electrode tips coated withgold. The electrodes impedance were measured at 1 kHz (Hanet al., 2002).
2
meeidiTsc(s(aM
ctgccTtwuGma
2.3. Acute slice preparation
Young adult male Sprague Dawley rats (1–3 months old or150–250 g) were anaesthetized with halothane prior to decapi-tation. Each hippocampus was dissected from the brain and cuttransversely along the septo-temporal axis into a single blockwith entorhinal cortex preservation under cold cutting artificialcerebrospinal fluid (aCSF) consisting of: (in mM) NaCl, 128;KCl, 2.5; NaH2PO4, 1.25; NaHCO3, 26; glucose, 10; MgSO4,2; ascorbic acid, 2; CaCl2, 2, and oxygenated with a mixture of95% O2 and 5% CO2 to maintain physiological pH of 7.2. Thetissue blocks were then mounted onto a vibratome (VT1000S,Leica, Germany) with SuperGlue and 400–500 �m thick sliceswere collected. The slices were incubated at 32 ◦C in an aCSFfor at least an hour before being carefully positioned on anMEA over an inverted microscope (DMIRB, Leica, Germany).The slice position on the MEAs was held constant by a nylonmesh strung across a platinum ring and was documented witha digital camera (Spot RT, Diagnostic Instruments, MI, USA).During the entire experimental duration on the MEAs, sliceswere submerged and perfused at a constant flow rate of 2 ml/minwith aCSF reduced in its MgSO4 concentration to 1 mM, andwas supplemented with 5 �M picrotoxin in the trisynapticexperiments.
2.4. Electrophysiology
uetlpilst
2
Nr
I
wiltdya5d2tfi
.2. Multielectrode setups
Two multielectrode recording systems were utilized: theulti-electrodes-array system (MEA60) and the multi-micro-
lectrode-plate system (MMEP). Each setup consisted of anlectrode array, amplifiers, data acquisition hardware, andts corresponding software. The manufactured pMEAs wereesigned to interface with one of these two setups. The MMEPs a 64-electrode system (Gross et al., 1993; University of Northexas, http://www.cnns.org). Data was amplified 2500× in twotages (Plexon Preamplifiers, http://www.plexoninc.com) withutoff filters at 8 Hz and 3 kHz and was then sampled at 7.35 kHzMicrostar DAQ card, http://www.mslabs.com, USA). Separatetimulation boxes (Iso-Flex, AMPI, Israel) allowed programmedMaster-8, AMPI, Israel) bipolar stimulation. The stimulationnd recording processes were controlled using a custom writtenatlab script.The MEA60 electrophysiological recording system is a
ommercially available turnkey system (Multi Channel Sys-ems, Reutlingen, Germany). It consists of amplifiers (1200×ain with a cutoff filters at 0.1–5 kHz), a data acquisitionard (10–25 kHz sampling frequency per channel), an eight-hannel stimulation box, and collection and analysis software.he software enabled extraction of waveform amplitude and
ime course display. Further analysis of recorded potentialsas conducted in Matlab (The Mathworks, Natick, MA, USA)sing the MEAtools toolbox from the University of Freiburgermany (http://www.brainworks.unifreiburg.de/projects/mea/-eatools/overview.htm), and custom written scripts for spike
mplitude calculations and CSD analysis.
Biphasic stimulation of the afferent pathways was performedsing either external (bipolar) or internal (monopolar/bipolar)lectrodes. External electrodes refer to twisted Nichrome wireshat were inserted in the afferent pathway using a micromanipu-ator. The internal electrodes, on the other hand, refer to single orairs of microelectrodes in the pMEA that were used for currentnjection. All stimulation pulses were biphasic with each phaseasting 100 �s. The stimulation protocol consisted of repeatedingle or paired pulses delivered to the afferent pathway, whilehe responses were recorded by the pMEA.
.5. Current source density analysis
CSD was calculated using equation (D3) from Freeman andicholson (Freeman and Nicholson, 1975) was applied to the
ecorded field potentials (FPs):
m = −σx(−2φx−2h + φx−h + 2φx + φx+h − 2φx+2h)/7 (1)
here Im is the current density, φ is the FP at location x, σ
s an estimate of biological tissue conductivity along the ana-yzed dimension, and h is the spatial sampling interval alonghat dimension. One-dimensional CSD was preferred to two-imensional CSD because the five points CSD equation (D3)ielded smoother results. This equation could not be appliedlong the two planar dimensions because the cMEAs do not have× 5 electrode grids. CSD was calculated using raw and filteredata (low pass spatially filtered field potentials (Shimono et al.,002)). There was no difference between the two sets becausehe D3 equation already includes a low pass smoothing spatiallter (Lanczos, 1956).

G. Gholmieh et al. / Journal of Neuroscience Methods 152 (2006) 116–129 119
FP and CSD topographical activity maps were generated inMatlab by assigning a color scheme to the measurement rangeand applying piecewise cubic Hermite interpolation betweenvertical electrodes data values. The 10 kHz sampling rate elim-inated the need for interpolation along the time domain. Dataoverlays on slice images were accomplished in Photoshop(Adobe, San Jose, CA, USA).
3. Results
3.1. Fabrication results
Four configurations of high-density cMEA were designedand manufactured to conform to hippocampal slice cytoarchi-tecture in order stimulate and record electrical activity in specificareas. The impedance measurements were measured at 1 kHzin an aCSF analyte in order to mimic experimental conditions.The cMEA#1 is a 3 × 20 design (Fig. 1A). Each electrode has28 �m diameter with 50 �m inter-electrode distance (176 k�).The 3 × 20 rectangular was designed for electrophysiologicalinvestigations of the pyramidal and granular cells of the hip-pocampus. The cMEA#2 is a 2 × 8 + 4 × 12 design (Fig. 1B).The electrodes had a square size of 36 �m × 36 �m (85 k�)and an inter-electrode distance of 60 �m. The 2 × 8 and the4 × 12 sub-array were intended for the Schaffer Collateral path-way stimulation optimization and for the recoding of the cor-r32TsusC(tppeeiu(cacbie1tStC
(t
period of 1 week. However, once all fabrication parameters weredefined, pMEAs could be reproducibly manufactured and over30 pMEAs have been produced. It is worth noting that the useof SiNx films as etch masks and etch-stops increased productionyield due to their superior adhesion to the substrates and theirresistance to etchants, in contrast to well-processed photore-sist mask layers, which suffered from undercuts. This additionaluse of SiNx as wet etching mask did not increase fabricationtime since multiple substrates can be deposited simultaneouslywith each manufacturing cycle. These pMEAs were durable, andsome have been used to record useful signals in over 30 experi-ments, each consisting of hundreds of stimulations. Electrodeimpedance and stimulation capacity varied depending on tipdesign. Electrochemical characterization of these electrodes byimpedance measurements, cyclic voltammetry and current injec-tion limits determination has been previously described (Han etal., 2002).
3.2. Electrophysiological recordings from the arrays usingexternal stimulation
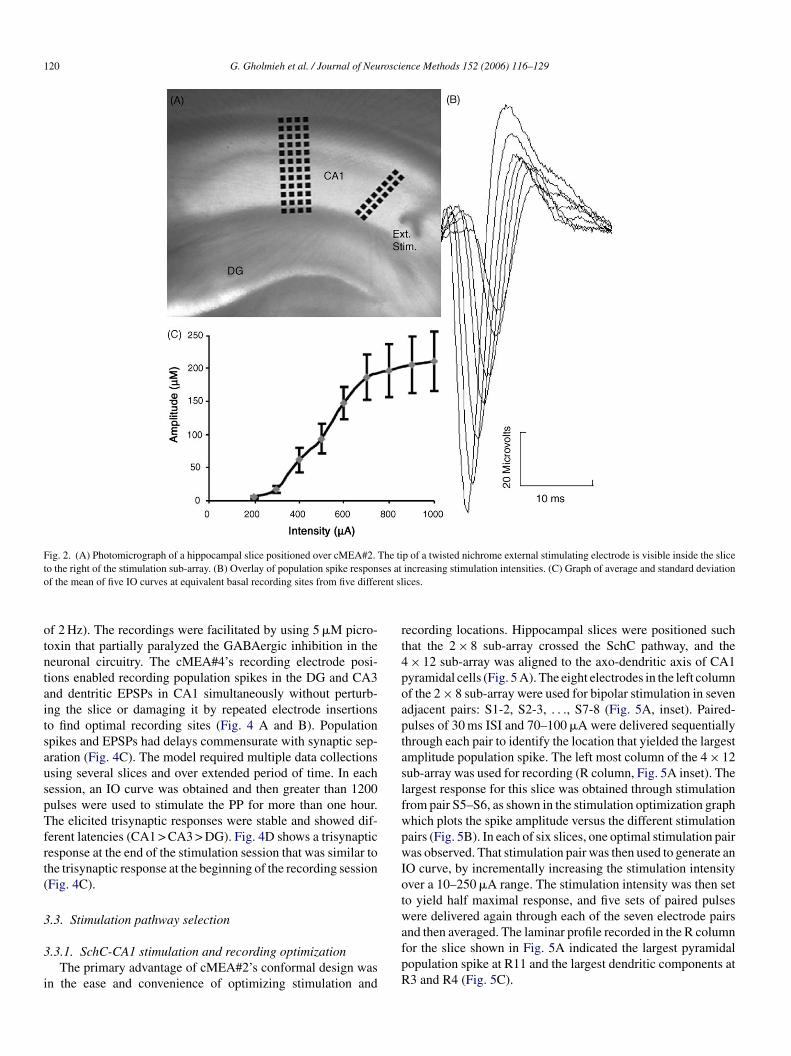
The ability of cMEAs to record extracellular FPs wasassessed by stimulating acute slices with external electrodesmade of twisted nichrome wire. Using cMEA#2, monosynap-tic input/output (IO) curves were recorded in CA1 in responseto SchC stimulation with electrical pulses of increasing intensi-tapttrdpEtirods
rwswt(cp
rtrtbe
esponding CA1 response respectively. The cMEA#3 is the× 7 + 3 × 7 + 3 × 6 design (Fig. 1C). Each electrode had a8 �m diameter with 50 �m inter-electrode distance (176 k�).his pMEA was designed in such a manner that 3 × 7 + 3 × 7ub-arrays would be optimal for the medial and lateral PP stim-lation and for the recording of the DG response. The 3 × 6ub-array was placed in the CA3 region in order to recordA3 disynaptic response resulting from the PP stimulation
PP → DG → CA3). The cMEA#4 (Fig. 1D) is complex arrayhat was designed to record the trisynaptic activity along the hip-ocampal circuitry and to perform a proof of concept of corticalrosthetics by replacing the CA3 functionality in vitro (Bergert al., 2001, 2005b, 2005a). The cMEA#4 includes two differ-nt circular pad sizes: (1) 28 �m diameter pads with a 50 �mnter-electrode spacing grouped in series to form sets of stim-lating pads in dentate gyrus (DG) (three at a time) and CA1two at a time); (2) 36 �m diameter pads also with a 50 �menter-to-center spacing (110 k�) for recording the trisynapticctivity in DG, CA3, and CA1. The stimulating electrodes wereonnected in pairs or triplets to allow larger stimulation currentsecause it is believed that increased perimeter to area ratio min-mizes the effect of the inhomogeneous charge distribution andnhances diffusive flux to the electrode edge (Rubinstein et al.,987; Stulik et al., 2000). A sub-array of seven triplets was posi-ioned to stimulate PP, and two sub-arrays of seven pairs targetedchC. Linear sub-arrays of seven to eight electrodes conformed
o record outputs from primary excitatory cells in DG, CA3 andA1.
Due to the large size of the pMEA glass support49 mm × 49 mm × 1 mm), up to six arrays can be manufac-ured at one time in academic fabrication facilities over the
ies that ranged from 200 to 1000 �A (Fig. 2 ). The output wasmeasure of the corresponding FP amplitude recorded in the
yramidal cell layer, and calculated as the difference betweenhe recorded waveform’s minimum and maximum. The signal-o-noise ratio exceeded 10:1, where noise was calculated asoot-mean-square (RMS) of the potential before stimulus. Well-efined population spikes overriding excitatory postsynapticotentials (EPSP) were observed at high stimulation intensities.lectrodes on the basal side of the pyramidal layer recorded
he largest population spikes, whose maximum amplitudes weren the range 150–250 �V. Fig. 2B shows an overlay of sampleesponses at different intensities, and Fig. 2C plots the averagef five IO curves at equivalent basal recording sites from fiveifferent slices. Response amplitude increased linearly until itaturated at higher stimulation intensities.
Monosynaptic and disynaptic responses were similarlyecorded from DG and CA3 respectively by stimulating PPith external electrodes (Fig. 3 ). The stimulation protocol con-
isted of paired pulses with 30 ms inter-stimulus intervals (ISI),hich facilitated disynaptic responses. Monosynaptic popula-
ion spikes were recorded in the dorsal and ventral blades of DGFig. 3A and B). Disynaptic responses in CA3 had spike laten-ies in the range 6–9 ms in relation to the DG monosynapticopulation spike (Fig. 3C).
The cMEA#4 was designed to record the monosynapticesponse of the DG, disynaptic response in the CA3 area andrisynaptic response in the CA1 when the PP is stimulated. Theecordings were used to build a nonlinear dynamic model ofhe CA3 (Berger et al., 2005a; Gholmieh et al., 2002, 2003)y stimulating the PP intermittently with Poisson-distributedlectrical pulses (random intervals with an average frequency
120 G. Gholmieh et al. / Journal of Neuroscience Methods 152 (2006) 116–129
Fig. 2. (A) Photomicrograph of a hippocampal slice positioned over cMEA#2. The tip of a twisted nichrome external stimulating electrode is visible inside the sliceto the right of the stimulation sub-array. (B) Overlay of population spike responses at increasing stimulation intensities. (C) Graph of average and standard deviationof the mean of five IO curves at equivalent basal recording sites from five different slices.
of 2 Hz). The recordings were facilitated by using 5 �M picro-toxin that partially paralyzed the GABAergic inhibition in theneuronal circuitry. The cMEA#4’s recording electrode posi-tions enabled recording population spikes in the DG and CA3and dentritic EPSPs in CA1 simultaneously without perturb-ing the slice or damaging it by repeated electrode insertionsto find optimal recording sites (Fig. 4 A and B). Populationspikes and EPSPs had delays commensurate with synaptic sep-aration (Fig. 4C). The model required multiple data collectionsusing several slices and over extended period of time. In eachsession, an IO curve was obtained and then greater than 1200pulses were used to stimulate the PP for more than one hour.The elicited trisynaptic responses were stable and showed dif-ferent latencies (CA1 > CA3 > DG). Fig. 4D shows a trisynapticresponse at the end of the stimulation session that was similar tothe trisynaptic response at the beginning of the recording session(Fig. 4C).
3.3. Stimulation pathway selection
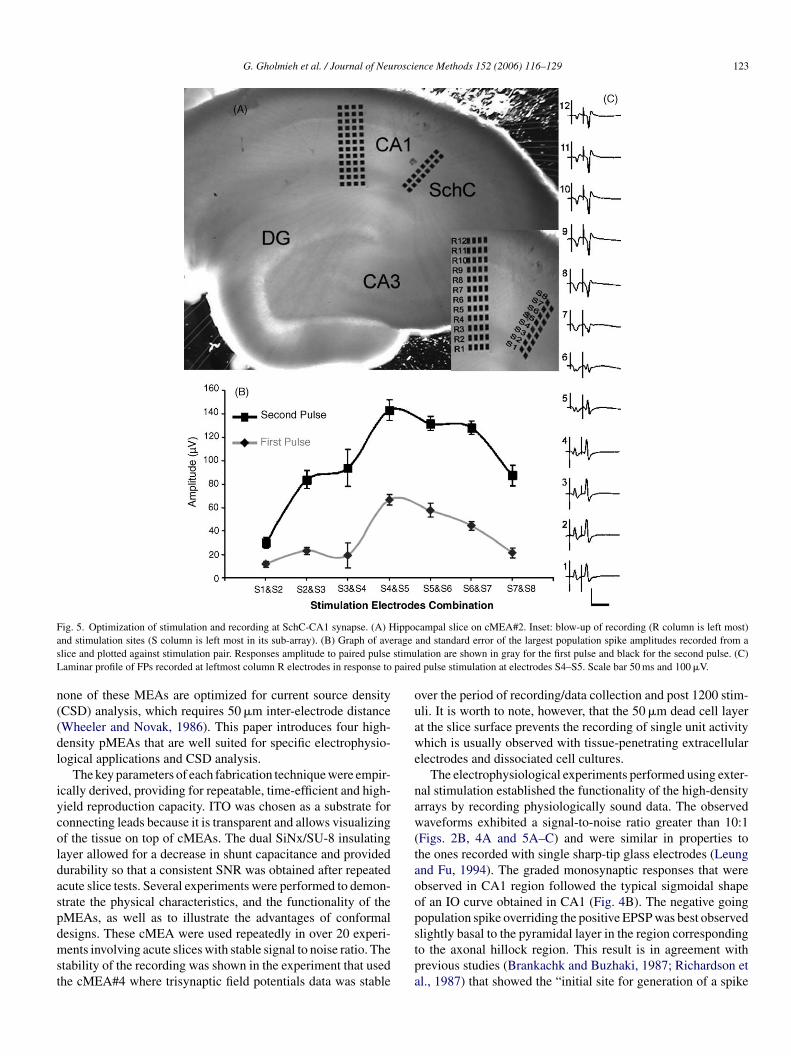
3.3.1. SchC-CA1 stimulation and recording optimizationThe primary advantage of cMEA#2’s conformal design was
in the ease and convenience of optimizing stimulation and
recording locations. Hippocampal slices were positioned suchthat the 2 × 8 sub-array crossed the SchC pathway, and the4 × 12 sub-array was aligned to the axo-dendritic axis of CA1pyramidal cells (Fig. 5 A). The eight electrodes in the left columnof the 2 × 8 sub-array were used for bipolar stimulation in sevenadjacent pairs: S1-2, S2-3, . . ., S7-8 (Fig. 5A, inset). Paired-pulses of 30 ms ISI and 70–100 �A were delivered sequentiallythrough each pair to identify the location that yielded the largestamplitude population spike. The left most column of the 4 × 12sub-array was used for recording (R column, Fig. 5A inset). Thelargest response for this slice was obtained through stimulationfrom pair S5–S6, as shown in the stimulation optimization graphwhich plots the spike amplitude versus the different stimulationpairs (Fig. 5B). In each of six slices, one optimal stimulation pairwas observed. That stimulation pair was then used to generate anIO curve, by incrementally increasing the stimulation intensityover a 10–250 �A range. The stimulation intensity was then setto yield half maximal response, and five sets of paired pulseswere delivered again through each of the seven electrode pairsand then averaged. The laminar profile recorded in the R columnfor the slice shown in Fig. 5A indicated the largest pyramidalpopulation spike at R11 and the largest dendritic components atR3 and R4 (Fig. 5C).

G. Gholmieh et al. / Journal of Neuroscience Methods 152 (2006) 116–129 121
Fig. 3. Mono- and di-synaptic responses evoked by paired pulse stimulation from wire electrodes and recorded with cMEA#3. (A) Monosynaptic population spikesrecorded from the DG’s dorsal (A) and ventral (B) blades. (C) Di-synaptic population spikes recorded from CA3 were more prominent in response to the secondpulse. (D) Photomicrograph of the corresponding hippocampal slice positioned over cMEA#3. The stimulation electrode is discernible as a dark area in at the cornerof DG marked with an X.
3.3.2. Selective stimulation of medial and lateral PPThe cMEA#3 had three sub-arrays designed to study PP-
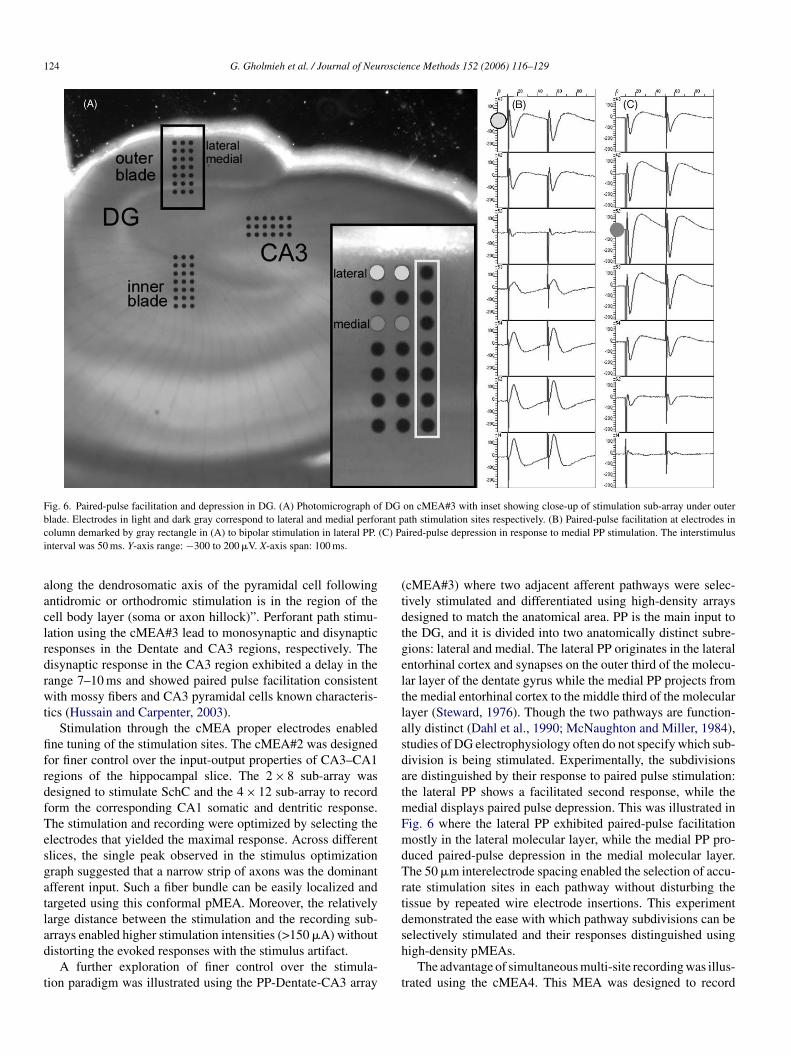
DG-CA3 synapses with an emphasis on differentiating betweenlateral and medial PP fibers. These sub-arrays span outer andinner blades of DG and CA4/CA3 in hippocampal dorsal slices(Fig. 6 A). In order to demonstrate the ability to discriminatebetween these two pathways using a high-density conformalcMEA, the lateral and medial PP were stimulated using pairs ofelectrodes in DG outer blade in five different slices. Stimulationin lateral PP produced paired pulse facilitation with a 13.58%(S.E.M. ± 4.1%) increase in amplitude of the second dentriticfEPSP (Fig. 6B). Medial PP stimulation resulted in pairedpulse depression with a 13.86% (S.E.M. ± 1.6%) decrease inthe amplitude of the second fEPSP (Fig. 6C). The selected elec-trode pairs clearly stimulated the two PP pathways based on theiranatomical location and responses. This fine spatial control overstimulation is much more difficult to obtain using more sparselyarranged pMEAs and nearly impossible to achieve in a singleslice with external wire electrodes.
3.4. Current source density analysis of CA1 pyramidal cells
In order to assess the applicability of high-density pMEAs forCSD analysis, hippocampal slices were oriented on cMEA#1such that CA1’s pyramidal axo-dendritic axis was parallel tothe longest side of the rectangular array (Fig. 7 A). Monopo-l
electrodes in a peripheral column, and evoked responses wererecorded from the remaining 59 electrodes. The left panel inFig. 7B shows FP activity recorded at the middle column ofelectrodes in response to a single stimulation in stratum radia-tum (marked by a red dot). Positive FPs were observed in stratumoriens and negative potentials in strata radiatum and molecularewith a 3–5 ms delay. Population spikes were then seen as a sharpdeflection in the waveform with a 5 ms delay. These currentsgradually switched polarity as cells repolarized themselves, andhyperpolarized 20 ms after stimulation. Simultaneous record-ings along the length of pyramidal cells constituted a FP laminarprofile of CA1 responses. By interpolating between adjacentrecordings, a topographical map was generated in which volt-ages were assigned colors (Fig. 7B). In these color maps, yel-low/red marked the spread of positive EPSPs, while blue areasdelineated negative EPSPs, or the spread of population spikesthrough positive EPSPs. The spatial spread of population spikeswas markedly narrower in CSD topographical maps (Fig. 7B).CSD also more finely localized reversal regions of EPSPs andpopulation spikes (zones where their polarity inverts) to stra-tum pyramidale. Additionally, CSD analysis unmasked a currentsource in stratum radiatum that was not discernible in FPs.
After illustrating the classical advantage of CSD over FP, theeffect of different electrode densities on CSD resolution wasinvestigated. FP recordings from a 20 electrode column wereseparated into groups of 10 odd and 10 even electrodes, andC
ar biphasic stimulations were then delivered through one of the SDs from these subgroups were compared to CSDs obtained
122 G. Gholmieh et al. / Journal of Neuroscience Methods 152 (2006) 116–129
Fig. 4. Monitoring trisynaptic activity in hippocampal slices with cMEA#4. (A) The design of the conformal multi-electrode array included two different circularpad sizes: ((A) 3 × 7 and (F and G) 2 × 7) 28 �m diameter pads with a 50 �m center-to-center spacing grouped in series to form sets of stimulating pads in DG andCA1, and ((B) 1 × 7 and (C, D, F, and G) 1 × 8) 36 �m diameter pads also with a 50 �m center-to-center spacing for recording. The sets are aligned according to rathippocampal cytoarchitecture covering key input/output regions of DG, CA3, and CA1, thereby allowing complete diagnostic assessment of the nonlinear dynamicsof the trisynaptic circuit. (B) Photomicrograph of a slice on the cMEA. (C) Trisynaptic recording from the DG, CA3 and CA1 areas. PP stimulation yielded largepopulations pikes in DG and CA3 and an EPSP in CA1, all with the appropriate multi-synaptic time delays. (D) Paired pulse responses from the same slice recordedafter (C) and following 1200 stimulations with random intervals. Scale bars 20 ms and 500 �V.
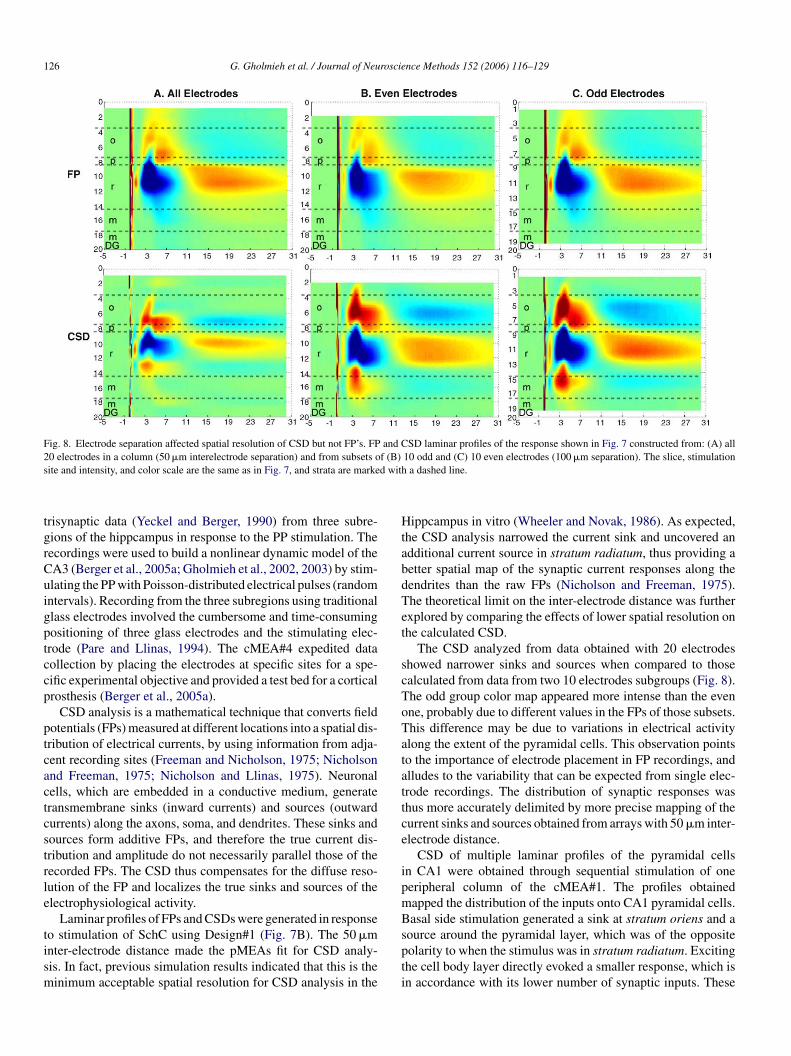
from the entire 20 electrode column. Fig. 8 shows FPs and CSDsobtained from a single stimulation at an electrode in stratumradiatum (same as in Fig. 7). Topographical maps indicated thatfor a same stimulation, there was minor difference between datacollected on odd and even subgroubs, mostly consisting of slightsignal size variations. The most significant observation was theeffect of electrode separation on CSDs, whereby CSD from evenand odd subgroups, whose electrodes were separated by 100 �m,did not narrow sinks and sources as did CSD from the entire arraywith 50 �m inter-electrode spacing.
CSD analyses of multiple laminar profiles of CA1 were gen-erated by sequentially stimulating electrodes in a column alongthe entire length of the pyramidal cells. Fig. 9 shows CSDs oflaminar profiles recorded from the middle column of the arraydepicted in Fig. 7, with stimulus sites denoted by red dots. Thestimulation spanned the entire dendritic range of CA1 and intoDG. Starting with stimulation under alvear fibers, where theslice has less thickness due to slicing along the hippocampalcurvature, no response was generated (profiles 1–3). As the stim-ulation site moved closer to the cell body layer, a current sinkwas observed in the stratum oriens with a corresponding sourcein stratum pyramidale (profiles 4–7). Exciting the cell bodylayer directly produced smaller sinks and sources (profile 8),which inverted in polarity for stimuli at stratum radiatum (pro-
file 9). As the stimulating site moved more distally along theapical dendritic tree, sinks and sources first grew to their largestvalues (profiles 10 and 11) and then gradually decreased (pro-files 12–14) until the stimulation site reached stratum lanuco-sum moleculare (profiles 15–17), yielding no evoked responses.Stimulating close to the fissure did not produce responses ineither CA1 or the DG (profile 18). Finally, large current sinksin the last two profiles (profiles 19 and 20) were responses ofgranule cell dendrites to stimulation in stratum moleculare ofDG.
4. Discussion
Few tissue and experiment specific cMEA configurationshave been produced in order to circumvent limitations resultingfrom fixed numbers of channels currently available in pMEArecording systems: (1) a hexameric layout with smaller andcloser electrodes in its center for retinal recordings (multi chan-nel systems) and (2) elliptic (Thiebaud et al., 1997) or circular(Duport et al., 1999) electrode layouts designed for hippocam-pal slices with a single or double layer of electrodes matchingroughly the cytoarchitecture of hippocampal pyramidal cells.These latter arrays, however, are hard to align with the tissuedue to differences in animal brain size and slicing. Additionally,
G. Gholmieh et al. / Journal of Neuroscience Methods 152 (2006) 116–129 123
Fig. 5. Optimization of stimulation and recording at SchC-CA1 synapse. (A) Hippocampal slice on cMEA#2. Inset: blow-up of recording (R column is left most)and stimulation sites (S column is left most in its sub-array). (B) Graph of average and standard error of the largest population spike amplitudes recorded from aslice and plotted against stimulation pair. Responses amplitude to paired pulse stimulation are shown in gray for the first pulse and black for the second pulse. (C)Laminar profile of FPs recorded at leftmost column R electrodes in response to paired pulse stimulation at electrodes S4–S5. Scale bar 50 ms and 100 �V.
none of these MEAs are optimized for current source density(CSD) analysis, which requires 50 �m inter-electrode distance(Wheeler and Novak, 1986). This paper introduces four high-density pMEAs that are well suited for specific electrophysio-logical applications and CSD analysis.
The key parameters of each fabrication technique were empir-ically derived, providing for repeatable, time-efficient and high-yield reproduction capacity. ITO was chosen as a substrate forconnecting leads because it is transparent and allows visualizingof the tissue on top of cMEAs. The dual SiNx/SU-8 insulatinglayer allowed for a decrease in shunt capacitance and provideddurability so that a consistent SNR was obtained after repeatedacute slice tests. Several experiments were performed to demon-strate the physical characteristics, and the functionality of thepMEAs, as well as to illustrate the advantages of conformaldesigns. These cMEA were used repeatedly in over 20 experi-ments involving acute slices with stable signal to noise ratio. Thestability of the recording was shown in the experiment that usedthe cMEA#4 where trisynaptic field potentials data was stable
over the period of recording/data collection and post 1200 stim-uli. It is worth to note, however, that the 50 �m dead cell layerat the slice surface prevents the recording of single unit activitywhich is usually observed with tissue-penetrating extracellularelectrodes and dissociated cell cultures.
The electrophysiological experiments performed using exter-nal stimulation established the functionality of the high-densityarrays by recording physiologically sound data. The observedwaveforms exhibited a signal-to-noise ratio greater than 10:1(Figs. 2B, 4A and 5A–C) and were similar in properties tothe ones recorded with single sharp-tip glass electrodes (Leungand Fu, 1994). The graded monosynaptic responses that wereobserved in CA1 region followed the typical sigmoidal shapeof an IO curve obtained in CA1 (Fig. 4B). The negative goingpopulation spike overriding the positive EPSP was best observedslightly basal to the pyramidal layer in the region correspondingto the axonal hillock region. This result is in agreement withprevious studies (Brankachk and Buzhaki, 1987; Richardson etal., 1987) that showed the “initial site for generation of a spike
124 G. Gholmieh et al. / Journal of Neuroscience Methods 152 (2006) 116–129
Fig. 6. Paired-pulse facilitation and depression in DG. (A) Photomicrograph of DG on cMEA#3 with inset showing close-up of stimulation sub-array under outerblade. Electrodes in light and dark gray correspond to lateral and medial perforant path stimulation sites respectively. (B) Paired-pulse facilitation at electrodes incolumn demarked by gray rectangle in (A) to bipolar stimulation in lateral PP. (C) Paired-pulse depression in response to medial PP stimulation. The interstimulusinterval was 50 ms. Y-axis range: −300 to 200 �V. X-axis span: 100 ms.
along the dendrosomatic axis of the pyramidal cell followingantidromic or orthodromic stimulation is in the region of thecell body layer (soma or axon hillock)”. Perforant path stimu-lation using the cMEA#3 lead to monosynaptic and disynapticresponses in the Dentate and CA3 regions, respectively. Thedisynaptic response in the CA3 region exhibited a delay in therange 7–10 ms and showed paired pulse facilitation consistentwith mossy fibers and CA3 pyramidal cells known characteris-tics (Hussain and Carpenter, 2003).
Stimulation through the cMEA proper electrodes enabledfine tuning of the stimulation sites. The cMEA#2 was designedfor finer control over the input-output properties of CA3–CA1regions of the hippocampal slice. The 2 × 8 sub-array wasdesigned to stimulate SchC and the 4 × 12 sub-array to recordform the corresponding CA1 somatic and dentritic response.The stimulation and recording were optimized by selecting theelectrodes that yielded the maximal response. Across differentslices, the single peak observed in the stimulus optimizationgraph suggested that a narrow strip of axons was the dominantafferent input. Such a fiber bundle can be easily localized andtargeted using this conformal pMEA. Moreover, the relativelylarge distance between the stimulation and the recording sub-arrays enabled higher stimulation intensities (>150 �A) withoutdistorting the evoked responses with the stimulus artifact.
A further exploration of finer control over the stimula-tion paradigm was illustrated using the PP-Dentate-CA3 array
(cMEA#3) where two adjacent afferent pathways were selec-tively stimulated and differentiated using high-density arraysdesigned to match the anatomical area. PP is the main input tothe DG, and it is divided into two anatomically distinct subre-gions: lateral and medial. The lateral PP originates in the lateralentorhinal cortex and synapses on the outer third of the molecu-lar layer of the dentate gyrus while the medial PP projects fromthe medial entorhinal cortex to the middle third of the molecularlayer (Steward, 1976). Though the two pathways are function-ally distinct (Dahl et al., 1990; McNaughton and Miller, 1984),studies of DG electrophysiology often do not specify which sub-division is being stimulated. Experimentally, the subdivisionsare distinguished by their response to paired pulse stimulation:the lateral PP shows a facilitated second response, while themedial displays paired pulse depression. This was illustrated inFig. 6 where the lateral PP exhibited paired-pulse facilitationmostly in the lateral molecular layer, while the medial PP pro-duced paired-pulse depression in the medial molecular layer.The 50 �m interelectrode spacing enabled the selection of accu-rate stimulation sites in each pathway without disturbing thetissue by repeated wire electrode insertions. This experimentdemonstrated the ease with which pathway subdivisions can beselectively stimulated and their responses distinguished usinghigh-density pMEAs.
The advantage of simultaneous multi-site recording was illus-trated using the cMEA4. This MEA was designed to record

G. Gholmieh et al. / Journal of Neuroscience Methods 152 (2006) 116–129 125
Fig. 7. FP and CSD of pyramidal cell activity. (A) Photomicrograph of a hippocampal slice on cMEA#1 with a pyramidal cell drawing from the Neuron MorphologyDatabase (http://neuron.duke.edu) to illustrate spatial extent of cells and strata relative the electrodes. (B) Expansion of cMEA’s span of CA1 and laminar profilerecorded in response to 50 �A monopolar stimulation at the electrode marked in red. The red traces show recorded FP or calculated CSD from the middle electrodecolumn (red box), with numbers corresponding to electrode position starting from the top. Topographical maps converted voltage to a color scale (−400 �V (blue) to400 �V (red)) and interpolated values between the electrodes. Strata are marked with a dashed line and labeled in white along the electrodes [o: oriens; p: pyramidale;r: radiatum; m: moleculare (CA1 and DG)] and trace drawing of a pyramidal cell. 200 �A stimulation triggered 5 ms after recording onset. X-axis span: 35 ms.
126 G. Gholmieh et al. / Journal of Neuroscience Methods 152 (2006) 116–129
Fig. 8. Electrode separation affected spatial resolution of CSD but not FP’s. FP and CSD laminar profiles of the response shown in Fig. 7 constructed from: (A) all20 electrodes in a column (50 �m interelectrode separation) and from subsets of (B) 10 odd and (C) 10 even electrodes (100 �m separation). The slice, stimulationsite and intensity, and color scale are the same as in Fig. 7, and strata are marked with a dashed line.
trisynaptic data (Yeckel and Berger, 1990) from three subre-gions of the hippcampus in response to the PP stimulation. Therecordings were used to build a nonlinear dynamic model of theCA3 (Berger et al., 2005a; Gholmieh et al., 2002, 2003) by stim-ulating the PP with Poisson-distributed electrical pulses (randomintervals). Recording from the three subregions using traditionalglass electrodes involved the cumbersome and time-consumingpositioning of three glass electrodes and the stimulating elec-trode (Pare and Llinas, 1994). The cMEA#4 expedited datacollection by placing the electrodes at specific sites for a spe-cific experimental objective and provided a test bed for a corticalprosthesis (Berger et al., 2005a).
CSD analysis is a mathematical technique that converts fieldpotentials (FPs) measured at different locations into a spatial dis-tribution of electrical currents, by using information from adja-cent recording sites (Freeman and Nicholson, 1975; Nicholsonand Freeman, 1975; Nicholson and Llinas, 1975). Neuronalcells, which are embedded in a conductive medium, generatetransmembrane sinks (inward currents) and sources (outwardcurrents) along the axons, soma, and dendrites. These sinks andsources form additive FPs, and therefore the true current dis-tribution and amplitude do not necessarily parallel those of therecorded FPs. The CSD thus compensates for the diffuse reso-lution of the FP and localizes the true sinks and sources of theelectrophysiological activity.
Laminar profiles of FPs and CSDs were generated in responsetism
Hippcampus in vitro (Wheeler and Novak, 1986). As expected,the CSD analysis narrowed the current sink and uncovered anadditional current source in stratum radiatum, thus providing abetter spatial map of the synaptic current responses along thedendrites than the raw FPs (Nicholson and Freeman, 1975).The theoretical limit on the inter-electrode distance was furtherexplored by comparing the effects of lower spatial resolution onthe calculated CSD.
The CSD analyzed from data obtained with 20 electrodesshowed narrower sinks and sources when compared to thosecalculated from data from two 10 electrodes subgroups (Fig. 8).The odd group color map appeared more intense than the evenone, probably due to different values in the FPs of those subsets.This difference may be due to variations in electrical activityalong the extent of the pyramidal cells. This observation pointsto the importance of electrode placement in FP recordings, andalludes to the variability that can be expected from single elec-trode recordings. The distribution of synaptic responses wasthus more accurately delimited by more precise mapping of thecurrent sinks and sources obtained from arrays with 50 �m inter-electrode distance.
CSD of multiple laminar profiles of the pyramidal cellsin CA1 were obtained through sequential stimulation of oneperipheral column of the cMEA#1. The profiles obtainedmapped the distribution of the inputs onto CA1 pyramidal cells.Basal side stimulation generated a sink at stratum oriens and aspti
o stimulation of SchC using Design#1 (Fig. 7B). The 50 �mnter-electrode distance made the pMEAs fit for CSD analy-is. In fact, previous simulation results indicated that this is theinimum acceptable spatial resolution for CSD analysis in the
ource around the pyramidal layer, which was of the oppositeolarity to when the stimulus was in stratum radiatum. Excitinghe cell body layer directly evoked a smaller response, which isn accordance with its lower number of synaptic inputs. These

G. Gholmieh et al. / Journal of Neuroscience Methods 152 (2006) 116–129 127
Fig. 9. Laminar response profile of CA1. CSD topographical color maps of laminar profiles of the slice in Fig. 7 in response to sequential stimulations along aperipheral column. The red dot marks the stimulation electrode’s relative position for each panel, with stimulation starting basal to the pyramidal layer in stratumoriens and proceeding into DG’s stratum moleculare. The slice, stimulation intensity, and color scale are the same as in Fig. 7, and strata are marked with a dashedline.
results are consistent with the neuroanatomy of the CA1 region(Andersen, 1975), where SchC and commissural fibers project toboth strata radiatum and oriens forming two excitable pathways(Buzsaki and Eidelberg, 1982; Richardson et al., 1987).
In summary, rapid transition of cell types in the brain man-dates high spatial resolution while the asymmetrical organiza-tion of the brain coupled with the limited number of recordingchannels requires conformal design. We have presented in thisarticle in vitro electrophysiological results from acute hippocam-pal slices that illustrate the advantages of the conformality and
high-density aspects of the successfully fabricated pMEAs. Theconformality enabled precise and convenient noninvasive selec-tion of stimulation and recording sites in a specific region of theslice, while the high-density aspect provided sufficient spatialresolution for CSD analysis. The demonstrated capabilities ofthe conformal pMEA can be used for many different applicationssuch as extracellular acute slice recordings (Oka et al., 1999),long-term monitoring for tissue based neurotoxins biosensorsin which electrophysiological activity of a hippocampal sliceculture is used to detect and identify toxic and hazardous chem-

128 G. Gholmieh et al. / Journal of Neuroscience Methods 152 (2006) 116–129
ical (Gholmieh et al., 2001; Shimono et al., 2002), or for thedevelopment of cortical implants (Berger et al., 2001).
References
Andersen P. Organization of hippocampal neurons and their interconnections.In: Isaacson RL, Pribram KH, editors. The hippocampus, vol. 1. NewYork: Plenum Press; 1975. p. 155–75.
Berger TW, Baudry M, Brinton RD, Liaw JS, Marmarelis VZ, Park AY,et al. Brain-implantable biomimetic electronics as the next era in neuralprosthetics. Proc IEEE 2001;89(7):993–1012.
Berger TW, Ahuja A, Courellis SH, Deadwyler SA, Erinjippurath G, GerhardtGA, et al. Hippocampal-cortical neural prostheses to restore lost cognitivefunction. IEEE Trans Biomed Eng 2005a;24(5):30–44.
Berger TW, Gholmieh G, Hsaio MC, Song D, Granacki JJ, Wills J, et al.Implantable biomimetic electronics as neural prostheses for lost cognitivefunction. In: Proceedings of the sixth Asian-Pacific conference on medicaland biological engineering (APCMBE2005); 2005b.
Boppart SA, Wheeler BC, Wallace CS. A flexible perforated microelec-trode array for extended neural recordings. IEEE Trans Biomed Eng1992;39(1):37–42.
Borkholder DA, Bao J, Maluf NI, Perl ER, Kovacs GT. Microelectrodearrays for stimulation of neural slice preparations. J Neurosci Meth1997;77(1):61–6.
Brankachk I, Buzhaki D. Spatial distribution of hippocampal responsesto dental pulp stimulation and acoustic clicks. Neirofiziologiia1987;19(1):36–46.
Buzsaki G, Eidelberg E. Convergence of associational and commissuralpathways on CA1 pyramidal cells of the rat hippocampus. Brain Res
D
D
D
E
F
G
G
G
G
G
G
H
hippocampal acute slices. In: Proceedings of the second joint meeting ofthe IEEE engineering in medicine and biology society and the biomedicalengineering society, vol. 3; 2002. p. 2127–8.
Heuschkel MO, Fejtl M, Raggenbass M, Bertrand D, Renaud P. A three-dimensional multi-electrode array for multi-site stimulation and recordingin acute brain slices. J Neurosci Meth 2002;114(2):135–48.
Hussain RJ, Carpenter DO. The effects of protein kinase C activity onsynaptic transmission in two areas of rat hippocampus. Brain Res2003;990(1–2):28–37.
Jahnsen H, Kristensen BW, Thiebaud P, Noraberg J, Jakobsen B, Bove M,et al. Coupling of organotypic brain slice cultures to silicon-based arraysof electrodes. Methods 1999;18(2):160–72.
Jimbo Y, Robinson HP. Propagation of spontaneous synchronized activityin cortical slice cultures recorded by planar electrode arrays. Bioelectro-chemistry 2000;51(2):107–15.
Lanczos C, editor. Applied Analysis. Englewood Cliffs, NJ: Prentice-Hall;1956.
Leung LS, Fu XW. Factors affecting paired-pulse facilitation in hippocampalCA1 neurons in vitro. Brain Res 1994;650(1):75–84.
McNaughton N, Miller JJ. Medial septal projections to the dentate gyrus ofthe rat: electrophysiological analysis of distribution and plasticity. ExpBrain Res 1984;56(2):243–56.
Meister M, Pine J, Baylor DA. Multi-neuronal signals from the retina: acqui-sition and analysis. J Neurosci Meth 1994;51(1):95–106.
Nicholson C, Freeman JA. Theory of current source-density analysis anddetermination of conductivity tensor for anuran cerebellum. J Neurophys-iol 1975;38(2):356–68.
Nicholson C, Llinas R. Real time current source-density analysis usingmulti-electrode array in cat cerebellum. Brain Res 1975;100(2):418–24.
Novak JL, Wheeler BC. Multisite hippocampal slice recording and stim-
O
P
R
R
S
S
S
S
S
S
T
1982;237(2):283–95.ahl D, Burgard EC, Sarvey JM. NMDA receptor antagonists reduce medial,
but not lateral, perforant path-evoked EPSPs in dentate gyrus of rat hip-pocampal slice. Exp Brain Res 1990;83(1):172–7.
roge MH, Gross GW, Hightower MH, Czisny LE. Multielectrode analysisof coordinated, multisite, rhythmic bursting in cultured CNS monolayernetworks. J Neurosci 1986;6(6):1583–92.
uport S, Millerin C, Muller D, Correges P. A metallic multisite record-ing system designed for continuous long-term monitoring of electro-physiological activity in slice cultures. Biosens Bioelectron 1999;14(4):369–76.
gert U, Schlosshauer B, Fennrich S, Nisch W, Fejtl M, Knott T, et al. Anovel organotypic long-term culture of the rat hippocampus on substrate-integrated multielectrode arrays. Brain Res Brain Res Protoc1998;2(4):229–42.
reeman JA, Nicholson C. Experimental optimization of current source-density technique for anuran cerebellum. J Neurophysiol 1975;38(2):369–82.
holmieh G, Soussou W, Courellis S, Marmarelis VZ, Berger TW, BaudryM. A biosensor for detecting changes in cognitive processing based onnonlinear systems analysis. Biosens Bioelectron 2001;16(7/8):491–501.
holmieh G, Courellis S, Marmarelis VZ, Berger TW. An efficient methodfor studying short-term plasticity with random impulse train stimuli. JNeurosci Meth 2002;121(2):111–27.
holmieh G, Courellis SH, Song D, Wang Z, Marmarelis VZ, Berger TW.Characterization of short-term plasticity of the dentate gyrus-CA3 systemusing nonlinear systems analysis. In: Proceedings of the IEEE EMBSconference; 2003. p. 1929–32.
ross GW, Rhoades BK, Reust DL, Schwalm FU. Stimulation of mono-layer networks in culture through thin-film indium–tin oxide recordingelectrodes. J Neurosci Meth 1993;50(2):131–43.
ross GW, Schwalm FU. A closed flow chamber for long-term multi-channel recording and optical monitoring. J Neurosci Meth 1994;52(1):73–85.
rumet AE, Wyatt Jr JL, Rizzo III JF. Multi-electrode stimulation and record-ing in the isolated retina. J Neurosci Meth 2000;101(1):31–42.
an M, Gholmieh G, Soussou W, Berger TW, Tanguay Jr AR. Conformally-mapped multielectrode arrays for in-vitro stimulation and recording of
ulation using a 32 element microelectrode array. J Neurosci Meth1988;23(2):149–59.
ka H, Shimono K, Ogawa R, Sugihara H, Taketani M. A new planar mul-tielectrode array for extracellular recording: application to hippocampalacute slice. J Neurosci Meth 1999;93(1):61–7.
are D, Llinas R. Non-lamellar propagation of entorhinal influences in thehippocampal formation: multiple electrode recordings in the isolatedguinea pig brain in vitro. Hippocampus 1994;4(4):403–9.
ichardson TL, Turner RW, Miller JJ. Action-potential discharge in hip-pocampal CA1 pyramidal neurons: current source-density analysis. JNeurophysiol 1987;58(5):981–96.
ubinstein JT, Spelman FA, Soma M, Suesserman MF. Current density pro-files of surface mounted and recessed electrodes for neural prostheses.IEEE Trans Biomed Eng 1987;34(11):864–75.
himono K, Baudry M, Panchenko V, Taketani M. Chronic multichannelrecordings from organotypic hippocampal slice cultures: protection fromexcitotoxic effects of NMDA by non-competitive NMDA antagonists. JNeurosci Meth 2002;120(2):193–202.
inger W. Why use more than one electrode at a time? In: New technologiesfor life sciences: trends guide 2000; 2000. p. 12–17.
oussou W, Gholmieh G, Han M, Ahuja A, Song D, Hsiao M-C, et al. Map-ping spatio-temporal electrophysiological activity in hippocampal sliceswith conformal planar multielectrode arrays. In: Baudry M, Taketani M,editors. Advances in network electrophysiology using multi electrodearrays, New York: Kluwer Academic; 2005.
teward O. Topographic organization of the projections from the entorhi-nal area to the hippocampal formation of the rat. J Comp Neurol1976;167(3):285–314.
toppini L, Duport S, Correges P. A new extracellular multirecording systemfor electrophysiological studies: application to hippocampal organotypiccultures. J Neurosci Meth 1997;72(1):23–33.
tulik K, Amatore C, Holub K, Marecek M, Kutner W. Microelec-trodes. Definitions, characterization, and applications. Pure Appl Chem2000;72(8):1483–92.
hiebaud P, de Rooij NF, Koudelka-Hep M, Stoppini L. Microelectrode arraysfor electrophysiological monitoring of hippocampal organotypic slice cul-tures. IEEE Trans Biomed Eng 1997;44(11):1159–63.

G. Gholmieh et al. / Journal of Neuroscience Methods 152 (2006) 116–129 129
Thiebaud P, Beuret C, Koudelka-Hep M, Bove M, Martinoia S, GrattarolaM, et al. An array of Pt-tip microelectrodes for extracellular monitoringof activity of brain slices. Biosens Bioelectron 1999;14(1):61–5.
Warland DK, Reinagel P, Meister M. Decoding visual information froma population of retinal ganglion cells. J Neurophysiol 1997;78(5):2336–50.
Wheeler BC, Novak JL. Current source density estimation using microelec-trode array data from the hippocampal slice preparation. IEEE TransBiomed Eng 1986;33(12):1204–12.
Yeckel MF, Berger TW. Feedforward excitation of the hippocampus by affer-ents from the entorhinal cortex: redefinition of the role of the trisynapticpathway. Proc Natl Acad Sci USA 1990;87(15):5832–6.