Embed Size (px)
Citation preview

Custom Formula-Based
Visualizations for Savvy
Designers
Mohammad Amin Kuhail
Software and Systems Section
IT University of Copenhagen
A thesis submitted for the degree of
PhilosophiæDoctor (PhD), DPhil,..
May 2013

Abstract
Despite their usefulness in many domains (e.g. healthcare, finance, etc.),
custom visualizations remain tedious and hard to implement. It would be
advantageous if savvy designers (designers with end-user development skills
and much domain knowledge) could refine visualizations to their needs.
For instance, it would save time and money if a clinician familiar with
spreadsheet formulas could refine a visualization (e.g. the lifelines) rather
than hiring a programmer.
Existing approaches to visualization are one of the two: accessible to savvy
designers but limited in customizability, or inaccessible and expressive. For
instance, chart tools are easy to use, but support only predefined visualiza-
tions, while visualization tools support custom visualizations, but require
program-like specifications.
This thesis presents Uvis, a visualization system that targets savvy design-
ers. With Uvis, designers drag and drop visual objects, set the visual object
properties with formulas, and see the result immediately. The formulas are
declarative and similar to spreadsheet formulas. The formulas compute the
property values and can refer to fields, visual properties, functions, etc.
This thesis hypothesizes that it is possible to express custom visualizations
with spreadsheet-like formulas, and savvy designers can learn to refine the
visualizations. The thesis presents four contributions: The first is the ex-
pressive power of formulas, substantiated with a collection of custom vi-
sualizations. The second contribution is iteratively refining Uvis based on
feedback from savvy designers. Uvis provides novel cognitive aids that as-
sist the designers in creating and refining custom visualizations. The third
contribution is a usability evaluation of Uvis with savvy designers. The

fourth contribution is a usability analysis of several visualization tools in-
cluding Uvis. The analysis highlights the differences between approaches
and argues why Uvis is more suited for custom visualizations.
The thesis is based on four full scientific papers.

iv
Dedication
I dedicate this thesis to my beloved parents, wife, and family members.
I also dedicate it to all positive people in the world who always focus on
changing themselves to the better and making the world a better place
rather than blaming others, the situation, etc.
I also dedicate it to the children who are having a hard time. I hope the
future will bring something positive to them. One by one, we all make a
difference.
Acknowledgements
I would like to acknowledge my supervisor Soren Lauesen for helping me so
much during my PhD studies. I have learned so much from him not only
at a professional or academic level, but also a personal level.
Soren Lauesen invented the basic Uvis principles, including the formula
principles. The rest of the initial Uvis ideas are the joint intellectual work
of Mohammad Amin Kuhail, Soren Lauesen, Kostas Pantazos, and Shangjin
XU (in alphabetical sequence). Each team member developed his version
of Uvis to validate his research ideas.
I would like to acknowledge my parents and other family members who gave
me a lot of positive energy during my PhD journey.
I would like to acknowledge my wife, Zara Al-Ali, who supported me during
writing the thesis. She contributed so much to my success.
I would like to thank professor Margaret-Anne (Peggy) Storey who super-
vised me during my stay abroad in the CHISEL lab, Victoria, Canada. In
general, all the lab members were friendly and inspiring.
I would like to acknowledge many of colleagues who inspired me with their
innovative ideas and hard work. In particular, I would like to thank Kostas
Pantazos, XU Shangjin, Soren Lippert, and Lars Grammel.
Contents
List of Figures ix
1 Introduction 1
1.1 The Uvis Approach . . . . . . . . . . . . . . . . . . . . . . . . . . . . . . 4
1.1.1 Example . . . . . . . . . . . . . . . . . . . . . . . . . . . . . . . . 5
1.2 Thesis Statement and Research Contributions . . . . . . . . . . . . . . . 11
1.3 List of Publications . . . . . . . . . . . . . . . . . . . . . . . . . . . . . . 11
1.4 Organization of the Dissertation . . . . . . . . . . . . . . . . . . . . . . 12
2 Background 13
2.1 Visualization Reference Model . . . . . . . . . . . . . . . . . . . . . . . . 13
2.2 Approaches to Visualization . . . . . . . . . . . . . . . . . . . . . . . . . 14
2.2.1 Charting Tools . . . . . . . . . . . . . . . . . . . . . . . . . . . . 14
2.2.2 Analytical and Exploratory Tools . . . . . . . . . . . . . . . . . . 14
2.2.3 Custom Visualization Tools . . . . . . . . . . . . . . . . . . . . . 15
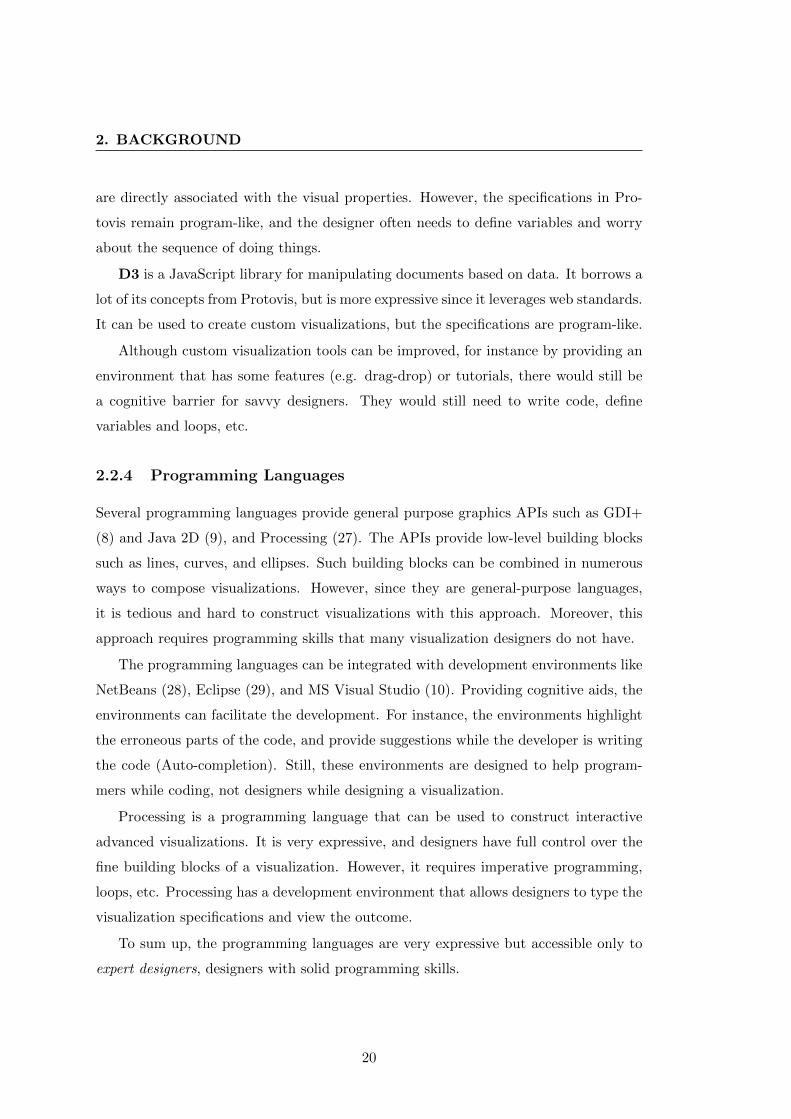
2.2.4 Programming Languages . . . . . . . . . . . . . . . . . . . . . . . 20
2.2.5 Summary . . . . . . . . . . . . . . . . . . . . . . . . . . . . . . . 21
3 Uvis Formulas 23
3.1 Introduction . . . . . . . . . . . . . . . . . . . . . . . . . . . . . . . . . . 23
3.2 Architecture . . . . . . . . . . . . . . . . . . . . . . . . . . . . . . . . . . 23
3.3 Visual Objects . . . . . . . . . . . . . . . . . . . . . . . . . . . . . . . . 25
3.3.1 Properties . . . . . . . . . . . . . . . . . . . . . . . . . . . . . . . 27
3.3.2 Functions . . . . . . . . . . . . . . . . . . . . . . . . . . . . . . . 27
3.4 Formula Basics . . . . . . . . . . . . . . . . . . . . . . . . . . . . . . . . 28
3.4.1 Visual Containers . . . . . . . . . . . . . . . . . . . . . . . . . . 29
iii
CONTENTS
3.4.2 Connecting visual objects to data . . . . . . . . . . . . . . . . . . 29
3.4.3 Property Formulas . . . . . . . . . . . . . . . . . . . . . . . . . . 31
3.4.4 End-user Data and Interaction . . . . . . . . . . . . . . . . . . . 34
3.5 Performance . . . . . . . . . . . . . . . . . . . . . . . . . . . . . . . . . . 35
3.5.1 One SQL Query per Multiple Visual Objects . . . . . . . . . . . 37
3.5.2 Fast GDI+ Shapes . . . . . . . . . . . . . . . . . . . . . . . . . . 37
3.5.3 Multi-Cell Canvas . . . . . . . . . . . . . . . . . . . . . . . . . . 39
4 Formula-Based Visualizations 41
4.1 Introduction . . . . . . . . . . . . . . . . . . . . . . . . . . . . . . . . . . 41
4.2 Example Visualizations . . . . . . . . . . . . . . . . . . . . . . . . . . . 41
4.2.1 Passenger Statistics . . . . . . . . . . . . . . . . . . . . . . . . . 41
4.2.2 Train Schedule . . . . . . . . . . . . . . . . . . . . . . . . . . . . 45
4.2.3 Medicine Tree . . . . . . . . . . . . . . . . . . . . . . . . . . . . . 47
4.2.4 Website Hits . . . . . . . . . . . . . . . . . . . . . . . . . . . . . 50
4.3 Other Visualizations . . . . . . . . . . . . . . . . . . . . . . . . . . . . . 53
4.4 Lines of Code . . . . . . . . . . . . . . . . . . . . . . . . . . . . . . . . . 55
4.5 Expressiveness Factors . . . . . . . . . . . . . . . . . . . . . . . . . . . . 55
4.6 Limitations . . . . . . . . . . . . . . . . . . . . . . . . . . . . . . . . . . 57
4.6.1 Recursion and Loops . . . . . . . . . . . . . . . . . . . . . . . . . 57
4.6.2 Complex Interaction . . . . . . . . . . . . . . . . . . . . . . . . . 58
4.6.3 Other Types of Visualizations . . . . . . . . . . . . . . . . . . . . 59
4.6.4 Inability to Define Functions . . . . . . . . . . . . . . . . . . . . 59
4.7 Summary . . . . . . . . . . . . . . . . . . . . . . . . . . . . . . . . . . . 59
5 Uvis Usability 61
5.1 Introduction . . . . . . . . . . . . . . . . . . . . . . . . . . . . . . . . . . 61
5.2 Initial Uvis Version . . . . . . . . . . . . . . . . . . . . . . . . . . . . . . 61
5.2.1 Drag-Drop-Set-Property . . . . . . . . . . . . . . . . . . . . . . . 62
5.2.2 Documentation . . . . . . . . . . . . . . . . . . . . . . . . . . . . 62
5.2.3 Only Visual Objects . . . . . . . . . . . . . . . . . . . . . . . . . 64
5.3 Uvis Enhanced Version . . . . . . . . . . . . . . . . . . . . . . . . . . . . 64
5.3.1 Table view . . . . . . . . . . . . . . . . . . . . . . . . . . . . . . 64
5.3.2 Inspector . . . . . . . . . . . . . . . . . . . . . . . . . . . . . . . 66
iv
CONTENTS
5.3.3 Showing multiple visual objects as a staircase . . . . . . . . . . 68
5.3.4 Showing Parent . . . . . . . . . . . . . . . . . . . . . . . . . . . . 70
5.3.5 Positioning children on top of parents . . . . . . . . . . . . . . . 70
5.3.6 Visual Editing Functions . . . . . . . . . . . . . . . . . . . . . . 70
5.3.7 Default Formulas . . . . . . . . . . . . . . . . . . . . . . . . . . . 72
5.3.8 Documentation . . . . . . . . . . . . . . . . . . . . . . . . . . . . 72
5.3.9 Benefits . . . . . . . . . . . . . . . . . . . . . . . . . . . . . . . . 74
6 Iterative Design of the Uvis System 75
6.1 Introduction . . . . . . . . . . . . . . . . . . . . . . . . . . . . . . . . . . 75
6.2 Iterative Design Process . . . . . . . . . . . . . . . . . . . . . . . . . . . 75
6.2.1 Objectives . . . . . . . . . . . . . . . . . . . . . . . . . . . . . . . 76
6.2.2 Uvis Concepts to Evaluate . . . . . . . . . . . . . . . . . . . . . . 76
6.3 Test Tasks . . . . . . . . . . . . . . . . . . . . . . . . . . . . . . . . . . . 80
6.3.1 First Version of Tasks . . . . . . . . . . . . . . . . . . . . . . . . 80
6.3.2 Second Version of Tasks . . . . . . . . . . . . . . . . . . . . . . . 82
6.3.3 Third Version of Tasks . . . . . . . . . . . . . . . . . . . . . . . . 85
6.4 First Phase of Evaluation . . . . . . . . . . . . . . . . . . . . . . . . . . 88
6.4.1 The Participant’s Background . . . . . . . . . . . . . . . . . . . . 88
6.4.2 The Usability Study Settings . . . . . . . . . . . . . . . . . . . . 88
6.4.3 Qualitative Results: . . . . . . . . . . . . . . . . . . . . . . . . . 89
6.4.4 Quantitative results: . . . . . . . . . . . . . . . . . . . . . . . . . 89
6.4.5 Causes and Solutions: . . . . . . . . . . . . . . . . . . . . . . . . 89
6.4.6 Changes - the second version of Uvis . . . . . . . . . . . . . . . . 91
6.5 Second Phase of Evaluation . . . . . . . . . . . . . . . . . . . . . . . . . 93
6.5.1 The Participant’s Background . . . . . . . . . . . . . . . . . . . . 93
6.5.2 The Usability Study Settings . . . . . . . . . . . . . . . . . . . . 94
6.5.3 Qualitative Results: . . . . . . . . . . . . . . . . . . . . . . . . . 94
6.5.4 Quantitative results: . . . . . . . . . . . . . . . . . . . . . . . . . 95
6.5.5 Causes and Solutions . . . . . . . . . . . . . . . . . . . . . . . . . 95
6.5.6 Changes - The Third Version of Uvis . . . . . . . . . . . . . . . . 97
6.6 Third Phase of Evaluation . . . . . . . . . . . . . . . . . . . . . . . . . . 98
6.6.1 The Participant’s Background . . . . . . . . . . . . . . . . . . . . 98
v

CONTENTS
6.6.2 The Usability Study Settings . . . . . . . . . . . . . . . . . . . . 99
6.6.3 Qualitative Results . . . . . . . . . . . . . . . . . . . . . . . . . . 100
6.6.4 Quantitative Results . . . . . . . . . . . . . . . . . . . . . . . . . 100
6.6.5 Causes and Solutions . . . . . . . . . . . . . . . . . . . . . . . . . 100
6.6.6 Changes - The Fourth Version of Uvis . . . . . . . . . . . . . . . 101
6.7 Fourth Phase of Evaluation . . . . . . . . . . . . . . . . . . . . . . . . . 103
6.7.1 The Participant’s Background . . . . . . . . . . . . . . . . . . . . 103
6.7.2 Usability Study Settings . . . . . . . . . . . . . . . . . . . . . . . 104
6.7.3 Qualitative Results . . . . . . . . . . . . . . . . . . . . . . . . . . 104
6.7.4 Quantitative Results . . . . . . . . . . . . . . . . . . . . . . . . . 104
6.7.5 Causes and Solutions . . . . . . . . . . . . . . . . . . . . . . . . . 105
6.7.6 Changes - The Fifth Version of Uvis . . . . . . . . . . . . . . . . 106
6.8 Summary . . . . . . . . . . . . . . . . . . . . . . . . . . . . . . . . . . . 106
7 Evaluation 109
7.1 Introduction . . . . . . . . . . . . . . . . . . . . . . . . . . . . . . . . . . 109
7.2 Tool Comparative Analysis . . . . . . . . . . . . . . . . . . . . . . . . . 109
7.2.1 Selected Tools . . . . . . . . . . . . . . . . . . . . . . . . . . . . 110
7.2.2 Prefuse . . . . . . . . . . . . . . . . . . . . . . . . . . . . . . . . 110
7.2.3 Protovis . . . . . . . . . . . . . . . . . . . . . . . . . . . . . . . . 112
7.2.4 Improvise . . . . . . . . . . . . . . . . . . . . . . . . . . . . . . . 113
7.2.5 Uvis . . . . . . . . . . . . . . . . . . . . . . . . . . . . . . . . . . 115
7.3 Evaluating the Tools with the Cognitive Dimensions of Notations . . . . 117
7.3.1 Abstractions . . . . . . . . . . . . . . . . . . . . . . . . . . . . . 118
7.3.2 Hidden Dependencies . . . . . . . . . . . . . . . . . . . . . . . . 119
7.3.3 Premature Commitment . . . . . . . . . . . . . . . . . . . . . . . 119
7.3.4 Progressive Evaluation . . . . . . . . . . . . . . . . . . . . . . . . 120
7.3.5 Viscosity . . . . . . . . . . . . . . . . . . . . . . . . . . . . . . . 120
7.3.6 Visibility and Juxtaposability . . . . . . . . . . . . . . . . . . . . 121
7.3.7 Summary . . . . . . . . . . . . . . . . . . . . . . . . . . . . . . . 122
7.4 Experimental Evaluation . . . . . . . . . . . . . . . . . . . . . . . . . . . 123
7.4.1 Objective . . . . . . . . . . . . . . . . . . . . . . . . . . . . . . . 123
7.4.2 The Participant’s Background . . . . . . . . . . . . . . . . . . . . 124
vi

CONTENTS
7.4.3 Procedure . . . . . . . . . . . . . . . . . . . . . . . . . . . . . . . 124
7.4.4 Tasks . . . . . . . . . . . . . . . . . . . . . . . . . . . . . . . . . 125
7.4.5 Form . . . . . . . . . . . . . . . . . . . . . . . . . . . . . . . . . . 126
7.4.6 Results . . . . . . . . . . . . . . . . . . . . . . . . . . . . . . . . 127
8 Conclusion and Future Work 129
8.1 Contributions . . . . . . . . . . . . . . . . . . . . . . . . . . . . . . . . . 129
8.2 Future Work . . . . . . . . . . . . . . . . . . . . . . . . . . . . . . . . . 130
References 133
A Usability Study Documentation 137
A.1 The Usability Log of Participant 1 . . . . . . . . . . . . . . . . . . . . . 138
A.2 The Background Form of Participant 10 . . . . . . . . . . . . . . . . . . 139
A.3 The Understandability Form of Participant 10 . . . . . . . . . . . . . . . 141
vii

CONTENTS
viii
List of Figures
1.1 The Uvis environment . . . . . . . . . . . . . . . . . . . . . . . . . . . . 4
1.2 An employee task plan visualization. The model of the visualization
data is on the right. . . . . . . . . . . . . . . . . . . . . . . . . . . . . . 6
1.3 Double clicking the employee table (box) shows a sample of the table . 6
1.4 Dragging a time scale visual object to the design panel . . . . . . . . . 7
1.5 Connecting EmployeeLabel to data . . . . . . . . . . . . . . . . . . . . 8
2.1 Visualization Reference Model . . . . . . . . . . . . . . . . . . . . . . . . 14
2.2 Features provided by several custom visualization tools for data trans-
formations . . . . . . . . . . . . . . . . . . . . . . . . . . . . . . . . . . . 16
2.3 Features provided by several custom visualization tools for visual mappings 17
2.4 Summary of the existing approaches . . . . . . . . . . . . . . . . . . . . 21
2.5 Summary of the existing approaches . . . . . . . . . . . . . . . . . . . . 22
3.1 Uvis architecture . . . . . . . . . . . . . . . . . . . . . . . . . . . . . . . 24
3.2 An example of a vism file . . . . . . . . . . . . . . . . . . . . . . . . . . 24
3.3 Examples of Uvis visual objects . . . . . . . . . . . . . . . . . . . . . . . 25
3.4 Examples of common built-in properties . . . . . . . . . . . . . . . . . . 26
3.5 Size and position properties of some visual objects . . . . . . . . . . . . 26
3.6 Visual-object-specific properties . . . . . . . . . . . . . . . . . . . . . . . 26
3.7 Examples of utility functions provided by Uvis . . . . . . . . . . . . . . 28
3.8 A task plan visualization . . . . . . . . . . . . . . . . . . . . . . . . . . . 30
3.9 Performance results of the lifelines example . . . . . . . . . . . . . . . . 36
3.10 A visualization inspired by LifeLines . . . . . . . . . . . . . . . . . . . . 36
3.11 Performance of visualizations created with Uvis . . . . . . . . . . . . . . 37
ix
LIST OF FIGURES
3.12 Comparison of single-row queries against multiple-row queries . . . . . . 37
3.13 Performance of a GDI+ Box in comparison to a .NET TextBox . . . . . 38
3.14 A visualization inspired by the Spiral Graph (1) containing 10,000 el-
lipses representing website hits . . . . . . . . . . . . . . . . . . . . . . . 38
3.15 Comparison of performance of a spiral visualization with one-cell canvas
against multi-cell canvas . . . . . . . . . . . . . . . . . . . . . . . . . . 39
4.1 An overview of the selected visualizations . . . . . . . . . . . . . . . . . 42
4.2 Passenger statistics visualization . . . . . . . . . . . . . . . . . . . . . . 43
4.3 Pie Slice properties . . . . . . . . . . . . . . . . . . . . . . . . . . . . . . 44
4.4 A train schedule visualization . . . . . . . . . . . . . . . . . . . . . . . . 46
4.5 A spline specification . . . . . . . . . . . . . . . . . . . . . . . . . . . . . 46
4.6 Medicine tree visualization . . . . . . . . . . . . . . . . . . . . . . . . . . 48
4.7 Medicine tree visualization with TreeNode objects . . . . . . . . . . . . 50
4.8 Website hits Visualization . . . . . . . . . . . . . . . . . . . . . . . . . . 52
4.9 Other visualizations created with Uvis. (A) LifeLines. (B) Horizon
Graphs. (C) Tile Maps. (D) CircleView. (E) Tree Maps. (F) Heat-
map grid . . . . . . . . . . . . . . . . . . . . . . . . . . . . . . . . . . . . 54
4.10 Lines of code needed to created several visualizations with Uvis . . . . . 55
4.11 Examples of what formulas can refer to . . . . . . . . . . . . . . . . . . 56
4.12 A visualization that is updated every 0.1 seconds. The visualization is
adapted from (2) . . . . . . . . . . . . . . . . . . . . . . . . . . . . . . . 60
5.1 Basic version of Uvis environment . . . . . . . . . . . . . . . . . . . . . 63
5.2 Uvis tutorial, version 1 . . . . . . . . . . . . . . . . . . . . . . . . . . . . 63
5.3 Enhanced version of Uvis environment . . . . . . . . . . . . . . . . . . . 65
5.4 The table view feature . . . . . . . . . . . . . . . . . . . . . . . . . . . . 65
5.5 The inspector showing the relationship between a visual object and a
data row . . . . . . . . . . . . . . . . . . . . . . . . . . . . . . . . . . . . 66
5.6 The inspector showing values behind the formula sub-expressions . . . . 68
5.7 The inspector showing irregular values in red and warnings in yellow . . 69
5.8 The staircase metaphor . . . . . . . . . . . . . . . . . . . . . . . . . . . 69
5.9 Highlighting parent visual objects . . . . . . . . . . . . . . . . . . . . . . 70
5.10 Positioning child objects on top of parent objects . . . . . . . . . . . . . 71
x
LIST OF FIGURES
5.11 Positioning PieSlice child objects on top of parent objects . . . . . . . 71
5.12 Setting the pie slice’s StartAngle . . . . . . . . . . . . . . . . . . . . . . 72
5.13 A power-point based tutorial . . . . . . . . . . . . . . . . . . . . . . . . 73
6.1 The iterative design process . . . . . . . . . . . . . . . . . . . . . . . . . 76
6.2 Uvis language concepts . . . . . . . . . . . . . . . . . . . . . . . . . . . . 77
6.3 Uvis environment and visual object concepts . . . . . . . . . . . . . . . 78
6.4 The Uvis concepts that tasks evaluate . . . . . . . . . . . . . . . . . . . 79
6.5 Visual tasks, version 1 . . . . . . . . . . . . . . . . . . . . . . . . . . . . 81
6.6 Visual tasks, version 2 . . . . . . . . . . . . . . . . . . . . . . . . . . . . 84
6.7 Visual tasks, version 3 . . . . . . . . . . . . . . . . . . . . . . . . . . . . 87
6.8 The first phase problems, causes, and solutions . . . . . . . . . . . . . . 90
6.9 Changes in version 2 of the Uvis environment . . . . . . . . . . . . . . . 92
6.10 Quantitative results of the second phase . . . . . . . . . . . . . . . . . . 95
6.11 The second phase problems, causes, and solutions . . . . . . . . . . . . . 97
6.12 The third version of the Uvis environment . . . . . . . . . . . . . . . . 98
6.13 The third phase quantitative results . . . . . . . . . . . . . . . . . . . . 101
6.14 Causes and solutions for problems observed in phase 3 . . . . . . . . . . 102
6.15 The fourth version of the Uvis environment . . . . . . . . . . . . . . . . 102
6.16 Quantitative results of the fourth phase tests . . . . . . . . . . . . . . . 105
6.17 The fourth phase problems, causes, and solutions . . . . . . . . . . . . . 106
6.18 The changes in the fifth version of Uvis . . . . . . . . . . . . . . . . . . 107
6.19 The fourth phase problems, causes, and solutions . . . . . . . . . . . . . 108
7.1 A custom x-y graph based on table HighReading . . . . . . . . . . . . . 110
7.2 Creating a custom x-y graph with Prefuse. a: binding the visualization
to data, b: defining time and numeric axes, c: defining a conditional vi-
sual mapping, d: associating the visual mappings with the visualization,
e: defining tick marks and associating them with the axes. f: defining
ellipses representing the temperature readings . . . . . . . . . . . . . . . 111
7.3 Creating a custom x-y graph with Protovis a: defining the visualization,
b: defining the numeric (temperature) and time scales (axes). c: defining
dots and visually mapping them to temperature and date fields according
to the scales . . . . . . . . . . . . . . . . . . . . . . . . . . . . . . . . . 113
xi
LIST OF FIGURES
7.4 Creating a custom x-y graph with the Protovis environment (Protoviewer)114
7.5 Creating a custom x-y graph with Improvise . . . . . . . . . . . . . . . . 114
7.6 The specifications of the custom x-y graph with Uvis . . . . . . . . . . . 116
7.7 The x-y graph visualization in the Uvis environment . . . . . . . . . . . 116
7.8 The Left expression values . . . . . . . . . . . . . . . . . . . . . . . . . . 117
7.9 The evaluation tasks . . . . . . . . . . . . . . . . . . . . . . . . . . . . . 125
7.10 Evaluation Quantitative results. T=Time, Q=Solution quality, GA=Group
A, and GB=Group B . . . . . . . . . . . . . . . . . . . . . . . . . . . . . 126
A.1 A snapshot of the usability log of participant 1 . . . . . . . . . . . . . . 138
A.2 The background form of participant 10, part A . . . . . . . . . . . . . . 139
A.3 The background form of participant 10, part B . . . . . . . . . . . . . . 140
A.4 The understandability form of participant 10, part A . . . . . . . . . . . 141
A.5 The understandability form of participant 10, part B . . . . . . . . . . . 142
A.6 The understandability form of participant 10, part C . . . . . . . . . . . 143
xii
1
Introduction
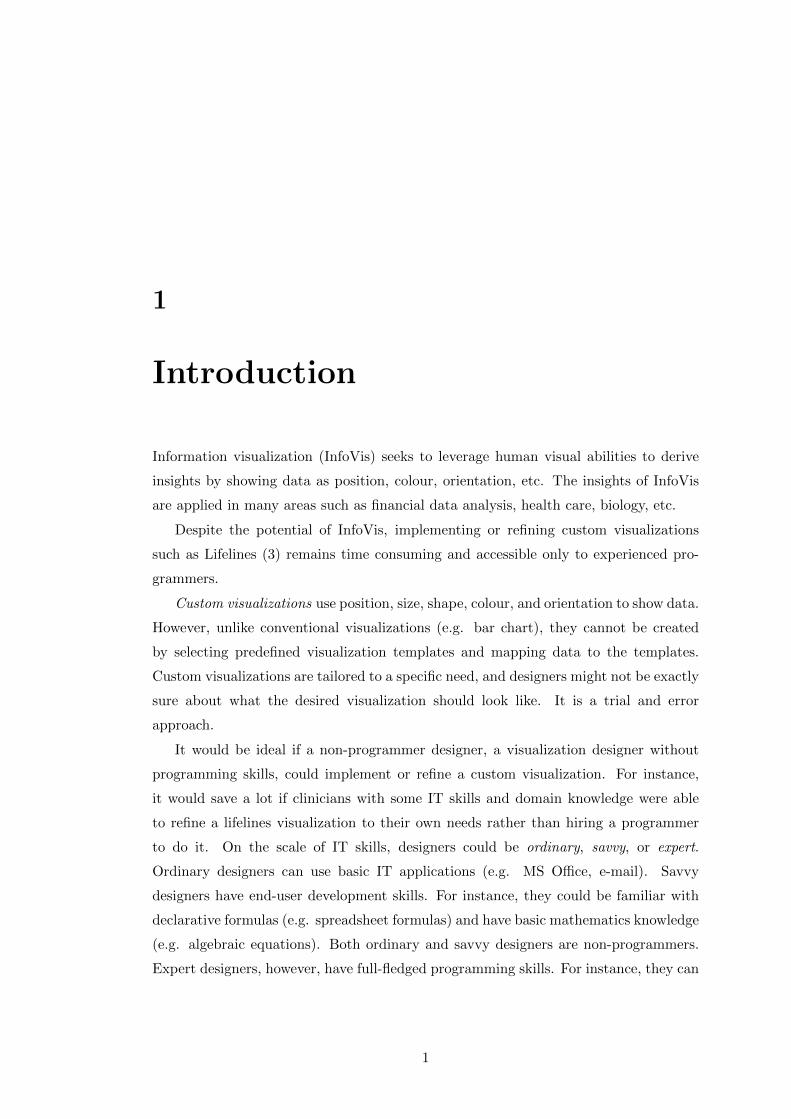
Information visualization (InfoVis) seeks to leverage human visual abilities to derive
insights by showing data as position, colour, orientation, etc. The insights of InfoVis
are applied in many areas such as financial data analysis, health care, biology, etc.
Despite the potential of InfoVis, implementing or refining custom visualizations
such as Lifelines (3) remains time consuming and accessible only to experienced pro-
grammers.
Custom visualizations use position, size, shape, colour, and orientation to show data.
However, unlike conventional visualizations (e.g. bar chart), they cannot be created
by selecting predefined visualization templates and mapping data to the templates.
Custom visualizations are tailored to a specific need, and designers might not be exactly
sure about what the desired visualization should look like. It is a trial and error
approach.
It would be ideal if a non-programmer designer, a visualization designer without
programming skills, could implement or refine a custom visualization. For instance,
it would save a lot if clinicians with some IT skills and domain knowledge were able
to refine a lifelines visualization to their own needs rather than hiring a programmer
to do it. On the scale of IT skills, designers could be ordinary, savvy, or expert.
Ordinary designers can use basic IT applications (e.g. MS Office, e-mail). Savvy
designers have end-user development skills. For instance, they could be familiar with
declarative formulas (e.g. spreadsheet formulas) and have basic mathematics knowledge
(e.g. algebraic equations). Both ordinary and savvy designers are non-programmers.
Expert designers, however, have full-fledged programming skills. For instance, they can
1
1. INTRODUCTION
declare variables, and understand recursion. Expecting ordinary designers to implement
or refine custom visualizations seems far fetched. Hence, this thesis realistically focuses
on allowing savvy designers to implement or refine custom visualizations.
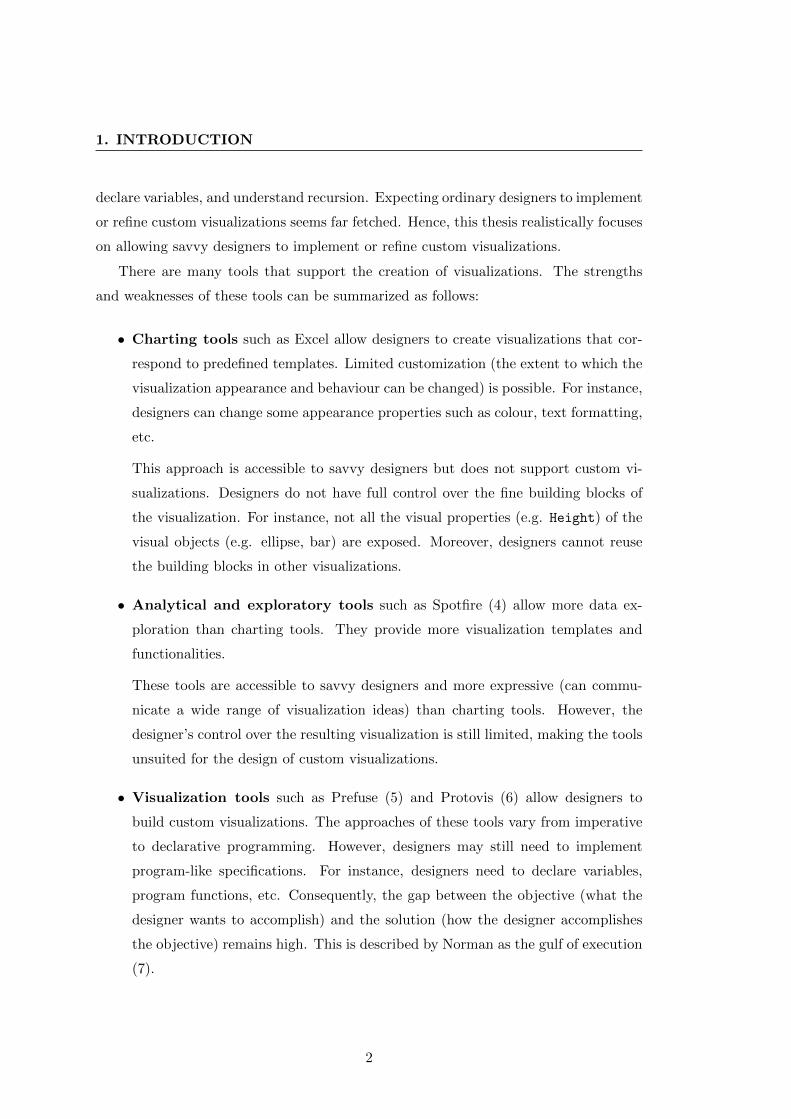
There are many tools that support the creation of visualizations. The strengths
and weaknesses of these tools can be summarized as follows:
• Charting tools such as Excel allow designers to create visualizations that cor-
respond to predefined templates. Limited customization (the extent to which the
visualization appearance and behaviour can be changed) is possible. For instance,
designers can change some appearance properties such as colour, text formatting,
etc.
This approach is accessible to savvy designers but does not support custom vi-
sualizations. Designers do not have full control over the fine building blocks of
the visualization. For instance, not all the visual properties (e.g. Height) of the
visual objects (e.g. ellipse, bar) are exposed. Moreover, designers cannot reuse
the building blocks in other visualizations.
• Analytical and exploratory tools such as Spotfire (4) allow more data ex-
ploration than charting tools. They provide more visualization templates and
functionalities.
These tools are accessible to savvy designers and more expressive (can commu-
nicate a wide range of visualization ideas) than charting tools. However, the
designer’s control over the resulting visualization is still limited, making the tools
unsuited for the design of custom visualizations.
• Visualization tools such as Prefuse (5) and Protovis (6) allow designers to
build custom visualizations. The approaches of these tools vary from imperative
to declarative programming. However, designers may still need to implement
program-like specifications. For instance, designers need to declare variables,
program functions, etc. Consequently, the gap between the objective (what the
designer wants to accomplish) and the solution (how the designer accomplishes
the objective) remains high. This is described by Norman as the gulf of execution
(7).
2
• Programming languages provide graphics APIs such as GDI+ (8) and Java
2D (9) that can be used to create advanced visualizations, but these languages
mainly target experienced programmers.
The programming languages can be integrated with development environments
(e.g. MS Visual Studio (10)). The environments allow programmers to manually
build a non-functional user interface. The environments use the drag-drop-set-
property approach. Programmers manually drag and drop graphical components
(buttons, text boxes, etc.) and set their properties. Then the screen looks right,
but it has little functionality. Programming behind is needed to make the interface
functional.
To sum up, existing tools are either inflexible and accessible to non-programmers,
or flexible and inaccessible to non-programmers.
An evaluation study (11) found out that drag-drop-set-property tools (called inter-
face builders and interactive graphical tools) were much more successful with designers
than program-based tools. The study also reports that spreadsheets are the only kind
of ”programming” widely accepted by end-users.
MS Access is an example of a successful drag-drop-set-property tool. Designers cre-
ate useful database applications by dragging and dropping UI elements (e.g. TextBox).
Further, designers define formulas that make the elements show data. However, the
formulas are very limited. For instance, it is not possible to show data as position,
orientation, etc.
Inspired by MS Access, Uvis is a drag-drop-set-property tool where designers drag
and drop visual objects, and specify formulas for the visual object properties. A for-
mula computes and sets the value of a property, and can bind visual objects to data.
A formula corresponds to a spreadsheet formula, but is able to combine data from
databases, visual components and end-user input. The detailed requirements of Uvis
can be found at (12). It encompasses a range of details, some of which are out of this
thesis scope. This thesis focuses on bridging the gaps in the existing approaches to
visualization by combining ease of learning and expressiveness.
The following section explains the Uvis approach.
3
1. INTRODUCTION
Property grid
formulas
Toolbox
Functions
Visual object
Error List
Data model
Table view
Visualization FormInspector
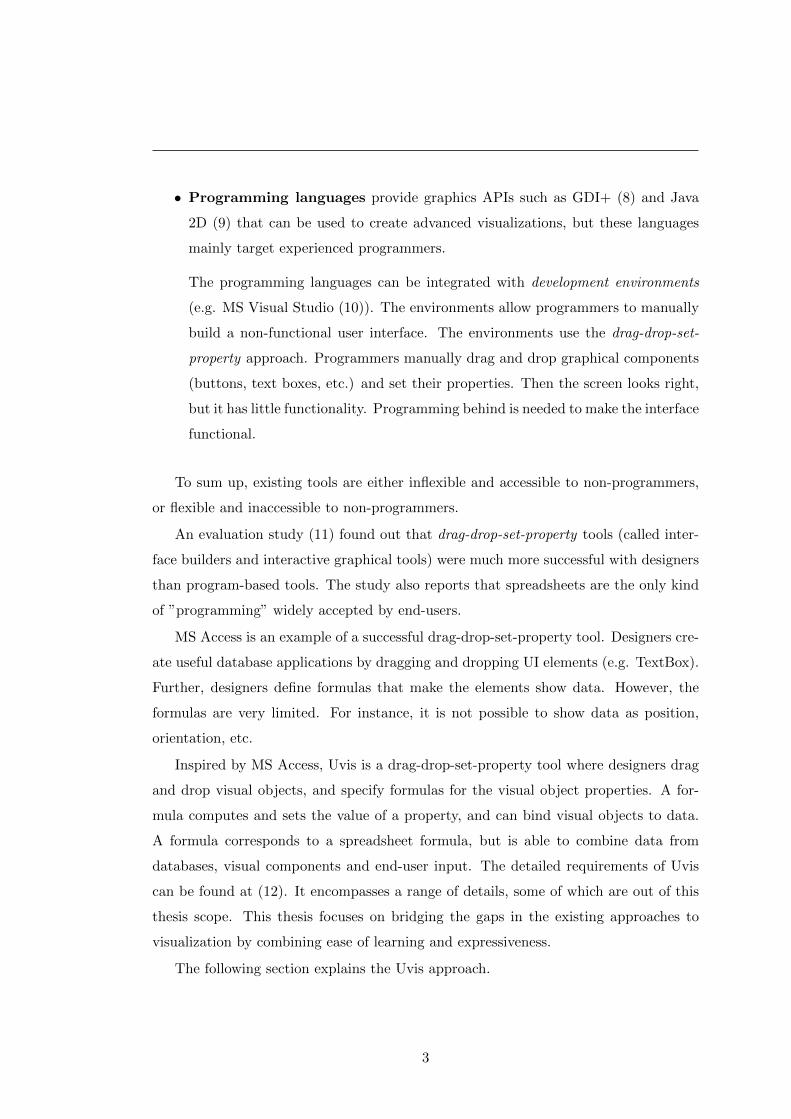
Figure 1.1: The Uvis environment
1.1 The Uvis Approach
The Uvis approach relies on these elements:
• The development environment assists the designer in creating or refining a
visualization (Figure 1.1). The environment consists of seven panels: toolbox,
visualization form, property grid, data model, error list, table view, and inspector.
The toolbox is a list of the available visual objects. The visualization form contains
the visualization the designer is currently building. The property grid allows the
designer to change the properties (e.g. colour, position, etc.) of a visual object.
The error list lists the problems in the visualization. The data model shows the
structure of the data the designer wants to show. The table view shows a sample
of the data in the data model. The inspector allows the designer to view data
behind the visual objects and their properties.
• The visual objects are the building blocks of a visualization. They can be
traditional UI elements (e.g. button, textbox), geometric shapes (e.g. ellipse, tri-
4
1.1 The Uvis Approach
angle), or specialized objects (e.g. time scale). The visual objects have properties
that define their appearance (e.g. position, size, colour) and behaviour.
• Formulas are declarative spreadsheet-like expressions that can bind visual ob-
jects to data and make their properties represent the data. The formulas can
refer to data fields, visual properties, functions, etc.
• The documentation is a tutorial that walks the designer step-wise through the
main Uvis concepts. It is easy to read, and contains concrete examples.
To create a visualization, the designer drags a visual object from the toolbox and
drops it on the visualization form. To make the visual object show data in the database,
the designer sets the Rows property with an SQL-like formula that can retrieve a subset
of tables in a relational database . The result is a local record set. Uvis creates a visual
object for each row in the record set. Uvis automatically positions the visual objects
like a staircase to make them visible to the designer. The designer sees the result
immediately in the visualization form.
To make the properties of the visual objects show data, the designer can set the
appearance properties (e.g. Height, Top) with formulas that refer to data fields in the
record set. Again, the designer sees the impact of the formulas in the visualization
form immediately.
If Uvis encounters errors while the designer is typing the formulas, Uvis highlights
the problematic parts, and produces a list of the errors.
To check that the visual objects show the right data in the right way, the designer
can select a visual object and view the data row behind it in the inspector. Moreover,
the designer can inspect the values of the formula sub-expressions.
Now we will give an example of how to create a visualization with Uvis. The
example uses the same style used in the documentation.
1.1.1 Example
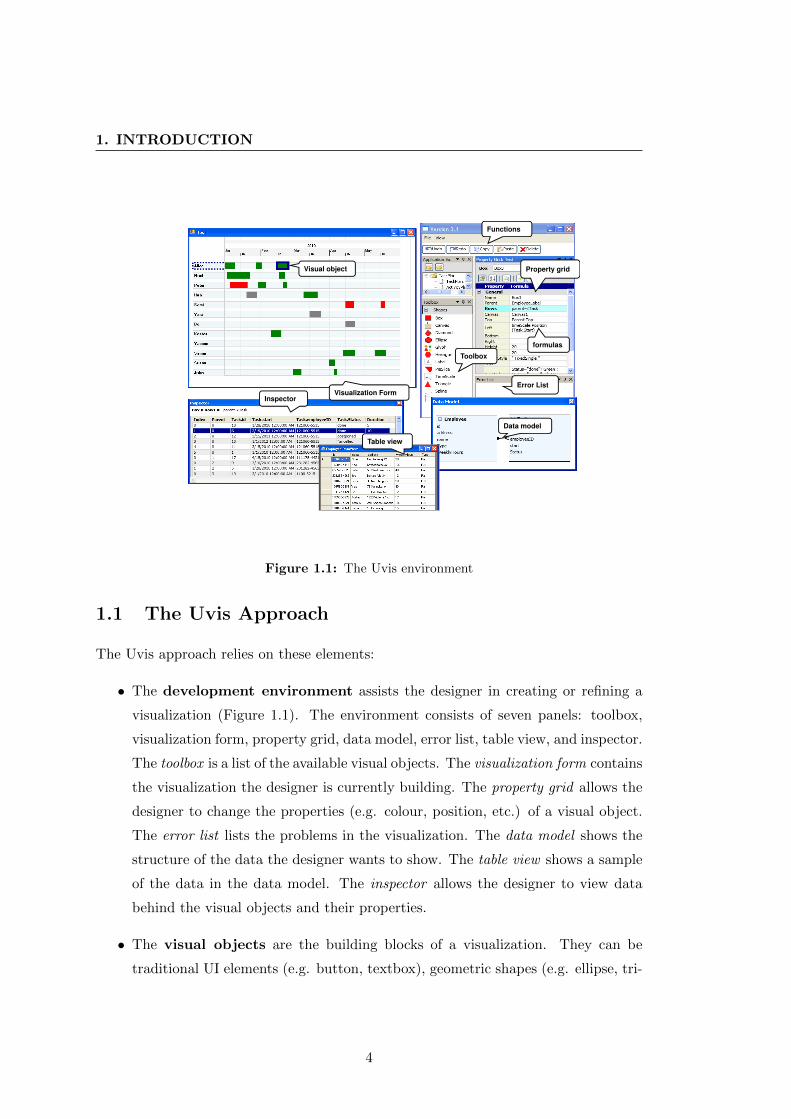
Objective: Kim is a Uvis experienced designer. She wants to create the visualization in
Figure 1.2 with Uvis. The visualization shows a task plan for employees. The employees
are shown as labels on the left. The employee tasks are shown as green, red, and grey
boxes. Each colour represents a task status: green for done, red for cancelled, and
5
1. INTRODUCTION
Figure 1.2: An employee task plan visualization. The model of the visualization data is
on the right.
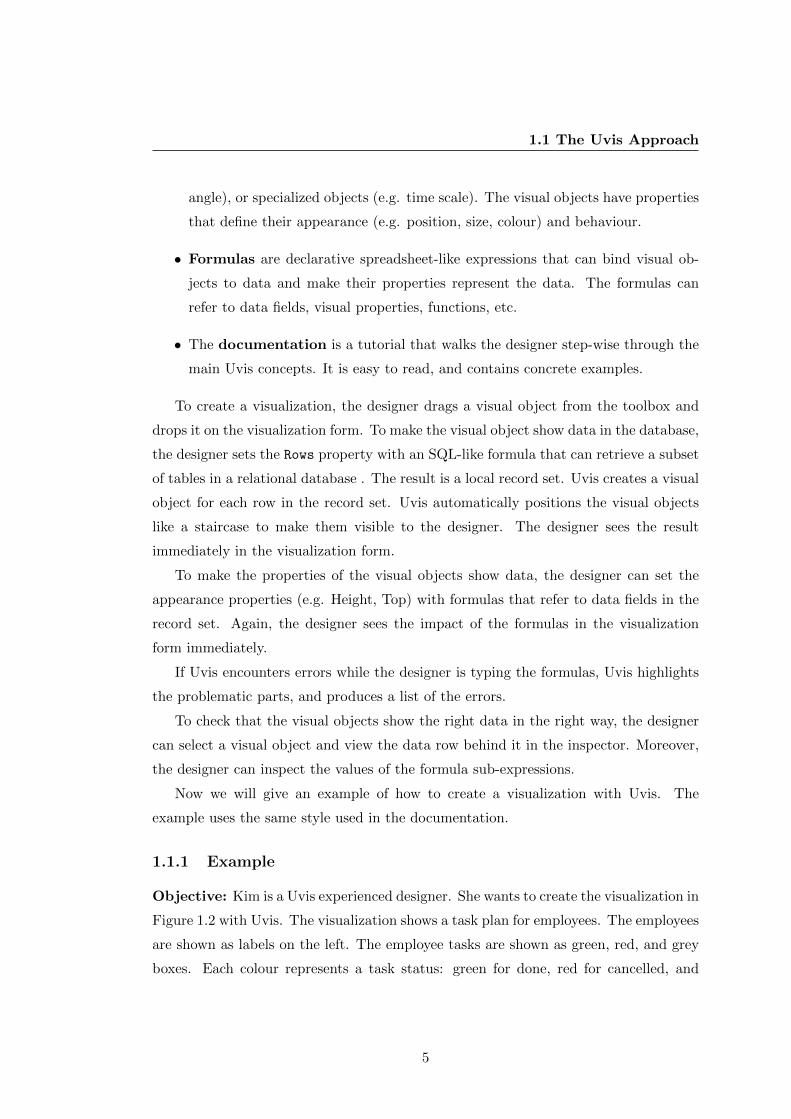
Figure 1.3: Double clicking the employee table (box) shows a sample of the table
6
1.1 The Uvis Approach
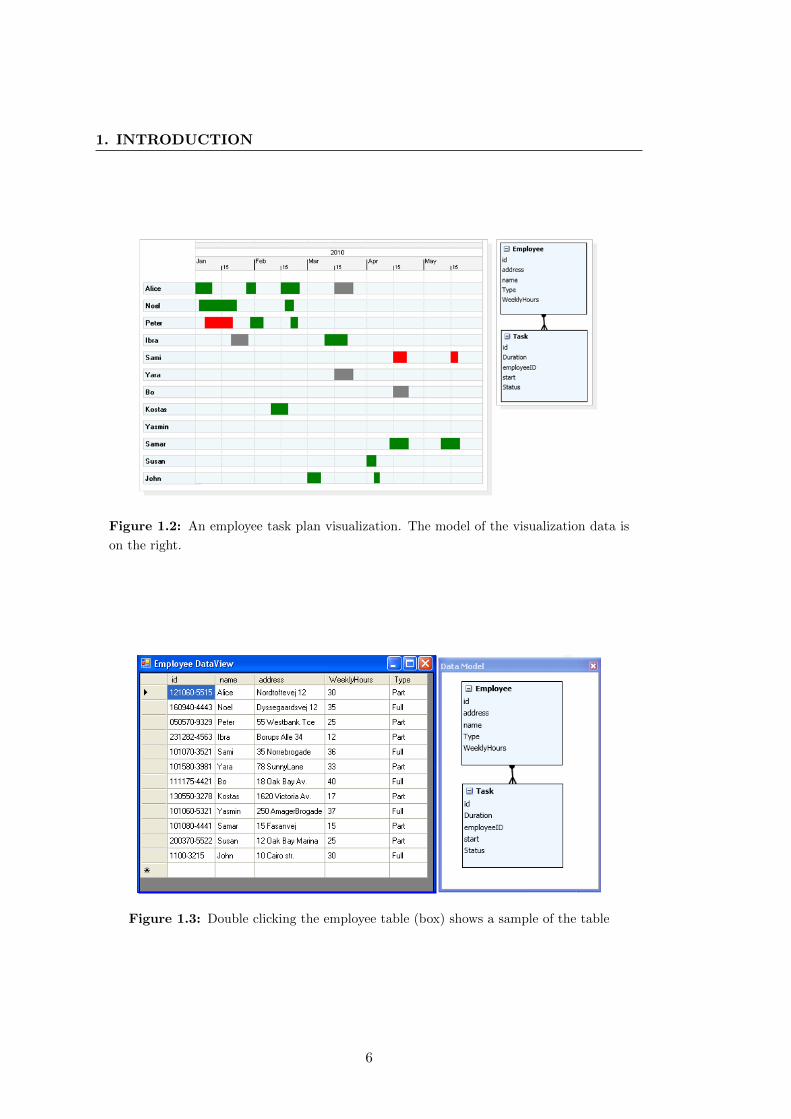
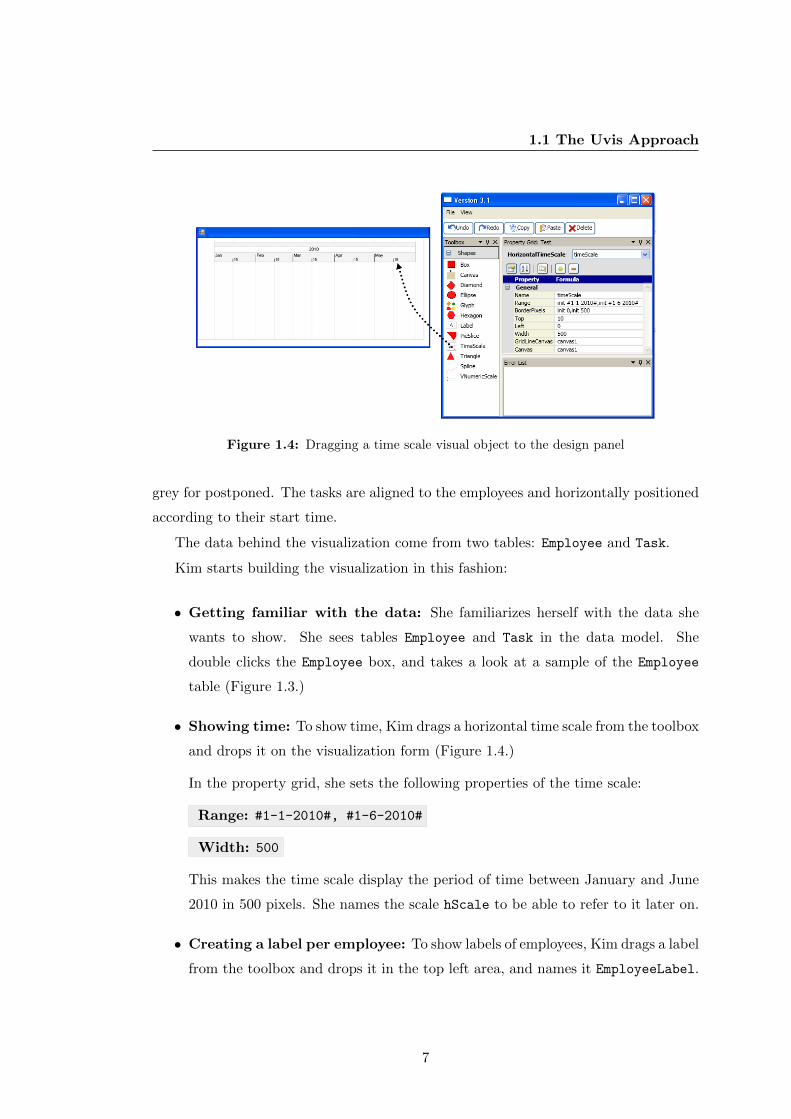
Figure 1.4: Dragging a time scale visual object to the design panel
grey for postponed. The tasks are aligned to the employees and horizontally positioned
according to their start time.
The data behind the visualization come from two tables: Employee and Task.
Kim starts building the visualization in this fashion:
• Getting familiar with the data: She familiarizes herself with the data she
wants to show. She sees tables Employee and Task in the data model. She
double clicks the Employee box, and takes a look at a sample of the Employee
table (Figure 1.3.)
• Showing time: To show time, Kim drags a horizontal time scale from the toolbox
and drops it on the visualization form (Figure 1.4.)
In the property grid, she sets the following properties of the time scale:
Range: #1-1-2010#, #1-6-2010#
Width: 500
This makes the time scale display the period of time between January and June
2010 in 500 pixels. She names the scale hScale to be able to refer to it later on.
• Creating a label per employee: To show labels of employees, Kim drags a label
from the toolbox and drops it in the top left area, and names it EmployeeLabel.
7
1. INTRODUCTION
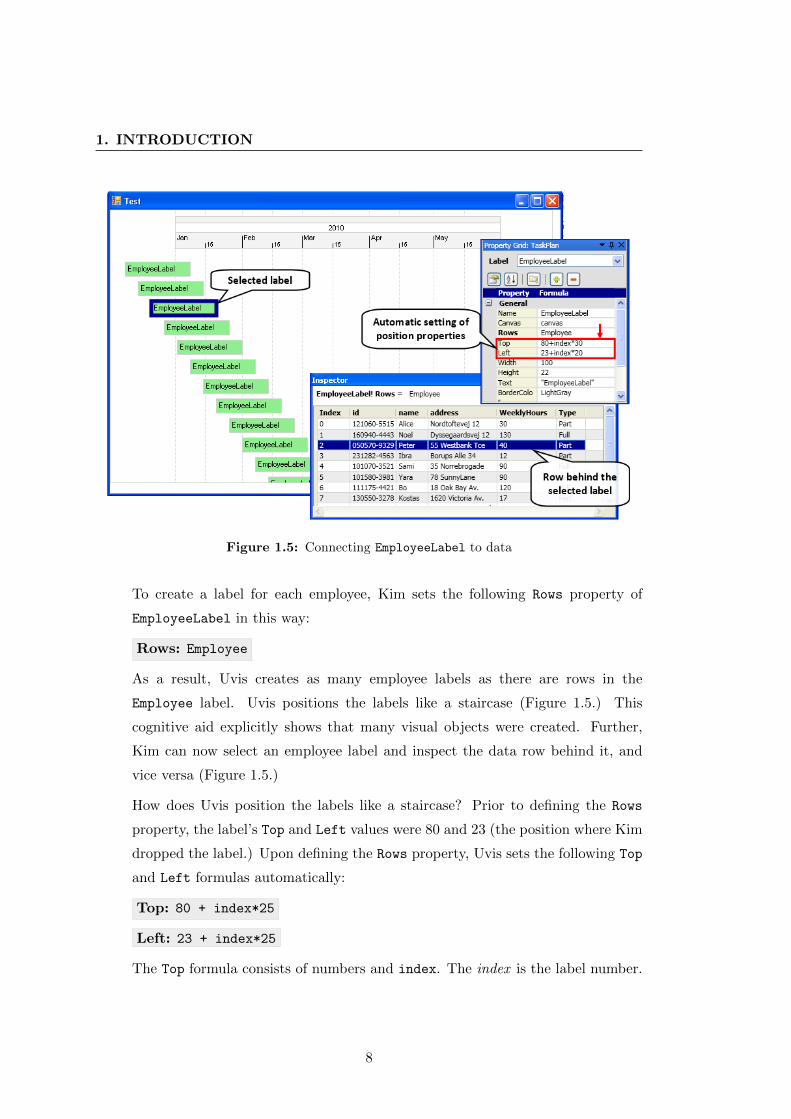
Figure 1.5: Connecting EmployeeLabel to data
To create a label for each employee, Kim sets the following Rows property of
EmployeeLabel in this way:
Rows: Employee
As a result, Uvis creates as many employee labels as there are rows in the
Employee label. Uvis positions the labels like a staircase (Figure 1.5.) This
cognitive aid explicitly shows that many visual objects were created. Further,
Kim can now select an employee label and inspect the data row behind it, and
vice versa (Figure 1.5.)
How does Uvis position the labels like a staircase? Prior to defining the Rows
property, the label’s Top and Left values were 80 and 23 (the position where Kim
dropped the label.) Upon defining the Rows property, Uvis sets the following Top
and Left formulas automatically:
Top: 80 + index*25
Left: 23 + index*25
The Top formula consists of numbers and index. The index is the label number.
8
1.1 The Uvis Approach
The first label’s index is 0, the second is 1, and so on. The Top formula means:
The first label’s top is 80 + 0*25 (80), the second labels top is 80 + 25 (105), and
so on. The Left formulas works in the same way. The result is that the labels
cascade like a staircase.
To gain some understanding of how the calculation happens, Kim can select (click)
the Top property, and the inspector will show all the Top values and the values
of sub-expressions (i.e. index.)
• Showing data from a table: To show the employee names on the labels, Kim
selects any employee label, and changes the following Text formula:
Text: Employee.name
The Text formula navigates to an Employee row and takes its name field. The
result is that the labels now show employee names.
• Showing visual objects that meet a criterion: To only show employees who
work more than 25 hours per week, Kim specifies the Rows property in this way:
Rows: Employee where WeeklyHours>20
The result is we only see employees with weekly work hours greater than 20.
• Showing related data: Kim wants to show the employee tasks as boxes. The
tasks reside in the Task table. The Task table has a many-to-one relationship
with the Employee table.
First, Kim drags and drops a Box object. Second, she specifies the following
formulas for the Rows and Parent properties:
Parent: EmployeeLabel
Rows: parent-<Task
The Parent formula means: Create a Box object for each parent (EmployeeLabel)
object. The Rows formula means: Start in the Employee row connected to
EmployeeLabel (the Parent). The join (-<) operator symbolizes a one-to-many
crow’s foot in the data model (Figure 1.2). Now navigate along the crow’s foot
to the Task table. The result is the related Task rows. Uvis creates Box objects
that correspond to the rows.
9
1. INTRODUCTION
• Aligning a visual object to the time scale: Kim wants to align the boxes
representing tasks to the time scale according to their start time. She selects a
task box, and defines the following Left property formula:
Left: hScale!Position(Task.start)
The Left formula means: Navigate to the time scale object (hScale). Call its
Position function with Task.Start as a parameter. The result is that the time
scale calculates the horizontal position of the task boxes according to their start
time (Task.Start.)
• Making a property depend on a condition: To make the task colour repre-
sent the status, Kim defines the following formula for the BackColor property:
BackColor: Task.Status="done"? Green : Task.Status="cancelled"?
Red : Gray
The BackColor formula looks at the field Task.Status. If it is done, make the
box green. If it is cancelled, make the box red. Otherwise, make the box grey.
• Checking the correctness of the visualization: To check that the visualiza-
tion shows the right data in the right way, Kim selects several employee labels,
looks at the connected rows, and checks all the weeklyhour values. They all are
greater than 20. This looks right. She moves on, and selects a task box. She looks
at the connected row, and checks whether Task.Status is done or cancelled, and
compares the status against the box colour. Kim moves on, and selects a box,
compares the Task.Start value against the visual position of the box. It looks
right too. Kim is now confident that her visualization is correct.
10
1.2 Thesis Statement and Research Contributions
1.2 Thesis Statement and Research Contributions
My hypothesis is as follows: It is possible to create custom visualizations with spreadsheet-
like formulas, and savvy designers can learn how to refine the custom visualizations.
This dissertation describes the following four primary contributions to the field of
information visualization:
• The first contribution is a mechanism of creating custom visualizations with Uvis
spreadsheet-like formulas. The visualizations cover several categories: time ori-
ented, radial, hierarchical, etc.
• The second contribution is a visualization system (Uvis) that allows savvy de-
signers to build formula-based visualizations with the drag-drop-set-property ap-
proach. The system provides cognitive aids that makes the process of building and
checking a custom visualization easy to learn. The system has been iteratively
designed based on feedback from savvy designers.
• The third contribution is a preliminary experimental evaluation with six potential
savvy designers. The evaluation assesses how easy it is to learn the Uvis approach.
The evaluation concludes that savvy designers can learn the basics of the Uvis
approach.
• The fourth contribution is a usability analysis of several visualization tools. It
highlights the striking differences between the existing approaches and Uvis.
1.3 List of Publications
• Mohammad A. Kuhail and Soren Lauesen. Customizable Visualizations with
Formula-linked Building Blocks. In GRAPP/IVAPP, pages 768 (771, 2012.)
• Mohammad A. Kuhail, Kostas Pandazo, and Soren Lauesen. Customizable Time-
Oriented Visualizations. In ISVC (2), pages 668 (677, 2012.)
• Mohammad A. Kuhail, Kostas Pantazos, and Soren Lauesen. The Inspector: A
Cognitive Artefact for Visual Mappings. In IVAPP 2013 proceedings.
• Mohammad A. Kuhail, Soren Lauesen, Kostas Pantazos, and XU Shangjin. Us-
ability Analysis of Custom Visualization Tools. In SIGRAD 2012 proceedings.
11
1. INTRODUCTION
1.4 Organization of the Dissertation
The rest of the dissertation is organized as follows.
An overview of the existing approaches to visualization construction. Also, a survey
of the relevant academic and commercial visualization and data analytic tools is given
in Chapter 2.
I substantiate that it is possible to express custom visualizations with formulas as
follows:
• The principles of Uvis formulas are explained through an example. This is fol-
lowed with principles ensuring that Uvis performs sufficiently (Chapter 3.)
• A collection of formula-based custom visualizations are presented. This is fol-
lowed with a discussion about the expressiveness and limitations of Uvis formulas
(Chapter 4.)
I refined Uvis to make sure it is easy to learn for savvy designers as follows:
• I carried out several usability studies with savvy designers. The studies resulted
in a refined version of Uvis. The initial and refined version of Uvis are presented.
In particular, the cognitive aids that support the designers that resulted from the
usability studies are presented (Chapter 5.) Furthermore, the usability studies
with savvy designers are summarized (Chapter 6.)
I substantiate that savvy designers can learn how to refine custom visualizations as
follows:
• Usability analysis of four tools including Uvis is presented. The analysis compares
the tool approaches using a custom visualization, and evaluates them using the
cognitive dimensions of notations (13).
• An evaluation study that was carried out with seven savvy designers is presented.
Finally, the benefits and limitations of the Uvis system, an outline of future work,
and a summary of contributions and findings are presented.
12
2
Background
This chapter provides an overview of the existing approaches to visualization. The
chapter describes each approach and assesses whether it is accessible to savvy designers
and suited for custom visualizations. The visualization reference model (Section 2.1) is
used where relevant to review how each approach supports visualization construction.
The existing approaches can be divided into charting tools (Section 2.2.1), analytical
and exploratory tools (Section 2.2.2), custom Visualization Tools (Section 2.2.3), and
programming languages (Section 2.2.4). A summary of the existing approaches is given
(Section 2.2.5).
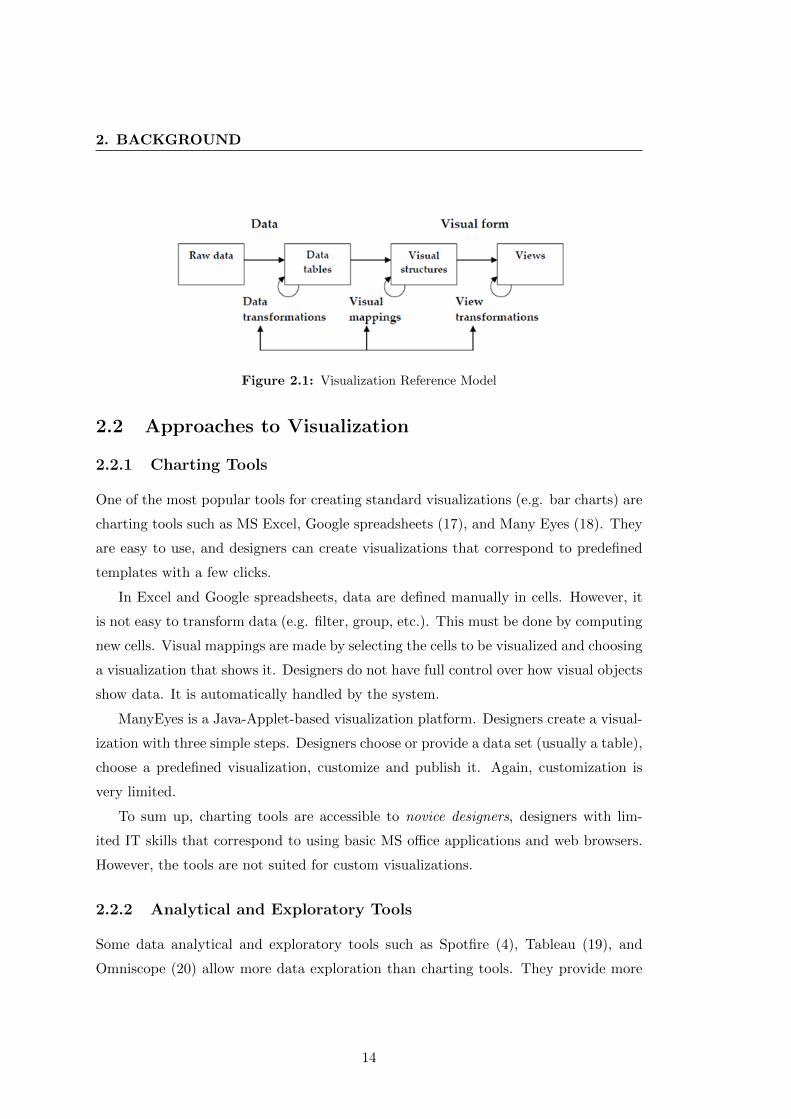
2.1 Visualization Reference Model
One of the most famous models that describes how designers create visualizations is
the visualization reference model ((14), (15)). The model decomposes the visualization
design into three steps (Figure 2.1): First, raw data is transformed into structured data
(e.g. tables) that can be further transformed by filtering, sorting, etc. (data transfor-
mations). Second, the data is mapped into visual structures (visual mappings). This
step is considered the most crucial step for visualization effectiveness and expressive-
ness (the breadth of visualization ideas that can be communicated) (16). Third, visual
structures are mapped into interactive views (view transformations). Chi showed that
the visualization reference model (or data state model) can characterize the majority
of visualization techniques through a taxonomy of visualization techniques.
The model is used to analyse the visualization systems in the following section.
13
2. BACKGROUND
Figure 2.1: Visualization Reference Model
2.2 Approaches to Visualization
2.2.1 Charting Tools
One of the most popular tools for creating standard visualizations (e.g. bar charts) are
charting tools such as MS Excel, Google spreadsheets (17), and Many Eyes (18). They
are easy to use, and designers can create visualizations that correspond to predefined
templates with a few clicks.
In Excel and Google spreadsheets, data are defined manually in cells. However, it
is not easy to transform data (e.g. filter, group, etc.). This must be done by computing
new cells. Visual mappings are made by selecting the cells to be visualized and choosing
a visualization that shows it. Designers do not have full control over how visual objects
show data. It is automatically handled by the system.
ManyEyes is a Java-Applet-based visualization platform. Designers create a visual-
ization with three simple steps. Designers choose or provide a data set (usually a table),
choose a predefined visualization, customize and publish it. Again, customization is
very limited.
To sum up, charting tools are accessible to novice designers, designers with lim-
ited IT skills that correspond to using basic MS office applications and web browsers.
However, the tools are not suited for custom visualizations.
2.2.2 Analytical and Exploratory Tools
Some data analytical and exploratory tools such as Spotfire (4), Tableau (19), and
Omniscope (20) allow more data exploration than charting tools. They provide more
14
2.2 Approaches to Visualization
visualization templates and functionalities. For instance, they allow conditional colour-
ing, sizing, etc.
Visual mappings are made by selecting predefined visualizations for selected data
and changing some settings for selected visual objects such as ”Size by” or Colour by”.
Tableau is a commercial data analytical tool that is based on Polaris (21). Tableau
helps designers to explore relational data through visualization. Designers drag and
drop ordinal and quantitative fields onto axis shelves to create visualizations. As a re-
sult, Tableau creates a visualization showing data from the fields. Tableau also employs
interaction techniques such zooming, and filtering. However, designers are limited in
customizing the visual output of the system.
Spotfire supports designers with a predefined number of visualizations (e.g. Line
charts) to analyse and interact with relational data. Furthermore, designers can create
visualizations using data from a number of data sources, such as ODBC/JDBC source,
flat files, xml files, etc. Like Tableau, Spotfire allows limited customization. Advanced
customization, though, can be obtained programmatically.
Like Tableau and Spotfire, Omniscope creates visualizations based on predefined
templates. Again, the designer does not have full control over the find building blocks
of the visualization.
To sum up, these tools are more expressive than charting tools. However, designer’s
control over the resulting visualization is still limited, making the tools unsuited for
the design of custom visualizations. For instance, a visualization like the Lifelines (3)
can not be made.
2.2.3 Custom Visualization Tools
The research community has produced several visualization systems that support cus-
tom visualizations. Examples include InfoVis (22), Improvise (23), Prefuse (5), Flare
(24), Protovis (6), and D3 (25). Only a few of these tools (e.g. Improvise and Protovis)
use development environments that assist designers in data transformations and visual
mappings. Figures 2.2 and 2.3 summarize the features that a representative set of these
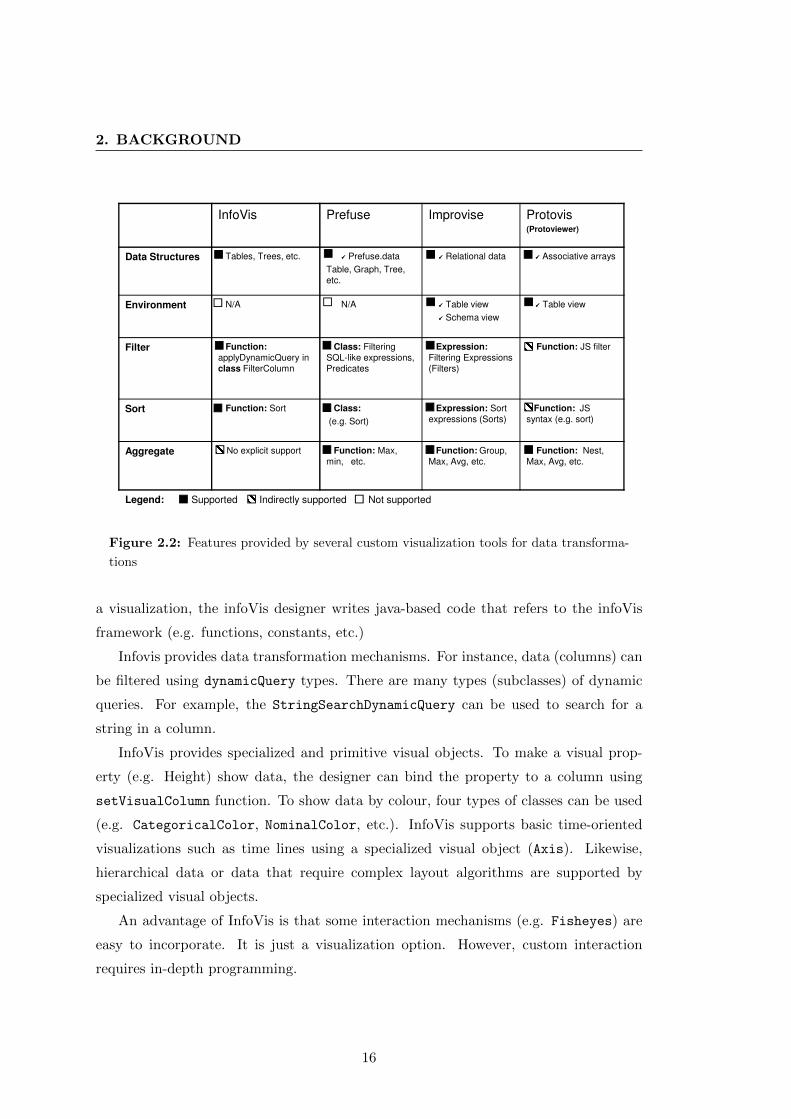
tools provide for data transformations and visual mappings.
InfoVis is a visualization toolkit that supports the creation of advanced visualiza-
tions such as trees and parallel co-ordinates. It provides a rich set of visual objects,
and a framework for managing data structures like tables, graphs, and trees. To create
15
2. BACKGROUND
InfoVis Prefuse Improvise Protovis(Protoviewer)
Data Structures Tables, Trees, etc. ���� Prefuse.data
Table, Graph, Tree,
etc.
���� Relational data ���� Associative arrays
Environment N/A N/A ���� Table view
���� Schema view
���� Table view
Filter Function:
applyDynamicQuery in
class FilterColumn
Class: Filtering
SQL-like expressions,
Predicates
Expression:
Filtering Expressions
(Filters)
Function: JS filter
Sort Function: Sort Class:
(e.g. Sort)
Expression: Sort
expressions (Sorts)
Function: JS
syntax (e.g. sort)
Aggregate � No explicit support Function: Max,
min, etc.
Function: Group,
Max, Avg, etc.
Function: Nest,
Max, Avg, etc.
Legend: Supported Indirectly supported Not supported
Figure 2.2: Features provided by several custom visualization tools for data transforma-
tions
a visualization, the infoVis designer writes java-based code that refers to the infoVis
framework (e.g. functions, constants, etc.)
Infovis provides data transformation mechanisms. For instance, data (columns) can
be filtered using dynamicQuery types. There are many types (subclasses) of dynamic
queries. For example, the StringSearchDynamicQuery can be used to search for a
string in a column.
InfoVis provides specialized and primitive visual objects. To make a visual prop-
erty (e.g. Height) show data, the designer can bind the property to a column using
setVisualColumn function. To show data by colour, four types of classes can be used
(e.g. CategoricalColor, NominalColor, etc.). InfoVis supports basic time-oriented
visualizations such as time lines using a specialized visual object (Axis). Likewise,
hierarchical data or data that require complex layout algorithms are supported by
specialized visual objects.
An advantage of InfoVis is that some interaction mechanisms (e.g. Fisheyes) are
easy to incorporate. It is just a visualization option. However, custom interaction
requires in-depth programming.
16

2.2 Approaches to Visualization
InfoVis Prefuse Improvise Protovis(Protoviewer)
Vis
ua
l
ob
jec
ts
Primitives Node(Circle, Ellipse,
etc.)
Java Shape
(Ellipse, etc)
Glyph (Rectangle,
Oval, etc.)
Mark (Dot, Bar,
Wedge, etc.)
Specialized AxisVisualization,
TreeVisualization, etc.
Graph, TreeMap,
etc.
BarChart,
MatrixView, etc.N/A
Environment
N/A N/A
���� WYSIWYG
���� selection
���� WYSIWYG
���� selection
Visual mappings function:
���� setVisualColumn
class:
���� action
expression:
���� projections.
expression:
���� Anonymous
���� functions
Abstract
(1D, 2D, Multi D)
visual objects:
���� Axis
���� MatrixAxisVisualization
class:
���� AxisLayout
visual objects:
���� ScatterPlot
���� PlaneView
visual objects:
���� Bar, Dot
class:
���� scales���� scales
GeographicalN/A N/A
visual objects:
���� PlaneView
visual objects:
���� GMAP
Temporal visual objects:
���� Axis
class:
���� AxisLayout
visual objects:
���� PlaneView
class:
���� scales
Tree visual objects:
���� Tree
���� TreeMap
visual objects:
���� Tree
���� TreeMap
N/A
class:
���� layout
Network visual objects:
���� Graph
visual objects:
���� Graph
class:����
ForceDirectedLayout
N/A
class:
���� layout
Legend: Supported Indirectly supported Not supported
Pre
se
nta
tio
n T
yp
e
Figure 2.3: Features provided by several custom visualization tools for visual mappings
17
2. BACKGROUND
In summary, InfoVis supports useful visualizations, but the designer needs in-depth
knowledge of the various abstractions (e.g. classes, functions). Designers can combine
the abstractions to create custom visualizations or programmatically extend the ab-
stractions. The approach requires in-depth tool and programming knowledge to create
custom visualizations.
Flare borrows many of its concepts from Prefuse, but supports web-based visu-
alizations. It is a visualization toolkit written in ActionScript. This toolkit supports
designers with a variety of simple and advanced visualizations. Designers define the
properties of the visual objects (e.g., position, shape, colour), and write imperative
commands to create the visualization. Designers can also define new operators and
visual objects. However, solid programming is required.
Improvise is a visualization system that mainly supports coordinated visualiza-
tions. The visual properties can show data using declarative expressions. The ex-
pressions can be conditional, logical, mathematical, etc. Designers use a development
environment to create a visualization. They navigate from panel to panel to accomplish
visual mappings. Each panel has a distinct purpose. For instance, one panel shows the
available visual objects and their properties. Another panel shows the variables that
can be used in expressions.
For data transformations, Improvise provides a table view for the to-be-visualized
tables. The tables can be filtered using Filters expression. The designer composes
an expression by choosing logical operators (e.g. >, <, AND, etc.) from a combo box.
The resulting expression is shown as a tree. To make the expression operands refer to
data fields, the designer assigns a variable to an expression operand and binds it to a
field in another panel. Sort and Group by expressions are created in a similar fashion.
To create a visual object, the designer chooses a visual object (control) from a
list (Type list). Next, the designer chooses a visual property of the visual object from
the Properties list, and creates Projections expressions that can map data to the
property. The projections are created in a fashion similar to other expressions (e.g.
Filters, Sort, etc.), and can contain mathematical or logical operators, and refer to
functions and data fields. Improvise provides specialized visual objects that facilitate
visual mappings. For instance, it supports time-oriented and geographical data using
a specialized visual object PlaneView.
18
2.2 Approaches to Visualization
Improvise allows some interaction using interactive components such as sliders. The
designer can link the interactive components with visualizations using shared variables.
However, this requires navigating back and forth through a series of panels.
In summary, Notation-wise, Improvise use declarative programming. However, the
environment forces the designer to use combo-boxes that have the expression elements.
It is difficult to find the expression elements. Moreover, the longer the expression, the
harder it is to create and read.
Protovis is a JavaScript-based visualization toolkit that uses a declarative domain
specific language that can map data to geometric visual objects (e.g. bar, dot, etc.)
and their properties. The toolkit can be extended with a development environment
called ”Protoviewer” (26).
Data transformations are supported by Protoviewer and the toolkit. Protoviewer
provides a table view for the to-be-visualized tables. The tables can be programmati-
cally filtered or sorted using JavaScript filter or sort functions. Protovis provides a
function nest to transform flat to relational (multi-dimensional) arrays. Furthermore,
Protovis provides statistical functions such as max (maximum), avg (average) that can
be applied on an array.
Visual mappings are supported as follows: To bind a visual object (mark) to data,
the designer passes an array to property data. To let a visual property (e.g. Height)
represent data, the designer specifies a declarative expression (an anonymous function).
The expressions can contain mathematical , logical, and conditional operators, reference
to functions, and array columns. Protovis evaluates the expressions for each visual
object, and the designer does not need to specify any loops. Protovis provides non-
visual objects (scales) that support temporal data. The scales generate ticks data
that can be used to draw ticks. Protovis provides layout classes (e.g. Treemap) that
encapsulate complex algorithms, and support hierarchical visualizations such as trees.
Protovis supports interaction. However, it is much like event-driven programming.
Even worse, the interactive components (e.g. combo boxes) are often separate HTML
objects that are not part of the specifications.
To sum up, Protovis mostly uses declarative rather than imperative programming.
This simplifies the effort required by the designers since they specify what the visualiza-
tion should be rather than how it is constructed. Unlike Prefuse, Protovis expressions
19
2. BACKGROUND
are directly associated with the visual properties. However, the specifications in Pro-
tovis remain program-like, and the designer often needs to define variables and worry
about the sequence of doing things.
D3 is a JavaScript library for manipulating documents based on data. It borrows a
lot of its concepts from Protovis, but is more expressive since it leverages web standards.
It can be used to create custom visualizations, but the specifications are program-like.
Although custom visualization tools can be improved, for instance by providing an
environment that has some features (e.g. drag-drop) or tutorials, there would still be
a cognitive barrier for savvy designers. They would still need to write code, define
variables and loops, etc.
2.2.4 Programming Languages
Several programming languages provide general purpose graphics APIs such as GDI+
(8) and Java 2D (9), and Processing (27). The APIs provide low-level building blocks
such as lines, curves, and ellipses. Such building blocks can be combined in numerous
ways to compose visualizations. However, since they are general-purpose languages,
it is tedious and hard to construct visualizations with this approach. Moreover, this
approach requires programming skills that many visualization designers do not have.
The programming languages can be integrated with development environments like
NetBeans (28), Eclipse (29), and MS Visual Studio (10). Providing cognitive aids, the
environments can facilitate the development. For instance, the environments highlight
the erroneous parts of the code, and provide suggestions while the developer is writing
the code (Auto-completion). Still, these environments are designed to help program-
mers while coding, not designers while designing a visualization.
Processing is a programming language that can be used to construct interactive
advanced visualizations. It is very expressive, and designers have full control over the
fine building blocks of a visualization. However, it requires imperative programming,
loops, etc. Processing has a development environment that allows designers to type the
visualization specifications and view the outcome.
To sum up, the programming languages are very expressive but accessible only to
expert designers, designers with solid programming skills.
20
2.2 Approaches to Visualization
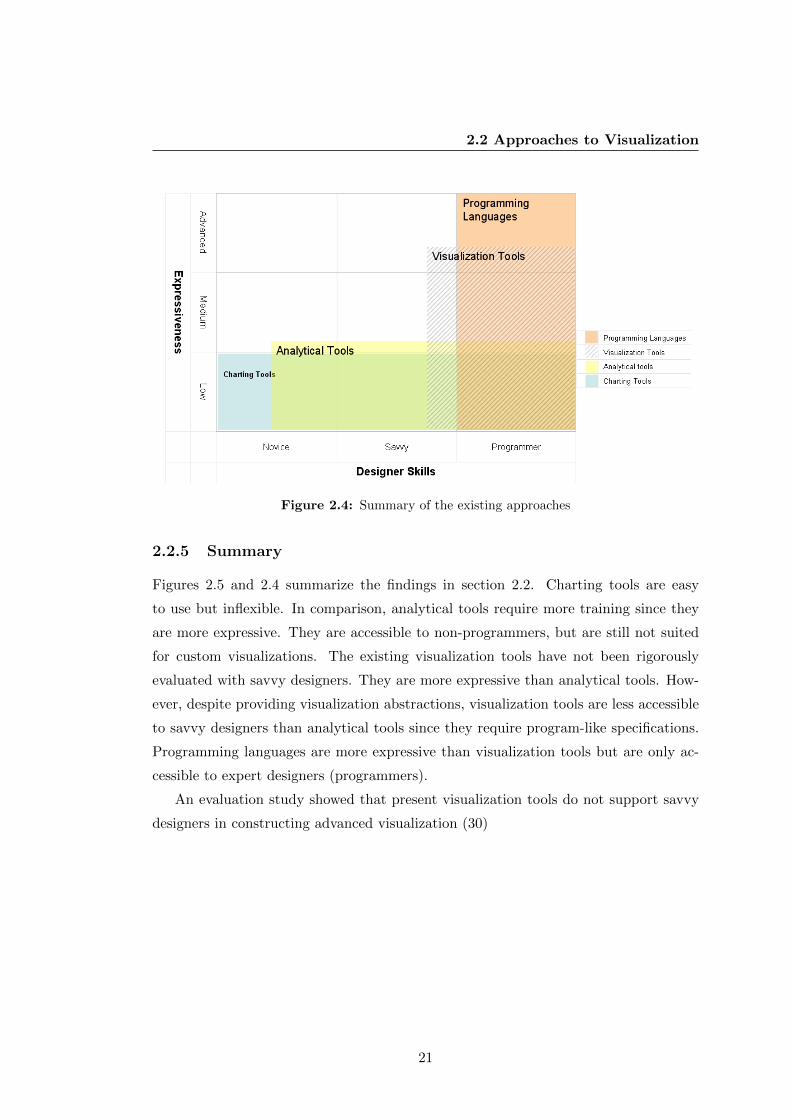
Figure 2.4: Summary of the existing approaches
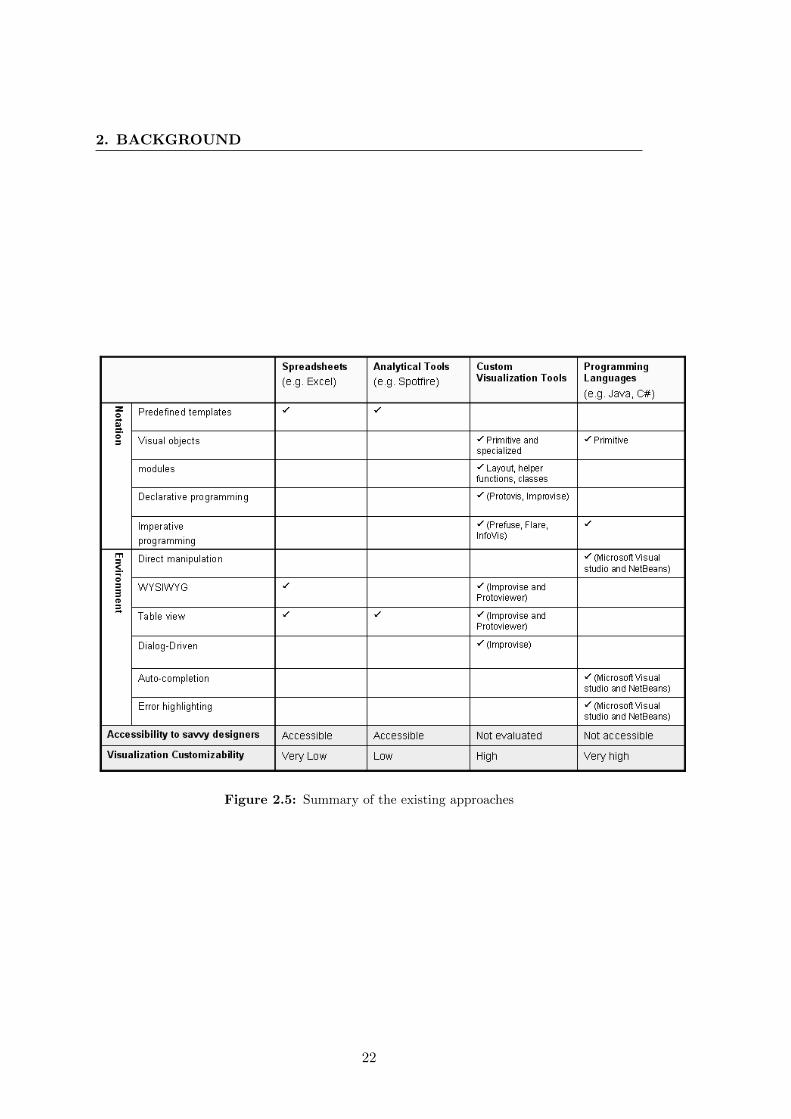
2.2.5 Summary
Figures 2.5 and 2.4 summarize the findings in section 2.2. Charting tools are easy
to use but inflexible. In comparison, analytical tools require more training since they
are more expressive. They are accessible to non-programmers, but are still not suited
for custom visualizations. The existing visualization tools have not been rigorously
evaluated with savvy designers. They are more expressive than analytical tools. How-
ever, despite providing visualization abstractions, visualization tools are less accessible
to savvy designers than analytical tools since they require program-like specifications.
Programming languages are more expressive than visualization tools but are only ac-
cessible to expert designers (programmers).
An evaluation study showed that present visualization tools do not support savvy
designers in constructing advanced visualization (30)
21
2. BACKGROUND
Figure 2.5: Summary of the existing approaches
22

3
Uvis Formulas
3.1 Introduction
Uvis formulas are declarative spreadsheet-like expressions that can bind visual objects
to data and make their properties represent the data.
This chapter presents the principles of Uvis formulas as follows: First, the Uvis
architecture is presented (section 3.2.) The architecture explains the context in which
Uvis formulas operate. Second, the visual objects, their properties, and their func-
tions are presented (section 3.3.) Third, the formula principles are explained using an
example (section 3.4.)
Of course a useful visualization has to perform sufficiently. The chapter discusses
the design principles that ensure that Uvis performs sufficiently. The principles are
followed with performance figures (section 3.5.)
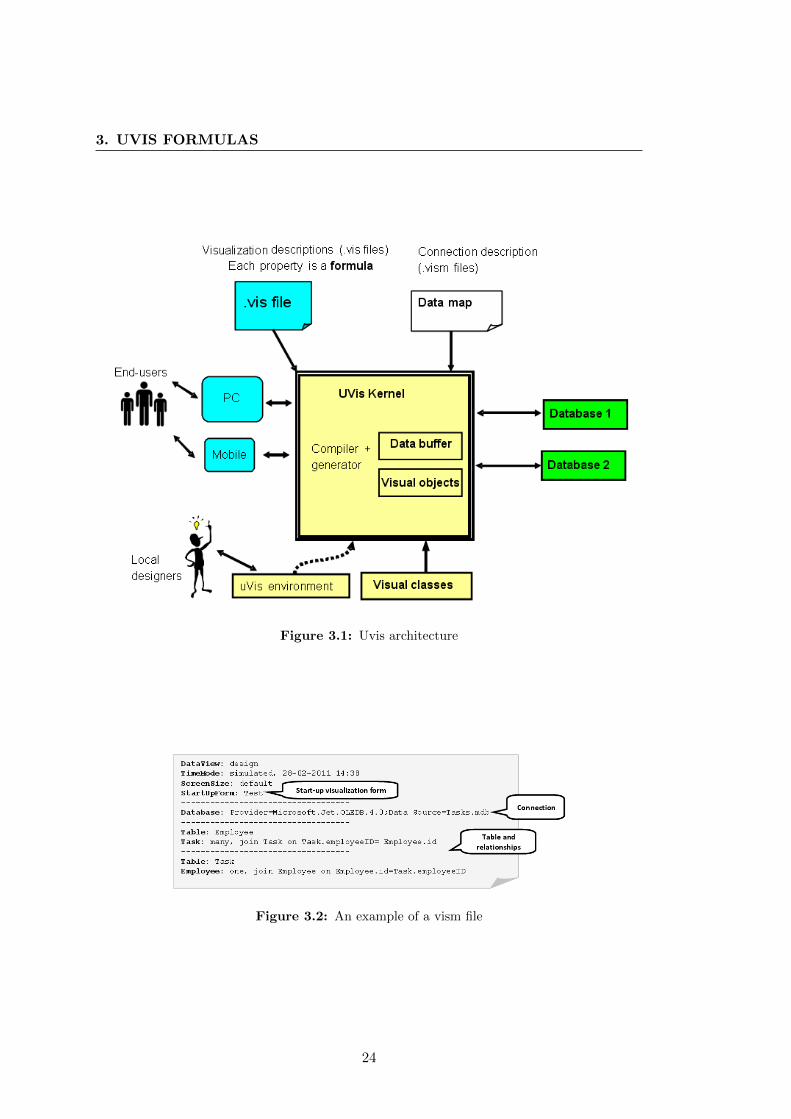
3.2 Architecture
Figure 3.1 shows the Uvis system architecture. A Connection description file (vism
file) is a text file with vism extension (Figure 3.2). It contains descriptions of connection
to one or more databases, the relationships of interest, and the foreign and primary
keys behind the relationships. Further, it contains a reference to a visualization form
to be shown at start up. A data architect or a programmer writes these descriptions.
The Uvis kernel reads this file, establishes connection to database, and prepares the
relationships that designers can use.
23
3. UVIS FORMULAS
Figure 3.1: Uvis architecture
Figure 3.2: An example of a vism file
24
3.3 Visual Objects
.NET
Button
Text box
Check box
Geometric
Box
Triangle
Ellipse
Specialized
Spline
VNumericAxis
HTimeScale
A Label
RangeSlider PieSliceRangeSlider PieSlice
Figure 3.3: Examples of Uvis visual objects
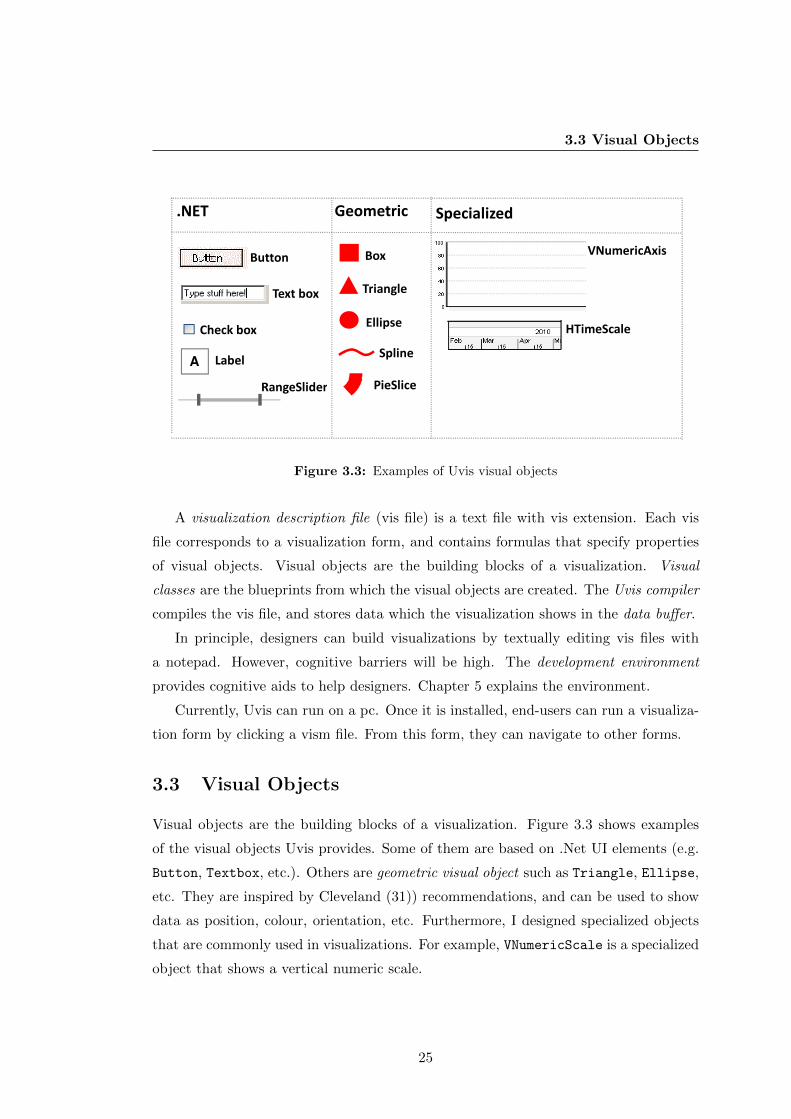
A visualization description file (vis file) is a text file with vis extension. Each vis
file corresponds to a visualization form, and contains formulas that specify properties
of visual objects. Visual objects are the building blocks of a visualization. Visual
classes are the blueprints from which the visual objects are created. The Uvis compiler
compiles the vis file, and stores data which the visualization shows in the data buffer.
In principle, designers can build visualizations by textually editing vis files with
a notepad. However, cognitive barriers will be high. The development environment
provides cognitive aids to help designers. Chapter 5 explains the environment.
Currently, Uvis can run on a pc. Once it is installed, end-users can run a visualiza-
tion form by clicking a vism file. From this form, they can navigate to other forms.
3.3 Visual Objects
Visual objects are the building blocks of a visualization. Figure 3.3 shows examples
of the visual objects Uvis provides. Some of them are based on .Net UI elements (e.g.
Button, Textbox, etc.). Others are geometric visual object such as Triangle, Ellipse,
etc. They are inspired by Cleveland (31)) recommendations, and can be used to show
data as position, colour, orientation, etc. Furthermore, I designed specialized objects
that are commonly used in visualizations. For example, VNumericScale is a specialized
object that shows a vertical numeric scale.
25
3. UVIS FORMULAS
Rows Connects visual objects to data.
Parent Shares the data of a visual object with another visual object.
Top The distance, in pixels, between the top edge of a visual object and the
top edge of the form.
Left The distance, in pixels, between the left edge of a visual object and the
left edge of the form.
Right The distance, in pixels, between the right edge of a visual object and the
left edge of the form.left edge of the form.
Bottom The distance, in pixels, between the bottom edge of a visual object and
the top edge of the form.
Height The height of the visual object.
Width The width of the visual object.
BackColor The background colour of the visual object.
BorderColor The border colour of the visual object.
Figure 3.4: Examples of common built-in properties
Width
Height
Height
Width
Height
Width
Width
Height
Width
Height
Width
Height
Box
TriangleDiamond
Ellipse
Hexagon Pentagon PlusForm
Figure 3.5: Size and position properties of some visual objects
Figure 3.6: Visual-object-specific properties
26

3.3 Visual Objects
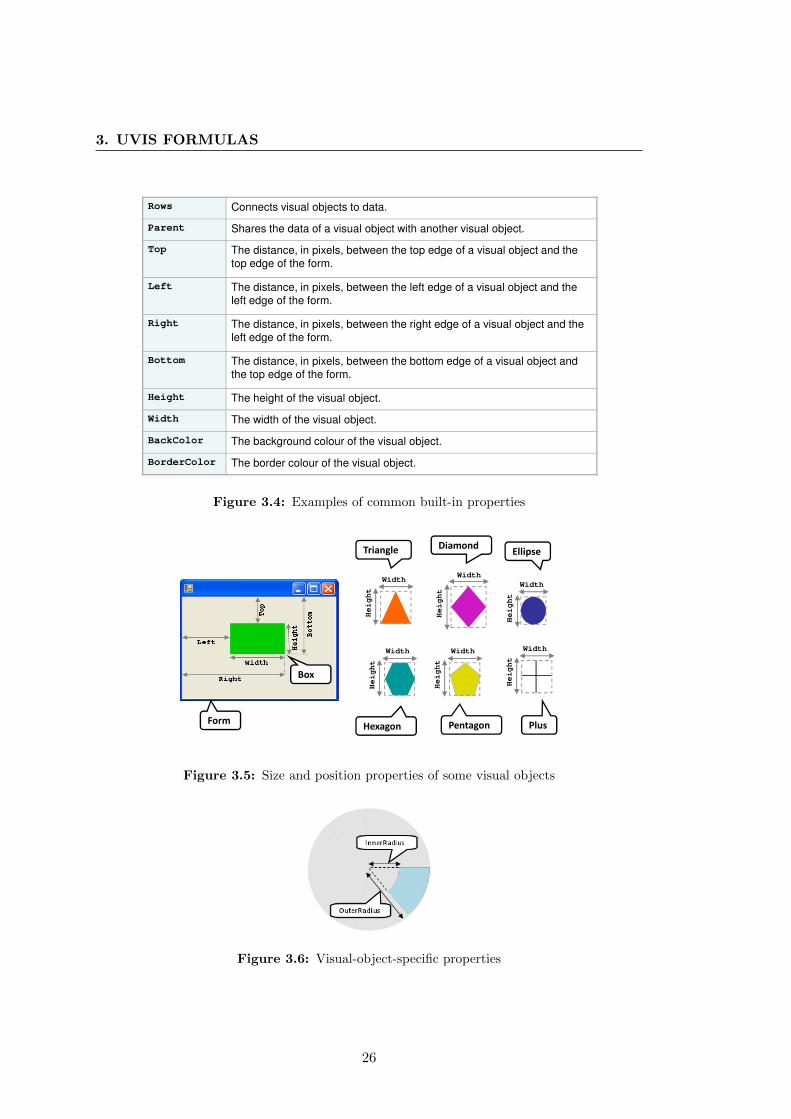
3.3.1 Properties
Visual objects have properties. The properties can bind the visual objects to data and
determine their appearance and behaviour. Each property can have a formula that
computes its values.
There are four kinds of properties:
• Built-in properties are defined by the visual object. They bind visual objects
to data and determine the visual object appearance (e.g. position, size, colour,
etc.). For consistency, some built-in properties are common for all visual objects.
Figure 3.4 and Figure 3.5 show examples of the common built-in properties.
Other built-in properties are specific to some visual objects. For instance, a
PieSlice has InnerRadius and OuterRadius as specific properties (Figure 3.6.)
• Designer properties are added by the designer. As an example, the designer
may write a complex formula in such a property and let other properties refer to
it rather than repeat it. As another example, the designer may define a property
without a formula. It serves as a variable that keeps track of whether the end-user
has clicked this control.
• Event properties do not have a formula but one or more statements that are
performed when the event happens. As an example, the Click event for a Button
may contain an OpenForm statement that opens another form.
3.3.2 Functions
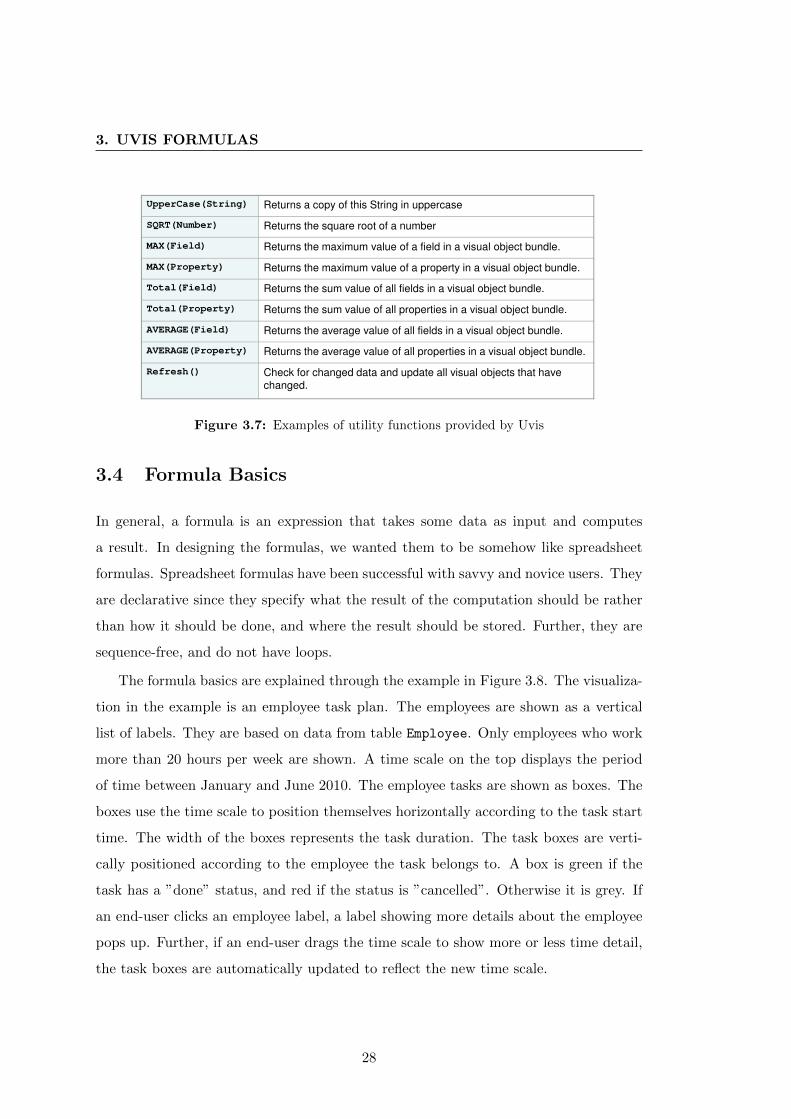
As other tools, Uvis has utility functions (e.g. math, string, and aggregation functions).
Further, it has a Refresh function that causes Uvis to explicitly check for changed data
and update all visual objects that have changed. Figure 3.7 shows examples of these
functions.
Some visual objects have built-in functions that formulas can call. As an example,
HTimeScale provides functions that can translate a point in time into a pixel position,
and vice versa. This allows a visual object to position itself according to a point in
time.
27
3. UVIS FORMULAS
UpperCase(String) Returns a copy of this String in uppercase
SQRT(Number) Returns the square root of a number
MAX(Field) Returns the maximum value of a field in a visual object bundle.
MAX(Property) Returns the maximum value of a property in a visual object bundle.
Total(Field) Returns the sum value of all fields in a visual object bundle.
Total(Property) Returns the sum value of all properties in a visual object bundle.
AVERAGE(Field) Returns the average value of all fields in a visual object bundle.
AVERAGE(Property) Returns the average value of all properties in a visual object bundle.
Refresh() Check for changed data and update all visual objects that have
changed.
Figure 3.7: Examples of utility functions provided by Uvis
3.4 Formula Basics
In general, a formula is an expression that takes some data as input and computes
a result. In designing the formulas, we wanted them to be somehow like spreadsheet
formulas. Spreadsheet formulas have been successful with savvy and novice users. They
are declarative since they specify what the result of the computation should be rather
than how it should be done, and where the result should be stored. Further, they are
sequence-free, and do not have loops.
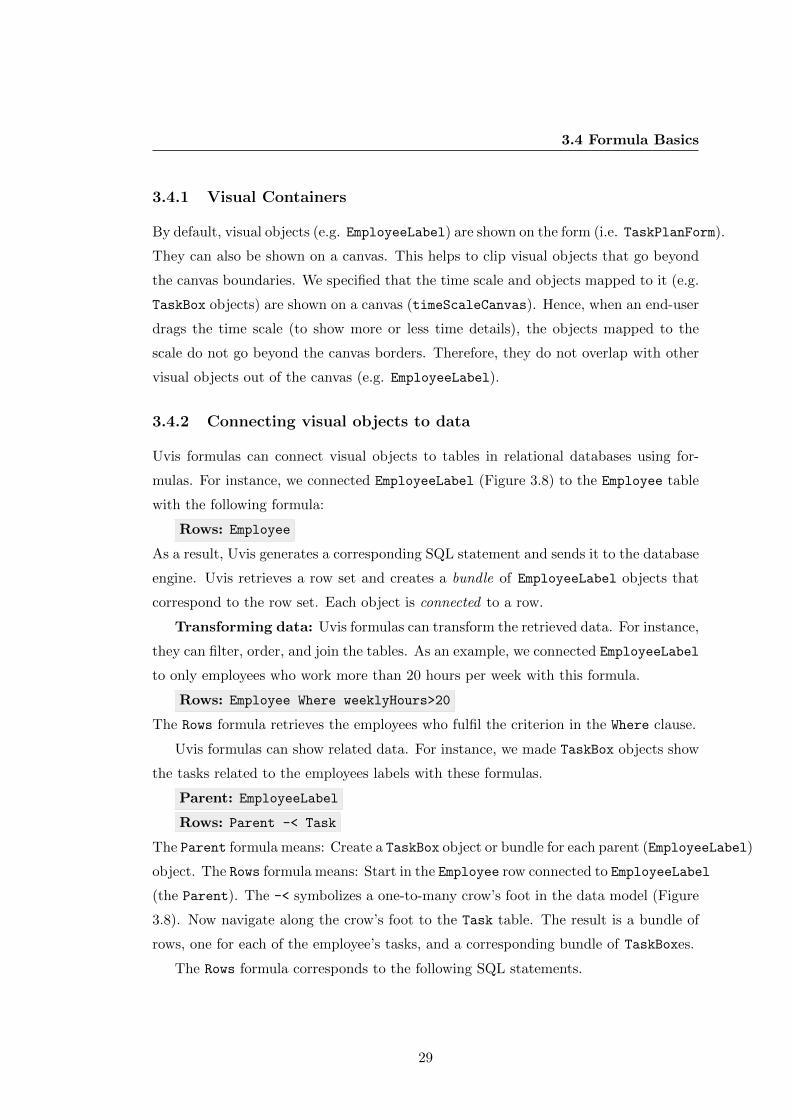
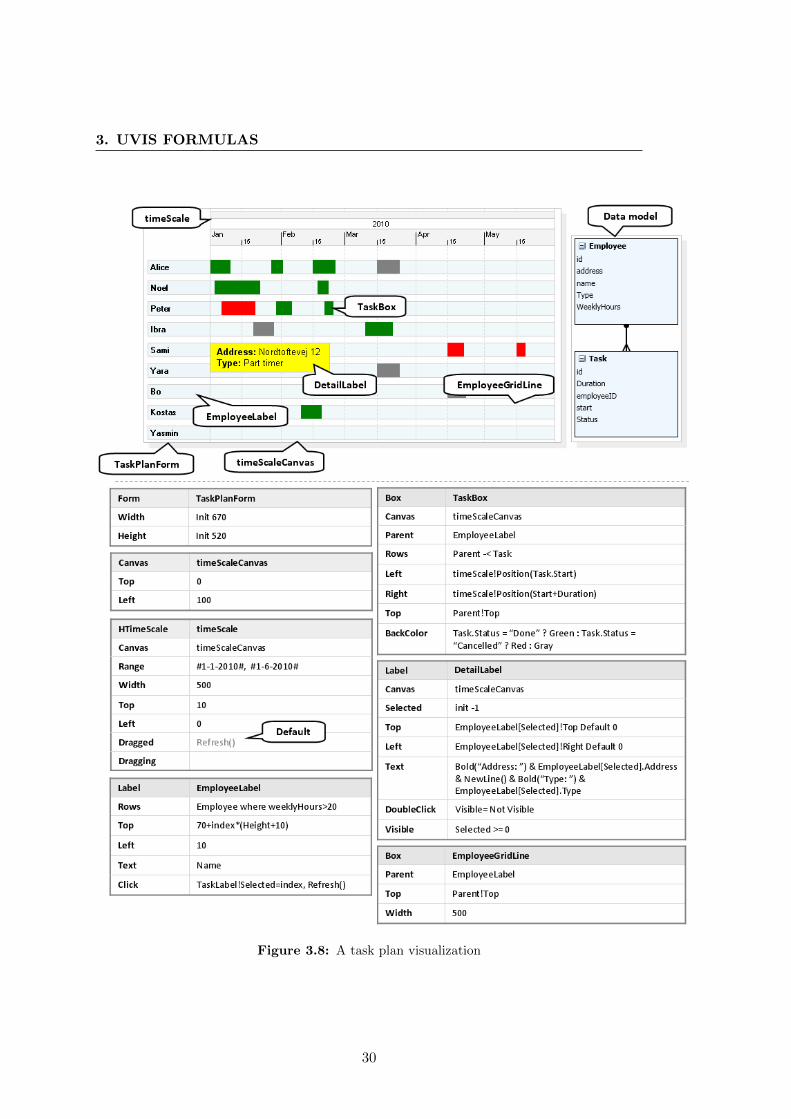
The formula basics are explained through the example in Figure 3.8. The visualiza-
tion in the example is an employee task plan. The employees are shown as a vertical
list of labels. They are based on data from table Employee. Only employees who work
more than 20 hours per week are shown. A time scale on the top displays the period
of time between January and June 2010. The employee tasks are shown as boxes. The
boxes use the time scale to position themselves horizontally according to the task start
time. The width of the boxes represents the task duration. The task boxes are verti-
cally positioned according to the employee the task belongs to. A box is green if the
task has a ”done” status, and red if the status is ”cancelled”. Otherwise it is grey. If
an end-user clicks an employee label, a label showing more details about the employee
pops up. Further, if an end-user drags the time scale to show more or less time detail,
the task boxes are automatically updated to reflect the new time scale.
28
3.4 Formula Basics
3.4.1 Visual Containers
By default, visual objects (e.g. EmployeeLabel) are shown on the form (i.e. TaskPlanForm).
They can also be shown on a canvas. This helps to clip visual objects that go beyond
the canvas boundaries. We specified that the time scale and objects mapped to it (e.g.
TaskBox objects) are shown on a canvas (timeScaleCanvas). Hence, when an end-user
drags the time scale (to show more or less time details), the objects mapped to the
scale do not go beyond the canvas borders. Therefore, they do not overlap with other
visual objects out of the canvas (e.g. EmployeeLabel).
3.4.2 Connecting visual objects to data
Uvis formulas can connect visual objects to tables in relational databases using for-
mulas. For instance, we connected EmployeeLabel (Figure 3.8) to the Employee table
with the following formula:
Rows: Employee
As a result, Uvis generates a corresponding SQL statement and sends it to the database
engine. Uvis retrieves a row set and creates a bundle of EmployeeLabel objects that
correspond to the row set. Each object is connected to a row.
Transforming data: Uvis formulas can transform the retrieved data. For instance,
they can filter, order, and join the tables. As an example, we connected EmployeeLabel
to only employees who work more than 20 hours per week with this formula.
Rows: Employee Where weeklyHours>20
The Rows formula retrieves the employees who fulfil the criterion in the Where clause.
Uvis formulas can show related data. For instance, we made TaskBox objects show
the tasks related to the employees labels with these formulas.
Parent: EmployeeLabel
Rows: Parent -< Task
The Parent formula means: Create a TaskBox object or bundle for each parent (EmployeeLabel)
object. The Rows formula means: Start in the Employee row connected to EmployeeLabel
(the Parent). The -< symbolizes a one-to-many crow’s foot in the data model (Figure
3.8). Now navigate along the crow’s foot to the Task table. The result is a bundle of
rows, one for each of the employee’s tasks, and a corresponding bundle of TaskBoxes.
The Rows formula corresponds to the following SQL statements.
29
3. UVIS FORMULAS
Figure 3.8: A task plan visualization
30
3.4 Formula Basics
SELECT Employee.ID, Employee.Name, Task.Start, Task.Duration, Task.Status
FROM ( (SELECT Employee.id FROM Employee WHERE [weeklyHours] > 20 ORDER BY
[name]) AS nested1 ) LEFT join Task on Task.employeeID= nested1.id"
Rows formulas are more compact than SQL statements. The designer does not have
to worry about specifying primary and foreign keys. The data architect has specified
them in the vism file. Furthermore, the designer does not specify the fields to select.
Uvis collects the selected fields from property formulas that refer to them.
To sum up, Rows formulas can bind visual objects to data, and transform the data.
This corresponds to the step of data transformations in the visualization reference
model.
Chapter 4 gives examples of more advanced SQL-like formulas. For instance, for-
mulas that can refer to visual properties.
3.4.3 Property Formulas
Each property can have a formula that specifies how to compute its value. Uvis eval-
uates the formula for each visual object in the bundle and sets the property with the
resulting value.
The formulas can be mathematical, logical, and conditional. Further, they can refer
to data fields, properties, and functions. Let us look at examples of different formulas.
• Formulas referring to properties: We positioned the EmployeeLabel objects
like a vertical list with this formula.
Top: 70 + Index*(Height+10)
The Top formula refers to Height and Index. Height is an EmployeeLabel prop-
erty. Its value for all EmployeeLabels is 20. Index is the visual object number
in the bundle. The first visual object’s index is 0, the second is 1, and so on.
Thus, the Top value of the first EmployeeLabel object is 70 + 0*(20+10). This
corresponds to 70. The second Top value is 70 + 1*(20+10)) This corresponds
to 100, and so on.
The result is that the employee labels are positioned like a vertical list.
• Formulas referring to functions and data fields : The TaskBox objects
align themselves to the time scale with these formulas.
31
3. UVIS FORMULAS
Left: timeScale!Position(Task.Start))
Right: timeScale!Position(Task.Start + Task.Duration)
The Left formula means: Navigate to timeScale. Call its Position function
and ask it to translate the start time of the task (field Task.Start) to a pixel
position. Use this position as the Left property.
Notice that the designer does not have to write the table name before the field
name, but it helps if there are two identical field names in different tables.
The Right formula adds the task duration (in days) to the task start, and asks
timeScale to calculate the position. The result is that each TaskBox object is
stretched correctly in the time dimension.
The bang (!) operator navigates from a visual object to a property or a function
while the dot (.) operator navigates from a visual object to a field. In principle,
we could have used the dot operator for both cases, but it introduces ambiguities
if there are identical field and property or function names. However, the designer
can still use a bang operator to navigate to a field, but the compiler looks for
a property or a function first. Similarly, the designer can use a dot operator to
access a property, but the compiler gives priority to a field.
• Formulas referring to parent properties: We positioned the TaskBox objects
according to their parents (EmployeeLabel) with these formulas.
Top: Parent!Top
The Top formula means: Navigate to the parent (EmployeeLabel) object and
take its Top value. The result is that the task boxes are vertically aligned to the
employee labels they belong to.
• Conditional formulas: We made TaskBox objects show task statuses as colour
with this formula.
BackColor: Task.Status = Done ? Green : Task.Status = Cancelled ?
Red : Gray
The BackColor formula means that if field Task.Status is ”done”, make the box
green. If it is ”cancelled”, make the box red. Otherwise, make the box grey.
32
3.4 Formula Basics
• Addressing properties of other visual objects: We will illustrates how
a formula can address properties in other visual objects. We defined a label
(DetailLabel) that shows up upon clicking an EmployeeLabel object. The label
shows the employee address and type.
We gave DetailLabel these property formulas
Selected: Init -1
Visible: selected >= 0
Top: EmployeeLabel[selected]!Top Default 0
Left: EmployeeLabel[selected]!Right Default 0
Text: Bold("Address: ") & EmployeeLabel[Selected].Address & NewLine()
& Bold("Type: ") & EmployeeLabel[Selected].Type Default ""
We added property Selected. It is not a built-in property, but a designer prop-
erty. Init -1 means that Selected is initially -1, but the value can change as a
result of end-user actions. When the end-user selects an employee label, Selected
should become the Index of the label.
The Visible formula says that the label should be visible when something is
selected (selected >= 0). Initially it will be invisible
The Top formula says: Navigate to the bundle of employee labels. Take the label
with the index given by Selected. Take its Top property value. If this doesn’t
work, for instance because nothing has been selected, use the default value and
make Top= 0. The Left formula works in a similar manner. The result is that
the label is aligned according to the employee label.
The Text formula says: Show ”address :” in bold. Concatenate it with what
follows. Navigate to the bundle of employee labels. Take the label with the index
given by Selected. Take its Address field value, and so on.
The Top, Left, and Text formulas are examples of addressing properties and
fields in another visual object.
To sum up, Uvis formulas use the navigation principle to address data fields, visual
objects, properties, and functions. Uvis navigates from component to component to
33
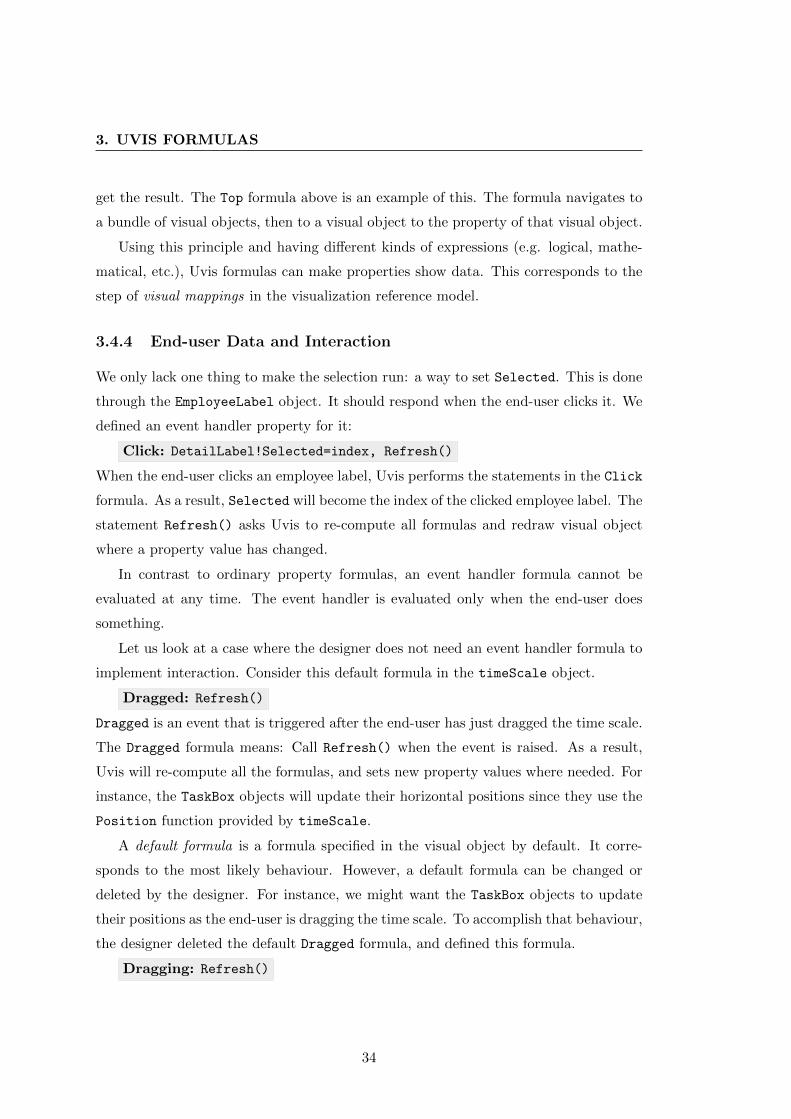
3. UVIS FORMULAS
get the result. The Top formula above is an example of this. The formula navigates to
a bundle of visual objects, then to a visual object to the property of that visual object.
Using this principle and having different kinds of expressions (e.g. logical, mathe-
matical, etc.), Uvis formulas can make properties show data. This corresponds to the
step of visual mappings in the visualization reference model.
3.4.4 End-user Data and Interaction
We only lack one thing to make the selection run: a way to set Selected. This is done
through the EmployeeLabel object. It should respond when the end-user clicks it. We
defined an event handler property for it:
Click: DetailLabel!Selected=index, Refresh()
When the end-user clicks an employee label, Uvis performs the statements in the Click
formula. As a result, Selected will become the index of the clicked employee label. The
statement Refresh() asks Uvis to re-compute all formulas and redraw visual object
where a property value has changed.
In contrast to ordinary property formulas, an event handler formula cannot be
evaluated at any time. The event handler is evaluated only when the end-user does
something.
Let us look at a case where the designer does not need an event handler formula to
implement interaction. Consider this default formula in the timeScale object.
Dragged: Refresh()
Dragged is an event that is triggered after the end-user has just dragged the time scale.
The Dragged formula means: Call Refresh() when the event is raised. As a result,
Uvis will re-compute all the formulas, and sets new property values where needed. For
instance, the TaskBox objects will update their horizontal positions since they use the
Position function provided by timeScale.
A default formula is a formula specified in the visual object by default. It corre-
sponds to the most likely behaviour. However, a default formula can be changed or
deleted by the designer. For instance, we might want the TaskBox objects to update
their positions as the end-user is dragging the time scale. To accomplish that behaviour,
the designer deleted the default Dragged formula, and defined this formula.
Dragging: Refresh()
34

3.5 Performance
Dragging is an event that is triggered as the end-user is dragging the time scale. The
Dragging formula means: Call Refresh() when the event is raised. The result is that
TaskBox objects will update their horizontal positions as the end-user is dragging the
time scale.
To sum up, Uvis event-handler formulas specify what happens upon end-user ac-
tions. Designers do not always have to write event-handler formulas.
Interaction with the visualization can change the view. For instance, it can view
more information on demand, zoom in a visualization to see more details, or filter
out uninteresting data. This corresponds to the step of view transformations in the
visualization reference model.
3.5 Performance
To evaluate Uvis performance, we used profiling tools to measure the time that Uvis
takes to open or refresh a visualization form. The data were collected using Windows
XP OS, with a 2.66 GHz Intel Core 2 Duo processor and 2.66 GB RAM, and a local
MS Access database. Averages of 10 measurements per result were taken.
Figure 3.9 shows the performance of a visualization inspired by the Lifelines (3)
created with Uvis. The visualization is shown in Figure 3.10. The total time to open
the screen is 0.6 seconds including 0.4 seconds to make 8 queries to the database. The
time to refresh the entire form is 0.07 seconds.
Compilation time is the time Uvis needs to compile all the formulas in the visualiza-
tion form. Creation time is the time Uvis needs to create all visual objects according to
data rows, compute all formulas, and set the properties. Refresh time is calculated this
way: Recompute all formulas, re-query the database if an SQL statement has changed,
set all visual properties to the new computed value (whether it has changed or not),
and update the screen accordingly. SQL-query time is the time needed to send an SQL
query and retrieve the data. Rendering time is the time needed to render the visual
objects on the screen.
Figure 3.11 shows the performance of several other visualizations created with Uvis.
More details about performance results can be found at (32).
In the following sections, we will discuss some principles that ensure adequate per-
formance.
35

3. UVIS FORMULAS
Figure 3.9: Performance results of the lifelines example
Figure 3.10: A visualization inspired by LifeLines
36
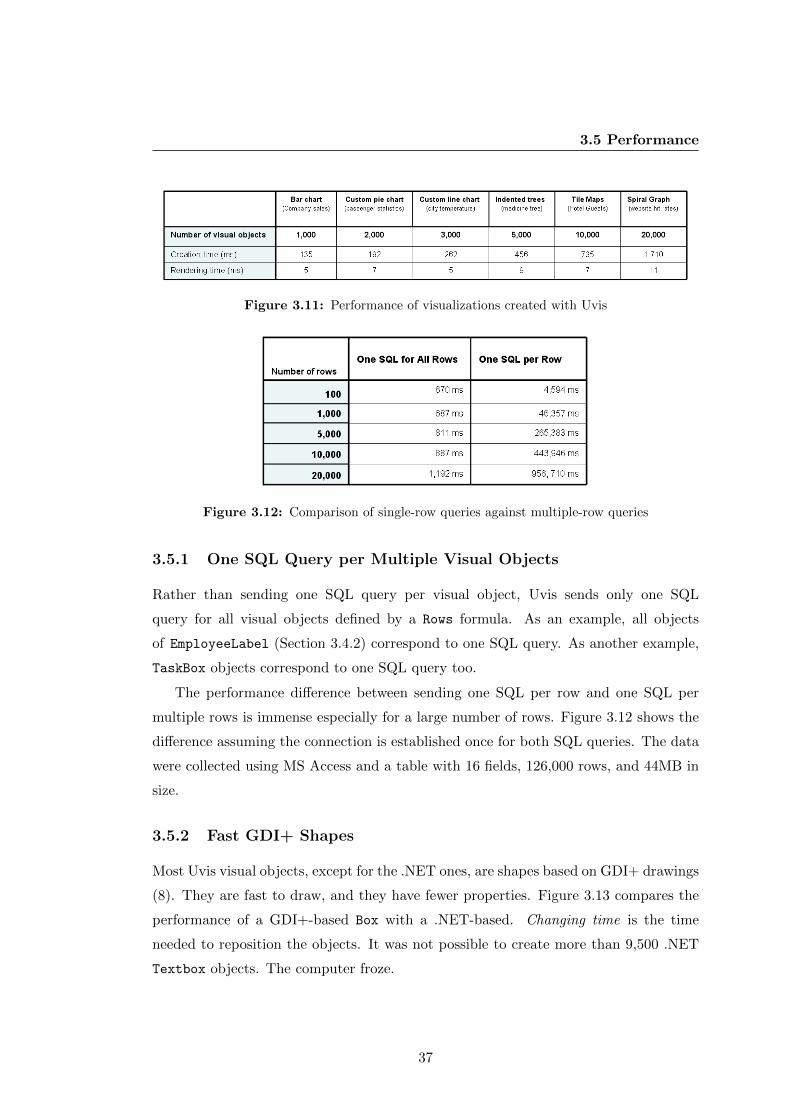
3.5 Performance
Figure 3.11: Performance of visualizations created with Uvis
Figure 3.12: Comparison of single-row queries against multiple-row queries
3.5.1 One SQL Query per Multiple Visual Objects
Rather than sending one SQL query per visual object, Uvis sends only one SQL
query for all visual objects defined by a Rows formula. As an example, all objects
of EmployeeLabel (Section 3.4.2) correspond to one SQL query. As another example,
TaskBox objects correspond to one SQL query too.
The performance difference between sending one SQL per row and one SQL per
multiple rows is immense especially for a large number of rows. Figure 3.12 shows the
difference assuming the connection is established once for both SQL queries. The data
were collected using MS Access and a table with 16 fields, 126,000 rows, and 44MB in
size.
3.5.2 Fast GDI+ Shapes
Most Uvis visual objects, except for the .NET ones, are shapes based on GDI+ drawings
(8). They are fast to draw, and they have fewer properties. Figure 3.13 compares the
performance of a GDI+-based Box with a .NET-based. Changing time is the time
needed to reposition the objects. It was not possible to create more than 9,500 .NET
Textbox objects. The computer froze.
37
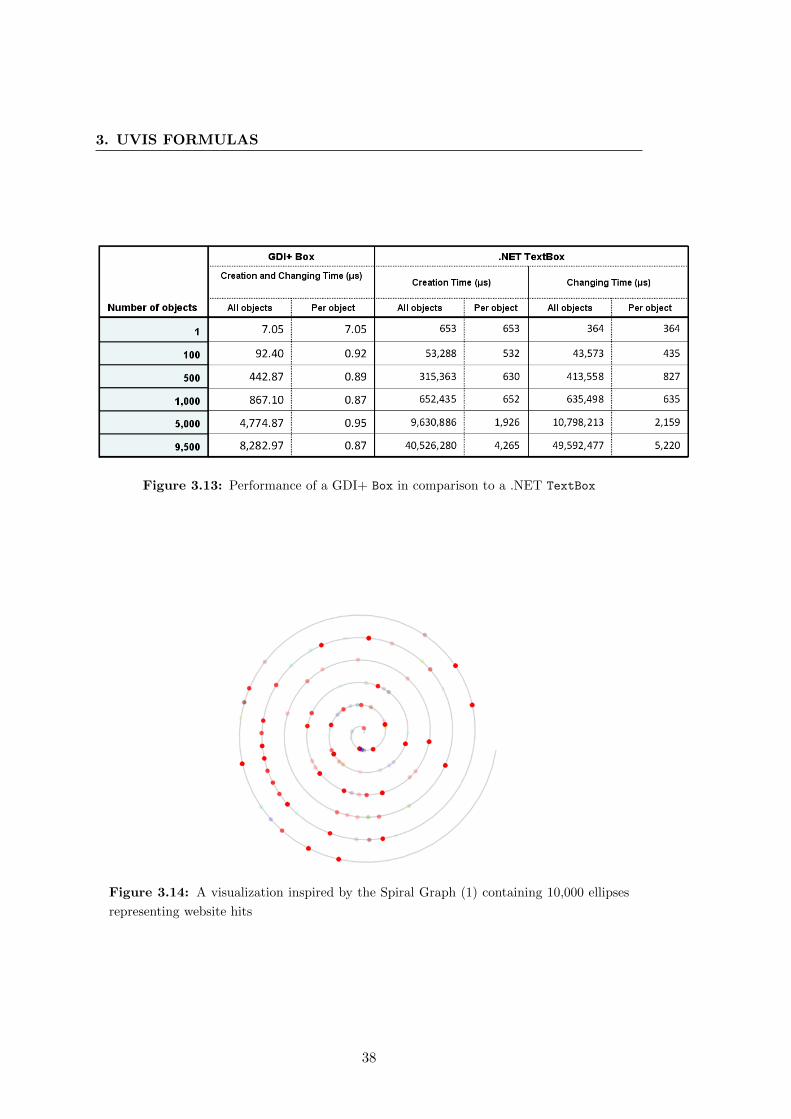
3. UVIS FORMULAS
Figure 3.13: Performance of a GDI+ Box in comparison to a .NET TextBox
Figure 3.14: A visualization inspired by the Spiral Graph (1) containing 10,000 ellipses
representing website hits
38
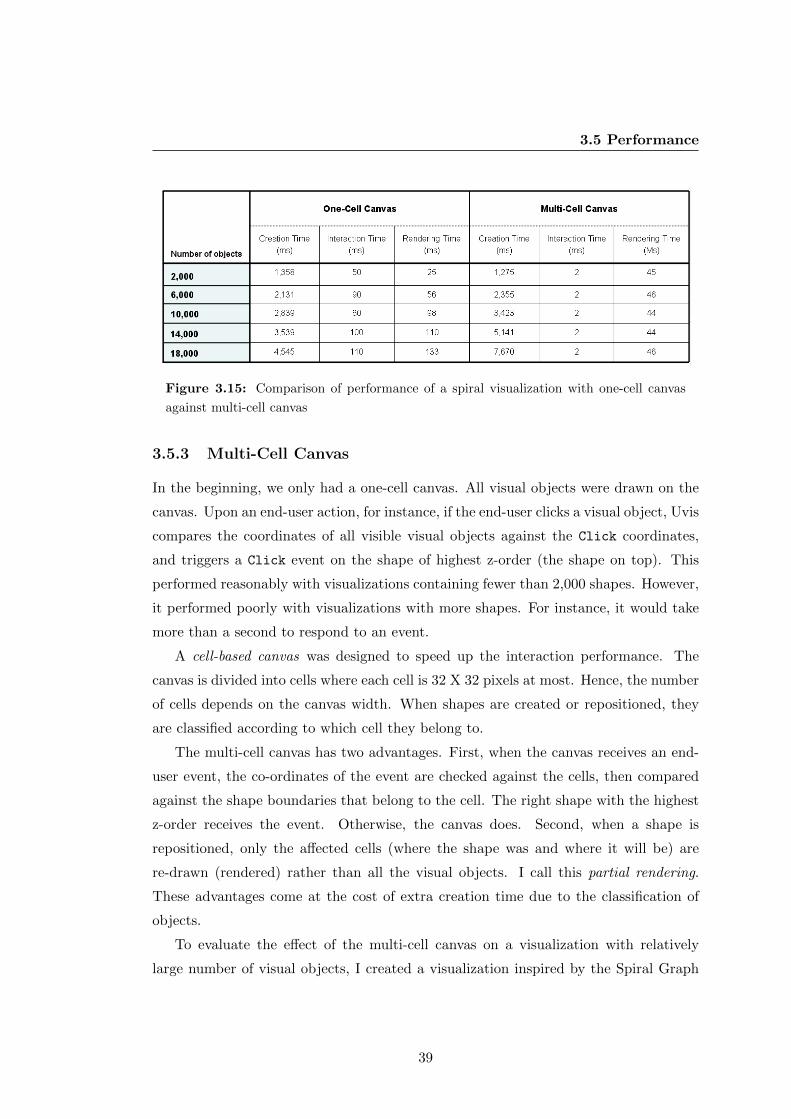
3.5 Performance
Figure 3.15: Comparison of performance of a spiral visualization with one-cell canvas
against multi-cell canvas
3.5.3 Multi-Cell Canvas
In the beginning, we only had a one-cell canvas. All visual objects were drawn on the
canvas. Upon an end-user action, for instance, if the end-user clicks a visual object, Uvis
compares the coordinates of all visible visual objects against the Click coordinates,
and triggers a Click event on the shape of highest z-order (the shape on top). This
performed reasonably with visualizations containing fewer than 2,000 shapes. However,
it performed poorly with visualizations with more shapes. For instance, it would take
more than a second to respond to an event.
A cell-based canvas was designed to speed up the interaction performance. The
canvas is divided into cells where each cell is 32 X 32 pixels at most. Hence, the number
of cells depends on the canvas width. When shapes are created or repositioned, they
are classified according to which cell they belong to.
The multi-cell canvas has two advantages. First, when the canvas receives an end-
user event, the co-ordinates of the event are checked against the cells, then compared
against the shape boundaries that belong to the cell. The right shape with the highest
z-order receives the event. Otherwise, the canvas does. Second, when a shape is
repositioned, only the affected cells (where the shape was and where it will be) are
re-drawn (rendered) rather than all the visual objects. I call this partial rendering.
These advantages come at the cost of extra creation time due to the classification of
objects.
To evaluate the effect of the multi-cell canvas on a visualization with relatively
large number of visual objects, I created a visualization inspired by the Spiral Graph
39

3. UVIS FORMULAS
(1) (Figure 3.14). I varied the number of objects to see the difference. Figure 3.15 has
the details.
40
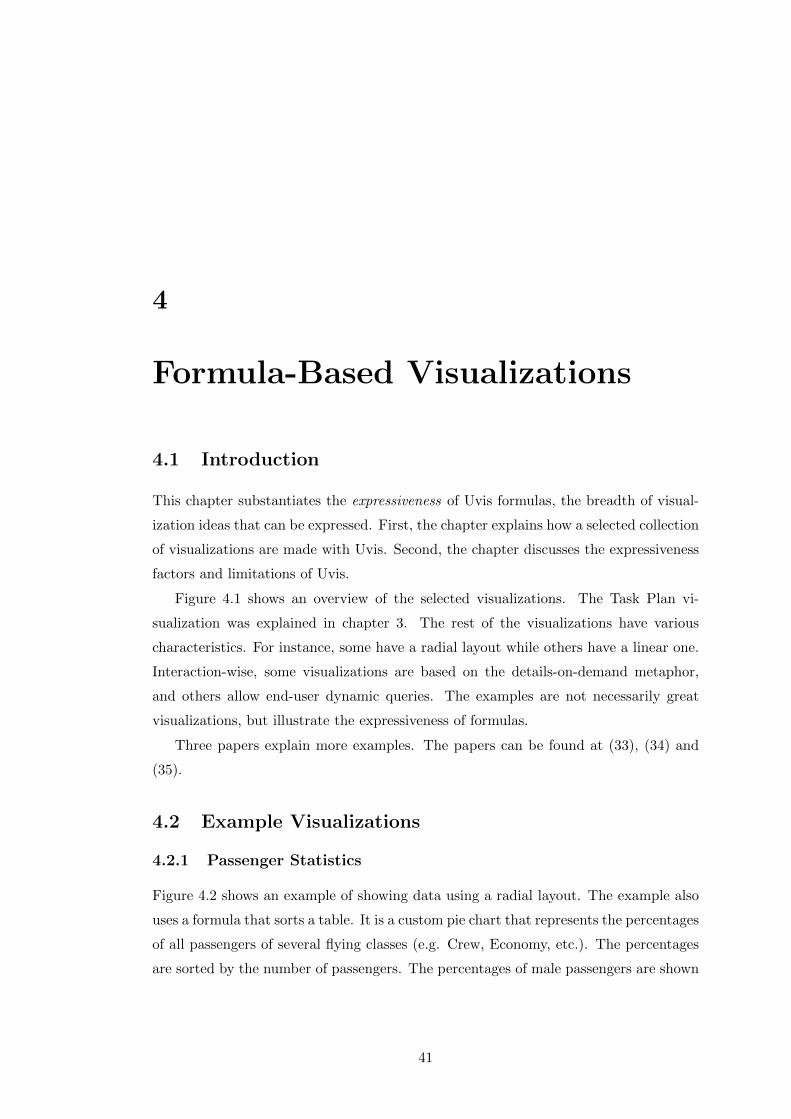
4
Formula-Based Visualizations
4.1 Introduction
This chapter substantiates the expressiveness of Uvis formulas, the breadth of visual-
ization ideas that can be expressed. First, the chapter explains how a selected collection
of visualizations are made with Uvis. Second, the chapter discusses the expressiveness
factors and limitations of Uvis.
Figure 4.1 shows an overview of the selected visualizations. The Task Plan vi-
sualization was explained in chapter 3. The rest of the visualizations have various
characteristics. For instance, some have a radial layout while others have a linear one.
Interaction-wise, some visualizations are based on the details-on-demand metaphor,
and others allow end-user dynamic queries. The examples are not necessarily great
visualizations, but illustrate the expressiveness of formulas.
Three papers explain more examples. The papers can be found at (33), (34) and
(35).
4.2 Example Visualizations
4.2.1 Passenger Statistics
Figure 4.2 shows an example of showing data using a radial layout. The example also
uses a formula that sorts a table. It is a custom pie chart that represents the percentages
of all passengers of several flying classes (e.g. Crew, Economy, etc.). The percentages
are sorted by the number of passengers. The percentages of male passengers are shown
41
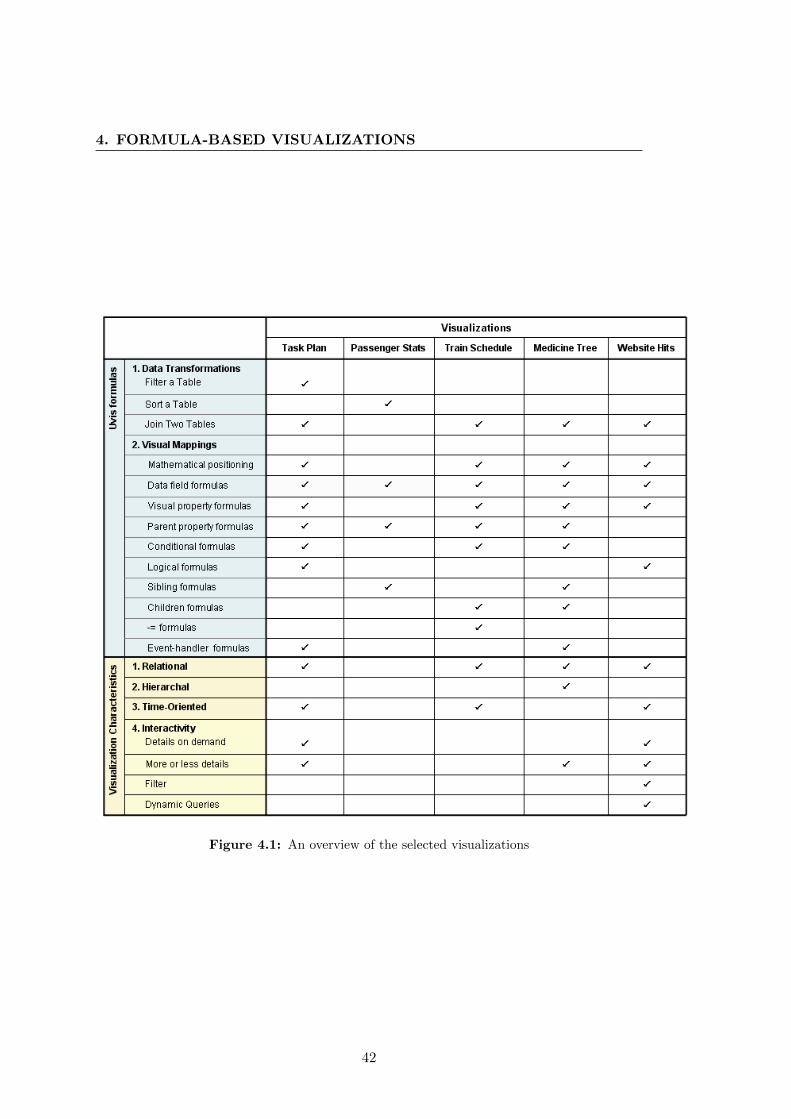
4. FORMULA-BASED VISUALIZATIONS
Figure 4.1: An overview of the selected visualizations
42
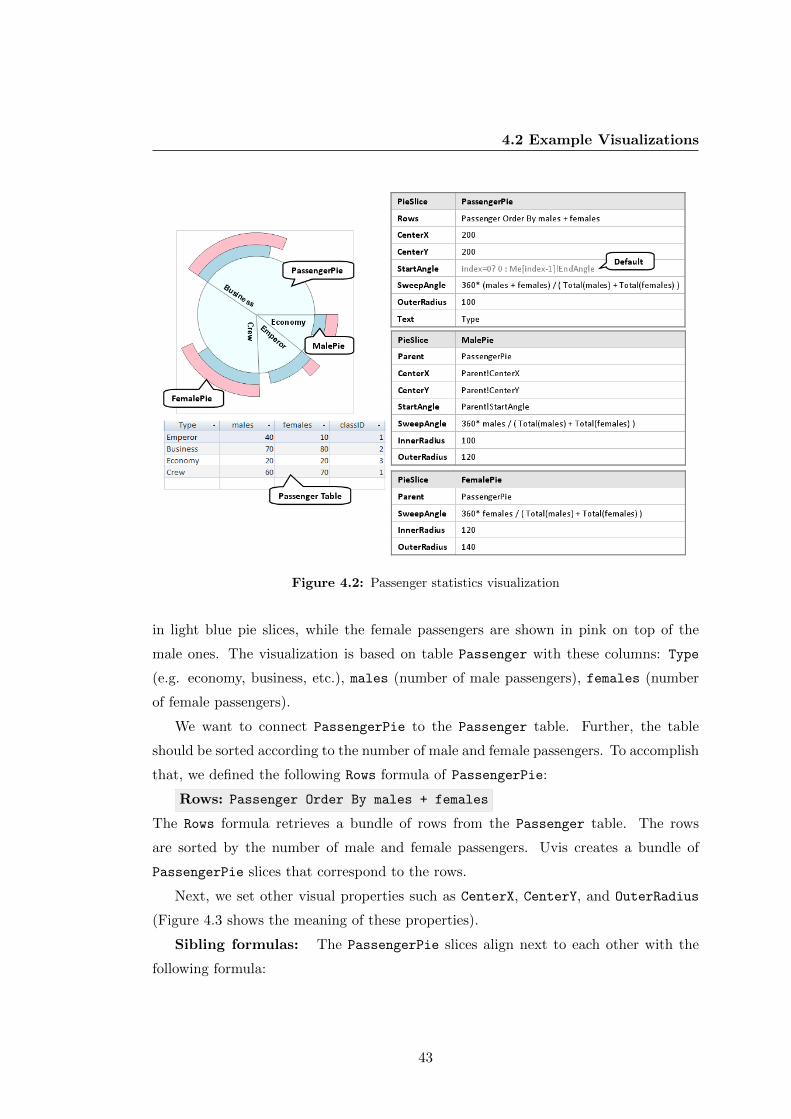
4.2 Example Visualizations
Figure 4.2: Passenger statistics visualization
in light blue pie slices, while the female passengers are shown in pink on top of the
male ones. The visualization is based on table Passenger with these columns: Type
(e.g. economy, business, etc.), males (number of male passengers), females (number
of female passengers).
We want to connect PassengerPie to the Passenger table. Further, the table
should be sorted according to the number of male and female passengers. To accomplish
that, we defined the following Rows formula of PassengerPie:
Rows: Passenger Order By males + females
The Rows formula retrieves a bundle of rows from the Passenger table. The rows
are sorted by the number of male and female passengers. Uvis creates a bundle of
PassengerPie slices that correspond to the rows.
Next, we set other visual properties such as CenterX, CenterY, and OuterRadius
(Figure 4.3 shows the meaning of these properties).
Sibling formulas: The PassengerPie slices align next to each other with the
following formula:
43
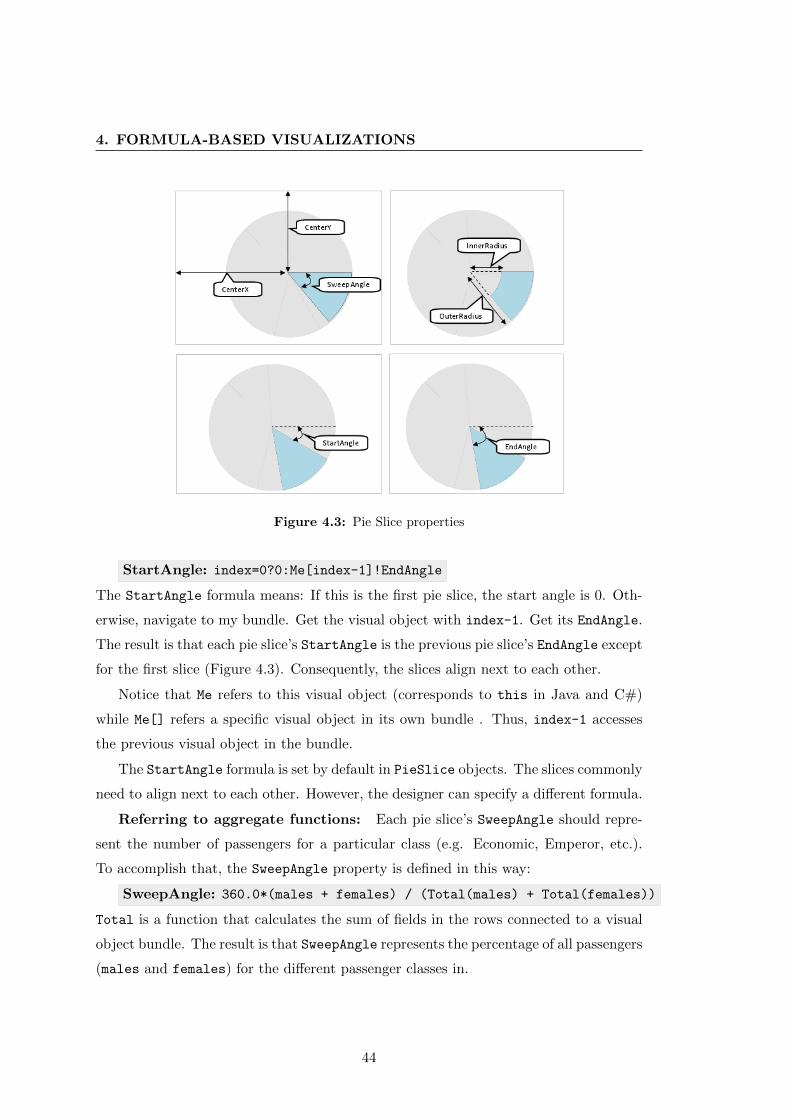
4. FORMULA-BASED VISUALIZATIONS
Figure 4.3: Pie Slice properties
StartAngle: index=0?0:Me[index-1]!EndAngle
The StartAngle formula means: If this is the first pie slice, the start angle is 0. Oth-
erwise, navigate to my bundle. Get the visual object with index-1. Get its EndAngle.
The result is that each pie slice’s StartAngle is the previous pie slice’s EndAngle except
for the first slice (Figure 4.3). Consequently, the slices align next to each other.
Notice that Me refers to this visual object (corresponds to this in Java and C#)
while Me[] refers a specific visual object in its own bundle . Thus, index-1 accesses
the previous visual object in the bundle.
The StartAngle formula is set by default in PieSlice objects. The slices commonly
need to align next to each other. However, the designer can specify a different formula.
Referring to aggregate functions: Each pie slice’s SweepAngle should repre-
sent the number of passengers for a particular class (e.g. Economic, Emperor, etc.).
To accomplish that, the SweepAngle property is defined in this way:
SweepAngle: 360.0*(males + females) / (Total(males) + Total(females))
Total is a function that calculates the sum of fields in the rows connected to a visual
object bundle. The result is that SweepAngle represents the percentage of all passengers
(males and females) for the different passenger classes in.
44

4.2 Example Visualizations
The MalePie and FemalePie are connected to the same data as PassengerPie
objects, and can access the same fields (according to their Parent formulas). Hence,
the SweepAngle formulas of MalePie and FemalePie show male and female passengers
respectively.
4.2.2 Train Schedule
Figure 4.4 shows a train schedule visualization. The stations that the trains stop at are
shown on the left. An hourly time scale shows the time from 4:00 AM till 12:30 PM.
The train stop times are shown as dots connected with lines. Southern trains are shown
in red while northern ones are shown in blue. The data come from tables Station,
Train, and StopTime.
This visualization explains how to show line segments with Uvis. Furthermore, it
explains how Uvis formulas navigate from data rows to visual objects. Let us look at
the details.
To show the stations as labels, we connected StationLabel to the Station table,
and positioned it vertically with the following formulas:
Rows: Station
Top: 78+0.7*Dist
The Top formula positions the labels vertically according to the station distances from
the start point (field Dist).
Next, to show the trains as labels, we connected TrainLabel to the Train table.
Showing curves: Uvis supports curves using a Spline visual object. A Spline
represents a curve segment. A Spline has a start point (StartX and StartY) and an
end point (EndX and EndY ) (Figure 4.5). To connect the Spline objects to each other
so they form a curve, the default specification is that the end point of a Spline is the
start point of the next Spline in the bundle. The last Spline’s start point is the same
as its end point. However, when a designer first creates a Spline , it is not connected
to data. We still want it to look like a curve segment. The default specification in this
case is that the end point is just 5 pixels to the top and to the right of the start point.
To show the train stops as curves, the designer defined the following formulas of
StopTimeSpline:
Parent: TrainLabel
Rows: parent -< StopTime
45
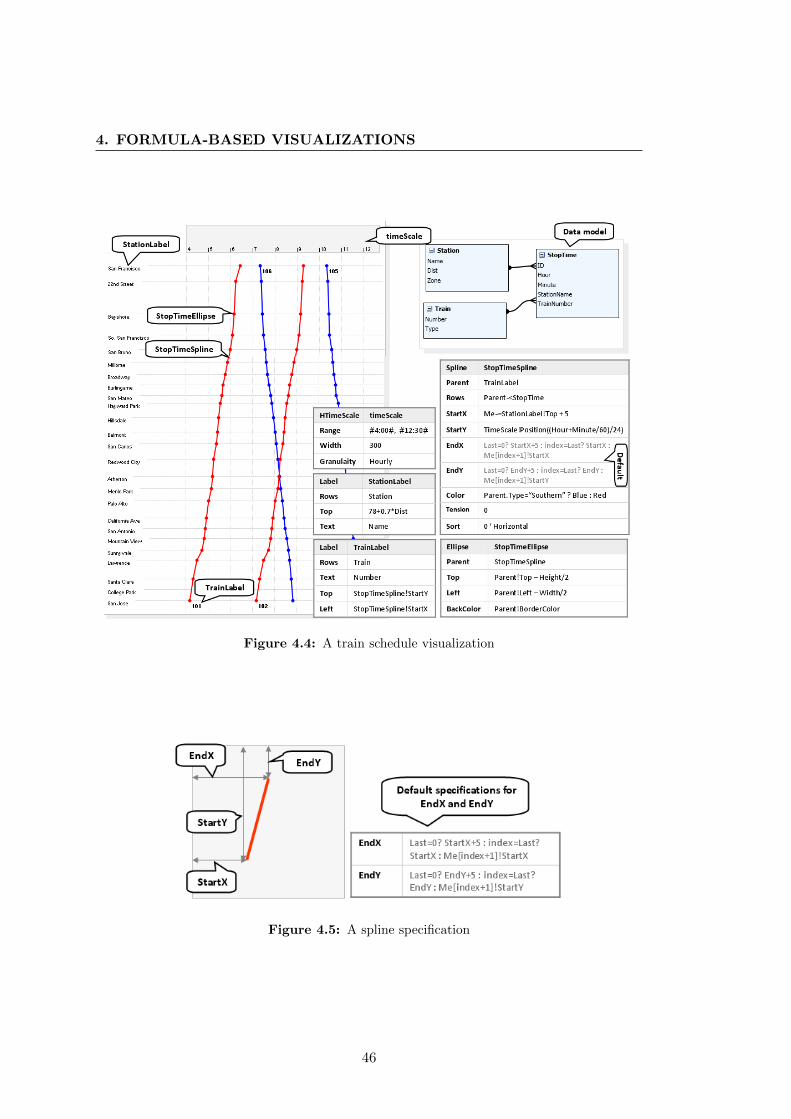
4. FORMULA-BASED VISUALIZATIONS
Figure 4.4: A train schedule visualization
Figure 4.5: A spline specification
46
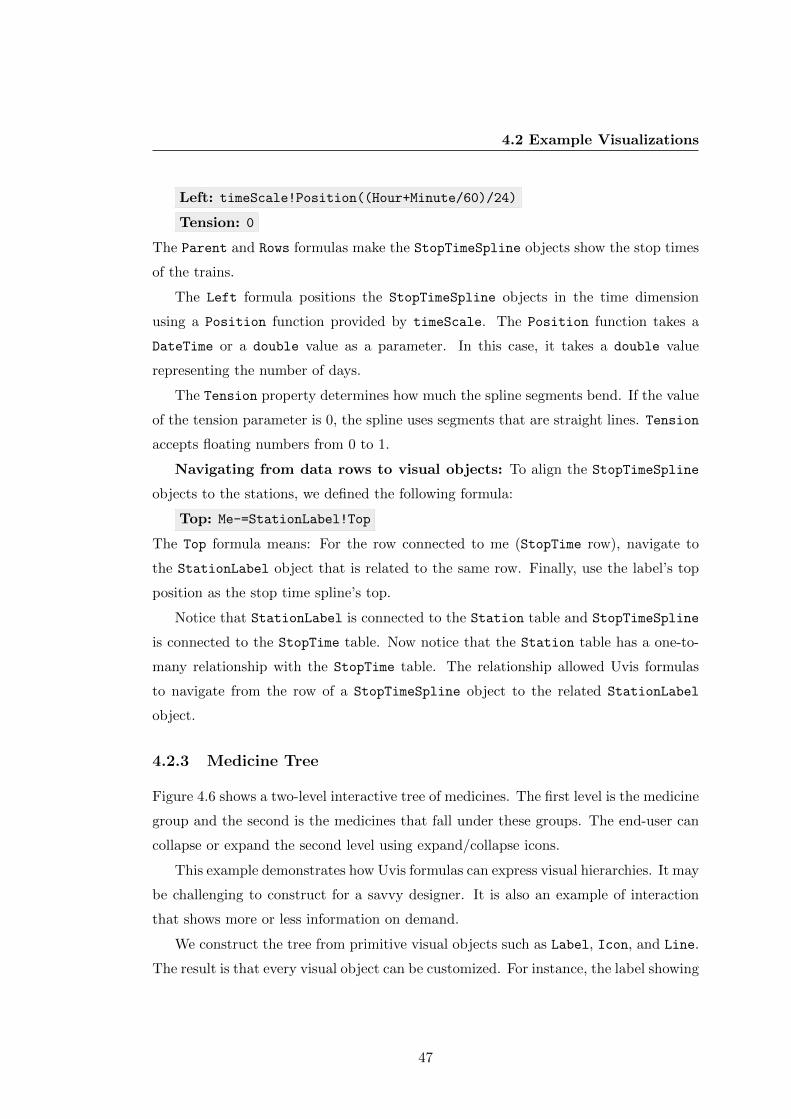
4.2 Example Visualizations
Left: timeScale!Position((Hour+Minute/60)/24)
Tension: 0
The Parent and Rows formulas make the StopTimeSpline objects show the stop times
of the trains.
The Left formula positions the StopTimeSpline objects in the time dimension
using a Position function provided by timeScale. The Position function takes a
DateTime or a double value as a parameter. In this case, it takes a double value
representing the number of days.
The Tension property determines how much the spline segments bend. If the value
of the tension parameter is 0, the spline uses segments that are straight lines. Tension
accepts floating numbers from 0 to 1.
Navigating from data rows to visual objects: To align the StopTimeSpline
objects to the stations, we defined the following formula:
Top: Me-=StationLabel!Top
The Top formula means: For the row connected to me (StopTime row), navigate to
the StationLabel object that is related to the same row. Finally, use the label’s top
position as the stop time spline’s top.
Notice that StationLabel is connected to the Station table and StopTimeSpline
is connected to the StopTime table. Now notice that the Station table has a one-to-
many relationship with the StopTime table. The relationship allowed Uvis formulas
to navigate from the row of a StopTimeSpline object to the related StationLabel
object.
4.2.3 Medicine Tree
Figure 4.6 shows a two-level interactive tree of medicines. The first level is the medicine
group and the second is the medicines that fall under these groups. The end-user can
collapse or expand the second level using expand/collapse icons.
This example demonstrates how Uvis formulas can express visual hierarchies. It may
be challenging to construct for a savvy designer. It is also an example of interaction
that shows more or less information on demand.
We construct the tree from primitive visual objects such as Label, Icon, and Line.
The result is that every visual object can be customized. For instance, the label showing
47
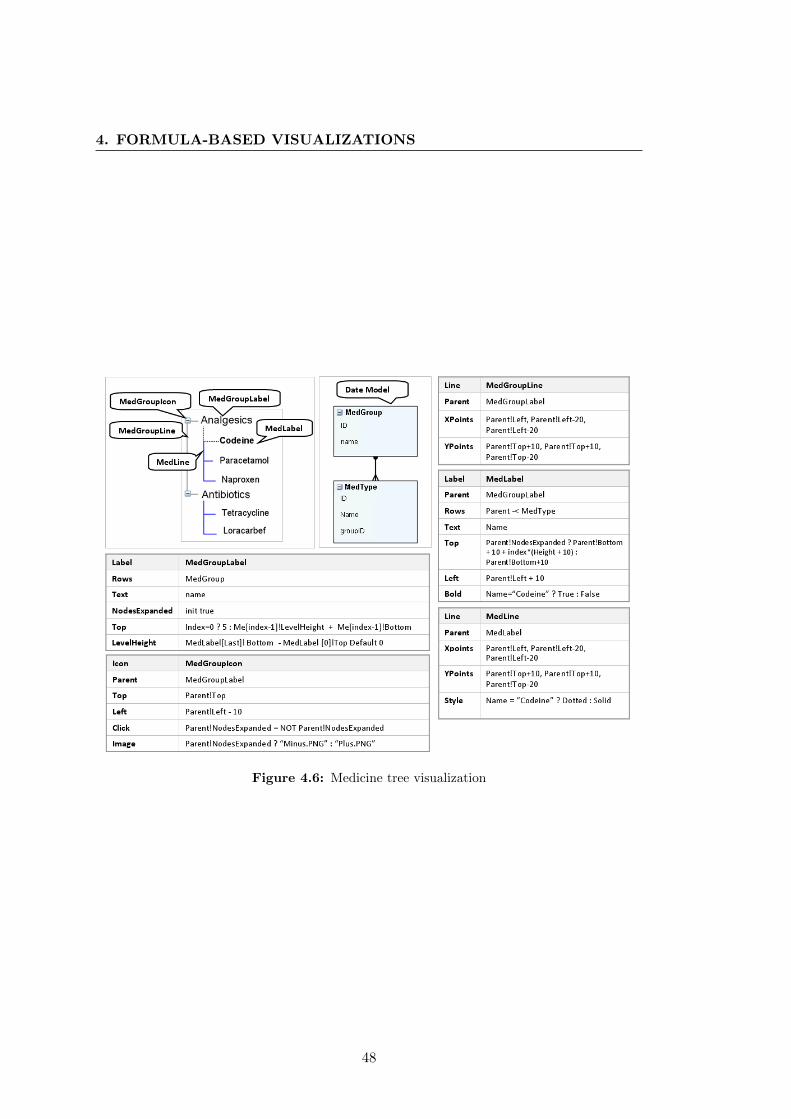
4. FORMULA-BASED VISUALIZATIONS
Figure 4.6: Medicine tree visualization
48
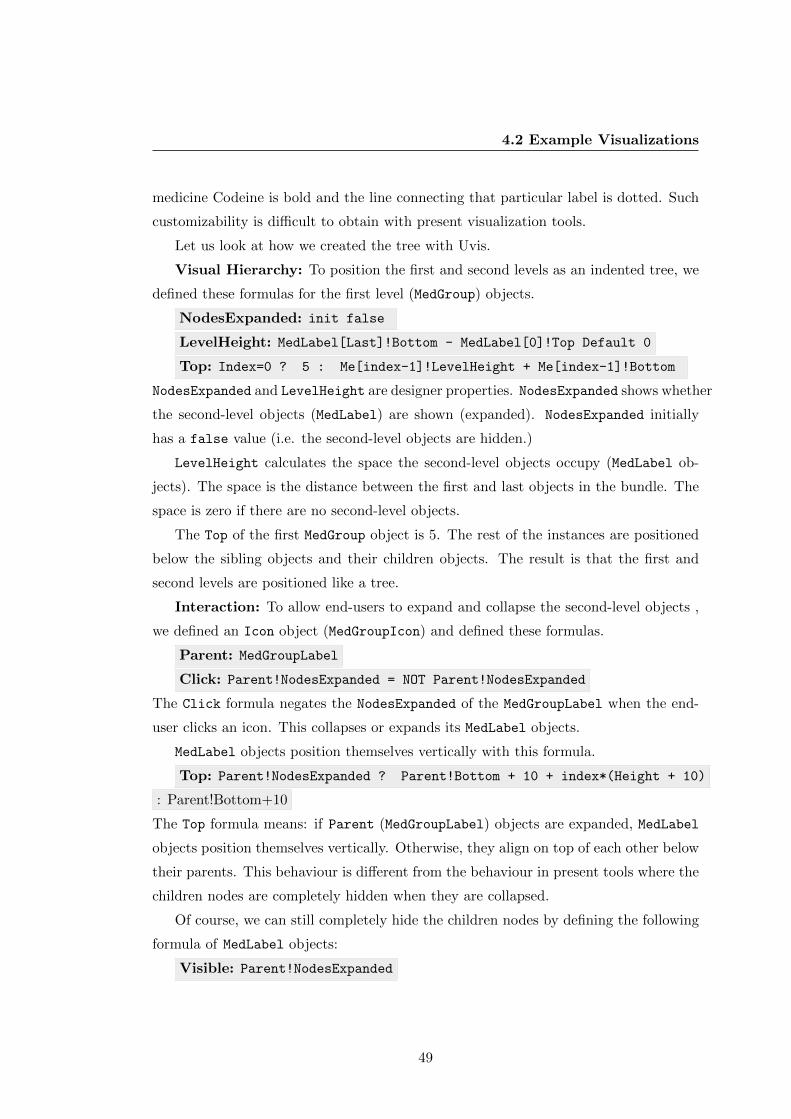
4.2 Example Visualizations
medicine Codeine is bold and the line connecting that particular label is dotted. Such
customizability is difficult to obtain with present visualization tools.
Let us look at how we created the tree with Uvis.
Visual Hierarchy: To position the first and second levels as an indented tree, we
defined these formulas for the first level (MedGroup) objects.
NodesExpanded: init false
LevelHeight: MedLabel[Last]!Bottom - MedLabel[0]!Top Default 0
Top: Index=0 ? 5 : Me[index-1]!LevelHeight + Me[index-1]!Bottom
NodesExpanded and LevelHeight are designer properties. NodesExpanded shows whether
the second-level objects (MedLabel) are shown (expanded). NodesExpanded initially
has a false value (i.e. the second-level objects are hidden.)
LevelHeight calculates the space the second-level objects occupy (MedLabel ob-
jects). The space is the distance between the first and last objects in the bundle. The
space is zero if there are no second-level objects.
The Top of the first MedGroup object is 5. The rest of the instances are positioned
below the sibling objects and their children objects. The result is that the first and
second levels are positioned like a tree.
Interaction: To allow end-users to expand and collapse the second-level objects ,
we defined an Icon object (MedGroupIcon) and defined these formulas.
Parent: MedGroupLabel
Click: Parent!NodesExpanded = NOT Parent!NodesExpanded
The Click formula negates the NodesExpanded of the MedGroupLabel when the end-
user clicks an icon. This collapses or expands its MedLabel objects.
MedLabel objects position themselves vertically with this formula.
Top: Parent!NodesExpanded ? Parent!Bottom + 10 + index*(Height + 10)
: Parent!Bottom+10
The Top formula means: if Parent (MedGroupLabel) objects are expanded, MedLabel
objects position themselves vertically. Otherwise, they align on top of each other below
their parents. This behaviour is different from the behaviour in present tools where the
children nodes are completely hidden when they are collapsed.
Of course, we can still completely hide the children nodes by defining the following
formula of MedLabel objects:
Visible: Parent!NodesExpanded
49
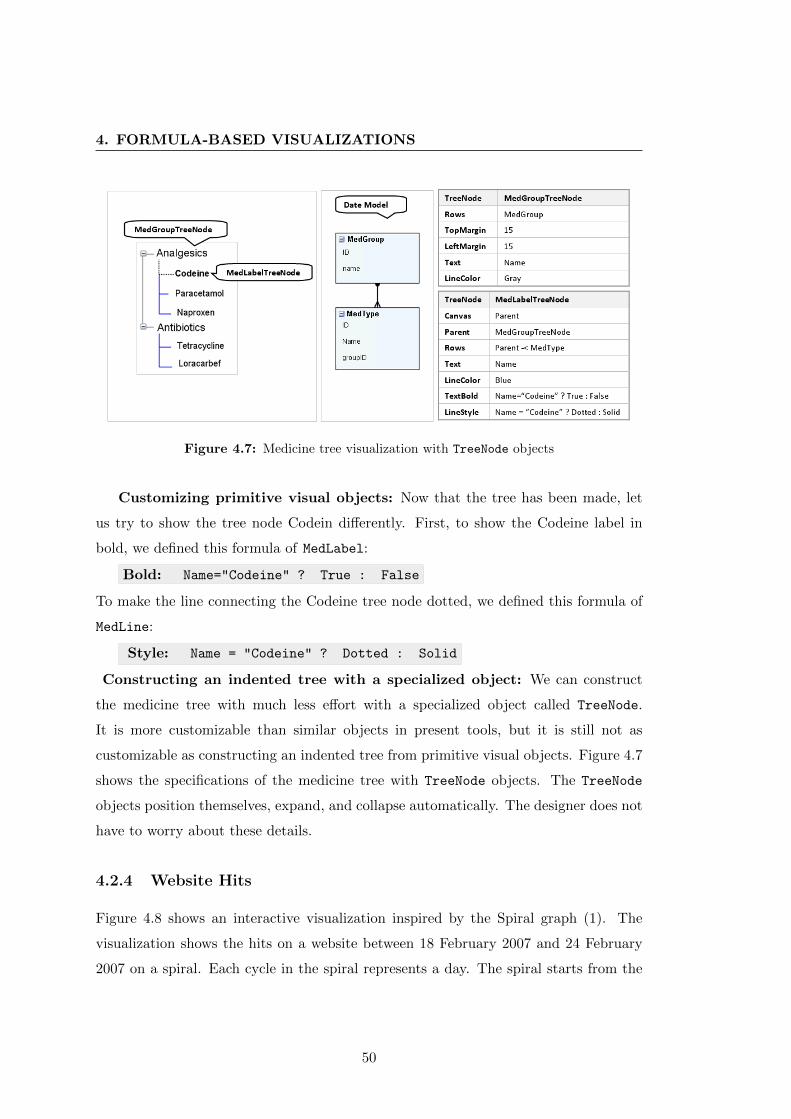
4. FORMULA-BASED VISUALIZATIONS
Figure 4.7: Medicine tree visualization with TreeNode objects
Customizing primitive visual objects: Now that the tree has been made, let
us try to show the tree node Codein differently. First, to show the Codeine label in
bold, we defined this formula of MedLabel:
Bold: Name="Codeine" ? True : False
To make the line connecting the Codeine tree node dotted, we defined this formula of
MedLine:
Style: Name = "Codeine" ? Dotted : Solid
Constructing an indented tree with a specialized object: We can construct
the medicine tree with much less effort with a specialized object called TreeNode.
It is more customizable than similar objects in present tools, but it is still not as
customizable as constructing an indented tree from primitive visual objects. Figure 4.7
shows the specifications of the medicine tree with TreeNode objects. The TreeNode
objects position themselves, expand, and collapse automatically. The designer does not
have to worry about these details.
4.2.4 Website Hits
Figure 4.8 shows an interactive visualization inspired by the Spiral graph (1). The
visualization shows the hits on a website between 18 February 2007 and 24 February
2007 on a spiral. Each cycle in the spiral represents a day. The spiral starts from the
50
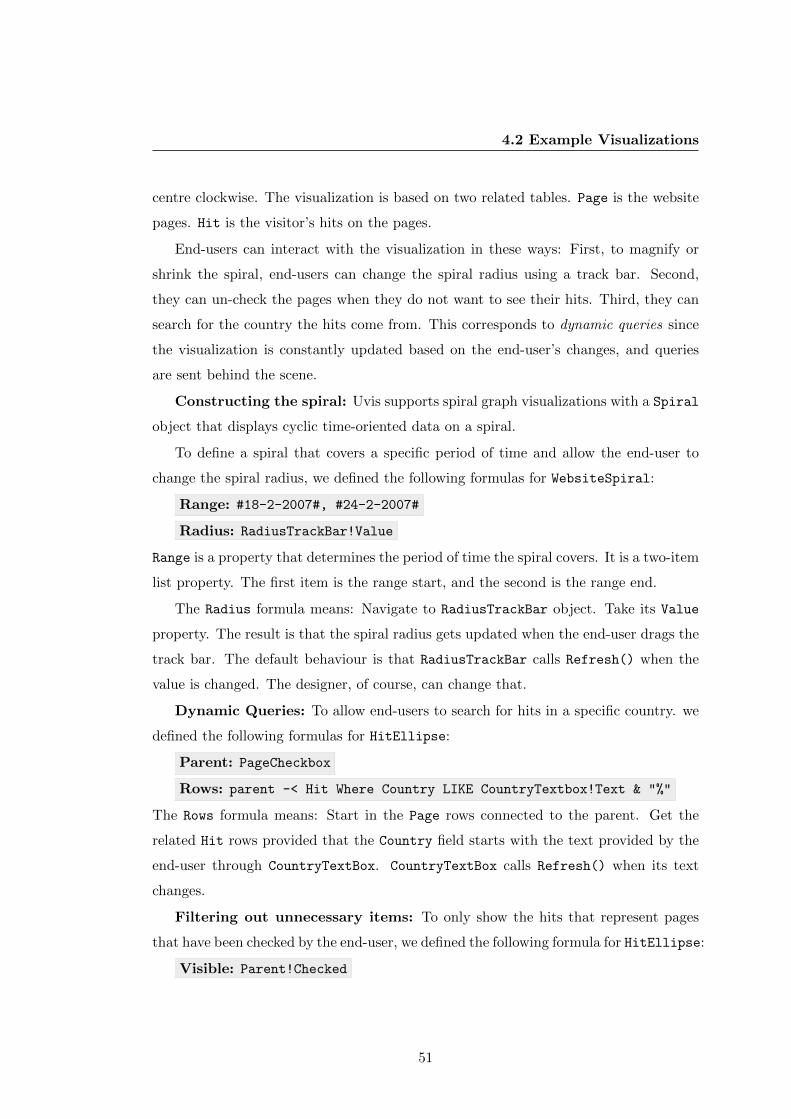
4.2 Example Visualizations
centre clockwise. The visualization is based on two related tables. Page is the website
pages. Hit is the visitor’s hits on the pages.
End-users can interact with the visualization in these ways: First, to magnify or
shrink the spiral, end-users can change the spiral radius using a track bar. Second,
they can un-check the pages when they do not want to see their hits. Third, they can
search for the country the hits come from. This corresponds to dynamic queries since
the visualization is constantly updated based on the end-user’s changes, and queries
are sent behind the scene.
Constructing the spiral: Uvis supports spiral graph visualizations with a Spiral
object that displays cyclic time-oriented data on a spiral.
To define a spiral that covers a specific period of time and allow the end-user to
change the spiral radius, we defined the following formulas for WebsiteSpiral:
Range: #18-2-2007#, #24-2-2007#
Radius: RadiusTrackBar!Value
Range is a property that determines the period of time the spiral covers. It is a two-item
list property. The first item is the range start, and the second is the range end.
The Radius formula means: Navigate to RadiusTrackBar object. Take its Value
property. The result is that the spiral radius gets updated when the end-user drags the
track bar. The default behaviour is that RadiusTrackBar calls Refresh() when the
value is changed. The designer, of course, can change that.
Dynamic Queries: To allow end-users to search for hits in a specific country. we
defined the following formulas for HitEllipse:
Parent: PageCheckbox
Rows: parent -< Hit Where Country LIKE CountryTextbox!Text & "%"
The Rows formula means: Start in the Page rows connected to the parent. Get the
related Hit rows provided that the Country field starts with the text provided by the
end-user through CountryTextBox. CountryTextBox calls Refresh() when its text
changes.
Filtering out unnecessary items: To only show the hits that represent pages
that have been checked by the end-user, we defined the following formula for HitEllipse:
Visible: Parent!Checked
51
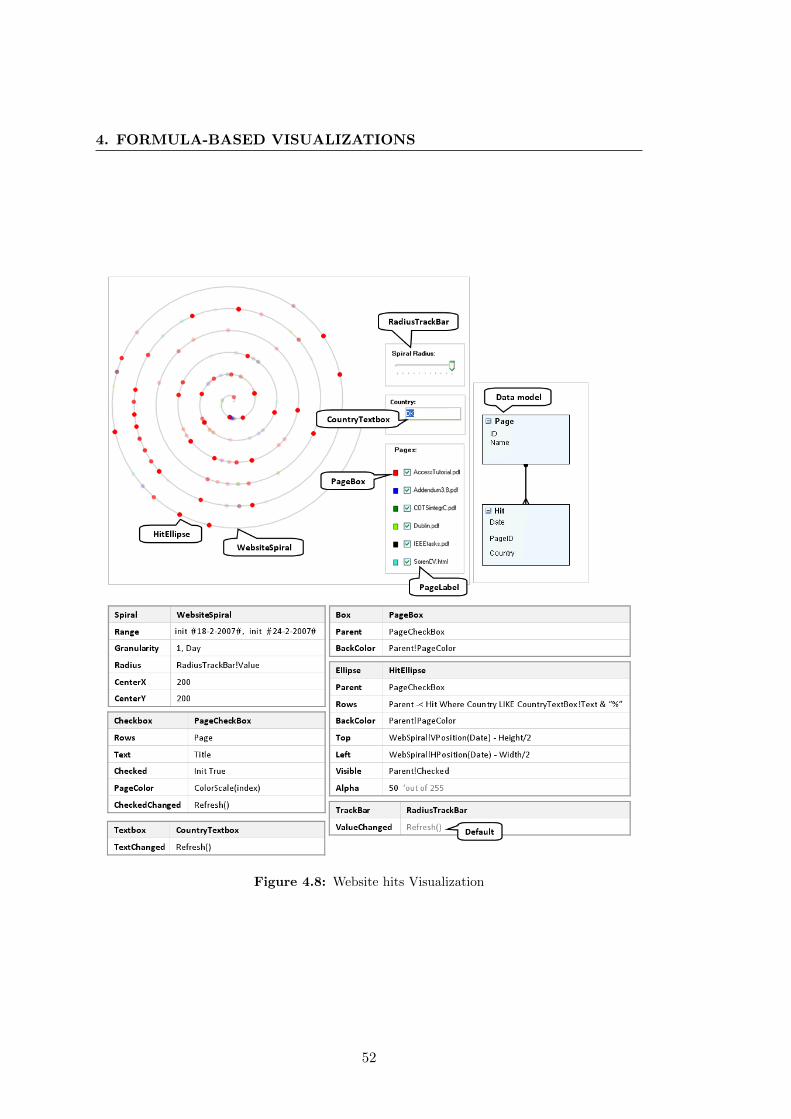
4. FORMULA-BASED VISUALIZATIONS
Figure 4.8: Website hits Visualization
52
4.3 Other Visualizations
The Visible formula means: Make a HitEllipse object visible when its parent
PageCheckboxis checked. PageCheckbox objects call Refresh() when the end-user
checks or unchecks them.
Polar Positioning: To position HitEllipse objects according to the time they
show, we defined the following formulas for HitEllipse:
Left: WebSpiral!HPosition(Date) - Width/2
Top: WebSpiral!VPosition(Date) - Height/2
The Left formula means: Navigate to the WebSpiral object. Call its HPosition func-
tion with the Date field as a parameter. WebSpiral provides HPosition and VPosition
functions that calculate the horizontal and vertical positions of a point in time. Sub-
tract half the ellipse’s width to make its centre represent the point in time. The Top
formula works in a similar fashion.
The result is that the ellipses are aligned to the spiral according to the time they
represent.
Over-plotting: Since it is likely that many hits occur at the same time, we need
a way o distinguish a few from many hits occurring at the same time. This is called
the over-plotting problem (36). We solved the problem with the following formula for
EllipseHit:
Alpha: 50 ’out of 255
The Alpha property represents the transparency component of a colour. Its value is 50
out of 255. EllipseHit objects are 19 % visible.
4.3 Other Visualizations
Figure 4.9 gives an overview of other visualizations that have been created with Uvis.
Some of the visualizations are explained in (37), (38), and (33). Some of the visualiza-
tions were created using only primitive visual objects. For instance, the visualization
inspired by CircleView (39) was created using PieSlice objects.
Other visualizations were created with specialized objects. For instance, the vi-
sualization inspired by the horizon graph (40) is created with Area objects that have
a specialized layout property. The property can have a "HorizonGraph" value that
supports the horizon graph visualizations.
53
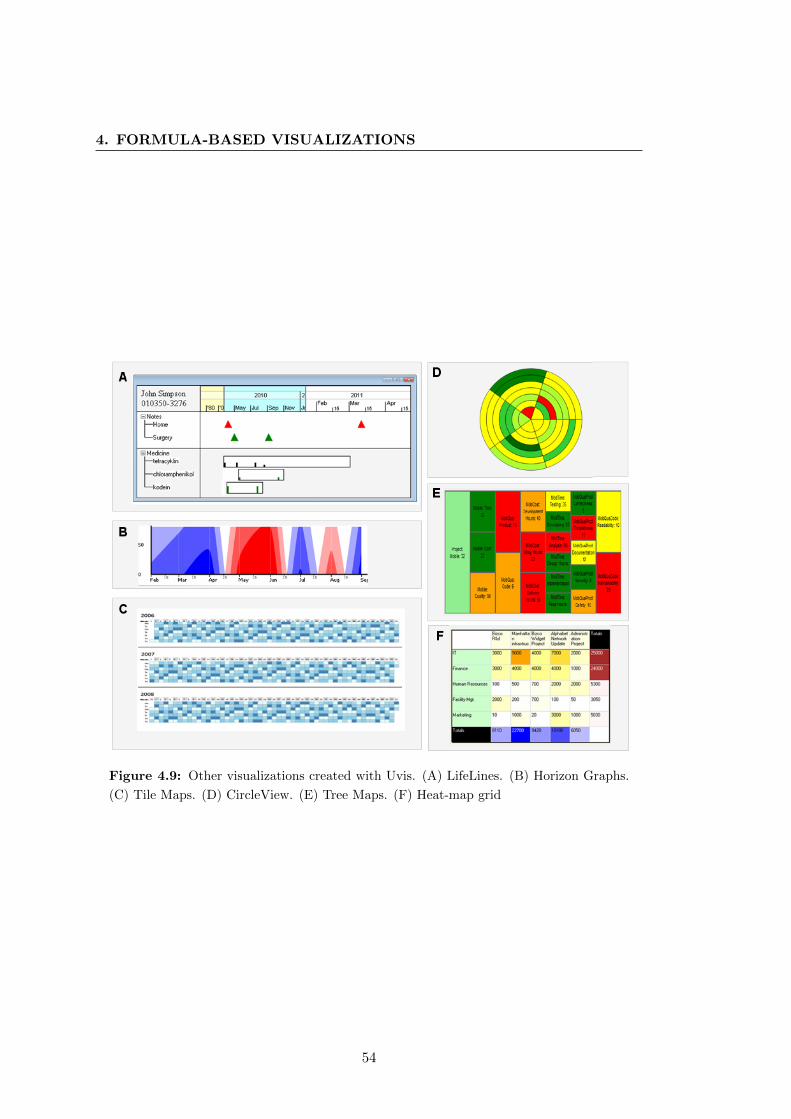
4. FORMULA-BASED VISUALIZATIONS
Figure 4.9: Other visualizations created with Uvis. (A) LifeLines. (B) Horizon Graphs.
(C) Tile Maps. (D) CircleView. (E) Tree Maps. (F) Heat-map grid
54

4.4 Lines of Code
Visualization
Lines of Code
Name Inspired by
Task Plan Gantt charts 134
Passenger Stats Custom pie chart 64
Medicine Trees (primitive) Indented Trees 39
Medicine Trees (specialized) Indented Trees 14
Train Schedule Étienne-Jules Marey’s Trains 81
Étienne-Jules Marey
Train Schedule Étienne-Jules Marey’s Trains 81
Website Stats Spiral Graph 98
Patient Record Analysis LifeLines 119
Company Profits Horizon Graphs 55
Hotel Guests Stats Tile Maps 51
Stock Prices CircleView 33
Figure 4.10: Lines of code needed to created several visualizations with Uvis
4.4 Lines of Code
Figure 4.10 shows the lines of code needed to create various visualizations with Uvis.
Uvis formulas shorten the lines of code in many ways. For instance, Rows formulas
are much more compact than SQL statements since they don’t contain key nor select
specifications.
In general, Uvis does many things behind the scene that shorten the specifications.
As an example, Uvis creates objects that correspond to rows, evaluates property for-
mulas and sets the values for properties of each visual object, updates property values
when Refresh is called, etc.
Sometimes specialized objects can reduce the lines of code. For instance, creat-
ing intended trees with TreeNode requires considerably fewer lines of code than using
primitive objects.
4.5 Expressiveness Factors
Uvis expressiveness depends on these factors:
1. Referencing mechanism: Rows formulas have the same expressiveness as SQL
statements plus the ability to refer to these operands:
• Utility functions
55
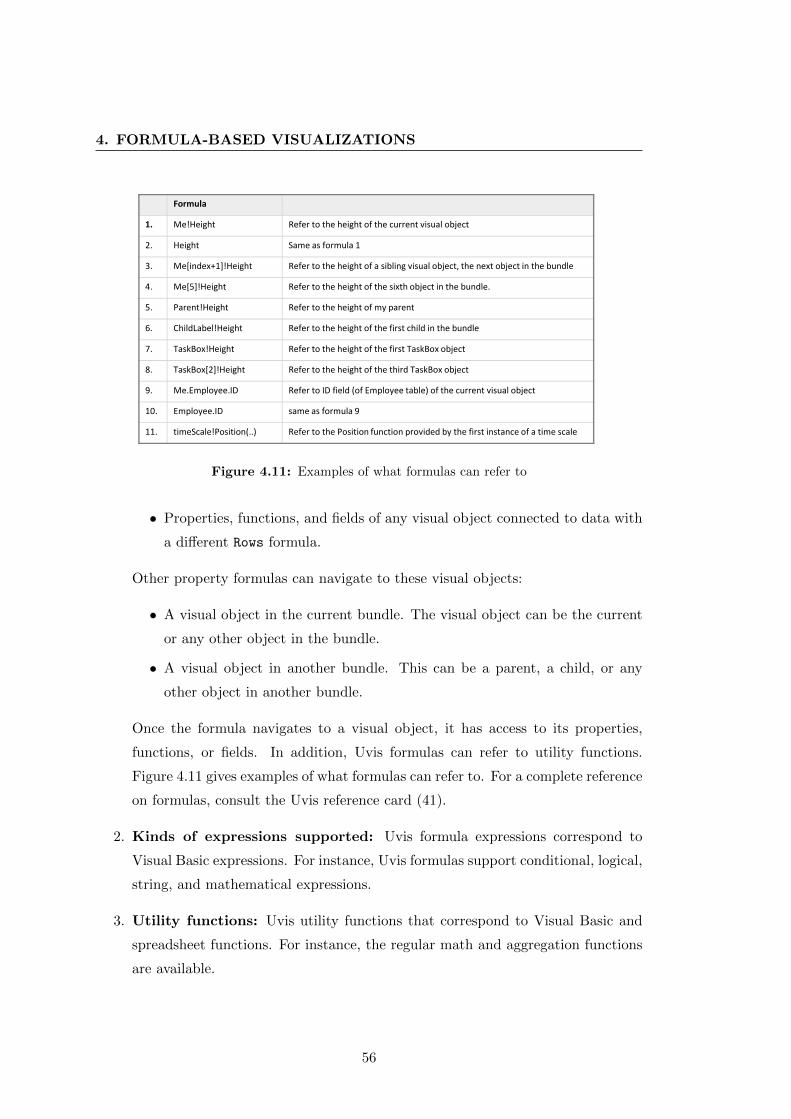
4. FORMULA-BASED VISUALIZATIONS
Formula
1. Me!Height Refer to the height of the current visual object
2. Height Same as formula 1
3. Me[index+1]!Height Refer to the height of a sibling visual object, the next object in the bundle
4. Me[5]!Height Refer to the height of the sixth object in the bundle.
5. Parent!Height Refer to the height of my parent
6. ChildLabel!Height Refer to the height of the first child in the bundle
7. TaskBox!Height Refer to the height of the first TaskBox object
8. TaskBox[2]!Height Refer to the height of the third TaskBox object
9. Me.Employee.ID Refer to ID field (of Employee table) of the current visual object
10. Employee.ID same as formula 9
11. timeScale!Position(..) Refer to the Position function provided by the first instance of a time scale
Figure 4.11: Examples of what formulas can refer to
• Properties, functions, and fields of any visual object connected to data with
a different Rows formula.
Other property formulas can navigate to these visual objects:
• A visual object in the current bundle. The visual object can be the current
or any other object in the bundle.
• A visual object in another bundle. This can be a parent, a child, or any
other object in another bundle.
Once the formula navigates to a visual object, it has access to its properties,
functions, or fields. In addition, Uvis formulas can refer to utility functions.
Figure 4.11 gives examples of what formulas can refer to. For a complete reference
on formulas, consult the Uvis reference card (41).
2. Kinds of expressions supported: Uvis formula expressions correspond to
Visual Basic expressions. For instance, Uvis formulas support conditional, logical,
string, and mathematical expressions.
3. Utility functions: Uvis utility functions that correspond to Visual Basic and
spreadsheet functions. For instance, the regular math and aggregation functions
are available.
56
4.6 Limitations
4. What visual objects provide: Visual objects also provide functions the for-
mulas can call. For instance, formulas can call the HPosition function of Spiral
objects.
4.6 Limitations
Despite the expressive power of Uvis formulas, they have the limitations discussed in
the following subsections.
4.6.1 Recursion and Loops
Uvis formulas alone do not support visualizations that require recursive algorithms.
Such algorithms contain loops and/or functions that call themselves recursively until a
condition is met.
Uvis formulas support recursion as long as it is within the context of existing visual
objects. Consider the following formula:
TotalTop: index=0 ? 0: Me[index-1]!TotalTop+Top
The formula calculates the sum of Top values in a bundle of visual objects. This is an
example of recursion that Uvis formulas allow. Now, let us see examples of recursion
that are not possible to create.
Loops: We have a bundle of Boxes that are connected to a table with field Number.
We want to show the Boxes with prime Numbers in red. Uvis formulas alone do not
support that since it requires a loop. A possible solution is to provide a utility function
that checks whether a number is prime.
Inability to create visual objects recursively: Section 4.2.3 presented a two-
level tree. However, Uvis formulas fall short if we want to show a recursive tree, for
instance a folder tree. Since Uvis uses SQL-like formulas, it inherits SQL limitations.
For instance, it is not possible to send a query that retrieves the nesting levels of the
folders. As a result, it is not possible to create a recursive tree with Uvis formulas
because new visual objects have to be defined for each level in the tree. A possible
solution is to delegate the responsibility of constructing the recursive visual hierarchy
to the visual object. Designers can set a property Recursive to true if they want the
tree levels to be defined dynamically.
57

4. FORMULA-BASED VISUALIZATIONS
Complex Algorithms: Tree maps require a complex recursive algorithm that
Uvis formulas do not support. A possible solution is to provide a visual object that
performs these complex layout algorithms. Pantazos developed a TreeMap visual ob-
ject that supports a tree map visualization with Uvis formulas (42). However, the
customizability of the tree map objects becomes very limited.
Similarly, graphs of different layout types (e.g. force-directed, node-link, etc.) re-
quire complex recursive algorithms. A Graph visual object with a Layout property
could support graphs of various layouts.
4.6.2 Complex Interaction
Sometimes interaction requires much more than a simple assignment statement. For
instance, some interaction mechanisms such as semantic zooming are cumbersome to
implement with Uvis formulas. Interactive visual objects that incorporate interaction
mechanisms provide a solution. For instance, HTimeScale incorporates semantic zoom-
ing. When the end-user drags inwards or outwards the scale, it shows more or less time
details.
Uvis provides another solution for implementing complex interaction. Developers
can write Java or C# code as event handlers. However, this solution requires program-
ming.
Sometimes visualizations should be updated constantly over a certain time period.
We have not implemented a visualization that exhibits such a behaviour. However, in
principle, the solution is easy. For example, Figure 4.12 shows a visualization of the
annual average income and life expectancy for some countries in a certain year. The
visualization is updated every 0.1 seconds. As a result, it shows the life expectancy and
income for next year. When it is the year 2011, the visualization stops updating itself.
Let us see how Uvis can solve this problem in theory.
To show the current year of life expectancy and income, we defined the following
properties of YearLabel:
Year: init 1954
Text: Year
Year is a designer property that retains the current year the visualization is showing
information about. Text makes the label show the year.
58
4.7 Summary
Now we want to create ellipses that show country life expectancy and income for
the year in YearLabel. To accomplish that, we defined the following formulas for
CountryEllipse:
Rows: Country -< Values where year=YearLabel!Year
The Rows formula retrieves the information (e.g. life expectancy, income, etc.) for all
countries in table Country provided the year is the Year of YearLabel.
To make the ellipses show information for next year every 0.1 second, we defined
the following properties of the form object:
Timer: YearLabel!Year < 2011 ? 0.1 : 0
OnTimer: YearLabel!Year = YearLabel!Year + 1, Refresh()
The Timer formula looks at the Year property of YearLabel. If it is less than 2011,
the time has a duration of 0.1 second. Otherwise the timer gets a zero duration. A
zero duration makes the timer stop.
OnTimer is an event that is raised repeatedly according to the Timer value. When
it is raised, Year gets increased by 1, and the visualization is updated.
At present Uvis does not have a timer, but the plan is to make one similar to
what for instance MS Access has: A timer in each Form object. With this in place, an
animation could be made as we discussed.
4.6.3 Other Types of Visualizations
Despite their importance, we have not implemented some types of visualizations such
as geographical ones. A possible solution to geographical visualizations is to provide a
Map visual object that can show a geographical map, and translate coordinates to pixel
positions.
4.6.4 Inability to Define Functions
A designer can not define new functions in Uvis. They require programming, however.
An escape solution is to provide utility functions or specialized visual objects that
perform the required functionality.
4.7 Summary
Despite the limitations, it is possible to create lots of custom visualizations with Uvis.
59
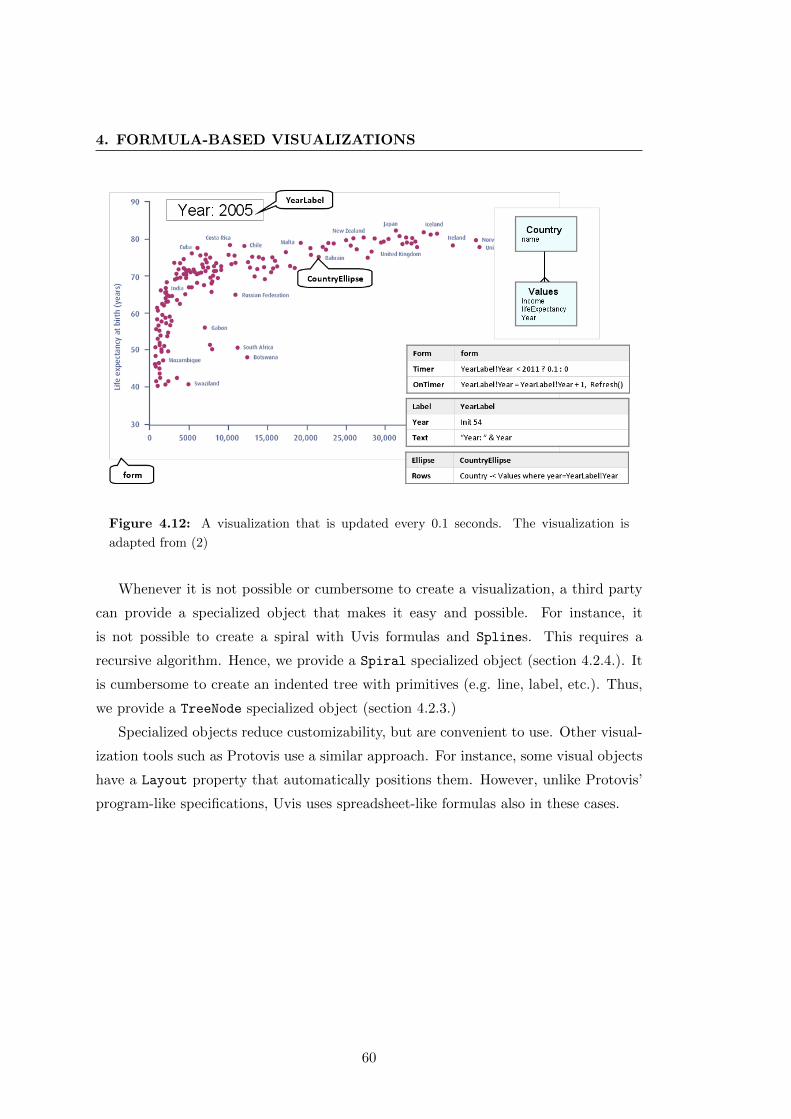
4. FORMULA-BASED VISUALIZATIONS
Figure 4.12: A visualization that is updated every 0.1 seconds. The visualization is
adapted from (2)
Whenever it is not possible or cumbersome to create a visualization, a third party
can provide a specialized object that makes it easy and possible. For instance, it
is not possible to create a spiral with Uvis formulas and Splines. This requires a
recursive algorithm. Hence, we provide a Spiral specialized object (section 4.2.4.). It
is cumbersome to create an indented tree with primitives (e.g. line, label, etc.). Thus,
we provide a TreeNode specialized object (section 4.2.3.)
Specialized objects reduce customizability, but are convenient to use. Other visual-
ization tools such as Protovis use a similar approach. For instance, some visual objects
have a Layout property that automatically positions them. However, unlike Protovis’
program-like specifications, Uvis uses spreadsheet-like formulas also in these cases.
60
5
Uvis Usability
5.1 Introduction
For many reasons, it can be challenging to implement or refine custom visualizations
like the ones in Chapters 3 and 4. For instance, some formula concepts are new to
designers or it is hard to verify that the implemented visualizations are correct. Be-
ing aware of that, the original Uvis approach uses a development environment that
provides cognitive support for designers. For instance, the environment highlights the
problematic parts of the formulas, and immediately updates the visualization.
I made several usability studies with savvy designers to find usability problems in
the initial approach. The details of the studies are presented in chapter 6. The studies
resulted in new features in the environment to improve usability. Further, I investigated
other ways of making Uvis easy to learn. For instance, I designed visual objects with
default formulas that cater for common cases. Further, I provided a tutorial that
thoroughly explains the concepts to the designers.
This chapter presents the principles behind the initial and enhanced versions of the
Uvis system.
5.2 Initial Uvis Version
This section presents the main principles behind the initial Uvis version. The principles
aim at providing a system that is easy to use. Let us look at the details.
61
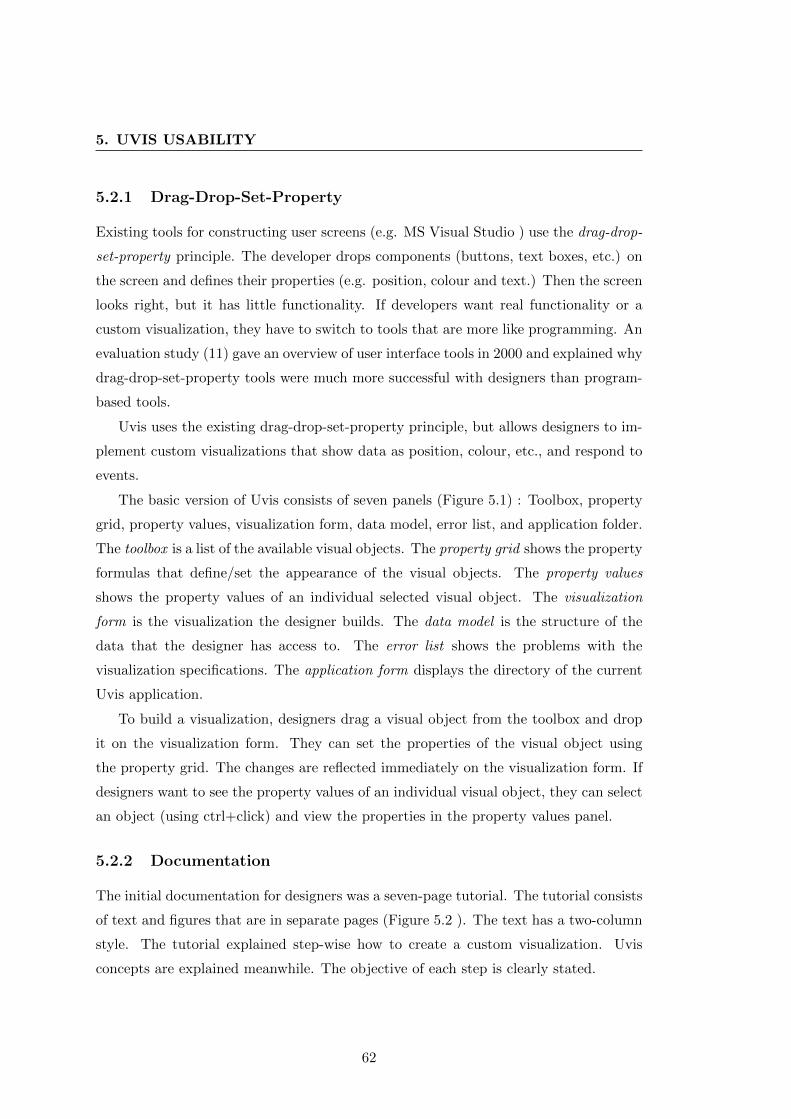
5. UVIS USABILITY
5.2.1 Drag-Drop-Set-Property
Existing tools for constructing user screens (e.g. MS Visual Studio ) use the drag-drop-
set-property principle. The developer drops components (buttons, text boxes, etc.) on
the screen and defines their properties (e.g. position, colour and text.) Then the screen
looks right, but it has little functionality. If developers want real functionality or a
custom visualization, they have to switch to tools that are more like programming. An
evaluation study (11) gave an overview of user interface tools in 2000 and explained why
drag-drop-set-property tools were much more successful with designers than program-
based tools.
Uvis uses the existing drag-drop-set-property principle, but allows designers to im-
plement custom visualizations that show data as position, colour, etc., and respond to
events.
The basic version of Uvis consists of seven panels (Figure 5.1) : Toolbox, property
grid, property values, visualization form, data model, error list, and application folder.
The toolbox is a list of the available visual objects. The property grid shows the property
formulas that define/set the appearance of the visual objects. The property values
shows the property values of an individual selected visual object. The visualization
form is the visualization the designer builds. The data model is the structure of the
data that the designer has access to. The error list shows the problems with the
visualization specifications. The application form displays the directory of the current
Uvis application.
To build a visualization, designers drag a visual object from the toolbox and drop
it on the visualization form. They can set the properties of the visual object using
the property grid. The changes are reflected immediately on the visualization form. If
designers want to see the property values of an individual visual object, they can select
an object (using ctrl+click) and view the properties in the property values panel.
5.2.2 Documentation
The initial documentation for designers was a seven-page tutorial. The tutorial consists
of text and figures that are in separate pages (Figure 5.2 ). The text has a two-column
style. The tutorial explained step-wise how to create a custom visualization. Uvis
concepts are explained meanwhile. The objective of each step is clearly stated.
62
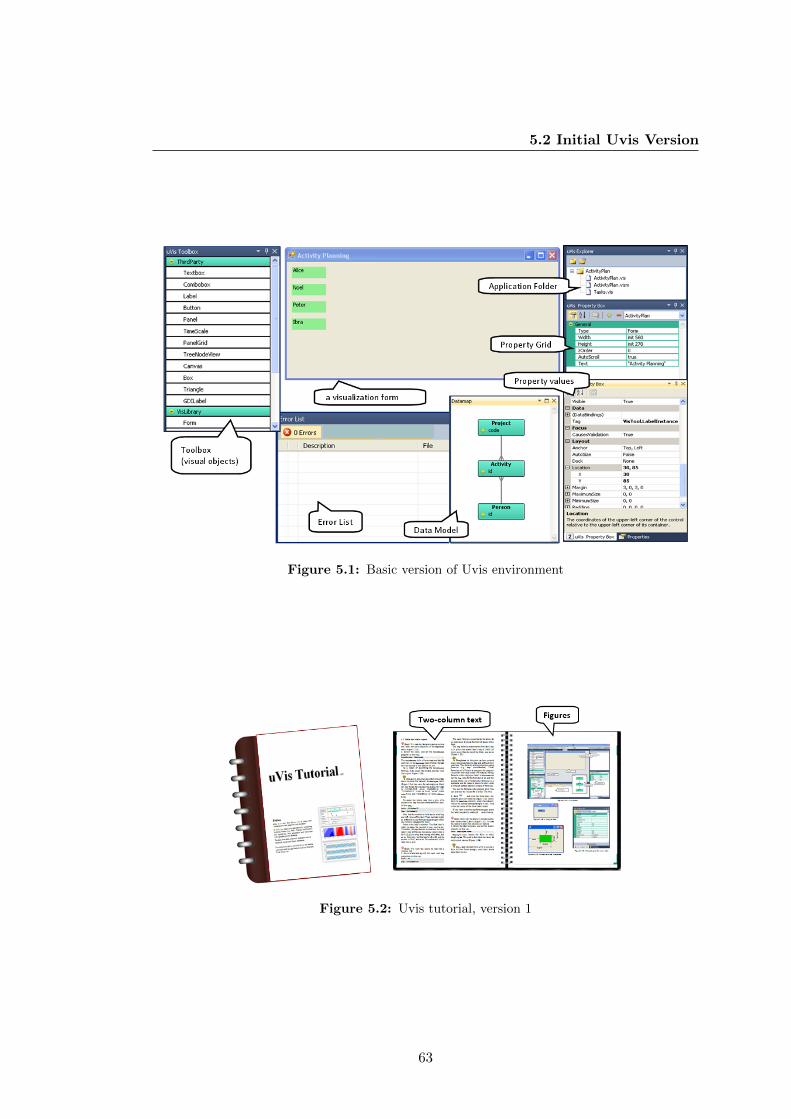
5.2 Initial Uvis Version
Figure 5.1: Basic version of Uvis environment
Figure 5.2: Uvis tutorial, version 1
63
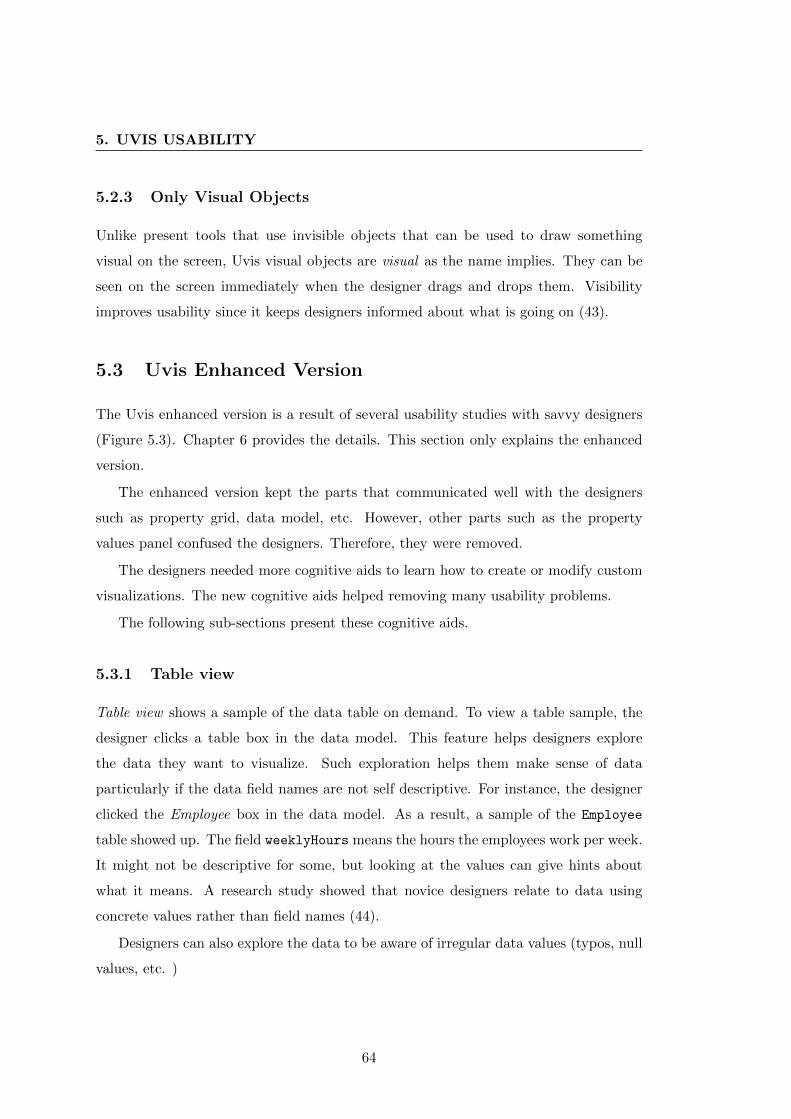
5. UVIS USABILITY
5.2.3 Only Visual Objects
Unlike present tools that use invisible objects that can be used to draw something
visual on the screen, Uvis visual objects are visual as the name implies. They can be
seen on the screen immediately when the designer drags and drops them. Visibility
improves usability since it keeps designers informed about what is going on (43).
5.3 Uvis Enhanced Version
The Uvis enhanced version is a result of several usability studies with savvy designers
(Figure 5.3). Chapter 6 provides the details. This section only explains the enhanced
version.
The enhanced version kept the parts that communicated well with the designers
such as property grid, data model, etc. However, other parts such as the property
values panel confused the designers. Therefore, they were removed.
The designers needed more cognitive aids to learn how to create or modify custom
visualizations. The new cognitive aids helped removing many usability problems.
The following sub-sections present these cognitive aids.
5.3.1 Table view
Table view shows a sample of the data table on demand. To view a table sample, the
designer clicks a table box in the data model. This feature helps designers explore
the data they want to visualize. Such exploration helps them make sense of data
particularly if the data field names are not self descriptive. For instance, the designer
clicked the Employee box in the data model. As a result, a sample of the Employee
table showed up. The field weeklyHours means the hours the employees work per week.
It might not be descriptive for some, but looking at the values can give hints about
what it means. A research study showed that novice designers relate to data using
concrete values rather than field names (44).
Designers can also explore the data to be aware of irregular data values (typos, null
values, etc. )
64
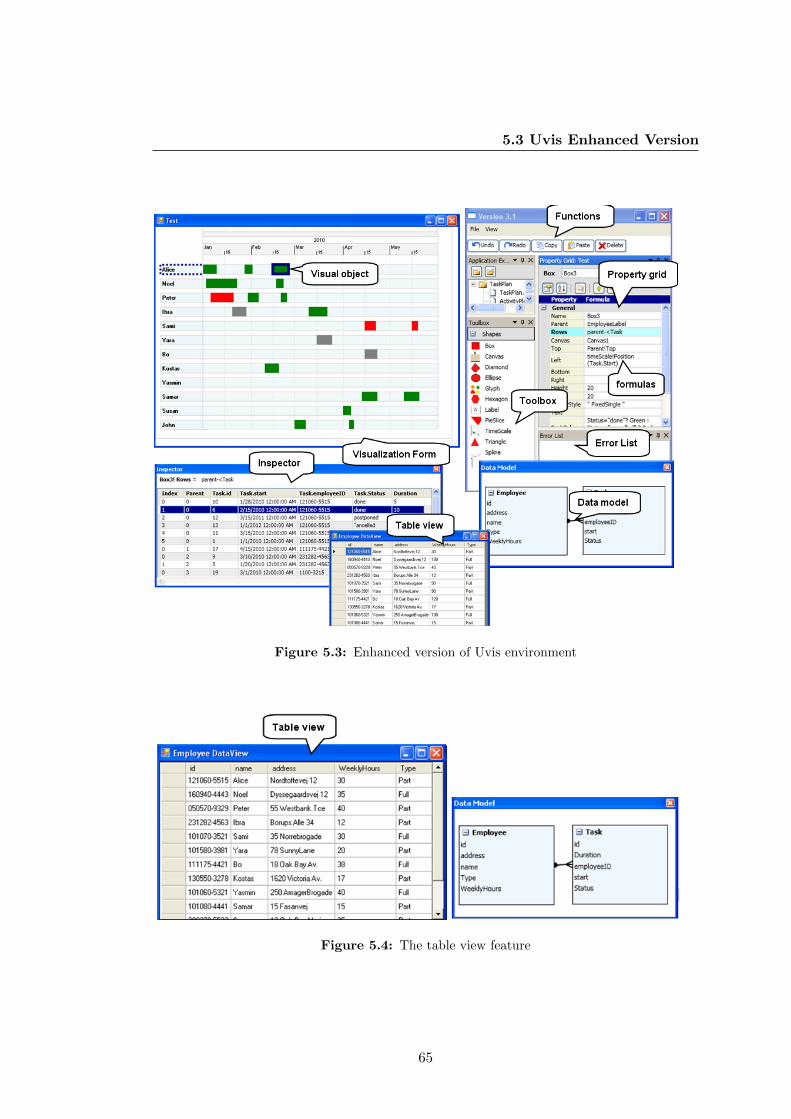
5.3 Uvis Enhanced Version
Figure 5.3: Enhanced version of Uvis environment
Figure 5.4: The table view feature
65
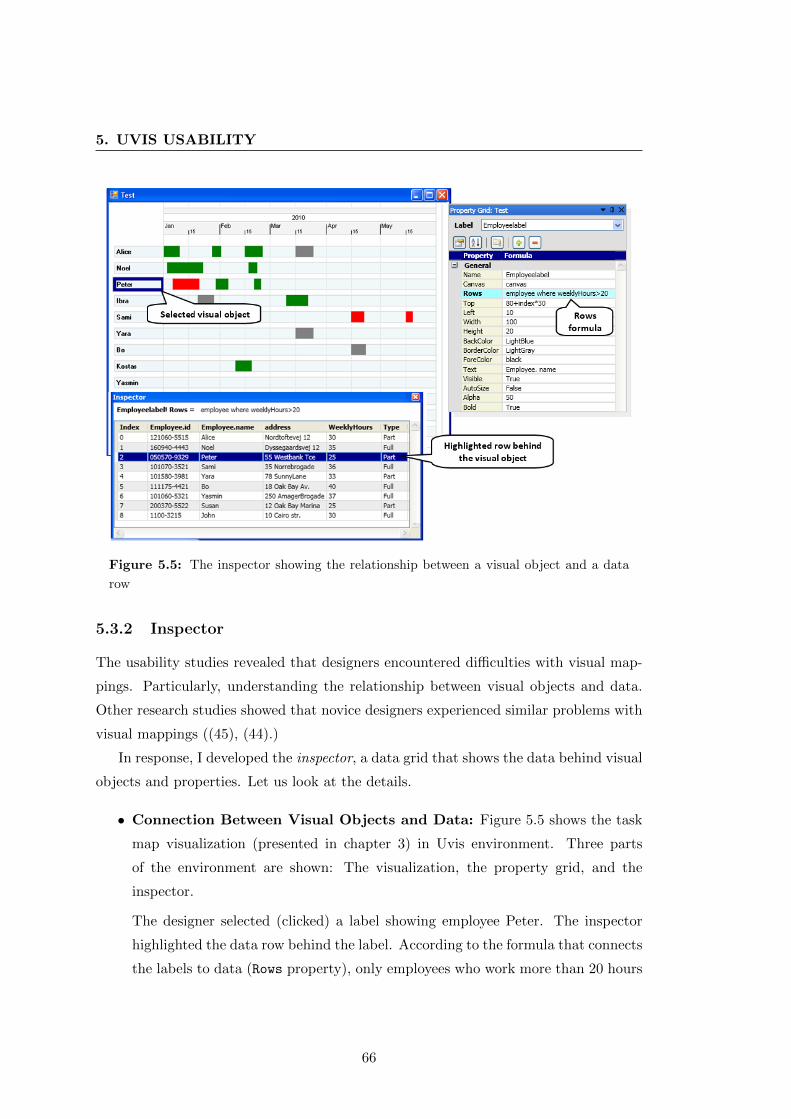
5. UVIS USABILITY
Figure 5.5: The inspector showing the relationship between a visual object and a data
row
5.3.2 Inspector
The usability studies revealed that designers encountered difficulties with visual map-
pings. Particularly, understanding the relationship between visual objects and data.
Other research studies showed that novice designers experienced similar problems with
visual mappings ((45), (44).)
In response, I developed the inspector, a data grid that shows the data behind visual
objects and properties. Let us look at the details.
• Connection Between Visual Objects and Data: Figure 5.5 shows the task
map visualization (presented in chapter 3) in Uvis environment. Three parts
of the environment are shown: The visualization, the property grid, and the
inspector.
The designer selected (clicked) a label showing employee Peter. The inspector
highlighted the data row behind the label. According to the formula that connects
the labels to data (Rows property), only employees who work more than 20 hours
66
5.3 Uvis Enhanced Version
per week should be shown. To confirm that the expression is correct, the designer
can sort (click) the WeeklyHours field in the inspector to check if there are values
less than 20.
Principle: The inspector allows the designers to view the relationship between
a visual object and the underlying data. Selection can be done both ways. De-
signers can select rows in the inspector and the corresponding visual objects are
highlighted and vice versa. When the underlying data changes (due to a change
in the Rows formula), the data in the inspector is updated immediately.
• Connection Between Visual Properties and Data: Figure 5.6 shows that
the designer has selected (clicked) a Box ( TaskBox) representing Alice’s task on
28th January 2010 and the Left property that positions the boxes according to
the time scale.
The Left property of the TaskBox visual object is defined by an expression
(timeScale!Position(Task.Start)).
The inspector breaks the expression down into two sub-expressions: Task.Start
and timescale!Position(Task.Start), and shows the values of the sub-expressions
as well as the index of each TaskBox object in the bundle.
Principle: The inspector allows the designer to view the details of the visual
property mappings and the data behind them. This has a potential of improving
the designer’s understanding of how visual mappings show data.
• Problematic Data Values: Figure 5.7 shows ellipses representing charity marathon
runners. The size of the ellipses represent the runners age. The Left formula
results in negative values for the first two objects. As a result, the objects could
be fully or partly out of view. Hence, the inspector shows the values in yellow as
a warning. If the designer did not intend for this to happen, a visual feedback
would not help. Only concrete values can reveal such a problem. The Hight and
Width formulas are identical, and they refer to field Age. For runner Laura, the
value is null. The default values for Hight and Width in this case are 0, but the
inspector shows the null value in red so the designer is aware.
Principle: In the world of programming, values such as null and division by
zero can be problematic. This applies to the visualization world too, and the
67
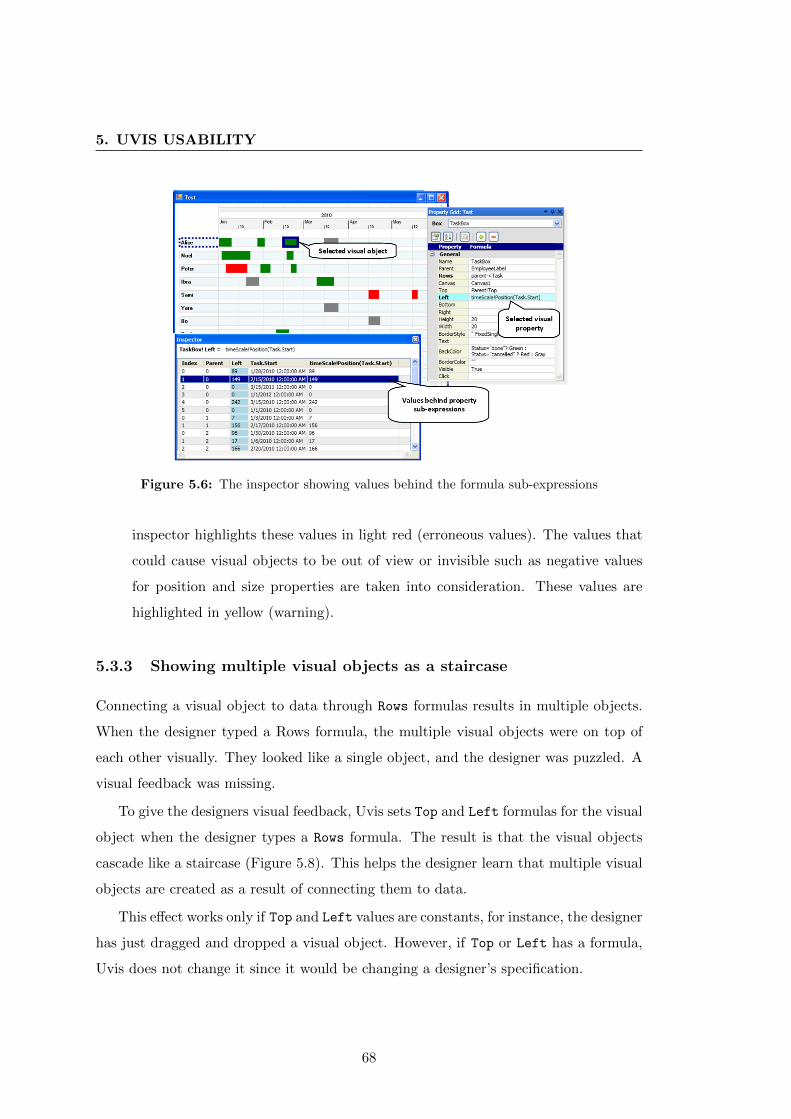
5. UVIS USABILITY
Figure 5.6: The inspector showing values behind the formula sub-expressions
inspector highlights these values in light red (erroneous values). The values that
could cause visual objects to be out of view or invisible such as negative values
for position and size properties are taken into consideration. These values are
highlighted in yellow (warning).
5.3.3 Showing multiple visual objects as a staircase
Connecting a visual object to data through Rows formulas results in multiple objects.
When the designer typed a Rows formula, the multiple visual objects were on top of
each other visually. They looked like a single object, and the designer was puzzled. A
visual feedback was missing.
To give the designers visual feedback, Uvis sets Top and Left formulas for the visual
object when the designer types a Rows formula. The result is that the visual objects
cascade like a staircase (Figure 5.8). This helps the designer learn that multiple visual
objects are created as a result of connecting them to data.
This effect works only if Top and Left values are constants, for instance, the designer
has just dragged and dropped a visual object. However, if Top or Left has a formula,
Uvis does not change it since it would be changing a designer’s specification.
68
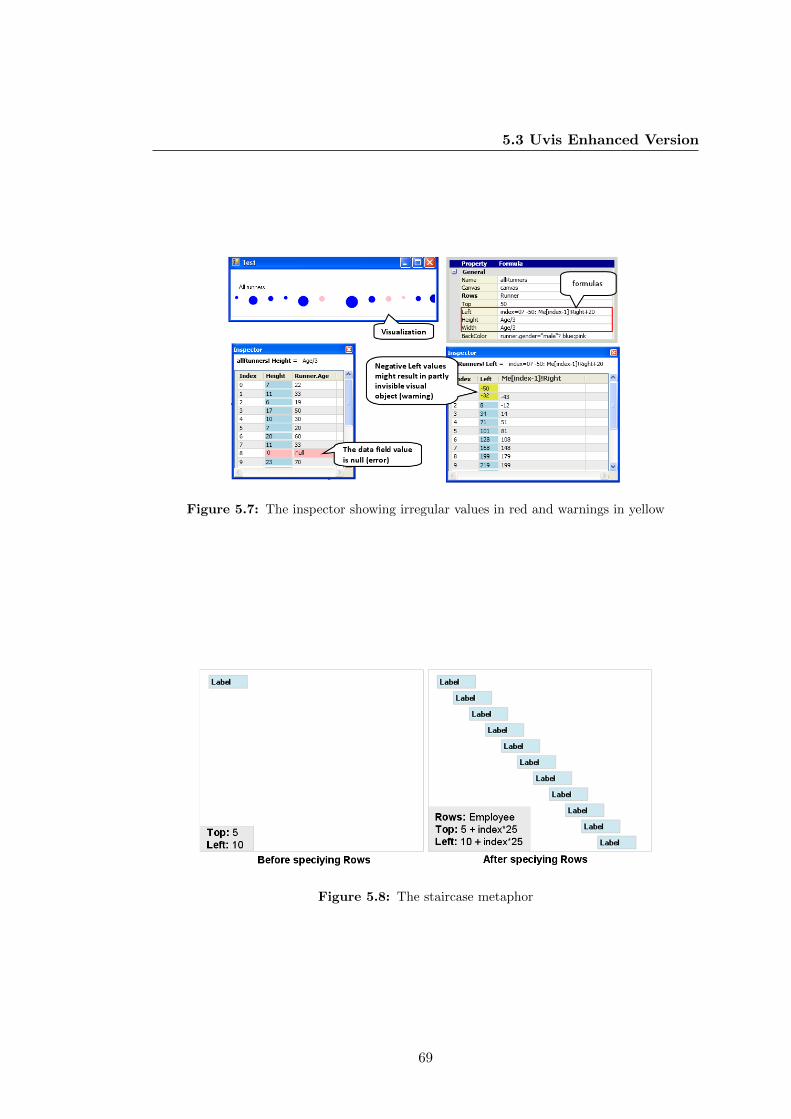
5.3 Uvis Enhanced Version
Figure 5.7: The inspector showing irregular values in red and warnings in yellow
Figure 5.8: The staircase metaphor
69
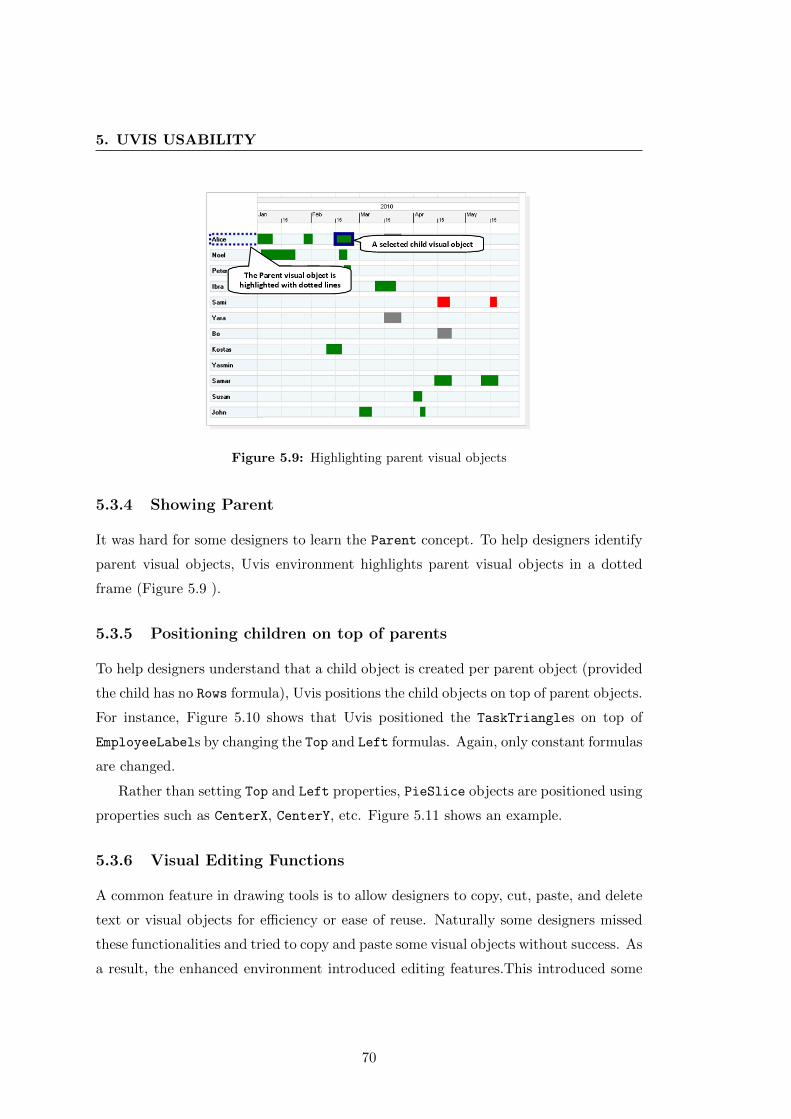
5. UVIS USABILITY
Figure 5.9: Highlighting parent visual objects
5.3.4 Showing Parent
It was hard for some designers to learn the Parent concept. To help designers identify
parent visual objects, Uvis environment highlights parent visual objects in a dotted
frame (Figure 5.9 ).
5.3.5 Positioning children on top of parents
To help designers understand that a child object is created per parent object (provided
the child has no Rows formula), Uvis positions the child objects on top of parent objects.
For instance, Figure 5.10 shows that Uvis positioned the TaskTriangles on top of
EmployeeLabels by changing the Top and Left formulas. Again, only constant formulas
are changed.
Rather than setting Top and Left properties, PieSlice objects are positioned using
properties such as CenterX, CenterY, etc. Figure 5.11 shows an example.
5.3.6 Visual Editing Functions
A common feature in drawing tools is to allow designers to copy, cut, paste, and delete
text or visual objects for efficiency or ease of reuse. Naturally some designers missed
these functionalities and tried to copy and paste some visual objects without success. As
a result, the enhanced environment introduced editing features.This introduced some
70
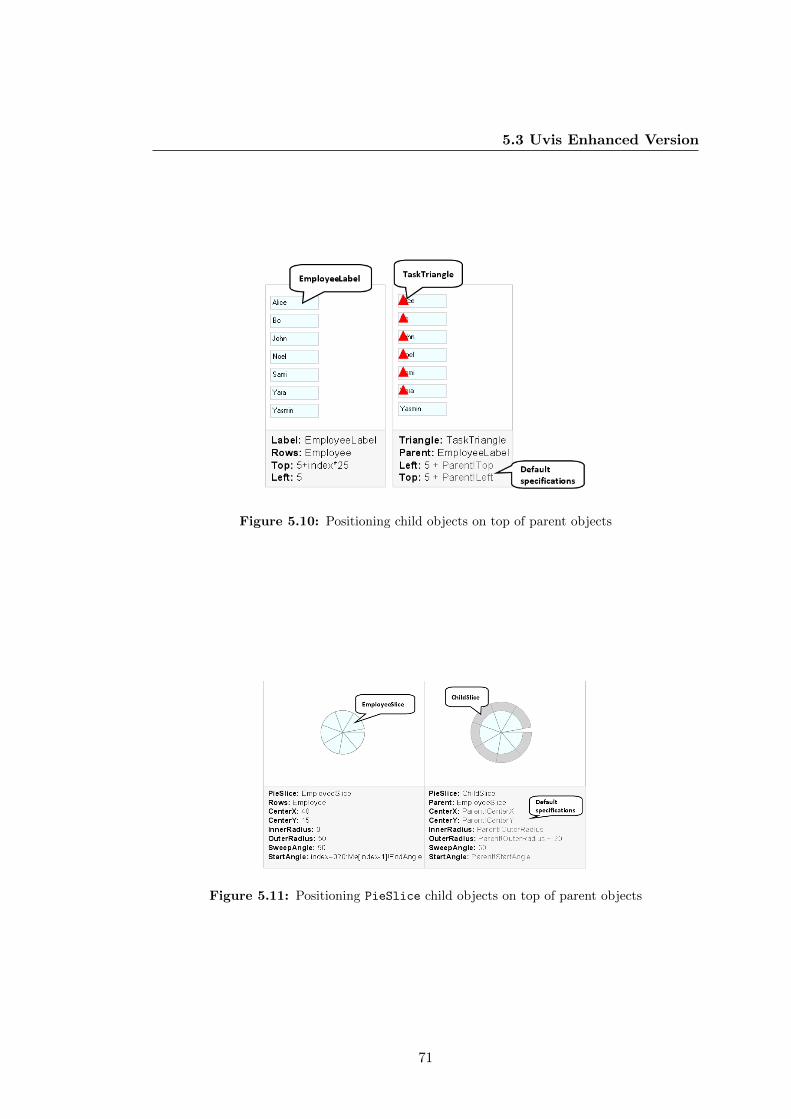
5.3 Uvis Enhanced Version
Figure 5.10: Positioning child objects on top of parent objects
Figure 5.11: Positioning PieSlice child objects on top of parent objects
71
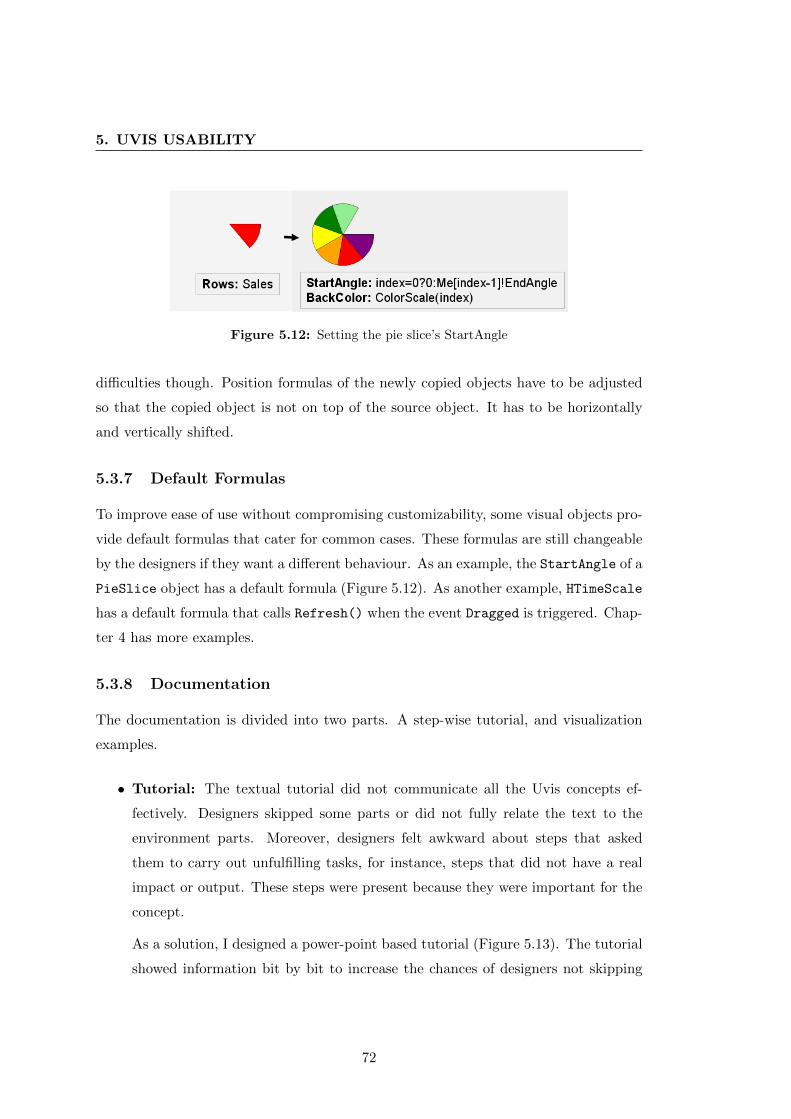
5. UVIS USABILITY
Figure 5.12: Setting the pie slice’s StartAngle
difficulties though. Position formulas of the newly copied objects have to be adjusted
so that the copied object is not on top of the source object. It has to be horizontally
and vertically shifted.
5.3.7 Default Formulas
To improve ease of use without compromising customizability, some visual objects pro-
vide default formulas that cater for common cases. These formulas are still changeable
by the designers if they want a different behaviour. As an example, the StartAngle of a
PieSlice object has a default formula (Figure 5.12). As another example, HTimeScale
has a default formula that calls Refresh() when the event Dragged is triggered. Chap-
ter 4 has more examples.
5.3.8 Documentation
The documentation is divided into two parts. A step-wise tutorial, and visualization
examples.
• Tutorial: The textual tutorial did not communicate all the Uvis concepts ef-
fectively. Designers skipped some parts or did not fully relate the text to the
environment parts. Moreover, designers felt awkward about steps that asked
them to carry out unfulfilling tasks, for instance, steps that did not have a real
impact or output. These steps were present because they were important for the
concept.
As a solution, I designed a power-point based tutorial (Figure 5.13). The tutorial
showed information bit by bit to increase the chances of designers not skipping
72
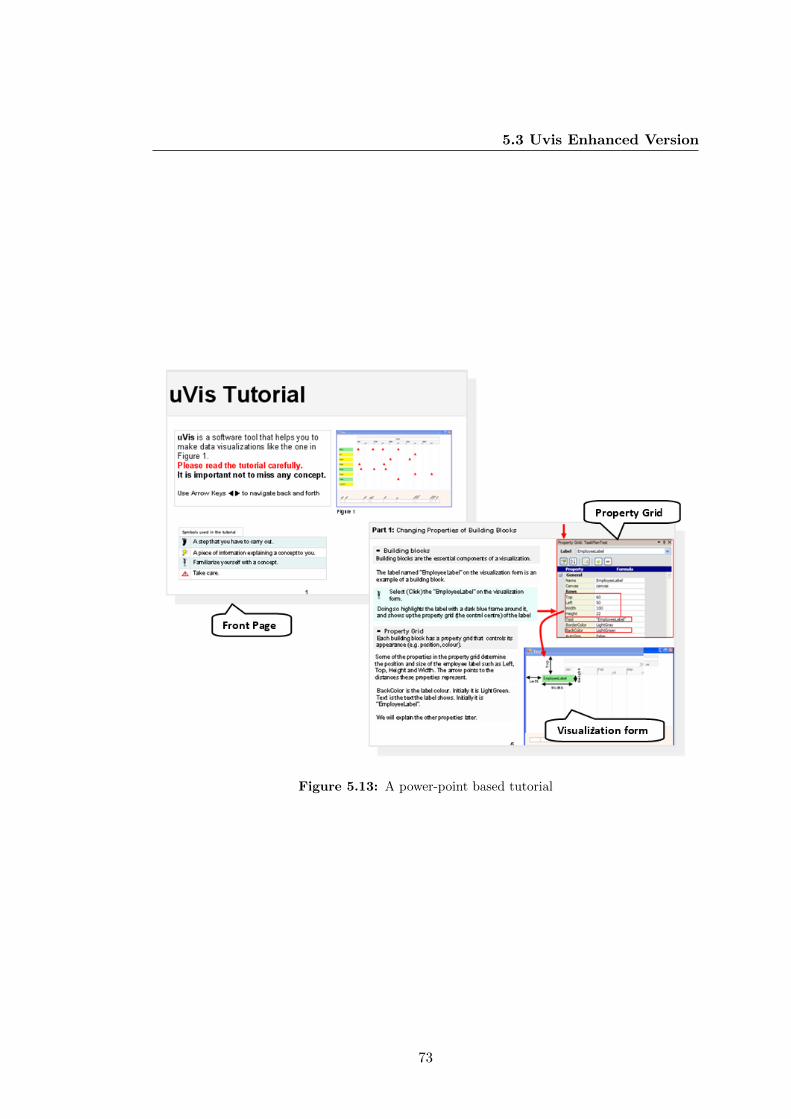
5.3 Uvis Enhanced Version
Figure 5.13: A power-point based tutorial
73
5. UVIS USABILITY
parts. Furthermore, the steps were only the tasks that resulted in something real
on the screen.
The tutorial was improved in other areas too. For instance, the language was
simplified to correspond to the designer’s language, the slides were consistent,
and smooth animation was used to draw the attention of the designer to new
concepts.
• Visualization examples: It is well known that concrete examples improve un-
derstanding (46). This was supported with evidence from usability studies too.
Designers missed an example that is similar to some tasks. In response, examples
on pie slices and curves were produced
5.3.9 Benefits
Although the improvements of Uvis were based on feedback from savvy designers, it
is hard to tell the precise impact of individual improvements on ease of learning. The
improvements collectively reduced the usability problems that designers encountered
with the initial version of Uvis. Chapter 6 provides more details. In one case, however,
I tested the impact of a major cognitive aid as explained in chapter 7. The result is
that it improved completion time and solution quality.
74
6
Iterative Design of the Uvis
System
6.1 Introduction
The main objective of the Uvis system (language, environment, visual objects, and
tutorial) is to make custom visualizations accessible to savvy designers. The initial
version of the Uvis system in chapter 5 was not tested with designers. This chapter
presents how the Uvis system evolved iteratively through involving novice, savvy, and
expert designers. The iterative design process was followed to refine the Uvis system.
This chapter is structured as follows: First, it briefly explains the iterative design
process, the objectives of using the process, the Uvis concepts to be evaluated, and the
tasks designed to evaluate them. Second, the chapter presents the rounds that the Uvis
system went through. Finally, a summary of the findings is given.
6.2 Iterative Design Process
It has been widely recognized that a user interface (UI) should be designed iteratively
since it is almost impossible to design a UI without a usability problem from the
beginning (47, 48, 49). Iterative design (Figure 6.1) is a cyclic process of prototyping,
testing, and refining a UI. An initial prototype is proposed first. The prototype is
usability tested with typical users. Usability studies identify usability problems. The
problems are dealt with according to their severity, and ease of fixing(50). As a result,
75

6. ITERATIVE DESIGN OF THE UVIS SYSTEM
Initial Analysis
Prototype
MedGroup
ID
name
MedType
ID
name
Page Hit
Usability Test
Product
ID
name
Date
Country
Figure 6.1: The iterative design process
a new prototype might be designed and usability tested. The usability test can be
modified too, and so on until a stable version is reached.
The following subsections present the objectives of using the iterative design process,
and the Uvis concepts that the process is designed to evaluate and make accessible to
designers.
6.2.1 Objectives
• Evaluating how easy it is to learn and/or understand Uvis main concepts, and
use Uvis.
• Making custom visualizations accessible to designers based on feedback from us-
ability studies.
• Investigating new ways to support designers.
6.2.2 Uvis Concepts to Evaluate
Figures 6.2 and 6.3 provide overviews of selected Uvis language, environment, and
visual object concepts to evaluate. Only concepts crucial for using Uvis are selected.
For each concept, there are one or more usability factors (e.g. ease of learning) used
to evaluate. For instance, an ease of learning factor means evaluating how easy it is
to learn a concept. Further, each concept is classified according to where it belongs in
the data transformations and/or visual mappings steps (two steps in the visualization
reference model (51))
The usability studies in section 6.4 will explain how I evaluate the Uvis concepts
and measure the corresponding usability factors.
76
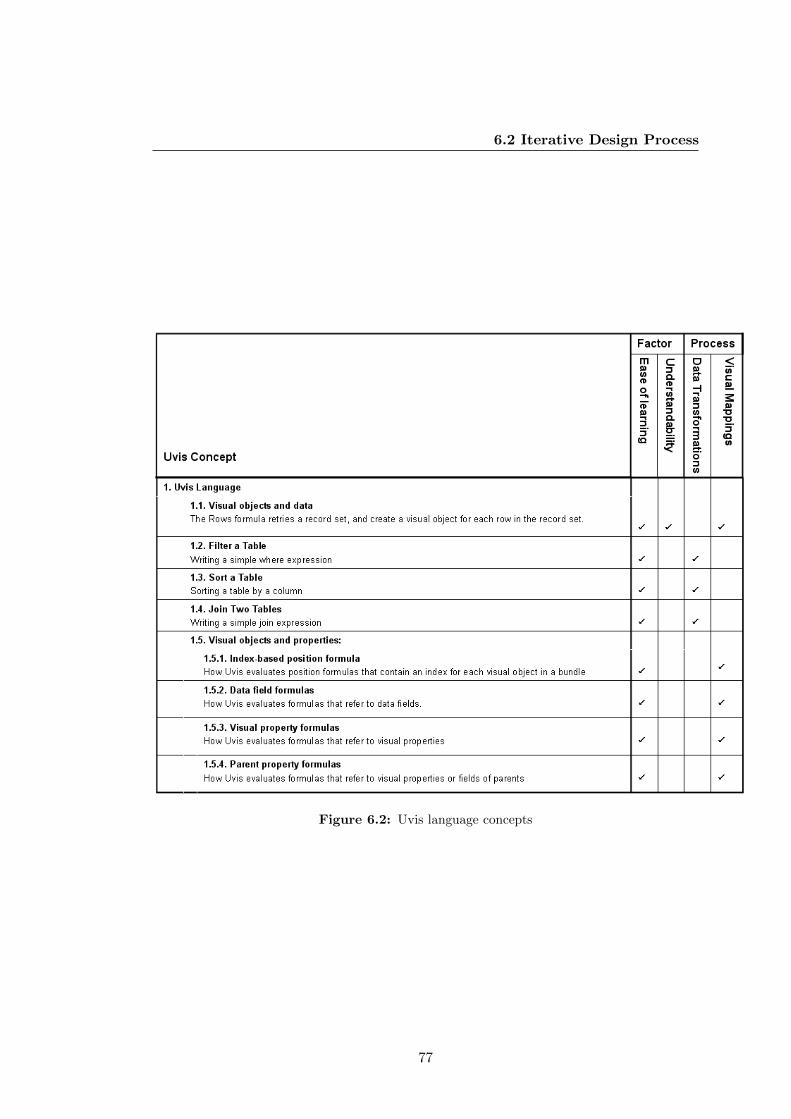
6.2 Iterative Design Process
Figure 6.2: Uvis language concepts
77

6. ITERATIVE DESIGN OF THE UVIS SYSTEM
Figure 6.3: Uvis environment and visual object concepts
78
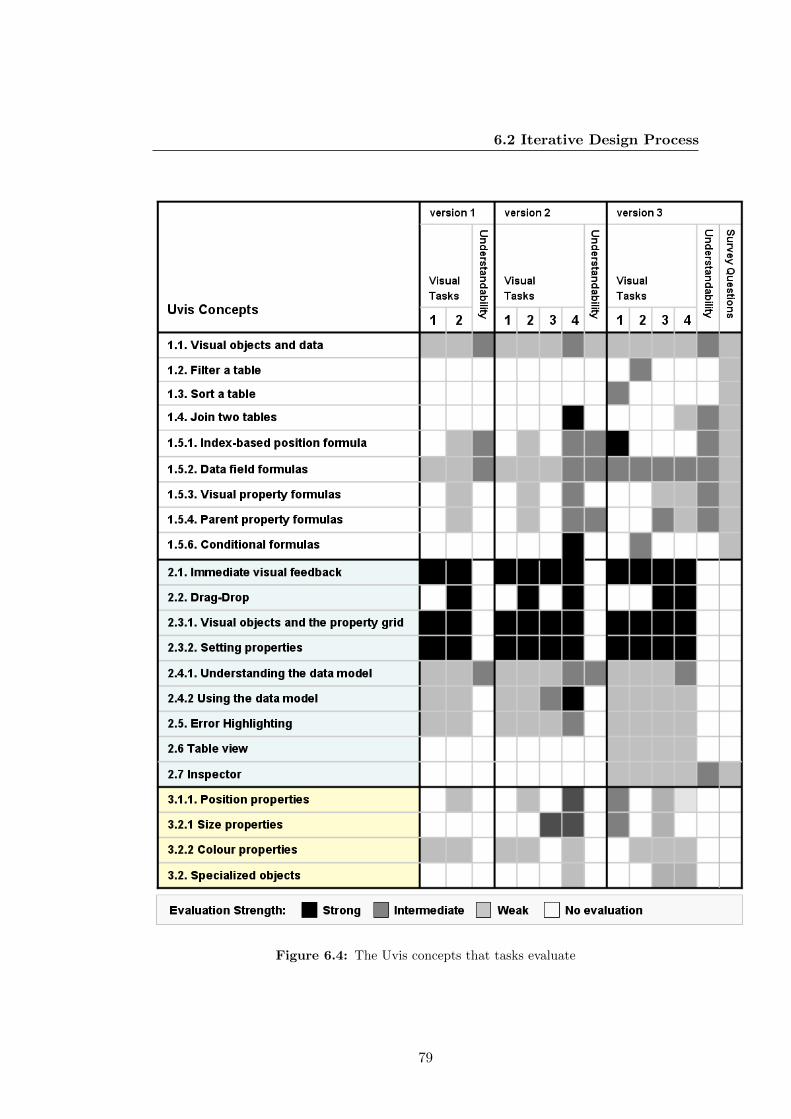
6.2 Iterative Design Process
Figure 6.4: The Uvis concepts that tasks evaluate
79
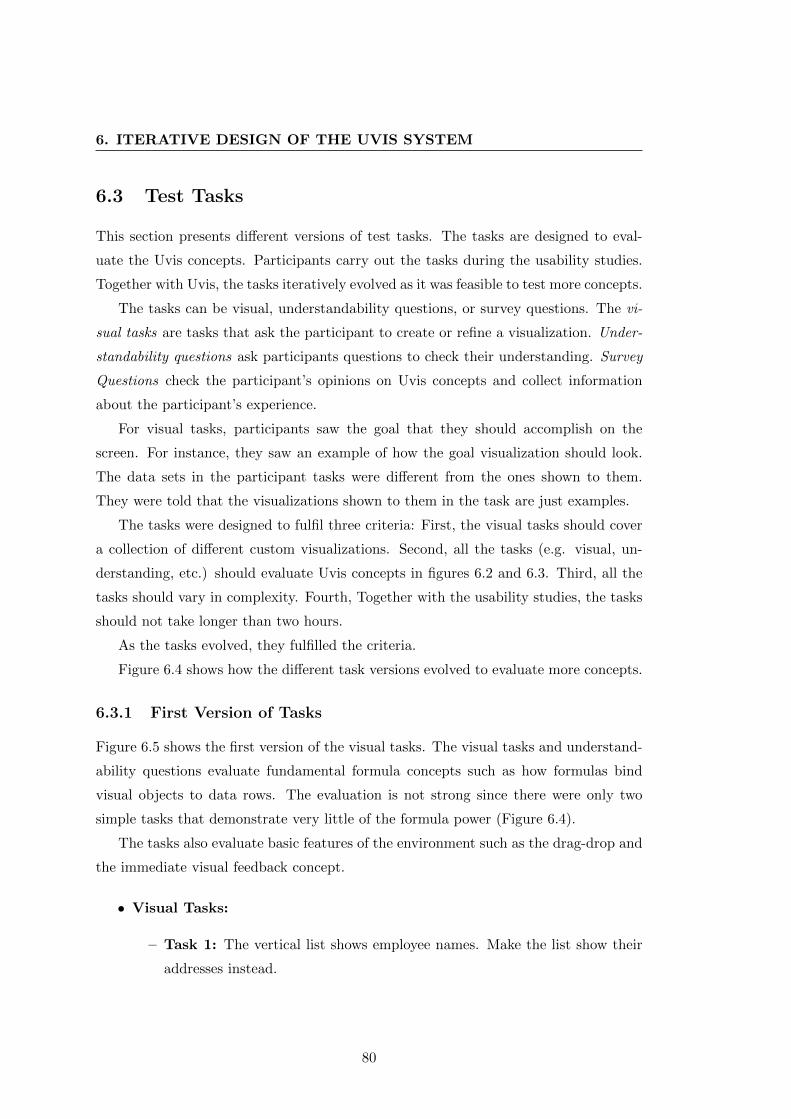
6. ITERATIVE DESIGN OF THE UVIS SYSTEM
6.3 Test Tasks
This section presents different versions of test tasks. The tasks are designed to eval-
uate the Uvis concepts. Participants carry out the tasks during the usability studies.
Together with Uvis, the tasks iteratively evolved as it was feasible to test more concepts.
The tasks can be visual, understandability questions, or survey questions. The vi-
sual tasks are tasks that ask the participant to create or refine a visualization. Under-
standability questions ask participants questions to check their understanding. Survey
Questions check the participant’s opinions on Uvis concepts and collect information
about the participant’s experience.
For visual tasks, participants saw the goal that they should accomplish on the
screen. For instance, they saw an example of how the goal visualization should look.
The data sets in the participant tasks were different from the ones shown to them.
They were told that the visualizations shown to them in the task are just examples.
The tasks were designed to fulfil three criteria: First, the visual tasks should cover
a collection of different custom visualizations. Second, all the tasks (e.g. visual, un-
derstanding, etc.) should evaluate Uvis concepts in figures 6.2 and 6.3. Third, all the
tasks should vary in complexity. Fourth, Together with the usability studies, the tasks
should not take longer than two hours.
As the tasks evolved, they fulfilled the criteria.
Figure 6.4 shows how the different task versions evolved to evaluate more concepts.
6.3.1 First Version of Tasks
Figure 6.5 shows the first version of the visual tasks. The visual tasks and understand-
ability questions evaluate fundamental formula concepts such as how formulas bind
visual objects to data rows. The evaluation is not strong since there were only two
simple tasks that demonstrate very little of the formula power (Figure 6.4).
The tasks also evaluate basic features of the environment such as the drag-drop and
the immediate visual feedback concept.
• Visual Tasks:
– Task 1: The vertical list shows employee names. Make the list show their
addresses instead.
80
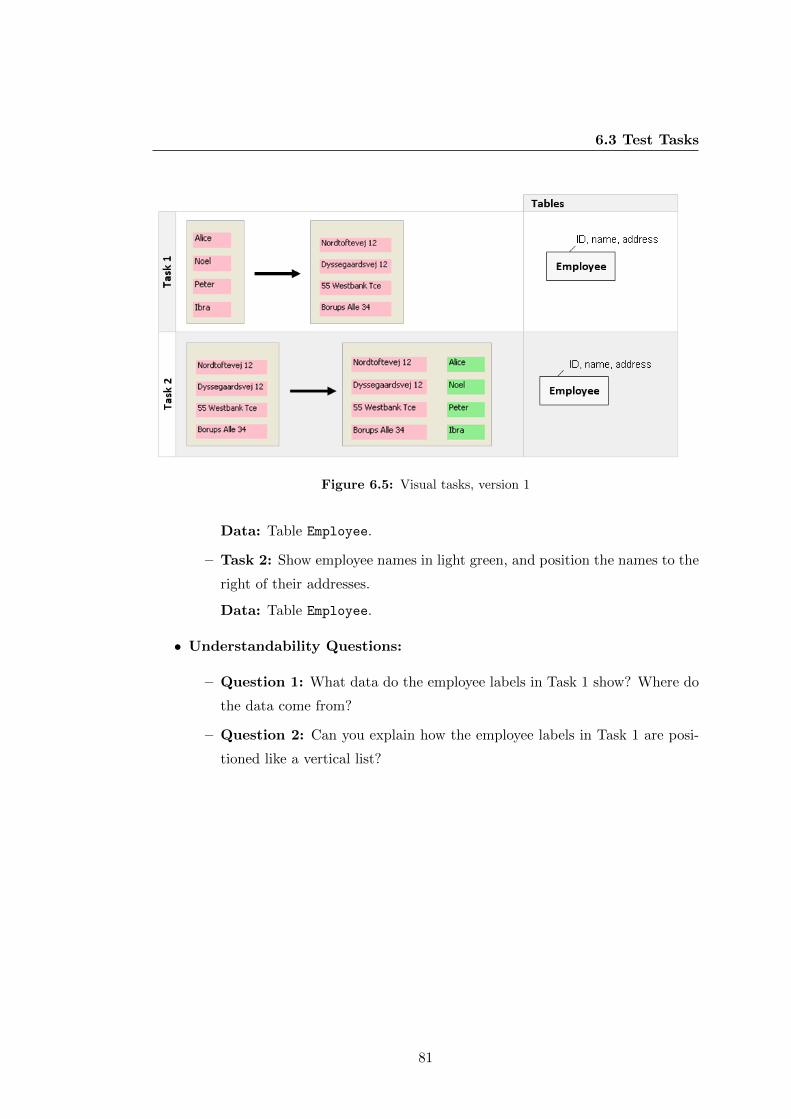
6.3 Test Tasks
Figure 6.5: Visual tasks, version 1
Data: Table Employee.
– Task 2: Show employee names in light green, and position the names to the
right of their addresses.
Data: Table Employee.
• Understandability Questions:
– Question 1: What data do the employee labels in Task 1 show? Where do
the data come from?
– Question 2: Can you explain how the employee labels in Task 1 are posi-
tioned like a vertical list?
81
6. ITERATIVE DESIGN OF THE UVIS SYSTEM
6.3.2 Second Version of Tasks
Figure 6.6 shows the second version of the visual tasks. This version of tasks and under-
standability questions evaluate more advanced formula concepts than the first version.
For instance, the tasks evaluate join formulas, conditional formulas, and formulas that
refer to visual properties.
This version of tasks evaluates some development environment concepts stronger
than the first version. For instance, the data model concept is strongly evaluated in
task 4 since designers have to work out a problem from scratch. They actually have to
use the data model extensively.
The visual tasks vary in complexity. For instance, some tasks draw on concepts
that are familiar to spreadsheet users (e.g. basic mathematical formulas) while others
require the understanding of Uvis specific formulas
• Visual Tasks:
– Task 1: The pink vertical list shows employee names. Make the list show
their addresses instead, also change the list colour to yellow.
Data: Table Employee.
– Task 2: Show employee names in light green, and position them to the right
of their addresses.
Data: Table Employee.
– Task 3: The visualization shows the employee activities in a certain period
of time. Make the activity width represent the activity duration.
Data: Tables Employee and Activity. One employee can have zero or more
activities.
– Task 4: Create a visualization that shows the projects and their activities.
The activities are positioned according to the time scale, and the projects
they belong to.
Data: Tables Project and Activity. One project can have zero or more
activities.
• Understandability Questions:
82
6.3 Test Tasks
– Question 1: What data are the employee labels in Task 1 showing? Where
do the data come from?
– Question 2: Can you explain how the employee labels in Task 1 are posi-
tioned like a vertical list?
– Question 3: Can you explain what Parent means?
– Question 3: Can you explain what the join (-<) symbol mean?
83
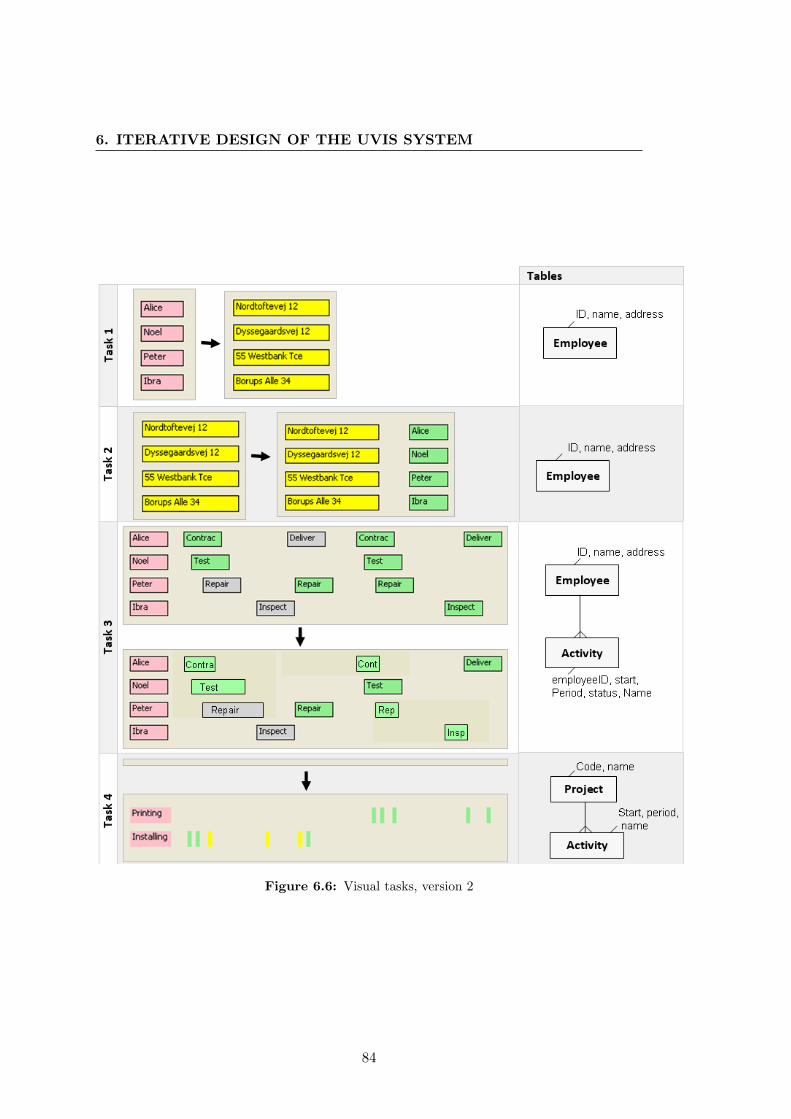
6. ITERATIVE DESIGN OF THE UVIS SYSTEM
Figure 6.6: Visual tasks, version 2
84
6.3 Test Tasks
6.3.3 Third Version of Tasks
Figure 6.7 shows the third version of the visual tasks. The visual tasks evaluate all
the Uvis concepts. Some concepts (e.g. joining two tables) are not evaluated strongly
by the visual tasks, but the understandability questions and opinion survey provide a
supplement to that.
The visual tasks progress in complexity from easy to difficult.
• Visual Tasks:
– Task 1: The bars show data from table Sales.
∗ A. Position the bars horizontally.
∗ B. Make the bar heights show the amount of sales.
∗ C. Sort the bars according to the amount of sales.
Data: Table Sales.
– Task 2:
∗ A. The ellipses on top (grey ellipses) show all runners of a marathon.
Make the male runners blue, and the female ones pink.
∗ B. On the bottom (the Citizen runners row): The ellipses show runners
that are citizens. Now we want the ellipses to only show runners that
are older than 30. Also, change the label from ”Citizen runners” into
”Runners older than 30”.
– Task 3: You have a custom pie chart (see figure below) representing per-
centages of all passengers of several flying classes (e.g. Crew, Economy, etc.).
The percentages of male passengers are shown in light blue pie slices.
Add pink pie slices that show percentages of female passengers on the top
of the male passengers.
Data: Table Passenger
– Task 4: The visualization shows the high temperature readings in three
cities in the period of time from 1 June 2011 to 1 October 2011. The cities
are shown by the labels on the left. The time is displayed by a time scale on
the top. Numeric scales on the right show the range of possible temperatures
in Celsius. The high temperature readings are shown as red curves.
85
6. ITERATIVE DESIGN OF THE UVIS SYSTEM
Add blue curves showing low temperature reading for the shown cities.
Data: Tables City, HighReading, and LowReading. One city can have zero
or more high readings/low readings.
• Survey Questions:
– To what extent do you agree with the following statements?
The answer should be: I strongly agree, I agree, I neither disagree nor agree,
I disagree, or I strongly disagree.
∗ I am confident that my visualizations produce the expected outcomes
described in the tasks
∗ The inspector was helpful.
∗ The tutorial was helpful.
∗ The formulas were easy to understand.
– What difficulties did you encounter during the study?
– Which parts of the formulas were difficult to understand for you?
– Which parts of the formulas were easy to understand for you?
– Do you have any suggestions for improvement?
• Understandability Questions:
– Describe the effect of the ”.” element in the Uvis formulas.
– Describe the effect of the ”!” element in the Uvis formulas.
– Describe the effect of the "-<" element in the Uvis formulas
– Describe the effect of the ”index” element in the Uvis formulas.
The following subsections will present the phases that the Uvis system went through.
In each phase, the section gives a summary of one ore more usability studies and the
identified problems and their fixes. At the end of each phase, a new version is presented,
and the refinements are explained.
The details of the usability studies can be found at (52).
86
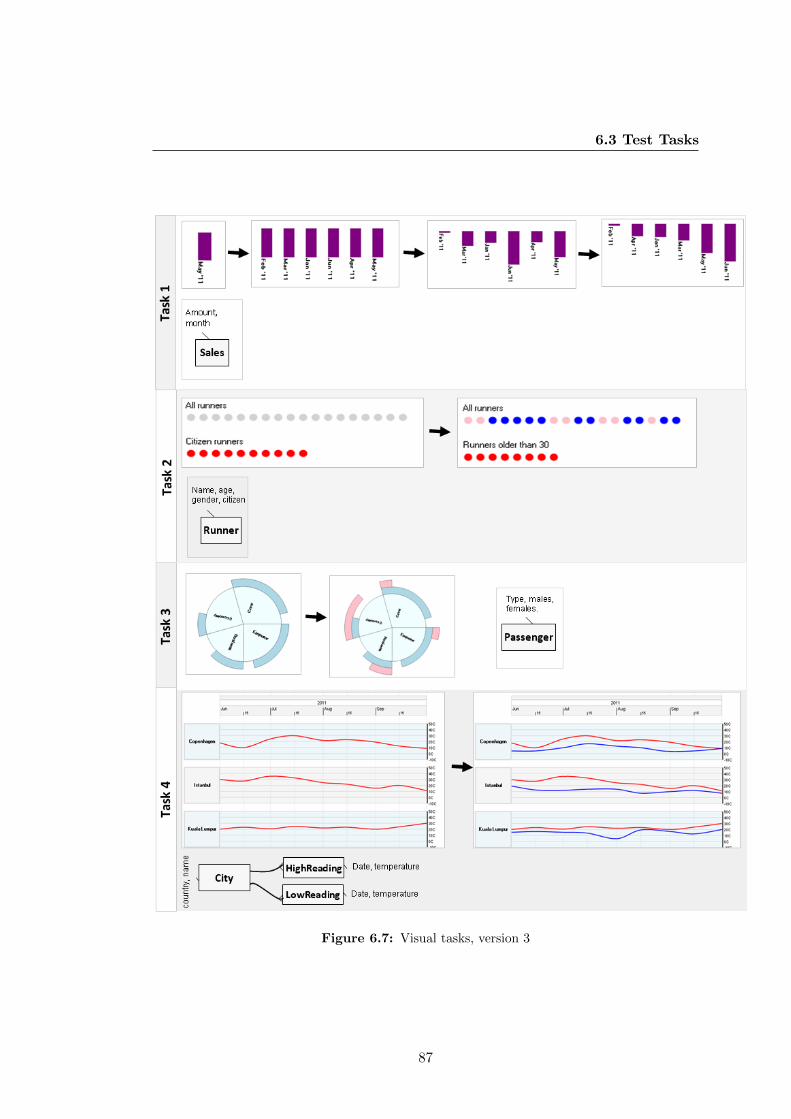
6.3 Test Tasks
Figure 6.7: Visual tasks, version 3
87
6. ITERATIVE DESIGN OF THE UVIS SYSTEM
6.4 First Phase of Evaluation
This phase was carried out with one participant only. One participant is enough to
detect usability problems that everyone will encounter.
6.4.1 The Participant’s Background
• Participant 1
– Gender: male
– Age: 29
– Position: medicine student.
– IT skills: novice IT user, has basic knowledge of MS word and power-point.
6.4.2 The Usability Study Settings
• Tutorial: The first version of the Uvis tutorial, a textual tutorial that explains
step-wise how to make a custom visualization (Employee activity plan). The
tutorial has a two-column style, and the figures are in separate pages.
• Uvis environment: The first version of the Uvis environment, the initial version
of the environment that is presented in chapter 5.
• Test duration: 1 hour and 30 minutes.
• Procedure: The test was carried out in a lab. The participant was asked to
read the tutorial, follow the steps he is asked to do, and think aloud meanwhile.
The tutorial had two sections. At the end of each section, the participant was
asked to carry out a task and answer a few understandability questions.
• Visual Tasks: Tasks 1 and 2, version 1 (Figure 6.5).
• Understandability Questions: Questions 1 and 2, version 1.
88
6.4 First Phase of Evaluation
6.4.3 Qualitative Results:
The participant could easily learn some concepts of the Uvis system. For instance, the
immediate visual feedback and how to set a property and a few other concepts seemed
natural. However, he could not answer the questions.
The participant encountered these problems.
• Problem 1: Connection between visual objects and table rows: When
asked about the relationship between visual objects and data, the participant
could not explain that each visual block is bound to a data row. ”It comes from
the table somehow”, he said.
• Problem 2: Data field formulas: The participant thought he needed to type
the field value for each label’s text (Task 1).
• Problem 3: Data Model: The participant could not use the data model in
both tasks. He did look at it, but could not see the connection between the data
model, and what he needed to do (Tasks 1 and 2).
• Problem 4: Index-based position formulas: The participant could not fig-
ure out how index-based position formulas (i.e. vertical list) were calculated
(Question 2).
• Problem 5: Selecting visual objects is cumbersome: At times, the partic-
ipant forgot how to select a visual object. It was cumbersome to remember the
combination of ctrl and click.
6.4.4 Quantitative results:
The participant failed in both visual tasks. He spent 15 minutes on task 1 and 20
minutes on task 2.
6.4.5 Causes and Solutions:
Figure 6.8 provides an overview of the problems, causes, and solutions.
• Cause 1: Insufficient explanation: Some Uvis concepts (e.g. visual objects
and data, etc.) were not explained well in the tutorial. The language was rather
89
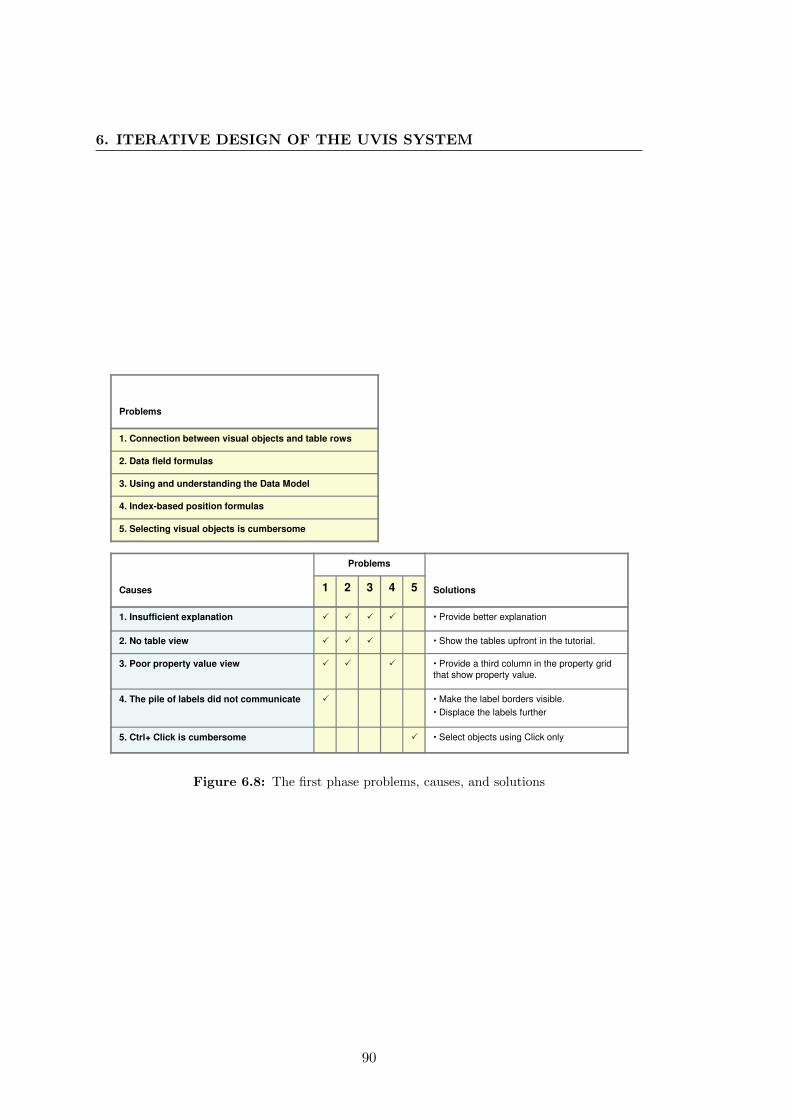
6. ITERATIVE DESIGN OF THE UVIS SYSTEM
Causes
Problems
Solutions1 2 3 4 5
1. Insufficient explanation � � � � � Provide better explanation
1
Problems
1. Connection between visual objects and table rows
2. Data field formulas
3. Using and understanding the Data Model
4. Index-based position formulas
5. Selecting visual objects is cumbersome
1. Insufficient explanation � � � � � Provide better explanation
2. No table view � � � � Show the tables upfront in the tutorial.
3. Poor property value view � � � � Provide a third column in the property grid
that show property value.
4. The pile of labels did not communicate � � Make the label borders visible.
� Displace the labels further
5. Ctrl+ Click is cumbersome � � Select objects using Click only
Figure 6.8: The first phase problems, causes, and solutions
90
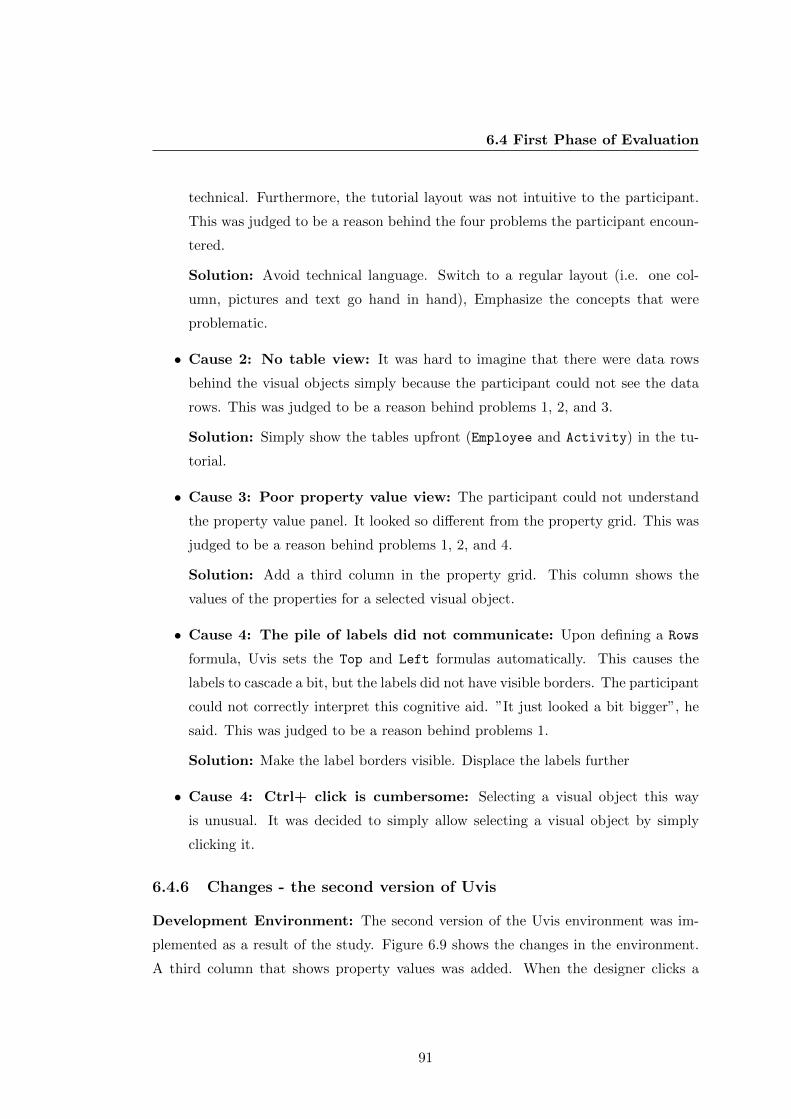
6.4 First Phase of Evaluation
technical. Furthermore, the tutorial layout was not intuitive to the participant.
This was judged to be a reason behind the four problems the participant encoun-
tered.
Solution: Avoid technical language. Switch to a regular layout (i.e. one col-
umn, pictures and text go hand in hand), Emphasize the concepts that were
problematic.
• Cause 2: No table view: It was hard to imagine that there were data rows
behind the visual objects simply because the participant could not see the data
rows. This was judged to be a reason behind problems 1, 2, and 3.
Solution: Simply show the tables upfront (Employee and Activity) in the tu-
torial.
• Cause 3: Poor property value view: The participant could not understand
the property value panel. It looked so different from the property grid. This was
judged to be a reason behind problems 1, 2, and 4.
Solution: Add a third column in the property grid. This column shows the
values of the properties for a selected visual object.
• Cause 4: The pile of labels did not communicate: Upon defining a Rows
formula, Uvis sets the Top and Left formulas automatically. This causes the
labels to cascade a bit, but the labels did not have visible borders. The participant
could not correctly interpret this cognitive aid. ”It just looked a bit bigger”, he
said. This was judged to be a reason behind problems 1.
Solution: Make the label borders visible. Displace the labels further
• Cause 4: Ctrl+ click is cumbersome: Selecting a visual object this way
is unusual. It was decided to simply allow selecting a visual object by simply
clicking it.
6.4.6 Changes - the second version of Uvis
Development Environment: The second version of the Uvis environment was im-
plemented as a result of the study. Figure 6.9 shows the changes in the environment.
A third column that shows property values was added. When the designer clicks a
91
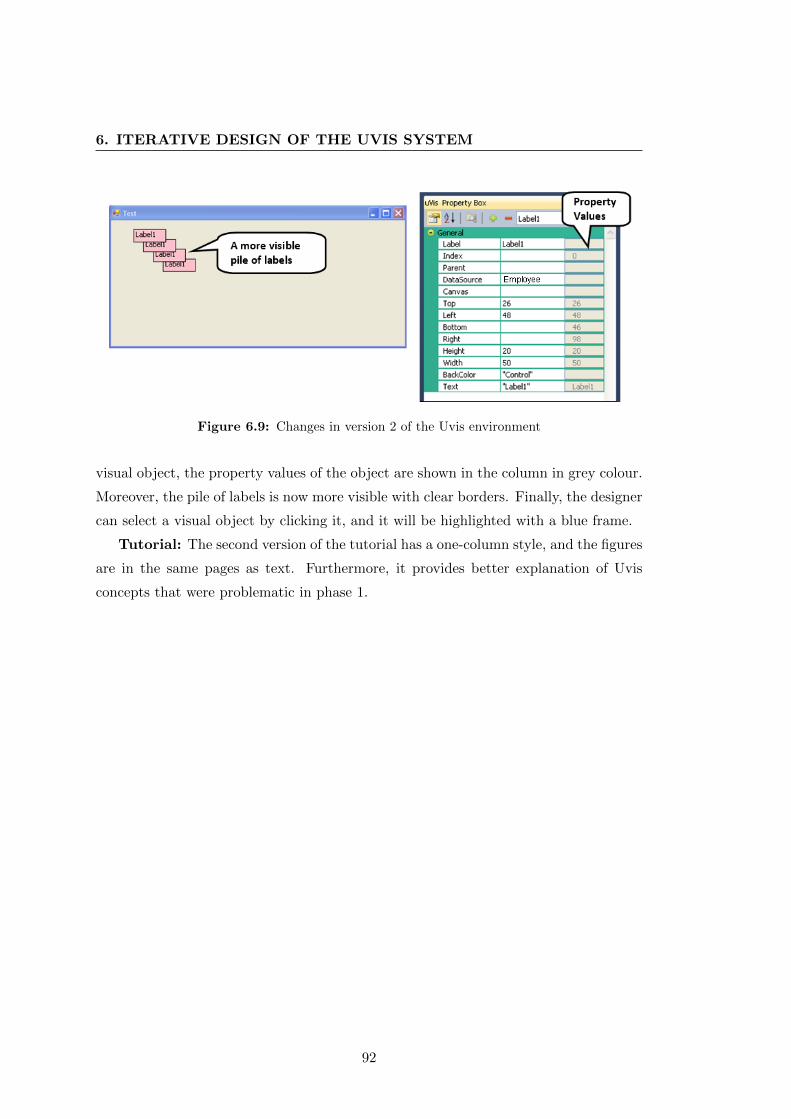
6. ITERATIVE DESIGN OF THE UVIS SYSTEM
Figure 6.9: Changes in version 2 of the Uvis environment
visual object, the property values of the object are shown in the column in grey colour.
Moreover, the pile of labels is now more visible with clear borders. Finally, the designer
can select a visual object by clicking it, and it will be highlighted with a blue frame.
Tutorial: The second version of the tutorial has a one-column style, and the figures
are in the same pages as text. Furthermore, it provides better explanation of Uvis
concepts that were problematic in phase 1.
92
6.5 Second Phase of Evaluation
6.5 Second Phase of Evaluation
This phase was carried out with three participants with different IT skills to get a
feeling of how accessible the Uvis system is.
The changes made in the second version of Uvis did not make a visible difference.
In fact, one of the changes (the property value column) caused confusion. Let us look
at the details.
6.5.1 The Participant’s Background
• Participant 2
– Gender: female
– Age: 29
– Position: a BSc student in biology.
– IT skills: novice IT user, has basic knowledge of MS word and power-point.
• Participant 3
– Gender: male
– Age: 26
– Position: a MSc student in IT.
– IT skills: expert IT user, has knowledge about programming, but has no
visualization design experience.
• Participant 4:
– Gender: male
– Age: 25
– Position: a PhD student in IT.
– IT skills: expert IT user, has knowledge and experience in programming,
but has no visualization design experience.
93
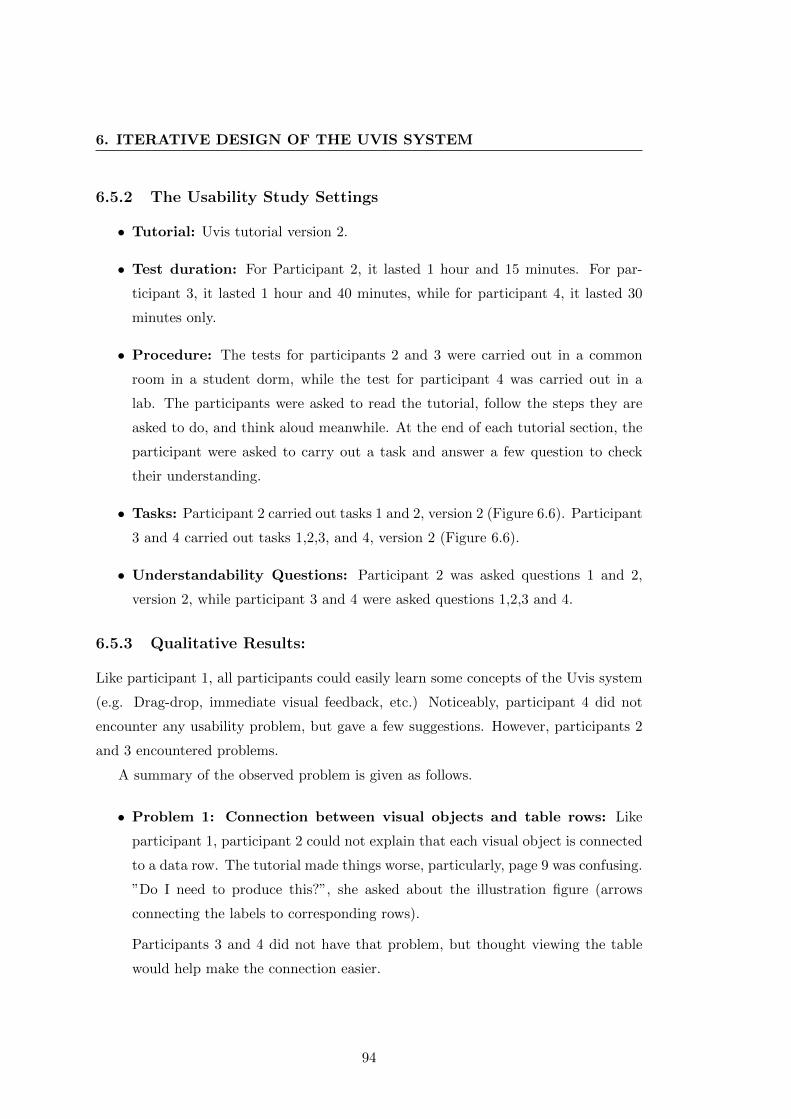
6. ITERATIVE DESIGN OF THE UVIS SYSTEM
6.5.2 The Usability Study Settings
• Tutorial: Uvis tutorial version 2.
• Test duration: For Participant 2, it lasted 1 hour and 15 minutes. For par-
ticipant 3, it lasted 1 hour and 40 minutes, while for participant 4, it lasted 30
minutes only.
• Procedure: The tests for participants 2 and 3 were carried out in a common
room in a student dorm, while the test for participant 4 was carried out in a
lab. The participants were asked to read the tutorial, follow the steps they are
asked to do, and think aloud meanwhile. At the end of each tutorial section, the
participant were asked to carry out a task and answer a few question to check
their understanding.
• Tasks: Participant 2 carried out tasks 1 and 2, version 2 (Figure 6.6). Participant
3 and 4 carried out tasks 1,2,3, and 4, version 2 (Figure 6.6).
• Understandability Questions: Participant 2 was asked questions 1 and 2,
version 2, while participant 3 and 4 were asked questions 1,2,3 and 4.
6.5.3 Qualitative Results:
Like participant 1, all participants could easily learn some concepts of the Uvis system
(e.g. Drag-drop, immediate visual feedback, etc.) Noticeably, participant 4 did not
encounter any usability problem, but gave a few suggestions. However, participants 2
and 3 encountered problems.
A summary of the observed problem is given as follows.
• Problem 1: Connection between visual objects and table rows: Like
participant 1, participant 2 could not explain that each visual object is connected
to a data row. The tutorial made things worse, particularly, page 9 was confusing.
”Do I need to produce this?”, she asked about the illustration figure (arrows
connecting the labels to corresponding rows).
Participants 3 and 4 did not have that problem, but thought viewing the table
would help make the connection easier.
94
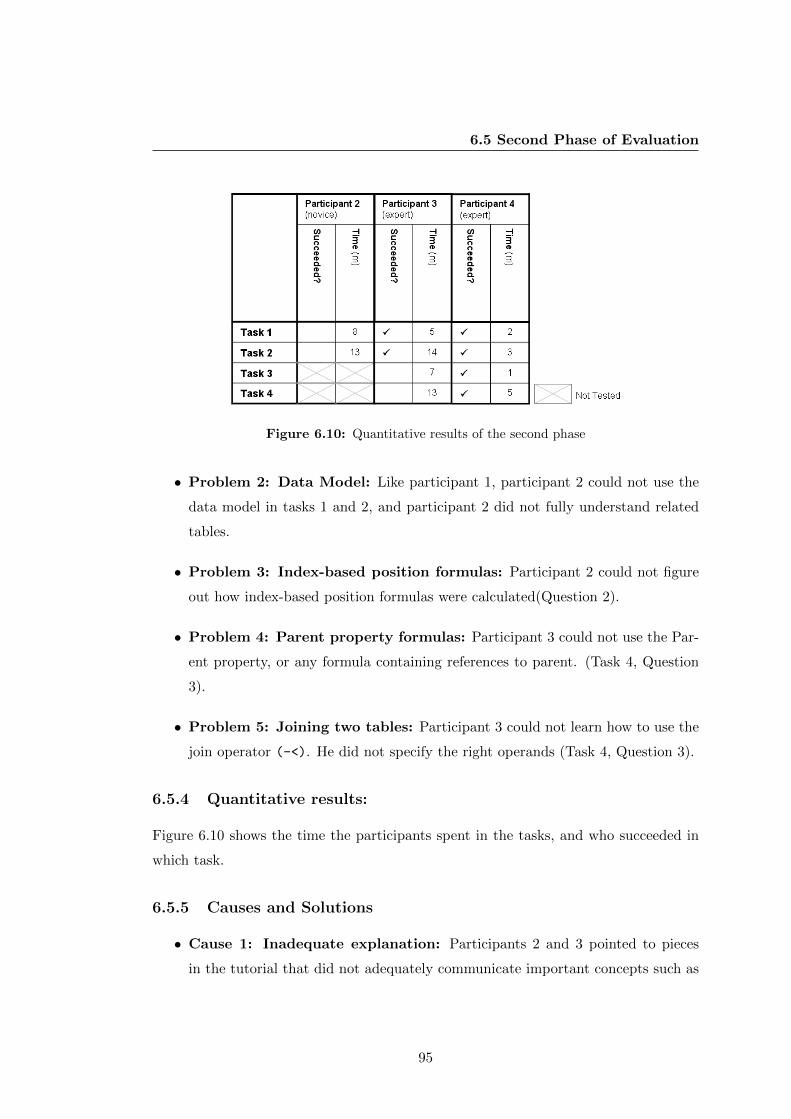
6.5 Second Phase of Evaluation
Figure 6.10: Quantitative results of the second phase
• Problem 2: Data Model: Like participant 1, participant 2 could not use the
data model in tasks 1 and 2, and participant 2 did not fully understand related
tables.
• Problem 3: Index-based position formulas: Participant 2 could not figure
out how index-based position formulas were calculated(Question 2).
• Problem 4: Parent property formulas: Participant 3 could not use the Par-
ent property, or any formula containing references to parent. (Task 4, Question
3).
• Problem 5: Joining two tables: Participant 3 could not learn how to use the
join operator (-<). He did not specify the right operands (Task 4, Question 3).
6.5.4 Quantitative results:
Figure 6.10 shows the time the participants spent in the tasks, and who succeeded in
which task.
6.5.5 Causes and Solutions
• Cause 1: Inadequate explanation: Participants 2 and 3 pointed to pieces
in the tutorial that did not adequately communicate important concepts such as
95
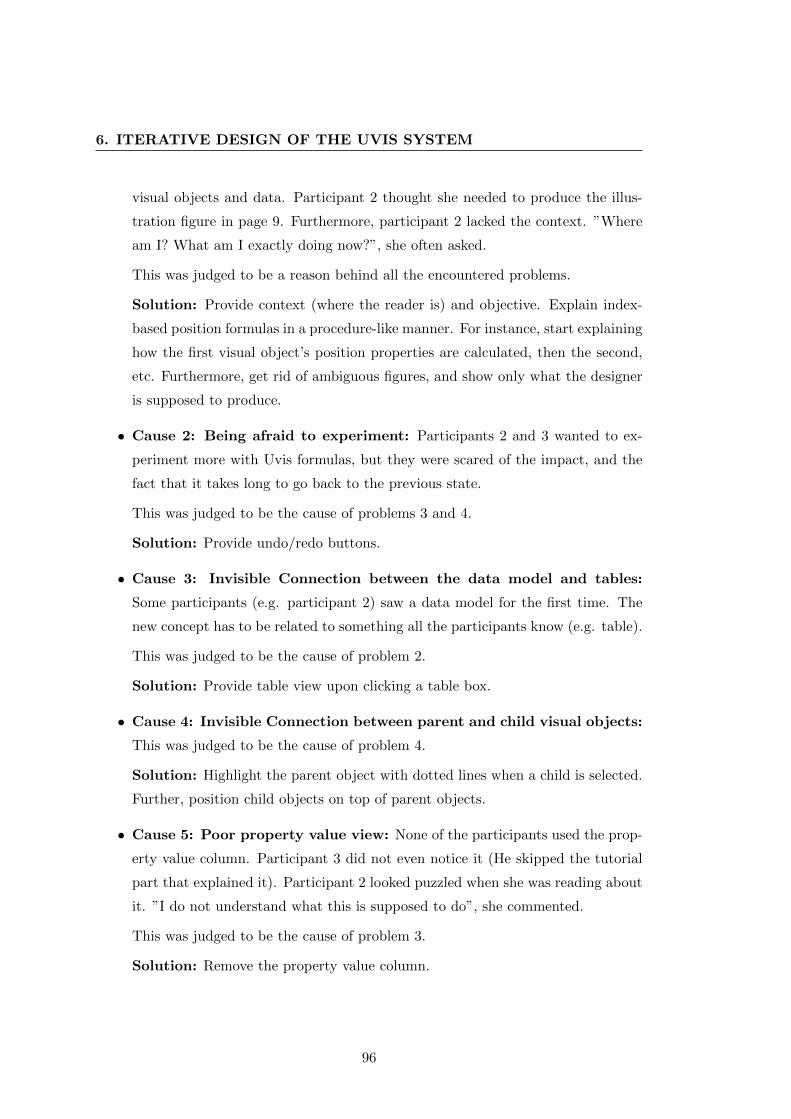
6. ITERATIVE DESIGN OF THE UVIS SYSTEM
visual objects and data. Participant 2 thought she needed to produce the illus-
tration figure in page 9. Furthermore, participant 2 lacked the context. ”Where
am I? What am I exactly doing now?”, she often asked.
This was judged to be a reason behind all the encountered problems.
Solution: Provide context (where the reader is) and objective. Explain index-
based position formulas in a procedure-like manner. For instance, start explaining
how the first visual object’s position properties are calculated, then the second,
etc. Furthermore, get rid of ambiguous figures, and show only what the designer
is supposed to produce.
• Cause 2: Being afraid to experiment: Participants 2 and 3 wanted to ex-
periment more with Uvis formulas, but they were scared of the impact, and the
fact that it takes long to go back to the previous state.
This was judged to be the cause of problems 3 and 4.
Solution: Provide undo/redo buttons.
• Cause 3: Invisible Connection between the data model and tables:
Some participants (e.g. participant 2) saw a data model for the first time. The
new concept has to be related to something all the participants know (e.g. table).
This was judged to be the cause of problem 2.
Solution: Provide table view upon clicking a table box.
• Cause 4: Invisible Connection between parent and child visual objects:
This was judged to be the cause of problem 4.
Solution: Highlight the parent object with dotted lines when a child is selected.
Further, position child objects on top of parent objects.
• Cause 5: Poor property value view: None of the participants used the prop-
erty value column. Participant 3 did not even notice it (He skipped the tutorial
part that explained it). Participant 2 looked puzzled when she was reading about
it. ”I do not understand what this is supposed to do”, she commented.
This was judged to be the cause of problem 3.
Solution: Remove the property value column.
96
6.5 Second Phase of Evaluation
Causes
Problems
Solutions1 2 3 4 5
1. Inadequate explanation � � � � � � Provide better explanation
2
Problems
Participants
2 3 4
1. Connection between visual objects and table rows �
2. Using and understanding the Data Model � �
3. Index-based position formulas �
4. Parent property formulas �
5. Joining two tables �Not Tested
2. Being afraid to experiment � � � Provide undo/redo functions
3. Invisible connection between the data model and tables
� � � Provide table view upon clicking a table box
4. Invisible connection between parent and child objects � � � Allow the parent object to be highlighted with
dotted lines when a child is selected
� Position child objects on top of parent
objects.
5. Poor property value view � � Remove the property value column
Figure 6.11: The second phase problems, causes, and solutions
6.5.6 Changes - The Third Version of Uvis
Development Environment: Version 3 of the Uvis environment was implemented as
a result of phase 2 usability tests. Figure 6.12 shows the changes in the environment.
A table is shown when the designer double clicks the corresponding table box in the
data model. A parent visual object is highlighted with a dotted frame when one of
its visual children is selected. Further, the child objects are positioned on top of the
parent objects upon the specification of Parent property (Section 5.3.5). The property
value column in Uvis 2 was removed, and the property grid has lighter colours.
Tutorial: Version 3 of the tutorial provided a clear objective for the steps the
participant is taking. Furthermore, it provided procedure-like explanation for how the
formulas are calculated.
97
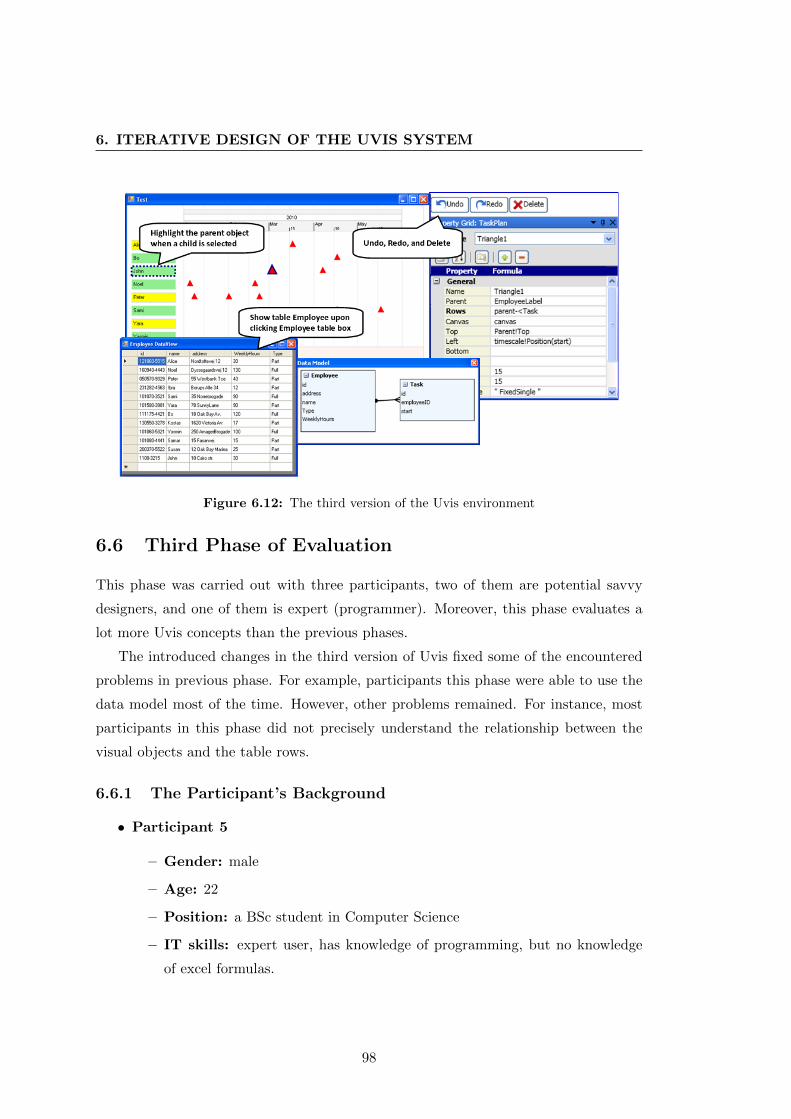
6. ITERATIVE DESIGN OF THE UVIS SYSTEM
Figure 6.12: The third version of the Uvis environment
6.6 Third Phase of Evaluation
This phase was carried out with three participants, two of them are potential savvy
designers, and one of them is expert (programmer). Moreover, this phase evaluates a
lot more Uvis concepts than the previous phases.
The introduced changes in the third version of Uvis fixed some of the encountered
problems in previous phase. For example, participants this phase were able to use the
data model most of the time. However, other problems remained. For instance, most
participants in this phase did not precisely understand the relationship between the
visual objects and the table rows.
6.6.1 The Participant’s Background
• Participant 5
– Gender: male
– Age: 22
– Position: a BSc student in Computer Science
– IT skills: expert user, has knowledge of programming, but no knowledge
of excel formulas.
98
6.6 Third Phase of Evaluation
• Participant 6
– Gender: male
– Age: 18
– Position: a first year mechanical engineering student.
– IT skills: savvy designer, has basic knowledge of programming.
• Participant 7
– Gender: female
– Age: 17
– Position: student.
– IT skills: savvy designer, knows basic math, and has created charts with
Excel formulas before.
6.6.2 The Usability Study Settings
• Tutorial: Uvis tutorial version 3.
• Test duration: For Participant 5, it lasted 1 hour and 40 minutes. For partici-
pant 6, it lasted 1 hour and 50 minutes, while for participant 7, it lasted 2 hours
and 20 minutes.
• Procedure: The tests for participants 6 and 7 were carried in a lab, while the
test for participant 5 was carried out at a public library. The participants were
asked to read the tutorial, follow the steps he is asked to do, and think aloud
meanwhile. At the end of each tutorial section, the participants were asked to
carry out a task and answer a few question to check their understanding.
• Visual Tasks: All participants carried out tasks 3, version 3 (Figure 6.7).
• Questions: All participants were asked to fill in the form in section 6.3.3.
99
6. ITERATIVE DESIGN OF THE UVIS SYSTEM
6.6.3 Qualitative Results
• Problem 1: Connection between visual objects and table rows: Partic-
ipants 6 and 7 had difficulties explaining the relationship between visual objects
and table rows. To them, the visual objects (labels) come from the table some-
how. Participant 5, though, could point to the direct relationship between a
visual object and a data row.
• Problem 2: Inability to check the correctness of the visualization: Par-
ticipant 7 came up with the right Rows formula for task 2, B, but changed her
mind because she did not see a visual difference. She could not confirm her
solution.
• Problem 3: Conditional formulas: Participant 6 could not figure out how to
use conditional formulas .
• Problem 4: Order by formulas: Participant 5 could not learn how to use
order by formulas.
• Problem 5: Complex visual objects: All participants spent significant time
finding their way through task 3 because it had some mathematical barriers (e.g.
inner radius, outer radius, etc.)
6.6.4 Quantitative Results
Figure 6.13 gives an overview of the quantitative results of the third phase.
6.6.5 Causes and Solutions
• Cause 1: Participants skip tutorial parts Most participants tend to skip
parts in the tutorial that do not catch their attention. Unfortunately, some of
these parts might be crucial to the Uvis concepts understanding. For instance,
explaining how visual objects and rows are related.
Solution: Provide a power-point tutorial that proceeds step by step so that the
participant tends to focus on one thing at a time. The textual tutorial will still
be there as a reference.
100
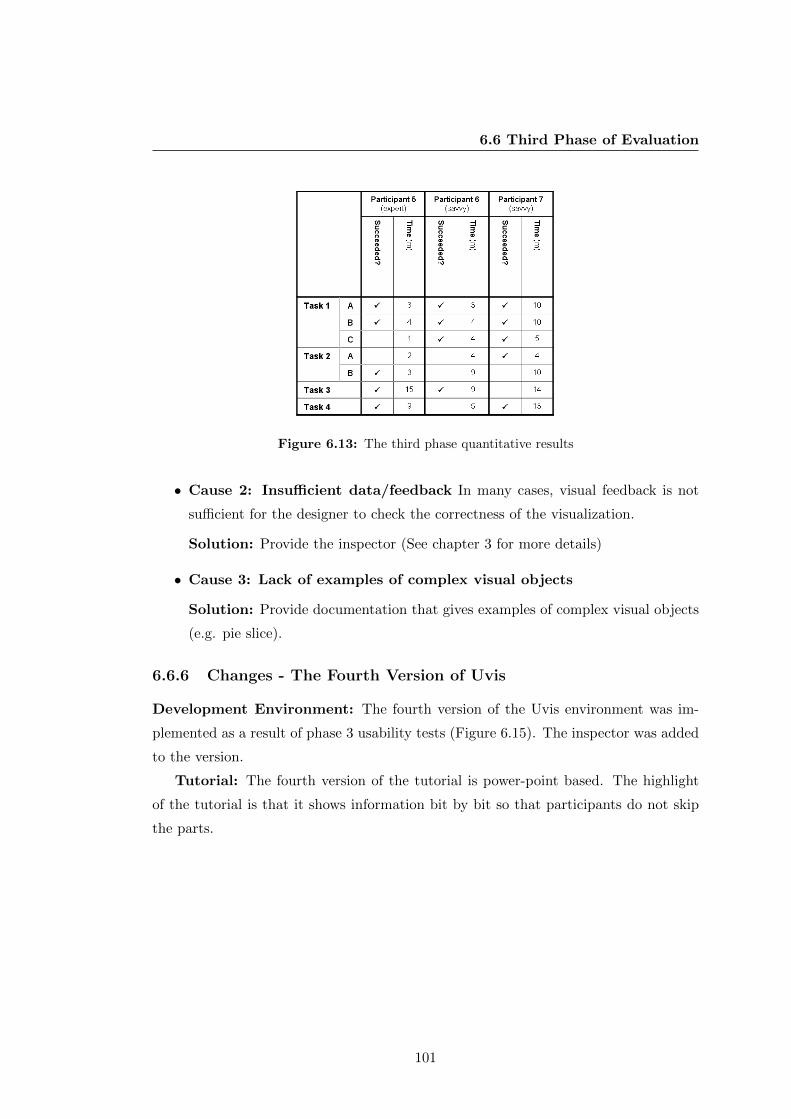
6.6 Third Phase of Evaluation
Figure 6.13: The third phase quantitative results
• Cause 2: Insufficient data/feedback In many cases, visual feedback is not
sufficient for the designer to check the correctness of the visualization.
Solution: Provide the inspector (See chapter 3 for more details)
• Cause 3: Lack of examples of complex visual objects
Solution: Provide documentation that gives examples of complex visual objects
(e.g. pie slice).
6.6.6 Changes - The Fourth Version of Uvis
Development Environment: The fourth version of the Uvis environment was im-
plemented as a result of phase 3 usability tests (Figure 6.15). The inspector was added
to the version.
Tutorial: The fourth version of the tutorial is power-point based. The highlight
of the tutorial is that it shows information bit by bit so that participants do not skip
the parts.
101
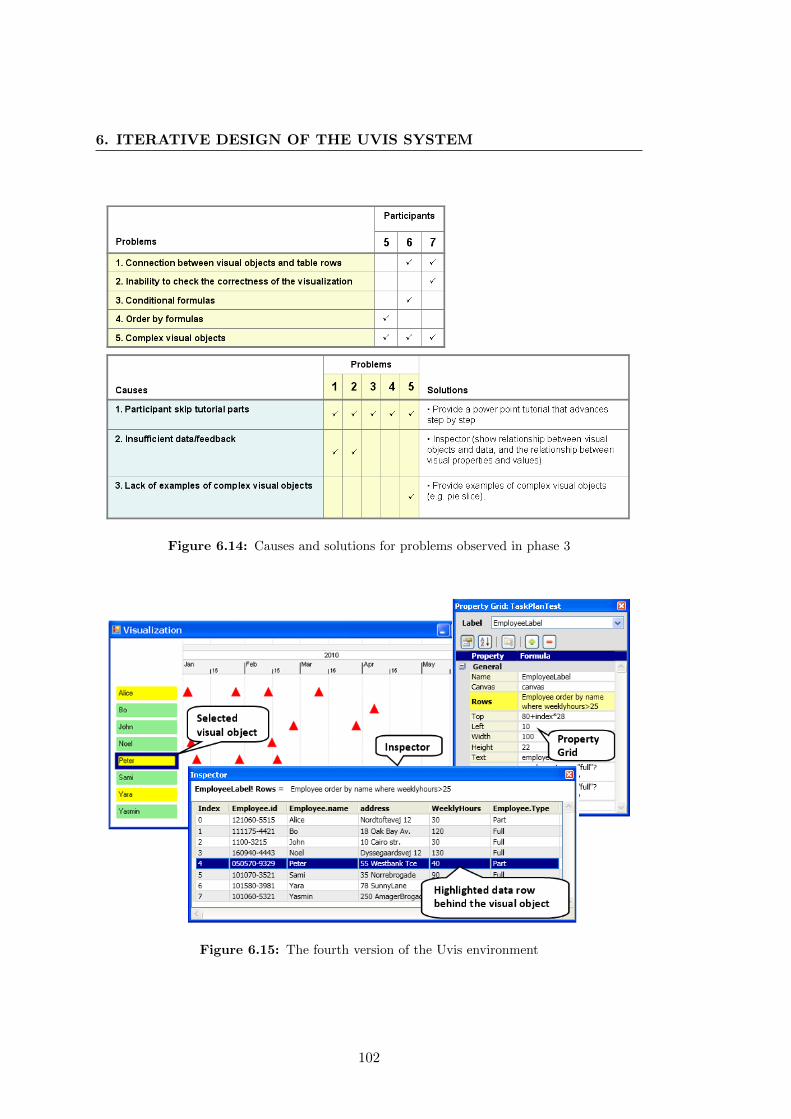
6. ITERATIVE DESIGN OF THE UVIS SYSTEM
Figure 6.14: Causes and solutions for problems observed in phase 3
Figure 6.15: The fourth version of the Uvis environment
102
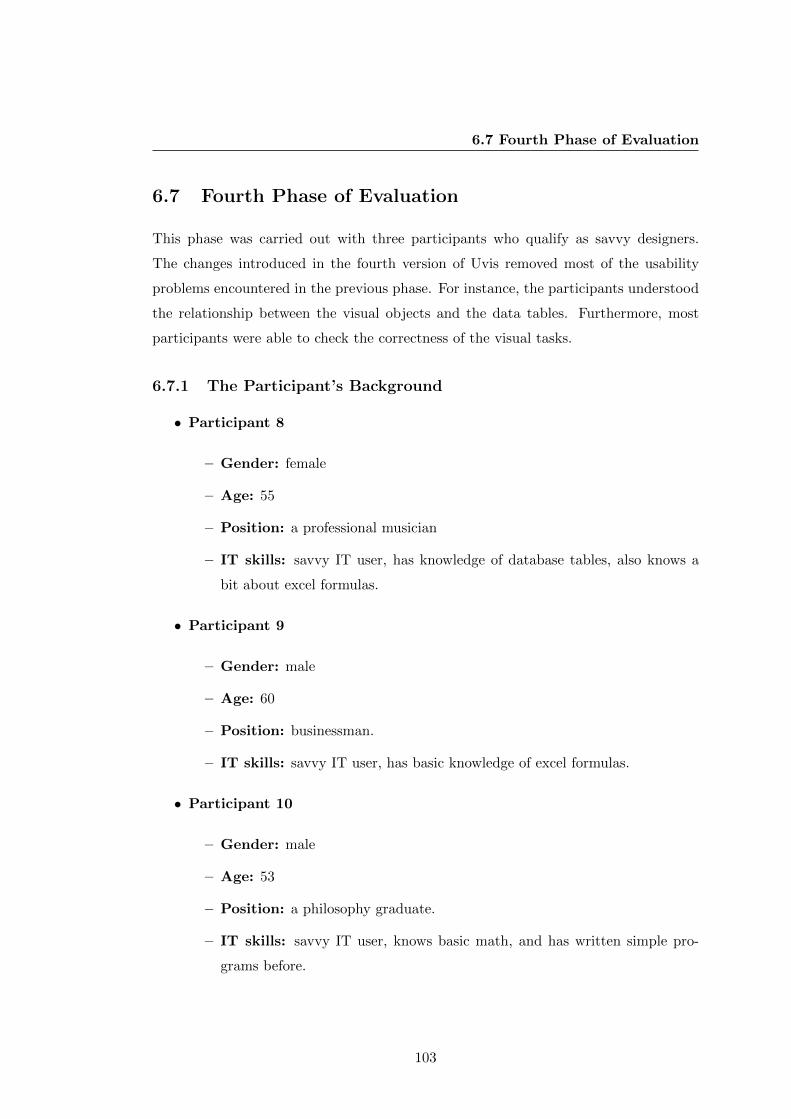
6.7 Fourth Phase of Evaluation
6.7 Fourth Phase of Evaluation
This phase was carried out with three participants who qualify as savvy designers.
The changes introduced in the fourth version of Uvis removed most of the usability
problems encountered in the previous phase. For instance, the participants understood
the relationship between the visual objects and the data tables. Furthermore, most
participants were able to check the correctness of the visual tasks.
6.7.1 The Participant’s Background
• Participant 8
– Gender: female
– Age: 55
– Position: a professional musician
– IT skills: savvy IT user, has knowledge of database tables, also knows a
bit about excel formulas.
• Participant 9
– Gender: male
– Age: 60
– Position: businessman.
– IT skills: savvy IT user, has basic knowledge of excel formulas.
• Participant 10
– Gender: male
– Age: 53
– Position: a philosophy graduate.
– IT skills: savvy IT user, knows basic math, and has written simple pro-
grams before.
103
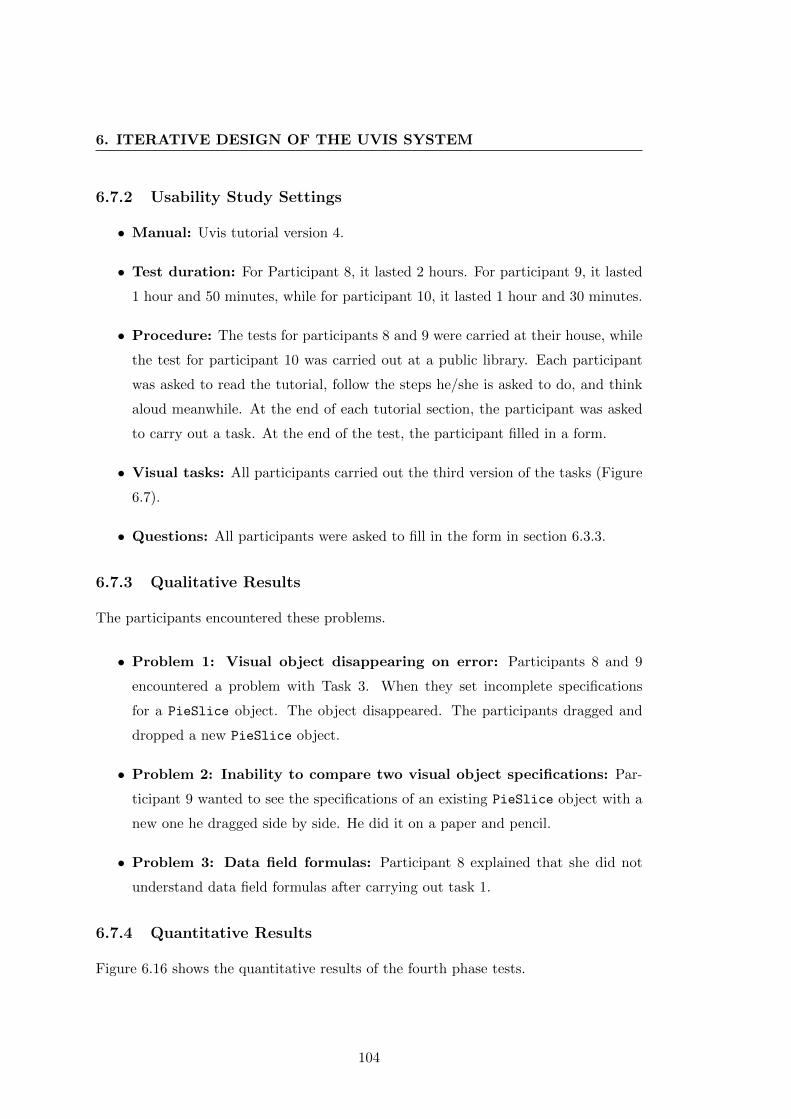
6. ITERATIVE DESIGN OF THE UVIS SYSTEM
6.7.2 Usability Study Settings
• Manual: Uvis tutorial version 4.
• Test duration: For Participant 8, it lasted 2 hours. For participant 9, it lasted
1 hour and 50 minutes, while for participant 10, it lasted 1 hour and 30 minutes.
• Procedure: The tests for participants 8 and 9 were carried at their house, while
the test for participant 10 was carried out at a public library. Each participant
was asked to read the tutorial, follow the steps he/she is asked to do, and think
aloud meanwhile. At the end of each tutorial section, the participant was asked
to carry out a task. At the end of the test, the participant filled in a form.
• Visual tasks: All participants carried out the third version of the tasks (Figure
6.7).
• Questions: All participants were asked to fill in the form in section 6.3.3.
6.7.3 Qualitative Results
The participants encountered these problems.
• Problem 1: Visual object disappearing on error: Participants 8 and 9
encountered a problem with Task 3. When they set incomplete specifications
for a PieSlice object. The object disappeared. The participants dragged and
dropped a new PieSlice object.
• Problem 2: Inability to compare two visual object specifications: Par-
ticipant 9 wanted to see the specifications of an existing PieSlice object with a
new one he dragged side by side. He did it on a paper and pencil.
• Problem 3: Data field formulas: Participant 8 explained that she did not
understand data field formulas after carrying out task 1.
6.7.4 Quantitative Results
Figure 6.16 shows the quantitative results of the fourth phase tests.
104
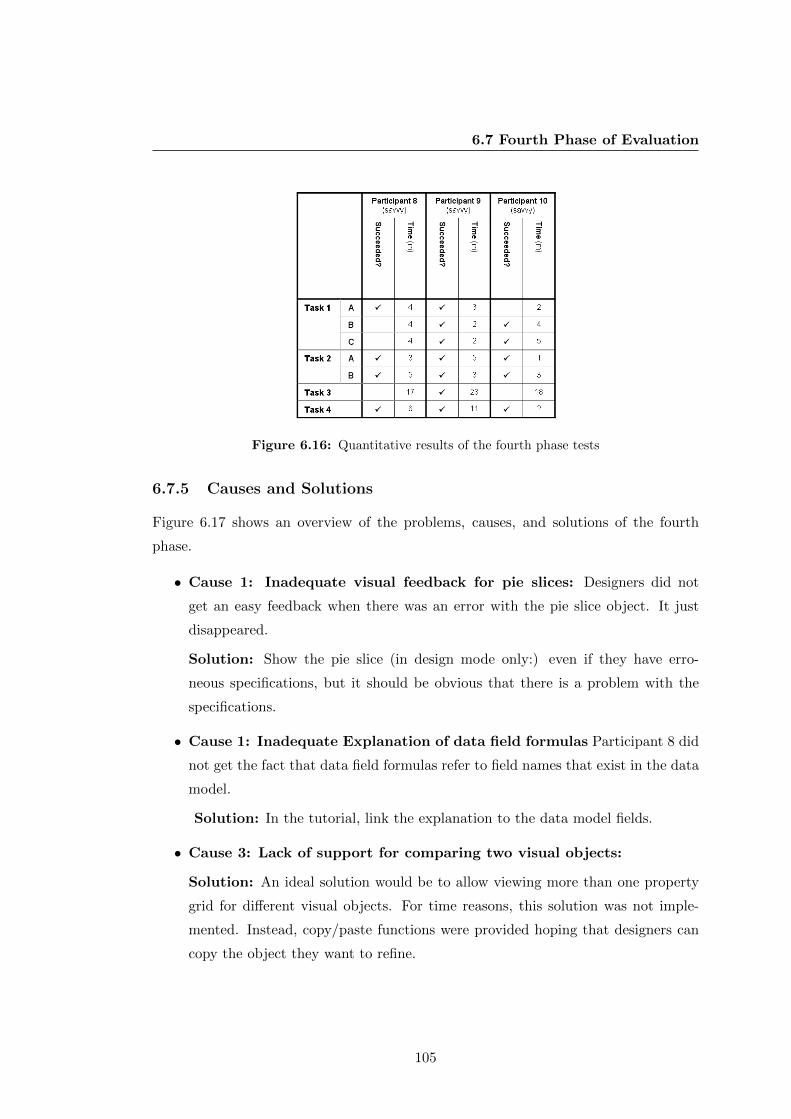
6.7 Fourth Phase of Evaluation
Figure 6.16: Quantitative results of the fourth phase tests
6.7.5 Causes and Solutions
Figure 6.17 shows an overview of the problems, causes, and solutions of the fourth
phase.
• Cause 1: Inadequate visual feedback for pie slices: Designers did not
get an easy feedback when there was an error with the pie slice object. It just
disappeared.
Solution: Show the pie slice (in design mode only:) even if they have erro-
neous specifications, but it should be obvious that there is a problem with the
specifications.
• Cause 1: Inadequate Explanation of data field formulas Participant 8 did
not get the fact that data field formulas refer to field names that exist in the data
model.
Solution: In the tutorial, link the explanation to the data model fields.
• Cause 3: Lack of support for comparing two visual objects:
Solution: An ideal solution would be to allow viewing more than one property
grid for different visual objects. For time reasons, this solution was not imple-
mented. Instead, copy/paste functions were provided hoping that designers can
copy the object they want to refine.
105
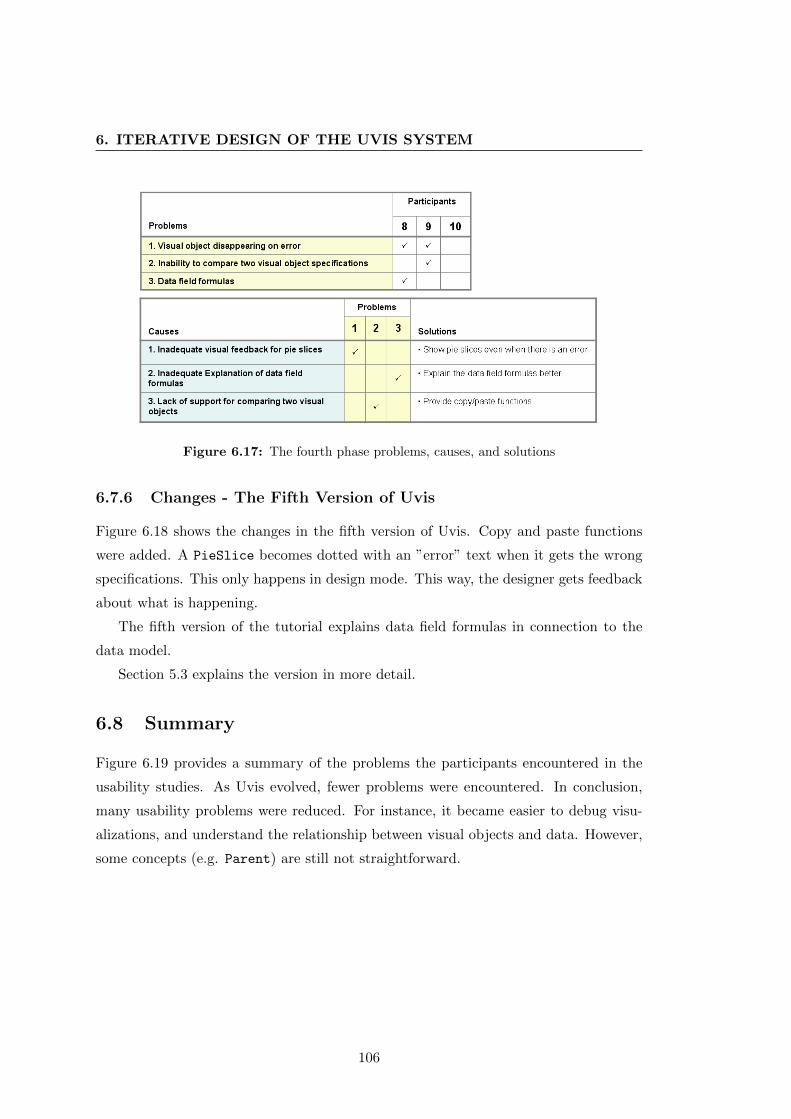
6. ITERATIVE DESIGN OF THE UVIS SYSTEM
Figure 6.17: The fourth phase problems, causes, and solutions
6.7.6 Changes - The Fifth Version of Uvis
Figure 6.18 shows the changes in the fifth version of Uvis. Copy and paste functions
were added. A PieSlice becomes dotted with an ”error” text when it gets the wrong
specifications. This only happens in design mode. This way, the designer gets feedback
about what is happening.
The fifth version of the tutorial explains data field formulas in connection to the
data model.
Section 5.3 explains the version in more detail.
6.8 Summary
Figure 6.19 provides a summary of the problems the participants encountered in the
usability studies. As Uvis evolved, fewer problems were encountered. In conclusion,
many usability problems were reduced. For instance, it became easier to debug visu-
alizations, and understand the relationship between visual objects and data. However,
some concepts (e.g. Parent) are still not straightforward.
106
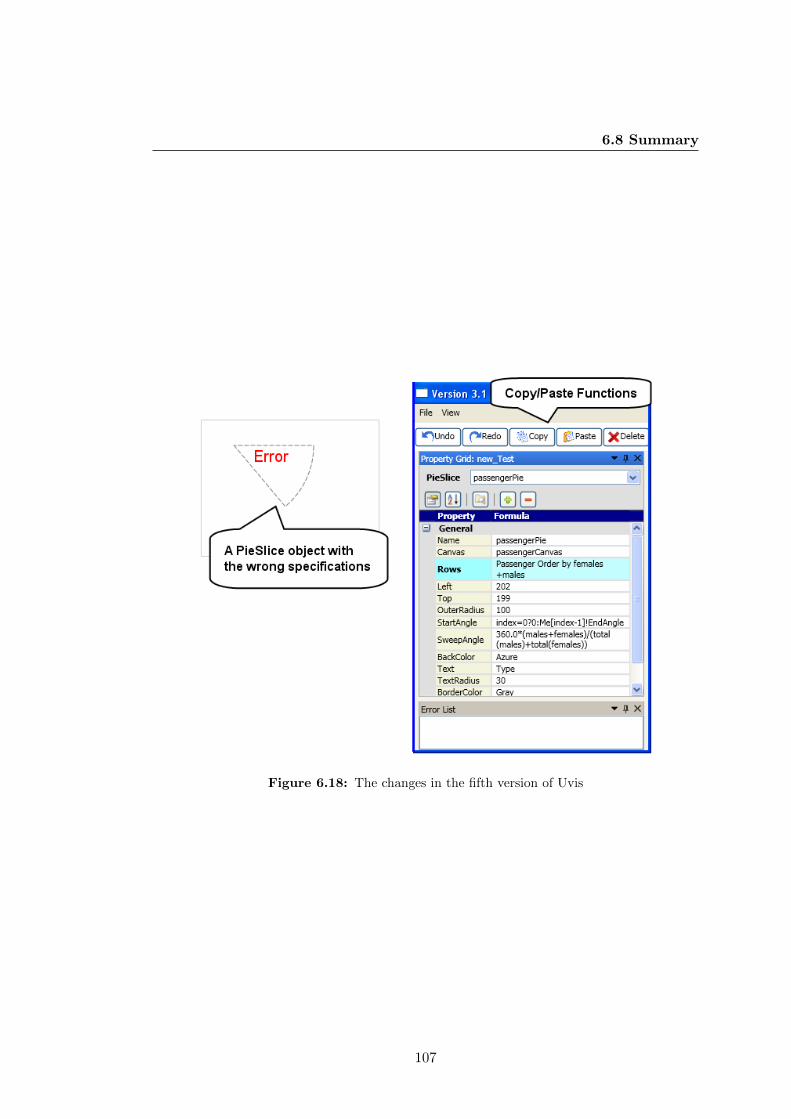
6.8 Summary
Figure 6.18: The changes in the fifth version of Uvis
107
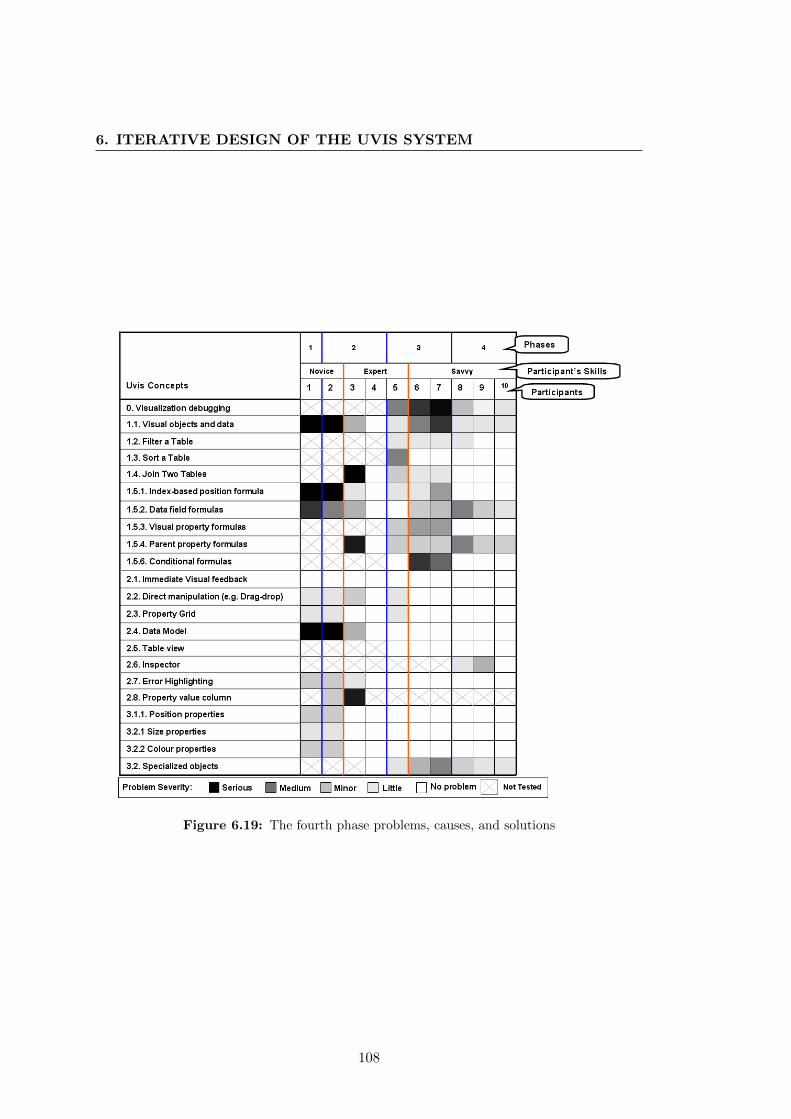
6. ITERATIVE DESIGN OF THE UVIS SYSTEM
Figure 6.19: The fourth phase problems, causes, and solutions
108
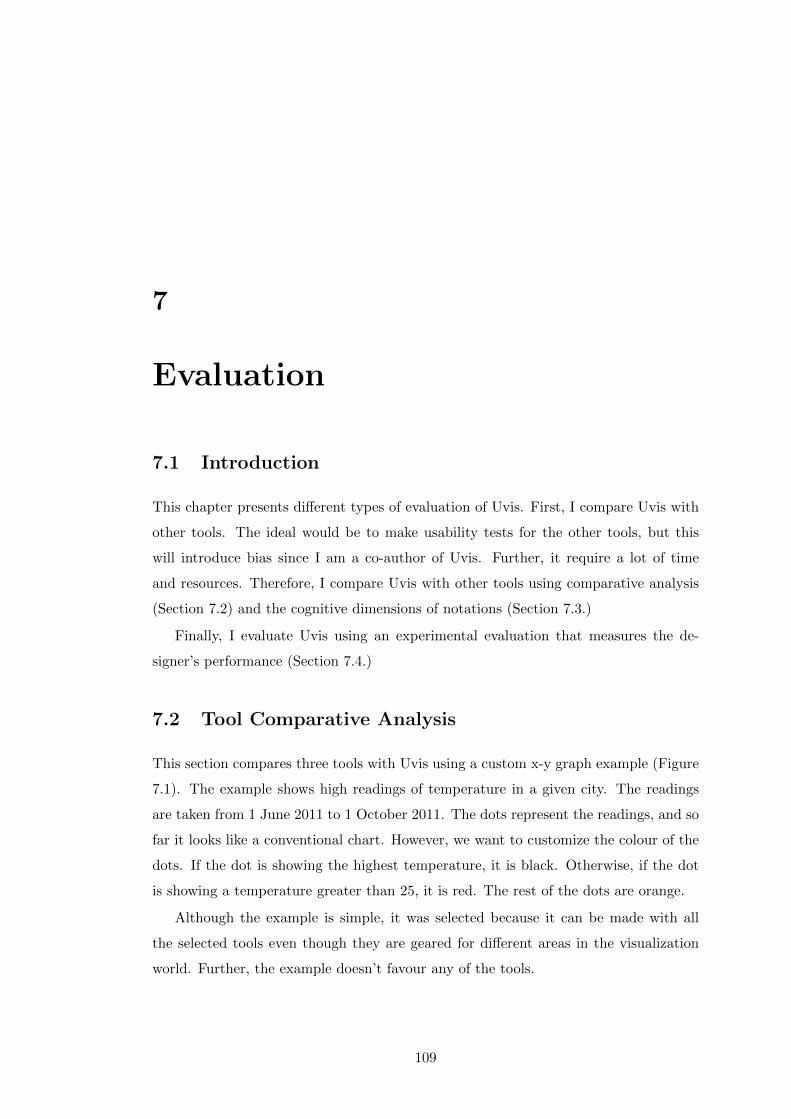
7
Evaluation
7.1 Introduction
This chapter presents different types of evaluation of Uvis. First, I compare Uvis with
other tools. The ideal would be to make usability tests for the other tools, but this
will introduce bias since I am a co-author of Uvis. Further, it require a lot of time
and resources. Therefore, I compare Uvis with other tools using comparative analysis
(Section 7.2) and the cognitive dimensions of notations (Section 7.3.)
Finally, I evaluate Uvis using an experimental evaluation that measures the de-
signer’s performance (Section 7.4.)
7.2 Tool Comparative Analysis
This section compares three tools with Uvis using a custom x-y graph example (Figure
7.1). The example shows high readings of temperature in a given city. The readings
are taken from 1 June 2011 to 1 October 2011. The dots represent the readings, and so
far it looks like a conventional chart. However, we want to customize the colour of the
dots. If the dot is showing the highest temperature, it is black. Otherwise, if the dot
is showing a temperature greater than 25, it is red. The rest of the dots are orange.
Although the example is simple, it was selected because it can be made with all
the selected tools even though they are geared for different areas in the visualization
world. Further, the example doesn’t favour any of the tools.
109
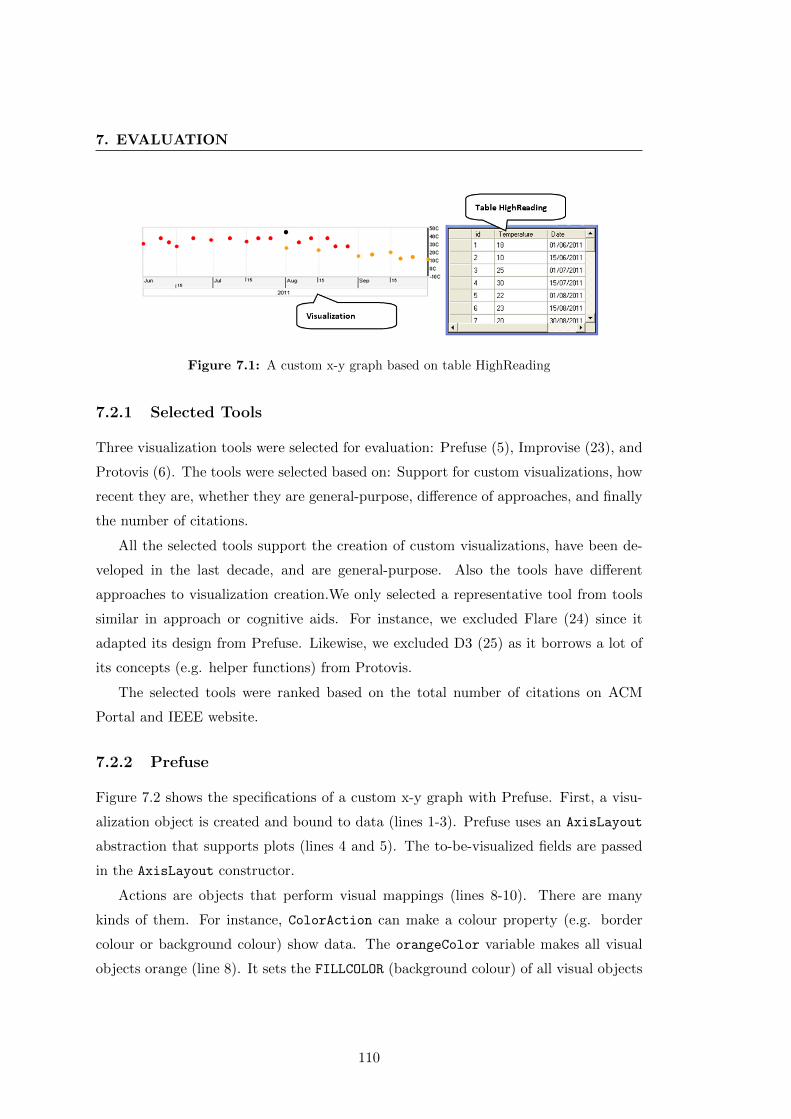
7. EVALUATION
Figure 7.1: A custom x-y graph based on table HighReading
7.2.1 Selected Tools
Three visualization tools were selected for evaluation: Prefuse (5), Improvise (23), and
Protovis (6). The tools were selected based on: Support for custom visualizations, how
recent they are, whether they are general-purpose, difference of approaches, and finally
the number of citations.
All the selected tools support the creation of custom visualizations, have been de-
veloped in the last decade, and are general-purpose. Also the tools have different
approaches to visualization creation.We only selected a representative tool from tools
similar in approach or cognitive aids. For instance, we excluded Flare (24) since it
adapted its design from Prefuse. Likewise, we excluded D3 (25) as it borrows a lot of
its concepts (e.g. helper functions) from Protovis.
The selected tools were ranked based on the total number of citations on ACM
Portal and IEEE website.
7.2.2 Prefuse
Figure 7.2 shows the specifications of a custom x-y graph with Prefuse. First, a visu-
alization object is created and bound to data (lines 1-3). Prefuse uses an AxisLayout
abstraction that supports plots (lines 4 and 5). The to-be-visualized fields are passed
in the AxisLayout constructor.
Actions are objects that perform visual mappings (lines 8-10). There are many
kinds of them. For instance, ColorAction can make a colour property (e.g. border
colour or background colour) show data. The orangeColor variable makes all visual
objects orange (line 8). It sets the FILLCOLOR (background colour) of all visual objects
110
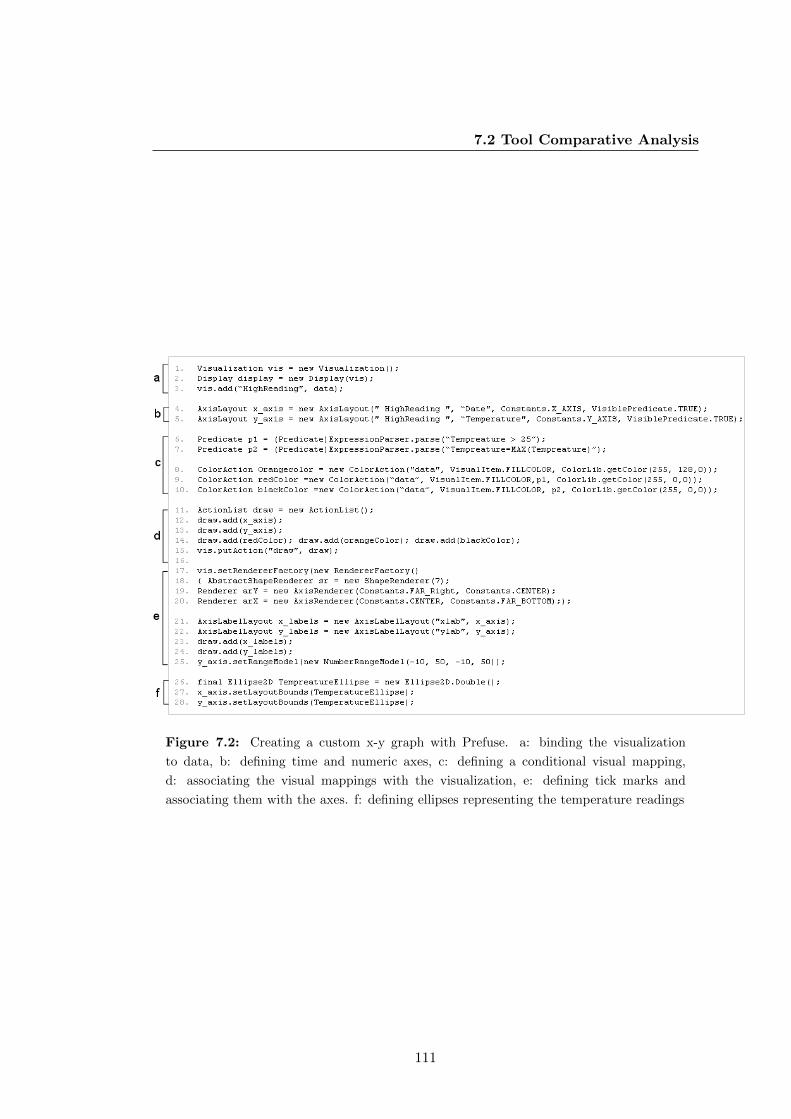
7.2 Tool Comparative Analysis
Figure 7.2: Creating a custom x-y graph with Prefuse. a: binding the visualization
to data, b: defining time and numeric axes, c: defining a conditional visual mapping,
d: associating the visual mappings with the visualization, e: defining tick marks and
associating them with the axes. f: defining ellipses representing the temperature readings
111

7. EVALUATION
to orange. However, the redColor variable makes objects that conform to a condition
red (line 9). The condition is specified by a predicate that checks if the temperature
fields are greater than 25. This predicate is specified at line 6. The actions are attached
with the visualization object (lines 11-15).
The axes are positioned using a RenderFactory class (lines 17-20), and tick marks
of the axes are generated using an AxisLabelLayout class (lines 21-24). The tick marks
are associated with their corresponding axes (line 25).
Finally, ellipses are chosen as visual objects to represent the temperature readings,
and associated with the axes defined previously (lines 26-28).
Conclusion: There are many abstractions that designers have to know and create
(e.g. AxisLayout, RenderFactory). The separation of actions from the visualizations,
predicates, and their properties can facilitate the management of code and allow reuse,
but reduces the understandability of the visual mappings. A designer might be won-
dering ”which visual object or property does this action relate to?”.
7.2.3 Protovis
Figure 7.3 shows the specifications of a custom x-y graph with Protovis. First, a
visualization object is defined (lines 1-4). Protovis uses non-visual scale classes for
creating time and numeric axes (lines 5-11). The designer uses them to generate tick
data. Rule and Label visual objects are used to draw the axes based on the tick data
(lines 12-18).
Dot objects are bound to data (an array that corresponds to the HighReading
table) (lines 19-21). The Left and Bottom properties position the Dot objects horizon-
tally and vertically (lines 22 and 23). The designer specified expressions for the two
properties that call functions provided by the scales that calculate the positions based
on temperature and date fields. Finally, a conditional expression for the FillStyle
(background colour property) sets the colour of dots that show the highest temperature
black. Otherwise, it sets the colour red for dots showing temperature greater than 25
red. Otherwise, they are orange (lines 24 and 25).
Development Environment (Protoviewer): The visualization can be built
with the Protoviewer development environment (Figure 7.4). This has several advan-
tages. Designers can see the resulting visualization immediately as they are modifying
112
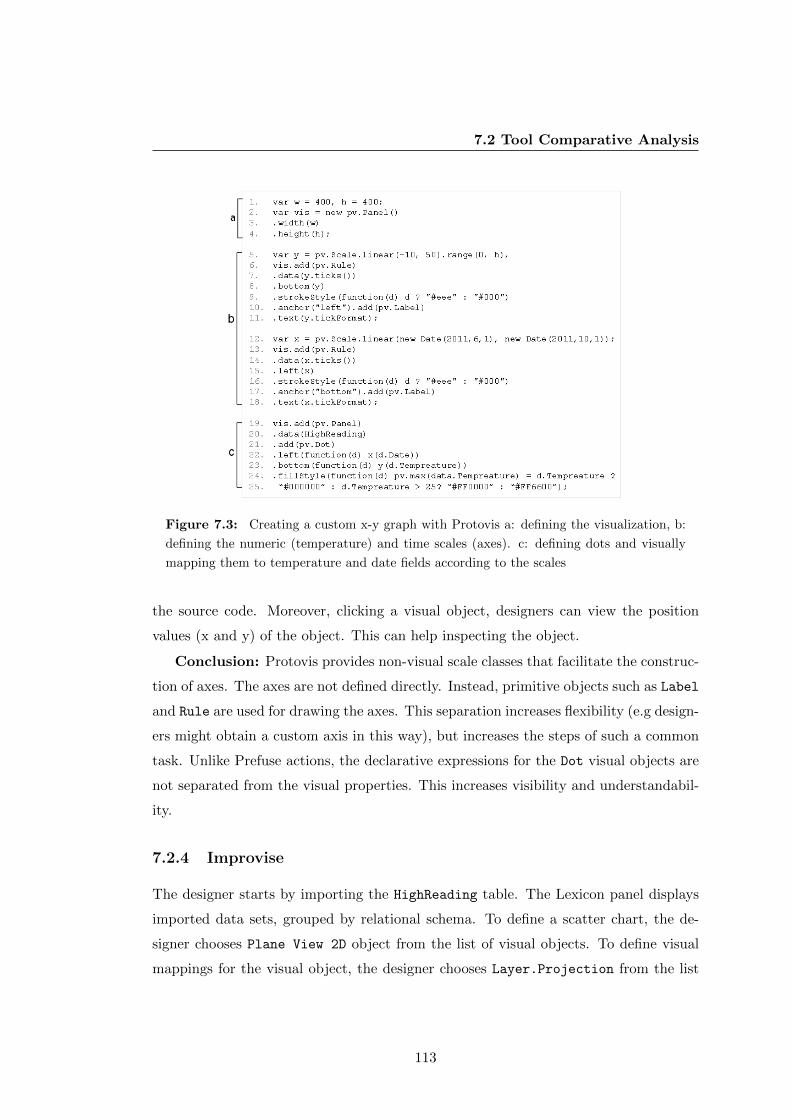
7.2 Tool Comparative Analysis
Figure 7.3: Creating a custom x-y graph with Protovis a: defining the visualization, b:
defining the numeric (temperature) and time scales (axes). c: defining dots and visually
mapping them to temperature and date fields according to the scales
the source code. Moreover, clicking a visual object, designers can view the position
values (x and y) of the object. This can help inspecting the object.
Conclusion: Protovis provides non-visual scale classes that facilitate the construc-
tion of axes. The axes are not defined directly. Instead, primitive objects such as Label
and Rule are used for drawing the axes. This separation increases flexibility (e.g design-
ers might obtain a custom axis in this way), but increases the steps of such a common
task. Unlike Prefuse actions, the declarative expressions for the Dot visual objects are
not separated from the visual properties. This increases visibility and understandabil-
ity.
7.2.4 Improvise
The designer starts by importing the HighReading table. The Lexicon panel displays
imported data sets, grouped by relational schema. To define a scatter chart, the de-
signer chooses Plane View 2D object from the list of visual objects. To define visual
mappings for the visual object, the designer chooses Layer.Projection from the list
113
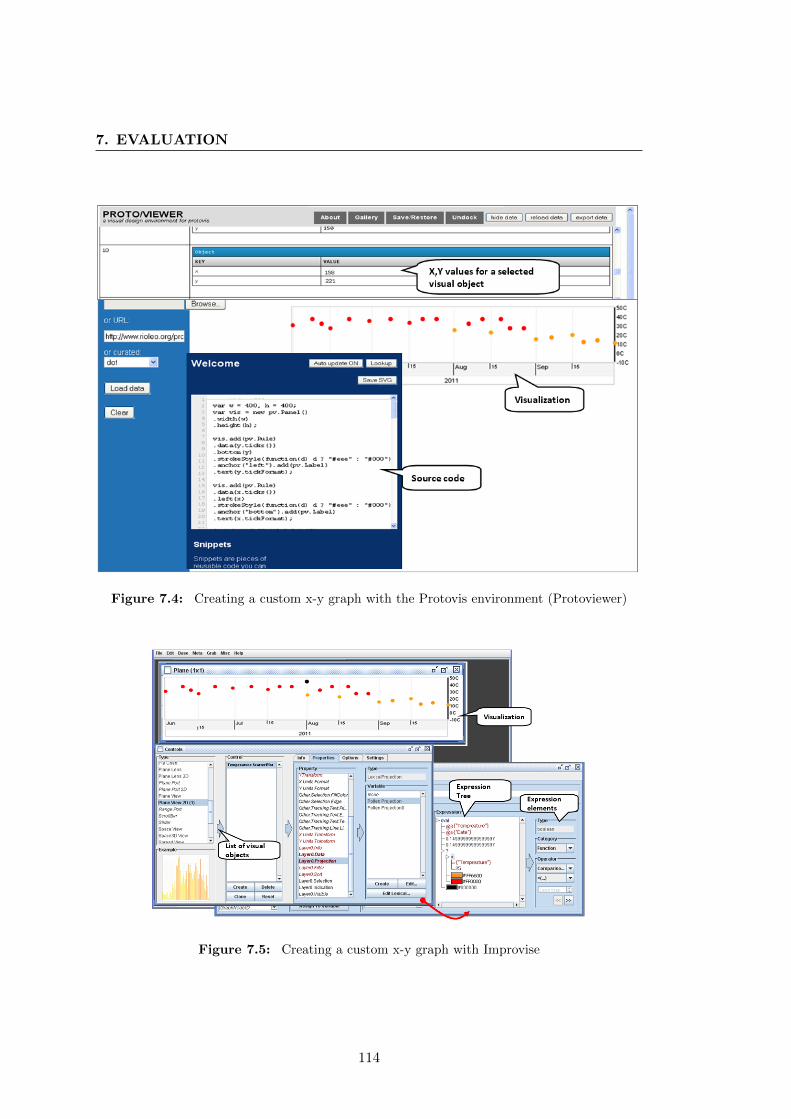
7. EVALUATION
Figure 7.4: Creating a custom x-y graph with the Protovis environment (Protoviewer)
Figure 7.5: Creating a custom x-y graph with Improvise
114

7.2 Tool Comparative Analysis
of properties. He clicks ”Create” to create a new projection (visual mapping). This
leads him to a new panel (Lexicon) where he can define expressions.
We want to define this expression for the background colour property.
Temperature > 25 ? "red": "orange"
This expression has to be built step-by-step using combo boxes that provide the
available Expression elements (Figure 7.5). First, the designer creates the conditional
part of the expression by choosing Function from the Category combo box, and Other
and ?(boolean,Color,Color). Improvise shows the result as a conditional expression
tree with default colours as results for the true and false expressions.
Second, the designer can manipulate the conditional statement parts by clicking the
tree nodes. To create a comparison condition, the designer chooses Function from the
Category combo box, and Comparison and >(...) from the Operator combo boxes.
Third, to make one of the nodes refer to the Temperature field, the designer clicks the
node and chooses Attribute from the Category combo-box. Improvise displays the
available fields, and the designer just selects (clicks) it.
Comments: In general, data transformations and visual mappings rely heavily on
dialogues. For instance, even a simple expression takes long to create. The environment
forces the designer to use combo-boxes that have the expression elements. It is not easy
to find the expression elements. Moreover, the longer the expression, the harder it is
to read.
7.2.5 Uvis
Figure 7.6 shows the textual specification of the custom x-y graph with Uvis and Figure
7.7 shows the environment where the chart was developed.
To create the time and numeric axes, the designer dragged HTimeScale and VNumericScale
visual objects from the toolbox and dropped them on a form. The designer moved and
resized them until they looked right. The environment sets position properties (i.e.
Top, Height, etc.) accordingly. To define the range of time and numbers the scales
show, the designer typed the value of the Range property in the property grid (lines 5
and 11 in Figure 7.6).
To create dots representing the temperature reading, the designer drags and drops
an Ellipse. The designer typed formulas for the position properties (Top and Left).
The formulas call position functions provided by the scales to calculate the positions
115
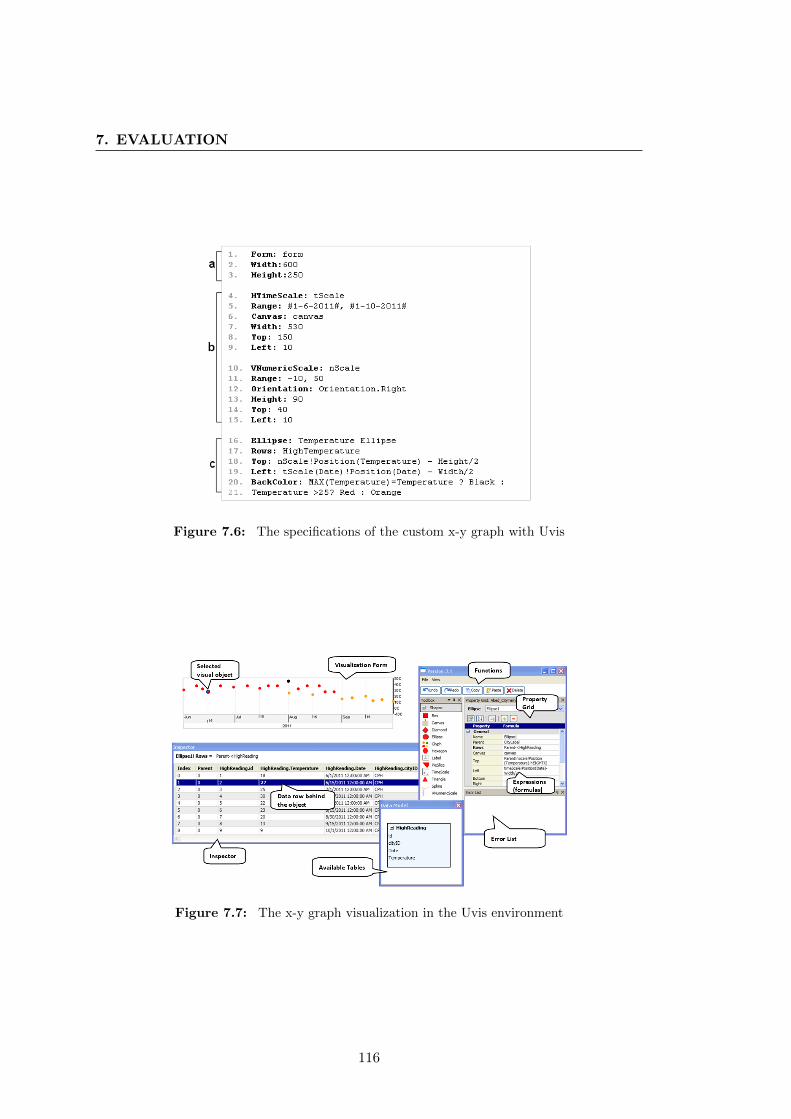
7. EVALUATION
Figure 7.6: The specifications of the custom x-y graph with Uvis
Figure 7.7: The x-y graph visualization in the Uvis environment
116
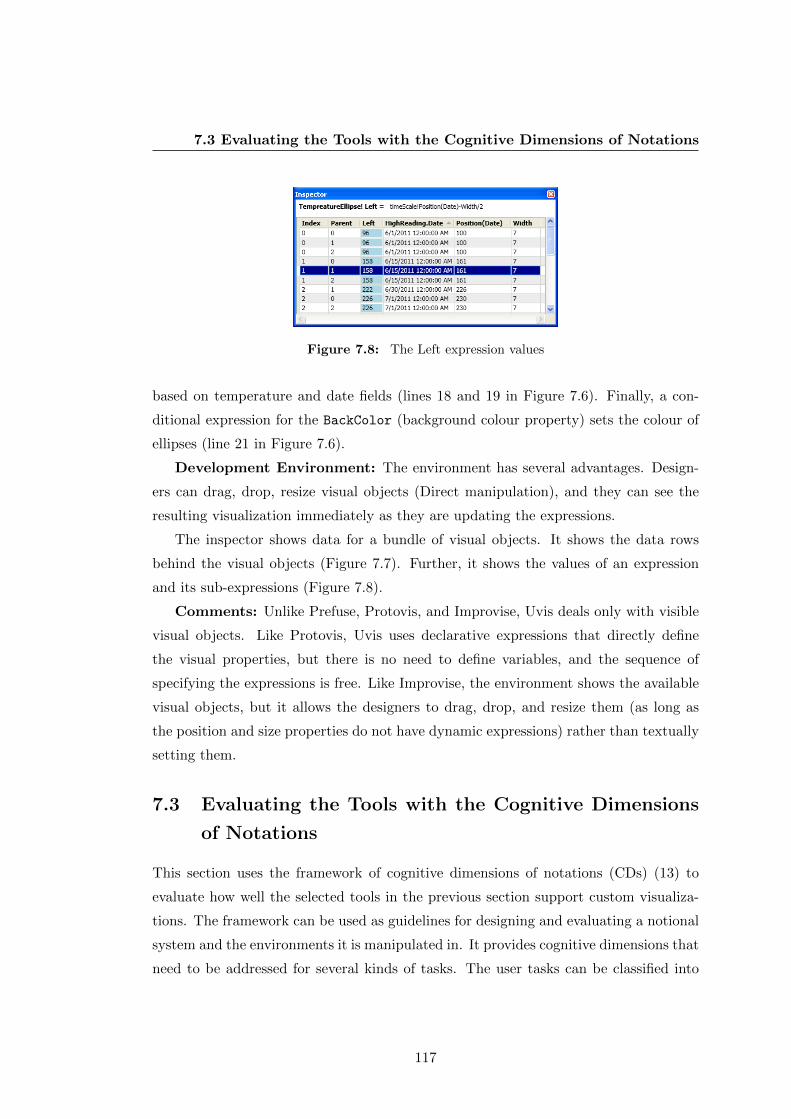
7.3 Evaluating the Tools with the Cognitive Dimensions of Notations
Figure 7.8: The Left expression values
based on temperature and date fields (lines 18 and 19 in Figure 7.6). Finally, a con-
ditional expression for the BackColor (background colour property) sets the colour of
ellipses (line 21 in Figure 7.6).
Development Environment: The environment has several advantages. Design-
ers can drag, drop, resize visual objects (Direct manipulation), and they can see the
resulting visualization immediately as they are updating the expressions.
The inspector shows data for a bundle of visual objects. It shows the data rows
behind the visual objects (Figure 7.7). Further, it shows the values of an expression
and its sub-expressions (Figure 7.8).
Comments: Unlike Prefuse, Protovis, and Improvise, Uvis deals only with visible
visual objects. Like Protovis, Uvis uses declarative expressions that directly define
the visual properties, but there is no need to define variables, and the sequence of
specifying the expressions is free. Like Improvise, the environment shows the available
visual objects, but it allows the designers to drag, drop, and resize them (as long as
the position and size properties do not have dynamic expressions) rather than textually
setting them.
7.3 Evaluating the Tools with the Cognitive Dimensions
of Notations
This section uses the framework of cognitive dimensions of notations (CDs) (13) to
evaluate how well the selected tools in the previous section support custom visualiza-
tions. The framework can be used as guidelines for designing and evaluating a notional
system and the environments it is manipulated in. It provides cognitive dimensions that
need to be addressed for several kinds of tasks. The user tasks can be classified into
117
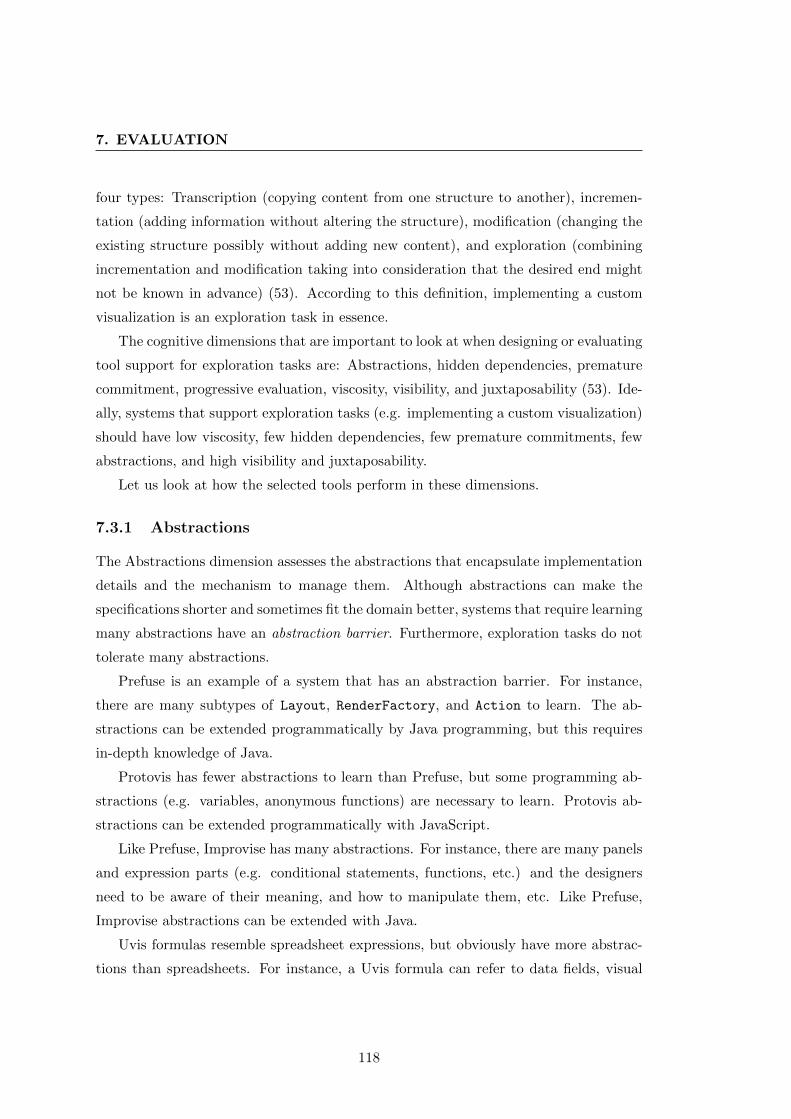
7. EVALUATION
four types: Transcription (copying content from one structure to another), incremen-
tation (adding information without altering the structure), modification (changing the
existing structure possibly without adding new content), and exploration (combining
incrementation and modification taking into consideration that the desired end might
not be known in advance) (53). According to this definition, implementing a custom
visualization is an exploration task in essence.
The cognitive dimensions that are important to look at when designing or evaluating
tool support for exploration tasks are: Abstractions, hidden dependencies, premature
commitment, progressive evaluation, viscosity, visibility, and juxtaposability (53). Ide-
ally, systems that support exploration tasks (e.g. implementing a custom visualization)
should have low viscosity, few hidden dependencies, few premature commitments, few
abstractions, and high visibility and juxtaposability.
Let us look at how the selected tools perform in these dimensions.
7.3.1 Abstractions
The Abstractions dimension assesses the abstractions that encapsulate implementation
details and the mechanism to manage them. Although abstractions can make the
specifications shorter and sometimes fit the domain better, systems that require learning
many abstractions have an abstraction barrier. Furthermore, exploration tasks do not
tolerate many abstractions.
Prefuse is an example of a system that has an abstraction barrier. For instance,
there are many subtypes of Layout, RenderFactory, and Action to learn. The ab-
stractions can be extended programmatically by Java programming, but this requires
in-depth knowledge of Java.
Protovis has fewer abstractions to learn than Prefuse, but some programming ab-
stractions (e.g. variables, anonymous functions) are necessary to learn. Protovis ab-
stractions can be extended programmatically with JavaScript.
Like Prefuse, Improvise has many abstractions. For instance, there are many panels
and expression parts (e.g. conditional statements, functions, etc.) and the designers
need to be aware of their meaning, and how to manipulate them, etc. Like Prefuse,
Improvise abstractions can be extended with Java.
Uvis formulas resemble spreadsheet expressions, but obviously have more abstrac-
tions than spreadsheets. For instance, a Uvis formula can refer to data fields, visual
118
7.3 Evaluating the Tools with the Cognitive Dimensions of Notations
properties, etc. However, Uvis has relatively few abstractions. For instance, there are
no variables and rendering objects. Uvis does not allow defining new abstractions.
7.3.2 Hidden Dependencies
The hidden dependencies dimension assesses whether dependencies between entities
are hidden or visible. Hidden dependencies slow down information finding and can
potentially increase the risk of error. Exploration tasks tolerate only a few hidden
dependencies.
Most Prefuse abstractions have hidden dependencies. For example, the layout action
implicitly overrides a specific visual mapping of size and position properties.
Protovis expressions can depend on variables. Such dependencies can be hard to
see in textual specifications. More advanced visualizations use layout classes that po-
sition visual items implicitly (e.g. tree maps), or some operators such as ”Parent” and
”Sibling” that have hidden dependencies.
In Improvise, it is hard to derive the elements of an expression, particularly, if the
expression contains variables or other sub-expressions. These can be viewed in other
panels.
Uvis formulas can depend on other visual properties. The properties can have
their own formulas, and so on. When designers change an expression, it is hard to
know the implications of such a change. Furthermore, more advanced visualizations
such as hierarchical visualizations use operators (e.g. Parent) that result in hidden
dependencies.
All the surveyed tools except for Uvis do not explicitly show which particular visual
property depends on which field. The Uvis environment shows that using the inspector
(Figure 7.8).
7.3.3 Premature Commitment
The premature commitment dimension assesses whether there are any constraints on
the order in which tasks must be accomplished. Premature commitment is harmful for
exploration tasks.
Since the specifications are program-like, Prefuse and Protovis impose constraints
on the sequence in which visualizations are defined. For instance, if a property depends
on another, the independent one has to be defined first.
119
7. EVALUATION
Improvise imposes a strict sequence on how some things are done. Constructing
the expression step-by-step is an example of strict sequencing, and having to navigate
from panel to panel to carry out visual mappings is another one.
Uvis specifications are sequence-free. At run time, the kernel finds out the sequence
of execution. If the designer types a formula that refers to a property that does not
exist yet, Uvis kernel flags an error, but the application still runs.
7.3.4 Progressive Evaluation
The progressive evaluation dimension assesses how easy it is to evaluate and obtain
feedback on an incomplete task. Progressive evaluation is important for exploration
tasks.
In Prefuse, it is not easy for a designer to obtain visual feedback of the specifications.
The source code has to be run in another setting to obtain feedback.
Improvise bridges that gap with an immediate visual feedback feature. However,
the visual feedback can be over-shadowed with many editing panels.
Protoviewer and the Uvis environment provide a separate design panel that is up-
dated immediately when the specifications are changed. The Uvis environment provides
similar kinds of feedback as traditional environments such as highlighting erroneous for-
mula parts, error, and warning lists. In addition, the environment shows the formula
values in a separate panel that is updated when the formula changes (Figure 7.8.)
7.3.5 Viscosity
The viscosity dimension assesses the cost of making small changes. It is costly to make
a small change in viscous systems. Viscosity is harmful for exploration tasks. We
consider two types of viscosity. First, repetitive viscosity means a single goal-related
change which requires many repetitive actions. Second, knock-on viscosity means a
change in one part affects other related parts.
Prefuse is based on an object oriented language (Java.) Hence, inheritance can
reduce repetitive viscosity. For instance, a change can be made in a parent class rather
than all inheriting classes. Modern development environments can help with small
knock-on changes such as changing a variable name that is used in many places (re-
factoring.) Nevertheless, changing Prefuse specifications requires in-depth knowledge
of the language constructs and programming concepts.
120
7.3 Evaluating the Tools with the Cognitive Dimensions of Notations
Like Prefuse, the Protovis language has low-repetitive viscosity since it supports
inheritance for visual objects. Moreover, Protovis allows other changes easily, for in-
stance, changing the visual object type. The environment (Protoviewer) does not have
support for making changes.
Designers who are experienced with Improvise might find some things easy to
change. For instance, variables that are referred to from many expressions can be
changed in one setting. Otherwise, Improvise is highly viscous. For instance, changing
some specialized visual object types (e.g. Plane View) is not possible. In general, a
change in Improvise requires navigating across panels.
Like spreadsheets, simple visualizations in Uvis have low viscosity. However, viscos-
ity grows with size. Uvis does not support inheritance, but designers can add properties
that have formulas that other visual objects can refer to. In such a case, a change is
only required in the designer property. Since Uvis formulas can refer to other formulas
elsewhere, a change in one formula might affect other dependant formulas. The Uvis
environment shows errors that result from such a change.
7.3.6 Visibility and Juxtaposability
The visibility dimension assesses the ability to view data components easily. Juxta-
posability assesses the ability to view two similar components side by side. The two
dimensions are generally discussed together due to similarity. Both dimensions are
important for exploration tasks.
What data components would a designer want to view when implementing a cus-
tom visualization? Many can be considered important. Examples include the currently-
designed visualization, the available visual objects and their properties, the visual map-
pings, the available data, the visualized data, and errors. What needs to be viewed
varies from task to task and designer to designer, but a possible solution is to give
designers the ability to show or hide components.
Even if Prefuse is integrated with a development environment, only a few compo-
nents can be visible in one setting. Traditional environments show the source code, the
available visual objects, and a list of errors in one setting. However, the designer has
to view the currently-designed visualization in another setting.
Protoviewer shows the currently-designed visualization as well as the specifications
behind it. Furthermore, designers can view the position property values of a single
121
7. EVALUATION
selected visual object at a time. Protoviewer does not provide support for comparing
the specifications of two similar visual objects.
Improvise shows the currently-designed visualization, but it can be over-shadowed
by the editing panels. A panel can only show one expression at a time, and it occupies
a lot of space. This does not allow comparing many expressions. Further, many data
crucial for the task (e.g. data fields) are buried in combo boxes.
Uvis shows the currently-designed visualization, the properties (and the expressions
defining them) of a selected visual object, and a list of errors. Upon selecting a visual
object, Uvis shows the data behind that particular object. Further, to allow compari-
son, the data from other visual objects from the same data source are shown as well.
It is also possible to see the defining expressions of all properties of a selected visual
object. However, it is not possible to see expressions of two visual objects at the same
time.
7.3.7 Summary
The findings of the comparative analysis and the evaluation with the cognitive dimen-
sions of notations can be summarized as follows:
• All the surveyed tools suffer from low juxtaposability and high hidden depen-
dencies with slightly different degrees.
• All the surveyed tools except for Uvis suffer from high premature commit-
ment and low visibility with slightly different degrees.
• Prefuse uses a programmatic approach that relies on specialized modules. The
main strength of this approach is the breadth of visualizations it can express
due to the many modules it provides. However, there are many abstractions to
learn even to construct a simple example like a custom x-y graph. Furthermore,
even with a development environment, the approach suffers from low progressive
feedback.
• Improvise uses an approach that is heavily dependant on dialogues (panels).
The main strength of this approach is that the tool provides useful visual objects
tailored for some tasks. However, the functionalities are not easy to find. For
instance, the conditional expression is buried in a combo box item called ”Other”.
122
7.4 Experimental Evaluation
• Protovis uses an approach that relies on primitive visual objects and declarative
expressions. The main strength of the approach is that the properties of the visual
objects are directly specified. No middle-ware objects (e.g. Prefuse actions) are
needed to link visual properties with expressions. However, some programming
abstractions (e.g. variables) are still needed to learn the language.
• Uvis uses an approach that relies on declarative spreadsheet-like formulas for
visual mappings, and a dedicated environment with many features (e.g. drag-
drop, visual feedback, etc.). The approach has high visibility, low premature
commitment, and relatively few abstractions to learn. However, the approach
still suffers from high viscosity (especially when it is a large-sized application).
To sum up, the findings favour notations that use declarative expressions since fewer
abstractions are needed to learn in comparison with programming. Furthermore, the
findings favour environments that allow exploration (low premature commitment) and
have high visibility rather than environments that are dialogue-dependant.
7.4 Experimental Evaluation
This sections reports on a preliminary evaluation study with six potential savvy design-
ers. Unlike the usability studies in chapter 6, this evaluation is not mainly concerned
with finding usability problems. Instead, it assesses to what extent designers can suc-
ceed on their own. The experimenter does not provide any help. Further, it provides
an overall evaluation of the tool, and assesses the impact of the inspector on ease of
learning.
7.4.1 Objective
• Evaluating the ease of learning.
• Evaluating the impact of the inspector on ease of learning.
• Identifying the Uvis concepts that are easy or difficult to learn.
123
7. EVALUATION
7.4.2 The Participant’s Background
All the participants were non-programmers. They had no prior knowledge of the Uvis
formulas, and had never used the Uvis environment. They have basic knowledge of
Excel formulas, algebra, trigonometry, and sequences, and know what a database table
is. Further, they know how to read simple visualizations (e.g. bar chart, pie chart,
etc.).
In addition to these common skills, some participants have more IT skills.
• Participant 1: A 28 year-old male who currently does voluntary work. He is
familiar with logical expressions (e.g. AND/OR). He came across the E-R model.
• Participant 2: A 22 year-old female biology student.
• Participant 3: A 22 year-old male student who is familiar with advanced Excel
formulas (e.g. IF, AND, etc.). He has created simple visualizations with the
standard tools.
• Participant 4: A 19 year-old male student.
• Participant 5: A 26 year-old male chef assistant. He came across the E-R
model. He has created standard and non-standard charts.
• Participant 6: A 27 year-old male loan manager. He came across the E-R
model.
7.4.3 Procedure
Each evaluation study lasted 2 hours on average. The studies were carried out in a lab.
The participants were divided into two groups so that we can evaluate the impact of
the inspector on ease of learning, but also evaluate the overall ease of learning of Uvis.
Participants 1, 2, and 3 belong to group A while participants 4, 5, and 6 belong to group
B. The distribution of the participants was done randomly. Each participant viewed
two screens. One screen showed a power-point based step-by-step tutorial available, and
the other showed the Uvis environment. The tutorials for both groups were identical
except that the group A tutorial explained about the inspector. Each participant was
asked to view the tutorial, and do what it says. The tutorial is divided into sections,
124

7.4 Experimental Evaluation
Figure 7.9: The evaluation tasks
at the end of which, designers were given a task to work on their own, but they could
go back to the tutorial and/or example solutions.
Quantitative measures: To evaluate ease of learning, I measured task completion
time (T) and the quality of the solution (Q). The quality of the solution was measured
by comparing the participant’s solution against the optimal solution and then rating it
on a scale 0-10.
Qualitative measures: To find out which concepts that are easy or hard to
understand, and collect other information related to Uvis, I observed the participants
while they used the tool, and asked them to fill the form in section 7.4.5
The detailed documentation can be found at (54).
7.4.4 Tasks
Figure 7.9 shows the tasks the designers carried out in the evaluation. They are the
same as the third version of tasks in chapter 6. The tasks are different in layout, and
125
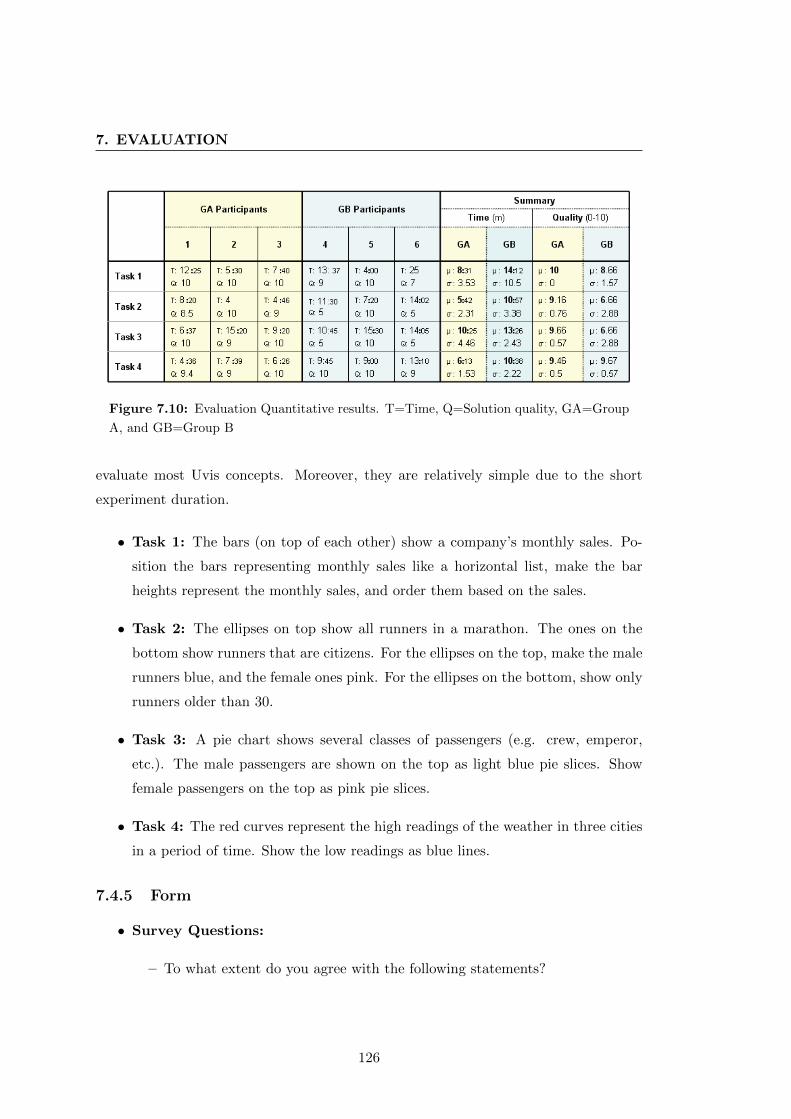
7. EVALUATION
Figure 7.10: Evaluation Quantitative results. T=Time, Q=Solution quality, GA=Group
A, and GB=Group B
evaluate most Uvis concepts. Moreover, they are relatively simple due to the short
experiment duration.
• Task 1: The bars (on top of each other) show a company’s monthly sales. Po-
sition the bars representing monthly sales like a horizontal list, make the bar
heights represent the monthly sales, and order them based on the sales.
• Task 2: The ellipses on top show all runners in a marathon. The ones on the
bottom show runners that are citizens. For the ellipses on the top, make the male
runners blue, and the female ones pink. For the ellipses on the bottom, show only
runners older than 30.
• Task 3: A pie chart shows several classes of passengers (e.g. crew, emperor,
etc.). The male passengers are shown on the top as light blue pie slices. Show
female passengers on the top as pink pie slices.
• Task 4: The red curves represent the high readings of the weather in three cities
in a period of time. Show the low readings as blue lines.
7.4.5 Form
• Survey Questions:
– To what extent do you agree with the following statements?
126

7.4 Experimental Evaluation
The answer should be: I strongly disagree, I disagree, I neither disagree nor
agree, I agree, or I strongly agree.
∗ I am confident that my visualizations produce the expected outcomes
described in the tasks
∗ The inspector was helpful.
∗ The tutorial was helpful.
∗ The formulas were easy to understand.
– How often did you use the inspector on average per task?
– What difficulties did you encounter during the study?
– Which parts of the formulas were difficult to understand for you?
– Which parts of the formulas were easy to understand for you?
– Do you have any suggestions for improvement?
• Understandability Questions:
– Describe the effect of the ”.” element in the Uvis formulas.
– Describe the effect of the ”!” element in the Uvis formulas.
– Describe the effect of the "-<" element in the Uvis formulas
– Describe the effect of the ”index” element in the Uvis formulas.
7.4.6 Results
Quantitative results: Figure 7.10 provides an overview of the quantitative results
of the evaluation. In all tasks, participants in group A completed their tasks in a
shorter time than participants in group B. Furthermore, participants in group A had
better solution quality than participants in group B except for task 4 where there is no
noticeable difference.
Qualitative results: The qualitative results can be summarized as follows:
• Formulas
– All participants can learn basic SQL-like formulas.
– All participants found basic mathematical formulas that refer to indexes
easy to understand.
127
7. EVALUATION
– All participants roughly explained what a join formula (-<) means.
– Half the participants correctly explained what a dot (.) operator means.
– Only participant 1 correctly explained what a bang (!) operator means.
– Participants had problems understanding formulas defining the SweepAngle
of a PieSlice. The formula was rather long and contained aggregate func-
tions.
• General observations
– In customizing a visualization, participants could draw analogies from ex-
isting parts, and build on new parts that are slightly different. This was
obvious in tasks 3 and 4.
– Participant 2 appreciated the fact that she viewed everything she needed
(e.g. data, properties, form, etc.) when working on the tasks.
– Most participants found it annoying that they could not compare the spec-
ifications of two visual objects side by side.
– All participants ignored the error list.
– All participants learned to use the data model.
– Participants in group A found the inspector helpful and said it made them
learn how to specify a visualization.
– When asked after the end of each task about how confident they are about
their solution, two participants in group A looked at the inspector first to
check the visual mappings and answered ”yes”. The participants in group B
were hesitant to say yes. Instead the answers were ”I guess so” and ”Maybe
so”.
– Participant 6 thought the data was hidden, and that’s why he could not
check that his solution was correct. He did not have the inspector.
128
8
Conclusion and Future Work
This dissertation presented Uvis, a visualization system that targets savvy designers.
With Uvis, designers drag and drop visual objects, set each visual object property with
a formula, and see the result immediately.
The formulas are declarative and similar to spreadsheet formulas. The formulas
compute the property values and can refer to fields, visual properties, functions, etc.
Cognitive aids assist designers while implementing a visualization. For instance,
designers can check the correctness of their visualizations using the inspector.
Uvis produces visualizations that perform sufficiently.
Uvis formulas can express a collection of custom visualizations that are made of
primitive and specialized visual objects.
In theory, Uvis is more accessible to savvy designers than existing visualization
tools. A preliminary evaluation shows that savvy designers can learn the basics of
Uvis.
8.1 Contributions
The thesis hypothesizes: It is possible to express custom visualizations with Uvis spreadsheet-
like formulas, and savvy designers can learn how to refine the custom visualizations.
Substantiation of this hypothesis consists of the following contributions:
• The expressive power of formulas is substantiated with a collection of custom
visualizations. The visualizations have various characteristics. For instance, some
have a radial layout and others have a linear out. Using Uvis formulas, variations
129
8. CONCLUSION AND FUTURE WORK
of life lines (3), spiral graphs (1), horizon Graphs (40), circle views (39), tile maps
(55), tree maps (56), indented trees, line charts, pie charts, and bar charts have
been made.
Since Uvis formulas follow the spreadsheet paradigm, some interactive visualiza-
tions can be implemented with no or little event handling.
• To ensure that savvy designers can learn the Uvis approach, Uvis was iteratively
designed based on feedback from savvy designers. This resulted in novel cognitive
aids. As an example, upon specifying the Rows formula, Uvis automatically sets
the Top and Left formulas. The visual objects cascade, and designers can see that
multiple visual objects were created. As another example, the inspector shows the
data behind the visual objects, and the sub-expression values. Usability studies
show that these aids reduced usability problems.
• To compare the usability of Uvis with other tools, Uvis was compared with three
other visualization tools using an example and using the cognitive dimensions of
notations. The result favours Uvis as a tool for custom visualizations.
• To evaluate designer’s performance with Uvis, a preliminary experiment was car-
ried out with six savvy designers. The result is that they can learn the basic
concepts of Uvis, and modify custom visualizations. Further, the inspector im-
proved their performance.
8.2 Future Work
• Port to other platforms: Uvis currently supports desktop applications. The
web is much more prevalent. We need Uvis to run on the web. However, this
introduces challenges. Uvis applications need to integrate seamlessly with several
web technologies: CSS for styling, JavaScript for data binding and interaction,
HTML for web content, and so on.
Porting to mobile platforms is also a must for the future.
• Connect to other database systems: At present we have only tested Uvis
with MS-Access databases. We use .NETs ADO to access the database and in
130
8.2 Future Work
principle it should work with other databases too, but we expect surprises. For
instance, there are variations of SQL syntaxes depending on the database system.
• Support non-tabular data: Some data are not relational, for instance XML
data, trees, graphs. We need formulas that can make these data sources look like
relational tables.
• More interactive visualizations: We need to support more common interac-
tion mechanisms such as fish-eye lenses, linking and brushing technique, semantic
zooming, etc. We need to investigate the best way to support that, a visual object
that hides implementation details and reduces customizability, traditional event
handling, or somewhere in between?
Furthermore, we need to support event handlers for keyboard, mouse and ges-
tures. At present uVis handles only simple events such as Click.
• Run pilot projects: We need to run pilot projects with industry, for instance,
with health-record vendors, software houses and hospitals. This will help us
collect information about the kinds of problems savvy designers encounter in
daily production.
• Evaluate More: The current evaluation relied mainly on modification tasks.
Asking designers to create visualizations from scratch introduces new challenges.
For instance, designers need to remember formulas, and they don’t have existing
components to compare with. This will help us identify more weaknesses and
strengths of the Uvis approach.
We also need to evaluate to what extent savvy designers can implement or refine
interactive visualizations.
• Investigate cognitive aids: Some cognitive aids might improve ease of learning
at the expense of task efficiency. Further, the usefulness of cognitive aids vary
from designer to designer. These issues have to be investigated.
The fourth phase of iterative design as well as the evaluation resulted in designers
needing more cognitive aids. For instance, some designers needed to compare the
specifications of two visual objects side by side. We need to investigate whether
this aid is necessary, and whether more aids are needed.
131

8. CONCLUSION AND FUTURE WORK
132
References
[1] Marc Weber, Marc Alexa, and Wolfgang Muller. Visualizing Time-Series
on Spirals. In INFOVIS, pages 7–14, 2001. x, 38, 40, 50, 130
[2] From Poverty To Power. URL: http://www.oxfamblogs.org/fp2p/?p=250, 2012. Ac-
cessed October, 2012. x, 60
[3] Catherine Plaisant, Brett Milash, Anne Rose, Seth Widoff, and Ben Shnei-
derman. LifeLines: Visualizing Personal Histories. In CHI, pages 221–227, 1996.
1, 15, 35, 130
[4] Spotfire. URL: http://spotfire.tibco.com/, 2012. Accessed July, 2012. 2, 14
[5] Jeffrey Heer, Stuart K. Card, and James A. Landay. prefuse: a toolkit for
interactive information visualization. In CHI, pages 421–430, 2005. 2, 15, 110
[6] Michael Bostock and Jeffrey Heer. Protovis: A Graphical Toolkit for Visu-
alization. IEEE Trans. Vis. Comput. Graph., 15(6):1121–1128, 2009. 2, 15, 110
[7] Donald A. Norman. User Centered System Design: New Perspectives on Human-
computer Interaction. CRC Press, 1986. 2
[8] GDI+. URL: http://msdn.microsoft.com/en-us/library/windows/desktop/ms533798(v=vs.85).aspx,
2012. Accessed August, 2012. 3, 20, 37
[9] Java2D. URL: http://www.oracle.com/technetwork/java/index.html, 2012. Accessed
September, 2012. 3, 20
[10] MS Visual Studio. URL: http://www.microsoft.com/visualstudio/eng/launch-day/,
2012. Accessed July, 2012. 3, 20
[11] Brad Myers, Scott E. Hudson, and Randy Pausch. Past, present, and future of
user interface software tools. ACM Trans. Comput.-Hum. Interact., 7(1):3–28, March
2000. 3, 62
[12] Soren Lauesen. Requirements specification for VisTool - a development tool
for complex data visualization. IT University of Copenhagen, October 2009. 3
133
REFERENCES
[13] T. R. G. Green. Cognitive dimensions of notations. In Proceedings of the fifth con-
ference of the British Computer Society, Human-Computer Interaction Specialist Group on
People and computers V, pages 443–460, New York, NY, USA, 1989. Cambridge University
Press. 12, 117
[14] Ed H. Chi. Expressiveness of the data flow and data state models in visualiza-
tion systems. In Proceedings of the Working Conference on Advanced Visual Interfaces,
AVI ’02, pages 375–378, New York, NY, USA, 2002. ACM. 13
[15] Stuart K. Card, Jock D. Mackinlay, and Ben Shneiderman. Readings in infor-
mation visualization - using vision to think. Academic Press, 1999. 13
[16] Andrew Sears and Julie A. Jacko. The Human-Computer Interaction Handbook:
Fundamentals, Evolving Technologies and Emerging Applications. CRC Press, 2007. 13
[17] Google Spreadsheets. URL: http://www.google.com/google-d-s/spreadsheets/, 2012.
Accessed September, 2012. 14
[18] Fernanda B. Viegas, Martin Wattenberg, Frank van Ham, Jesse Kriss, and
Matt McKeon. ManyEyes: a Site for Visualization at Internet Scale. IEEE
Transactions on Visualization and Computer Graphics, 13(6):1121–1128, November 2007.
14
[19] Tableau. URL: http://www.tableausoftware.com/, 2012. Accessed July, 2012. 14
[20] Omniscope. URL: http://www.visokio.com/omniscope, 2012. Accessed October, 2012.
14
[21] Chris Stolte, Diane Tang, and Pat Hanrahan. Polaris: a system for query,
analysis, and visualization of multidimensional databases. Commun. ACM,
51(11):75–84, 2008. 15
[22] Jean-Daniel Fekete. The InfoVis Toolkit. In INFOVIS, pages 167–174, 2004. 15
[23] Chris Weaver. Building Highly-Coordinated Visualizations in Improvise. In
INFOVIS, pages 159–166, 2004. 15, 110
[24] Flare - Data Visualization for the Web. URL: http://flare.prefuse.org/, 2009. Ac-
cessed September, 2012. 15, 110
[25] Michael Bostock, Vadim Ogievetsky, and Jeffrey Heer. D3 Data-Driven Doc-
uments. IEEE Trans. Vis. Comput. Graph., 17(12):2301–2309, 2011. 15, 110
[26] Ryo Akasaka. Protoviewer: a web-based visual design environment for Pro-
tovis. In ACM SIGGRAPH 2011 Posters, SIGGRAPH ’11, pages 85:1–85:1, New York,
NY, USA, 2011. ACM. 19
134
REFERENCES
[27] Processing. URL: http://processing.org/, 2012. Accessed October, 2012. 20
[28] NetBeans. URL: http://netbeans.org/, 2012. Accessed June, 2012. 20
[29] Eclipse. URL: http://www.eclipse.org/, 2012. Accessed June, 2012. 20
[30] Kostas Pantazos and Søren Lauesen. Constructing Visualizations with InfoVis
Tools - An Evaluation from a user Perspective. In GRAPP/IVAPP, pages 731–736,
2012. 21
[31] William S. Cleveland. The Elements of Graphing Data. Hobart Press, 1994. 25
[32] Performance Details. URL: https://www.dropbox.com/sh/rw73hzc9n2xcf8y/ZxvTJ5hEWk,
2012. Accessed September, 2012. 35
[33] Soren Lauesen, Mohammad A. Kuhail, Kostas Pandazos, Shangjin Xu, and
Mads B. Andersen. A drag-drop-formula tool for custom visualization. 2013.
41, 53
[34] Mohammad A. Kuhail and Søren Lauesen. Customizable Visualizations with
Formula-linked Building Blocks. In GRAPP/IVAPP, pages 768–771, 2012. 41
[35] Mohammad A. Kuhail, Kostas Pandazo, and Søren Lauesen. Customizable
Time-Oriented Visualizations. In ISVC (2), pages 668–677, 2012. 41
[36] Stephen Few. Solution to the over plotting problem. 2008. 53
[37] Mohammad A. Kuhail, Kostas Pantazos, and Søren Lauesen. The Inspector:
A Cognitive Artefact for Visual Mappings. 2013. 53
[38] Mohammad A. Kuhail, Søren Lauesen, Kostas Pantazos, and XU Shangjin.
Usability Analysis of Custom Visualization Tools. 2012. 53
[39] Daniel A. Keim, Jorn Schneidewind, and Mike Sips. CircleView: a new ap-
proach for visualizing time-related multidimensional data sets. In Proceedings of
the working conference on Advanced visual interfaces, AVI ’04, pages 179–182, New York,
NY, USA, 2004. ACM. 53, 130
[40] Stephen Few. URL: http://www.perceptualedge.com/articles/visual business intelligence/time on the horizon.pdf,
2012. Accessed August, 2012. 53, 130
[41] Uvis Reference Card. URL: http://www.itu.dk/people/slauesen/S-
EHR/uVisCard.ppt, 2012. Accessed October, 2012. 56
[42] Kostas Pantazos. Custom Data Visualization Without Real Programming. IT
University of Copenhagen, October 2013. 58
135
REFERENCES
[43] Larry L. Constantine and Lucy A. D. Lockwood. Software for use: a practical
guide to the models and methods of usage-centered design. ACM Press/Addison-Wesley
Publishing Co., New York, NY, USA, 1999. 64
[44] Lars Grammel, Melanie Tory, and Margaret-Anne D. Storey. Erratum to
”How Information Visualization Novices Construct Visualizations”. IEEE Trans.
Vis. Comput. Graph., 17(2):260, 2011. 64, 66
[45] Jeffrey Heer, Frank van Ham, Sheelagh Carpendale, Chris Weaver, and Pe-
tra Isenberg. Creation and Collaboration: Engaging New Audiences for Infor-
mation Visualization. In Andreas Kerren, John Stasko, Jean-Daniel Fekete,
and Chris North, editors, Information Visualization, 4950 of Lecture Notes in Com-
puter Science, pages 92–133. Springer Berlin / Heidelberg, 2008. 66
[46] Daniel Conrad Halbert. Programming by example. PhD thesis, 1984. AAI8512843.
74
[47] KF Bury. The iterative development of usable computer interfaces. pages 743–
748, 1984. 75
[48] William Buxton and Richard Sniderman. Iteration in the design of the human-
computer interface. pages 72–81, 1980. 75
[49] JOHN D. GOULD and CLAYTON LEWIS. C.H. Designing for usability: Key
principles and what designers think. pages 300–311, 1985. 75
[50] Soren Lauesen. User Interface Design: A Software Engineering Perspective. Addison-
Wesley, 2005. 75
[51] Ed Huai hsin Chi. A Taxonomy of Visualization Techniques Using the Data
State Reference Model. In INFOVIS, pages 69–75, 2000. 76
[52] Usability Studies. URL: https://www.dropbox.com/sh/5mbll18m20me0xs/cgFbWnQs-
H, 2012. Accessed September, 2012. 86, 137
[53] Thomas Green and Alan Blackwell. Cognitive Dimensions of Information
Artefacts: a tutorial. T.R.G. Green and A.F. Blackwell, 1(2), 1998. 118
[54] Evaluation Studies. URL: https://www.dropbox.com/sh/8knw16605ggmnrv/VoEwahs7aH,
2012. Accessed September, 2012. 125, 137
[55] Wolfgang Aigner, Silvia Miksch, Heidrun Schumann, and Christian Tominski.
Visualization of Time-Oriented Data. Human-Computer Interaction Series. Springer, 2011.
130
[56] Ben Shneiderman. URL: http://www.cs.umd.edu/hcil/treemap-history/, 2012. Ac-
cessed August, 2012. 130
136
Appendix A
Usability Study Documentation
The appendix gives examples of hand-written documentation used for the usability
study. For full and computerized documentation, refer to (52). For documentation of
the evaluation study, refer to (54).
137

A. USABILITY STUDY DOCUMENTATION
A.1 The Usability Log of Participant 1
Figure A.1: A snapshot of the usability log of participant 1
138
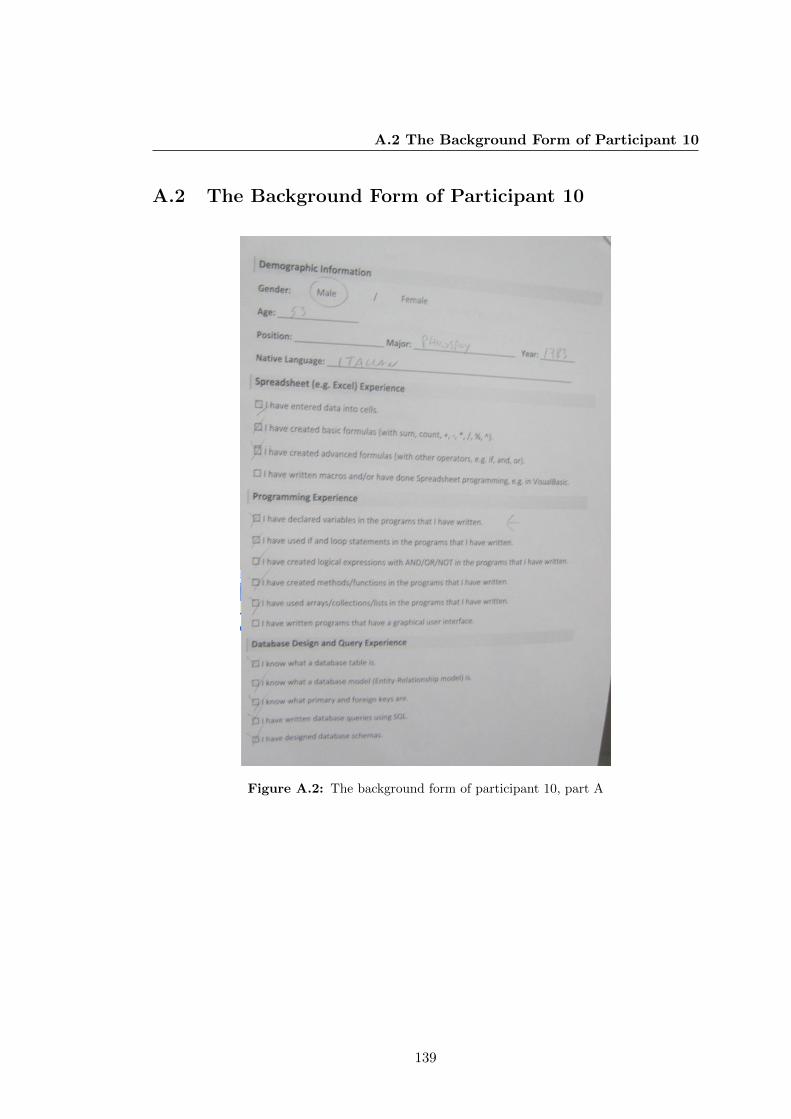
A.2 The Background Form of Participant 10
A.2 The Background Form of Participant 10
Figure A.2: The background form of participant 10, part A
139
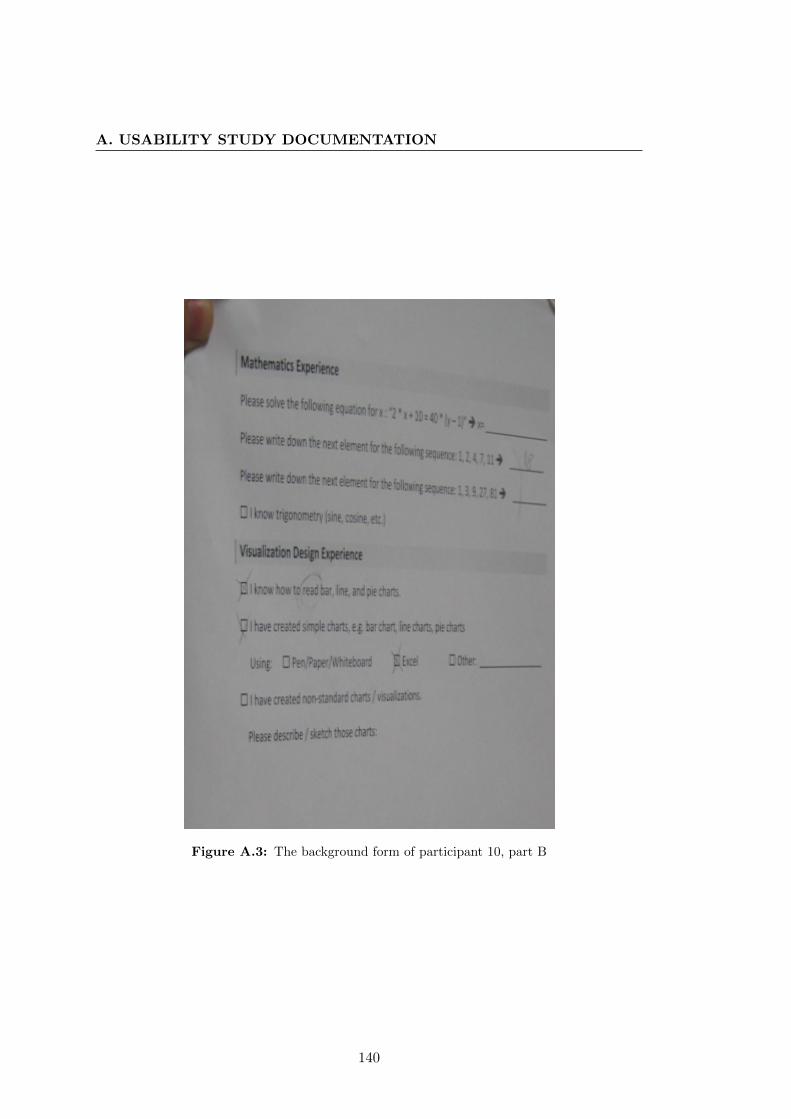
A. USABILITY STUDY DOCUMENTATION
Figure A.3: The background form of participant 10, part B
140
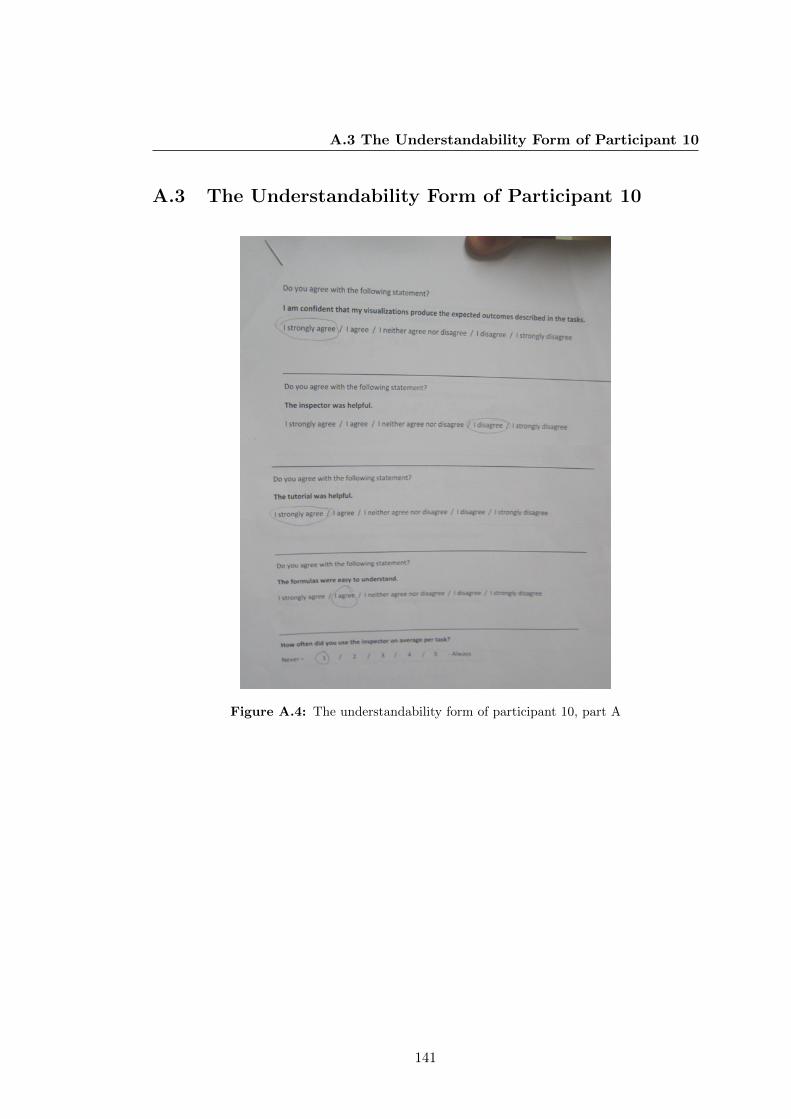
A.3 The Understandability Form of Participant 10
A.3 The Understandability Form of Participant 10
Figure A.4: The understandability form of participant 10, part A
141
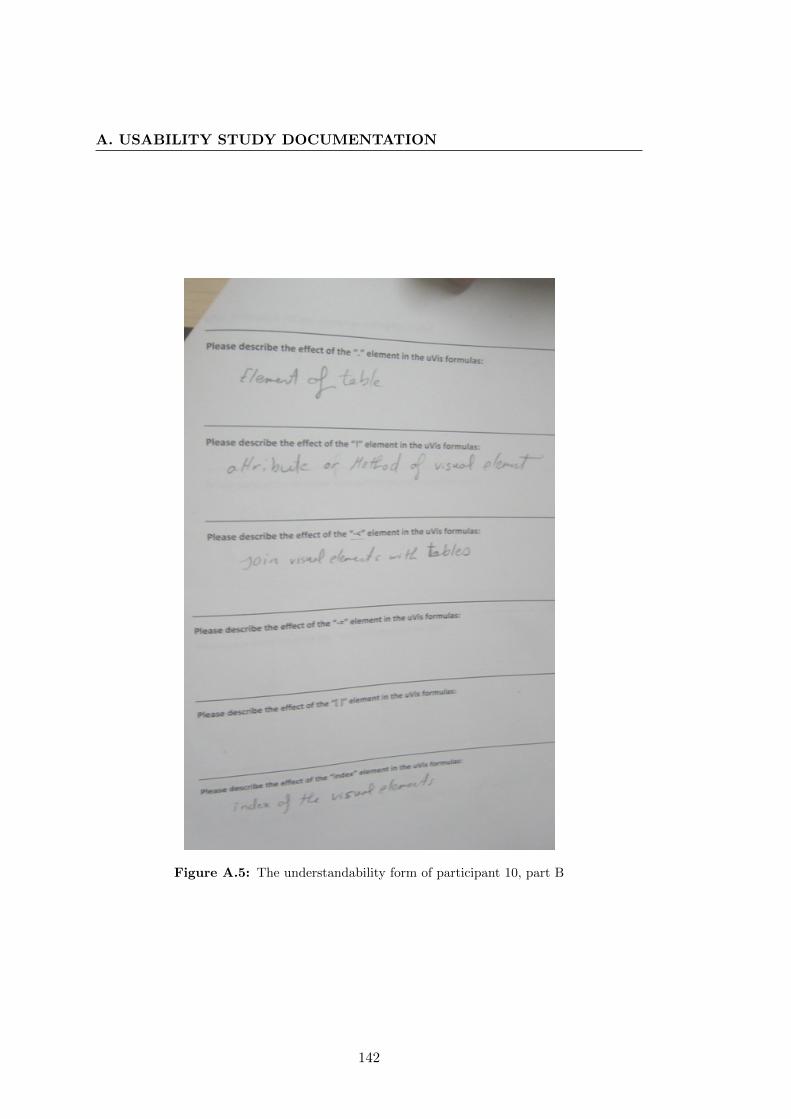
A. USABILITY STUDY DOCUMENTATION
Figure A.5: The understandability form of participant 10, part B
142
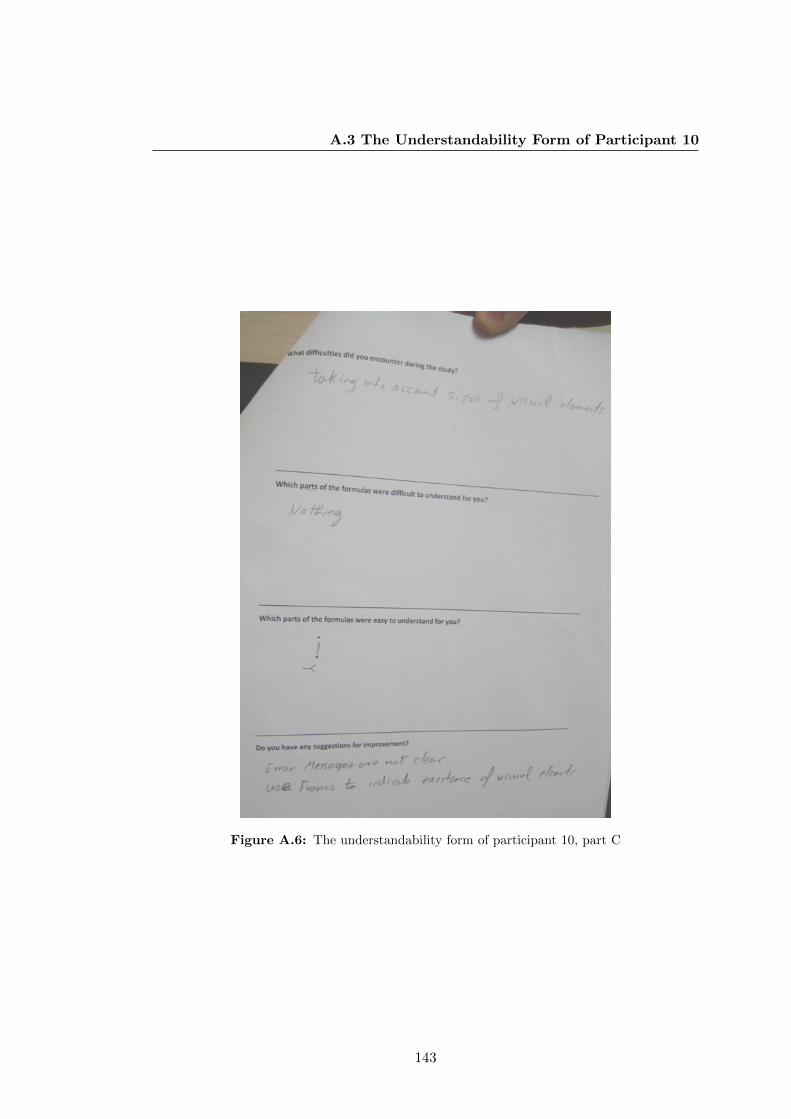
A.3 The Understandability Form of Participant 10
Figure A.6: The understandability form of participant 10, part C
143
![Augmenting Static Visualizations with PapARVis Designer · mar [18], leveraging its simplicity and expressiveness to spec-ify 2D visualizations.PapARVis Designer enables designers](https://img.pdfslide.net/doc/110x75/5f282968de10112bf8053bb5/augmenting-static-visualizations-with-paparvis-designer-mar-18-leveraging-its.jpg)