Embed Size (px)
Citation preview

Customer Discrimination: Evidence from Israel
by
Revital Bar and Asaf Zussman
Discussion Paper No. 16.04
November 2016
9190501הצופים, ירושלים בנין פרץ נפתלי, קמפוס האוניברסיטה העברית, הר
The Hebrew University Campus, MT. Scopus, 91905 Jerusalem, Israel
www.falk.huji.ac.il

Customer Discrimination: Evidence from Israel*
By
Revital Bar and Asaf Zussman†
Department of Economics, The Hebrew University of Jerusalem
Abstract
This paper studies customer discrimination against Arab workers in the Israeli market for
labor-intensive services. Relying on surveys, field data and a natural experiment, we
provide evidence consistent with Becker’s customer discrimination model. First, a
significant share of Jewish customers prefers to receive labor-intensive services from
firms employing Jewish rather than Arab workers; these preferences are most strongly
linked to concerns for personal safety. Second, customer preferences affect firms’ hiring
decisions. Third, firms employing Arab workers charge significantly lower service prices
than those employing only Jewish workers.
JEL Code: J71
Keywords: customer discrimination, labor market, Israel
The Maurice Falk Institute for Economic Research in Israel Ltd.
Jerusalem, November 2016 Discussion Paper No. 16.04
* For valuable comments and suggestions, we thank the editor, Paul Oyer, three anonymous
reviewers, Joseph Altonji, David Neumark and participants of presentations at the Bank of Israel,
Ben Gurion University, CELSE 2016, Hebrew University (Economics and Psychology
departments), I-CORE and the Israeli Economic Association Meeting 2015. We are grateful to
Gal Baranes, Yuval Benshalom, Anat Carmel, Emma Davidovich, Reut Drori, Adi Koren, Neta
Lederer, Or Mazar, Matan Mor, Yael Naor, Vered Porzycki, and Anita Shtrubel for excellent
research assistance. Financial support was generously provided by the ICore Program of the
Planning and Budgeting Committee at the Israel Science Foundation (grant no. 1821/12) and the
Maurice Falk Institute for Economic Research in Israel. The research design underlying this study
was approved by the Hebrew University’s Ethics Committee for Research. † Please address correspondence to [email protected] or [email protected].

2
1. Introduction
The theoretical study of discrimination by economists began with Gary Becker’s path-
breaking book The Economics of Discrimination (1957). Becker argued that inferior labor
market outcomes associated with minority groups (such as blacks in the United States) are
driven by discriminatory preferences held by either employers, co-workers or customers.
Most of the follow-up literature, both theoretical and empirical, has focused on employer
discrimination. The role of customer preferences in generating cross-group differences in
market outcomes has received relatively little attention. Our paper aims to contribute to
this strand of the literature.
Becker’s customer discrimination model assumes competitive service and labor
markets. All firms provide a homogenous service and all workers have the same
productivity. The crucial assumption is that some customers have discriminatory tastes:
they prefer to receive the service from majority group workers. Under certain conditions,
this preference lowers the relative demand for minority group workers and therefore their
relative wage. As a result, profit-maximizing firms have to choose between (a) employing
low-wage minority group workers and charging low service prices from non-
discriminatory customers or (b) employing high-wage majority group workers and
charging high service prices from discriminatory customers.1
Importantly, these theoretical results imply that firms that cater to discriminatory
customers are not necessarily at a competitive disadvantage and therefore may survive in
the market in the long run. This outcome does not hold in Becker’s employer discrimination
model. As already noted by Becker himself, and more forcefully made by Arrow (1972),
discriminatory employers will not be able to survive in a perfectly competitive market in
1 In online Appendix A, we present Becker’s customer discrimination model using mathematical notation
and discuss its key results. We note there the possibility that if the share of non-discriminatory customers is
sufficiently large or the relative supply of minority group workers is sufficiently low, firms employing
minority group workers and those employing majority group workers would charge the same prices.

3
the long run since they charge the same price as non-discriminatory employers while
paying a higher wage to their employees.2
Our investigation focuses on discrimination by Jewish customers against Arab workers
in Israel. Arabs constitute about twenty percent of the country’s population and are
associated with inferior labor market outcomes relative to Jews, e.g. in terms of wages and
the unemployment rate. Anecdotal evidence suggests that the preference for Jewish labor
is widespread, is often justified by safety concerns and tends to increase with the intensity
of the Israeli-Palestinian conflict.
Motivated by this evidence and the insights of Becker’s customer discrimination
model, in this paper we systematically address the following questions: (1) To what extent
do Jewish customers prefer to receive services from Jewish rather than Arab workers? (2)
Do firm owners take these customer preferences into account when making their hiring
decisions? (3) Do firms employing Arab workers charge lower service prices than those
employing only Jewish workers?
Our analysis focuses on the market for services intensive in manual labor, e.g. painting
an apartment. From a methodological perspective, this market has several appealing
features. First, unlike in other sectors where many Arabs are employed, such as
construction and agriculture, in the market for labor intensive services there is a lot of
interaction between Arab workers and Jewish customers. Moreover, this interaction is
direct and often takes place in customers’ homes. Second, the context presents an
opportunity for Jewish customers to pay higher prices to receive services from Jewish
rather than Arab workers. Finally, in this market wages are a major component of
production costs, implying that we can expect to observe relatively large price differentials.
The key assumption in Becker’s model is that some customers have discriminatory
preferences. To test the validity of this assumption in the present context, starting in August
2015 we conducted a survey using a random sample of Jewish individuals listed in a
nationwide telephone directory. Our ability to differentiate between Arabs and Jews is
2 Later research proposed several modifications to Becker’s employer discrimination model that can generate
wage gaps even in the long run. See Chrales and Guryan (2008) for discussion of this issue.

4
based on the distinct naming conventions of the two ethnic groups (see Shayo and
Zussman, 2011). In the survey, we inquired about participants’ attitudes and beliefs
regarding Arab and Jewish workers and elicited their willingness to pay a premium to
receive a specific manual labor-intensive service (painting an apartment) from Jewish
rather than Arab workers. In October 2015, as we were conducting the customer survey, a
wave of violence broke out between Israelis and Palestinians. We leverage this natural
experiment to study the effect of politically motivated violence on customers’
discriminatory preferences.
The Becker model predicts that firm owners will take customers’ discriminatory
preferences into account when making hiring decisions and that firms employing Arab
workers would charge lower service prices than those employing only Jewish workers. To
test these predictions, we collected and analyzed data from two leading online directories
of firms providing labor-intensive services, Midrag (“ranking”) and Miktzoanim
(“professionals”). Our data collection effort, carried out from January to August 2015, was
restricted to certain fields. Building on the fact that the vast majority of firms are named
after their owners, we further restricted the data collection effort to Jewish-owned firms.
For each of these firms, we collected from the websites contact information and average
numerical satisfaction ratings (based on customer reviews). Next, we contacted the firms
and asked for a price quote for a well-defined task. Once we had a price quote in hand, we
inquired whether the owner employs Arab workers.3 Several weeks after receiving the
price quotes, we conducted a nominally independent follow-up survey of the firm owners.
In this survey, we recorded their attitudes and beliefs regarding workers from the two ethnic
groups. By merging the results of the survey with the information obtained in the earlier
contact with the employers, we were able to determine why some firm owners employ
Arab workers while others employ only Jewish workers and whether firms employing Arab
workers charge lower prices.
3 Although this question may seem completely inappropriate and offensive, none of the owners we contacted
refused to answer it. Some even mentioned that this question is often asked by customers.
5
Results of the customer survey show that a significant share of participants is willing
to pay a premium to have their apartment painted by a firm employing Jewish rather than
Arab workers. Participants’ responses reveal that this willingness is strongly associated
with their belief that Arab workers pose a greater threat to their personal safety than Jewish
workers do. Furthermore, we find that the share of those willing to pay a premium increased
from about a third to roughly forty percent following the outbreak of violence in October
2015, with a larger increase in the areas that experienced more violence. We also find that
the outbreak of violence had an effect on the intensive margin: for participants willing to
pay a premium, the average premium level rose from about forty-five to sixty percent.
Consistent with the predictions of the Becker model, we find that customer preferences
are strongly linked to firms’ hiring decisions and quoted prices. Results of the employer
survey (conducted in the early, relatively calm, period) indicate that eighty percent of firm
owners agree with the statement “Jewish customers prefer to receive services from Jewish
rather than Arab workers.” Moreover, among the responses to the various statements we
posed, the response to this particular statement is the only significant predictor of the
employment of Arab workers by the firm. We also find significant price differentials:
controlling for customer satisfaction ratings, firms employing Arab workers charge about
fifteen percent lower prices than those employing only Jewish workers.
The empirical literature on customer discrimination in the labor market is relatively
thin. Two early influential papers use data on professional sports to investigate this issue.
Kahn and Sherer (1988) examine the compensation of professional basketball players in
the NBA and show that, controlling for a variety of productivity and market-related
variables, black players earn significantly less than white players do. Furthermore, they
find that home attendance rises with the share of white players in the team, suggesting a
role for customer discrimination. Nardinelli and Simon (1990) show that, controlling for
objective player performance statistics, baseball cards sold in the United States command
lower prices when they feature pictures of nonwhite rather than white players. This
suggests that in the market for professional baseball players, nonwhite ones may have
lower entertainment value than their white colleagues.

6
Neumark (1996) conducts a field experiment to detect gender discrimination in the
hiring of waiters and waitresses in Philadelphia. He provides strong evidence of
discrimination against women in high-price restaurants. The author interprets the observed
positive and significant relationship between the proportion male among the clientele and
the proportion male among the waiting staff in these restaurants as suggesting that
discrimination is driven by customer preferences.
Several papers examine in more general settings how the racial and ethnic composition
of the pool of customers affects market outcomes. Holzer and Ihlanfeldt (1998) base their
analysis on a survey of employers in four large metropolitan areas in the United States.
They show that the racial composition of an establishment’s customers is strongly
associated with the race of those hired, particularly in jobs that involve direct contact with
customers and in sales or service occupations. Race of customers also affects wages, with
employees in establishments that have mostly black customers earning less than those in
establishments with mostly white customers. Leonard, Levine and Giuliano (2010) test for
customer discrimination with data from a large number of retail stores that belong to the
same chain. They find little evidence that matching employee demographics with the
demographics of the store’s community affects sales. Analyzing French data, Combes et
al. (2016) show that customer discrimination contributes to the overexposure of African
immigrants to unemployment in jobs that involve customer contact.
The main contribution of this paper to the literature on customer discrimination lies in
its direct approach. Previous studies rely on observed labor and service market outcomes
– such as wages and prices – to deduce whether customers have discriminatory preferences.
In contrast, in this paper we directly capture discriminatory attitudes and relate them to
market outcomes. Our approach builds on the tense inter-ethnic relations in Israel and on
the fact that many Israelis freely express discriminatory attitudes and beliefs. At the same
time, we note that the external validity of our results may be limited. In particular, it is
likely that safety concerns are much more dominant in Israel than in other contexts.
This paper also contributes to our understanding of the large and persistent differences
in labor market outcomes between Jews and Arabs in Israel. In online Appendix B, we
illustrate these differences – focusing on prime working age men employed full time –
using recent data from the Israeli Central Bureau of Statistics’ Income Survey. Without

7
conditioning on any other factor, hourly wages are forty-three log points lower for Arabs.
This gap increases slightly when controlling for standard sociodemographic characteristics
(age, marital status and new immigrant status). The gap falls to seventeen log points (but
remains highly statistically significant) once we control for education, sector and
occupation. We note, however, that the addition of the last set of controls is problematic
since these variables may be endogenous. For example, it is possible that Arabs choose not
to acquire education if they expect to be discriminated against in the labor market.
Similarly, customer discrimination might steer Arab workers into specific sectors and
occupations where customer contact is limited and wages are low.
Surprisingly, there is very little research trying to explain these large and persistent
ethnic gaps in the Israeli labor market, and no well identified evidence on the role of
discrimination in generating them.4 Our paper is thus arguably the first to provide credible
evidence of discrimination against Arabs in the Israeli labor market.
The rest of the paper is organized as follows. The next section describes our data
collection efforts. In Section 3 we present the results of the analysis; at the end of this
section, we discuss whether the preference for Jewish labor is “taste-based” or “statistical”
in nature. Section 4 concludes.
2. Data 2.1 Customer Survey
The key assumption in Becker’s model is that some majority group customers have
discriminatory tastes, preferring to receive services from majority group workers.
Accordingly, the main purpose of the telephone survey we conducted was to uncover to
what extent Jewish Israelis have such a preference with respect to Jewish relative to Arab
workers. We also use the survey to examine the sources of this preference.
4 Yashiv and Kasir (Kaliner) (2014) provide a recent summary of the relevant facts and a review of the
literature.

8
The survey population includes all individuals listed in the country’s landline telephone
directory (“White Pages”), which consists of thirteen books, each covering a different
geographical area. We randomly selected individuals with Jewish names from these books,
dropping from the analysis a few cases where an Arab accent was detected during the
interview.
The survey effort started in early August 2015. On October 1st 2015, after we surveyed
about one thousand individuals, a wave of ethnic violence broke out in Israel and the
Occupied Territories. This ended a period of relative calm that started in autumn 2014. We
continued the survey effort until the end of December 2015, reaching about two thousand
surveys in total.5
The customer survey questionnaire has two parts (the full text is in online Appendix
C). The first part focuses on sociodemographic and other personal characteristics of the
participants. The second deals with participants’ beliefs concerning Jewish and Arab
workers. We start this part by asking the participant to imagine the following scenario: her
apartment needs re-painting and she considers hiring a professional firm to do the job. The
firm owner, who is Jewish, can send a team of either Jewish or Arab workers. We then ask
the participant the following questions, the first three of which are based on criteria used
by Midrag to rank customer satisfaction with firms (see details in the next sub-section):
• “Which team do you think will do a higher quality job?”
• “Which team do you think is more likely to complete the job on schedule?”
• “Which team do you think will provide a more courteous service?”
• “Which team do you think poses a lower threat for your safety and the safety of your
family?”
In each case, the participant can choose one of the teams or state that she believes that there
will be no difference between them.
Next, we present the participant with a follow-up scenario: the firm owner proposes to
send a team of Arab workers to perform the job for one thousand Israeli shekels (roughly
5 The response rate in the survey was twenty-nine percent.

9
$250). We then ask the participant “Would you be willing to pay a price higher than one
thousand shekels for the job to be performed by a team of Jewish workers?” When the
answer is “yes”, we further ask: “how much would you be willing to pay for the job to be
performed by a team of Jewish workers?”.
The last question in the survey asks the participant whether she has ever used the
internet websites Midrag or Miktzoanim to contact service providers. We later use this
information to verify that the patterns observed for the whole sample also hold when
focusing on participants who are familiar with these websites.
2.2 Firm Data
Becker’s model predicts that firms that cater to non-discriminatory customers will hire
minority group workers and charge lower service prices than firms catering to
discriminatory customers. To test these predictions, we examine the online market for
manual labor-intensive services in Israel.
2.2.1 Directories
We collected data from Midrag and Miktzoanim, the two most popular online
nationwide directories that list firms providing various labor-intensive services.
Conversations with market participants suggest that these firms are generally small with a
single owner who manages a few workers.6
Midrag, established in 2003, is the largest directory of its kind. According to its “about”
page, Midrag currently lists about two thousand service providers, reviewed by over 230
thousand customers. Midrag’s business model is such that firms pay a monthly fee to be
listed, but access to the directory is free for registered customers (high-usage customers
pay a small annual fee).
The website strives to list only firms that provide high quality services. In order to enter
the website’s listing, the firm has to provide verifiable contact information for a large
number of previous customers. Midrag randomly contacts a subset of these customers and
6 From now on, we use the terms “firm owner” and “service provider” interchangeably.
10
asks them to provide the following ratings, each on a scale of one to ten: overall satisfaction
with the service provided and satisfaction with quality, price, courtesy and timeliness. Only
firms with an initial average overall rating of at least eight enter the list. To keep the ratings
up to date, Midrag employees track customer searches for service providers. They then
contact the customers to ask which provider was used, if any, and to collect satisfaction
ratings. If a firm’s average overall rating falls below eight, it is de-listed.
Miktzoanim was established in 2004. Like Midrag, it applies strict criteria for initially
listing service providers, tracks their performance by using customer satisfaction ratings,
and de-lists firms if necessary. Miktzoanim rates firms (on a scale of one to five) solely
based on customers’ overall satisfaction score.
2.2.2 Fields and tasks
We focused on five specific fields of service. For each field we defined a particular
task which (a) is routine enough to enable the firm owner to quote a price over the phone
and (b) may require the work of more than one person. To find suitable tasks, we carried
out a small pilot study and zeroed in on the following five tasks: cleaning a recently
renovated two bedroom empty apartment; moving a refrigerator between apartments;
painting a two-bedroom apartment; removing a plasterboard partition in an apartment;
installing an electric timer for a water heater.
For each of these tasks, we constructed a detailed scenario. For example, the moving
job was characterized by the following features: (a) we wanted to move a 270 liter
refrigerator; (b) the job was to be done within two weeks; (c) the refrigerator was located
in a second floor apartment in a building without an elevator in a specific neighborhood;
and (d) the destination of the move was a first floor apartment in a building without an
elevator in a different neighborhood.
2.2.3 Collecting contact information and ratings
In January 2015, we collected contact information and average numerical ratings for
all the Jewish-named firms listed in the fields to which our tasks belong (we note that firms
with distinct Arab names constitute a very small share of those listed on the websites, a
fact that by itself may suggest the existence of customer discrimination). As noted above,

11
the websites use different rating scales. To facilitate comparison, we transform the ratings
from the two websites to range from zero to ten.7
2.2.4 Obtaining price quotes
From late January to early May 2015, one of our research assistants called all the
service providers for which we collected contact information. Phone calls were conducted
during regular business hours and followed a pre-specified uniform script.
At the start of the call, the research assistant said she was interested in a price quote for
a particular task and provided the detailed description of this task. If the firm owner refused
to quote a price over the phone (e.g. because he wanted to estimate in person the amount
of work required), the research assistant ended the call. In the few cases where the firm
owner quoted a range rather than a specific price, we use the middle of the range.8
In the next stage of the call, the research assistant asked the firm owner whether he
plans to perform the job by himself. If so, the research assistant thanked the firm owner
and ended the call. In those cases where the firm owner answered that he would either bring
along with him or send workers to do the job, the research assistant said “I feel a bit
uncomfortable asking this, but do you employ Arabs?”. Once she obtained the answer to
this question, the research assistant thanked the firm owner and ended the call.
2.2.5 Surveying firm owners
From early April to early August 2015, a different research assistant made a second
round of calls to the same service providers. The purpose of these calls, carried out in each
case several weeks after the initial ones, was to conduct a nominally independent survey,
i.e. we did not alert the service providers to the fact that we already contacted them. Like
the customer survey, this survey had two parts (the full text is in online Appendix D). The
first part collects sociodemographic information while the second deals with firm owners’
7 Ratings were available for all firms in Midrag but were missing for some of the Miktzoanim firms. One
reason for this is that, unlike Midrag, Miktzoanim does not provide a rating when a firm is initially listed. 8 Firm owners are required by law to pay a value added tax of eighteen percent for the services they provide.
When contacting the service providers, we specifically asked for a tax-inclusive price quote.

12
perceptions concerning Arab and Jewish workers. Specifically, we asked each firm owner
to what extent he agrees with the following statements regarding Arab and Jewish workers
in his field of work:
• “Jewish workers are more efficient than Arab workers”
• “Jewish workers are more trustworthy than Arab workers”
• “Jewish workers pose a lower threat for the safety of the employer than Arab workers”
• “Jewish workers prefer not to work alongside Arab workers and vice versa”
• “Jewish customers prefer to receive services from Jewish rather than Arab workers”
Figure 1 provides a timeline summarizing the data gathering efforts.
[Figure 1]
3. Customer Discrimination – The Evidence 3.1 Customer Preferences for Jewish Labor
The main goal of our customer survey was to estimate the extent to which Jewish
customers prefer to receive services from Jewish rather than Arab workers. In this sub-
section, we present the results of the survey, showing that a large share of customers is
willing to pay a premium to receive services from Jewish workers. At the end of the sub-
section, we address some methodological concerns.
Columns 1 and 2 of Table 1 report the means and standard deviations of participants’
sociodemographic characteristics in two periods: August-September 2015 – before the
outbreak of violence – and October-December 2015 – during the violent period. In column
3, we test for differences in means across the two periods. In all cases but one, we are
unable to reject the null hypothesis of equal means.
[Table 1]
In column 5 we present for all characteristics the corresponding “population” means
(and standard deviations) obtained from two large-scale representative surveys conducted
by the Israeli Central Bureau of Statistics. Comparing the figures in the first two columns

13
with those in column 5 suggests that our sample is not representative of the adult Jewish
population in Israel.9 For example, the share of females is about sixteen percentage points
higher in our survey than in the population. The fact that the sample is not representative
might be a cause for concern since it makes it difficult for us to infer from our survey results
what share of the population has discriminatory preferences. We deal with this issue below.
Recall that in the second part of the customer survey we used a hypothetical scenario
(involving the painting of an apartment) to elicit participants’ beliefs concerning Arab and
Jewish workers. Panel A of Table 2 displays summary statistics on these beliefs, where
again, we differentiate between surveys conducted before and after the outbreak of
violence. In the early period (column 1), 20.8 percent of participants believed that Jewish
workers will do a higher quality job than Arab workers, while 7.4 percent held the opposite
view; the rest, more than seventy percent, thought that the two types of workers will do an
equally good job. Thus, one can claim that as far as job quality is concerned, there is a “net
preference” for Jewish labor of only 13.4 percentage points. The corresponding “net
preference” measure is even smaller when examining beliefs concerning timeliness and
courtesy (5.7 and -0.6 percentage points, respectively). In contrast, the “net preference”
measure in the response to the safety question stands at a whopping 55.9 percentage points.
[Table 2]
Column 2 presents the corresponding figures for surveys conducted during the violent
period, while column 3 tests for differences in customers’ beliefs across the two periods.
We find that the outbreak of violence led to an across-the-board increase in customers’ “net
preference” for Jewish labor.
The most important assumption in Becker’s model is that majority group customers
prefer – and are willing to pay more – to receive services from members of their own group.
In panel B of Table 2, we examine participants’ willingness to pay a premium to have their
apartment painted by Jewish rather than Arab workers. Although to an outside observer the
question regarding the willingness to pay a premium may seem highly provocative, only
9 This problem is most likely related to the use of landline telephones. See Gordoni, Oren and Shavit (2011)
for discussion of this issue in the Israeli context.

14
three percent of participants refused to answer it (we measure the decline in the response
rate relative to the immediately preceding question in the survey). To put things in
perspective, we note that about thirteen percent of participants refused to answer the
question about their (relative) income.
In the period preceding the outbreak of violence, a third of survey participants
expressed a willingness to pay a premium (first row, column 1). Among these participants,
the average premium level stood at about forty-six percent (second row).10 The evidence
presented in columns 2 and 3 of panel B suggests that violence raised both the share of
participants willing to pay a premium and the mean premium level.
We next examine which of the customers’ views are most strongly correlated with the
willingness to pay a premium for Jewish labor. In Table 3, we regress an indicator for this
willingness on indicators capturing participants’ beliefs concerning Jewish and Arab
workers, pulling together data from the two periods. The right hand side indicators take the
value of one when the participant stated that Jewish workers would outperform Arab
workers in a specific domain.
[Table 3]
Participants who believe that Jewish workers will provide a higher quality job are fifty-
five percentage points more likely than others to state that they are willing to pay a premium
for Jewish labor (column 1). We observe a qualitatively similar pattern for the other three
customer beliefs (columns 2-4). In column 5, we simultaneously include in the regression
all the indicators and add an indicator for the violent period. The coefficients for all
customer preference indicators drop in size but three of them – including the one
concerning personal safety – remain highly statistically significant. We also find that the
coefficient for the violent period is insignificant, which implies that the effect of violence
10 Eighty five percent of the participants who were willing to pay a premium further stated an exact premium
level. Most of the remaining fifteen percent actually said that they would be willing to pay any price to
receive the service from Jewish rather than Arab workers. We excluded these participants from the
calculation of the mean premium level.

15
is fully absorbed in the preference indicators. These patterns are robust to controlling for
the sociodemographic characteristics shown in Table 1 (column 6).11
An important question for understanding the nature of discrimination is whether the
views concerning Arab and Jewish workers observed above are uniformly distributed
across the Jewish population or rather characterize only certain segments of it. To explore
this issue, in Table 4 we pull together surveys conducted before and after the outbreak of
violence and analyze the sociodemographic correlates of participants’ beliefs.12 The
dependent variables in columns 1-4 are indicators taking the value of one when the
participant stated that she believes that the Jewish team will outperform the Arab team
along the relevant domains.13 The dependent variable in column 5 is an indicator that
equals 1 if the participant is willing to pay a premium for Jewish labor and the dependent
variable in column 6 is the premium level itself (expressed as a share of the original price).
Several sociodemographic characteristics correlate strongly and consistently with
participants’ beliefs regarding Arab and Jewish labor (columns 1-4). Older, more highly
educated, secular and higher income participants hold more favorable views of Arab
workers. New immigrants – most of whom emigrated from the former Soviet Union – seem
to hold Arab workers in particularly low regard. The number of children also correlates
with unfavorable views of Arab workers. These patterns are in line with results reported in
previous studies examining the views of Jewish Israelis towards Arabs; see Zussman
(2013) and references therein.
[Table 4]
Focusing on the sociodemographic correlates of the willingness to pay a premium to
receive services from Jewish rather than Arab workers (column 5) yields a very similar
11 We observe similar patterns when conducting this analysis separately for each of the periods (online
Appendix Tables E1 and E2). 12 In online Appendix Tables E3 and E4 we replicate this analysis separately for the two periods and obtain
similar results. 13 We estimate the regressions using OLS. In Appendix Table E5 we replicate the analysis of columns 1-4
with the original (ordinal) variables using Ordered Logit. The results are very similar to those reported in
Table 4.

16
picture to that observed in columns 1-4. The willingness to pay a premium is low for older,
highly educated, secular and higher income participants and high for new immigrants and
participants with more children. In contrast, when examining the sociodemographic
correlates of the premium level, most of the coefficients turn out to be insignificant (column
6). Finally, the results reported in the last row reinforce those presented in Table 2 and
show that violence affected attitudes: participants’ views of Arab workers became more
negative while the willingness to pay a premium, as well as the premium level itself,
increased.
In sum, the results presented in this sub-section indicate that a large share of Jewish
customers are willing to pay a premium to receive services from Jewish rather than Arab
workers. This willingness – which is driven, at least in part, by the belief that Arab workers
pose a greater threat to the safety of customers – increased after the outbreak of violence.
3.1.1 Potential concerns
The design of the customer survey and interpretation of its results raise several
concerns. First, recall from Table 1 that our sample is not representative, e.g. the share of
females is much higher in the sample than in the population. To estimate what share of the
adult Jewish population in Israel is willing to pay a premium, we use the “population”
means for the sociodemographic characteristics reported in the last column of Table 1
together with the coefficients for the corresponding variables estimated separately for each
period (column 5 of online Appendix Tables E3 and E4). This adjustment raises the share
of those willing to pay a premium from 33.4 to 41.3 percent in the period preceding the
outbreak of violence and from 40.5 to 42.1 percent in the following period.14 When
conducting an analogous adjustment for the average premium level, it leads to a slight
14 We note that while the sociodemographic characteristics of participants in our sample did not change across
periods (column 3 in Table 1), the association between these characteristics and the willingness to pay a
premium did in fact change. For example, females’ willingness to pay a premium was slightly lower than
that of males before the outbreak of violence; in contrast, during the violent period, females were 9.3
percentage points more willing than males to pay a premium. This implies that the over-representation of
women in our sample did not matter much in the first period, but had a significant effect in the second, pulling
up the mean willingness to pay a premium in the sample relative to the population.

17
decrease (from 45.7 to 43.4 percent) in the first period and to a small increase (from 60.2
to 61.0 percent) after the outbreak of violence. Overall, the results of the adjustment
exercise indicate that while the sample is not fully representative of the population, our
survey does provide a fairly accurate picture of the underlying patterns.
A related concern has to do with the fact that we later use data on service providers
listed in the internet websites Midrag and Miktzoanim. It is possible that customers of these
websites differ in their preferences from the general population. In online Appendix Table
E6 we replicate the analysis of Table 2 while focusing on the thirteen percent of participants
who indicated that they have previously used these websites. The observed patterns are
very similar to the original ones.
A completely different concern has to do with experimental “demand effects.” Most
importantly, it is possible that by providing participants with specific reasons for the
preference for Jewish labor, we affected their responses. To address this concern, in August
2016 we conducted a supplemental customer survey similar to the original one, but where
we elicited the reasons for participants’ preferences using an open-ended question.15
Results show that safety concerns are by far the most common reason for customers’
preference for Jewish labor – seventy-one percent of participants mentioned this reason in
their response. In online Appendix F, we provide details regarding the supplemental survey
and additional results.
Finally, so far we have interpreted the results as implying that violence had a causal
effect on customer attitudes. This interpretation seems reasonable given that our survey
covered a short period of time and the fact that violence erupted unexpectedly in October
2015, dominating media attention since then. In a similar vein, Hjort (2014) shows that the
eruption of ethnic violence led to a sharp increase in discrimination in mixed-ethnicity
production teams employed in a Kenyan flower plant.
To provide further support for the causal interpretation of the results, we exploit the
fact that from its outbreak and until the end of the period under investigation here, violence
15 We thank an anonymous referee for encouraging us to carry out the supplemental survey.

18
was concentrated in Jerusalem and the West Bank.16 Using a “difference-in-differences”
framework, the analysis (reported in online Appendix Table E7) provides evidence
consistent with a causal interpretation. Most importantly, we find that the willingness to
pay a premium for Jewish labor increased much more in “treated” relative to “control”
areas. These results are consistent with previous research leveraging spatial and temporal
variation in conflict intensity to show that violence has a causal effect on attitudes.17
3.2 Firms
Having established that a large share of Jewish customers prefers to receive services
from Jewish rather than Arab workers, in this sub-section we test two key predictions of
the Becker model: (1) firm owners take customer preferences into account when making
their hiring decisions and (2) firms that employ Arab workers charge lower service prices
than those employing only Jewish workers.
3.2.1 Employment of Arab workers
We start our investigation with a total of 389 Jewish-owned firms that were listed in
Midrag or Miktzoanim in the five selected fields. Of these, fourteen firms were cross-listed
in the two directories and we include them only in the Midrag sample. Table 5 provides
summary statistics on the 203 firm owners who participated in the survey (i.e. the response
rate was fifty-four percent). It turns out that in many respects firm owners are quite similar
to the average Jewish Israeli adult – last column of Table 1 – with some notable exceptions
(e.g. practically all firm owners are male).
[Table 5]
How do employers view Arab as compared to Jewish workers? We find that about a
third of firm owners agree (strongly or otherwise) with the statement “Jewish workers are
more efficient than Arab workers” (Table 6). Roughly sixty percent agree that Jewish
workers are “more trustworthy” and that they “pose a lower threat for the safety of the
employer” than Arab workers. These results may suggest the existence of employer
16 Source: Israeli Security Agency (2016). 17 See, for example, Gould and Klor (2010).

19
discrimination. We also find that about a third of firm owners agree with the statement
“Jewish workers prefer not to work alongside Arab workers and vice versa”. This may
indicate the existence of co-worker discrimination.
[Table 6]
Crucially for our investigation, four out of five firm owners expressed agreement with
the statement “Jewish customers prefer to receive services from Jewish rather than Arab
workers”. This share is more than twice as large as the share of participants in our customer
survey who expressed a willingness to pay a premium for Jewish labor. This discrepancy
could possibly imply that some participants in the customer survey were reluctant to reveal
their true preferences and that the actual demand for Jewish labor is stronger than what we
have previously estimated. On the other hand, it is possible that “blaming the customers”
is a convenient answer for employers who do not hire Arab workers.18 Thus, while it is
clear that we cannot take firm owners’ responses at face value, our results do strongly
indicate that employers are aware of customers’ preference for Jewish labor.
We next investigate how the decision to employ Arab workers relates to the firm
owners’ views discussed above (Table 7). To do this, we utilize the data gathered in our
first contact with firm owners, where we asked for a price quote and inquired about the
employment of Arabs. We note that this information is available only for a subset of firms
(see details below).
Employers who agree (strongly or otherwise) with the statement “Jewish workers are
more efficient than Arab workers” are 15.5 percentage points less likely than others to
employ Arab workers (column 1). Similarly, employers who do not trust Arab workers or
think that they pose a security threat to them are less likely to employ Arabs (columns 2
18 Similar to the concern raised regarding the customer survey, experimental “demand effects” may also affect
the responses of firm owners. To address this concern, in August 2016 we carried out a supplemental survey
of firm owners, where we allowed them to use their own words. The results are consistent with our previous
findings and suggest that customers’ preferences play an important role in firm owners’ hiring decisions.
Details on the supplemental firm owner survey are provided in online Appendix G.

20
and 3). In contrast, the employment of Arabs does not seem to be strongly correlated with
firm owners’ beliefs about co-worker preferences (column 4).
[Table 7]
The strongest single predictor of the employment of Arab workers turns out to be
customer preferences: firm owners who agree with the statement “Jewish customers prefer
to receive services from Jewish rather than Arab workers” are 31.9 percentage points less
likely than others to employ Arabs (column 5). Strikingly, when we run a “horse race”
specification (column 6) and additionally include sociodemographic controls in the
analysis (column 7), the indicator for customer preferences maintains its size and statistical
significance while all other indicators become statistically insignificant.19 This finding
strongly suggests that, as predicted by Becker’s customer discrimination model, customer
preferences are a crucial input into firm owners’ decisions concerning the hiring of
minority group employees.
3.2.2 Price differentials
We now turn to examine the question of price differentials between firms employing
Arab workers and those employing only Jewish workers. As before, we start out with 375
firms that were listed in Midrag or Miktzoanim in the five selected fields. The analysis
excludes seventy-two cases where the service provider was either unreachable or refused
to quote a price over the phone, leaving us with 303 firms with a quoted price.
Summary statistics for these firms, 146 from Midrag and 157 from Miktzoanim, are
provided in panels A and B of Table 8, respectively. Of the firm owners reached through
Midrag, one-hundred indicated that they will either bring along or send workers to do the
job (second row, second to last column). Of these firm owners, twenty-three indicated that
they employ Arab workers while the rest stated that they employ only Jewish workers
(fourth row, last two columns). Average price quotes seem to be significantly lower for
firms employing Arab workers in two of the five tasks: cleaning an apartment and
19 The “security threat” variable is marginally significant in column 6. This suggests that employers
themselves may statistically discriminate on this basis.

21
removing a plasterboard partition. For two other tasks – moving a refrigerator and installing
an electric timer – quoted prices are somewhat lower for firms employing Arab workers.
For the remaining task – painting an apartment – prices are almost the same across the two
types of firms.
[Table 8]
For all the tasks, differences in overall ratings between firms employing Arab workers
and those employing only Jewish workers seem to be quite limited. The same is true for
the quality, price, timeliness and courtesy ratings. This suggests that the price differences
observed across the two types of firms do not reflect differences in customer satisfaction.20
Relative to Midrag, a somewhat lower share of firm owners from Miktzoanim indicated
that they would either bring along or send workers to do the job (fifty-nine versus sixty-
eight percent). The share of these firms that employ Arabs is similar in Miktzoanim
(twenty-five percent) and in Midrag (twenty-three percent). In Miktzoanim, average price
quotes seem to be significantly lower for firms employing Arab workers in two tasks –
moving a refrigerator and removing a plasterboard partition – and similar in two other tasks
– cleaning and painting an apartment. We have overall customer satisfaction ratings for
sixty-four out of the ninety-one providers who bring along or send workers to do the job.
For all tasks, the ratings appear to be either equal across the two types of firms or somewhat
higher for firms employing Arab workers.
We next use regression analysis to more rigorously test for differences in quoted service
prices between firms employing Arab workers and those employing only Jewish workers.
The analysis exploits the fact that there is a lot of variation in the number of customer
reviews each firm has on the website. Since it is likely that quoted prices (and average
ratings) for firms with many reviews are more representative of market conditions, we
weigh observations by the number of customer reviews.
20 The customer satisfaction ratings of firms that appear in the websites could potentially be influenced by
the ethnicity of the firms’ workers. In light of the results of our customer survey, it is reasonable to assume
that such a bias, if it exists, would work against firms with Arab employees.

22
We find that for firms listed in Midrag, those that employ Arab workers quote 17.3 log
points lower prices on average than firms employing only Jewish workers (column 1 of
Table 9). When we control for the average overall rating of the firm, the gap slightly drops
to 16.8 log points; the rating itself is positively, although insignificantly, correlated with
the price quote (column 2). A similar pattern is observed for firms listed in Miktzoanim
(columns 3 and 4). When we combine data from the two directories, the correlations are
more tightly estimated (columns 5 and 6). All else being equal, quoted prices are 16.8 log
points (fifteen percent) lower for firms employing Arab workers than for those employing
only Jewish workers.
[Table 9]
We conduct three robustness checks for the baseline results concerning price
differentials. First, we replicate the analysis giving each observation (firm) an equal weight.
Results, reported in online Appendix Table E8, are very similar to the original ones. In
particular, when including data from both directories and controlling for overall ratings,
the price differential is estimated at 18.5 log points.
Second, one may be concerned that a single task (field) is driving our results. To
address this concern, we exclude from the analysis one task at a time. The results are robust
to this change and show that firms employing Arab workers charge between thirteen and
twenty log points lower prices than those employing only Jewish workers (online Appendix
Table E9).
Finally, we note that eighteen of the service providers included in the analysis of Table
9 quoted a price range rather than a specific price. So far, the analysis has used the middle
of the price range as the price quote in these cases. Results are almost identical when using
instead either the minimum or the maximum of the range (online Appendix Tables E10
and E11).
3.3 Taste-based or Statistical Customer Discrimination?
The driving force in Becker’s model is customers’ prejudice toward members of the
minority group (“tastes”). While this is not the focus of our paper, we argue below that, in
the current context, the preferences of Jewish customers are not driven solely by “tastes”

23
but also by “statistical” considerations, as in Arrow (1972) and Phelps (1972). In this
respect, the analysis in this sub-section is related to a large recent empirical literature which
attempts to identify the sources of discrimination. Examples include Altonji and Pierret
(2001), List (2004), Autor and Scarborough (2008), Charles and Guryan (2008), Pope and
Sydnor (2011), Doleac and Stein (2013), and Zussman (2013 and forthcoming).21
Our claim that “statistical” considerations play a role in the current context rests mainly
on the results of the customer surveys, which indicate that the preference for Jewish labor
is most strongly linked to customers’ concerns for their safety. In turn, these concerns seem
to reflect the fact that Arabs are involved in politically motivated violence against Jews.
This interpretation receives additional support from the finding that the willingness to pay
a premium to receive services from Jewish rather than Arab workers increased following
the outbreak of violence in October 2015 and from the fact that this pattern was more
pronounced in the areas that experienced more violence.
It is worth emphasizing, however, that customers’ concerns for their safety may be
exaggerated. Indeed, a media search for the period before and after the outbreak of violence
uncovers no evidence of workers (either Arab or Jewish) assaulting their customers. Thus,
we cannot rule out the possibility that for some of the survey participants, “safety concerns”
is a politically correct justification for simple taste-based discrimination.
Further evidence supporting the taste-based discrimination interpretation comes from
results presented in Table 4. Statistical discrimination is driven by lack of economically
relevant information about specific agents – in our context, information regarding the job-
related attributes of Arab and Jewish workers in specific firms – which forces decision
makers to rely on group averages. The fact that Table 4 shows significant differences across
sociodemographic groups in beliefs concerning those averages, suggests a role for taste-
21 Guryan and Charles (2013), Rich (2014), Bertrand and Duflo (forthcoming) and Neumark (forthcoming)
provide recent surveys of this literature. It is worth noting that some of the papers that try to disentangle
statistical from taste-based discrimination do this in product market settings. These papers focus on
discrimination by customers against minority group sellers. In contrast, our paper focuses on customer
discrimination against minority group workers, which is the type of customer discrimination portrayed in
Becker’s model.
24
based discrimination. For example, assuming that customers with more education and those
with less education share the same information set, it is not clear why the latter would differ
from the former in their assessment of the relative productivity (or other attributes) of Arab
workers.
Disentangling statistical from taste-based discrimination is notoriously difficult,
especially outside the lab. The context studied here is no exception. We therefore refrain
from taking a strong stand on the sources of discrimination, and simply note that the results
provide some evidence for both models.
4. Conclusions
Becker’s customer discrimination model assumes competitive service and labor
markets. The key assumption of the model is that some customers prefer to receive services
from majority group workers. This preference lowers the relative demand for minority
group workers and their relative wage. As a result, there are two types of firms in
equilibrium: some employ low-wage minority group workers and charge low service prices
from non-discriminatory customers; the others employ high-wage majority group workers
and charge high service prices from discriminatory customers.
Israel seems to be an ideal setting to test Becker’s customer discrimination model.
Whereas previous studies rely on observed wages, prices and employment patterns to infer
whether customers have discriminatory preferences, our paper directly captures
discriminatory attitudes and relates them to market outcomes. This approach builds on the
fact that relations between Arabs and Jews are very tense and on the tendency of Israelis
to freely express discriminatory attitudes and beliefs.
We focus on the market for labor-intensive services, in which: the interaction between
Jewish customers and Arab workers often takes place in the customers’ homes; there is an
opportunity for Jewish customers to pay higher prices to receive services from Jewish
workers; and wages are a major component of production costs.

25
The results of our customer survey indicate that about forty percent of Jewish Israelis
are willing to pay a premium to receive services from Jewish rather than Arab workers.
This willingness is most strongly associated with customers’ belief that Arab workers pose
a greater threat to their personal safety than Jewish workers do. Leveraging the outbreak
of violence in October 2015 as a natural experiment, we find that violence heightens
negative views of Arab workers and raises the willingness to pay a premium for Jewish
labor. These results suggest that “statistical” considerations play a role in shaping customer
preferences.
To examine the influence of these customer preferences on firms’ hiring decisions and
quoted prices, we rely on field data collected from Israel’s two most popular online
directories listing service providers and on a survey of these providers. Eighty percent of
firm owners stated that Jewish customers prefer to receive services from Jewish rather than
Arab workers. We additionally find that firm owners’ beliefs about these customer
preferences are the only significant predictor of the employment of Arab workers by the
firm. Controlling for customer satisfaction ratings, we find that firms that employ Arab
workers charge fifteen percent lower prices than those employing only Jewish workers.
Taken as a whole, the results presented in this paper thus provide strong direct evidence
in support of Gary Becker’s classic customer discrimination model.

26
5. References
Altonji, Joseph G., and Charles R. Pierret. 2001. “Employer Learning and Statistical
Discrimination.” Quarterly Journal of Economics, 116(1): 313-350.
Arrow, Kenneth J. 1972. “Some Mathematical Models of Race in the Labor Market.” In
Racial Discrimination in Economic Life, ed. Arthur .H. Pascal. Lexington, MA:
Lexington Books.
Autor, David H., and David Scarborough. 2008. “Does Job Testing Harm Minority
Workers? Evidence from Retail Establishments.” Quarterly Journal of
Economics, 123(1): 219-277.
Becker, Gary S. 1957. The Economics of Discrimination. Chicago: The University of
Chicago Press.
Bertrand, Marianne, and Esther Duflo. Forthcoming. “Field Experiments on
Discrimination.” In Handbook of Field Experiments, eds. Abhijit Banerjee and
Esther Duflo. Amsterdam: Elsevier.
Charles, Kerwin K., and Jonathan Guryan. 2008. “Prejudice and Wages: An Empirical
Assessment of Becker’s The Economics of Discrimination.” Journal of Political
Economy, 116(5): 773-809.
Combes, Pierre-Philippe, Bruno Decreuse, Morgane Laouenan, and Alain Trannoy.
2016. “Customer Discrimination and Employment Outcomes: Theory and
Evidence from the French Labor Market.” Journal of Labor Economics, 34(1): 107-
160.
Doleac, Jennifer L., and Luke C.D. Stein. 2013. “The Visible Hand: Race and Online
Market Outcomes.” Economic Journal, 123(572): F469-F492.
Gordoni, Galit, Anat Oren, and Yossi Shavit. 2011. “Coverage Bias in Telephone
Surveys in Israel.” Field Methods, 23(2): 188-203.
Gould, Eric D., and Esteban F. Klor. 2010. “Does Terrorism Work?” Quarterly Journal
of Economics, 125(4): 1459-1510.
Guryan, Jonathan, and Kerwin K. Charles. 2013. “Taste‐based or Statistical
Discrimination: The Economics of Discrimination Returns to its Roots.” Economic
Journal, 123(572): F417-F432.

27
Holzer, Harry J., and Keith R. Ihlanfeldt. 1998. “Customer Discrimination and
Employment Outcomes for Minority Workers.” Quarterly Journal of Economics,
113(3): 835-867.
Hjort, Jonas. 2014. “Ethnic Divisions and Production in Firms.” Quarterly Journal of
Economics, 129(4): 1899-1946.
Israeli Security Agency. 2016. Annual Summary of Trends in Terror. [In Hebrew]
Kahn, Lawrence M., and Peter D. Sherer. 1988. “Racial Differences in Professional
Basketball Players' Compensation.” Journal of Labor Economics, 6(1): 40-61.
Leonard, Jonathan S., David I. Levine, and Laura Giuliano. 2010. “Customer
Discrimination.” Review of Economics and Statistics, 92(3): 670-678.
List, John A. 2004. “The Nature and Extent of Discrimination in the Marketplace:
Evidence from the Field.” Quarterly Journal of Economics, 119(1): 49-89.
Nardinelli, Clark, and Curtis Simon. 1990. “Customer Racial Discrimination in the
Market for Memorabilia: The Case of Baseball.” Quarterly Journal of Economics,
105(3): 575-595.
Neumark, David. 1996. “Sex Discrimination in Restaurant Hiring: An Audit Study.”
Quarterly Journal of Economics, 111(3): 915–41.
Neumark, David. Forthcoming. “Experimental Research on Labor Market
Discrimination.” Journal of Economic Literature.
Phelps, Edmund S. 1972. “The Statistical Theory of Racism and Sexism.” American
Economic Review, 62(4): 659-61.
Pope, Devin G., and Justin R. Sydnor. 2011. “What’s in a Picture? Evidence of
Discrimination from Prosper.com.” Journal of Human Resources, 46(1): 53-92.
Rich, Judith. 2014. “What Do Field Experiments of Discrimination in Markets Tell Us?
A Meta-Analysis of Studies Conducted Since 2000.” IZA, Discussion Paper no.
8584.
Shayo, Moses, and Asaf Zussman. 2011. “Judicial Ingroup Bias in the Shadow of
Terrorism.” Quarterly Journal of Economics, 126(3): 1447-1484.
Yashiv, Eran, and Nitsa Kasir (Kaliner). 2014. “The Labor Market of Israeli Arabs: Key
Features and Policy Solutions.” Unpublished working paper, Tel Aviv University.

28
Zussman, Asaf. 2013. “Ethnic Discrimination: Lessons from the Israeli Online Market for
Used Cars.” Economic Journal, 123(572): F433–F468.
Zussman, Asaf. Forthcoming. “Conflict and the Ethnic Structure of the Marketplace:
Evidence from Israel.” European Economic Review.

29
Table 1 Sociodemographic characteristics of customers
Before
violent period During
violent period Difference
N - total (before violent period) “Population”
(1) (2) (3) (4) (5) Female 0.696 0.668 -0.028 2,130 0.520
(0.460) (0.471) (0.020) (983) (0.500)
Age 55.32 55.89 0.576 2,084 45.46 (16.21) (17.66) (0.742) (959) (18.29)
New immigrant1 0.080 0.091 0.011 2,093 0.215 (0.272) (0.288) (0.012) (961) (0.411)
Sephardic2 0.295 0.310 0.016 2,099 0.325 (0.456) (0.463) (0.020) (964) (0.468)
Higher education degree3 0.474 0.475 0.001 2,112 0.304 (0.500) (0.500) (0.022) (974) (0.460)
Secular 0.538 0.533 -0.005 2,107 0.436 (0.499) (0.499) (0.022) (972) (0.496)
Married 0.737 0.696 -0.041** 2,105 0.608 (0.440) (0.460) (0.020) (966) (0.488)
Number of children 2.814 2.842 0.029 2,054 2.183 (1.689) (1.876) (0.079) (950) (1.813)
Employed4 0.567 0.543 -0.025 2,094 0.693 (0.496) (0.498) (0.022) (968) (0.461)
High income 0.342 0.309 -0.033 1,840 0.327 (0.475) (0.462) (0.022) (831) (0.469)
Notes. 1 Immigrated to Israel since 1989. 2 Following a convention adopted by the Israeli Central Bureau of Statistics, we use continent of origin in order to identify ethnic divisions within the Jewish community: Ashkenazic (Western) Jews are associated with Europe and America and Sephardic (Eastern) Jews are associated with Asia and Africa. This applies to either the individual or his or her father. Additionally, we classify as “second generation Sabra (native-born)” individuals who were born in Israel and whose fathers were born in the country. 3 Holds a bachelor’s, master’s or doctoral degree. 4 Either salaried employee or self-employed. Column 1 presents means (and standard deviations) for the sociodemographic characteristics of participants surveyed during August-September 2015. Column 2 presents means (and standard deviations) for the sociodemographic characteristics of participants surveyed during October-December 2015. Column 3 presents coefficients (and standard errors) for the indicator variable “violent period” (which equals 1 for surveys conducted since October 1st 2015 and 0 otherwise) when each of the sociodemographic controls is regressed on it. Column 5 presents means (and standard deviations) for the sociodemographic characteristics of adult Jews in the 2013 Labor Force Survey conducted by the Israeli Central Bureau of Statistics (except for the variables “secular” and “number of children”, which do not appear in the Labor Force Survey and were derived from the 2013 Social Survey, also conducted by the Israeli Central Bureau of Statistics). Columns 3 is estimated using OLS. Robust standard errors in parentheses. *, **, *** represent statistical significance at the 10%, 5%, and 1% levels.

30
Table 2 Customer beliefs and willingness to pay a premium for Jewish labor
Panel A: Customer beliefs, by period
Before violent period
During violent period Difference
N - total (before violent
period) (1) (2) (3) (4)
Quality Jewish team 0.208 0.285 0.077*** 2,033 (0.406) (0.452) (0.019) (960)
Same 0.718 0.613 -0.104*** (0.450) (0.487) (0.021)
Arab team 0.074 0.102 0.028** (0.262) (0.302) (0.013)
Timeliness Jewish team 0.179 0.244 0.065*** 1,996 (0.383) (0.430) (0.018) (956)
Same 0.699 0.665 -0.033 (0.459) (0.472) (0.021)
Arab team 0.122 0.090 -0.032** (0.328) (0.287) (0.014)
Courtesy Jewish team 0.185 0.254 0.069*** 2,013 (0.389) (0.436) (0.018) (955)
Same 0.624 0.601 -0.023 (0.485) (0.490) (0.022)
Arab team 0.191 0.145 -0.046*** (0.393) (0.352) (0.017)
Safety Jewish team 0.569 0.643 0.075*** 2,020 (0.496) (0.479) (0.022) (946)
Same 0.422 0.352 -0.070*** (0.494) (0.478) (0.022)
Arab team 0.010 0.005 -0.005 (0.097) (0.068) (0.004)

31
Panel B: Willingness to pay a premium, by period
Before violent period
During Violent period Difference
N - total (Before violent
period) (1) (2) (3) (4)
Willing to pay a premium 0.334 0.405 0.072*** 1,998 (0.472) (0.491) (0.022) (935)
Premium level .0 457 .0 602 0.145*** 631 (0.375) (0.595) (0.039) (274)
Notes. The table summarizes responses to a hypothetical scenario presented to survey participants where they had to compare the performance of an Arab team and a Jewish team in providing a particular service (Panel A) and to state whether they are willing to pay a premium to receive the service from the Jewish team (Panel B). Panel A: “Quality” refers to the question “which team do you think will do a higher quality job?”. “Timeliness” refers to the question “which team do you think is more likely to complete the job on schedule?”. “Courtesy” refers to the question “which team do you think will provide a more courteous service?”. “Safety” refers to the question “which team do you think poses a lower threat for your safety and the safety of your family?”. “Jewish team” is an indicator that equals 1 if the customer believes that the Jewish team will outperform the Arab team and 0 otherwise. “Same” is an indicator that equals 1 if the customer believes that both teams will perform equally well and 0 otherwise. “Arab team” is an indicator that equals 1 if the customer believes that the Arab team will outperform the Jewish team and 0 otherwise. Panel B: “Willing to pay a premium” is an indicator which equals 1 if the participant is willing to pay a premium to receive the service from the Jewish rather than the Arab team and 0 otherwise. “Premium level” is the additional amount (as share of the original, NIS 1,000, price) that the participant is willing to pay to receive the service from the Jewish rather than the Arab team. In both panels, column 1 presents the means (and standards deviations) of the responses of participants surveyed during August-September 2015. Column 2 presents the means (and standards deviations) of the responses of participants surveyed during October-December 2015. Column 3 presents coefficients (and standards errors) for the indicator variable “violent period” (which equals 1 for surveys conducted since October 1st 2015 and 0 otherwise) when each of the indicators representing the participants’ answers is regressed on it. Columns 3 is estimated using OLS. Robust standard errors in parentheses. *, **, *** represent statistical significance at the 10%, 5%, and 1% levels.

32
Table 3 Correlates of customer willingness to pay a premium
Dependent variable: Will pay a premium for a Jewish team (1) (2) (3) (4) (5) (6)
Quality 0.550*** 0.268*** 0.225*** (0.022) (0.032) (0.033)
Timeliness 0.443*** 0.034 0.039 (0.025) (0.032) (0.032)
Courtesy 0.537*** 0.179*** 0.167*** (0.023) (0.033) (0.034)
Safety 0.533*** 0.367*** 0.355*** (0.016) (0.020) (0.022)
Violent period 0.002 0.006 (0.017) (0.018)
Sociodemographic controls No No No No No Yes R2 0.240 0.141 0.213 0.290 0.398 0.415 Observations 1,966 1,942 1,956 1,965 1,898 1,766 Notes. The dependent variable is an indicator which equals 1 if the participant stated that he would be willing to pay a premium to receive the service from a Jewish rather than an Arab team and 0 otherwise. The independent variables are indicators capturing participants’ beliefs concerning Jewish and Arab workers. The indicators equal 1 when the participant believes that the Jewish team will outperform the Arab team in a specific domain and 0 otherwise (see Table 2 for the full text of the questions). The regression in column 6 includes the sociodemographic controls that appear in Table 1 as well as an indicator for missing income. The variable “violent period” is an indicator that equals 1 if the survey was conducted since October 1st 2015 and 0 otherwise. Estimated using OLS. Robust standard errors in parentheses. *, **, *** represent statistical significance at the 10%, 5%, and 1% levels.

33
Table 4 Sociodemographic correlates of customer beliefs
Quality Timeliness Courtesy Safety Willing to pay
a premium Premium
level (1) (2) (3) (4) (5) (6)
Female 0.006 0.009 0.040** 0.017 0.041* 0.036 (0.020) (0.020) (0.019) (0.024) (0.023) (0.058)
Age -0.001* -0.002** -0.003*** -0.005*** -0.002** -0.003 (0.001) (0.001) (0.001) (0.001) (0.001) (0.002)
New immigrant 0.219*** 0.176*** 0.167*** 0.135*** 0.108*** -0.006 (0.040) (0.040) (0.040) (0.037) (0.042) (0.085)
Sephardic -0.000 0.003 -0.007 0.002 -0.008 0.105** (0.022) (0.022) (0.021) (0.025) (0.025) (0.047)
Higher education degree
-0.076*** -0.069*** -0.106*** -0.027 -0.053** 0.033 (0.020) (0.019) (0.019) (0.024) (0.023) (0.045)
Secular -0.151*** -0.100*** -0.154*** -0.179*** -0.232*** 0.030 (0.021) (0.021) (0.020) (0.025) (0.025) (0.055)
Married -0.007 0.002 0.004 0.007 -0.009 0.090* (0.024) (0.023) (0.023) (0.028) (0.027) (0.049)
# of children 0.036*** 0.034*** 0.032*** 0.021*** 0.043*** 0.002 (0.007) (0.007) (0.007) (0.006) (0.007) (0.010)
Employed -0.030 -0.006 -0.023 -0.005 0.046* -0.012 (0.023) (0.023) (0.022) (0.026) (0.025) (0.048)
High income -0.078*** -0.028 -0.046** -0.049* -0.065** -0.092* (0.022) (0.022) (0.021) (0.027) (0.025) (0.051)
Violent period 0.058*** 0.057*** 0.065*** 0.066*** 0.060*** 0.130*** (0.019) (0.018) (0.018) (0.022) (0.021) (0.042)
R2 0.121 0.081 0.131 0.098 0.133 0.049 Observations 1,887 1,852 1,867 1,872 1,859 598 Notes. The dependent variables in columns 1-4 refer to participants’ responses to questions regarding the performance of Jewish relative to Arab workers (see Table 2 for the full text of the questions). These variables are indicators that equal 1 when the participant believes that the Jewish team will outperform the Arab team and 0 otherwise (i.e. when the participant believes that Arab team will outperform the Jewish team or when the participant believes both teams will perform equally well). The dependent variable in column 5 is an indicator which equals 1 if the participant is willing to pay a premium to receive the service from a Jewish rather than an Arab team and 0 otherwise. The dependent variable in column 6 is the additional amount (as share of the original, NIS 1,000 price) that the participant is willing to pay to receive the service from a Jewish rather than an Arab team. See Table 1 for explanations and summary statistics for the independent variables. The regressions include an indicator variable for missing income. The variable “violent period” is an indicator that equals 1 if the survey was conducted since October 1st 2015 and 0 otherwise. Estimated using OLS. Robust standard errors in parentheses. *, **, *** represent statistical significance at the 10%, 5%, and 1% levels.

34
Table 5 Sociodemographic characteristics of firm owners
Mean Standard deviation N (1) (2) (3) Female 0.025 0.155 203 Age 41.83 10.29 202 New immigrant 0.134 0.341 202 Sephardic 0.453 0.499 203 Higher education degree 0.164 0.371 201 Secular 0.550 0.499 202 Married 0.703 0.458 202 Number of children 2.218 1.670 202 Employed 0.995 0.071 199 High income 0.247 0.433 178 Notes. See Table 1 for the definitions of the sociodemographic variables. The only difference is that in this case “higher education” refers to participants with post-high school education.

35
Table 6 Firm owner beliefs
Mean Standard deviation N (1) (2) (3) Efficiency Strongly agree 0.139 0.347 194
Agree 0.206 0.406 Disagree 0.309 0.463 Strongly disagree 0.345 0.477
Trustworthiness Strongly agree 0.292 0.456 195 Agree 0.318 0.467 Disagree 0.215 0.412 Strongly disagree 0.174 0.380
Security threat Strongly agree 0.212 0.410 193 Agree 0.342 0.476 Disagree 0.218 0.414 Strongly disagree 0.228 0.421
Co-workers' preference
Strongly agree 0.082 0.276 194 Agree 0.247 0.433 Disagree 0.299 0.459 Strongly disagree 0.371 0.484
Customers' preference
Strongly agree 0.449 0.499 196 Agree 0.352 0.479 Disagree 0.122 0.329 Strongly disagree 0.077 0.267
Notes. This table shows the distribution of firm owners’ responses to various statements concerning Arab and Jewish workers. “Efficiency” refers to the statement “In your field of work, Jewish workers are more efficient than Arab workers”. “Trustworthiness” refers to the statement “In your field of work, Jewish workers are more trustworthy than Arab workers”. “Security threat” refers to the statement “In your field of work, Jewish workers pose a lower threat for the safety of the employer than Arab workers”. “Co-workers’ preference” refers to the statement “In your field of work, Jewish workers prefer not to work alongside Arab workers and vice versa”. “Customers' preference” refers to the statement “In your field of work, Jewish customers prefer to receive services from Jewish rather than Arab workers”.

36
Table 7 Correlates of Arab employment
Dependent variable: Employs Arabs (1) (2) (3) (4) (5) (6) (7)
Efficiency -0.155* -0.149 -0.120 (0.084) (0.099) (0.103)
Trustworthiness -0.171* -0.006 0.042 (0.094) (0.109) (0.107)
Security threat -0.223** -0.206* -0.191 (0.089) (0.120) (0.125)
Co-workers preference -0.114 0.047 0.007 (0.092) (0.116) (0.123)
Customers preference -0.319** -0.356*** -0.296** (0.130) (0.126) (0.118)
Task fixed effects Yes Yes Yes Yes Yes Yes Yes Directory fixed effects Yes Yes Yes Yes Yes Yes Yes Sociodemographic controls No No No No No No Yes R2 0.125 0.133 0.134 0.099 0.149 0.227 0.299 Observations 102 103 102 102 104 97 94 Notes. The dependent variable is an indicator which equals 1 when the firm owner indicated that he employs Arabs and 0 otherwise. The explanatory variables are indicators capturing the participant’s agreement with a particular statement concerning Arab and Jewish workers. The indicators equal 1 when the participant agreed (strongly or otherwise) with a statement and 0 otherwise. See Table 6 for the full text of the statements. The regression in column 7 includes the same set of sociodemographic controls as in Table 3. Estimated using OLS. Robust standard errors in parentheses. *, **, *** represent statistical significance at the 10%, 5%, and 1% levels.

37
Table 8 Panel A: Midrag – summary statistics
Task
Cleaning an apartment
Moving a refrigerator
Painting an apartment
Removing a plasterboard
partition Installing an electric timer
All tasks
(1) (2) (3) (4) (5) (6) (7) (8) (9) (10) (11) (12) Solo job? No Yes No Yes No Yes No Yes No Yes No Yes # of firms 17 1 34 0 18 8 24 7 7 30 100 46 Employs Arabs? No Yes No Yes No Yes No Yes No Yes No Yes # of firms 12 5 31 3 14 4 14 10 6 1 77 23 Average Price Quote 1,527 1,250 272 250 2,645 2,688 765 568 244 220 - - Average Ratings: Overall 8.9 9.1 9.3 9.2 9.3 9.5 9.6 9.5 9.5 9.5 9.3 9.3 Quality 8.7 9.0 9.4 9.3 9.3 9.4 9.6 9.4 9.6 9.6 9.3 9.3 Price 9.0 9.1 9.3 9.2 9.5 9.2 9.5 9.3 9.3 9.3 9.3 9.2 Timeliness 9.4 9.5 9.4 9.5 9.5 9.7 9.7 9.5 9.3 9.3 9.4 9.6 Courtesy 9.4 9.4 9.4 9.4 9.6 9.7 9.7 9.6 9.5 9.7 9.5 9.5 Notes. The table reports summary statistics for firms listed in Midrag. The top two rows pertain to all firms whose owners provided a price quote, while the rows below pertain only to firms whose owners indicated that they plan to bring along or send workers to perform the task specified in the column heading.

38
Table 8 Panel B: Miktzoanim – summary statistics
Task
Cleaning an apartment
Moving a refrigerator1
Painting an apartment
Removing a plasterboard
partition Installing an
electric timer1 All
tasks (1) (2) (3) (4) (5) (6) (7) (8) (9) (10) (11) (12)
Solo job? No Yes No Yes No Yes No Yes No Yes No Yes # of firms 24 0 31 2 24 13 10 12 4 37 93 64 Employs Arabs? No Yes No Yes No Yes No Yes No Yes No Yes # of firms 20 4 28 2 12 12 5 5 3 0 68 23 Average Price Quote 1,487 1,477 304 225 2,465 2,412 1,745 1,047 224 n/a - - Average Ratings: Overall 8.4 9.5 9.1 9.3 9.6 9.6 9.7 10.0 8.8 n/a 9.0 9.6 # of Rated Firms2 13 1 23 2 9 7 4 2 3 0 52 12 Notes. The table reports summary statistics for firms listed in Miktzoanim. The top two rows pertain to all firms whose owners provided a price quote, while the rows below pertain only to firms whose owners indicated that they plan to bring along or send workers to perform the task specified in the column heading. 1 In two cases – one for the moving task and the other for the electric timer task – the firm owner cut off the conversation before we were able to ask whether he employs Arabs. 2 Unlike in Midrag, not all Miktzoanim firms have customer satisfaction ratings; the number of rated firms is indicated in the last row.

39
Table 9 Arab employment and quoted price differences
Dependent variable: Log price quote Midrag Miktzoanim Both directories (1) (2) (3) (4) (5) (6)
Employs Arabs -0.173*** -0.168*** -0.169* -0.185** -0.173*** -0.168*** (0.061) (0.061) (0.085) (0.079) (0.059) (0.059)
Average overall rating 0.048 0.054*** 0.053* (0.058) (0.018) (0.030)
Task fixed effects Yes Yes Yes Yes Yes Yes Directory fixed effects No No No No Yes Yes R2 0.953 0.953 0.959 0.964 0.952 0.953 Observations 100 100 64 64 164 164 Notes. The dependent variable is the natural log of the price quotes we received from service providers. “Employs Arabs” is an indicator which equals 1 when the firm owner indicated that he employs Arabs and 0 otherwise. Average overall ratings are on a zero to ten scale. Columns 1 and 2 use only providers listed in Midrag; columns 3 and 4 use only providers listed in Miktzoanim; columns 5 and 6 use providers listed in both directories. Each firm (observation) is weighted by the number of customer reviews it had on the website. Estimated using OLS. Robust standard errors in parentheses. *, **, *** represent statistical significance at the 10%, 5%, and 1% levels.

40
Figure 1 – Project Timeline
January 2015 April 2015 August 2015 October 2015 May 2015
Collected firms' contact information and ratings from internet websites.
Contacted firm owners to obtain price quotes and inquire about the employment of Arab workers.
December 2015
Conducted a nominally-independent telephone survey of firm owners.
Surveyed about 2,000 adult Jewish individuals using a random sample from the country’s landline telephone directory.
On October 1st 2015, a wave of ethnic violence erupted in Israel and the Occupied Territories.

1
ONLINE APPENDIX Customer Discrimination: Evidence from Israel
Revital Bar and Asaf Zussman

2
Appendix A: Becker's Customer Discrimination Model
In this appendix we present Becker’s customer discrimination model using mathematical
notation (while adopting it to the Israeli context).1 The model assumes that all markets are
perfectly competitive. There are two groups of workers, denoted by 𝐽𝐽 and 𝐴𝐴: 𝐽𝐽 refers to
Jewish workers and 𝐴𝐴 refers to Arab workers. Workers from the two groups have the same
productivity.
Customers in the market for services are assumed to be Jewish and to vary in their prejudice
toward Arab workers: the disutility customers incur by receiving the service from Arab
workers is captured by a parameter, 𝑑𝑑. From the perspective of customer 𝑖𝑖, the utility-
adjusted price of the service is 𝑃𝑃𝐽𝐽 when it is provided by Jewish workers but 𝑃𝑃𝐴𝐴(1 + 𝑑𝑑𝑖𝑖)
when it is provided by Arab workers. Customer 𝑖𝑖 is thus indifferent between receiving the
service from Arab or Jewish workers when 𝑃𝑃𝐴𝐴(1 + 𝑑𝑑𝑖𝑖) = 𝑃𝑃𝐽𝐽 .
Equilibrium outcomes depend on the distribution of the disutility parameter and on the
number of Arab relative to Jewish workers. In a non-discriminatory environment, i.e. when
𝑑𝑑𝑖𝑖 = 0 for all customers, all workers earn the same competitive equilibrium wage rate 𝑤𝑤.
For a given number of Arab and Jewish workers, an increase in the number of
discriminatory customers – or an increase in the strength of their taste for discrimination –
would tend to reduce the relative demand for Arab workers and therefore their relative
wage, so that 𝑤𝑤𝐴𝐴 < 𝑤𝑤𝐽𝐽.
Assuming for simplicity that one unit of labor is required to produce one unit of the service,
profit maximizing employers would be indifferent between hiring Arab and Jewish workers
as long as 𝑃𝑃𝐴𝐴 − 𝑤𝑤𝐴𝐴 = 𝑃𝑃𝐽𝐽 − 𝑤𝑤𝐽𝐽. Thus in equilibrium, in addition to the wage differential
there would be an equal price differential: 𝑃𝑃𝐴𝐴 − 𝑃𝑃𝐽𝐽 = 𝑤𝑤𝐴𝐴 − 𝑤𝑤𝐽𝐽 < 0. Such an equilibrium
would be characterized by ethnic segregation: firms that cater to discriminatory customers
will hire only Jewish workers, pay higher wages, and charge higher prices than firms that
employ Arab workers and that serve non-discriminatory customers. The equilibrium wage
1 A more detailed discussion of the implications of customer discrimination is provided by Lawrence M.
Kahn, 1991, “Customer Discrimination and Affirmative Action,” Economic Enquiry, 29(3): 555-571.

3
and price differentials would be equal to the disutility parameter of the “marginal
discriminator”, the customer who is just indifferent between receiving the service from
Arab or Jewish workers. Customers more prejudiced than the “marginal discriminator”
would be served only by firms employing Jews; customers less prejudiced than the
“marginal discriminator” would be served only by firms employing Arabs.
It is important to emphasize that if the share of non-discriminatory Jewish customers is
sufficiently large or the relative supply of Arab workers is sufficiently low, in equilibrium
there would no wage gap and no price differential. All firms would pay the same wage and
charge the same price, but Arab workers would be employed only in firms that serve non-
discriminatory customers.

4
Appendix B: Wage Gaps between Arab and Jewish Workers
Table B1 Dependent variable: log hourly wage (1) (2) (3) (4)
Arab -0.427*** -0.477*** -0.296*** -0.171*** (0.027) (0.029) (0.028) (0.027)
Socio-demographic controls No Yes Yes Yes Education No No Yes Yes Sector and occupation FEs No No No Yes R2 0.058 0.173 0.350 0.439 Observations 3,412 3,401 3,401 3,401 Source. Israeli Central Bureau of Statistics, 2013 Income Survey. Notes. Hourly wage is calculated by dividing the average monthly gross salary by the average monthly number of hours worked. The sample is restricted to prime working age (25-54) men employed full time. Socio-demographic characteristics include indicators for age group, for being married and for being a new immigrant (immigrated to Israel since 1989). Education is controlled for by a set of indicators for highest diploma received. Estimated using OLS. Robust standard errors in parentheses. *, **, *** represent statistical significance at the 10%, 5%, and 1% levels.

5
Appendix C: Survey of Customers
This appendix contains the text of the telephone survey of Jewish customers. Text in bold
face was read out loud to the survey participant. Text in brackets provides additional
information.
Hello, this is [name of research assistant] calling from The Hebrew University of
Jerusalem. We are conducting a short survey for research purposes. Your answers
will be kept secret. You can refuse to answer any question. I would appreciate your
participation.
Gender [identified from conversation]: male / female
I will now ask you a few background questions:
• How old are you?
• In which country were you born?
• [If participant was born in Israel] In which country was your father born?
• [If participant was not born in Israel] In what year did you emigrate to Israel?
• What is the highest diploma or degree that you have earned in your studies? up
to and including high-school / post-secondary, non-academic / bachelor’s degree /
master’s degree / doctoral degree / other
• Do you consider yourself: secular / traditional / religious / haredi [ultra-orthodox]?
• In which locality do you reside?
• Are you: married / single / divorced / widowed?
• How many children do you have?
• Are you: self-employed / salaried employee / unemployed
• The mean net monthly income for an Israeli family is NIS 14,600. Is your family’s
income: higher than / roughly equal to / less than NIS 14,600?

6
Assume that your apartment needs re-painting and you consider hiring a professional
firm to do the job. The firm owner, who is Jewish, can send a team of either Jewish
or Arab workers.
• Which team do you think will do a higher quality job?
a team of Jewish workers / a team of Arab workers / no difference
• Which team do you think is more likely to complete the job on schedule?
a team of Jewish workers / a team of Arab workers / no difference
• Which team do you think will provide a more courteous service?
a team of Jewish workers / a team of Arab workers / no difference
• Which team do you think poses a lower threat for your safety and the safety of
your family?
a team of Jewish workers / a team of Arab workers / no difference
Imagine that the firm owner proposes to send you a team of Arab workers to perform
the job for NIS 1,000.
• Would you be willing to pay a price higher than NIS 1,000 for the job to be
performed by a team of Jewish workers?
yes / no
• If yes, how much would you be willing to pay for the job to be performed by a
team of Jewish workers?
• Have you ever used the internet websites Midrag or Miktzoanim to contact a
service provider?
neither website / Midrag / Miktzoanim / both websites
Thank you very much.

7
Appendix D: Survey of Firm Owners
This appendix contains the text of the telephone survey of firm owners. Text in bold face
was read out loud to the survey participant. Text in brackets provides additional
information.
Hello, this is [name of research assistant] calling from The Hebrew University of
Jerusalem. We are conducting a short survey for research purposes. Your answers
will be kept secret. You can refuse to answer any question. I would appreciate your
participation.
Gender [identified from conversation]: male / female
I will now ask you a few background questions:
• How old are you?
• In which country were you born?
• [If participant was born in Israel] In which country was your father born?
• [If participant was not born in Israel] In what year did you emigrate to Israel?
• What is the highest diploma or degree that you have earned in your studies? up
to high-school, without a certificate of matriculation / up to high-school, with a
certificate of matriculation / post-secondary, non-academic / academic degree /
other
• Do you consider yourself: secular / traditional / religious / haredi [ultra-orthodox]?
• In which locality do you reside?
• Are you: married / single / divorced / widowed?
• How many children do you have?
• The mean net monthly income for an Israeli family is NIS 14,600. Is your family’s
income: higher than / roughly equal to / less than NIS 14,600?

8
• Are you: self-employed / salaried employee / unemployed
ο [If participant is self-employed or a salaried employee] What is your field of
work?
Our research deals with characteristics of Jewish and Arab workers. For each of the
following statements, I will ask you to rank your agreement with the statement in a
scale of 1 to 4, where 1 means strongly agree, 2 means agree, 3 means somewhat
disagree and 4 means strongly disagree.
1. “In your field of work, Jewish workers are more efficient than Arab workers”
strongly agree / agree / somewhat disagree / strongly disagree
2. “In your field of work, Jewish workers are more trustworthy than Arab workers”
strongly agree / agree / somewhat disagree / strongly disagree
3. “In your field of work, Jewish workers pose a lower threat for the safety of the
employer than Arab workers”
strongly agree / agree / somewhat disagree / strongly disagree
4. “In your field of work, Jewish workers prefer not to work alongside Arab workers
and vice versa”
strongly agree / agree / somewhat disagree / strongly disagree
5. “In your field of work, Jewish customers prefer to receive services from Jewish
rather than Arab workers”
strongly agree / agree / somewhat disagree / strongly disagree
Thank you very much.

9
Appendix E: Additional Results
Table E1 Correlates of customer willingness to pay a premium – before the outbreak of violence
Dependent variable: will pay a premium for a Jewish team (1) (2) (3) (4) (5)
Quality 0.536*** 0.239*** (0.035) (0.048)
Timeliness 0.442*** 0.106** (0.039) (0.049)
Courtesy 0.479*** 0.109** (0.038) (0.051)
Safety 0.487*** 0.332*** (0.025) (0.031)
Sociodemographic controls No No No No Yes R2 0.208 0.127 0.153 0.261 0.374 Observations 932 929 929 924 860 Notes. Results in this table are based on surveys conducted during August-September 2015, i.e. before the outbreak of violence. The dependent variable is an indicator which equals 1 if the participant stated that he would be willing to pay a premium to receive the service from a Jewish rather than an Arab team and 0 otherwise. The independent variables are indicators capturing participants’ beliefs concerning Jewish and Arab workers. The indicators equal 1 when the participant believes that the Jewish team will outperform the Arab team in a specific domain and 0 otherwise (see Table 2 for the full text of the questions). The regression in column 5 includes the same set of sociodemographic controls as in Table 3. Estimated using OLS. Robust standard errors in parentheses. *, **, *** represent statistical significance at the 10%, 5%, and 1% levels.

10
Table E2 Correlates of customer willingness to pay a premium – during the violent period
Dependent variable: will pay a premium for a Jewish team (1) (2) (3) (4) (5)
Quality 0.555*** 0.203*** (0.028) (0.045)
Timeliness 0.437*** -0.020 (0.033) (0.041)
Courtesy 0.573*** 0.227*** (0.028) (0.046)
Safety 0.572*** 0.376*** (0.022) (0.030)
Sociodemographic controls No No No No Yes R2 0.260 0.148 0.260 0.311 0.460 Observations 1,034 1,013 1,027 1,041 906 Notes. Results in this table are based on surveys conducted during October-December 2015, i.e. after the outbreak of violence. The dependent variable is an indicator which equals 1 if the participant stated that he would be willing to pay a premium to receive the service from a Jewish rather than an Arab team and 0 otherwise. The independent variables are indicators capturing participants’ beliefs concerning Jewish and Arab workers. The indicators equal 1 when the participant believes that the Jewish team will outperform the Arab team in a specific domain and 0 otherwise (see Table 2 for the full text of the questions). The regression in column 5 includes the same set of sociodemographic controls as in Table 3. Estimated using OLS. Robust standard errors in parentheses. *, **, *** represent statistical significance at the 10%, 5%, and 1% levels.
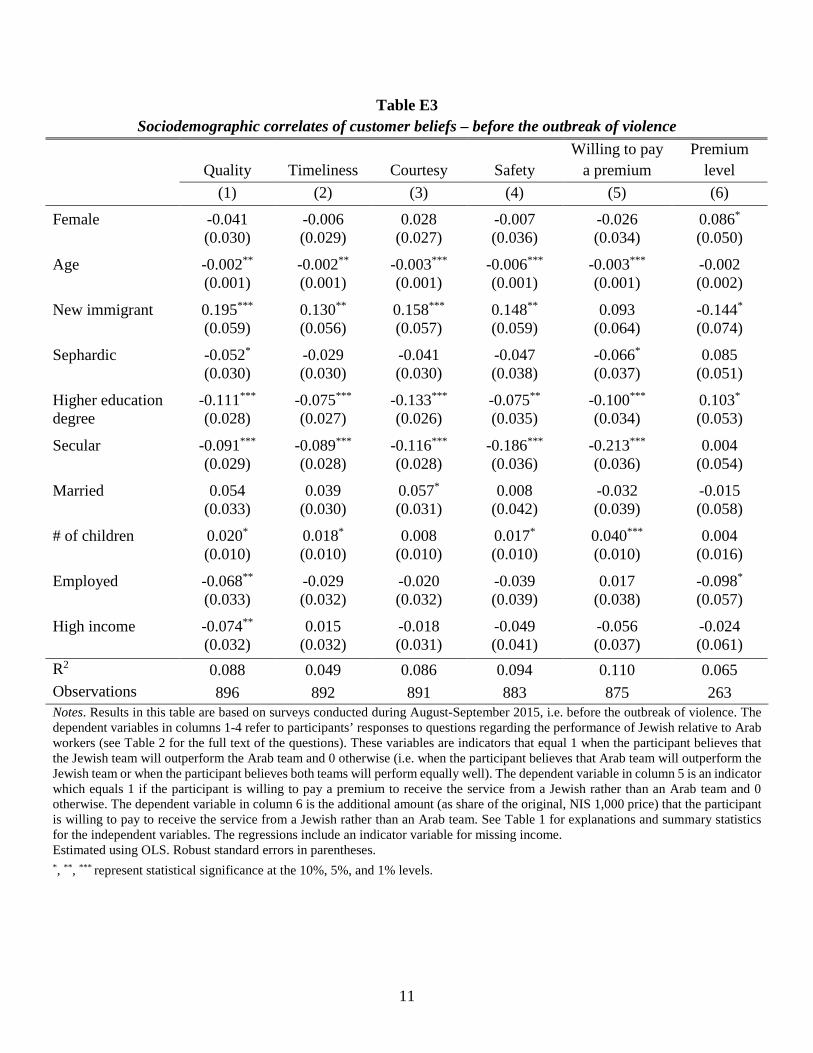
11
Table E3 Sociodemographic correlates of customer beliefs – before the outbreak of violence
Quality Timeliness Courtesy Safety Willing to pay
a premium Premium
level (1) (2) (3) (4) (5) (6)
Female -0.041 -0.006 0.028 -0.007 -0.026 0.086* (0.030) (0.029) (0.027) (0.036) (0.034) (0.050)
Age -0.002** -0.002** -0.003*** -0.006*** -0.003*** -0.002 (0.001) (0.001) (0.001) (0.001) (0.001) (0.002)
New immigrant 0.195*** 0.130** 0.158*** 0.148** 0.093 -0.144* (0.059) (0.056) (0.057) (0.059) (0.064) (0.074)
Sephardic -0.052* -0.029 -0.041 -0.047 -0.066* 0.085 (0.030) (0.030) (0.030) (0.038) (0.037) (0.051)
Higher education degree
-0.111*** -0.075*** -0.133*** -0.075** -0.100*** 0.103* (0.028) (0.027) (0.026) (0.035) (0.034) (0.053)
Secular -0.091*** -0.089*** -0.116*** -0.186*** -0.213*** 0.004 (0.029) (0.028) (0.028) (0.036) (0.036) (0.054)
Married 0.054 0.039 0.057* 0.008 -0.032 -0.015 (0.033) (0.030) (0.031) (0.042) (0.039) (0.058)
# of children 0.020* 0.018* 0.008 0.017* 0.040*** 0.004 (0.010) (0.010) (0.010) (0.010) (0.010) (0.016)
Employed -0.068** -0.029 -0.020 -0.039 0.017 -0.098* (0.033) (0.032) (0.032) (0.039) (0.038) (0.057)
High income -0.074** 0.015 -0.018 -0.049 -0.056 -0.024 (0.032) (0.032) (0.031) (0.041) (0.037) (0.061)
R2 0.088 0.049 0.086 0.094 0.110 0.065 Observations 896 892 891 883 875 263 Notes. Results in this table are based on surveys conducted during August-September 2015, i.e. before the outbreak of violence. The dependent variables in columns 1-4 refer to participants’ responses to questions regarding the performance of Jewish relative to Arab workers (see Table 2 for the full text of the questions). These variables are indicators that equal 1 when the participant believes that the Jewish team will outperform the Arab team and 0 otherwise (i.e. when the participant believes that Arab team will outperform the Jewish team or when the participant believes both teams will perform equally well). The dependent variable in column 5 is an indicator which equals 1 if the participant is willing to pay a premium to receive the service from a Jewish rather than an Arab team and 0 otherwise. The dependent variable in column 6 is the additional amount (as share of the original, NIS 1,000 price) that the participant is willing to pay to receive the service from a Jewish rather than an Arab team. See Table 1 for explanations and summary statistics for the independent variables. The regressions include an indicator variable for missing income. Estimated using OLS. Robust standard errors in parentheses. *, **, *** represent statistical significance at the 10%, 5%, and 1% levels.

12
Table E4 Sociodemographic correlates of customer beliefs – during the violent period
Quality Timeliness Courtesy Safety Willing to pay
a premium Premium
level (1) (2) (3) (4) (5) (6)
Female 0.047* 0.022 0.051* 0.033 0.093*** -0.011 (0.027) (0.027) (0.027) (0.033) (0.031) (0.103)
Age -0.001 -0.002 -0.004*** -0.005*** -0.000 -0.002 (0.001) (0.001) (0.001) (0.001) (0.001) (0.003)
New immigrant 0.252*** 0.216*** 0.179*** 0.136*** 0.140*** 0.087 (0.055) (0.055) (0.054) (0.048) (0.054) (0.133)
Sephardic 0.055* 0.037 0.029 0.046 0.048 0.129* (0.032) (0.032) (0.031) (0.033) (0.035) (0.071)
Higher education degree
-0.044 -0.061** -0.080*** 0.014 -0.014 -0.002 (0.028) (0.028) (0.027) (0.031) (0.032) (0.072)
Secular -0.200*** -0.110*** -0.185*** -0.169*** -0.247*** 0.053 (0.031) (0.030) (0.029) (0.033) (0.034) (0.090)
Married -0.061* -0.032 -0.043 0.003 0.005 0.180** (0.033) (0.034) (0.032) (0.038) (0.038) (0.081)
# of children 0.048*** 0.046*** 0.050*** 0.025*** 0.045*** -0.001 (0.009) (0.009) (0.009) (0.008) (0.009) (0.014)
Employed -0.004 0.010 -0.034 0.022 0.064* 0.058 (0.033) (0.032) (0.030) (0.035) (0.034) (0.077)
High income -0.083*** -0.068** -0.074*** -0.050 -0.072** -0.127 (0.030) (0.031) (0.029) (0.037) (0.034) (0.080)
R2 0.173 0.113 0.183 0.104 0.165 0.047 Observations 991 960 976 989 984 335 Notes. Results in this table are based on surveys conducted during October-December 2015, i.e. after the outbreak of violence. The dependent variables in columns 1-4 refer to participants’ responses to questions regarding the performance of Jewish relative to Arab workers (see Table 2 for the full text of the questions). These variables are indicators that equal 1 when the participant believes that the Jewish team will outperform the Arab team and 0 otherwise (i.e. when the participant believes that Arab team will outperform the Jewish team or when the participant believes both teams will perform equally well). The dependent variable in column 5 is an indicator which equals 1 if the participant is willing to pay a premium to receive the service from a Jewish rather than an Arab team and 0 otherwise. The dependent variable in column 6 is the additional amount (as share of the original, NIS 1,000 price) that the participant is willing to pay to receive the service from a Jewish rather than an Arab team. See Table 1 for explanations and summary statistics for the independent variables. The regressions include an indicator variable for missing income. Estimated using OLS. Robust standard errors in parentheses. *, **, *** represent statistical significance at the 10%, 5%, and 1% levels.

13
Table E5 Sociodemographic correlates of customer beliefs – using ordered logit
Quality Timeliness Courtesy Safety (1) (2) (3) (4)
Female 0.047 0.056 0.325*** 0.090 (0.107) (0.108) (0.105) (0.110)
Age -0.002 -0.003 -0.015*** -0.024*** (0.004) (0.004) (0.003) (0.004)
New immigrant 1.074*** 0.980*** 0.829*** 0.669*** (0.189) (0.174) (0.187) (0.206)
Sephardic -0.034 -0.087 -0.077 -0.035 (0.118) (0.122) (0.112) (0.118)
Higher education degree -0.224** -0.190* -0.331*** -0.118 (0.105) (0.106) (0.100) (0.109)
Secular -0.716*** -0.487*** -0.830*** -0.805*** (0.113) (0.114) (0.106) (0.113)
Married -0.046 0.053 0.045 0.022 (0.121) (0.127) (0.119) (0.129)
# of children 0.162*** 0.168*** 0.140*** 0.112*** (0.034) (0.034) (0.032) (0.036)
Employed -0.157 0.054 -0.224** -0.046 (0.120) (0.124) (0.112) (0.124)
High income -0.345*** -0.169 -0.252** -0.232* (0.121) (0.122) (0.113) (0.124)
Violent period 0.160 0.379*** 0.425*** 0.320*** (0.097) (0.100) (0.095) (0.100)
Pseudo R2 0.055 0.041 0.066 0.073 Observations 1,887 1,852 1,867 1,872 Notes. The dependent variables refer to participants’ responses to questions regarding the performance of Jewish relative to Arab workers (see Table 2 for the full text of the questions). These categorical variables equal 1 when the participant believes that the Arab team will outperform the Jewish team, 2 when the participant believes that the Arab and Jewish teams will perform equally well and 3 when the participant believes that the Jewish team will outperform the Arab team. See Table 1 for explanations and summary statistics for the independent variables. The regressions include an indicator variable for missing income. The variable “violent period” is an indicator that equals 1 if the survey was conducted since October 1st 2015 and 0 otherwise. Estimated using Ordered Logit. Robust standard errors in parentheses.
*, **, *** represent statistical significance at the 10%, 5%, and 1% levels.

14
Table E6 Customer beliefs and willingness to pay a premium for Jewish labor – restricted sample
Panel A: Customer beliefs, by period
Before violent period
During violent period Difference
N - total (before violent
period) (1) (2) (3) (4)
Quality Jewish team 0.165 0.271 0.106** 255 (0.373) (0.446) (0.051) (115)
Same 0.730 0.671 -0.059 (0.446) (0.471) (0.058)
Arab team 0.104 0.057 -0.047 (0.307) (0.233) (0.035)
Timeliness Jewish team 0.139 0.217 0.078 253 (0.348) (0.414) (0.048) (115)
Same 0.739 0.688 -0.051 (0.441) (0.465) (0.057)
Arab team 0.122 0.094 -0.028 (0.328) (0.293) (0.040)
Courtesy Jewish team 0.148 0.221 0.073 251 (0.356) (0.416) (0.049) (115)
Same 0.635 0.610 -0.024 (0.484) (0.489) (0.062)
Arab team 0.217 0.169 -0.048 (0.414) (0.376) (0.050)
Safety Jewish team 0.584 0.743 0.159*** 253 (0.495) (0.439) (0.060) (113)
Same 0.407 0.257 -0.150** (0.493) (0.439) (0.059)
Arab team 0.009 0 -0.009 (0.094) (.000) (0.009)

15
Panel B: Willingness to pay a premium, by period
Before violent period
During Violent period Difference
N - total (before violent
period) (1) (2) (3) (4)
Willing to pay a premium 0.339 0.413 0.074 250 (0.476) (0.494) (0.062) (112)
Premium level .0 380 .0 639 0.259** 79 (0.297) (0.579) (0.101) (35)
Notes. Results in this table are based on surveys of participants who stated that they are familiar with one or both of the internet websites Midrag and Miktzoanim. The table summarizes responses to a hypothetical scenario presented to survey participants where they had to compare the performance of an Arab team and a Jewish team in providing a particular service (Panel A) and to state whether they are willing to pay a premium to receive the service from the Jewish team (Panel B). Panel A: “Quality” refers to the question “which team do you think will do a higher quality job?”. “Timeliness” refers to the question “which team do you think is more likely to complete the job on schedule?”. “Courtesy” refers to the question “which team do you think will provide a more courteous service?”. “Safety” refers to the question “which team do you think poses a lower threat for your safety and the safety of your family?”. “Jewish team” is an indicator that equals 1 if the customer believes that the Jewish team will outperform the Arab team and 0 otherwise. “Same” is an indicator that equals 1 if the customer believes that both teams will perform equally well and 0 otherwise. “Arab team” is an indicator that equals 1 if the customer believes that the Arab team will outperform the Jewish team and 0 otherwise. Panel B: “Willing to pay a premium” is an indicator which equals 1 if the participant is willing to pay a premium to receive the service from the Jewish rather than the Arab team and 0 otherwise. “Premium level” is the additional amount (as share of the original, NIS 1,000, price) that the participant is willing to pay to receive the service from the Jewish rather than the Arab team. In both panels, column 1 presents the means (and standards deviations) of the responses of participants surveyed during August-September 2015. Column 2 presents the means (and standards deviations) of the responses of participants surveyed during October-December 2015. Column 3 presents coefficients (and standards errors) for the indicator variable “violent period” (which equals 1 for surveys conducted since October 1st, 2015 and 0 otherwise) when each of the indicators representing the participants’ answers is regressed on it. Columns 3 is estimated using OLS. Robust standard errors in parentheses. *, **, *** represent statistical significance at the 10%, 5%, and 1% levels.

16
Table E7 Politically motivated violence and customer beliefs – a “difference-in-differences” analysis
Quality Timeliness Courtesy Safety Willing to pay
a premium Premium
level (1) (2) (3) (4) (5) (6)
Violent period 0.054** 0.030 0.058*** 0.062** 0.028 0.137 (0.026) (0.026) (0.021) (0.028) (0.031) (0.087)
Treated locality x violent period 0.123*** 0.174*** 0.059 0.036 0.173*** -0.095 (0.044) (0.047) (0.063) (0.059) (0.044) (0.116)
Locality fixed effects Yes Yes Yes Yes Yes Yes Sociodemographic controls Yes Yes Yes Yes Yes Yes R2 0.271 0.236 0.287 0.294 0.293 0.239 Observations 1,887 1,852 1,867 1,872 1,859 598 Notes. Results in this table are based on surveys conducted during August-December 2015. The dependent variables in columns 1-4 refer to participants’ responses to questions regarding the performance of Jewish relative to Arab workers (see Table 2 for the full text of the questions). These variables are indicators that equal 1 when the participant believes that the Jewish team will outperform the Arab team and 0 otherwise (i.e. when the participant believes that Arab team will outperform the Jewish team or when the participant believes both teams will perform equally well). The dependent variable in column 5 is an indicator which equals 1 if the participant is willing to pay a premium to receive the service from a Jewish rather than an Arab team and 0 otherwise. The dependent variable in column 6 is the additional amount (as share of the original NIS 1,000 price) that the participant is willing to pay to receive the service from a Jewish rather than an Arab team. The variable “violent period” is an indicator that equals 1 if the survey was conducted since October 1st
2015 and 0 otherwise. The variable “treated locality” is an indicator that equals 1 if the survey participant resides in Jerusalem or in the West Bank, the areas that saw most attacks since the outbreak of violence. All regressions include locality fixed-effects and the same set of sociodemographic controls as in Table 3. Estimated using OLS. Robust standard errors, clustered at the locality level, in parentheses.
*, **, *** represent statistical significance at the 10%, 5%, and 1% levels.

17
Table E8 Arab employment and quoted price differences – not using weights
Dependent variable: Log price quote Midrag Miktzoanim Both directories (1) (2) (3) (4) (5) (6)
Employs Arabs -0.157* -0.154* -0.139 -0.196* -0.147** -0.185** (0.091) (0.091) (0.106) (0.115) (0.073) (0.075)
Average overall rating 0.147 0.034*** 0.047*** (0.089) (0.012) (0.015)
Task fixed effects Yes Yes Yes Yes Yes Yes Directory fixed effect No No No No Yes Yes R2 0.886 0.890 0.886 0.914 0.874 0.886 Observations 100 100 91 64 191 164 Notes. The analysis in this table is identical to that presented in Table 9, only that here we do not weigh each firm (observation) using the number of customer reviews it had on the website. The dependent variable is the natural log of the price quotes we received from service providers. “Employs Arabs” is an indicator which equals 1 when the firm owner indicated that he employs Arabs and 0 otherwise. Average overall ratings are on a zero to ten scale. Columns 1 and 2 use only providers listed in Midrag; columns 3 and 4 use only providers listed in Miktzoanim; columns 5 and 6 use providers listed in both directories. Estimated using OLS. Robust standard errors in parentheses. *, **, *** represent statistical significance at the 10%, 5%, and 1% levels.

18
Table E9 Arab employment and quoted price differences – excluding tasks
Dependent variable: Log price quote
Excluded task: Cleaning an apartment
Moving a refrigerator
Painting an apartment
Removing a plasterboard
partition
Installing an electric timer
(1) (2) (3) (4) (5) Employs Arabs -0.143** -0.187*** -0.191** -0.198*** -0.128**
(0.072) (0.062) (0.076) (0.062) (0.061)
Average overall rating 0.075* 0.048 0.049 0.042 0.060** (0.043) (0.030) (0.044) (0.029) (0.029)
Task fixed effects Yes Yes Yes Yes Yes Directory fixed effects Yes Yes Yes Yes Yes R2 0.932 0.952 0.943 0.929 0.973 Observations 133 154 105 130 134 Notes. All columns use providers listed in both directories. In each column, we exclude one task (indicated by the column heading) from the analysis. The dependent variable is the natural log of the price quotes we received from service providers. “Employs Arabs” is an indicator which equals 1 when the firm owner indicated that he employs Arabs and 0 otherwise. Average overall ratings are on a zero to ten scale. Each firm (observation) is weighted by the number of customer reviews it had on the website. Estimated using OLS. Robust standard errors in parentheses. *, **, *** represent statistical significance at the 10%, 5%, and 1% levels.

19
Table E10 Arab employment and quoted price differences – using the minimum of the price range
Dependent variable: Log price offer Midrag Miktzoanim Both directories (1) (2) (3) (4) (5) (6)
Employs Arabs -0.170*** -0.165*** -0.185** -0.201** -0.170*** -0.166*** (0.062) (0.062) (0.083) (0.077) (0.059) (0.059)
Average overall rating 0.045 0.054*** 0.052* (0.058) (0.017) (0.030)
Task fixed effects Yes Yes Yes Yes Yes Yes Directory fixed effects No No No No Yes Yes R2 0.950 0.950 0.958 0.964 0.950 0.951 Observations 100 100 64 64 164 164 Notes. The dependent variable is the natural log of the price quotes we received from service providers. In cases where the firm owner quoted a price range instead of a specific price, we use the minimum of the price range as the price quote. “Employs Arabs” is an indicator which equals 1 when the firm owner indicated that he employs Arabs and 0 otherwise. Average overall ratings are on a zero to ten scale. Columns 1 and 2 use only providers listed in Midrag; columns 3 and 4 use only providers listed in Miktzoanim; columns 5 and 6 use providers listed in both directories. Each firm (observation) is weighted by the number of customer reviews it had on the website. Estimated using OLS. Robust standard errors in parentheses. *, **, *** represent statistical significance at the 10%, 5%, and 1% levels.

20
Table E11 Arab employment and quoted price differences – using the maximum of the price range
Dependent variable: Log price offer Midrag Miktzoanim Both directories (1) (2) (3) (4) (5) (6)
Employs Arabs -0.176*** -0.171*** -0.164* -0.180** -0.176*** -0.171*** (0.061) (0.061) (0.088) (0.082) (0.059) (0.058)
Average overall rating 0.050 0.053*** 0.054* (0.058) (0.020) (0.030)
Task fixed effects Yes Yes Yes Yes Yes Yes Directory fixed effects No No No No Yes Yes R2 0.954 0.954 0.959 0.964 0.953 0.954 Observations 100 100 64 64 164 164 Notes. The dependent variable is the natural log of the price quotes we received from service providers. In cases where the firm owner quoted a price range instead of a specific price, we use the maximum of the price range as the price quote. “Employs Arabs” is an indicator which equals 1 when the firm owner indicated that he employs Arabs and 0 otherwise. Average overall ratings are on a zero to ten scale. Columns 1 and 2 use only providers listed in Midrag; columns 3 and 4 use only providers listed in Miktzoanim; columns 5 and 6 use providers listed in both directories. Each firm (observation) is weighted by the number of customer reviews it had on the website. Estimated using OLS. Robust standard errors in parentheses. *, **, *** represent statistical significance at the 10%, 5%, and 1% levels.

21
Appendix F: Supplemental Customer Survey
This appendix contains the text and the main results of a supplemental survey of customers.
The survey was conducted in August 2016 by a leading Israeli provider of online data
collection services. It is based on a representative sample of 525 Jewish adults.
The survey:
1. Assume that your apartment needs re-painting and you consider hiring a
professional firm to do the job. The firm owner, who is Jewish, can send a team of
either Jewish or Arab workers. Which team do you prefer would come to your
apartment to do the job?
a) The Jewish team
b) The Arab team
c) I do not have a preference for a specific team [for participants who chose this
option, this was the end of the survey]
2. Please specify your reasons for choosing this team:
3. Imagine that the firm owner proposes to send you a team of Arab workers to
perform the job for NIS 1,000. Would you be willing to pay a price higher than
NIS 1,000 for the job to be performed by a team of Jewish workers?
a) Yes
b) No
4. If yes, how much would you be willing to pay for the job to be performed by a
team of Jewish workers?
Thank you very much.
Survey results:
In response to question 1, sixty two percent of participants expressed a preference to
receive the service from Jewish rather than Arab workers, thirty six percent expressed no
preference and only one percent (seven participants) preferred to receive the service from
Arab workers.

22
More than seventy percent of the participants who preferred to receive the service from
Jewish workers mentioned safety concerns as one of the main reasons for their preference.
A quarter mentioned job quality and less than five percent mentioned either timeliness or
courtesy. Some of the other reasons given for the preference for Jewish workers were
trustworthiness, language barriers and ideology (e.g. “charity begins at home”).
Seventy percent of the participants who expressed a preference to receive the service from
Jewish workers were willing to pay a premium to do so. The median premium level among
those participants was fifty percent and the average was fifty five percent (these
calculations exclude two outliers with extremely high premium levels).
Results of the supplemental customer survey are highly consistent with the results of the
original customer survey. Both surveys show that a significant share of Jewish customers
prefers to receive the service from Jewish workers and is willing to pay a high premium to
do so. This preference is motivated primarily by safety concerns and is much less affected
by other factors such as quality, timeliness and courtesy.
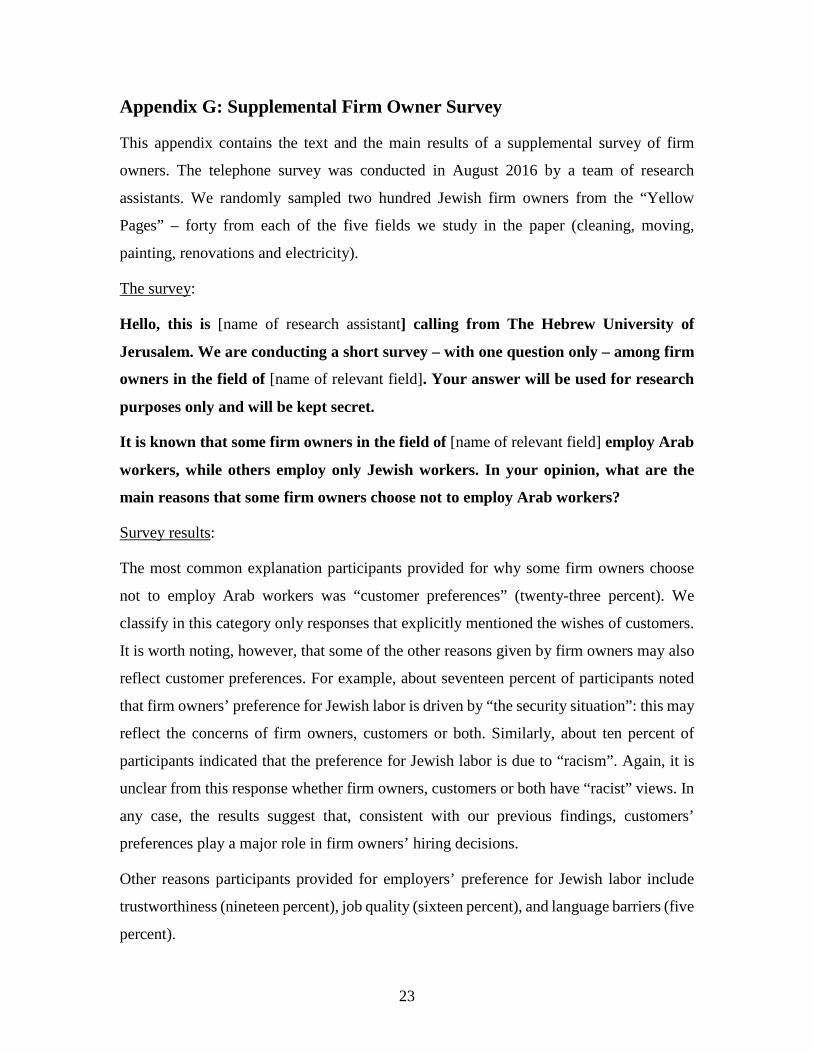
23
Appendix G: Supplemental Firm Owner Survey
This appendix contains the text and the main results of a supplemental survey of firm
owners. The telephone survey was conducted in August 2016 by a team of research
assistants. We randomly sampled two hundred Jewish firm owners from the “Yellow
Pages” – forty from each of the five fields we study in the paper (cleaning, moving,
painting, renovations and electricity).
The survey:
Hello, this is [name of research assistant] calling from The Hebrew University of
Jerusalem. We are conducting a short survey – with one question only – among firm
owners in the field of [name of relevant field]. Your answer will be used for research
purposes only and will be kept secret.
It is known that some firm owners in the field of [name of relevant field] employ Arab
workers, while others employ only Jewish workers. In your opinion, what are the
main reasons that some firm owners choose not to employ Arab workers?
Survey results:
The most common explanation participants provided for why some firm owners choose
not to employ Arab workers was “customer preferences” (twenty-three percent). We
classify in this category only responses that explicitly mentioned the wishes of customers.
It is worth noting, however, that some of the other reasons given by firm owners may also
reflect customer preferences. For example, about seventeen percent of participants noted
that firm owners’ preference for Jewish labor is driven by “the security situation”: this may
reflect the concerns of firm owners, customers or both. Similarly, about ten percent of
participants indicated that the preference for Jewish labor is due to “racism”. Again, it is
unclear from this response whether firm owners, customers or both have “racist” views. In
any case, the results suggest that, consistent with our previous findings, customers’
preferences play a major role in firm owners’ hiring decisions.
Other reasons participants provided for employers’ preference for Jewish labor include
trustworthiness (nineteen percent), job quality (sixteen percent), and language barriers (five
percent).