Embed Size (px)
Citation preview
Customer Experience Drives Revenue Growth, 2016Business Case: The Customer Experience Ecosystem Playbook
by Harley Manning and Dylan CzarneckiJune 21, 2016
For CustoMer experienCe proFessionals
foRREsTER.Com
Key takeawaysCorrelating CX To Revenue Growth Reveals The Business Value of CXCx drives three types of customer loyalty: retention, enrichment, and advocacy. increased customer loyalty in turn tends to drive increased revenue growth. But for these drivers to affect an industry, customers must be free to switch providers, and providers must offer differentiated Cx.
CX Drives Revenue Growth To Different Degrees Depending on Industry DynamicsCompanies with customers who have many equally convenient and strongly differentiated choices — like online retailers and investment firms — see major revenue upside from superior Cx. Companies with trapped customers, or little Cx differentiation from direct competitors, like traditional retailers, will see less impact on their revenue growth.
Why read this reportit’s the age of the customer, and transforming the customer experience (Cx) is one of five critical market imperatives that companies need to shift toward customer obsession. But how can customer experience professionals prove that to their executives? the proof lies in comparing the revenue growth of companies with superior customer experience to that of their direct competitors with comparatively inferior customer experience. this report details how we went about doing exactly that and the surprising results that we uncovered.
this is an update of a previously published report; Forrester reviews and updates it periodically for continued relevance and accuracy.
2
2
7
9
10
12
© 2016 Forrester research, inc. opinions reflect judgment at the time and are subject to change. Forrester®, technographics®, Forrester Wave, roleView, techradar, and total economic impact are trademarks of Forrester research, inc. all other trademarks are the property of their respective companies. unauthorized copying or distributing is a violation of copyright law. [email protected] or +1 866-367-7378
Forrester research, inc., 60 acorn park Drive, Cambridge, Ma 02140 usa+1 617-613-6000 | Fax: +1 617-613-5000 | forrester.com
table of Contents
Does Superior Customer Experience Pay Off?
Better CX Correlates With Higher Revenue Growth In Most Industries
Cable: at&t u-Verse Beats Comcast xfinity
airlines: Cx leader southwest outgrew united
investment Firms: leaders edward Jones and Charles schwab Beat laggards
retailers: superior online experience trounces the traditional retail experience
The CX/Revenue Growth Equation
How the Cx/revenue Growth equation explains the Dynamics of each industry
Craft Your Customer Experience Strategy For Growth
What it Means
CX Leaders And Laggards Will Continue To Go Their Separate Ways
Supplemental Material
notes & resources
We used Forrester’s Customer experience index, us Consumers Q3 2015, which we complemented with third-party customer satisfaction scores, to identify direct competitors with significant differences in the quality of their customer experience. We then analyzed their us securities and exchange Commission (seC) filings to build models that compared their revenue growth.
related research Documents
Customer advocacy 2014: How us Consumers rate their Financial institutions
the us Customer experience index, Q3 2015
For CustoMer experienCe proFessionals
Customer Experience Drives Revenue Growth, 2016Business Case: The Customer Experience Ecosystem Playbook
by Harley Manning and Dylan Czarneckiwith alyson Clarke, Kate McCarthy, Christopher Mines, sucharita Mulpuru, James nail, scott ross, and Kara Hartig
June 21, 2016
For Customer experienCe proFessionals
Customer Experience Drives Revenue Growth, 2016June 21, 2016
© 2016 Forrester research, inc. unauthorized copying or distributing is a violation of copyright law. [email protected] or +1 866-367-7378
2
Business Case: The Customer Experience Ecosystem Playbook
Does superior Customer experience pay off?
in 2015, we explored whether customer experience really matters to business success or whether Cx is just the latest hype. We found that superior Cx drives superior revenue growth in industries where customers are free to switch business and competitors deliver a differentiated customer experience.1 Does this finding still hold true? to find out for Cx professionals, we:
› Identified direct competitors with significant differences in CX quality. We selected pairs of publicly traded companies that compete directly for the same types of customers, where one of the competitors was an industry leader in Forrester’s Customer experience index (Cx index™) and the other lagged behind during the period of 2010 to 2015.2
› Built models that compared the growth of leaders and laggards over time. using financial data that we culled from annual reports and seC filings like Forms 10-K and 10-Q, we isolated the revenue streams for specific lines of business within large corporations and calculated the compound annual growth rate (CaGr) of their revenue from 2010 to 2015. this allowed us to compare direct competitors and determine whether or not customer experience actually correlates with growth.
Better Cx Correlates With Higher revenue Growth in Most industries
in all, we examined five industries with diverse competitive dynamics and revenue models. the only notable thing that these industries have in common is that the end user of their products or services is a consumer.
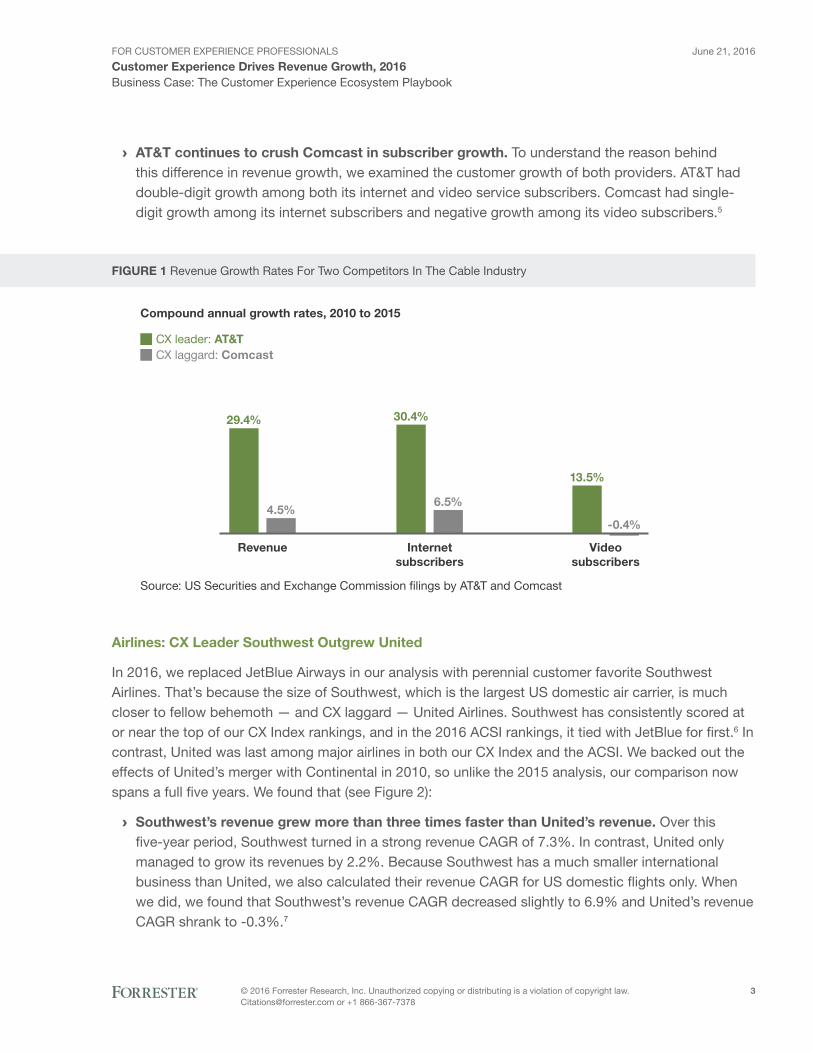
Cable: AT&T U-Verse Beats Comcast Xfinity
at&t u-verse scored near the top of Forrester’s Cx index rankings for internet service providers (isps) in Q3 2015. and although u-verse was just average as a tV service provider, it was still significantly ahead of Comcast, which was the lowest-scoring brand in both industries.3 aCsi scores confirmed these relative rankings. at&t came in first as an isp and second as a subscription tV service provider, while Comcast was last as an isp and second to last as a subscription tV service provider.
analyzing their performance was a challenge. the financials of u-verse are buried in the annual report of at&t: a massive corporation that also includes a giant wireless business. similarly, Comcast’s cable operation is just one of five business segments in Comcast’s annual reports. nonetheless, we teased out the revenue and subscriber numbers for both corporations’ cable offerings (isp plus video).4 When we compared them with each other, we found that from 2010 to 2015 (see Figure 1):
› AT&T clearly showed superior revenue growth. there was a stark contrast between the revenue growth rates of our leader and our laggard. at&t had a revenue CaGr of more than 29%. During that same period, Comcast’s revenue grew less than 5%.
For Customer experienCe proFessionals
Customer Experience Drives Revenue Growth, 2016June 21, 2016
© 2016 Forrester research, inc. unauthorized copying or distributing is a violation of copyright law. [email protected] or +1 866-367-7378
3
Business Case: The Customer Experience Ecosystem Playbook
› AT&T continues to crush Comcast in subscriber growth. to understand the reason behind this difference in revenue growth, we examined the customer growth of both providers. at&t had double-digit growth among both its internet and video service subscribers. Comcast had single-digit growth among its internet subscribers and negative growth among its video subscribers.5
fIGURE 1 revenue Growth rates For two Competitors in the Cable industry
Source: US Securities and Exchange Commission filings by AT&T and Comcast
Compound annual growth rates, 2010 to 2015
CX leader: AT&TCX laggard: Comcast
Revenue Internetsubscribers
Videosubscribers
29.4% 30.4%
13.5%
4.5%6.5%
-0.4%
Airlines: CX Leader southwest outgrew United
in 2016, we replaced JetBlue airways in our analysis with perennial customer favorite southwest airlines. that’s because the size of southwest, which is the largest us domestic air carrier, is much closer to fellow behemoth — and Cx laggard — united airlines. southwest has consistently scored at or near the top of our Cx index rankings, and in the 2016 aCsi rankings, it tied with JetBlue for first.6 in contrast, united was last among major airlines in both our Cx index and the aCsi. We backed out the effects of united’s merger with Continental in 2010, so unlike the 2015 analysis, our comparison now spans a full five years. We found that (see Figure 2):
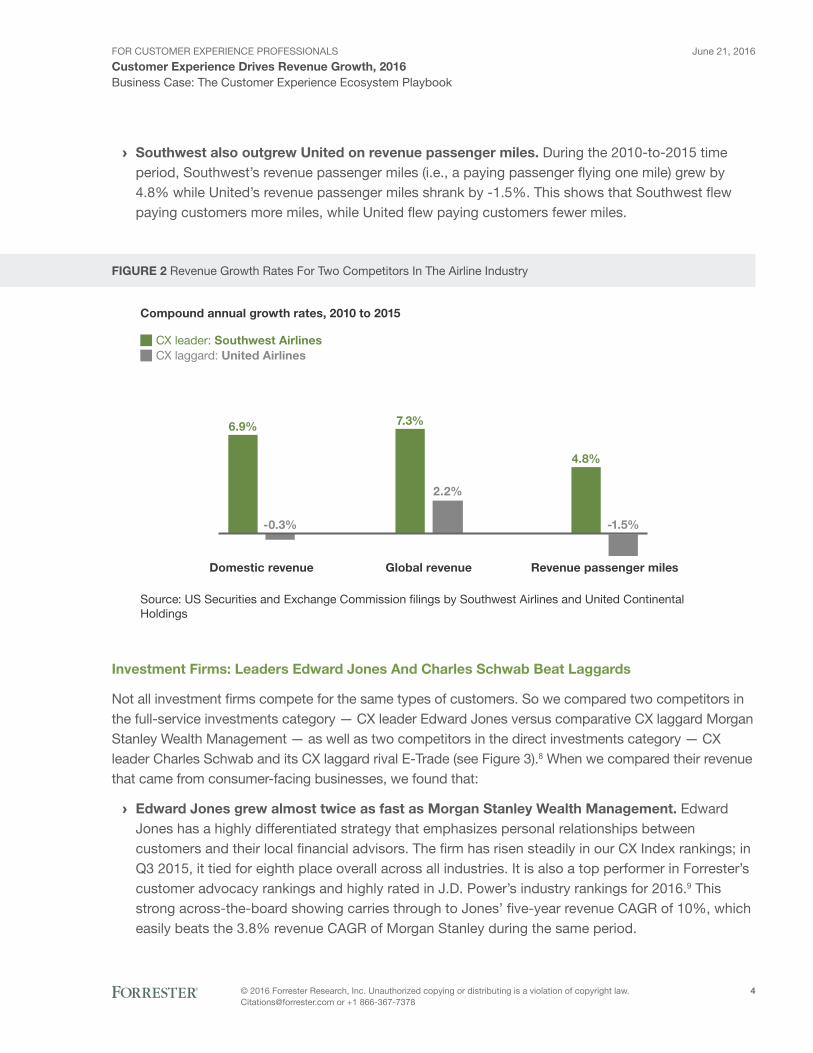
› southwest’s revenue grew more than three times faster than United’s revenue. over this five-year period, southwest turned in a strong revenue CaGr of 7.3%. in contrast, united only managed to grow its revenues by 2.2%. Because southwest has a much smaller international business than united, we also calculated their revenue CaGr for us domestic flights only. When we did, we found that southwest’s revenue CaGr decreased slightly to 6.9% and united’s revenue CaGr shrank to -0.3%.7
For Customer experienCe proFessionals
Customer Experience Drives Revenue Growth, 2016June 21, 2016
© 2016 Forrester research, inc. unauthorized copying or distributing is a violation of copyright law. [email protected] or +1 866-367-7378
4
Business Case: The Customer Experience Ecosystem Playbook
› southwest also outgrew United on revenue passenger miles. During the 2010-to-2015 time period, southwest’s revenue passenger miles (i.e., a paying passenger flying one mile) grew by 4.8% while united’s revenue passenger miles shrank by -1.5%. this shows that southwest flew paying customers more miles, while united flew paying customers fewer miles.
fIGURE 2 revenue Growth rates For two Competitors in the airline industry
Source: US Securities and Exchange Commission filings by Southwest Airlines and United ContinentalHoldings
Compound annual growth rates, 2010 to 2015
CX leader: Southwest AirlinesCX laggard: United Airlines
Domestic revenue Global revenue Revenue passenger miles
6.9% 7.3%
4.8%
-0.3%
2.2%
-1.5%
Investment firms: Leaders Edward Jones And Charles schwab Beat Laggards
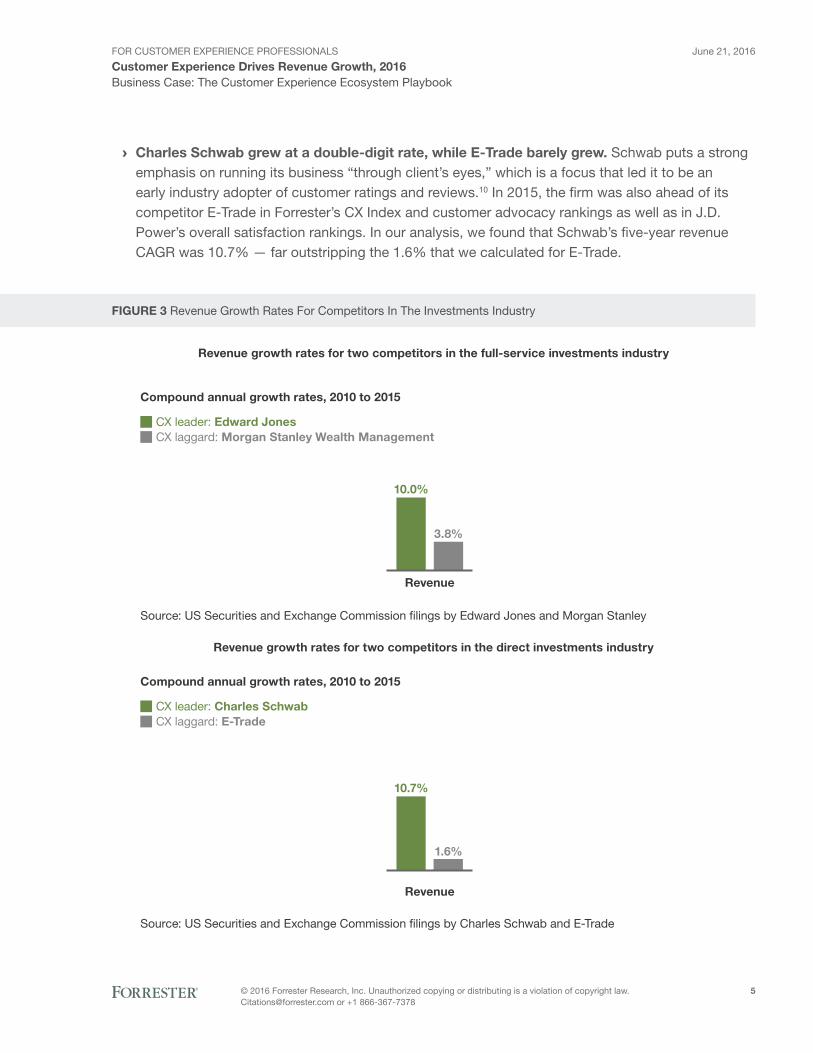
not all investment firms compete for the same types of customers. so we compared two competitors in the full-service investments category — Cx leader edward Jones versus comparative Cx laggard Morgan stanley Wealth Management — as well as two competitors in the direct investments category — Cx leader Charles schwab and its Cx laggard rival e-trade (see Figure 3).8 When we compared their revenue that came from consumer-facing businesses, we found that:
› Edward Jones grew almost twice as fast as morgan stanley Wealth management. edward Jones has a highly differentiated strategy that emphasizes personal relationships between customers and their local financial advisors. the firm has risen steadily in our Cx index rankings; in Q3 2015, it tied for eighth place overall across all industries. it is also a top performer in Forrester’s customer advocacy rankings and highly rated in J.D. power’s industry rankings for 2016.9 this strong across-the-board showing carries through to Jones’ five-year revenue CaGr of 10%, which easily beats the 3.8% revenue CaGr of Morgan stanley during the same period.
For Customer experienCe proFessionals
Customer Experience Drives Revenue Growth, 2016June 21, 2016
© 2016 Forrester research, inc. unauthorized copying or distributing is a violation of copyright law. [email protected] or +1 866-367-7378
5
Business Case: The Customer Experience Ecosystem Playbook
› Charles schwab grew at a double-digit rate, while E-Trade barely grew. schwab puts a strong emphasis on running its business “through client’s eyes,” which is a focus that led it to be an early industry adopter of customer ratings and reviews.10 in 2015, the firm was also ahead of its competitor e-trade in Forrester’s Cx index and customer advocacy rankings as well as in J.D. power’s overall satisfaction rankings. in our analysis, we found that schwab’s five-year revenue CaGr was 10.7% — far outstripping the 1.6% that we calculated for e-trade.
fIGURE 3 revenue Growth rates For Competitors in the investments industry
Source: US Securities and Exchange Commission filings by Edward Jones and Morgan Stanley
Source: US Securities and Exchange Commission filings by Charles Schwab and E-Trade
Revenue growth rates for two competitors in the full-service investments industry
Revenue growth rates for two competitors in the direct investments industry
Compound annual growth rates, 2010 to 2015
Compound annual growth rates, 2010 to 2015
CX leader: Edward JonesCX laggard: Morgan Stanley Wealth Management
CX leader: Charles SchwabCX laggard: E-Trade
Revenue
Revenue
1.6%
10.7%
10.0%
3.8%
For Customer experienCe proFessionals
Customer Experience Drives Revenue Growth, 2016June 21, 2016
© 2016 Forrester research, inc. unauthorized copying or distributing is a violation of copyright law. [email protected] or +1 866-367-7378
6
Business Case: The Customer Experience Ecosystem Playbook
Retailers: superior online Experience Trounces The Traditional Retail Experience
in retail, most direct competitors have undifferentiated customer experiences. For example, Costco and sam’s Club have Cx index scores that are virtually identical. the same is true for JCpenney and Macy’s, Home Depot and lowe’s, as well as many other large retailers that go head to head.11 this Cx parity stopped us from making the direct comparisons between Cx leaders and Cx laggards that we did in other industries.
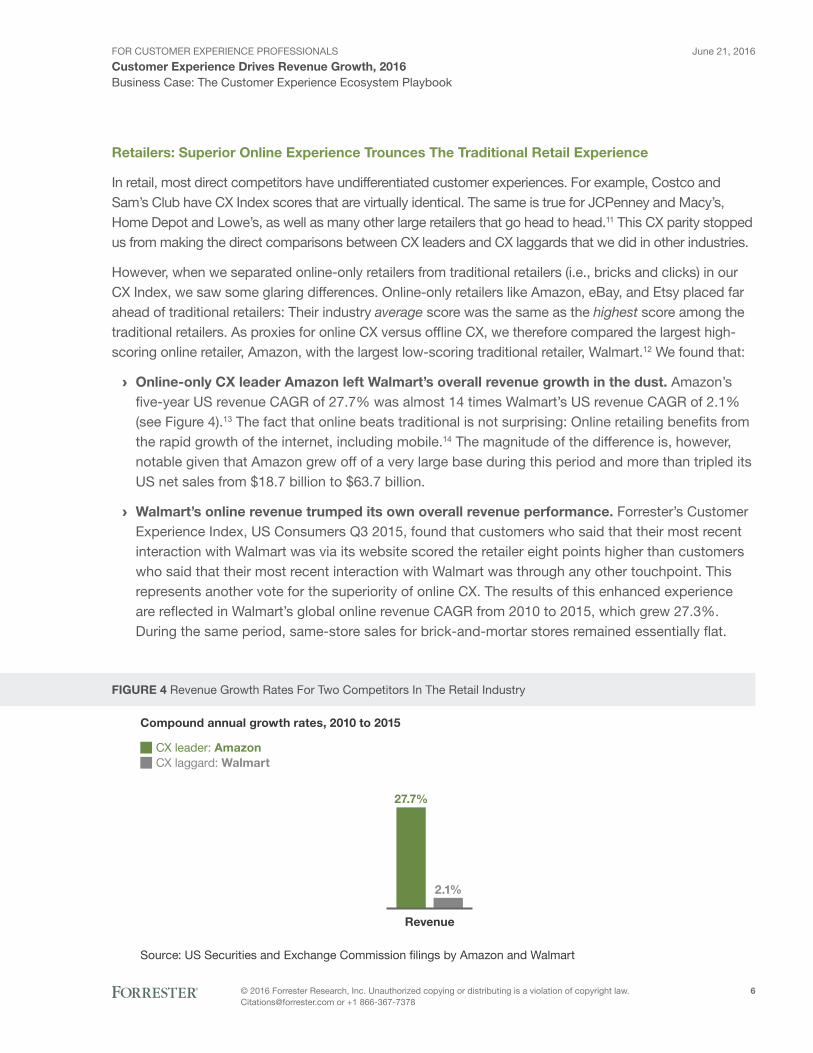
However, when we separated online-only retailers from traditional retailers (i.e., bricks and clicks) in our Cx index, we saw some glaring differences. online-only retailers like amazon, eBay, and etsy placed far ahead of traditional retailers: their industry average score was the same as the highest score among the traditional retailers. as proxies for online Cx versus offline Cx, we therefore compared the largest high-scoring online retailer, amazon, with the largest low-scoring traditional retailer, Walmart.12 We found that:
› online-only CX leader Amazon left Walmart’s overall revenue growth in the dust. amazon’s five-year us revenue CaGr of 27.7% was almost 14 times Walmart’s us revenue CaGr of 2.1% (see Figure 4).13 the fact that online beats traditional is not surprising: online retailing benefits from the rapid growth of the internet, including mobile.14 the magnitude of the difference is, however, notable given that amazon grew off of a very large base during this period and more than tripled its us net sales from $18.7 billion to $63.7 billion.
› Walmart’s online revenue trumped its own overall revenue performance. Forrester’s Customer experience index, us Consumers Q3 2015, found that customers who said that their most recent interaction with Walmart was via its website scored the retailer eight points higher than customers who said that their most recent interaction with Walmart was through any other touchpoint. this represents another vote for the superiority of online Cx. the results of this enhanced experience are reflected in Walmart’s global online revenue CaGr from 2010 to 2015, which grew 27.3%. During the same period, same-store sales for brick-and-mortar stores remained essentially flat.
fIGURE 4 revenue Growth rates For two Competitors in the retail industry
Source: US Securities and Exchange Commission filings by Amazon and Walmart
Compound annual growth rates, 2010 to 2015
CX leader: AmazonCX laggard: Walmart
Revenue
27.7%
2.1%
For Customer experienCe proFessionals
Customer Experience Drives Revenue Growth, 2016June 21, 2016
© 2016 Forrester research, inc. unauthorized copying or distributing is a violation of copyright law. [email protected] or +1 866-367-7378
7
Business Case: The Customer Experience Ecosystem Playbook
the Cx/revenue Growth equation
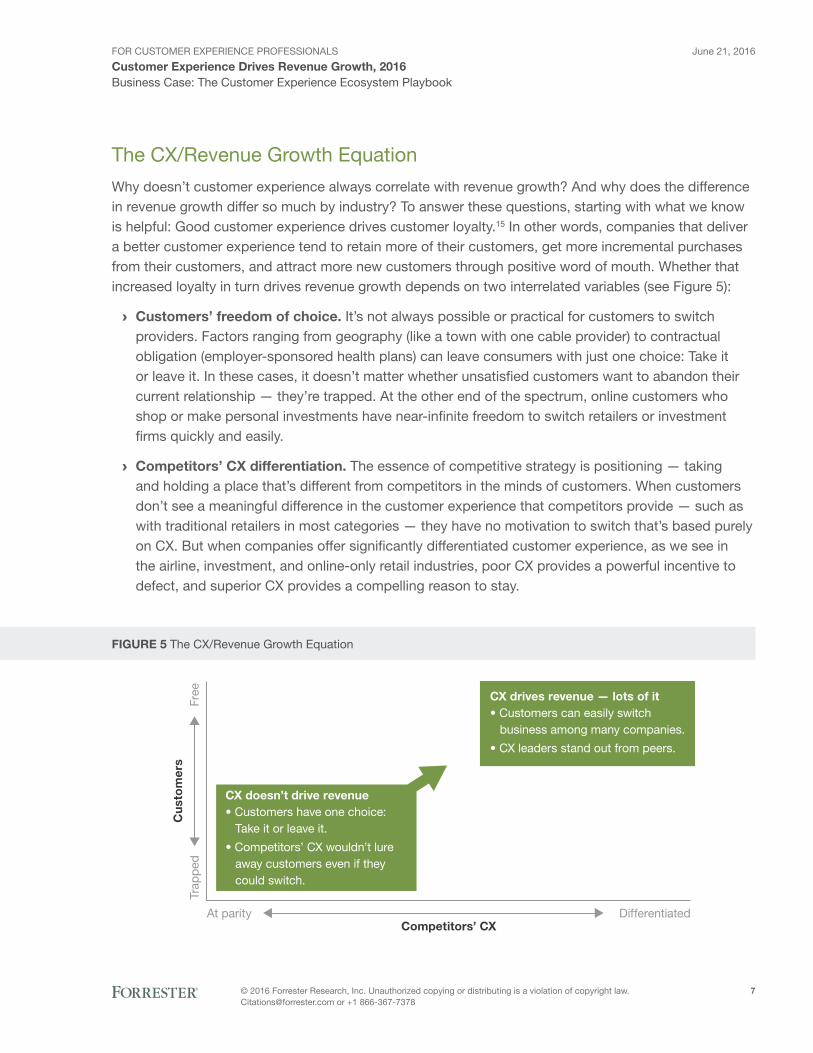
Why doesn’t customer experience always correlate with revenue growth? and why does the difference in revenue growth differ so much by industry? to answer these questions, starting with what we know is helpful: Good customer experience drives customer loyalty.15 in other words, companies that deliver a better customer experience tend to retain more of their customers, get more incremental purchases from their customers, and attract more new customers through positive word of mouth. Whether that increased loyalty in turn drives revenue growth depends on two interrelated variables (see Figure 5):
› Customers’ freedom of choice. it’s not always possible or practical for customers to switch providers. Factors ranging from geography (like a town with one cable provider) to contractual obligation (employer-sponsored health plans) can leave consumers with just one choice: take it or leave it. in these cases, it doesn’t matter whether unsatisfied customers want to abandon their current relationship — they’re trapped. at the other end of the spectrum, online customers who shop or make personal investments have near-infinite freedom to switch retailers or investment firms quickly and easily.
› Competitors’ CX differentiation. the essence of competitive strategy is positioning — taking and holding a place that’s different from competitors in the minds of customers. When customers don’t see a meaningful difference in the customer experience that competitors provide — such as with traditional retailers in most categories — they have no motivation to switch that’s based purely on Cx. But when companies offer significantly differentiated customer experience, as we see in the airline, investment, and online-only retail industries, poor Cx provides a powerful incentive to defect, and superior Cx provides a compelling reason to stay.
fIGURE 5 the Cx/revenue Growth equation
Competitors’ CX
Cu
sto
mer
sTr
app
e dFr
ee
DifferentiatedAt parity
CX drives revenue — lots of it• Customers can easily switch
business among many companies.
• CX leaders stand out from peers.
CX doesn’t drive revenue• Customers have one choice:
Take it or leave it.
• Competitors’ CX wouldn’t lureaway customers even if theycould switch.
For Customer experienCe proFessionals
Customer Experience Drives Revenue Growth, 2016June 21, 2016
© 2016 Forrester research, inc. unauthorized copying or distributing is a violation of copyright law. [email protected] or +1 866-367-7378
8
Business Case: The Customer Experience Ecosystem Playbook
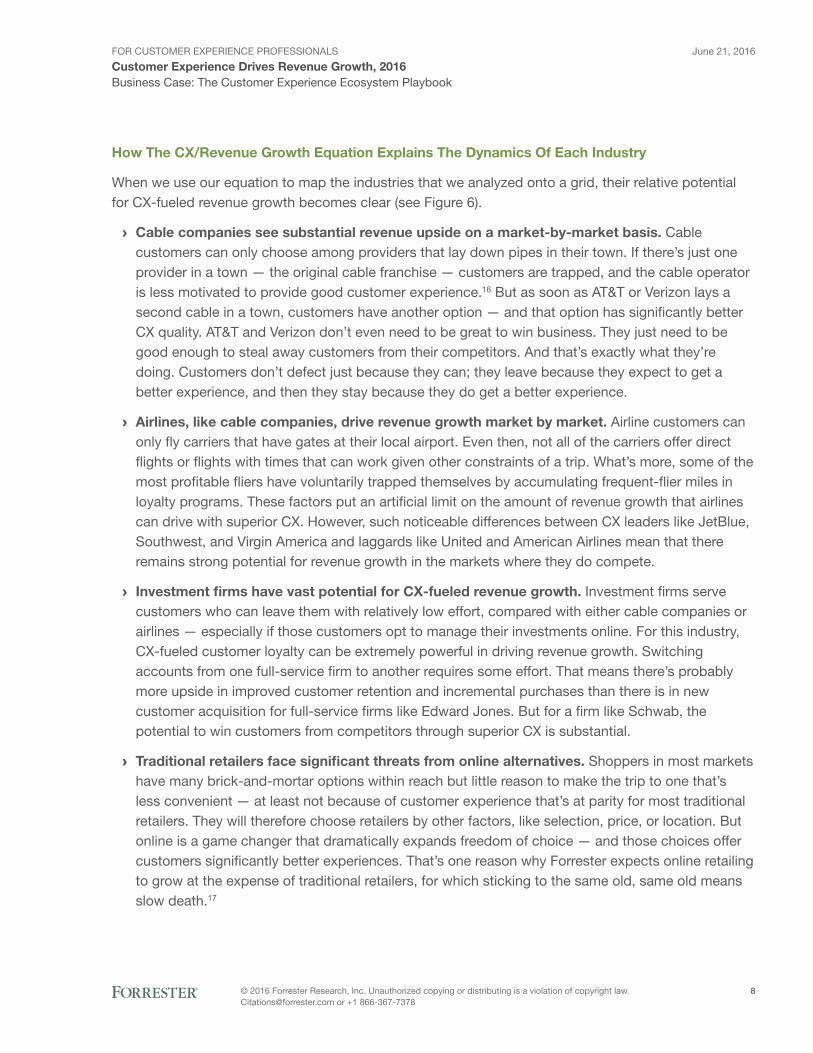
How The CX/Revenue Growth Equation Explains The Dynamics of Each Industry
When we use our equation to map the industries that we analyzed onto a grid, their relative potential for Cx-fueled revenue growth becomes clear (see Figure 6).
› Cable companies see substantial revenue upside on a market-by-market basis. Cable customers can only choose among providers that lay down pipes in their town. if there’s just one provider in a town — the original cable franchise — customers are trapped, and the cable operator is less motivated to provide good customer experience.16 But as soon as at&t or Verizon lays a second cable in a town, customers have another option — and that option has significantly better Cx quality. at&t and Verizon don’t even need to be great to win business. they just need to be good enough to steal away customers from their competitors. and that’s exactly what they’re doing. Customers don’t defect just because they can; they leave because they expect to get a better experience, and then they stay because they do get a better experience.
› Airlines, like cable companies, drive revenue growth market by market. airline customers can only fly carriers that have gates at their local airport. even then, not all of the carriers offer direct flights or flights with times that can work given other constraints of a trip. What’s more, some of the most profitable fliers have voluntarily trapped themselves by accumulating frequent-flier miles in loyalty programs. these factors put an artificial limit on the amount of revenue growth that airlines can drive with superior Cx. However, such noticeable differences between Cx leaders like JetBlue, southwest, and Virgin america and laggards like united and american airlines mean that there remains strong potential for revenue growth in the markets where they do compete.
› Investment firms have vast potential for CX-fueled revenue growth. investment firms serve customers who can leave them with relatively low effort, compared with either cable companies or airlines — especially if those customers opt to manage their investments online. For this industry, Cx-fueled customer loyalty can be extremely powerful in driving revenue growth. switching accounts from one full-service firm to another requires some effort. that means there’s probably more upside in improved customer retention and incremental purchases than there is in new customer acquisition for full-service firms like edward Jones. But for a firm like schwab, the potential to win customers from competitors through superior Cx is substantial.
› Traditional retailers face significant threats from online alternatives. shoppers in most markets have many brick-and-mortar options within reach but little reason to make the trip to one that’s less convenient — at least not because of customer experience that’s at parity for most traditional retailers. they will therefore choose retailers by other factors, like selection, price, or location. But online is a game changer that dramatically expands freedom of choice — and those choices offer customers significantly better experiences. that’s one reason why Forrester expects online retailing to grow at the expense of traditional retailers, for which sticking to the same old, same old means slow death.17
For Customer experienCe proFessionals
Customer Experience Drives Revenue Growth, 2016June 21, 2016
© 2016 Forrester research, inc. unauthorized copying or distributing is a violation of copyright law. [email protected] or +1 866-367-7378
9
Business Case: The Customer Experience Ecosystem Playbook
fIGURE 6 the Cx/revenue Growth equation explains the Dynamics of each industry
Competitors’ CX
Cu
sto
mer
sTr
app
e dFr
ee
DifferentiatedAt parity
Traditionalretailers
Investment�rms
Cableproviders
Airlines
Digital-onlyretailers
Craft Your Customer experience strategy For Growth
Does customer experience really drive business success? Yes, for the five industries that we examined, it does. Customer experience professionals looking to drive revenue growth — or simply avoid revenue loss — should take the following steps.
› step 1: map yourself and your competitors on our CX/revenue growth grid. How freely can your customers move from provider to provider? Do you face strongly differentiated Cx leaders and Cx laggards, or are you and your direct competitors at or near parity? the answers to these questions will help you determine where your company’s positioned now and whether there’s an opening for you, a current competitor, or a new disruptor to gain a competitive advantage because of superior customer experience.
› step 2: Assess your potential. if there is a Cx-fueled opportunity in your industry, can your company seize it? or will you have to settle for defending your company against some other firm that can? in all likelihood, the answer for your company will depend on two things: how much business discipline it brings to the practice of Cx today and whether it can produce differentiating Cx innovations in the future. to gauge your current level of Cx discipline, score yourself using Forrester’s Cx maturity framework.18 and to determine your innovation readiness, ask yourself how well your company can enable experimentation, reframe customer problems, and rally the troops across your organization. if design thinking sounds fanciful, or if your executives won’t engage with potentially scary ideas, then sorry, but your company doesn’t have what it takes to distance itself enough from competitors to make a difference.19
For Customer experienCe proFessionals
Customer Experience Drives Revenue Growth, 2016June 21, 2016
© 2016 Forrester research, inc. unauthorized copying or distributing is a violation of copyright law. [email protected] or +1 866-367-7378
10
Business Case: The Customer Experience Ecosystem Playbook
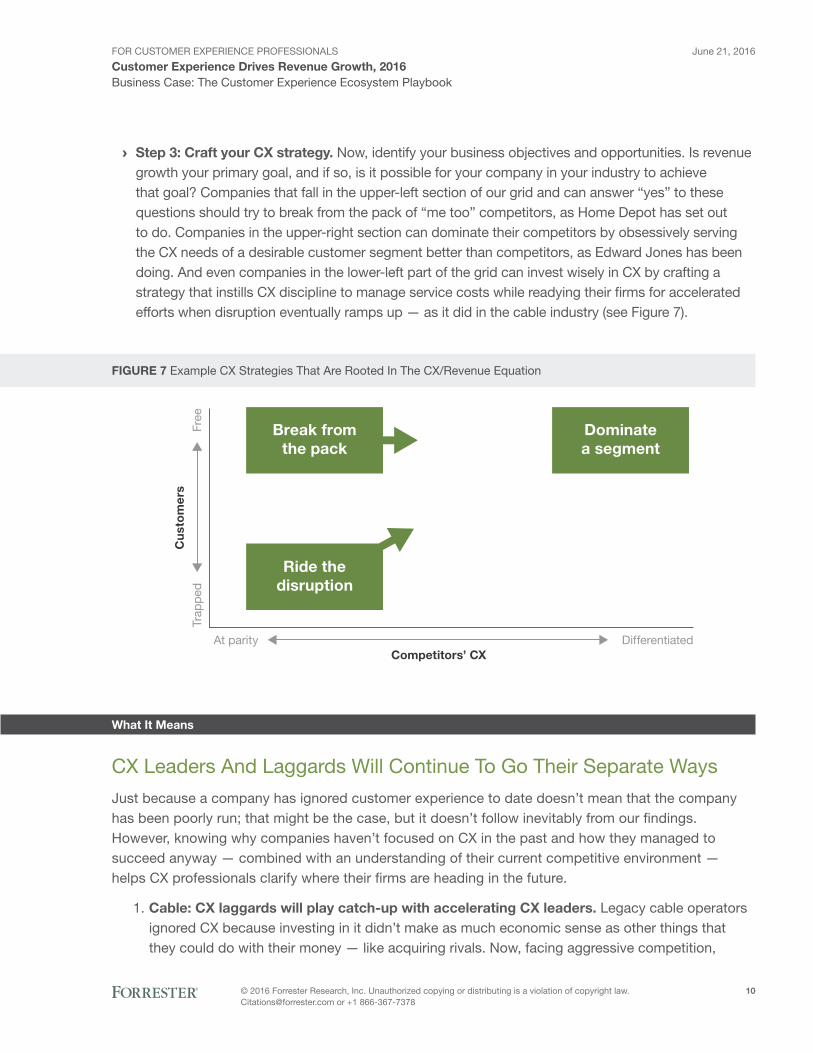
› step 3: Craft your CX strategy. now, identify your business objectives and opportunities. is revenue growth your primary goal, and if so, is it possible for your company in your industry to achieve that goal? Companies that fall in the upper-left section of our grid and can answer “yes” to these questions should try to break from the pack of “me too” competitors, as Home Depot has set out to do. Companies in the upper-right section can dominate their competitors by obsessively serving the Cx needs of a desirable customer segment better than competitors, as edward Jones has been doing. and even companies in the lower-left part of the grid can invest wisely in Cx by crafting a strategy that instills Cx discipline to manage service costs while readying their firms for accelerated efforts when disruption eventually ramps up — as it did in the cable industry (see Figure 7).
fIGURE 7 example Cx strategies that are rooted in the Cx/revenue equation
Competitors’ CX
Cu
sto
mer
sTr
app
e dFr
ee
DifferentiatedAt parity
Break fromthe pack
Ride thedisruption
Dominatea segment
What It means
Cx leaders and laggards Will Continue to Go their separate Ways
Just because a company has ignored customer experience to date doesn’t mean that the company has been poorly run; that might be the case, but it doesn’t follow inevitably from our findings. However, knowing why companies haven’t focused on Cx in the past and how they managed to succeed anyway — combined with an understanding of their current competitive environment — helps Cx professionals clarify where their firms are heading in the future.
1. Cable: CX laggards will play catch-up with accelerating CX leaders. legacy cable operators ignored Cx because investing in it didn’t make as much economic sense as other things that they could do with their money — like acquiring rivals. now, facing aggressive competition,
For Customer experienCe proFessionals
Customer Experience Drives Revenue Growth, 2016June 21, 2016
© 2016 Forrester research, inc. unauthorized copying or distributing is a violation of copyright law. [email protected] or +1 866-367-7378
11
Business Case: The Customer Experience Ecosystem Playbook
they’ve begun to improve customer experience, mostly by fixing problems in an attempt to eliminate frustration from customer interactions. Meanwhile, at&t and Verizon continue to invest in Cx improvements while making strategic acquisitions that give them enhanced capabilities and more subscribers.20 this will push the industry further up and to the right of the Cx/revenue growth grid as fiber gets laid down in more communities. and as the pay-tV service industry declines, the battle over internet subscribers will intensify, with legacy providers focusing on faster broadband and enhanced capabilities. this is where at&t and Verizon’s position as multiple-platform content providers will become pivotal in creating differentiated experiences that integrate video, broadband, and wireless services.
2. Airlines: CX leaders will look to increase their advantage. the recent massive drop in oil prices gave airlines the opportunity to either lower prices in an attempt to win customers or improve their typically low operating margins. they universally chose the latter path. that’s symptomatic of an industry that’s trying to get on firmer financial footing after it historically pursued growth over profits. However, JetBlue and southwest will invest to maintain and even increase their leadership positions, with an outside chance of unveiling disruptive Cx innovations.21 united and american will continue to treat Cx as one tactic among many — like charging new fees or squeezing in more seats — for improving margins. However, neither one shows signs of making a serious commitment to Cx as a strategy. the wild card in this game is Delta air lines. its impressive commitment to becoming the “no cancellations” airline has manifested a range of strategic initiatives that could move it into JetBlue and southwest territory.22
3. Investment firms: CX leaders will engage in an arms race of innovation. even a typical investment firm offers online features like comparisons, ratings, reviews, and immersive interactive tools that are competitive with those of the best digital-only retailers. What’s more, firms with highly rated Cx, like schwab and Vanguard, are rolling out innovative digital and omnichannel products to one-up would-be disruptors like Betterment and Wealthfront.23 expect the wave of innovations that have a basis in deep customer understanding and sophisticated user-centered design to accelerate, especially from usaa. it more than makes up for its relative lack of size through a combination of the most customer-centric culture in the business plus increasingly sophisticated Cx innovation. an example is the savings Coach app that it developed with voice-recognition and text-to-speech technology provider nuance Communications.24 the result: Firms that don’t constantly improve their Cx will see their customers stolen by those that do.
4. Retailers: some firms will play to win and others, not to lose. Factors like selection and convenience give online sellers an inherent Cx advantage. some traditional retailers will seek to offset these advantages by bringing the benefits of online — including responsiveness and immersive multimedia content — to their physical spaces, as Burberry has been doing. others will try to counterbalance the web’s shop-anytime ease with efforts to extend physical store hours; some will go so far as to operate stores 24x7 with the aid of remote monitoring, more self-service, and skeletal staffs.25 smart players will also shift the culture of their store associates toward customer centricity by paying fewer associates more money to attract higher-quality
For Customer experienCe proFessionals
Customer Experience Drives Revenue Growth, 2016June 21, 2016
© 2016 Forrester research, inc. unauthorized copying or distributing is a violation of copyright law. [email protected] or +1 866-367-7378
12
Business Case: The Customer Experience Ecosystem Playbook
people who can deliver a better customer experience — as trader Joe’s and the Container store do today. ultimately, though, the real Cx/revenue growth winners will be sellers with strongly differentiated concepts that lure shoppers away from competitors with highly engaging experiences — think Birchbox, Ministry of supply, story, and the trunk Club.
engage With an analyst
Gain greater confidence in your decisions by working with Forrester thought leaders to apply our research to your specific business and technology initiatives.
Analyst Inquiry
ask a question related to our research; a Forrester analyst will help you put it into practice and take the next step. schedule a 30-minute phone session with the analyst or opt for a response via email.
learn more about inquiry, including tips for getting the most out of your discussion.
Analyst Advisory
put research into practice with in-depth analysis of your specific business and technology challenges. engagements include custom advisory calls, strategy days, workshops, speeches, and webinars.
learn about interactive advisory sessions and how we can support your initiatives.
supplemental Material
survey methodology
Forrester’s Customer experience index online survey, us Consumers Q3 2015, is an online survey that we fielded in april and May 2015 of 45,320 us individuals ages 18 to 88. For results that are based on a randomly chosen sample of this size (n = 45,320), there is 95% confidence that the results have a statistical precision of plus or minus 0.5% of what they would be if the entire population of us adults who are online weekly or more often had been surveyed. Forrester weighted the data by age, gender, income, broadband adoption, and region to demographically represent the adult us online population. the survey sample size, when weighted, was 45,320. (note: Weighted sample sizes can be different from the actual number of respondents to account for individuals who are generally underrepresented in online panels.) please note that respondents who participate in online surveys generally have more experience with the internet and feel more comfortable transacting online.
For Customer experienCe proFessionals
Customer Experience Drives Revenue Growth, 2016June 21, 2016
© 2016 Forrester research, inc. unauthorized copying or distributing is a violation of copyright law. [email protected] or +1 866-367-7378
13
Business Case: The Customer Experience Ecosystem Playbook
How To Get Access To forrester’s CX Index Data Analysis And Insights
Forrester’s Cx index answers three key questions. How good is a company’s current customer experience? Why is the customer experience quality what it is? What should a company do to improve? the Cx index captures universal and industry-specific drivers and identifies, through advanced analytics, the drivers that have the most impact on the Cx index score and revenue to help companies focus investments in the right place. Forrester collects Cx index data on more than 900 brands in 18 industries across eight key markets (australia, Canada, China, France, Germany, india, the uK, and the us). if you wish to find out more details regarding Forrester’s Cx index data and services or how you can leverage the methodology, please contact your account manager or [email protected].
external citations, unauthorized reproduction, and distribution of any parts of this report are prohibited without prior written consent from Forrester.
endnotes1 the proof lies in comparing the revenue growth of companies with superior customer experience with that of their
direct competitors with comparatively inferior customer experience.
2 to help support our findings of companies that are Cx leaders and companies that are Cx laggards, we compared our own Cx index rankings with customer satisfaction scores from J.D. power and/or the aCsi. even though all three of these studies use different methodologies, we never found a case when one of our Cx index leaders was a customer satisfaction laggard or one of our Cx index laggards was a customer satisfaction leader. and although scores did vary slightly during this period, we did not observe a break in the overall pattern of Cx leaders and laggards.
3 in september 2014, Comcast appointed Charlie Herrin as senior vice president of customer experience in its cable division. since then, Comcast has undertaken a number of initiatives to improve its Cx. as of our Q3 2015 Cx index rankings, however, we didn’t see any significant improvement in its scores. this is consistent with our observation that significant rises in Cx index scores — which are based on customer surveys — lag improvements by two to three years.
4 to calculate consumer revenue growth for at&t and Comcast, we isolated at&t’s u-verse video and internet revenues and compared them with Comcast xfinity’s video and high-speed internet revenues. the number of internet and video subscribers for each company came from 10-K filings. source: us securities and exchange Commission filings by at&t and Comcast.
5 it is worth noting that at&t u-verse’s video subscriber numbers declined between 2014 and 2015, which is the only time that this happened in the period from 2010 to 2015. this drop was primarily due to a strategic shift toward acquiring and retaining DirectV subscribers. source: us securities and exchange Commission filings by at&t and Verizon.
6 From 2012 to 2015, southwest came in only a few points below aCsi leader JetBlue. source: “Benchmarks By industry: airlines,” american Customer satisfaction index, 2016 (http://theacsi.org/index.php?option=com_content&view=article&id=147&catid=&itemid=212&i=airlines).
7 to compare southwest and united, we adjusted for the acquisition of airtran by southwest in 2011 and the merger of united and Continental airlines in 2010. in years 2012 to 2015, we subtracted airtran’s full 2010 revenue from southwest’s operating revenue. similarly, we removed airtran’s 2010 revenue passenger miles from each following year of southwest’s revenue passenger miles. in calculating united’s domestic growth, we used the 2010 revenue starting number that it reported for ual on page 117 of its Form 10-K for 2012. We then added the revenue for the “Continental successor” in 2010. united refers to the revenues that it generated under the Continental brand after the official acquisition as “Continental successor” and the revenues that Continental made before the merger as “Continental predecessor.” We also added the “Continental predecessor” revenue for the year prior to the merger
For Customer experienCe proFessionals
Customer Experience Drives Revenue Growth, 2016June 21, 2016
© 2016 Forrester research, inc. unauthorized copying or distributing is a violation of copyright law. [email protected] or +1 866-367-7378
14
Business Case: The Customer Experience Ecosystem Playbook
to account for the increased revenue from the merger when calculating the CaGr. to calculate united’s revenue passenger miles CaGr, we added Continental’s revenue passenger miles estimate for the full year of 2009 to united’s 2010 revenue passenger miles. source: us securities and exchange Commission filings by southwest and united Continental Holdings.
8 For edward Jones’ and Morgan stanley’s revenue comparison, we used edward Jones’ total revenue and Morgan stanley’s total Wealth Management segment revenues. to isolate e-trade’s consumer-facing revenue, we tracked the reported revenues from its trading and investing segment, and for schwab, we isolated the investor services segment. For e-trade, we subtracted the corporate interest expense revenue in 2010 and 2015 because schwab did not include this revenue stream in its reports. also, we removed e-trade’s principal transaction revenue from 2010 because its market-making business generated this revenue — this business was sold off in 2014 and therefore saw no revenue in 2015. For schwab, we factored out its provision for loan losses in 2010 and 2015 because e-trade did not factor loan loss provisions into its trading and investing segment.
9 Customer advocacy — the extent to which a firm’s customers believe that it does what’s best for them, not just what’s best for its own bottom line — is a top predictor of customer retention and growth. us financial services customers who rate their firms highest on customer advocacy are most likely to consider those firms for future purchases. see the “Customer advocacy 2015: Drive Cross-sell and loyalty By Focusing on advocacy” Forrester report.
source: “investors adopt More Hands-on approach to advisors, says J.D. power Full service investor satisfaction study,” J.D. power press release, april 7, 2016 (http://www.jdpower.com/press-releases/2016-us-full-service-investor-satisfaction-study).
10 after stumbling badly in the early 2000s, Charles schwab bounced back, thanks to a strategy that it built around customer advocacy and loyalty. the strategy of driving organic growth by doing what’s right for customers led senior management to sharpen pricing, improve service, and offer more investing help. the result was more customers willing to consider schwab for a future purchase. see the “Case study: Charles schwab storms Back By Focusing on Customer loyalty” Forrester report.
11 JCpenney and Macy’s as well as Home Depot and lowe’s also have nearly identical 2015 aCsi scores. source: “Benchmarks By industry: Department and Discount stores,” american Customer satisfaction index, 2016 (http://www.theacsi.org/index.php?option=com_content&view=article&id=147&catid=&itemid=212&i=Department+and+Discount+stores) and “Benchmarks By industry: specialty retail stores,” american Customer satisfaction index, 2016 (http://www.theacsi.org/index.php?option=com_content&view=article&id=147&catid=&itemid=212&i=specialty+retail+stores).
12 to compare amazon’s and Walmart’s north american revenue, we used amazon’s north american net sales and Walmart’s us net sales. in 2010, our figure for amazon includes amazon Web services because amazon only recently reported it separately. However, we estimated this figure to be small enough that it would only affect amazon’s double-digit growth by less than 1% if we discounted it. source: andrew r. Hickey, “amazon Cloud revenue Could exceed $500 Million in 2010: report,” the Channel Company, august 3, 2010 (http://www.crn.com/news/applications-os/226500204/amazon-cloud-revenue-could-exceed-500-million-in-2010-report.htm).
13 to calculate amazon’s CaGr revenues in 2010 from retail and amazon Web services (aWs), we compared them with revenues in 2015 from only retail. this is because amazon reported revenues for aWs for the first time in its 2015 annual report. in 2010, aWs revenues were combined with overall north american retail.
14 Benefiting from the growth of the internet (including mobile), online retail will naturally continue to grow. But dynamic pricing, marketplaces, customization, and 3D printing will be the bigger reasons that eCommerce keeps growing. see the “the Future of shopping” Forrester report.
15 Forrester modeled the relationship between customer experience and revenue potential for each brand in our Cx index. By asking customers to tell us about their specific intentions relative to staying with, buying more from, and recommending each brand and combining this with expert inputs, we determined the revenue impact by customer for increases in the brand’s Cx index score. this allowed us to build more detailed and accurate models of the overall
For Customer experienCe proFessionals
Customer Experience Drives Revenue Growth, 2016June 21, 2016
© 2016 Forrester research, inc. unauthorized copying or distributing is a violation of copyright law. [email protected] or +1 866-367-7378
15
Business Case: The Customer Experience Ecosystem Playbook
revenue impact of Cx by brand and industry. When we analyzed the relationship between Cx index scores and revenue, we found that Cx drives loyalty-based revenue in every industry that we analyzed. see the “How Customer experience Drives revenue: a new and improved look” Forrester report.
16 Forrester’s Cx index data reveals the differences in customer experience quality across industries. When we analyzed the 12 tV service providers in our study by their customers’ ability to switch providers and their Cx index score, we found a startling relationship. Firms with customers who have more service options have, on average, higher Cx index scores than firms with customers who have limited service options. among the 14 isps in our study, we see a similar, albeit weaker, relationship. see the “Cx industry spotlight: tV and internet service providers” Forrester report.
17 More retailers will disappear in the future, and mediocre store associates will become an endangered species. Companies must take specific measures to ensure that they survive. see the “the Future of shopping” Forrester report.
18 Cx professionals can map practices from Forrester’s Cx maturity framework to each of the four phases on the path to maturity. they can then assess which phase their organization is in today and which gaps they have to close before moving on to more advanced activities in their plans to build an experience-driven organization. see the “Where are You on the path to Cx Management Maturity?” Forrester report.
19 to understand what role Cx professionals play in innovation efforts, Forrester talked to Cx pros and innovation experts at 29 companies and agencies. What we learned is that savvy Cx pros are adopting an approach to innovation that focuses on fostering and cultivating the conditions that give rise to innovations rather than leading the innovation effort itself. this report details the three actions that Cx pros must take to create a culture of Cx innovation in their organization. see the “How Cx pros innovate” Forrester report.
20 at&t has invested in a range of Cx improvements, from simplified ordering on its website to enhanced tools for employees. see the “How Companies improved their Customer experience index scores, 2014” Forrester report.
at&t acquired Cx index top-ranked tV service provider DirectV in July 2015. its real goal was building a digital platform that will give it a lasting competitive advantage on ubiquitous broadband services. see the “Quick take: at&t Buys DirectV to launch its Digital platform ambitions” Forrester report.
Verizon closed its acquisition of aol for $4.4 billion in June 2015. in addition to getting attractive media properties like the Huffington post and techCrunch, Verizon will be able to combine the ad tech stack from aol with the unparalleled audience tracking capabilities that it already developed. this will help give it the flexibility to deliver a variety of customer-friendly options ranging from providing more relevant ads to letting subscribers opt out of ads altogether. see the “Quick take: Verizon Buys aol to recast ad tech’s Foundations” Forrester report.
21 For example, in February 2016, JetBlue announced JetBlue technology Ventures in silicon Valley, California, which is a wholly owned subsidiary that will invest in, incubate, and partner with early-stage startups at the intersection of technology, travel, and hospitality. source: “JetBlue launches JetBlue technology Ventures in silicon Valley to shape the Future travel experience,” Business Wire, February 11, 2016 (http://www.businesswire.com/news/home/20160211005408/en/JetBlue-launches-JetBlue-technology-Ventures-silicon-Valley).
22 in 2013, it increased its flight completion rate to 99.43%, at one point going 72 days without any cancellations of its 2,500 flights. this made it the airline with the fewest flight cancellations overall. in 2012 and 2013, Delta became the second-most on-time airline and had the fewest security delays (0.01%). What’s more, the airline reduced its mishandled baggage rate by 27% year over year. there is evidence that these efforts are paying off: Delta estimates that it realized more than $80 million in cost savings due to fewer defects in operations. see the “Case study: How Delta air lines soared in the Customer experience index” Forrester report.
23 two weeks after launching its direct-to-consumer digital investment manager, Charles schwab unveiled a version for independent registered investment advisors (rias) and their clients. By developing its own solution and then pricing it so aggressively, schwab is squeezing all other advisor-based investment management providers in the us. incumbents with the most to lose include active asset managers like allianz asset Management and Capital Group, full-service brokerages like uBs and Wells Fargo advisors, insurers like northwestern Mutual life, and even high-priced rias. see the “Quick take: schwab’s intelligent portfolios Will squeeze other investment Managers” Forrester report.
For Customer experienCe proFessionals
Customer Experience Drives Revenue Growth, 2016June 21, 2016
© 2016 Forrester research, inc. unauthorized copying or distributing is a violation of copyright law. [email protected] or +1 866-367-7378
16
Business Case: The Customer Experience Ecosystem Playbook
Vanguard’s personal advisor services exploits digital technology to bring personal guidance from a financial advisor for an annual fee of just 0.3% of a client’s managed assets. even before its formal launch, money had poured into personal advisor, with more than $7 billion of it being new to advisor management at Vanguard. powered by technology like collaborative advice tools, personal advisor will be a transformative offer. see the “Quick take: Vanguard’s personal advisor Will transform the Financial advice Business” Forrester report.
24 source: Mary Wisniewski, “usaa launches new app to Help Millennials save,” american Banker, July 28, 2015 (http://www.americanbanker.com/news/bank-technology/usaa-launches-new-app-to-help-millennials-save-1075714-1.html).
25 retail will be a more difficult environment as expenses like healthcare and education eat up more of every dollar, leaving less to spend on shopping. ultimately, this means that the same old, same old will lead to a slow, steady death for many retailers. see the “the Future of shopping” Forrester report.
We work with business and technology leaders to develop customer-obsessed strategies that drive growth.
Products and services
› core research and tools › data and analytics › Peer collaboration › analyst engagement › consulting › events
Forrester research (nasdaq: Forr) is one of the most influential research and advisory firms in the world. We work with business and technology leaders to develop customer-obsessed strategies that drive growth. through proprietary research, data, custom consulting, exclusive executive peer groups, and events, the Forrester experience is about a singular and powerful purpose: to challenge the thinking of our clients to help them lead change in their organizations. For more information, visit forrester.com.
client suPPort
For information on hard-copy or electronic reprints, please contact client support at +1 866-367-7378, +1 617-613-5730, or [email protected]. We offer quantity discounts and special pricing for academic and nonprofit institutions.
Forrester’s research and insights are tailored to your role and critical business initiatives.
roles We serve
Marketing & Strategy ProfessionalscMoB2B MarketingB2c Marketing
› customer experiencecustomer insightseBusiness & channel strategy
Technology Management Professionalscioapplication development & deliveryenterprise architectureinfrastructure & operationssecurity & risksourcing & vendor Management
Technology Industry Professionalsanalyst relations
125102