Embed Size (px)
Citation preview
CUSTOMER PERSONALIZATION DRIVEN CONTENT MANAGEMENT SYSTEM
University of Jyväskylä
Master’s thesis
2017
Ilia Bazanov Web Intelligence and Service Engineering
Oleksiy Khriyenko
ABSTRACT
Author Ilia Bazanov
Tittle of thesis Customer Personalization driven Content Management System Behavior
Discipline Web Intelligence and Service Engineering
Type of work Master’s thesis
Time (month/year) May/2017
Number of pages 40
Abstract Customer information can be used to tailor products, services and consumption experiences to fit the specific needs and tastes of customers. Website personalization allows changing radically the attitude of a website for each visitor. By personalizing content on the website, it can offer the best solution for each user or client. There is no single solution, which works for everyone in ecommerce sphere anymore. Personalization takes care of everyone’s individual needs. This study is aimed to look into online personalization, its abilities and potential. In this research, solution by Frosmo has been used to carry out experiments on top of data, received from e-commerce websites of three different natures: a travel company, a wrist watches shop and a network of stores selling consumer electronics. I will analyze if there is any relation to the placement of personalized content and if yes, does it work the same way for different websites. As outcome, I proved that personalization for ecommerce websites is a profitable way of inversing resources nowadays and that personalized content has more chances to attract users.
Keywords Online personalization, product recommendations, A/B testing
Location Jyväskylä University Library
3
PREFACE
Writing this thesis would be impossible for me without help of many people. Thank you to my supervisors Oleksiy Khriyenko and Tapani Ristaniemi for giving me this opportunity and guiding me along this long way. Your support and comments were vital to this research. Thank you to Frosmo for giving me this opportunity of using data to carry out the research. Thank you to Markku Mantere at Frosmo for guiding me, Alvaro Hernandez Jabardo and Volker Rhmlw for helping me to choose clients to work with. Thank you to Otto Zemzans and Anh Do for giving me support with technical part and just being true friends. Also thank you to Anna Goeva for helping me with proofreading and structure of the thesis. Helsinki, May 15, 2017 Ilia Bazanov
4
CONTENTS
ABSTRACT ..................................................................................................................... 3
PREFACE ........................................................................................................................ 3
LIST OF FIGURES ......................................................................................................... 6
GLOSSARY ..................................................................................................................... 7
1 INTRODUCTION ................................................................................................ 8
2 PERSONALIZATION ........................................................................................ 10
2.1 What is online personalization ............................................................. 10
2.2 Benifits of online personalization ......................................................... 11
2.3 Methods of online personalization ....................................................... 12
2.4 Segmantation ........................................................................................... 15
2.5 A/B testing .............................................................................................. 17
3 FROSMO’S APPROACH .................................................................................. 20
3.1 Custom action .......................................................................................... 22
3.2 Conversion ............................................................................................... 23
3.3 Segmentation ........................................................................................... 23
3.4 A/B tests .................................................................................................. 24
4 RESEARCH MODEL ......................................................................................... 26
4.1 Introduction ............................................................................................. 26
4.2 Hypothesis and research model ........................................................... 26
4.3 Method ..................................................................................................... 28
5 RESEARCH FINDINS ....................................................................................... 31
5.1 Case 1 – a travel company ..................................................................... 31
5.1.1 Product recommendation #1 ..................................................... 31
5.1.2 Product recommendations #2 and #3....................................... 32
5.1.3 The numbers ................................................................................. 32
5.1.4 Results of product recommendation #1 ................................... 32
5.1.5 Results of product recommendation #2 ................................... 33
5.1.6 Results of product recommendation #3 ................................... 33
5.1.7 Summary ....................................................................................... 33
5.2 Case 2 – wrist watches shop .................................................................. 34
5.2.1 The numbers ................................................................................. 34
5.2.2 Results of product recommendations ....................................... 35
5.2.3 Summary ....................................................................................... 35
5.3 Case 3 – electronics shop ....................................................................... 36
5.3.1 The numbers ................................................................................. 37
5.3.2 Results of product recommendations ....................................... 37
5.3.3 Summary ....................................................................................... 37
6 CONCLUSIONS ................................................................................................. 38

5
REFERENCES ............................................................................................................... 39
6
LIST OF FIGURES
FIGURE 1. How does Frosmo work………………………………………………..16 FIGURE 2. Example of data in log file……………………………………………..25 FIGURE 3. Program’s interface and possible settings……………………………26 FIGURE 4. Example line of output…………………………………………………26
7
GLOSSARY
Decile - characterizes the distribution of the values of the aggregate, which consists of ten equal parts. Any of these ten parts is 1/10 of the total population. Thus, the first decile separates 10% of the lowest values lying below the decile, from 90% of the largest values lying above the decile.
CTR - (Synonym - click-through rate) is defined as the ratio of the number of clicks per banner or ad (or a product recommendation in case of this study) to the number of impressions, measured in percent. CTR calculation formula: CTR = (number of clicks / impressions) * 100.
KPI - (Key Performance Indicators, KPI) is defined as the performance of a unit (in case of this study, product recommendation), which helps to evaluate performance of that unit. It can be an impression, a click, a conversion, a transaction.
Conversion – a pre-defined action, which should be completed by a user. Can also include transaction. Examples of conversion – subscription to web-shop’s email feed or buying certain product in terms of a sale.
Transaction – a finished payment fact, performed by a user. In simple words, a finished purchase.
Behavioral factor - a set of visitors’ actions on a specific site. It can be login to the site, time of stay, page view, clicks on the proposed links, return to the site - all these things can be attributed to behavioral factors.
Statistical significance – in statistics, a value is called statistically significant if the probability of a random occurrence of this value is relatively small.
SEO - (Search engine optimization) is a set of actions for internal and external optimization, which target raising the position of the site in the results of the search engines on specific user requests, in order to increase network traffic, potential customers and subsequent monetization.
A/B testing - is a test, during which two versions of a web page are compared to see which one performs better based on pre-defined method of measure.
8
1 INTRODUCTION
In 1999, David Weinberger, one of the authors of the book entitled "The Cluetrain Manifesto", wrote: “Personalization: the automatic tailoring of sites and messages to individuals viewing them so that we can feel that somewhere there’s a piece of software that loves us for who we are.“ Today, almost 20 years later, this method is used by companies that are trying to make online interaction with users be more efficient and easy. Frequency of using personalization has grown dramatically during this time. In fact, it has grown so much that personalized user experience has become the norm, not an option. One of the most important tasks for any e-commerce business owner is growing the conversion rate. Competition generates increasing requirements for the websites from users’ point of view. In most cases, if person does not find what (s)he looks for, (s)he will go to another website. The amount of offers leads to the fact – it is becoming increasingly difficult to stand out and to be noticed. Personalization is great way to approach this task. By personalizing content on the website, it can offer the best solution for each user or client. There is no single solution, which works for everyone in ecommerce sphere anymore. Personalization takes care of everyone’s individual needs. Today, people want a more tailored experience, even if they do not consciously think about it. It means that in our world with endless options, if your web experience does not give them what they want, they will find another provider who can. However, is it true that personalization is the crucial key to improvement of the user experience and does it really affect conversions? This is the main question of this work. I am targeting to research about effectiveness of personalized messages in practice by comparing amount of conversions users who saw personalized content and who did not. To accomplish this, I will use many of personalization techniques, which are implemented by Frosmo platform. Those include segmentation, A/B testing, conversion and transaction tracking. The research will be based on data, which is collected from three websites, which are using Frosmo. This data includes all the actions, which anonymous user performed on the site. Those include: display of a recommendation message, long displays (for example, if user spent some time reading the message), clicks, entering or leaving a segment, performing a conversion or transaction and other customizable actions.
9
In Chapter 2 I will be talking about personalization, its methods, benefits and basic techniques. In Chapter 3, I will introduce you to Frosmo’s approach to personalization and how do we implement it. Chapter 4 tells more about research model and the technical approach. Finally, Chapter 5 is about the findings of this research. During my studies and experiments here, I hope to be able to see some difference in amount of conversions before and after personalization. In addition, I will try to categorize personalized messages into different types and see, if a certain type usually works better, than others do. I will try to analyze if there is any relation to the placement of personalized content and if yes, does it work the same way for different websites.
10
2 PERSONALIZATION
2.1 What is online personalization
A lot of time and resources can be spent for design, a lot of effort can be put in improving site navigation and mobile optimization, but what does the most of websites offer nowadays? A static, almost never changing picture. Regardless of how many times a person will get to the page, (s)he sees the same offers and forced to perform the same actions again and again to find the necessary information or a product. Customer information can be used to tailor products, services and consumption experiences to fit the specific needs and tastes of customers (Chellappa and Sin, 2005). Website personalization allows changing radically the attitude of a website for each visitor. As a result, it will be a mutual conversation between a user and the website. The website will know interests of each particular user and will be able to keep a nice conversation about them. The terms customization, individualization and personalization are often used as synonyms in the literature about e-commerce. Ansari and Mela (2000) divide personalization into two types – on-site personalization and external personalization. External personalization is executed through, for example, external personalized advertisement or emails. The goal of it is to attract users to the site. In this study, however, I will be concentrating only on on-site personalization. Pine (1993) has defined the personalization as modifying products or services to fit the personal needs of individual customers. However, what is on-site personalization anyway? Everyone has met a shop assistant in clothing store sometime, who helps to find things, which suit personally each customer, depending on given set of properties. Properties can include, for example, size, style and image. In fact, personalization in the web is exact same thing. Using different tools and data, a website can make concrete messages or offers, which have bigger chance to suit the client and lead to the conversion. After the first and all next visits to the website, it will remember information associated with both the visitor himself and the actions (s)he did. With each new entry on a page, the website will instantly adapt to the user, his interests and needs, because there is no sense to show the same offers to radically different clients. A page, which was personalized, will keep the same design and original structure, but the offers, which are visible to a user, including products, will be
11
adjusted. Personalization does not require allocating resources into new design or structure – it is a self-contained process.
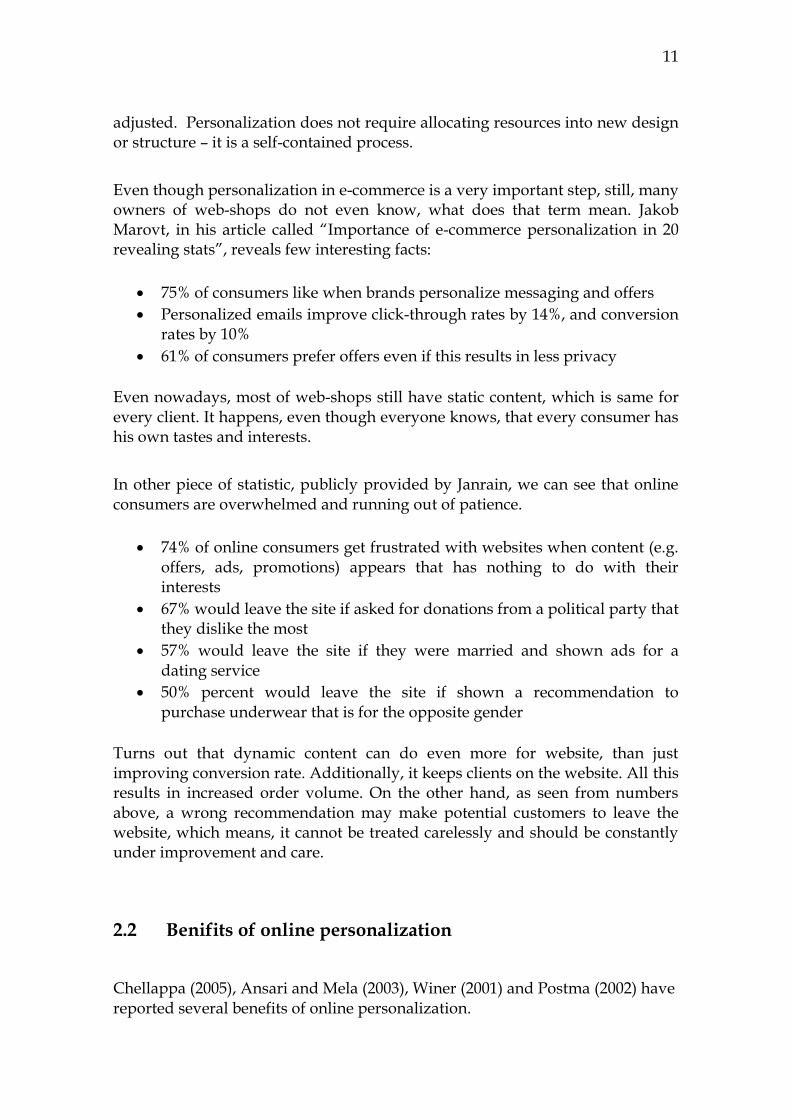
Even though personalization in e-commerce is a very important step, still, many owners of web-shops do not even know, what does that term mean. Jakob Marovt, in his article called “Importance of e-commerce personalization in 20 revealing stats”, reveals few interesting facts:
75% of consumers like when brands personalize messaging and offers
Personalized emails improve click-through rates by 14%, and conversion rates by 10%
61% of consumers prefer offers even if this results in less privacy
Even nowadays, most of web-shops still have static content, which is same for every client. It happens, even though everyone knows, that every consumer has his own tastes and interests.
In other piece of statistic, publicly provided by Janrain, we can see that online consumers are overwhelmed and running out of patience.
74% of online consumers get frustrated with websites when content (e.g. offers, ads, promotions) appears that has nothing to do with their interests
67% would leave the site if asked for donations from a political party that they dislike the most
57% would leave the site if they were married and shown ads for a dating service
50% percent would leave the site if shown a recommendation to purchase underwear that is for the opposite gender
Turns out that dynamic content can do even more for website, than just improving conversion rate. Additionally, it keeps clients on the website. All this results in increased order volume. On the other hand, as seen from numbers above, a wrong recommendation may make potential customers to leave the website, which means, it cannot be treated carelessly and should be constantly under improvement and care.
2.2 Benifits of online personalization
Chellappa (2005), Ansari and Mela (2003), Winer (2001) and Postma (2002) have reported several benefits of online personalization.
12
For instance, online-personalization allows companies in e-commerce sphere to grow and improve relationships with customers by creating clients’ profiles based on what they like and how they behave. Providing less excess information and helping customers in making smart decisions increases their loyalty level. (Srinivasan, 2002). Keeping in mind that getting new customers is always more expensive than returning customers, loyalty plays an important role in e-commerce sales sphere. (Karimi et al., 2001). Online personalization might help in decision of customers’ switching from your competitors to you, which is also a powerful feature, as Alba et al (1997) and Winer (2001) have discussed already. Furthermore, online personalization has also shown a steady increase in customers’ satisfaction level according to Ansari and Mela (2003).
In addition, according to research carried out by Degeratu et al. (2000), price density can be lower online than offline, while the impact of the brand is higher online. This means that customer’s satisfaction and loyalty levels are dependent from many factors, both offline and online. Thus, Shankar at al. (2003) do believe, that companies’ duty is to understand the connection between customers’ satisfaction, loyalty and how does the online environment affect it.
Finally, online personalization provides much more efficient information flow for customers, which helps customers in making smart decisions, as discussed earlier, but also it results in smarter e-mail messages, which do generate higher click-rates and standardized messages (Postma and Brokke, 2002) and targeted online ads, which are based on previously collected user data, report higher response rates (Mangalindan, 2003). We could see a lot of this kind of advertisements today for example in Facebook, which is known as one of the biggest online advertisement platforms.
2.3 Methods of online personalization
Methods of personalization are mainly divided into two types – based on rules and based on algorithms. Personalization, which is based on rules, offers to visitor solutions, focused on specific segments. The algorithms-based personalization monitors users’ behavior and develop predictive behavior models to show suitable content for each visitor. This content allows machine learning. Both types of personalization do not exclude being used in the same time and environment, since they can act independently.
13
First, a personalized website carries out an analysis of its visitors, including for example, where they come from, which keywords they used to find the website, geographical data, personal data, what was most interesting for them etc. After the analysis, website will offer more targeted offers for the visitor, which are connected with his scopes of interest. For example, based on analysis of acquired books of the buyer, website will immediately offer him recommendations, based on genre or author. Another good example will be, if a visitor on the website, which sells cars, will go to the link “cheap cars”, premium cars will not be shown to this visitor directly. Similarly, a person, who is interested in expensive goods, will not see advertisements of economy category. A client, living in London, will see address of the closest company office in his area. (S)he will not have a need to look up the address manually from contact page, browsing a whole list of offices. The next step - definition of audience segments. It is necessary to understand, what is the biggest chunk of visitors and where do they come from. Based on this analysis, a process should be constructed, which will influence the sales and marketing strategy. Today, we are experiencing the growing popularity of services and software that allow creating dynamic content based on segmentation and lists. Possible third step would be A/B testing. It is a powerful marketing tool to increase the efficiency of the Internet resource. A/B testing increases the conversion rates, improves quality of the search, helps to pick best of many design options or for example name of the product (possibilities are not limited to this list). It requires basic segmentation to be implemented but the basic idea is simple – one part of users see one option, and another part sees different option. Results of these groups are compared in some way and the decision is made so that the conversion rate will raise (or it can be any other specified metric). One more proved by time way to customize content is to use a special survey before the customer will place an order. This way it is possible to gather enough information about user’s interests and generate more personalized approach. Some websites might ask you once you create account there, what kind of categories are you interested in – this is a new visitor’s analysis. If there is no idea about biggest traffic sources, there cannot be confidence, where to spend time and money to get best results. In twenty first century, data drives sales. New user analysis is a very first and quite simple way to get very important data to boost ecommerce and sales.
14
What does it mean in practice? First, JavaScript (essential part of any web-browser today) has native support of retrieving last visited page address (the page, which user visited before coming to the website). It is called a referrer, or, in a bigger perspective, a channel. When biggest channels are known, it is suggested to adapt the website more for these channels to increase engagement and decide better, where to put money. For example, if the biggest source of users is Facebook, it would be wise to make the content (or items in shop) easily sharable via Facebook, or introduce special campaigns, connected with Facebook. Second example - everyone uses keywords to find certain information in search engines. In addition, of course it is possible to know, by which keywords a user has found the website. This is quite essential thing when doing the search engine optimization (SEO) to once again boost amount of visitors, engagement and sales. Important part is to check whether a user came to the page by direct visit – (s)he typed a URL directly or used a bookmark. For example, using a bookmarked product link can mean that a user was showing interest to this product and (s)he is just about to buy it, so that’s a perfect time to offer a discount coupon. Or, coming to the main page of the site by typing direct URL means that user is an active returning user, which tells about his engagement. By having parameters in the link, which leads to the website, it is possible to start tracking efficiency of advertisement campaigns – just modify the link, which will lead to the website inside of the advertisement. Add some parameters, depending on which a user can be segmented on his/her first visit. For example, adding a parameter like “?campaign_source=google” will help to segment people, who came to the website by seeing an ad in Google search results or anywhere else. First visit analysis contains much data about how website visitors discover a website. It can give an insight which online marketing tactics are driving the most traffic to the website, as well as the tactics that bring in the most qualified, converting leads. It can as well be a starting point for some tactics like coupon offering in the right time.
15
2.4 Segmantation
Market segmentation is one of the most widely accepted concepts in marketing. Its fundamental thesis is that, to achieve competitive advantage and, thereby, superior financial performance, firms should (1) identify segments of demand, (2) target specific segments, and (3) develop specific marketing “mixes” for each targeted market segment (Shelby, Hammond). Users’ segmentation is a method of dividing customers into groups of individuals that are similar in some ways, relevant to the marketing. These similarities may include age, interests, gender, habits, product price range etc. Users’ segmentation is also called consumer or client segmentation. Segmentation is an absolute need, if an ecommerce project targets at least some variety of customers. Of course, if it is just a representative web site for a local kid’s clothes shop, then there is no big point in it. Most of those who are working on websites or mobile applications and services on the Internet, understand the importance of segmentation system for the successful development and product management. Focusing on segmentation, it is easy to look for bottlenecks, as well as understand, how to make changes to improve product’s success in certain segments. Before starting to use the segmentation, it is necessary to decide:
Which data is interesting for us and how it may be gathered
Which sources can be used (for example, external services like Facebook)
What can be done with this data or by which criteria it is possible to divide users into segments
Why to outline these specific segments Assume an online clothing shop, which sells products for a very wide range of people. Owner should be at least interested in client’s age, gender, geographical location, currency and native language. Which sources can be used to gather this data? For geolocation, currency and native language it is possible to use free services and algorithms, which will tell us this information based on user’s IP address. Determining age and gender is a bit harder task, but either ask user to disclose this information for us (for example, let us see his Facebook account), or can try to analyze most viewed (and bought) items and assume gender and age from them.
16
The basic and a very effective segment will be geographical (or county based) segment. For example, starting from the first visit, show the website to a user in his native language, convert prices to his currency (products price, postage price) or even count the average posting duration to his city. More in depth segmentation might include showing the most likely suitable products for the user, such as not showing kids’ clothes if the user has never searched for them, as well as clothes based on gender. What can be achieved with even such simple segmentation? By enabling segmentation, companies can raise the conversion rate, encouraging users to buy more and more often. Users can for example see special offers, which are meant for certain country or certain product types, in which they were interested before. Segmentation can help to develop certain markets, such as, for example, asking users to spread the word about the shop in their favorite social networks (based on country). It can also improve customer service and assist in customer loyalty and retention. Marketing materials can be sent out using customer segmentation to be more valued and appreciated by customers who receives them as opposed to impersonal brand messaging that does not acknowledge purchase history or any kind of customer’s interests. Other benefits of users’ segmentation include staying a step ahead of competitors in specific sections of the market and identifying new products that existing or potential customer could be interested in or improving products to meet customer expectation. It is simple. If an online shop is the first, who will offer to customer what they want, it will receive higher amount of successful deals. If it offers categories of products, which are more popular in that particular geographical place, it will most probably also lead to a higher amount of finished purchases. Imagine if a user who comes from India visits some web shop like Amazon and first thing (s)he sees is an air heater. Just by enabling the most simple and automatic segmentation, which I described above, it is possible to avoid this kind of situations. There are many kinds of segmentation, something more complex than simple and automatic segmentations. For example, it is wise to implement measurable segments in conjunction with any other segmentation, like geographical or behavior ones. These segments can be called value-based. Value-based segments evaluate groups of customers in terms of revenue, which they generate, and in terms of relationship’s cost, which is cost of maintaining relations with those clients. It is easy to understand, what segment’ generated revenue is. However, other valuable piece is cost of relationship. This is, for example, cost of postage to one specific country (if it is included in the price, which is popular option), or cost of call support (if there is a need of people speaking that specific language) etc.
17
Therefore, it comes out that segmentation is capable of not only increasing the income, but also of finding drawbacks and ways to cut costs. After receiving such information, companies can adjust their markets budgets accordingly. Customer segmentation can have a great effect on customer management by dividing customers into groups with the same needs. A company can target each group differently and focus of what each kind of customer needs at any given moment of time. Large or small group can be targeted, depending on company’s resources or needs. It is logical to conclude that segmentation is powerful statistics tool and it has two sides – user side (when recommendations are based depending on user’s segments) and company side (powerful reporting tool), which can be used both for increasing income and decreasing costs.
2.5 A/B testing
Imagine the situation, a project has been launched to live, it gets visits, new users, maybe even returning users at this stage. However, one day, owner decides to change something on the website. Most often example is to place a popup widget, which will convince users to subscribe to the newsletter feed. In this case, it is an intuitive assumption that users of the website will subscribe to the news feed more often, if they will get a reminder about that, so there is an expectation of increase in number of subscribers. Assumptions and hypotheses are based on personal experiences, views or maybe even some scientific researches, which do not necessarily coincide with the views of target audience. In other words, assumption does not mean that after the changes, the desired effect will happen. To test these kinds of hypotheses A/B tests were introduced. The idea behind A/B testing is simple. Target audience is being randomly divided into segments. Important part – to keep one of the segments unchanged. This segment will be called comparison group of the test. In this particular case, there is only one segment – users, who will see the popup widget. Although, A/B testing is not limited to two segments – it depends on the particular case, which requires conducting the A/B test. In order to obtain a statistically significant result, it is important to eliminate the influence of the segments to each other, i.e. a user should be assigned to only one segment strictly. From technical point of view, it is easy to achieve by specifying a segment label in the browser’s cookies.
18
To reduce influence of external factors, such as advertising campaigns, day of the week, weather or the season, it is important to make measurements of the segments in parallel, i.e., in the same period of time. In addition, it is very important to exclude internal factors, which may also significantly distort the test results. Such factors can be actions of personnel, actions of support center, developers or administrators of the website. For example, in Google Analytics platform, there are filters for that purpose. The number of users in segments will not necessarily be equal due to randomness. The metric is chosen relatively, i.e., without reference to absolute values. Usually, metric is presented as deciles or a percent of total users’ amount. The value can be different, however, most often, a page view is used as a counter, but it can also be average bill or CTR of a link. Segments can and do often have different size. For example, a test for significant change in the user interface, probably, should be conducted only within 10% of total amount of website’s visitors. Such changes always lead to positive or negative results, which are very hard to predict. By reducing the test segment size, the risk is reduced respectively, especially, if there is a high change of negative feedback from users. What can be improved by conducting A/B tests? These are most popular metrics among different ecommerce projects:
Conversions (such as order)
Economical metrics (such as average bill size)
Behavior factors (such as user’s interest in the resource) One metric is not always enough to carry out results. It is good to make A/B test and track as many valuable metrics as possible. For example, huge change in user interface might decrease the average bill size but increase amount of conversions. After conducting a test and receiving first results, it is important not to hurry. Values can differ from day to day, which means, there are some kinds of random factors being involved. To compare such values, it is important to take average results for significant period. For more precise and reasonable results, some companies might carry out the same A/B test twice, with a gap of time in between the tests. To execute any actions based on A/B tests’ results you should also make sure that the difference in results is statistically significant. Often, the difference

19
between tests is so little that it will not make sense to spend any resources for improvements.
20
3 FROSMO’S APPROACH
Currently I am working and writing my thesis in a Finnish company called Frosmo Ltd. Frosmo is a Helsinki-based software and service company. I chose this company because our main product gives me perfect opportunity for fulfilling the thesis target. In a nutshell: Frosmo enables companies to modify any aspect of their online business, regardless of complexity. With our technological approach, it is easy to develop your website faster than ever before.
The industry’s fastest implementation: simply add our dynamic JavaScript tag to your site and start creating different types of features through any JavaScript framework. This is a big deal.
Speaking of features, we do not restrain your online service development to a set of predefined features. Your business goals should remain at the heart of your web development. No more long lists of features limiting your business strategy, just solutions built around your needs.
Smart and secure thinking: each Frosmo client is an individual instance connected to our core library through an API. Therefore, in addition to our core library, you can have features created and released whenever you need.
On a bigger scale, we can all agree the Internet has a big impact on humanity, in both our personal and professional lives. However, to be frank, our online experiences are not always enjoyable. Companies struggle to keep up with modern web design principles and consumers’ shifting expectations, among other things.
At Frosmo, our mission is to transform those experiences, and take the web to a completely new level, benefiting both businesses and consumers. We believe that together we can make the Internet a better place. Putting it all simply: Frosmo has all features, which I mentioned in this thesis and which I wanted to test. The list includes: new user analysis, segmentation, A/B testing, conversions tracking, product tracking, and any kinds of personalization possibilities. This list can be expanded limitlessly, since we make changes to client’s website using JavaScript, which gives us unlimited power and borderless possibilities. Once we install Frosmo to client’s website (basically, client inserts just two lines to the source code of the website), we help them with the initial setting. After this, client can use the system by himself (we provide teaching and learning materials), however, much bigger part of clients prefers to use Frosmo as an
21
outsource web-developer (we provide project managers and developers for each client), since really big clients, like chain of hotels, usually have a giant queue of tasks to do and sometimes, even the simplest change in their website can take them up to one year to handle. That is why such clients benefit very much when using Frosmo. This way we enable clients to react instantly on market changes.
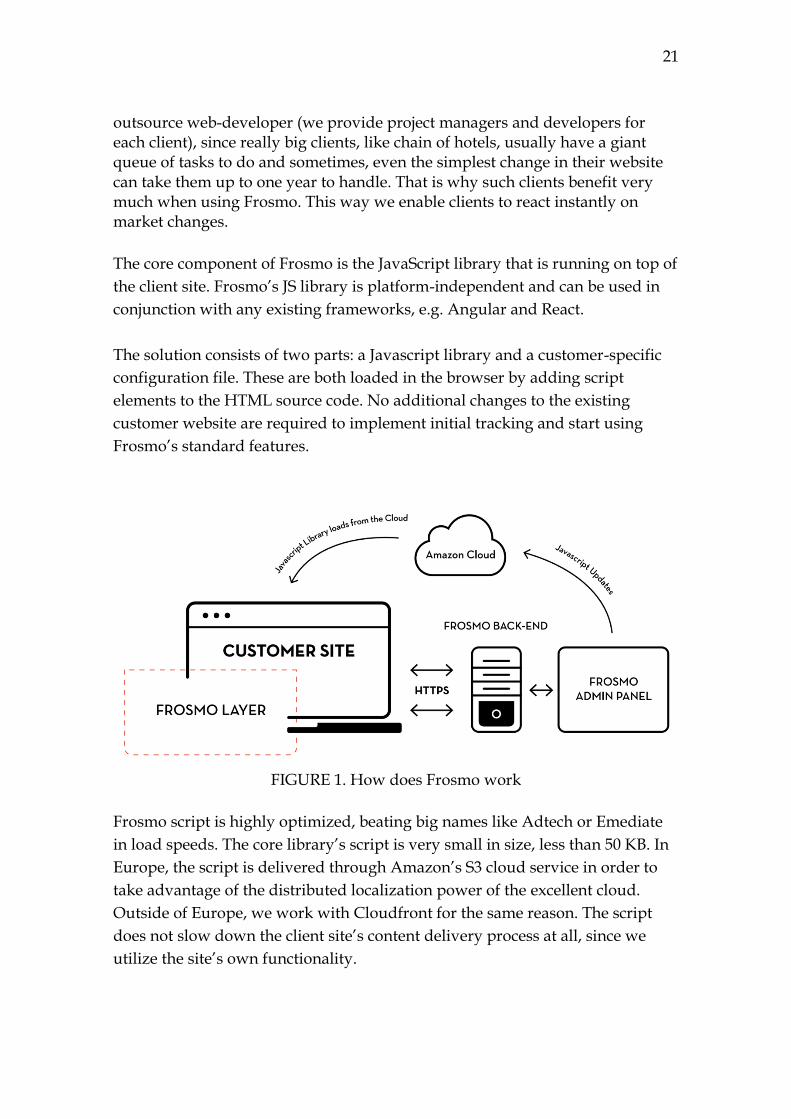
The core component of Frosmo is the JavaScript library that is running on top of
the client site. Frosmo’s JS library is platform-independent and can be used in
conjunction with any existing frameworks, e.g. Angular and React.
The solution consists of two parts: a Javascript library and a customer-specific
configuration file. These are both loaded in the browser by adding script
elements to the HTML source code. No additional changes to the existing
customer website are required to implement initial tracking and start using
Frosmo’s standard features.
FIGURE 1. How does Frosmo work
Frosmo script is highly optimized, beating big names like Adtech or Emediate
in load speeds. The core library’s script is very small in size, less than 50 KB. In
Europe, the script is delivered through Amazon’s S3 cloud service in order to
take advantage of the distributed localization power of the excellent cloud.
Outside of Europe, we work with Cloudfront for the same reason. The script
does not slow down the client site’s content delivery process at all, since we
utilize the site’s own functionality.
22
By default, Frosmo collects only anonymous information about the website
users and their behavior (similarly or integrated with Google Analytics).
Personal information, such as names, email addresses or phone numbers, will
not be saved to Frosmo’s servers. Data, which is not sent to Frosmo’s back-end using APIs, is stored in the user’s browser’s local storage. Some information that is sent via the APIs (e.g. segmentation data) is also stored similarly. Certain non-essential data is stored using third party cookies by default, for example segmentation data intended for use between domains. However, none of the main functionalities requires the use of cookies and storing data in cookies can be turned off if necessary.
3.1 Custom action
Before starting experiments, I explain some basic features we use in Frosmo. Custom action is a defined in code action, which user has to perform. Result of such action can be a Segmentation event or a Conversion. Custom action can be anything. Segmentation based on type of user’s client does not require such action – it is being done automatically. However, if site’s owner wants to segment users based on what products did they look for or which pages they visited, this is the case for custom action. However, in my practice, I met cases that are more complicated. Example of a complex case: a travel company wanted to segment users, who reached final step of a hotel purchase, but dropped off without finalizing it 3 times, where the period between each time was at least one day. In that case, when user was attempting to drop off on the third time (he moved mouse out of the browser’s window), a special offer was showed to the user, which was not accessible by any other method and it was supposed to change user’s mind and win a conversion. Custom action is quite basic but very powerful feature in Frosmo’s inventory. It is possible to target any user performing any series of actions, which is often impossible with other solutions. I will use custom actions when explaining segmentation and conversion tracking features.
23
3.2 Conversion
Conversion - a pre-defined action, which should be completed by a user. Can also include transaction, which is a simple fact of user's purchase. This is a simple and wide definition in terms of e-commerce. However, how is it different in terms of our system? In Frosmo, conversion is anything. Using JavaScript, we can define any sequence of actions to be taken to complete a custom conversion. It can be an email feed subscription or a certain amount of user’s visits within custom period. It can also include transaction, which we track and use later as well as the rest of data we can pick. Amount of conversions is widely used as one of the main KPIs in our system. Conversions make big data small and obvious – depending on complexity of a conversion, site owner or project manager can see huge chunks of data analyzed and presented in a small table, which makes decision making efficient, fast and easy. We can also separate or segment users by a fact of conversion accomplishment. For example, if user is a constant buyer (places at least one order per month), we can show some special offers or discounts for that specific group of users. In this scope, conversion would be same as transaction (of course, can be customized to work only with certain products etc.), but it can be used later on for segmentation with rule “at least one conversion per month”. In the end, conversion in Frosmo system is a very powerful and limitlessly customizable tool, which can help with any kinds of complex requests later on.
3.3 Segmentation
Segmentation in Frosmo starts from automatically created segments. Those include: segmentation by visitor’s device (desktop, mobile, tablet) and segmentation by visitor’s activity (weekly returning user, monthly returning user, new user). All segmentation events in Frosmo are instant – if user has performed a defined action, (s)he will be segmented immediately.
As I was saying in previous chapter, Frosmo can also use Custom actions to segment users. Since Custom action can be anything, it gives us absolute
24
flexibility in defining segments, only your imagination is the border. That is the main principle of Frosmo – to make it possible to implement any customer’s idea within a short period. Very important tool from segmentation is Segment grouping. Define any segments and assign them to one Segment group with a rule, which can be “general”, “mutual exclusive” and “funnel”. Mutual exclusive means that a user can belong only to one segment in this Segment group. Funnel means that the user advances through segments in a funnel mode and can only belong to 1 segment at a time and cannot go back. General is just for keeping the assigned segments together, which allows to see the total number and the distribution of people more easily. Live example of using funnel mode of Segment groups can be tracking of how many orders a user made, starting from 1 and ending for example with 5. Period between orders should not exceed 1 month, and after fifth order, website will provide a promo code to the user. Looks like this is a tough task but in fact it is just few minutes of clicking in Frosmo admin panel, if conversion was pre-defined earlier.
3.4 A/B tests
A/B test is showing the same page in two (but not limited to) different versions and comparing, which one performs better by defined measurement methods. In case of Frosmo, we can measure performance of each version by defining conversions (can be anything, as I explained earlier) and comparing their total number. To be able to show different versions of the same page to users, we need to segment them, because we do not want same user to see different versions of the page – user should see a random version, which will be remaining the same until the end of A/B test. Segmentation in this case is done by action of a simple visit for the page and user is assigned to a random segment of users, who see the same version of the page. Each version typically has own specific modification or a difference in existing modifications. For example, group A can see some email sign up form as a pop-up and group B can see the same sign up form embedded to the page content. Conversions in this case will be the email feed subscriptions. Usually, to make A/B test results significant, we carry out tests during weeks or sometimes months. The automatic statistics and calculation part is done at the

25
backend, which makes seeing the results as simple as navigating to the admin panel. Once results are gathered and presented to the customer, (s)he decides, whether there is a further action needed. For example (and most usually), we select the best performing page variation and make it visible to 100% of users.
26
4 RESEARCH MODEL
4.1 Introduction
Since online shopping is continuously growing and changing, it has forced companies to apply new strategies and methods. One method for improving sales is personalizing the online shopping experience by targeting individual interests through dynamic product recommendations. This activity has become necessary for any online store. Personalized messages help to prevent customer from information overflow. Ideally, these will help to customers in their buying decisions, increasing click-through rates and thus, sales. However, in the same time, personalized messages may seem to be intrusive and some customers may be afraid of losing control of their own privacy, which may lead to the negative reaction from customer’s side. There are many studies and reports available, which investigate intrusiveness and irritation of personalization, like Li et al. (2002) and Edwards et al. (2002). Li describes intrusiveness as “a perception or psychological consequence that occurs when an audience’s cognitive processes are interrupted.” In other words, advertisements will be intrusive if when they are received, final goals are interrupted, meaning, if such advertisements will be rather helping in reaching final goals, this should bring positive results. However, effectiveness of such is not yet well proved by field tests and data analysis. In this technical part of my thesis, I will use Frosmo platform and methods, which I described earlier, to separate and analyze effectiveness of personalized messages, which we try to make as less intrusive as possible.
4.2 Hypothesis and research model
This study tries to investigate relationship between both personalized and non-personalized product recommendations and their placements. Those will be categorized by the site they are introduced on and analyzed by amount of transactions, which were affected by them. According to Senecal and Nantel (2002), I can divide all product recommendations into “Buy also”, “Recommended for you”, “Others have viewed also” and “The most popular right now”. In addition, according to
27
Wattal et al. (2011), those can be sub-categorized into implicit and explicit (using personal data like name). In simple words, product recommendations are messages used to show recommended products. Term "product" dependents on customer. On retail customers, products are self-explanatory, in travel sites products are usually destinations/bookings, in ticket selling sites products might be events etc. The recommendation of these products usually depends on what user have been browsing or buying recently. It also might depend on current product being watched, products which are already in the basket (if people usually buy a bundle of products) and any other custom actions or options. To be able to recommend products, in Frosmo, we need to set up a feature called product tracking on the client’s website first. We need to know what products our clients have, how many page visits each product gets, etc. We write a JavaScript code, so that each time a visitor visits a product page, the script sends us the information about that product, and we save it in our database. We can use that data to make recommendation messages, for example, we can recommend bestseller products to visitors based on the data we have collected. Of course, product tracking and product recommendation are coming from back-end, since we need to communicate with products database to select products, which match certain criteria. An individual product in database can have any custom fields, along with the generic fields. Generic fields are fields which are common for most of the products, regardless the field or scope. They are product category, product id, product name, product price, product discount price, product image, and product url. Along with these, a product can have any additional fields or parameters, which are stored in JSON format in column named as product promotion label. This way of storing gives us flexibility along with reliability and effectiveness. For analysis part, I will use logs from our back-end, which contain information about all messages shown (along with non-personalized ones) and transactions made. These logs contain everything, which has ever happened on websites, which were using Frosmo. For each individual user (there is no private data kept), I can see, what (s)he was seeing or doing before (s)he made a conversion or even transaction. These logs are individual for each client and separated to files on a daily basis. On average, each file content is around at least 300 000 lines daily, which depends on how big is the client and how many visitors did it have on a specific day.
28
I do not know, who exactly performed the actions like a click on the website, but I can construct the sequence of actions for each user, since everybody has assigned random id, which stays the same all the time. Each action in the logs has user id, timestamp and description of what exactly happened. I can check all actions happened on a site during certain period, and since I know the unique id of recommendation messages we use, I can pick up the information I need based on that. For example, how many people have seen the recommendation, how many did click it, how many performed transactions afterwards. To analyze these log files, I have created a program, using C# as a programming language and .NET as a platform. More information about this you will find in the next chapter.
4.3 Method
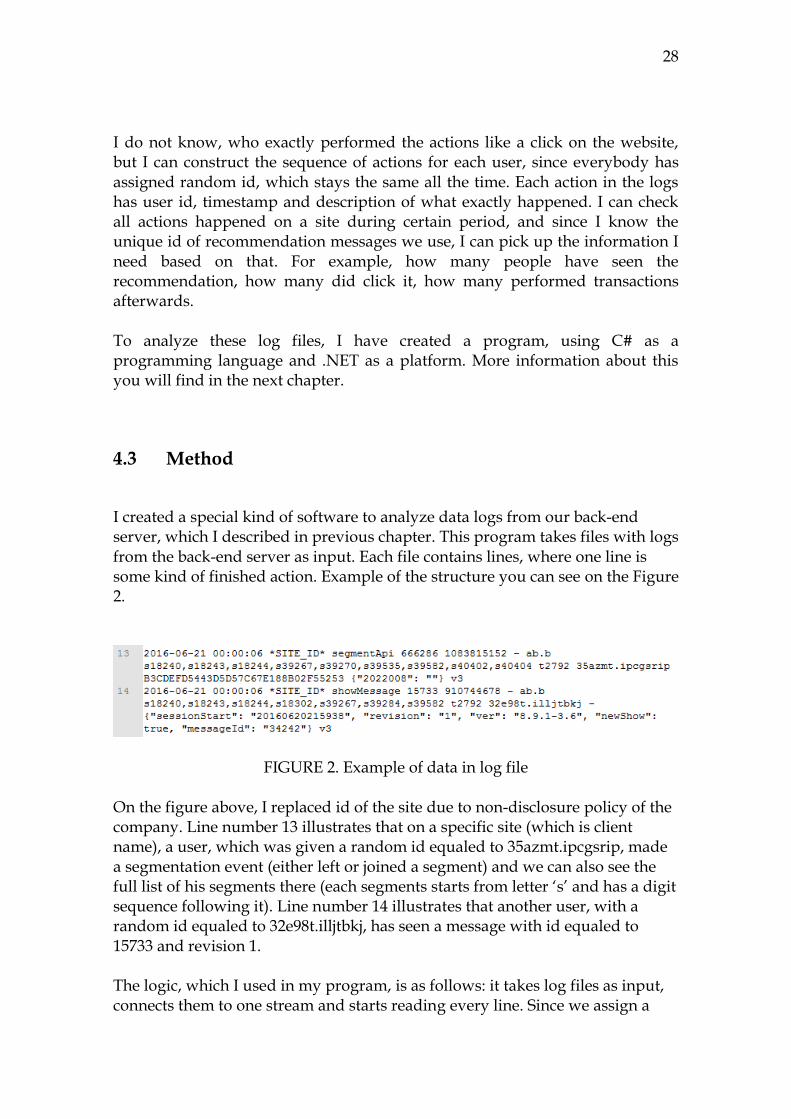
I created a special kind of software to analyze data logs from our back-end server, which I described in previous chapter. This program takes files with logs from the back-end server as input. Each file contains lines, where one line is some kind of finished action. Example of the structure you can see on the Figure 2.
FIGURE 2. Example of data in log file
On the figure above, I replaced id of the site due to non-disclosure policy of the company. Line number 13 illustrates that on a specific site (which is client name), a user, which was given a random id equaled to 35azmt.ipcgsrip, made a segmentation event (either left or joined a segment) and we can also see the full list of his segments there (each segments starts from letter ‘s’ and has a digit sequence following it). Line number 14 illustrates that another user, with a random id equaled to 32e98t.illjtbkj, has seen a message with id equaled to 15733 and revision 1. The logic, which I used in my program, is as follows: it takes log files as input, connects them to one stream and starts reading every line. Since we assign a
29
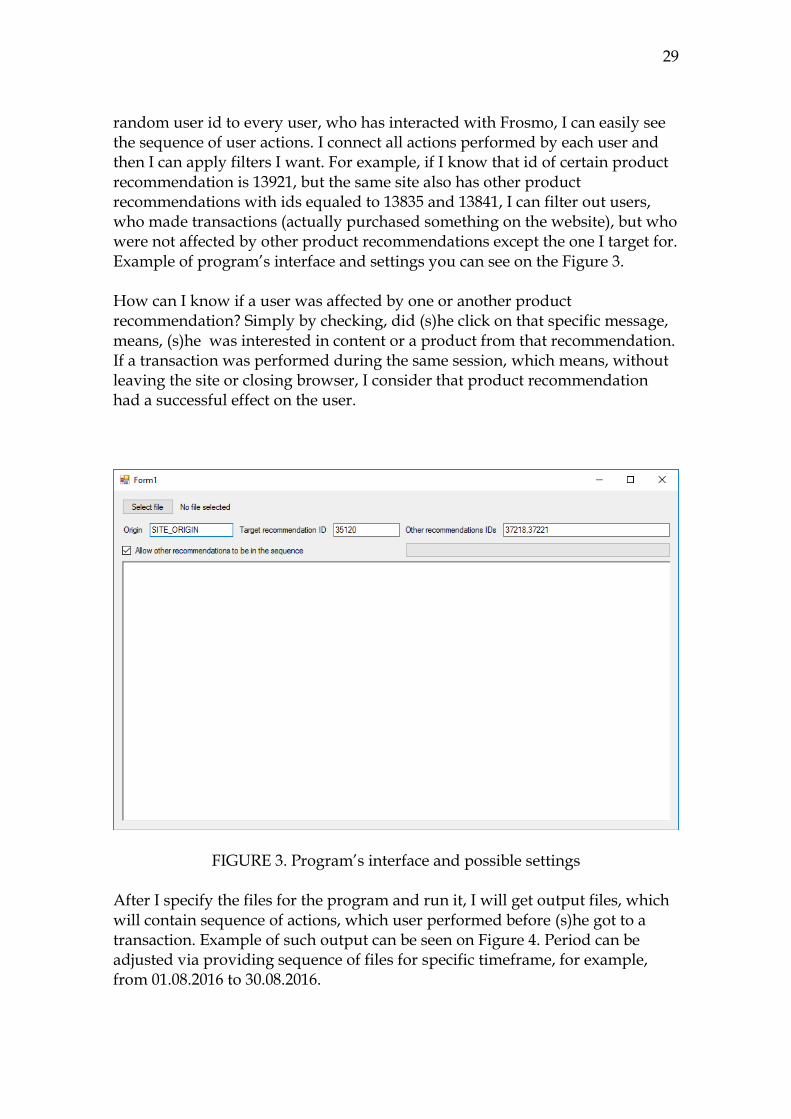
random user id to every user, who has interacted with Frosmo, I can easily see the sequence of user actions. I connect all actions performed by each user and then I can apply filters I want. For example, if I know that id of certain product recommendation is 13921, but the same site also has other product recommendations with ids equaled to 13835 and 13841, I can filter out users, who made transactions (actually purchased something on the website), but who were not affected by other product recommendations except the one I target for. Example of program’s interface and settings you can see on the Figure 3. How can I know if a user was affected by one or another product recommendation? Simply by checking, did (s)he click on that specific message, means, (s)he was interested in content or a product from that recommendation. If a transaction was performed during the same session, which means, without leaving the site or closing browser, I consider that product recommendation had a successful effect on the user.
FIGURE 3. Program’s interface and possible settings After I specify the files for the program and run it, I will get output files, which will contain sequence of actions, which user performed before (s)he got to a transaction. Example of such output can be seen on Figure 4. Period can be adjusted via providing sequence of files for specific timeframe, for example, from 01.08.2016 to 30.08.2016.
30
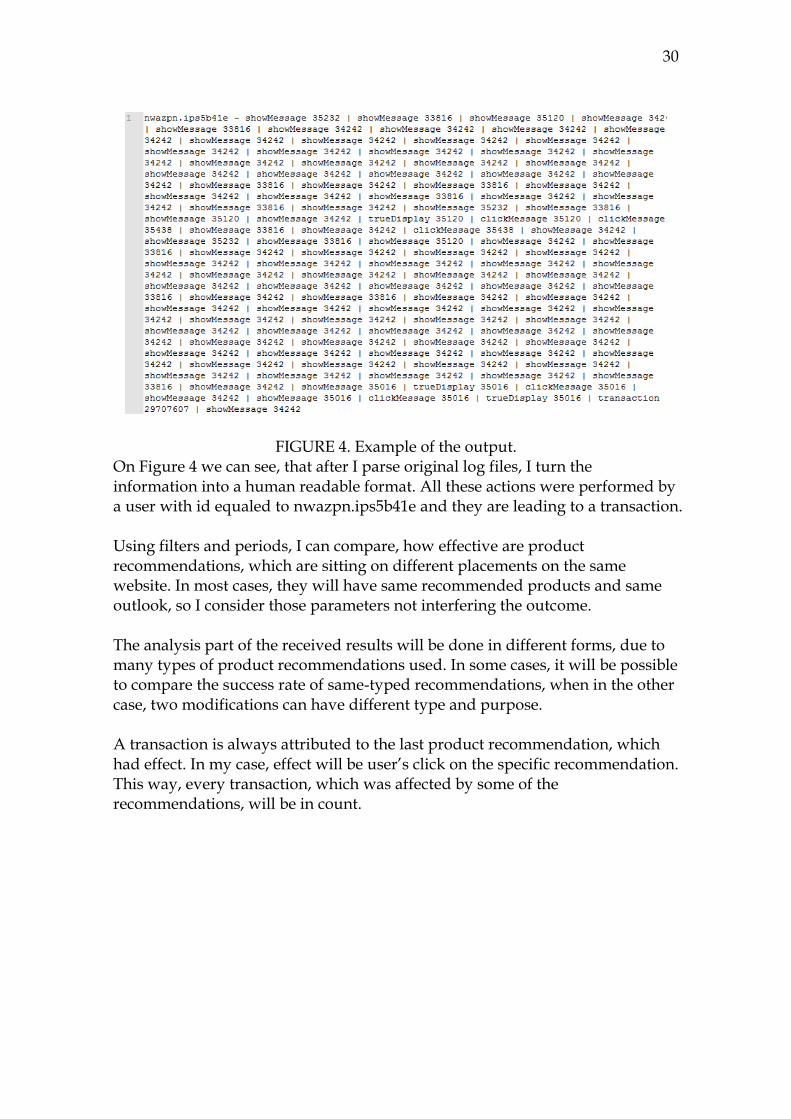
FIGURE 4. Example of the output. On Figure 4 we can see, that after I parse original log files, I turn the information into a human readable format. All these actions were performed by a user with id equaled to nwazpn.ips5b41e and they are leading to a transaction. Using filters and periods, I can compare, how effective are product recommendations, which are sitting on different placements on the same website. In most cases, they will have same recommended products and same outlook, so I consider those parameters not interfering the outcome. The analysis part of the received results will be done in different forms, due to many types of product recommendations used. In some cases, it will be possible to compare the success rate of same-typed recommendations, when in the other case, two modifications can have different type and purpose. A transaction is always attributed to the last product recommendation, which had effect. In my case, effect will be user’s click on the specific recommendation. This way, every transaction, which was affected by some of the recommendations, will be in count.
31
5 RESEARCH FINDINS
5.1 Case 1 – a travel company
First client is a travel company. It operates in tourism business. Their portfolio consist of tour operators, 1,800 travel agencies and online portals, six airlines with more than 130 aircraft, over 300 hotels with 210,000 beds, 13 cruise liners and countless incoming agencies in all major holiday destinations around the globe. Their aim is to offer high quality end-to-end customer experience through fully integrated tourism business, from inspiring and booking to flight and transfer right through to the holiday itself in a hotel or on board a cruise ship. There are all in all 3 product recommendation messages on this website, one homepage recommendation with most viewed hotels and two recommendations which are sitting on 3rd and 4th step of purchase funnel, which contain personalized hotels or offers. All recommendations are styled to fit original website’s content and not to seem aggressive. According to Senecal and Nantel (2011) and Wattal el al., the home page product recommendation is “The most popular right now” and implicit, when the rest two modifications are implicit “Recommended for you”. It gives me possibility to not only compare two different types of recommendations in two different places, but also compare the same ones, which are placed on different steps of the checkout funnel.
5.1.1 Product recommendation #1
The overall idea of this recommendation is to display four most viewed trips for new users on the homepage and after visiting four different trip pages, the content changes to 4 last viewed trips. The Client give us the design and the wish to add 4 products. We decide to show the four most viewed combined trips for the new users and the four last viewed hotels from a known user, when this user visited minimum four different trip pages. This way, we can both target new users with most purchased items on the site, which seems to be the best option for user, who has just arrived to the website, as well as old users, showing them hotels they have been interested in recently.
32
5.1.2 Product recommendations #2 and #3
The Idea is to show flexible product recommendations in the bottom of booking funnel in step 3 and step 4 related to the current searched country or region. If a user has searched for Hotels in Mallorca, (s)he will get the results from these countries in step 3 of the funnel. We generate three boxes filled with products of the same country, for example Spain, but from different regions / destinations. Click on the recommended product brings the user to step 4, also selecting the product as final result. In step 4 the User can select another hotel to replace the already selected one. We generate three boxes filled with products of the same region/destination. Click on the recommended product holds the user in step 4 and shows a new hotel instead of the previous one. We also remember the last 10 viewed hotels in local store and do not show these in these boxes as recommended products. We separate products by type as well: if a user searches only for hotel, recommendation will contain hotels, or, if a user searches for combined trips, recommendation will contain only combined trips.
5.1.3 The numbers
The period for this case will be from 6 June 2016 until 25 December 2016, all together, around 7 months. During the whole time, all modifications were active and no changes were done to them or their placements. In total, there was 29 156 517 lines of logs analyzed and 4574 transactions made during that period. We need to keep in mind, that even smallest transaction is in fact at least few hundreds of euros, since it is a travel agency. So even a few transactions in a month, which were brought by product recommendation, make a difference.
5.1.4 Results of product recommendation #1
During the selected period, this product recommendation, which was containing either most popular or the last visited properties, has attributed to itself 33 transactions (was clicked last, before transaction was made). This is not
33
that much as I expected, because I presumed, that homepage is a standard place to keep a product recommendation, but apparently, it is not that good, at least, for the current website, if we compare this result to the rest of product recommendations.
5.1.5 Results of product recommendation #2
As I said before, this product recommendation was sitting on the third step of checkout funnel (the step before last). In addition, my assumption was that it is not that good to keep something like this in the checkout funnel. However, it attributed practically the same amount of conversions – 32. It tells us that there are cases, when people were not sure, which destination they want to visit. Even though it is the same country, destination can be different. It helps people who struggles with problem of selecting next vacation place to make a better choice by showing more same kind of options.
5.1.6 Results of product recommendation #3
The last product recommendation was sitting in the step 4 of the checkout – a step, where you can once more verify everything before booking. This was a good surprise for both client and us – it attributed 159 transactions, practically, 5 times more than others did. This recommendation makes it easy for user to switch to another hotel in the same selected place (town) in one click. Most probably, good user experience plus variety of same kind of choice made this recommendation to perform best. In fact, 159 transactions is a huge sum for travelling website, so as client said, probably, we discovered a gold mine. We won’t be able to know, how much the transaction amount will drop if we turn off this product recommendation, but we both tend to believe, that this one is making valuable effect. At least, it should convince user that the agency is interested in providing variety of choices and the best possible vacation for every client.
5.1.7 Summary
Our assumptions were very different from what the data showed to us. We thought that probably product recommendations in the checkout funnel might distract the user from finishing the transaction or even put him to thinking, where does (s)he really want to go, which means, (s)he might even leave the website. However, in fact, quite a few people are interested in switching their options even at the last step of the checkout.
34
Roughly, about 5% of all transactions were affected by product recommendations. Of course, as a company, we try to target closer to 30%, but every case is different. I think, for the described case, product recommendations are doing good job, but of course, we might reconsider them, once this thesis is done and another cases are analyzed. I hope to find some patterns in next cases and convince client to carry out an A/B test with using discovered by me new data to see, if it is going to raise the total percent of affected transactions.
5.2 Case 2 – wrist watches shop
This client is one of the largest online & offline retail shop for the wristwatches. They have also B2B distribution rights for the major watch brand. This means, they have other offline & online watch sellers as their customers. Their income is mainly coming from the large network of the web-shops and offline shops, so it is vital to invest resources in new ways of growing transactions amount. The site is rigid and is not easily customizable. Customer’s IT knowledge and capabilities are very low as well.
Product recommendations (there are four of them now, in total) are all of the same type – they are hidden personalized recommendations of watches. When searching by a specific type of watches (male, female, kid or by brand), recommendations are always showed as the first five watches in the results. However, they do not have any specific style – they use the same styling as the rest of results. Thus, user does not know that actually (s)he might be buying a recommended product.
All four recommendations are categorized as hidden implicit “Recommended for you” type. The fact, which I want to analyze, is how big percent of transactions are coming from those recommendations and in which category a recommendation seems to be performing the best. I expect to see some valuable results of given recommendations for the final transactions amount, since they are hidden and they cannot frustrate the users.
5.2.1 The numbers
35
The period for this case will be from 17 January 2017 until 17 February 2017, all together, around 1 month. During the whole time, all modifications were active and no changes were done to them or their placements. In total, there was 19 063 818 lines of logs analyzed and 4256 transactions made during that period by 6636 users in total. In this case, transaction’s total varies quite much, but it is visible, that this is a successful web-shop with a noticeable number of transactions per month. The user’s chance of making transaction is also on a high level. Presumably, that is also because of the shop’s name – it is quite famous in certain countries.
5.2.2 Results of product recommendations
In total for all four recommendations, there was 557 attributed transactions (those, which were made directly after interacting with a recommendation), which is around 13% of all transactions made on the selected period. Recommendations do not cover all the possible searches. With keeping that in mind, the percent is considerably high. The best performing recommendation was the one in Male category, while the worst was in the Kid category, which is predictable – most of watch buyers are, of course, men. From the other side – in 13% of all searches, which lead to a transaction, people found what they wanted on the first line in the results. Isn’t that something? One important detail is that recommendations are not affected with “filter by price ascending or descending” feature (and they never show watches, which are cheaper, than searched range, if any), which means, they also raised the transaction’s total in the end.
5.2.3 Summary
I can consider my expectations partly proved. Relatively small resources investment in the development (in total, 30 hours) made old and static content personalized in a safe way – without possibly frustrating users. Hidden recommendations are always showing watches, which are not filtered by price ascending or descending filter, giving us a chance on an upsell. 13% of users are buying watches, which are recommended by us, without knowing it, which is, for sure, a positive result. There is a certain increase in monthly transactions amount as well. In addition, those users are happy to find
36
what they were looking for right in the beginning of the search page – in the first line of results. I do not see any possible cons of those recommendations as well as the customer, so in the end, the recommendations were included in the constant content of the web-shop.
5.3 Case 3 – electronics shop
The last client in scope of this thesis is a huge network of stores selling consumer electronics. It has numerous shops throughout Europe and Asia. Personalization on websites of such size is essential because even a small positive difference in transactions’ average value will be significant, since the amount of transactions on a daily basis is quite huge. We carried out our modifications so far only on one website, because client wants to get significant prove of our necessity and whether it is worth to personalize the content. There are in total six modifications on the home page with dynamic content. Only one of them is truly personalized, while the rest is used to list some limited by time offers or to show the best sellers of some category, which does not depend on consumer’s preference but can be easily changed by the owners of the shop, meaning, this week they can highlight TVs as category and next week it can be kitchen gear. I was interested to see whether the personalized message attracts more final transactions than the rest five, which are pre-decided by owners. On purpose, we put the personalized message on the second line of products, while the first line is some highlighted category. It means, that consumer’s attention will first go through the pre-selected products, and only then to the personalized products. I presume to see some significant difference in amount of attributed transactions between the personalized message and the rest five with not personalized content.
37
5.3.1 The numbers
The period for this case will be from 17 January 2017 until 17 February 2017, all together, around 1 month. During the whole time, all modifications were active and no changes were done to them or their placements. In total, there was 32 514 238 lines of logs analyzed and 21 054 transactions made during that period by 129 835 users in total. This was the biggest source of data for carrying out researches in this thesis. Obviously, it is visible that this shop is a big player on the market and they are interested in personalization.
5.3.2 Results of product recommendations
I was quite surprised by results in some sense. To present results in more compact way, as I do not see a reason to go into details of each modification, I will compare one personalized message against five non-personalized ones. Roughly, personalized content attracts around 36% of all transactions, when the rest 64% are attributed to the rest of modifications. Keeping in mind, this is only 1/6 (or around 16%) part of the front page. I did not success to measure average transaction value of personalized baskets, because the data was too big for the kind of parser I have created. It can be explained by behavior of a typical consumer on such kind of sites – people usually compare many products (for instance, smartphones) there.
5.3.3 Summary
The need and positive effect of personalization for this website is proved by those numbers in my opinion. Looking at total amount of users, you can imagine, how many of those users may end up not buying anything because they did not find what they wanted or they were annoyed by the static content on the website. I tend to believe that if all modifications were personalized more, the total income would have increased. This is the way to proceed as planned now – to turn few of those six modifications to be personalized. For example, they can show best sellers from categories you have previously visited. This way, at some point, most of the content on the front page will be personally tailored for each user, while shop still has possibility to push special offers in between, which is my perfect vision of a main page for consumer electronics shop.
38
6 CONCLUSIONS
During this study, I have learnt how we are getting, storing and using data in Frosmo. I successfully build my own software to parse logs from our back-end servers. I have defined my own model of conversion attribution and used it to compare many personalization modifications among three e-commerce websites. I have learnt that it is hard to presume, what will be the practical result of a personalization. It certainly requires a lot of testing to find the best place and way for personalization on each site. Typical placement for all websites I have analyzed was home page, which did not make significant impact in all cases. For example, in case #1 the best placement was on the last step of checkout. Case 2 showed us that personalized content has more chances to attract users and same thing happened in case 3. Regarding the question of personalization effectiveness, I think that given three cases proved the recommendations being a rewarding and value-bringing change. Although, all those cases were carefully planned beforehand, which is not happening each time when you test a new personalized content in e-commerce, which is why it is called testing. However, the results for each one of them makes it clear – if your target is to raise amount of conversions and you plan carefully new personalized features, it is possible to accomplish positive results. I certainly think that personalization for ecommerce websites is a profitable way of inversing resources nowadays. In addition, it would be much easier, cheaper and faster to use ready solutions from such companies as Frosmo, which already have big experience in this sphere. I believe that during next few years, most of e-commerce websites will be based on personalization and we will see a dramatic decrease in volume of static content, which will increase the volumes of shopping done worldwide.
39
REFERENCES
Alba et al., Interactive Home Shopping: Consumer, Retailer, and Manufacturer Incentives to Participate in Electronic Marketplaces, Journal of Marketing, 1997 Ansari, A. & Mela, 2003, E-customization, Journal of Marketing Research Ansari, A., Essegaier, S. & Kohli, R. 2000, Internet Recommendation Systems, Journal of Marketing Research Chellappa, R.K. & Sin, 2005, Personalization Versus Privacy: An Empirical Examination of the Online Consumer’s Dilemma, Information Technology and Management David Weinberger et al. 1999. The Cluetrain Manifesto.
Degeratu, A.M., Rangaswamy, A. & Wu, J. 2000, Consumer choice behavior in online and traditional supermarkets: The effects of brand name, price, and other search attributes, International Journal of research in Marketing
Edwards, S.M., Li, H. & Lee, J. 2002, Forced exposure and psychological reactance: Antecedents and consequences of the perceived intrusiveness of pop-up ads, Jour-nal of Advertising
Hammond, K., Ehrenberg, A.S.C. and Goodhardt, G.J., 1996. Market segmentation for competitive brands, European Journal of Marketing
Jakob Marovt, April 2, 2014, Importance of e-commerce personalization in 20 revealing stats, blog.mojn.com
Janrain, July 31, 2013, Online consumers fed up with irrelevant content on favorite websites, janrain.com
Karimi, J., Somers, T.M. & Gupta, Y.P. 2001, Impact of information technology man-agement practices on customer service, Journal of Management Information Systems
Li, H., Edwards, S.M. & Lee, J. 2002, Measuring the intrusiveness of advertisements: Scale development and validation, Journal of Advertising
Mangalindan, M. 2003, Web ads on the rebound, Wall Street Journal
Pine, 1993, Mass customization: The New Frontier in Business Competition
40
Postma, O.J. & Brokke, M. 2002, Personalisation in practice: The proven effects of personalisation, The Journal of Database Marketing
Shelby D. Hunt & Dennis B. Arnett, Market Segmentation Strategy, Competitive Advantage, and Public Policy, 2004, Australasian Marketing Journal
Srinivasan, S.S., Anderson, R. & Ponnavolu, K. 2002, Customer loyalty in e-com-merce: an exploration of its antecedents and consequences, Journal of Retailing
Senecal and Nantel, 2002, The influence of online product recommendations on consumers’ online choices
Shankar, V., Smith, A.K. & Rangaswamy, A. 2003, Customer satisfaction and loyalty in online and offline environments, International Journal of Research in Marketing
Wattal et al., 2011, What's in a “Name”? Impact of Use of Customer Information in E-Mail Advertisements
Winer, R.S. 2001, A framework for customer relationship management, California Management Review