Embed Size (px)
Citation preview

DR. S. JYOTHIRMAYE REDDY DR. B. VENKATESWARA REDDY S. DURGA RAO 1P a g e
CUSTOMER SATISFACTION: A COMPARATIVE STUDY OF
MARUTI AND TATA MOTOR CARS IN ANDHRA PRADESH
DR. S. JYOTHIRMAYE REDDY
Department of Business Management,
Sri Sai Ram Institute of PG Studies, North
Rajupalem, Nellore Dist. (AP) INDIA
DR. B. VENKATESWARA REDDY
Dean, Dept. Of Management Studies
Narayana Engineering College,
Nellore (AP) INDIA
S. DURGA RAO
Department of Management Studies
S V University, Tirupati
(AP) INDIA
The automobile sector plays a vital role in the development of a nation. India is one of the
largest and fastest growing countries in automobile sector. The research covers customer
satisfaction towards Maruti and Tata Motor cars. The present study was carried to identify
the relationship between demographic factors and customer satisfaction. The positive
influence of customer satisfaction makes the customers to be loyal to the company. The
population of the study comprises the total population of five cities in Andhra Pradesh.
Random sample was carried on 1000 customers out of which 500 are Maruti users and 500
are Tata Motor car users. A well designed questionnaire was administered for the study. Chi-
square, ANOVA, Regression, F-test & Z-test were used to analyse the data. The analysis
helps in providing improvements in the pertinent areas of Maruti and Tata Motor cars.
Key words: Automobile Industry, demographic factors, customer satisfaction, positive
influence, Quality, service.
1.1 INTRODUCTION:
Automobile industry has become the back bone of the Indian economy which employee’s 13
million individuals in India. The automotive industry is contributing about 3.1 % of India’s
GDP. India is one of the fastest growing car markets in the world. India is expected to
overtake China by 2050 in terms of the number of units sold. India has a huge domestic
market and as of now it has a low base of car ownership (17 per 1000 people). Lower cost of
production, availability of skilled labour, surging economy, pro industrial policy of the
government made India to be a huge attraction for car manufacturers across the globe.
Several foreign auto manufacturers like Ford, General Motors, Honda and Hyundai have their

DR. S. JYOTHIRMAYE REDDY DR. B. VENKATESWARA REDDY S. DURGA RAO 2P a g e
own manufacturing bases in India. Multiplicity of local taxes, high import duties on raw
materials, high taxes on services, lack of infrastructure, poor after sales service, inconsistency
in quality, congested roads are becoming hurdles for the higher growth rate of passenger cars
industry.
1.2 Review of Literature:
Dr. V. Senthilkumar (2012) conducted a research on the effects of customer service and
product quality on customer satisfaction and loyalty to clarify the relationship among four
variables of customer service quality, product quality, customer satisfaction and customer
loyalty. For this a well designed questionnaire was administered using five point Likert scale.
52 customers were surveyed using this questionnaire. The data analyses revealed that
customer service and product quality have been influential on customer satisfaction. The
researcher concluded that there is a positive and meaningful relationship between customer
satisfaction and customer loyalty. Prof. Nistorescu, Mr. Mihail Barbu and Mr. Roxana
Ioana Dumitriu (2013) conducted a study concerning customer loyalty in the auto market.
The objective was to study the dimensions of loyalty viz. satisfaction, re-acquisition, and
recommendation, and to see if there were any correlations among the three dimensions. 593
customers were taken as sample for the survey. Simple random sampling technique was used
to select the sample. The analysis showed that there was statistically significant correlation
between satisfaction and repurchase, between satisfaction and recommendation and between
recommendation and repurchase. The researchers concluded that loyalty is a powerful
marketing tool and the three dimensions are interrelated. Prof. Pallawi B. Sangode (2011)
conducted a comparative study on Service Quality of Maruti Suzuki and Hyundai Dealers in
Nagpur. The objectives of the study were (i) To understand and categorize the factors
influencing service quality (ii) To find out the variables which can be defined under each
factor (iii) To compare Maruti and Hyundai showrooms in terms of quality. For this a survey
was conducted using convenience sampling method. 40 respondents who were users of
Maruti and Hyundai cars were taken for the study. From the analysis it was found that there is
a significant difference between the service quality provided by Maruti and Hyundai dealers.
1.3 Statement of the problem:
In this competitive environment corporate companies are keen in promoting brands and
creating brand value to project their products and to sustain in the market. Hence it is very
essential to know the determinants and measurement of brand equity and its implication on
value of the firm. Automobile industry in general and car industry in particular is chosen
taking into account the emergence of many new brands of cars in the recent past and
changing mind set of the customers on the purchase of cars. Customer satisfaction plays a
key role in choosing a particular brand.

DR. S. JYOTHIRMAYE REDDY DR. B. VENKATESWARA REDDY S. DURGA RAO 3P a g e
1.4 Significance of the study:
In this dynamic environment, Customers are becoming more comfort conscious than price.
Choosing a particular brand of car requires lot of prior information and good decision making
skills to come to a conclusion as to what of type of car has to be purchased.
1.5 Objectives of the study:
1. To measure the customer satisfaction level towards Maruti and Tata Motor cars in Andhra
Pradesh.
2. To compare the customer satisfaction level between Maruti and Tata Motor cars.
3. To provide suggestions to improve the customer satisfaction of Maruti and Tata Motor
Cars.
1.6 Research Methodology
Research design: Descriptive research
Data sources:
Secondary Data: Secondary data sources are journals, magazines association bulletins
(SIAM, ICRA), news papers, web portals, company brochures, books etc.
Primary Data: Users of Maruti and Tata Motor Cars in Andhra Pradesh are the primary
data sources.
Research approach: Survey method
Research instrument: Structured questionnaire
Sampling design:
Sampling frame: Customers of Maruti and Tata Motor cars in major cities of Andhra
Pradesh were taken for the survey. The cities considered for the study were Guntur,
Nellore, Rajahmundry, Vijayawada and Visakhapatnam
Sampling unit: Maruti and Tata Motor Car users.
Sample Size: The sample size is 1000 (500 Maruti and 500 Tata, 200 from each city)
Sampling method : Convenience sampling method

DR. S. JYOTHIRMAYE REDDY DR. B. VENKATESWARA REDDY S. DURGA RAO 4P a g e
Contact method: Personal contact
Statistical Tools Used: Chi-square Test, Regression Analysis, ANOVA, Z-Test, F-Test.
Scope of the Study:
The present study aims at assessing the customer behaviour and satisfaction by using Maruti
and Tata Motor car respondents. It also tries to identify the factors influencing the choice of
different models.
Hypotheses:
H01: Customer satisfaction level of Maruti and Tata Motor cars is independent of age.
H02: Customer satisfaction towards Maruti and Tata motor cars is independent of family
size.
H04: Customer satisfaction towards Maruti and Tata motor cars is independent of
occupation.
H05: Customer satisfaction towards Maruti and Tata motor cars is independent of
income level.
H07: There is no significant difference in customer satisfaction between Maruti and Tata
Motor cars.
1.7 Limitations of the study:
The study is restricted to five major cities in Andhra Pradesh.
The study is confined to the existing passenger car users.
The data has been gathered using a questionnaire and hence the limitations of the
questionnaire are inherent in the report.
1.8 DATA ANALYSIS:
1.8.1 DEMOGRAPHIC PROFILE OF THE RESPONDENTS
Distribution of overall sample respondents based on their demographic characteristics namely
age, family size, educational qualification, occupation, income level and years of ownership
are displayed in table 1.1.
Age:

DR. S. JYOTHIRMAYE REDDY DR. B. VENKATESWARA REDDY S. DURGA RAO 5P a g e
The overall sample represents 295 (29.5%) respondents from the age group of ‘less than 30
years’, 469 (46.9%) from‘30 to 45 years’, and 236 (23.6%) from ‘above 45 years’. It is found
that majority of the respondents are from the age group of ‘30-45 years’. The major
respondents are below 45 years for Maruti and are above 30 years for Tata cars.
Table 1.1 Profile of the Respondents (N=1000)
Characteristics Groups Overall Maruti Tata
Freq. % Freq. % Freq. %
Age
Below 30 years 295 29.5 209 41.8 86 17.2
30 – 45 years 469 46.9 211 42.2 258 51.6
Above 45 years 236 23.6 80 16.0 156 31.2
Total 1000 100.0 500 100 500 100
Family Size
< = 3 members 337 33.7 243 48.6 94 18.8
4 members 487 48.7 211 42.2 276 55.2
> = 5 members 176 17.6 46 9.2 130 26.0
Total 1000 100.0 500 100 500 100
Income Level
< 4 lakhs 286 28.6 215 43.0 71 14.2
4 – 6 lakhs 375 37.5 116 23.2 259 51.8
6 – 8 lakhs 172 17.2 62 12.4 110 22.0
> 8 lakhs 167 16.7 107 21.4 60 12.0
Total 1000 100.0 500 100 500 100
Name of the
passenger car
company
MARUTI 500 50.0 500 100 - -
TATA 500 50.0 - - 500 100
Total 1000 100 500 100 500 100
Family Size:
From the survey, it is found that majority of the respondents are having family size as ‘4
members’ (n=487), followed by337 respondents having less than or equal to 3 members as
family size. 176 respondents are having family size ‘above or equal to 5 members’. Majority
of the Maruti respondents are having family size of less than or equal to four members,
whereas majority of Tata respondents are having ‘above or equal to four members’.
Income Level:

DR. S. JYOTHIRMAYE REDDY DR. B. VENKATESWARA REDDY S. DURGA RAO 6P a g e
Majority of the sample respondents are having ‘4-6 lakhs’ of annual income (n=375, 37.5%).
286 respondents (28.6%) are having less than 4 lakhs of annual income. 172 (17.2%)
respondents have ‘6-8 lakhs’ of annual income and 167 (16.7%) respondents are having
above eight lakhs. For Maruti the average annual income is less than 6 lakhs and for Tata the
average annual income is between 4 - 8 lakhs.
1.8.2 FACTORS OF CUSTOMER SATISFACTION ON CAR PURCHASE
The following section discusses the descriptive analysis of factors namely external design,
quality, performance, sales capability and service capability; customer satisfaction and
customer ranking of attributes for the overall sample.
External design:
‘External design’ parameters are in positive side i.e. customers are satisfied with the External
design of Passenger cars. The highest mean is recorded for the appearance of passenger cars
(mean=4.27) and comparatively low mean values are observed for the side view of the
Passenger cars (mean=3.67) and rear view of the passenger cars (mean=3.68). The front view
of the passenger cars is found to be good according to the respondents (mean=3.83). The
overall mean for ‘External design’ factor with respect to the Passenger cars is 3.86 which is
fairly a good and positive score.
Table 1.2 Customer Satisfaction towards External design of Passenger cars (N=1000)
Variables 1 2 3 4 5 Mean S.D.
Appearance 10
(1.0)
16
(1.6)
21
(2.1)
617
(61.7)
336
(33.6) 4.27 0.584
Front view 12
(1.2)
17
(1.7)
206
(20.6)
659
(65.9)
106
(10.6) 3.83 0.630
Side view 24
(2.4)
59
(5.9)
286
(28.6)
490
(49.0)
141
(14.1) 3.67 0.839
Rear view 20
(2.0)
84
(8.4)
262
(26.2)
466
(46.6)
168
(16.8) 3.68 0.918
Overall ‘External design’ 3.86 0.518
NOTE: The values specified in the brackets represent percentages
Anchors: 1 – ‘Highly Dissatisfied’; 2 – ‘Dissatisfied’; 3 – ‘Neither Satisfied nor
Dissatisfied’; 4 – ‘Satisfied’; 5 – ‘Highly Satisfied’
‘Appearance ‘found to be high for Tata cars (mean=4.33) and the rest of the variables are
found high for Maruti cars. It is inferred that Tata cars found to be good in ‘Appearance’ and

DR. S. JYOTHIRMAYE REDDY DR. B. VENKATESWARA REDDY S. DURGA RAO 7P a g e
Maruti cars found to be good with respect to ‘Front view’, ‘Side view’ and ‘Rear view’. The
overall satisfaction on ‘External design’ found to be high for Maruti cars (mean=3.95)
compared with Tata cars (mean = 3.77).
Table 1.3 Summary of ‘External design’ across different Samples
‘External design’
Variables
Total Sample
(N=1000)
Maruti
(N=500)
Tata
(N=500)
Mean S.D. Mean S.D. Mean S.D.
Appearance 4.27 0.584 4.18 0.506 4.33 0.649
Front view 3.83 0.630 3.95 0.608 3.72 0.631
Side view 3.67 0.839 3.88 0.855 3.45 0.765
Rear view 3.68 0.918 3.77 0.939 3.59 0.890
Overall ‘External
design’ 3.86 0.518 3.95 0.533 3.77 0.487
Quality
Respondents are highly satisfied with the ‘Engine ‘of the passenger cars (mean=3.88)
followed by ‘AC system’ (mean=3.77). The respondents found to be less satisfied with the
‘Paint’ of passenger cars (mean=3.58). The rest of the factors namely electronic equipment,
steering system, wheels & tyres, interiors and ground clearance level displayed moderate
mean values ranging from 3.60 to 3.65. The overall mean for ‘Quality’ factor is 3.67.
Table 1.4 Customer Satisfaction towards ‘Quality’ of Passenger cars (N=1000)
Variables 1 2 3 4 5 Mean S.D.
Engine 19
(1.9)
30
(3.0)
188
(18.8)
578
(57.8)
185
(18.5) 3.88 0.778
AC System 13
(1.3)
71
(7.1)
228
(22.8)
528
(52.8)
160
(16,0) 3.77 0.795
Electronic
Equipment
14
(1.4)
80
(8.0)
297
(29.7)
500
(50.0)
109
(10.9) 3.61 0.829
Steering System 20
(2.0)
108
(10.8)
281
(28.1)
418
(41.8)
173
(17.3) 3.62 0.959
Wheels & Tyres 22
(2.2)
125
(12.5)
227
(22.7)
453
(45.3)
173
(17.3) 3.63 0.981
Interiors 10 97 290 442 161 3.65 0.895

DR. S. JYOTHIRMAYE REDDY DR. B. VENKATESWARA REDDY S. DURGA RAO 8P a g e
(1.0) (9.7) (29.0) (44.2) (16.1)
Paint 13
(1.3)
102
(10.2)
305
(30.5)
452
(45.2)
128
(12.8) 3.58 0.882
Ground Clearance
Level
38
(3.8)
96
(9.6)
221
(22.1)
522
(52.2)
123
(12.3) 3.60 0.953
Overall ‘Quality’ 3.67 0.489
NOTE: The values specified in the brackets represent percentages
Anchors: 1 – ‘Highly Dissatisfied’; 2 – ‘Dissatisfied’; 3 – ‘Neither Satisfied nor
Dissatisfied’; 4 – ‘Satisfied’; 5 – ‘Highly Satisfied’
Maruti car sample exhibits high mean values for all the ‘Quality’ variables compared with the
Tata car sample. Thus, it is inferred that respondents are highly satisfied with the ‘Quality’ of
Maruti cars (mean=3.83). The Tata car respondents display lower mean value (3’51)
compared with the Maruti car respondents.
Table 1.5 Summary of ‘Quality’ across different Samples
‘Quality’
Variables
Total Sample
(N=1000)
Maruti
(N=500)
Tata
(N=500)
Mean S.D. Mean S.D. Mean S.D.
Engine 3.88 0.778 4.02 0.629 3.74 0.879
AC System 3.77 0.795 3.90 0.725 3.61 0.831
Electronic Equipment 3.61 0.829 3.83 0.745 3.40 0.854
Steering System 3.62 0.959 3.80 0.850 3.43 1.023
Wheels & Tyres 3.63 0.981 3.80 0.980 3.46 0.954
Interiors 3.65 0.895 3.76 0.852 3.53 0.922
Paint 3.58 0.882 3.73 0.806 3.43 0.929
Ground Clearance Level 3.60 0.953 3.73 0.953 3.47 0.935
Overall ‘Quality’ 3.67 0.489 3.82 0.423 3.51 0.500
Performance
Table 1.6 Customer Satisfaction towards ‘Performance’ of Passenger cars (N=1000)
Variables 1 2 3 4 5 Mean S.D.
Power 11 62 190 571 166 3.84 0.780

DR. S. JYOTHIRMAYE REDDY DR. B. VENKATESWARA REDDY S. DURGA RAO 9P a g e
(1.1) (6.2) (19.0) (57.1) (16.6)
Brakes 20
(2.0)
83
(8.3)
202
(20.2)
515
(51.5)
180
(18.0) 3.75 0.868
Clutch 11
(1.1)
73
(7.3)
267
(26.7)
479
(47.9)
170
(17.0) 3.72 0.830
Suspension System 13
(1.3)
100
(10.0)
274
(27.4)
480
(48.0)
133
(13.3) 3.62 0.860
Fuel Consumption 27
(2.7)
98
(9.8)
220
(22.0)
440
(44.0)
215
(21.5) 3.72 0.994
Maintenance 15
(1.5)
84
(8.4)
237
(23.7)
522
(52.2)
142
(14.2) 3.69 0.869
Driving Comfort 10
(1.0)
89
(8.9)
231
(23.1)
512
(51.2)
158
(15.8) 3.72 0.867
Overall ‘Performance’ 3.72 0.531
NOTE: The values specified in the brackets represent percentages
Anchors: 1 – ‘Highly Dissatisfied’; 2 – ‘Dissatisfied’; 3 – ‘Neither Satisfied nor
Dissatisfied’; 4 – ‘Satisfied’; 5 – ‘Highly Satisfied’
Respondents are highly satisfied with ‘power’ (mean=3.84) and brakes (mean=3.75).
Respondents displayed moderate level of satisfaction on the variables namely driving comfort
(mean=3.72), clutch (mean=3.72) and fuel consumption (mean=3.72). Comparatively low
mean values are recorded for the variables suspension system (mean=3.62) and maintenance
(mean=3.69). The overall ‘Performance’ score of passenger cars is 3.72
Table 1.7 Summary of ‘Performance’ across different Samples
‘Performance’
Variables
Total Sample
(N=1000)
Maruti Cars
(N=500)
Tata Cars
(N=500)
Mean S.D. Mean S.D. Mean S.D.
Power 3.84 0.780 4.04 0.547 3.62 0.906
Brakes 3.75 0.868 3.90 0.882 3.61 0.830
Clutch 3.72 0.830 3.90 0.649 3.55 0.945
Suspension System 3.62 0.860 3.70 0.821 3.54 0.891
Fuel Consumption 3.72 0.994 3.95 0.855 3.49 1.068
Maintenance 3.69 0.869 3.92 0.741 3.46 0.926
Driving Comfort 3.72 0.867 3.98 0.713 3.46 0.931
Overall ‘Performance’ 3.72 0.531 3.92 0.423 3.53 0.557

DR. S. JYOTHIRMAYE REDDY DR. B. VENKATESWARA REDDY S. DURGA RAO 10P a g e
From the table, it is observed that Maruti car sample exhibits high mean values for all the
‘Performance’ variables compared with Tata car sample. Thus, it is inferred that respondents
are highly satisfied with the ‘Performance’ of Maruti cars (mean=3.92). The Tata car sample
displays lower mean value (3.53) compared with the Maruti car sample
Sales Capability
Table 1.8 Customer Satisfaction towards ‘Sales Capability’ of showrooms (N=1000)
Variables 1 2 3 4 5 Mean S.D.
Price 18
(1.8) 81 (8.1)
181
(18.1)
575
(57.5)
145
(14.5) 3.75 0.818
Showroom Equipment 28
(2.8) 58 (5.8)
319
(31.9)
524
(52.4) 71 (7.1) 3.55 0.814
On Time Vehicle
Delivery
26
(2.6) 83 (8.3)
282
(28.2) 537(53.7) 72(7.2) 3.55 0.845
New Car Condition 20
(2.0) 69 (6.9)
252
(25.2)
463
(46.3) 196(19.6) 3.76 0.886
Staff Responsiveness 13
(1.3) 84 (8.4)
325
(32.5)
494
(49.4) 84(8.4) 3.55 0.814
Attractive Display of
Products
15
(1.5) 128(12.8)
266
(26.6)
476
(47.6) 115(11.5) 3.55 0.908
Test Drive Facility 54
(5.4) 79 (7.9)
263
(26.3)
489
(48.9) 115(11.5) 3.54 0.972
Overall ‘Sales Capability’ 3.61 0.482
NOTE: The values specified in the brackets represent percentages
Anchors: 1 – ‘Highly Dissatisfied’; 2 – ‘Dissatisfied’; 3 – ‘Neither Satisfied nor
Dissatisfied’; 4 – ‘Satisfied’; and 5 – ‘Highly Satisfied’
The highest mean of satisfaction is recorded for the ‘New car condition’ (mean=3.76)
followed by ‘Price’ (mean=3.75).The respondents expressed their satisfaction with ‘Show
room equipment’ (mean=3.55), ‘on time delivery’ (mean=3.55), ‘attractive display of
products’ (mean=3.55) and ‘Staff responsiveness’ (mean=3.55) while purchasing cars. The
respondents are comparatively less satisfied with the ‘Test drive facility’ (mean=3.54). The
overall mean value for ‘Sales Capability’ is 3.61, which is fairly good.
Table 1.9 Summary of ‘Sales Capability’ across different Samples
‘Sales Capability’ Total Sample Maruti Tata

DR. S. JYOTHIRMAYE REDDY DR. B. VENKATESWARA REDDY S. DURGA RAO 11P a g e
Variables (N=1000) (N=500) (N=500)
Mean S.D. Mean S.D. Mean S.D.
Price 3.75 0.818 3.94 0.705 3.56 0.877
Showroom Equipment 3.55 0.814 3.68 0.746 3.43 0.859
On Time Vehicle Delivery 3.55 0.845 3.66 0.801 3.43 0.873
New Car Condition 3.76 0.886 3.97 0.644 3.55 1.031
Staff Responsiveness 3.55 0.814 3.68 0.769 3.42 0.838
Attractive Display of
Products 3.55 0.908 3.68 0.806 3.41 0.982
Test Drive Facility 3.54 0.972 3.72 0.891 3.35 1.012
Overall ‘Sales Capability’ 3.61 0.482 3.76 0.409 3.45 0.497
From the table 1.9 , it is observed that Maruti car sample exhibits high mean values for all
the ‘Sales Capability’ variables compared with the Tata car sample. Thus, it is inferred that
respondents are highly satisfied with the ‘Sales Capability’ of Maruti cars (mean=3.76). Tata
car respondents displayed very low mean value (3.45) compared with Maruti car respondents.
Service Capability
The highest mean of satisfaction is recorded for the ‘Service Facility’ (mean=3.77) followed
by ‘Parts availability’ (mean=3.70). The respondents expressed their satisfaction with Timely
response’ (mean=3.53), ‘Service Quality’ (mean=3.50), and ‘Staff response’ (mean=3.41),
while purchasing and availing service for passenger cars. Low mean values are observed for
‘Availability of trained staff’ (mean=3.38) and ‘Service charges’ (mean=3.35). The overall
mean of ‘Service Capability’ for the entire sample of the present study is 3.52.
Table 1.10 Customer Satisfaction towards Service Capability (N=1000)
Variables 1 2 3 4 5 Mean S.D.
Service Facility 17
(1.7)
75
(7.5)
202
(20.2)
545
(54.5)
161
(16.1) 3.77 0.792
Parts Availability 17
(1.7)
66
(6.6)
271
(27.1)
508
(50.8)
138
(13.8) 3.70 0.816
Timely Service 13
(1.3)
121
(12.1)
293
(29.3)
469
(46.9)
104
(10.4) 3.53 0.880
Service Quality 19
(1.9)
122
(12.2)
284
(28.4)
493
(49.3)
82
(8.2) 3.50 0.879
Staff Response 58
(5.8)
70
(7.0)
337
(33.7)
471
(47.1)
64
(6.4) 3.41 0.927
Service Charges 32 162 299 436 71 3.35 0.942

DR. S. JYOTHIRMAYE REDDY DR. B. VENKATESWARA REDDY S. DURGA RAO 12P a g e
(3.2) (16.2) (29.9) (43.6) (7.1)
Availability of Trained
Staff
40
(4.0)
139
(13.9)
324
(32.4)
410
(41.0)
87
(8.7) 3.38 0.938
Overall ‘Service Capability’ 3.52 0.541
NOTE: The values specified in the brackets represent percentages
Anchors: 1 – ‘Highly Dissatisfied’; 2 – ‘Dissatisfied’; 3 – ‘Neither Satisfied nor
Dissatisfied’; 4 – ‘Satisfied’; and 5 – ‘Highly Satisfied’
Table 1.11 Summary of ‘Service Capability’ across different Samples
‘Service Capability’
Variables
Total Sample
(N=1000)
Maruti
(N=500)
Tata
(N=500)
Mean S.D. Mean S.D. Mean S.D.
Service Facility 3.77 0.792 3.92 0.625 3.60 0.900
Parts Availability 3.70 0.816 3.86 0.638 3.52 0.929
Timely Service 3.53 0.880 3.80 0.746 3.26 0.920
Service Quality 3.50 0.879 3.62 0.846 3.37 0.894
Staff Response 3.41 0.927 3.49 0.910 3.34 0.939
Service Charges 3.35 0.942 3.56 0.758 3.14 1.054
Availability of Trained
Staff 3.38 0.938 3.57 0.772 3.18 1.041
Overall ‘Service
Capability’ 3.52 0.541 3.69 0.450 3.35 0.567
From the table 1.11, it is observed that Maruti car sample exhibits high mean values for all
the ‘Service Capability’ variables compared with Tata car sample. Thus, it is inferred that
respondents are highly satisfied with the ‘Service Capability’ of Maruti cars (mean=3.70).
Tata car respondents display very low mean value (3.35) compared with Maruti car
respondents.
Customer Satisfaction towards Passenger Cars
Most feel good about of the respondents their cars (mean=4.27) and some of the respondents
reveal their proud feeling of having a particular brand of car (mean=3.32). Comparatively
low mean is recorded for the statement “I am satisfied with my car” (mean=2.79). Lot of
difference exists among the mean score for the three statements asked in the questionnaire.
The overall customer satisfaction on passenger car secured a mean value of 3.48.
Table 1.12 Overall ‘Customer Satisfaction’ towards Passenger Cars (N=1000)

DR. S. JYOTHIRMAYE REDDY DR. B. VENKATESWARA REDDY S. DURGA RAO 13P a g e
Statements 1 2 3 4 5 Mean S.D.
I am satisfied with my car 30
(3.0)
157
(15.7)
418
(41.8)
309
(30.9)
86
(8.6) 2.79 0.493
I feel good about my Car 30
(3.0)
120
(12.0)
127
(12.7)
406
(40.6)
317
(31.7) 4.27 0.534
I am proud to have this Car 31
(3.1)
110
(11.0)
282
(28.2)
448
(44.8)
129
(12.9) 3.32 0.546
Overall ‘Customer Satisfaction’ 3.48 0.542
NOTE: The values specified in the brackets represent percentages
Anchors: 1 – ‘Highly Dissatisfied’; 2 – ‘Dissatisfied’; 3 – ‘Neither Satisfied nor
Dissatisfied’; 4 – ‘Satisfied’; and 5 – ‘Highly Satisfied’
Maruti Car sample exhibits high mean values for all the statements of ‘Customer
Satisfaction’ variables compared with Tata car sample. Thus, it is inferred that respondents
are highly satisfied with Maruti cars (mean=3.68).
Table 1.13 Summary of ‘Customer Satisfaction’ across different Samples
Statements
Total Sample
(N=1000)
MARUTI
(N=500)
TATA
(N=500)
Mean S.D. Mean S.D. Mean S.D.
I am satisfied with my car 2.79 0.493 3.38 0.394 3.18 0.535
I feel good about my Car 4.27 0.534 3.95 0.498 3.77 0.508
I am proud to have this
Car 3.32 0.546 3.71 0.500 3.36 0.523
Overall ‘Customer
Satisfaction’ 3.48 0.542 3.68 0.443 3.44 0.516
Maruti sample respondents exhibit higher mean values across all the variables that are
considered in the present study over Tata sample respondents. Thus, it is concluded that
Maruti Cars are giving more satisfaction to the customers.
Table 1.14 Overview of Variables and their Mean distribution
Factors of Customer
Satisfaction
Total Sample Maruti Tata
Mean S.D. Mean S.D. Mean S.D.
DR. S. JYOTHIRMAYE REDDY DR. B. VENKATESWARA REDDY S. DURGA RAO 14P a g e
External design 3.86 0.518 3.95 0.533 3.77 0.487
Quality 3.67 0.489 3.83 0.423 3.51 0.500
Performance 3.72 0.531 3.92 0.423 3.53 0.557
Sales Capability 3.61 0.482 3.76 0.409 3.45 0.497
Service Capability 3.52 0.541 3.70 0.450 3.35 0.567
Customer Satisfaction 3.48 0.542 3.73 0.443 3.23 0.516
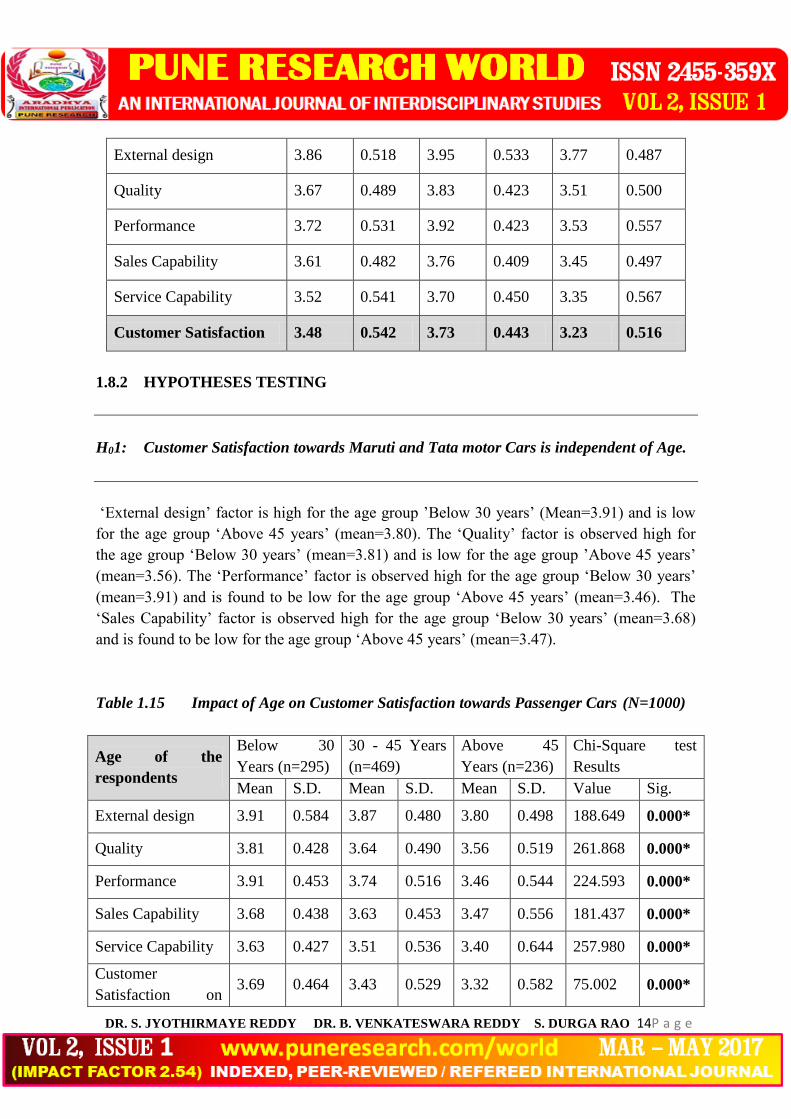
1.8.2 HYPOTHESES TESTING
H01: Customer Satisfaction towards Maruti and Tata motor Cars is independent of Age.
‘External design’ factor is high for the age group ’Below 30 years’ (Mean=3.91) and is low
for the age group ‘Above 45 years’ (mean=3.80). The ‘Quality’ factor is observed high for
the age group ‘Below 30 years’ (mean=3.81) and is low for the age group ’Above 45 years’
(mean=3.56). The ‘Performance’ factor is observed high for the age group ‘Below 30 years’
(mean=3.91) and is found to be low for the age group ‘Above 45 years’ (mean=3.46). The
‘Sales Capability’ factor is observed high for the age group ‘Below 30 years’ (mean=3.68)
and is found to be low for the age group ‘Above 45 years’ (mean=3.47).
Table 1.15 Impact of Age on Customer Satisfaction towards Passenger Cars (N=1000)
Age of the
respondents
Below 30
Years (n=295)
30 - 45 Years
(n=469)
Above 45
Years (n=236)
Chi-Square test
Results
Mean S.D. Mean S.D. Mean S.D. Value Sig.
External design 3.91 0.584 3.87 0.480 3.80 0.498 188.649 0.000*
Quality 3.81 0.428 3.64 0.490 3.56 0.519 261.868 0.000*
Performance 3.91 0.453 3.74 0.516 3.46 0.544 224.593 0.000*
Sales Capability 3.68 0.438 3.63 0.453 3.47 0.556 181.437 0.000*
Service Capability 3.63 0.427 3.51 0.536 3.40 0.644 257.980 0.000*
Customer
Satisfaction on 3.69 0.464 3.43 0.529 3.32 0.582 75.002 0.000*

DR. S. JYOTHIRMAYE REDDY DR. B. VENKATESWARA REDDY S. DURGA RAO 15P a g e
Cars
Note: * indicates insignificant at 95% confidence level
The ‘Service Capability’ factor is observed high for the age group ‘Below 30 years’
(mean=3.63) and is found to be low for the age group ‘Above 45 years’ (mean=3.40). The
Overall Customer Satisfaction towards Passenger Cars is observed high for the age group
‘Below 30years’ (mean=3.69) and is found to be low for the age group ‘Above 45 years’
(mean=3.32). The mean distribution clearly indicated a trend of decrease in satisfaction levels
with the increase in age of the respondents.
All the factors of customer satisfaction and customer satisfaction on Passenger cars found
significant p values (p=0.000<0.05). This clearly indicates that there is a statistical significant
relationship exists between age group of the respondents and customer satisfaction.
Hence, H01 is rejected
H02: Customer Satisfaction towards Maruti and Tata motor Cars is independent of
family size.
‘External design’ factor is high for the respondents with Family size ‘<=3 members’
(mean=3.95) and is low for the respondents with Family size ‘>=5 members’ (mean=3.68).
The ‘Quality’ factor is observed high for the respondents with Family size ‘<=3 members’
(mean=3.78) and is low for the respondents with Family size ‘>=5 members’ (mean=3.47).
The ‘Performance’ factor is observed high for the respondents with Family size ‘<=3
members’ (mean=3.88) and is found to be low for the respondents with Family size ‘>=5
members’ (mean=3.46). The ‘Sales Capability’ factor is observed high for the respondents
with Family size ’<=3 members’ (mean=3.77) and is found to be low for the respondents
with Family size ’>=5 members’ (mean=3.39). The ‘Service Capability’ factor is observed
high for the respondents with Family size ’<=3 members’ (mean=3.69) and is found to be
low for the respondents with Family size ’>=5 members’ (mean=3.31). The Overall
Customer Satisfaction towards Passenger Cars is observed high for the respondents with
Family size ’<=3 members’ (mean=3.67) and is found to be low for the respondents with
Family size ’>=5 members’ (mean=3.28).
Table 1.16 Chi-Square test results on Family size vs. Customer Satisfaction towards
Passenger Cars (N=1000)

DR. S. JYOTHIRMAYE REDDY DR. B. VENKATESWARA REDDY S. DURGA RAO 16P a g e
Family Size of
the respondents
< = 3
members
(n=337)
4 members
(n=487)
> = 5
members
(n=176)
Chi-Square test
Results
Mean S.D. Mean S.D. Mean S.D. Value Sig.
External design 3.95 0.559 3.87 0.445 3.68 0.577 114.865 0.000*
Quality 3.78 0.472 3.66 0.471 3.47 0.506 231.730 0.000*
Performance 3.88 0.487 3.71 0.540 3.46 0.471 208.275 0.000*
Sales Capability 3.77 0.481 3.57 0.450 3.39 0.465 202.517 0.000*
Service Capability 3.69 0.482 3.48 0.541 3.31 0.554 221.763 0.000*
Customer
Satisfaction on
Cars
3.67 0.489 3.42 0.542 3.28 0.533 71.821 0.000*
Note: * indicates insignificant at 95% confidence level
It is observed that the entire variables found statistically significant with the family size
(p=0.000<0.05) at 95% confidence level. It is concluded from the Chi-Square test that
customer satisfaction on Passenger cars is dependent on family size of the respondents.
Thus, H02 is rejected
H04: Customer Satisfaction towards Maruti and Tata motor Cars is independent of
Occupation.
‘Government Employees’ respondents display high mean values across all the variables
including overall customer satisfaction on Passenger cars, except for ‘Performance’ factor.
‘Private Employees’ display low mean values across all the factors of customer satisfaction
and also for overall customer satisfaction on Passenger cars. ‘Self-employed’ respondents
display moderate values across all the factors and exhibit high mean for ‘Performance’ factor.
Table 1.18 Chi-Square test results on Occupation vs. Customer Satisfaction towards
Passenger Cars (N=1000)
Occupation of the
respondents
Self Employed
(n=365)
Private
Employee
(n=418)
Government
Employee
(n=217)
Chi-Square test
Results
Mean S.D. Mean S.D. Mean S.D. Value Sig.
External design 3.87 0.573 3.80 0.506 3.96 0.421 103.164 0.000*

DR. S. JYOTHIRMAYE REDDY DR. B. VENKATESWARA REDDY S. DURGA RAO 17P a g e
Quality 3.68 0.554 3.59 0.433 3.80 0.441 225.414 0.000*
Performance 3.81 0.540 3.65 0.524 3.73 0.506 236.018 0.000*
Sales Capability 3.64 0.507 3.50 0.466 3.76 0.413 214.553 0.000*
Service Capability 3.59 0.506 3.41 0.564 3.63 0.513 238.173 0.000*
Customer
Satisfaction on Cars 3.49 0.543 3.38 0.550 3.66 0.474 39.987 0.000*
* Significant at 95% confidence level
From the table 1.18, it is noticed that all the p values for all the factors of customer
satisfaction and overall customer satisfaction on Passenger cars found significant at 95%
confidence level (p=0.000 < 0.05). Hence, it is concluded from the test results that customer
satisfaction on Passenger cars is not independent of Occupation of the respondents.
H04 is rejected.
H05: Customer Satisfaction towards Maruti and Tata motor Cars is independent of
income level.
.Table 1.19 Mean distribution between Income Level and Customer Satisfaction on Cars
Income Level of the
respondents
< 4 Lakhs
(n=286)
4 - 6 Lakhs
(n=375)
6 - 8 Lakhs
(n=172)
> 8 Lakhs
(n=167)
Mean S. D. Mean S. D. Mean S. D. Mean S. D.
External design 3.94 0.427 3.83 0.550 3.76 0.621 3.90 0.445
Quality 3.82 0.395 3.58 0.486 3.53 0.561 3.75 0.476
Performance 3.92 0.406 3.63 0.552 3.49 0.551 3.84 0.508
Sales Capability 3.75 0.404 3.50 0.502 3.45 0.466 3.75 0.463
Service Capability 3.68 0.484 3.41 0.549 3.38 0.573 3.64 0.486
Customer Satisfaction
on Cars 3.71 0.456 3.33 0.562 3.28 0.490 3.65 0.490
‘External design’ factor is high for the respondents with income level ‘<4 lakhs’
(mean=3.94) and is low for the respondents with income level ‘6 – 8 lakhs’ (mean=3.76).
‘Quality’ factor is observed high for the respondents with income level ‘<4 lakhs’
(mean=3.82) and is low for the respondents with income level ‘6 - 8 lakhs’ (mean=3.53).
‘Performance’ factor is observed high for the respondents with income level ‘<4 lakhs’
(mean=3.92) and is found to be low for the respondents with income level ‘6 – 8 lakhs’
(mean=3.49).‘Sales Capability’ factor is high for the respondents with income level ‘<4
lakhs’ (mean=3.75) and is low for the respondents with income level ‘6 - 8 lakhs’

DR. S. JYOTHIRMAYE REDDY DR. B. VENKATESWARA REDDY S. DURGA RAO 18P a g e
(mean=3.45). ‘Service Capability’ factor is observed high for the income level ‘<4 lakhs’
(mean=3.68) and is found to be low for the income level ‘6 – 8 lakhs’ (mean=3.28).
The Overall Customer Satisfaction on Passenger Cars is high for the respondents with income
level ‘<4 Lakhs’ (mean=3.71) and is found to be low for the respondents with income level ‘6
– 8 lakhs’ (mean=3.28). The distribution of mean displays a logical sequence of decreasing
satisfaction on all the factors considered with the increase in income level of the respondents.
From the table it is noticed that all the p values are less than 0.05. Hence, it is concluded that
there is statistical significant relationship exist between Income of the respondents and
Satisfaction on Passenger cars at 95% confidence level.
Table 1.20 Chi-Square test results on Income vs. Customer Satisfaction towards
Passenger Cars
Income vs.
Customer Satisfaction
Chi-Square (χ2)
Value Sig.
External design 202.489 0.000*
Quality 306.526 0.000*
Performance 285.475 0.000*
Sales Capability 235.512 0.000*
Service Capability 266.748 0.000*
Customer Satisfaction on Passenger cars 128.146 0.000*
* Significant at 95% confidence level
Hence, H05 is rejected.
H07: There is no significant difference in customer satisfaction between Maruti and Tata
Motor cars.
It is noticed that Maruti Car respondents have high mean scores when compared with Tata
Car respondents for all the factors of customer satisfaction. The overall customer satisfaction
score is high for Maruti respondents (mean = 3.73) than Tata respondents (Mean = 3.23).
Table 1.22 Difference in Customer satisfaction across Maruti and Tata
Car Brands
Maruti
(n=500)
Tata
(n=500)
Total
(ns=1000) Z
Value
Sig.
(2-tailed) Mea S. D. Mea S. D. Mea S. D.

DR. S. JYOTHIRMAYE REDDY DR. B. VENKATESWARA REDDY S. DURGA RAO 19P a g e
n n n
External design 3.95 0.533 3.77 0.487 3.86 0.518 5.575 <0.0001*
Quality 3.83 0.422 3.51 0.500 3.67 0.489 10.936 <0.0001*
Performance 3.92 0.423 3.53 0.557 3.72 0.530 12.469 <0.0001*
Sales Capability 3.76 0.409 3.45 0.497 3.61 0.481 10.770 <0.0001*
Service Capability 3.70 0.450 3.35 0.567 3.52 0.541 11.121 <0.0001*
Customer Satisfaction 3.73 0.443 3.23 0.516 3.48 0.542 16.440 <0.0001*
Note: * significant at 95% confidence level
Considering the Z and p values, it is noticed that all the p values are significant (p<0.05) at
95% confidence level. This indicates that there are differences between Maruti and Tata car
respondents with respect to their satisfaction. It is inferred that Maruti car respondents are
highly satisfied with their car than Tata car respondents.
H07 is rejected
SUMMARY
From the analysis made in this chapter, all the independent variables considered namely age,
family size, educational qualification, occupation, income level and years of ownership,
found having significant relationship with the dependent variable i.e., Customer satisfaction
towards Passenger Cars. Further, the null hypothesis framed to test the comparison between
two samples found insignificant and regression analysis carried to test the relationship of
external design, quality, performance, sales capability, service capability towards customer
satisfaction found significant.
1.9 Findings:
The coded quantitative data were taken into a computer using the statistical package for
social sciences (SPSS 17.0) program guidelines. The data were then analysed in a systematic
manner. Descriptive statistics were used to describe the sample in a meaningful manner. Z-
test and F-test were carried to establish the differences between the mean scores of various
groups that represent the sample. Linear regression analysis was carried to establish the
relationship between customer satisfaction factors and customer satisfaction. Chi-square test
was administered to identify the relationship between expected and observed values. Based
on the research question framed for the present study, the following major findings are
presented in detail:
Age:

DR. S. JYOTHIRMAYE REDDY DR. B. VENKATESWARA REDDY S. DURGA RAO 20P a g e
The study has found significant statistical relationship between age and customer satisfaction.
It is found that majority of the respondents are in the age group of ‘30 -45 years’. The major
respondents are below 45 years for Maruti and above 30 years for Tata Motors. Respondents
who are above 45 years have shown low mean values on customer satisfaction.
Family size:
Family size found mixed relationship with customer satisfaction in the present study. There is
no significant relationship between customer satisfaction and family size for the Maruti
sample on car purchase. At the same time it is observed that there is a statistical relationship
between customer satisfaction and family size for Tata Motors sample and total sample.
From the survey it is found that 48. 7% of the total population belongs to a family size of 4
members. Majority of the Maruti respondents are in the family size of less than or equal to 4
members and majority of the Tata Motor respondents are in the family size of above 4
members. Respondents with a family size of five or more exhibited low mean values.
Occupation:
The present study observed significant statistical relationship between occupation and
customer satisfaction. From the survey it is found that majority of the respondents (41.8%)
are private employees. 72% of the Maruti respondents are either private employees or self
employed. 84.6% of Tata Motor users are either private employees or self employed. Private
employees are the least satisfied category among all the categories.
Income level:
From the analysis it is found that there is a statistical significant relationship between income
level and customer satisfaction. From the study it is found that majority of the customers
(37.5 %) are having an annual income of ‘4 – 6 lakhs’. It is observed that the average annual
income of Maruti car users is less than 6 lakhs and the average annual income of Tata Motor
car users is between ‘4 & 8 lakhs’. Respondents with an annual income of ‘6 – 8 lakhs’ are
the least satisfied category among the four categories.
External Design:
Highest mean values are observed for the variable appearance by both Maruti (4.18) and Tata
(4.33) car users. Rear view is given the lowest mean value by Maruti car users (3.77), Tata
car users gave the lowest mean value for side view (3.45).
Quality:

DR. S. JYOTHIRMAYE REDDY DR. B. VENKATESWARA REDDY S. DURGA RAO 21P a g e
The highest mean values are recorded for the variable ‘Engine Quality by both Maruti and
Tata respondents. The lowest mean values are recorded for the variable ‘Paint Quality’ by
both Maruti and Tata respondents.
Performance:
The highest mean values are given to the performance variable ‘Power’ by both Maruti and
Tata car respondents. Maruti respondents gave the lowest mean value to the performance
variable ‘clutch’ and Tata respondents gave the lowest mean value to the performance
variables ‘maintenance and driving comfort’.
Sales Capability:
Maruti customers exhibited highest mean value to the variable ‘new car condition’ and Tata
customers exhibited highest mean value to the variable ‘price’. Maruti and Tata Motor
customers exhibited lowest mean value to the variable ‘Test drive facility’.
Service Capability:
Both Maruti and Tata respondents accorded the highest mean value to the variable ‘service
facility’. Both Maruti and Tata respondents accorded the lowest mean value to the variable
‘service charges’
The findings of the present study are note worthy and fill the research gap that has been
identified in the review of literature. The findings will immensely help the car manufacturers
who believe that it is the customer satisfaction that benefits an organization in many ways.
1.10 Suggestions:
Respondents are not happy with the side view, rear view of the passenger cars though
they are satisfied with the external design of their cars. Redesigning of Maruti and Tata
cars will make the cars more attractive and competitive. This helps them to excel in the
market and to handle the competition arising from the International manufacturers.
Maruti respondents are dissatisfied with ground clearance level, paint quality, and
interiors. Tata respondents are dissatisfied with electronic equipment, steering system,
paint quality and wheels & tyres. Maruti and Tata have to concentrate on the above areas
to make them more competitive and to deliver higher quality to their customers.

DR. S. JYOTHIRMAYE REDDY DR. B. VENKATESWARA REDDY S. DURGA RAO 22P a g e
The respondents of Maruti are not satisfied with suspension system, clutch and breaks.
The respondents of Tata are highly dissatisfied with driving comfort, maintenance and
fuel consumption. Maruti and Tata Motors have to pay attention on the above attributes to
overcome from the said deficiencies. This will enhance the good will and reputation of
Maruti and Tata and make them globally competitive.
Maruti respondents are not satisfied with on-time delivery of the vehicle, new car
condition, showroom equipment and display of products. Tata respondents are highly
dissatisfied with test drive facility, display of products and staff responsiveness. Maruti
and Tata Motors have to pay lot of attention to training and development programs to
make the staff more effective. To enhance the sales capability many additional facilities
have to be incorporated in the showrooms of Maruti and Tata Motors.
Maruti respondents are dissatisfied with service charges, availability of trained staff, staff
response and service quality. The respondents of Tata are highly dissatisfied with service
charges, availability of trained staff, timely service and staff response. Maruti and Tata
have to take many initiatives in making their service capability world class.
Respondents above 45 years are the least satisfied group. Relatively their association with
the car is more. They purchased cars long time back. To make these respondents more
happy organizations have to provide some special offers namely discounts on servicing,
next purchase offers, incentives for using the car for long periods.
Respondents with a family size of five or more than five are not satisfied with their cars.
Most of the Maruti and Tata cars are of A1, A2, A3 categories and do not have versions
with higher width. A special model that can fulfil the needs of this particular market will
ensure great demand among families with a size of five or more than five.
Respondents in the graduate category are the least satisfied among the respondents. Most
of these people are relatively young and are looking for advanced features which they see
in International brands. Incorporating global features in Maruti and Tata cars will make
them more attractive and competitive.
Maruti’s presence in the premiere segment is not strong. The users with the income of
above six lakhs are looking for International brands. Maruti has to fulfil this particular
segment by introducing sophisticated models to cater to the needs of high income level
people to retain its market leadership for a long period. Tata launched their vehicles with
the concept of cheaper price and operating economics. Unfortunately their strategy did
not work to the expectations of the company and very people with the income of four
lakhs and below opted Tata cars. Tata has to revamp its overall strategy in this particular
segment to have a reasonably good market share.

DR. S. JYOTHIRMAYE REDDY DR. B. VENKATESWARA REDDY S. DURGA RAO 23P a g e
In spite of having world’s best technology through the acquisition of JLR, Tata could not
deliver quality products in India. The company is using only 30% of its installed capacity.
Presently the company has only 460 dealership networks in India. The company stands in
sixth position today comparing to its second position five years ago. Tata has to revamp
it’s overall strategy to regain its lost market.
Ashok Kumar Mishra (2014), ‘A Study on Relation Between Effective After Sales Service
and Customer Overall Satisfaction at Tata Motor’s with Special Reference to Ramgarhia
Automobiles, Ramgarh Cantt, Jharkhand’, International Journal of Research in Business
Management, Vol. 2, Issue 3, Pp: 79-88.
Dr. Ashok Kurtkoti, Sandeep Prabhu (2011), 'Study of Satisfaction with reference to Tata
Nano Cars Customers in Pune City’, PMR, Pp: 28 – 32.
Dr. Garima Malik (2012), ‘A Study on Consumer Perceptions and Expectations for Tata
Nano Parikalpana’, Kalinga Institute of Industrial Technology Journal of Management,
Vol. 07, No-3, Jan. - Dec. – 2012, Pp: 1 – 10.
Dr. Sandesh Kumar Sharma, Kiran Sharma, Makshud Khan (2011), ‘A Study and
Analysis of Customer Satisfaction of Tata Motors in Jaipur, Rajasthan’,
Int.J.Buss.Mgt.Eco.Res., Vol 2(4), 250-257, Pp. 250 – 257.
Ekta Chakravarty (2013), ‘Separation -A Better Tomorrow-Economy” A Study of
Marketing Strategies on Automobile’, International Journal of Research and Development
- A Management Review (IJRDMR), Volume-2, Issue – 1, Pp: 88 – 92.
Kavita Dua, Savita (2013), ‘A Study of Customer Satisfaction with Reference to Tata
Motor Passenger Vehicles’, International Journal of Advanced Research in Management
and Social Sciences ISSN: 2278-6236, Vol. 2 | No. 4 | Pp: 68 – 83.
Ms. M. Shanthini Devi, Ms. S. Arunpriya (2013), ‘A Study on Customer Satisfaction
Towards Tata Nano Car with Special Reference to Coimbatore City’, GRA – Global
Research Analysis, Volume : 2 | Issue : 8 | Pp: 12 -13.
Nataraj S, Dr. N. Nagaraja (2012), ‘Customer Satisfaction in Automobile Industry – An
Indian Online Buyers’ Perspective of Car Manufacturers Websites’, International Journal
of Multidisciplinary Research Vol.2 Issue 6, Pp: 92 – 107.
Owolabi Ademola Benjamin, Olajide Oluwatimilehin Samuel (2014), ‘Personality
Attributes as Predictors of Nigeria Customer Satisfaction towards Automobiles’,
International Journal of Business and Management Invention, Volume 3 Issue 5ǁ Pp. 01-
07.
Shao, Chiu a, Ching-Chan Cheng, Tieh-Min Yen, Hsiu-Yuan Hud (2011), ‘Preliminary
research on customer satisfaction models in Taiwan: A case study from the automobile
industry’, Expert Systems with Applications 38, 9780–9787, Pp. 9781-9787

DR. S. JYOTHIRMAYE REDDY DR. B. VENKATESWARA REDDY S. DURGA RAO 24P a g e
Talat Mahmood Kiyani, Mohammad Raza Ullah Khan Niazi, Riffat Abbas Rizvi Imran
khan (2012), ‘The Relationship between Brand Trust, Customer Satisfaction and
Customer Loyalty (Evidence from Automobile Sector of Pakistan)’, Interdisciplinary
Journal of Contemporary Research in Business, Institute of Interdisciplinary Business
Research 489, Vol 4 Pp: 489-502.
Veldandi Ramchander Rao, R.Veerin Kumar (2012), ‘Customer Satisfaction towards
Tata Motors – A Study on Passenger Cars in Warangal District of Andhra Pradesh’,
South Asian Journal of Marketing & Management Research, Volume 2, Issue 4, Pp: 127
– 150.