Embed Size (px)
Citation preview

Volume-III, Issue-IV January 2017 118
International Journal of Humanities & Social Science Studies (IJHSSS) A Peer-Reviewed Bi-monthly Bi-lingual Research Journal ISSN: 2349-6959 (Online), ISSN: 2349-6711 (Print) Volume-III, Issue-IV, January 2017, Page No. 118-144 Published by Scholar Publications, Karimganj, Assam, India, 788711 Website: http://www.ijhsss.com
Customer Satisfaction and Expectation Towards After Sales
Service of TVS Motors Ltd in Sivakasi Dr. M. Rifaya Meera
Assistant Professor, Ayya Nadar Janaki Ammal College, Sivakasi (Tamil Nadu), India
S. Muthupandi
Research Scholar, Ayya Nadar Janaki Ammal College, Sivakasi (Tamil Nadu), India
Abstract
Customer satisfaction is a strategic goal of any organisation, since a satisfied customer is
the core concern of any organisation; they pay close attention to the factors that influence
customers’ satisfaction. After sales service is one of the important factor that influence
customer satisfaction in case of durable goods. After sales service is needed to prevent
dissatisfaction, frustration and it will among present customers against the product and its
manufacturers. This study basically focuses on after sales service offered by “TVS Motors
Ltd”. This study has considered different aspects of after sales service that has impact on
customer satisfaction. The data required for study is collected through a structural
questionnaire. It includes opinion of customers on various aspects of customer’s
expectations and customer satisfaction also.
Keywords: Strategic goal, customer expectation, customer satisfaction, After Sales
Service, TVS Motors.
Introduction: After sales service has become an important marketing tool for the
manufacturing industry globally, Nigeria inclusive. A rapidly changing business
environment, increased use of technology, higher market competition, and higher potential
profits in after sales service has changed the way companies view after sales services
(Muhammad et al, 2011). It is no longer treated as a cost center, but instead, has become a
major profit source with profitability ranging up to 45% of corporate revenues for many
business environments (Saccani, et al., 2007). After sales service involve a continuous
interaction between the service provider and the customer throughout the post-purchase
product life cycle. At the time the product is sold to the customer, this interaction is
formalized by a mutually agreed warranty or service contract. The exact terms of the
warranty or service contract, the characteristics of the customer base, and the nature of the
sold product influence the after sales service strategy of the service provider (Cohen et al.,
2006; Oliva and Kallenberg, 2003) as cited in Muhammed, et al (2011). Goffin and New,
(2001) discovered that after-sales services maximize the value extracted by customers over
the entire product life cycle. Kurata and Nam, 2010; and Ahn and Sohn,( 2009)) agreed that

Customer Satisfaction and Expectation Towards After Sales Service of … M. Rifaya Meera & S. Muthupandi
Volume-III, Issue-IV January 2017 119
after-sales services can create sustainable relationships with customers and contribute
significantly to customer satisfaction by offering different after-sales services during the
various stages of the primary product lifecycle, the provider can ensure product
functionality and thereby customer satisfaction. This may lead to a fruitful relationship
between the provider and the customer over time, allowing for more transactions. It is on
this note that this research paper wishes to investigate the impact of after sales service
dimensions on customer satisfaction and retention with special reference to LG Electronics
in Ibadan metropolis, Nigeria. Two-wheelers are most popular especially among the people
belonging to middle level group. Due to wide choice of brands there is stiff competition
among the manufacturers and marketers to get attention of the buyers. People favor a
specific model of motor cycle among different brands for numerous reasons like
maintenance, price, appearance, fuel efficiency, durability and resale value. Today the two
wheeler industry plays a important role in the Indian economy. India is the second largest
two-wheeler manufacturers in the world. One of the most important features of economic
development is the transformation of luxury goods into necessary goods. In recent times one
such goods, which has been greatly demanded by the consumers, is the motor cycle
possessing a mechanical device for conveyance is an indicator of good standard of living.
The Indian two wheeler market with a volume of about 3.7 million is the second largest
manufacturer and producer of two-wheelers in the world. It stands next only to Japan and
china in terms of the number of two-wheelers produced and domestic sales respectively.
The Indian two-wheelers industry can be classified into three major segments namely-
scooters, motorcycles and mopeds. The key players in the Indian two-wheeler markets are
TVS, BAJAJ, HERO and HONDA. The Indian motorcycle industry can be broadly
categorized into Indian motorcycles and Indo-Japanese motorcycles. Indo-Japanese
motorcycles segment is dominated by Hero group, Bajaj and Escorts in collaboration with
Japanese manufacturers like Honda, Kawasaki and Yamaha respectively. The Indian
motorcycles are dominated by Bajaj (m80), Escorts and Royal Enfield.
Customer satisfaction is the individual’s perception of the performance of the product or
service in relation to his or her expectations. Customers will have drastically different
expectations, of an expensive. The concept of customer satisfaction is a function of
customer expectations. The overall objectives of providing value to customers continuously
and more effectively than the competition is to have and to retain highly satisfied. In a
competitive marketplace where business competes for customers, customer satisfaction is
seen as a key differentiator and increasingly has been become a key element of business
strategy.
Statement of the Problem: Today’s consumer markets are too competitive. For
maximizing the profit and widening the market share, the companies use various efforts for
attaining their objectives. There also exist strong consumer advocacy movements all over
the world. Most of the companies try to convert potential customer into a regular customer.
For this, they try to provide maximum benefits and convenience to the customers through
the excellent utilization of resource. The transformation of a potential customer into a

Customer Satisfaction and Expectation Towards After Sales Service of … M. Rifaya Meera & S. Muthupandi
Volume-III, Issue-IV January 2017 120
regular customer is not an easy task. They have to blend various marketing mixes in
different ways. Satisfaction is a subjective concept and crucial concern for both customers
and organisations, thus difficult to determine. It depends on many factors and varies from
person to person and product to product. The importance of customer satisfaction in strategy
development for customers and market oriented cannot be easily determined. Now a day it
has become very important factor for each and every organization to enhance the level of
customer satisfaction. Customer satisfaction, a term issued in marketing, it’s a measure how
product and service supplied by the company meet or surpass customer expectation. If
customer expectations meet with the perceived value of goods and service then customer is
satisfied but if the perceived value of goods and service is less than the customer
expectations than customer is dissatisfied and if the perceived value exceeded the expected
value of the goods and service than the customer is delighted. Hence, the researchers decide
to take the study about Customer Satisfaction and Expectation towards After Sales Service
of TVS Motors Ltd in Sivakasi area.
Scope of the Study: The study is limited to the customers of TVS motors vehicle buyers.
The customer includes customers who enter the show room. This study will help us to
understand customers, preference, satisfaction levels and their needs expected from the
business owners.
Objectives of the Study:
To study about the socio-economic and demographic profile of the respondents.
To ascertain their expectation levels towards after sales service.
To analyses their satisfaction level
To identify the various factors influencing their satisfaction level
To give suitable suggestions on the basis of the findings of the study and come out
proper conclusion.
Review of Literature: A study on the customers Satisfaction and expectation towards after
sales service of Two wheelers have attached the attention of many researchers in recent
times, When formulating the problem for their study, the researcher should refer the studies
already under taken previously.
Duggani yuvaraju and Durga Rao. S (2014) “Customer satisfaction towards Honda Two
wheelers” in their study, made an attempt to examine customer satisfaction towards Honda
two wheelers: A case study in Tirupati. In their study they use convenient sampling
method for collecting data from 100 samples with the help of questionnaire. The results of
performance of the Honda bikes are fully satisfied the customer’s needs of pick up, quality,
services.
Adil Bashir (2013) “Consumer behavior towards online shopping of electronics in
pakistan” in his research identified and got insight into consumer behavior towards online
shopping of electronic goods with respect to Pakistan economy. Convenient sampling
method is used to collect the data from 240 samples with the help of the questionnaire. The

Customer Satisfaction and Expectation Towards After Sales Service of … M. Rifaya Meera & S. Muthupandi
Volume-III, Issue-IV January 2017 121
result of the study is the main barrier in the process of online shopping is the safety issue.
People of Pakistan are afraid to share their personal information and financial information
on internet and the low level of trust on online stores therefore; sellers have to make proper
strategies to increase the customer’s level of trust on them.
Silja Hokkanen (2012) in his study “The impact of in store customer service on post
purchase” analyzed how in store customer service can affect satisfied impulse purchaser’
post purchase behavior in terms of store returns. The results of those study revealed that in-
store customer service can positively affect impulse-buyers’ post purchase evaluations of
service, and by increasing the level of in-store service the sales personal can influence the
customers’ and move an initial impulse purchase into a permanent adoption. This in return
can minimize store returns.
Charles- Henri Gros (2012) in his study “The influence of social media on consumers
during their purchase decision making process” aims to explain how the influence of social
media is reflected on consumers’ purchasing decision-making process and if this influence
differs at the various stages of this process. Non probability sampling is used for collecting
data from 260 consumers. The research is that the influence of social media also differs
depending upon cultural background such as nationalities. Indeed, the study indicated that
consumers depending on their nationalities appeared more or less influenced by social
media at the various stages of their purchasing decision-making processes.
Wiwat Jankingthong and pattanij Gonejanart (2012) in their study “Factors affecting
Post purchase behavioural intentions in Tourism sector” analyzed the relationships of
factors affecting post- purchase behavioral intentions in tourism sector on the basis of the
investigated variables from recent relevant literature. The study identifies the key drivers of
post-purchase behavioral intention as well as their relationships, thus representing a
significant step forward in the explanation of post purchase behavioral intentions. The
synthesis of this study is that factors influencing post-purchase behavioral intention include
the direct effect of CSR, service quality, perceived value and tourist satisfaction which have
a positive relationship with post-purchase behavioral intention and tourist complaints which
have a negative relationship with post-purchase behavioral intention and the indirect effect
of CSR, designation image, service quality and perceived value on post-purchase behavioral
intention through tourist satisfaction and the indirect effect of designation image and service
quality on post-purchase behavioral intention through service quality and perceived value,
respectively.
Sheetal Soni and Abhishek Soni (2012) in their survey “consumer behavior towards two
wheeler bikes” conducted on the consumer of two wheelers (based on responses from 100
two wheelers users from both urban and rural areas) in Jodhpur District of Rajasthan.
Though the sample size is small, the study brings out some of the interesting observations
about the general attitude of the Indian consumers towards their purchase decisions and
behavior, which could be broadly applicable to many other consumer products as well. The
conclusion of the study is the consumers expressed high satisfaction with their two wheeler

Customer Satisfaction and Expectation Towards After Sales Service of … M. Rifaya Meera & S. Muthupandi
Volume-III, Issue-IV January 2017 122
bikes. Advertising is considered to be powerful medium in the marketing of automobiles.
Amongst the different media that are used, television is the most effective in influencing the
consumers’ buying decisions, keeping in view the ever increasing “growth rate” of
population, prevailing standards of living and cost of vehicles, two wheelers bikes would
continue to dominate the automobile industry in India.
Vetrivel.T (2012) in his study “Pre-purchase and post purchase behavior of customers with
reference to TVS motors in erode district” analyzed pre-purchase and post-purchase
Behaviour of customers with reference to TVS Motors in Erode district. This study was
carried out for a period of 9 months in Erode district. The objective of this study is to be
identifying the attitude of two wheelers owners towards TVS Motors. For these purpose
300 two wheelers owners were taken as sample for the study in order to get the needed
information. The study is a descriptive type and convenient sampling is used. The data are
collected from survey using questionnaire through interview schedule. From this survey, it
was found that TVS vehicles are mainly preferred for its power & pickup, safely & comfort
and design. Performance is a major factor for purchasing TVS brand. TVS motors has to
update its technology to meet the changing customer needs and preference to cope up with
the competitions in the market and adequate steps should be made to increase the quality in
their services for better customer satisfaction.
Mallikarjuna Reddy (2010) in his study “consumer behavior towards two wheelers motor
bikes” This study carried out with the help of the four important major factors, through this
the behavior of the consumer is evaluated. For his study he selected as 100 samples for data
collection. The result of the study is the consumers mostly prefer Hero Honda bikes. As far
as mileage per litre of petrol is concerned, Hero Honda is ruling the market and finding
favour with the consumers.
S. Saravanan and Prof. N. Panchanatham (2009), in their study they discussed the
essentials for Promotion of a product .The result shows that a customer considers all factors
at the time of purchasing a two wheeler, although majority of customers give importance to
the brand image. This study also describes the socioeconomic factors which satisfy two
wheelers customers and that the employees and students crave for show room services.
Khor Eng Tatt (2010) in his study “Factors influencing consumers buying behavior of
Luxury branded goods” he conducted to focus on how consumer buying behavior reacts
with regards luxury branded goods. The study also would like to understand further
whether is there any interaction between the independent variable and moderating variable
with the depend variable (consumer behavior). The details collected from 200 samples
through questionnaire. Result analysis indicated that monthly does not moderate the
interactions between the independent variable, brand Loyalty and dependent variable,
Consumer buying behavior.
Jagadeshkumar (June 2005) in his study “A study on customer expectations, experience
and satisfaction level towards services provided at two-wheeler exchange mela’s with

Customer Satisfaction and Expectation Towards After Sales Service of … M. Rifaya Meera & S. Muthupandi
Volume-III, Issue-IV January 2017 123
special reference to lotus TVS” Erode. A project report submitted to Faculty of management
sciences.
Methodology Used:
Primary Data: Primary data collected from the respondents. Questionnaire prepared by
keeping in view of the objective.
Secondary data: Secondary data have been collected from Standard Textbooks, Magazines,
Journal and Internet.
Sampling Design: The scope of the study only extends to the Sivakasi. The numbers of
respondents are high, so the researcher had adopted convenient sampling technique, 80
customers are taken for this study.
Tools and Techniques: Following tools and techniques are to be used for analyzing the
data:
Per cent Analysis
Garret Ranking Method
Chi-square Test
Factor analysis
Hypothesis: The following are the hypotheses framed for the study:
There is no significant association between level of satisfaction and occupation level.
There is no significant association between level of satisfaction of respondents and
age of the respondents.
Analysis and Interpretation of Data:
Table 1 Gender Wise Classifications
Sex Frequency Per cent
Male 39 48.8
Female 41 51.2
Total 80 100
Source: Primary data
It is clear from the above table that, among the 80 respondents, 51.20% are female
respondents and left over 48.80 are male respondents.
It is found that majority of the respondents (51.2 per cent) are coming under the category
of female.

Customer Satisfaction and Expectation Towards After Sales Service of … M. Rifaya Meera & S. Muthupandi
Volume-III, Issue-IV January 2017 124
Table 2 Age Wise Classification of Respondents
Source: Primary Data
It is significant to note from the above Table 2 that young people in the age bracket of 20
to 27 years dominate in the use of two wheelers. It is found that 86.20 per cent of the
respondents are in the age bracket of 20 to 27 years followed by 28 to 34 years category,
which constitutes 10.00 per cent of the total respondents.
It is found that majority of the respondents (86.2 per cent) are having 20-27.
Table 3 Marital Status
Sl. No Marital status No. of respondents Per cent
1 Married 18 22.5
2 Unmarried 62 77.5
Total 80 100
Source: primary data
The above table shows that out of 80 respondents, 18 respondents (22.5per cent) are
married and the remaining 62 respondents (77.5 per cent) are unmarried.
It is found that majority of the respondents (77.5 per cent) are unmarried.
Table 4 Occupational Status
Sl. No. Occupation No. of Respondents Per cent
1. Student 54 67.5
2. Employed 11 13.8
3. Professional 7 8.8
4. Business 5 6.2
5. Others 2 2.5
6. Retired 1 1.2
Total 80 100
Source: Primary Data
The above table 4 gives a clear inference that out of 80 respondents, 67.5 per cent are
students; 13.8 per cent are employed people; 8.8 Per cent are professional; 6.2 per cent are
business people; others are 2.5% and remaining 1.2 per cent are retired people.
Sl. No. Age Frequency Per cent
1 20-27 years 69 86.2
2 28-34 years 8 10
3 35-42 years 2 2.5
4 51 years and Above 1 1.2
Total 80 100

Customer Satisfaction and Expectation Towards After Sales Service of … M. Rifaya Meera & S. Muthupandi
Volume-III, Issue-IV January 2017 125
It is inferred that most of the respondents (67.5) are students. The above stratified status
has also presented in the following diagram.
Table 5 Income Level of Respondents
Sl. No Income Level No. of Respondents Per cent
1 Above 20000 25 31.2
2 Rs15001-20000 22 27.5
3 Rs.10001-15000 14 17.5
4 Rs.5001-10000 4 5.0
5 Below Rs.5000 13 16.2
Total 80 100.0
Source: Primary Data
From the above table 5 it is inferred that the 5% of the respondents are having an income
of Rs.5001-10000 per month, 17.50% of the respondents are having an income of
Rs.10001-15000 per month and 16.2% of the respondents are having an income of below
Rs.5000 per month. 27.50% of the respondents are having an income of Rs.15001-20000
per month.31.20 % of the respondents are having an income of .Above Rs. 20,000 per
month.
It is inferred that majority 31.20% of the consumers are having income above 20,000 per
month.
Table 6 Educational Qualification of the Respondents
Source: Primary Data
From the above table 6 it is inferred that 17.5% of the respondents are Graduates, 76.2%
of the respondents are qualified post graduates and 2.5% of the respondents are qualified up
to 12th
standard, 1.2 per cent of the respondents are not studied, 2.5 per cent of the
respondents are diploma (others) levels.
It is inferred that most of the respondents (76.2%) are studied up to Post graduate level.
Sl. No Education No. of Respondents Per cent
1 Not Studied 1 1.2
2 Up to 12th Std 2 2.5
3 UG 14 17.5
4 PG 61 76.2
5 Others 2 2.5
Total 80 100.0

Customer Satisfaction and Expectation Towards After Sales Service of … M. Rifaya Meera & S. Muthupandi
Volume-III, Issue-IV January 2017 126
Table 7 Earning Members in the Family
Sl. No Earnings Members No. of Respondents Per cent
1 One 7 8.8
2 Two 28 35.0
3 Three 32 40.0
4 Four 13 16.2
Total 80 100.0
Source: Primary data
From the above table it reflects that out of 80 respondents, 28 respondents (35%) having
Two earning members in their family, 32 respondents (40%) having Three earning
members in their family. 7 respondents (8.8%) having one earning members in their family
and 13 respondents (16.20%) having four earning members in their family.
It is understood that majority of the respondents (40%) have three member in their
family under income earning members category.
Table 8 Number of Vehicle Owned by the Respondents
Sl. No No. of Vehicles No. of Respondents Per cent
1 Only 1 Two-Wheeler 4 5.0
2 2 Two-Wheeler 31 38.8
3 1 Two-wheeler & 1 Four-Wheeler 23 28.8
4 More than 2 Two-wheeler & More than
1 Four-Wheeler 22 27.5
Total 80 100.0
Source: Primary Data
From the above table it is found that 5.0% of the respondents are having only 1 two-
wheeler, 38.8% of the respondents are having 2 Two-wheeler, 27.5% of the respondent are
having more than 2 two wheelers & Four-Wheeler and 28.8% of the respondents are having
1 Two-Wheeler & 1 Four wheeler.
It is under stood that majority of the respondents (38.8 per cent) are having two 2
wheelers.
Table 9 Model of Vehicle Owned by the Respondents
Sl. No Brand No. of Respondents Per cent
1 TVS Flame SR 125 1 1.2
2 TVS Scooty Pep Plus 26 32.5
3 TVS Jupiter 1 1.2
4 TVS Star city 28 35.0
5 TVS Scooty Streak 3 3.8

Customer Satisfaction and Expectation Towards After Sales Service of … M. Rifaya Meera & S. Muthupandi
Volume-III, Issue-IV January 2017 127
6 TVS Apache 180 RTR 4 5.0
7 TVS sport 15 18.8
8 TVS star city plus 1 1.2
9 TVS XL 1 1.2
Total 80 100.0
Source: Primary Data
From the above table it is inferred that 35% of the respondents having TVS Star city,
32.5% of the respondents having TVS Scooty Pep Plus, 18.8% of the respondents having
TVS sport, 3.8% of the respondents having TVS Scooty Streak, and .5% of the respondents
having TVS Apache 180 RTR.
Table 9 reveals that, most of the respondents are having TVS Star city.
Table 10 Usage of Vehicle
Sl. No. Years No. of respondents Per cent
1 Below 1 year 4 5
2 1-2 years 31 38.8
3 3-4 years 23 28.8
4 More than 4 years 22 27.5
Total 80 100
Source: Primary Data
From the above table it is found that out of 80 respondents, 5 per cent of the respondents
are using vehicle for below 1 year, 38.8 per cent of the respondents have been using 1-2
years, 28.8 per cent of the respondents have been using 3-4 years and remaining 27.5 per
cent of the respondents are using more than four years.
It is under stood that majority of the respondents (38.8 per cent) are using between 1 to 2
years.
Table 11 Intimation for the Service Due Date
Sl. No. Intimation received No. of Respondents Per cent
1 Yes 69 86.2
2 No 11 13.8
Total 80 100
Source: Primary Data
It shows that out of 80 respondents, 86.2 per cent of the respondents are received
intimation through calls or letters for service due date from their service provider to get
motor vehicle service. Remaining 13.8 per cent respondents are not received intimation for
the service due.

Customer Satisfaction and Expectation Towards After Sales Service of … M. Rifaya Meera & S. Muthupandi
Volume-III, Issue-IV January 2017 128
It is lucid from the above data that most of the respondents (86.2 per cent) are received
intimation for the service due.
Table 12 Free Service Offered
Sl. No. Free service No of Respondents Per cent
1 Yes 66 82.5
2 No 14 17.5
Total 80 100
Source: Primary Data
It shows that out of 80 respondents, 82.5 per cent of the respondents are received free
service intimation by TVS Motors ltd. offered. Remaining 17.5 per cent respondents are not
received intimation for the free service offered.
It is found that most of the respondents (82.5 per cent) are received free service
intimation for the free service offered by TVS motors Private Limited.
Table 13 Cleanliness and Comfort of Service Reception and Customers Waiting Area
Source: Primary Data
From the above table it is found that out of 80 respondents 17.5 per cent of the
respondents are opined that cleanliness and comport at fair level, 18.8 per cent of the
respondents are opined that cleanliness and comport at excellent level and 63.8 per cent of
the respondents good with their cleanliness and comfort of service reception and customers
waiting area. It is under stood that majority of the respondents (63.8 per cent) having Good
with their cleanliness and comfort of service reception and customers is waiting area.
Table 14 Expectation of Service from TVS Motors Vehicle
Sl. No. Expect service No of Respondents Per cent
1 better service 72 90
2 better settlement and claim 7 8.8
3 better returns 1 1.2
Total 80 100
Source: Primary Data
From the above table it is found that out of 80 respondents 90 per cent of the respondents
has expected better service from TVS motors vehicle, 8.8 per cents of the respondents has
Sl. No. Opinion No of Respondents Per cent
1 Fair 14 17.5
2 Good 51 63.8
3 Excellent 15 18.8
Total 80 100

Customer Satisfaction and Expectation Towards After Sales Service of … M. Rifaya Meera & S. Muthupandi
Volume-III, Issue-IV January 2017 129
expected better settlement and claim from TVS motors vehicle and, 1.2 per cents of the
respondents has expected better return from TVS motors vehicle.
It is under stood that majority of the respondents (90 per cent) have been expected better
service from TVS motors vehicle.
Table 15 Price of Spare Parts from TVS Motor
Sl. No. Price levels No of Respondent Per cent
1 High 24 30
2 Reasonable 51 63.75
3 Low 5 6.25
Total 80 100
Source: Primary Data
From the above table it is found that out of 80 respondents 30 per cents of the
respondents felt that the price level is high, 63.75 per cents of the respondents felt that the
price level is reasonable and 6.25 per cent of the respondents felt that the price level is Low.
It is lucid from the above data that majority of the respondents (63.75 per cents) felt that
the price of spare parts is reasonable.
Table 16 Overall Opinions about Service Charges and Repair Charges
Sl. No. Repair Charges No of respondents Per cent
1 High 9 11.25
2 Reasonable 69 86.25
3 Low 2 2.5
Total 80 100
Source: Primary Data
It is explained that out of 80 respondents 11.25 per cent of the respondents felt that
service or repair charges are high, 86.25 per cent of the respondents felt that service or
repair charges are reasonable and 2.5 per cent of the respondents felt that service or repair
charges are low.
It is found that most of the respondents (86.5 per cent) felt that service or repair charges
are reasonable.
Table 17 Overall Satisfactions
Sl. No. Level of satisfaction No of Respondents Per cent
1 Yes 64 78.8
2 No 16 20
Total 80 100
Source: Primary Data

Customer Satisfaction and Expectation Towards After Sales Service of … M. Rifaya Meera & S. Muthupandi
Volume-III, Issue-IV January 2017 130
It shows that out of 80 respondents, 78.8 per cent of the respondents are highly satisfied
with their present two wheelers. Remaining 20 per cent respondents are not satisfied with
their present two wheelers
It is lucid from the above data that majority of the respondents (78.8 per cent) are highly
satisfied with their present two wheelers.
Table 18 Overall Suggestions for the Improvement of TVS Motors Vehicle
Sl. No. Over all opinion Frequency Per cent
1 Quality 18 22.5
2 Different colors 10 12.5
3 Attractiveness 22 27.5
4 Mileage 13 16.2
Total 80 100
Source: Primary Data
From the above table it is found that out of 80 respondents 22.5 per cent of the
respondents suggested for further improvement in quality vehicle, 12.5 per cent of the
respondents, suggested for making different colors, 27.5 per cent of the respondents,
suggested for the improvement in attractiveness of the vehicle, 16.2 per cent of the
respondents, suggested for the improvement in mileage in TVS motors. It is lucid from the
above data that most of the respondents (27.5 per cent) suggested for the improvement in
attractiveness
Attracted Features in TVS Motors Private Limited among all other brands- Garrett
Ranking Analysis: The respondents are asked to rank the attracted features of TVS among
all other brands. To identify the most preferred features of TVS motors, the researcher has
used Garrett ranking test. The following table shows the details of scores given by the
respondents for the features attracted in TVS Motors private Limited among all other
brands.
Table 19 Attracted features in TVS motors private limited among all other brands
Sl. No. Features Rank
Total I II III IV
1 Brand Image 19 12 16 33 80
2 Service network 19 21 24 16 80
3 Price 32 11 26 11 80
4 Mileage 10 36 14 20 80
Total 80 80 80 80 320
Source: primary data
Garrett Scores Explanations: The Garret ranks are calculated by using appropriate Garret
ranking formula. Then based on the Garret ranks, the Garret Table value is ascertained. The

Customer Satisfaction and Expectation Towards After Sales Service of … M. Rifaya Meera & S. Muthupandi
Volume-III, Issue-IV January 2017 131
Garret Table value and scores of each purpose in multiplied to record scores in Table 3.19
Finally by adding each row; the total Garret scores are obtained.
100 (Rij – 0.5)
Per cent Position = ----------------------
Nj
Where
Rij= Rank given for the ith
variable by the jth
respondents
Nj = Number of variables ranked by the jth
respondents.
Table 20 Per cent Position and Garret Value
Source: Computed Value
Table 21 Calculation of Garrett Score
Sl.
No. Features
Rank Total
1 2 3 4
1. Brand Image 19*73=1387 12*57=684 16*44=704 33*28=924 3699
2. Service network 19*73=1387 21*57=1197 24*44=1056 16*28=448 4088
3. Price 32*73=2336 11*57=627 26*44=1144 11*28=308 4415
4. Mileage 10*73=730 36*57=2052 14*44=616 20*28=560 3958
Source: primary data
Table 21 shows the Garret scores. The Garret ranks are calculated by using appropriate
Garret ranking formula. Then based on the Garret ranks, the Garret Table value is
ascertained. The Garret Table value and scores of each purpose in multiplied to record
scores in Table 4.16 Finally by adding each row; the total Garret scores are obtained.
Table 22 Attracted features in TVS motors private limited among all other brands
Source: Computed Value
Sl. No. Nj
Rij )5.0(100
Calculated Value Garret Value
1. 100 (1-0.5)/4
12.5 73
2. 100 (2-0.5)/4
37.5 57
3. 100 (3-0.5)/4
62.5 44
4. 100 (4-0.5)/4
87.5 28
Sl.
No.
Features attracted to satisfied TVS Motors
private Limited
Garrett
Scores Average Rank
1. Brand Image 3699/80 46.24 IV
2. Service network 4088/80 51.10 II
3. Price 4415/80 55.19 I
4. Mileage 3958/80 49.48 III

Customer Satisfaction and Expectation Towards After Sales Service of … M. Rifaya Meera & S. Muthupandi
Volume-III, Issue-IV January 2017 132
The above table 22 shows that the Garratt scores and the average scores of attracted
features of TVS Motors private Limited among all other brands. The average scores are
ranked according to their values. The first rank is given to Price, Second rank goes to
service network, Third rank for Mileage and Fourth rank to brand image of TVS Motors
private Limited among all other brands.
Customer Satisfaction towards Service Features of TVS Motors Pvt. Ltd: To know the
satisfaction level of the respondent’s towards after sales service. Satisfaction towards
service features of TVS motors pvt Ltd the study has been made. For this purpose opinion
of the respondents are gathered to identify the most preferred service features of TVS
motors, the researcher has used Garrett ranking test. The following table shows the details
of scores given by the respondent’s satisfaction for the selection of service features.
Table 23 Satisfaction towards service features of TVS motors pvt Ltd
Sl.
No.
Service
Rank Total
I II III IV
1 Information in time 10 46 15 9 80
2 Quick issues of reimbursement 32 7 12 29 80
3 Claim & settlement 25 8 17 30 80
4 Customer relationship 13 19 36 12 80
Total 80 80 80 80
Source: Computed Data
Table 24 Per cent Position and Garret Value
Source: Computed Value
Table 25 Calculation of Garrett Score
Sl.
No. Purposes 1 2 3 4 Total
1. Information in time
10*73
=730
46*57=
2622
15*44
=660
9*289
=2601 6613
2. Quick issues of
reimbursement
32*73
=2336
7*57
=399
12*44
=528
29*28
=812 4075
3. Claim & settlement
25*73
=1825
8*57
=456
17*44
=748
30*28
=840 3869
S.
No Nj
Rij )5.0(100
Calculated Value Garret Value
1. 100 (1-0.5)/4
12.5 73
2. 100 (2-0.5)/4
37.5 57
3. 100 (3-0.5)/4
62.5 44
4. 100 (4-0.5)/4
87.5 28
Customer Satisfaction and Expectation Towards After Sales Service of … M. Rifaya Meera & S. Muthupandi
Volume-III, Issue-IV January 2017 133
4. Customer relationship
13*73
=949
19*57
=1083
36*44
=1584
12*28
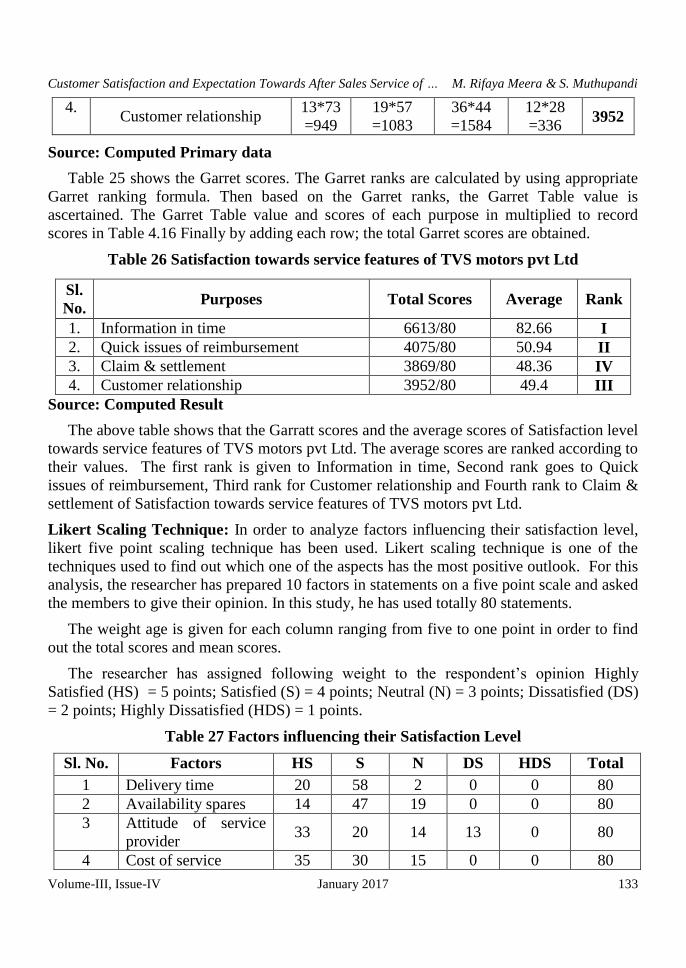
=336 3952
Source: Computed Primary data
Table 25 shows the Garret scores. The Garret ranks are calculated by using appropriate
Garret ranking formula. Then based on the Garret ranks, the Garret Table value is
ascertained. The Garret Table value and scores of each purpose in multiplied to record
scores in Table 4.16 Finally by adding each row; the total Garret scores are obtained.
Table 26 Satisfaction towards service features of TVS motors pvt Ltd
Source: Computed Result
The above table shows that the Garratt scores and the average scores of Satisfaction level
towards service features of TVS motors pvt Ltd. The average scores are ranked according to
their values. The first rank is given to Information in time, Second rank goes to Quick
issues of reimbursement, Third rank for Customer relationship and Fourth rank to Claim &
settlement of Satisfaction towards service features of TVS motors pvt Ltd.
Likert Scaling Technique: In order to analyze factors influencing their satisfaction level,
likert five point scaling technique has been used. Likert scaling technique is one of the
techniques used to find out which one of the aspects has the most positive outlook. For this
analysis, the researcher has prepared 10 factors in statements on a five point scale and asked
the members to give their opinion. In this study, he has used totally 80 statements.
The weight age is given for each column ranging from five to one point in order to find
out the total scores and mean scores.
The researcher has assigned following weight to the respondent’s opinion Highly
Satisfied (HS) = 5 points; Satisfied (S) = 4 points; Neutral (N) = 3 points; Dissatisfied (DS)
= 2 points; Highly Dissatisfied (HDS) = 1 points.
Table 27 Factors influencing their Satisfaction Level
Sl. No. Factors HS S N DS HDS Total
1 Delivery time 20 58 2 0 0 80
2 Availability spares 14 47 19 0 0 80
3 Attitude of service
provider 33 20 14 13 0 80
4 Cost of service 35 30 15 0 0 80
Sl.
No. Purposes Total Scores Average Rank
1. Information in time 6613/80 82.66 I
2. Quick issues of reimbursement 4075/80 50.94 II
3. Claim & settlement 3869/80 48.36 IV
4. Customer relationship 3952/80 49.4 III

Customer Satisfaction and Expectation Towards After Sales Service of … M. Rifaya Meera & S. Muthupandi
Volume-III, Issue-IV January 2017 134
5 Warranty service 27 45 7 1 0 80
6 Water service 28 49 3 0 0 80
7 Free service 15 41 11 13 0 80
8 Oil service 13 23 33 9 2 80
9 Customer service 10 36 20 1 13 80
10 General service 17 23 16 11 13 80
Total 212 372 140 48 28
Source: Primary data
Table 28 Calculation of Likert Scaling Technique
Sl.
No.
Factors HS*5 S*4 N*3 DS*2 HDS*1 Total/80 Mean
Scores
1 Delivery time 20*5=
100
58*4=
232
2*3=
6
0*2=
0
0*1=
0 338/80
4.23
2 Availability
spares
14*5=
70
47*4=
188
19*3=
57
0*2=
0
0*1=
0 315/80
3.94
3 Attitude of
service
provider
33*5=
165
20*4=
80
14*3=
42
13*2=
26
0*1=
0 313/80
3.91
4 Cost of
service
35*5=
175
30*4=
120
15*3=
45
0*2=
0
0*1=
0 340/80
4.25
5 Warranty
service
27*5=
135
45*4=
180
7*3=
21
1*2=
2
0*1=
0 338/80
4.22
6 Water service 28*5=
140
49*4=
196
3*3=
9
0*2=
0
0*1=
0 345/80
4.31
7 Free service 15*5=
75
41*4=
164
11*3=
33
13*2=
26
0*1=
0 298/80
3.72
8 Oil service 13*5=
65
23*4=
92
33*3=
99
9*2=
18
2*1=
0 274/80
3.43
9 Customer
service
10*5=
50
36*4=
144
20*3=
60
1*2=
2
13*1=
13 269/80
3.36
10 General
service
17*5=
85
23*4=
92
16*3=
48
11*2=
22
13*1=
13 260/80
3.25
Source: Computed Value
Table 29 Factors influencing their satisfaction level
Sl. No. Characteristics Mean Scores Rank
1 Delivery time 4.23 III
2 Availability spares 3.94 V
3 Attitude of service provider 3.91 VI
4 Cost of service 4.25 II

Customer Satisfaction and Expectation Towards After Sales Service of … M. Rifaya Meera & S. Muthupandi
Volume-III, Issue-IV January 2017 135
5 Warranty service 4.22 IV
6 Water service 4.31 I
7 Free service 3.72 VII
8 Oil service 3.43 VIII
9 Customer service 3.36 IX
10 General service 3.25 X
Source: Primary data
From the above Table 29 it is clear that, Water service got First rank; Cost of service has
been ranked as Second rank; Delivery time has secured third rank; Warranty service got
Fourth rank; Availability spares has been ranked as Fifth rank; Attitude of service provider
has secured Sixth rank; Free service got Seventh rank; Oil service has been ranked as
Eighth rank; Customer service got Ninth rank and General service has secured Tenth rank.
Table 30 Characteristics of TVS motor vehicles
Sl. No. Characteristics HS S N DS HDS Total
1 Price of vehicle 5 50 9 0 0 64
2 Engine and performance 12 35 9 8 0 64
3 Maintenance 19 41 4 0 0 64
4 Color 23 24 17 0 0 64
5 Cost of spares 8 40 16 0 0 64
6 Mileage 32 25 7 0 0 64
7 Style 25 37 1 1 0 64
8 Weight 19 22 15 8 0 64
9 Capacity of petrol 28 33 2 1 0 64
10 Brakes 13 30 10 3 8 64
11 Kick Starters 24 23 14 1 2 64
12 Utility box 12 18 34 0 0 64
Total 220 378 138 22 10
Source: Primary data
Table 31 Calculation of Likert Scaling Technique
Sl.
No.
Characteris
tics HS*5 S*4 N*3 DS*2 HDS*1 Total/80
Mean
Scores
1 Price of
vehicle 5*5=25
50*4=
200
9*3=
27 0*2=0 0*1=0 252/64 3.94
2 Engine and
performance 12*5=60
35*4=
140
9*3=
27 8*2=16 0*1=0 243/64 3.80
3 Maintenance 19*5=95 41*4=
164
4*3=
12 0*2=0 0*1=0 271/64 4.23
4 Color 23*5=115 24*4= 17*3= 0*2=0 0*1=0 262/64 4.09

Customer Satisfaction and Expectation Towards After Sales Service of … M. Rifaya Meera & S. Muthupandi
Volume-III, Issue-IV January 2017 136
96 51
5 Cost of spares 8*5=40 40*4=
160
16*3=
48 0*2=0 0*1=0 248/64 3.88
6 Mileage 32*5=160 25*4=
100
7*3=
21 0*2=0 0*1=0 281/64 4.39
7 Style 25*5=125 37*4=
148
1*3=
3 1*2=2 0*1=0 278/64 4.34
8 Weight 19*5=95 22*4=
88
15*3=
45 8*2=16 0*1=0 244/64 3.81
9 Capacity of
petrol 28*5=140
33*4=
132
2*3=
6 1*2=2 0*1=0 280/64 4.38
10 Brakes 13*5=65 30*4=
120
10*3=
30 3*2=6 8*1=8 229/64 3.58
11 Kick Starters 24*5=120 23*4=
92
14*3=
42 1*2=2 2*1=2 258/64 4.03
12 Utility box 12*5=60 18*4=
72
34*3=
102 0*2=0 0*1=0 234/64 3.66
Source: Primary data
Table 32 Characteristics of TVS motor vehicles
Sl. No. Characteristics Mean Scores Rank
1 Price of vehicle 3.94 VII
2 Engine and performance 3.80 X
3 Maintenance 4.23 IV
4 Color 4.09 V
5 Cost of spares 3.88 VIII
6 Mileage 4.39 I
7 Style 4.34 III
8 Weight 3.81 IX
9 Capacity of petrol 4.38 II
10 Brakes 3.58 XII
11 Kick Starters 4.03 VI
12 Utility box 3.66 XI
From the above Table 32 it is clear that, Mileage got First rank; Capacity of petrol has
been ranked as Second; Style has secured third rank; maintenance got Fourth rank; color has
been ranked as Fifth; Kick starters has secured Sixth rank; Price of vehicle got Seventh
rank; Cost of spares has been ranked as Eighth; Weight got Ninth rank and Engine and
performance has secured Tenth rank; utility box has secured Eleventh rank; Brake has been
ranked as Twelfth.

Customer Satisfaction and Expectation Towards After Sales Service of … M. Rifaya Meera & S. Muthupandi
Volume-III, Issue-IV January 2017 137
Association among Level of Satisfaction towards occupation level: To know the
association among level of satisfaction towards occupation levels has been made with the
following hypothesis.
Hypothesis 1: “There is no significant association among level of satisfaction towards
occupation level”. To test the hypothesis Chi-Square Test is applied and the result is
presented in the following table.
Table 33 Associations between Level of Satisfaction and Occupation Level
Occupation Level of satisfaction
No opinion Agree
Professional
Count 0 7
Expected count 2.28 4.73
% within Occupation 0% 100%
Business
Count 3 2
Expected count 1.63 3.38
% within Occupation 60% 40%
Employed
Count 8 3
Expected count 3.58 7.43
% within Occupation 72.73% 27.27%
Student
Count 15 39
Expected count 17.55 36.45
% within Occupation 27.78% 72.22%
Retired
Count 0 1
Expected count 0.325 0.675
% within Occupation 0% 100%
Others
Count 0 2
Expected count 0.65 1.35
% within Occupation 0% 100%
Total
Count 26 54
Expected count 26 54
% within Occupation 32.5 67.5
Source: Computed data
From the above table it is found that out of 80 respondents 39 respondents are students
towards agree factors of TVS motors in level of satisfaction. The result of chi-square test is
presented in the following table.
Table 34 Chi-square Test Result
Value df Asymp.sig.(2-sided)
Pearson Chi-Square 15.20158853 5 0.010
Likelihood Ratio 17.46092767 5 0.004

Customer Satisfaction and Expectation Towards After Sales Service of … M. Rifaya Meera & S. Muthupandi
Volume-III, Issue-IV January 2017 138
Linear-by-Linear Association 0.20443451 1 0.651
N of Valid Cases 80
Source: Computed data
From the above table it is found that the significant value of the chi-square value 15.20
for the 5 degrees of freedom is 0.010, which is less than the acceptable level of 0.05. Hence
the null hypothesis is rejected and it is concluded that there is a significant association
among level of satisfaction towards occupation level.
Association among Level of Satisfaction towards Age Level: To know the association
between level of satisfaction and age of the respondents has been made with the following
hypothesis.
Hypothesis 2: “There is no significant association among level of satisfaction of
respondents towards age of the respondents”.
Table 35 Association between Level of Satisfaction and Age Level
Age
Level of satisfaction
No opinion Agree
20-27 years Count 26 43
Expected Count 22.425 46.575
% within Age 37.681159 62.31884
% within group 100 79.62963
% of Total 32.5 53.75
28-34 years Count 0 8
Expected Count 2.6 5.4
% within Age 0 100
% within group 0 14.81481
% of Total 0 10
35-42 years Count 0 2
Expected Count 0.65 1.35
% within Age 0 100
% within group 0 3.703704
% of Total 0 2.5
51 years and Above Count 0 1
Expected Count 0.325 0.675
% within Age 0 100
% within group 0 1.851852
% of Total 0 1.25
Total Count 26 54
Expected Count 26 54
% within Age 32.5 67.5

Customer Satisfaction and Expectation Towards After Sales Service of … M. Rifaya Meera & S. Muthupandi
Volume-III, Issue-IV January 2017 139
% within group 100 100
% of Total 32.5 67.5
Source: Computed data
From the above table it is found that out of 80 respondents 43 respondents are students
towards agree factors of TVS motors in level of satisfaction. The result of chi-square test is
presented in the following table.
Table 36 Chi-square test result
Value Df Asymp.sig.(2-sided)
Pearson Chi-Square 6.1406333
3 .105
Likelihood Ratio 9.4704968
3 .024
Linear-by-Linear Association 4.2263374
1 .040
N of Valid Cases 80
Source: Computed data
From the above table 36 it is found that the significant value of the chi-square value 6.14
for the 3 degrees of freedom is 0.105, which is more than the acceptable level of 0.05.
Hence the null hypothesis is accepted and it is concluded that there is no significant
association between levels of satisfaction towards age of the respondents.
Factor Analysis: Mathematically factor analysis is somewhat similar to multiple regression
analysis. In factor analysis, each variable is expressed as a linear combination of the
underlying factors. The amount of variance a variable shares with all the other variables
included in the analysis is referred to communality. The co-variation among the variables is
described in terms of a small number of common factors plus a unique factor for each
variable. These factors are not over observed. If the variables are standardized, the factor
model may be represented as
X1=
AijF
1+A
i2F
2+A
i3F
3+……+A
imF
m+V
iU
i
Where
Xi = i
th
standardized variable
A ij
= Standardized multiple regression coefficient of variable i on common
Factor j
F = common factor
Vi = standardized regression coefficient of variable I on unique factor iU
i = the unique factor
for variable i
M = number of common factors
The unique factors are uncorrelated with each other and with the common factors. The
common factors themselves can be expressed as a linear combination of the observed
variables.
Customer Satisfaction and Expectation Towards After Sales Service of … M. Rifaya Meera & S. Muthupandi
Volume-III, Issue-IV January 2017 140
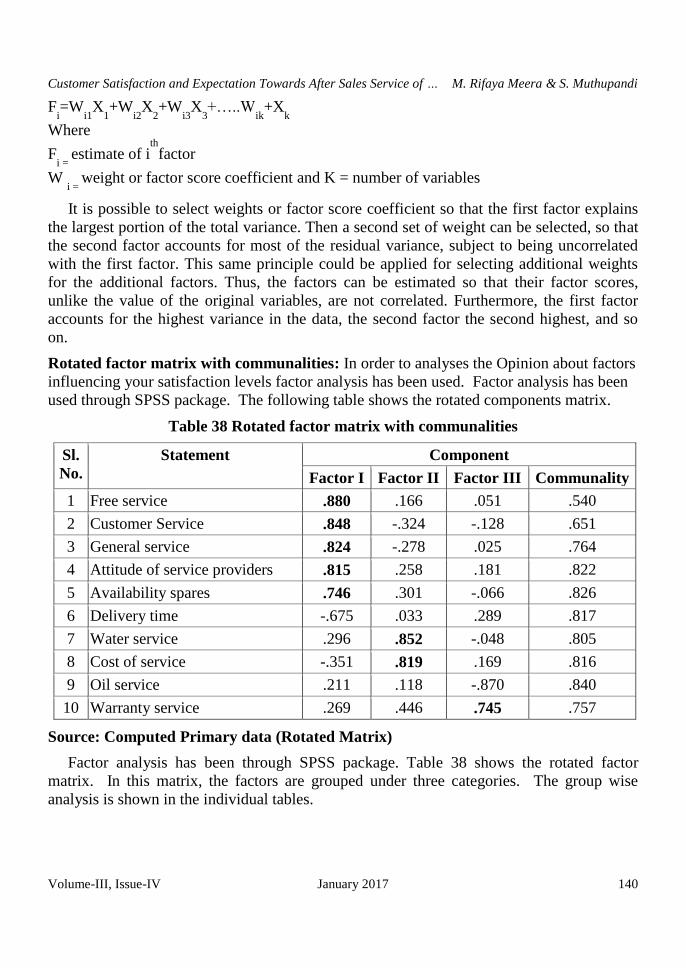
Fi=W
i1X
1+W
i2X
2+W
i3X
3+…..W
ik+X
k
Where
Fi =
estimate of ith
factor
W i =
weight or factor score coefficient and K = number of variables
It is possible to select weights or factor score coefficient so that the first factor explains
the largest portion of the total variance. Then a second set of weight can be selected, so that
the second factor accounts for most of the residual variance, subject to being uncorrelated
with the first factor. This same principle could be applied for selecting additional weights
for the additional factors. Thus, the factors can be estimated so that their factor scores,
unlike the value of the original variables, are not correlated. Furthermore, the first factor
accounts for the highest variance in the data, the second factor the second highest, and so
on.
Rotated factor matrix with communalities: In order to analyses the Opinion about factors
influencing your satisfaction levels factor analysis has been used. Factor analysis has been
used through SPSS package. The following table shows the rotated components matrix.
Table 38 Rotated factor matrix with communalities
Sl.
No.
Statement Component
Factor I Factor II Factor III Communality
1 Free service .880 .166 .051 .540
2 Customer Service .848 -.324 -.128 .651
3 General service .824 -.278 .025 .764
4 Attitude of service providers .815 .258 .181 .822
5 Availability spares .746 .301 -.066 .826
6 Delivery time -.675 .033 .289 .817
7 Water service .296 .852 -.048 .805
8 Cost of service -.351 .819 .169 .816
9 Oil service .211 .118 -.870 .840
10 Warranty service .269 .446 .745 .757
Source: Computed Primary data (Rotated Matrix)
Factor analysis has been through SPSS package. Table 38 shows the rotated factor
matrix. In this matrix, the factors are grouped under three categories. The group wise
analysis is shown in the individual tables.

Customer Satisfaction and Expectation Towards After Sales Service of … M. Rifaya Meera & S. Muthupandi
Volume-III, Issue-IV January 2017 141
Table 39 Factor I - Service Factors
Sl. No. Statement Factor loading Communality
1 Free service .880 .540
2 Customer Service .848 .651
3 General service .824 .764
4 Attitude of service providers .815 .822
5 Availability of spares .746 .826
Source: Computed Primary data
In the first factor consists of five factors namely free service (.880), customer service
(.848), general service (.824), attitude of service providers (.815), availability (.746) have
been examined. Free service has the highest factors loading. Hence factor second is
characterized as “Service factors”
Table 40 Factor II – Service cost Factors
Sl. No. Statement Factor loading Communality
1 Water service .852 .805
2 Cost of service .819 .816
Source: Computed Primary data
In the second factor consists of two factors namely Water service (.852), cost of service
(.819), have been examined. Water service has the highest factors loading. Hence factor
second is characterized as “Service cost factors”
Table 41 Factor III – Warranty Service Factors
Sl. No. Statement Factor loading Communality
1 Warranty service .852 .805
Source: Computed Primary data
In the third factor consists of one factors namely Warranty service (.852) has been
examined. Hence factor second is characterized as “Warranty service factors”
Findings of the Study:
The summary of findings is as follows:
It clearly indicates that, the two wheelers companies should take into account the
requirements of young people while designing the two wheelers.
It is found that majority of the respondents (51.2) are coming under the category of
female.
It is found that majority of the respondents (77.5 percent) are unmarried.

Customer Satisfaction and Expectation Towards After Sales Service of … M. Rifaya Meera & S. Muthupandi
Volume-III, Issue-IV January 2017 142
It is inferred that majority of the respondents (67.5) are students. The above stratified
status has also presented in the following diagram
It is inferred that most ( 31.20% )of the consumers are having income above 20,000
per month
It is inferred that majority of the respondents (76.2%) are studied up to Post graduate
level.
It is understood that most of the respondents (40%) have three earning member in
their family.
It is under stood that most of the respondents (38.8 percent) are having two 2
wheelers.
It is observed that, most of the respondents are having TVS Star city.
It is under stood that majority of the respondents (38.8 percent) have been using
between 1 to 2 years.
It is lucid from the above data that most of the respondents (86.2 per cent) are received
intimation for the service due.
It is found that most of the respondents (82.5 per cent) are received intimation for the
free service offered by TVS motors Private Limited.
It is under stood that majority of the respondents (63.8 percent) having an opinion that
cleanliness and comfort of service reception and customers waiting area of TVS is
Good.
It is under stood that majority of the respondents (90 percent) have been expected
better service from TVS motors vehicle.
It is lucid from the above data that majority of the respondents (63.75 per cent) are
feeling the price of spare parts are reasonable.
It is found that majority of the respondents (86.5 per cent) are feeling that feel service
or repair charges are Good.
It is lucid from the above data that majority of the respondents (78.8 per cent) are
highly satisfied with their present two wheelers.
It is lucid from the above data that majority of the respondents (78.8 per cent) are
highly satisfied with their present two wheelers.
It is lucid from the above data that most of the respondents (27.5 per cent) suggested
for further improvement to attractiveness in TVS motors vehicle.
Likert Scaling Technique:
The researcher used ranking technique in the following details:
It is clear that, Water service got First rank; Cost of service has been ranked as
Second; Delivery time has secured third rank; Warranty service got Fourth rank;
Availability spares has been ranked as Fifth; Attitude of service provider has secured
Sixth rank; Free service got Seventh rank; Oil service has been ranked as Eighth;
Customer service got Ninth rank and General service has secured Tenth rank.
It is clear that, Mileage got First rank; Capacity of petrol has been ranked as Second;
Style has secured third rank; maintenance got Fourth rank; color has been ranked as

Customer Satisfaction and Expectation Towards After Sales Service of … M. Rifaya Meera & S. Muthupandi
Volume-III, Issue-IV January 2017 143
Fifth; Kick starters has secured Sixth rank; Price of vehicle got Seventh rank; Cost of
spares has been ranked as Eighth; Weight got Ninth rank and Engine and performance
has secured Tenth rank; utility box has secured Eleventh rank; Brake has been ranked
as Twelfth.
Garrett Ranking Analysis:
It is coherent that the Garratt scores and the average scores of Satisfaction towards
service features of TVS motors pvt Ltd. The average scores are ranked according to
their values. The first rank is given to Information in time, Second rank goes to Quick
issues of reimbursement, Third rank for Customer relationship and Fourth rank to
Claim & settlement of Satisfaction towards service features of TVS motors pvt Ltd.
It is found that the Garratt scores and the average scores of features attracted to
satisfied TVS Motors private Limited among all other brands. The average scores are
ranked according to their values. The first rank is given to Price, Second rank goes to
service network, Third rank for Mileage and Fourth rank to brand image features
attracted to satisfied TVS Motors private Limited among all other brands
Chi-Square Test and Its Result:
Pearson’s chi square test is applied to test whether there is no relationship among level
of satisfaction towards occupation levels. It is found that the significant value of the
chi-square value 15.20 for the 5 degrees of freedom is 0.010, which is less than the
acceptable level of 0.05. Hence the null hypothesis is rejected and it is concluded that
there is a significant association among level of satisfaction towards occupation level.
Pearson’s chi square test is applied to test whether there is no relationship among level
of satisfaction towards age levels. It is found that the significant value of the chi-
square value 6.14 for the 3 degrees of freedom is 0.105, which is more than the
acceptable level of 0.05. Hence the null hypothesis is accepted and it is concluded that
there is no significant association between levels of satisfaction towards age of the
respondents.
Recommendations:
20 per cent respondents are not satisfied with their present two wheelers. They may go
for different brand, So Company should make arrangement to retain their customers
by Motivate their customer by appropriate use of buying motive technique
Since chi-square analysis shows that there is no relationship between age and level of
satisfaction, income and level of satisfaction. it is suggested that users should select a
two wheelers which is affordable and economical.
It is explained that out of 80 respondents,11.25 per cent of the respondents felt that
service or repair charges are fair, company should enquire and analyze about the
service rendered by the show room.
It is suggested that the company may adopt fuel saving techniques so that the vehicles
can have long life and smooth running.

Customer Satisfaction and Expectation Towards After Sales Service of … M. Rifaya Meera & S. Muthupandi
Volume-III, Issue-IV January 2017 144
The company shall concentrate on quality products also instead of concentrating on
low priced vehicles alone because 63.75 per cent of the respondents has been feeling
reasonable price in spare parts. Only customers expects quality vehicles from the TVS
Motors private Limited
Mileage and power are two controversies part of the two wheelers. If we need
mileage then we have to compromise with engine power and vice versa. User should
be clear about their necessity.
After sales service is important but users are not giving importance to it at the time of
purchase so they are dissatisfied by service rendered by the show room. It is suggested
that the users should enquire and analyses about the service rendered by the show
room before purchasing two-wheelers.
Conclusion: In a competitive marketplace where business competes for customers,
customer satisfaction is seen as a key differentiator and increasingly has been become a key
element of business strategy. The study could be more effective if the geographical area and
sampling size is increased. Anyhow possible amount of clear picture is formatted from the
report. The study is further suggested for further improvements and to identify the various
factors to improve their proceedings of TVS Motors private limited. If the above
recommendations are carried out promptly and properly there is no doubt the producer,
middlemen and consumers will get mutual benefit and satisfaction. It will lead an
establishment of a strong brand image of TVS Motors private limited.
Reference:
1. Rajesh Amonkar “Customer Satisfaction Towards After Sales Service: A Case
Study Analysis”, International Journal of Science and Research (IJSR), Volume 5
Issue 10, October 2016.
2. Dr. Duggani Yuvaraju & Prof. S. Durga Rao, Customer Satisfaction towards Honda
Two Wheelers: A Case Study in Tirupati, IOSR Journal of Business and
Management (IOSR-JBM), Volume 16, Issue 5. Version. I (May. 2014), PP 65-74.
3. Dr. k. lakshmi priya, “customer satisfaction towards honda two wheeler-a study in
palakkad district, kerala”. International Conference on "Research avenues in Social
Science” Organize by SNGC, Coimbatore, Vol-1 Issue-3 2016
4. Dr. A.S Ambily and Dheeraj R, “A Study on Consumer Satisfaction among Yamaha
Two Wheeler Users” International Journal of Core Engineering & Management
(IJCEM) Volume 3, Issue 1, April 2016.