Embed Size (px)
Citation preview
Customer Satisfaction Survey
Development Services
2013-2014 Annual Report
November 26, 2014
2
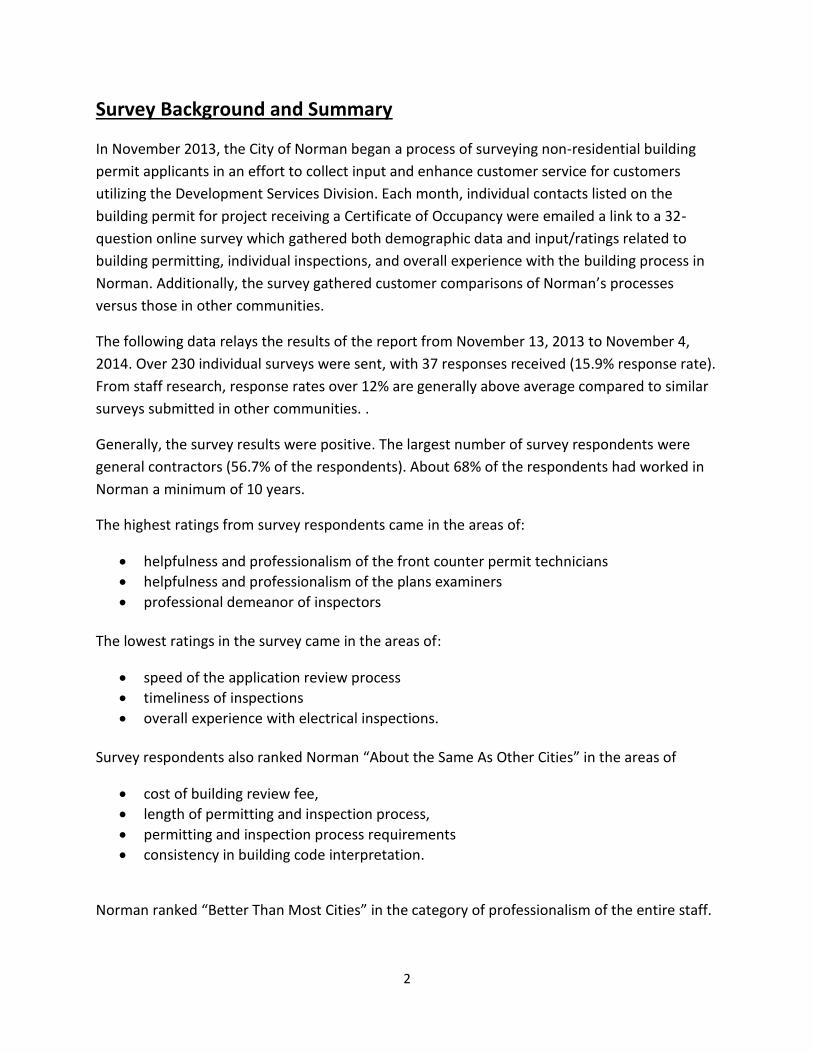
Survey Background and Summary
In November 2013, the City of Norman began a process of surveying non-residential building
permit applicants in an effort to collect input and enhance customer service for customers
utilizing the Development Services Division. Each month, individual contacts listed on the
building permit for project receiving a Certificate of Occupancy were emailed a link to a 32-
question online survey which gathered both demographic data and input/ratings related to
building permitting, individual inspections, and overall experience with the building process in
Norman. Additionally, the survey gathered customer comparisons of Norman’s processes
versus those in other communities.
The following data relays the results of the report from November 13, 2013 to November 4,
2014. Over 230 individual surveys were sent, with 37 responses received (15.9% response rate).
From staff research, response rates over 12% are generally above average compared to similar
surveys submitted in other communities. .
Generally, the survey results were positive. The largest number of survey respondents were
general contractors (56.7% of the respondents). About 68% of the respondents had worked in
Norman a minimum of 10 years.
The highest ratings from survey respondents came in the areas of:
helpfulness and professionalism of the front counter permit technicians
helpfulness and professionalism of the plans examiners
professional demeanor of inspectors
The lowest ratings in the survey came in the areas of:
speed of the application review process
timeliness of inspections
overall experience with electrical inspections.
Survey respondents also ranked Norman “About the Same As Other Cities” in the areas of
cost of building review fee,
length of permitting and inspection process,
permitting and inspection process requirements
consistency in building code interpretation.
Norman ranked “Better Than Most Cities” in the category of professionalism of the entire staff.
3
Three categories that ranked as top priorities from survey respondents for continuing quality of
the building inspection process include:
consistent interpretation of codes
willingness of the inspector to consider alternatives
definite times when requested inspections will take place
Respondents that requested contact from the Development Coordinator received a return phone call to discuss issues or other items related to their permitting process. Any information and/or issues were related to the appropriate Department Director.
The following pages provide statistical information related to the survey results.
4
Survey Statistics and Service/Process Ratings
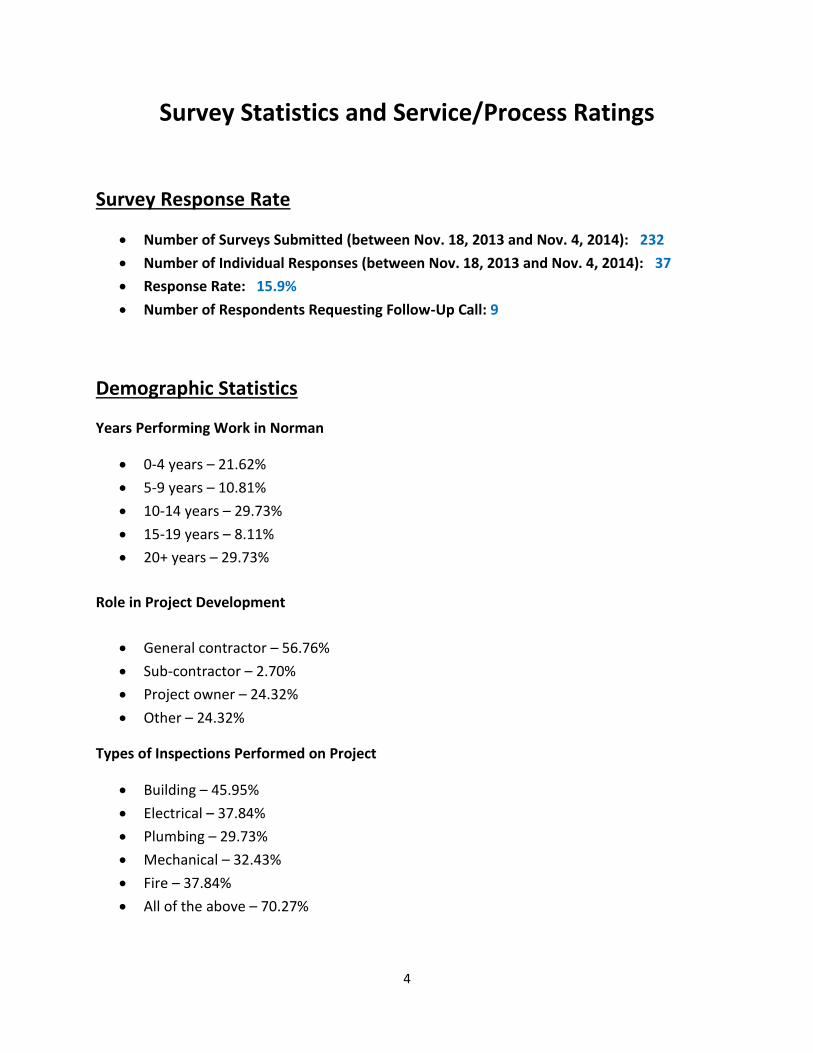
Survey Response Rate
Number of Surveys Submitted (between Nov. 18, 2013 and Nov. 4, 2014): 232
Number of Individual Responses (between Nov. 18, 2013 and Nov. 4, 2014): 37
Response Rate: 15.9%
Number of Respondents Requesting Follow-Up Call: 9
Demographic Statistics
Years Performing Work in Norman
0-4 years – 21.62%
5-9 years – 10.81%
10-14 years – 29.73%
15-19 years – 8.11%
20+ years – 29.73%
Role in Project Development
General contractor – 56.76%
Sub-contractor – 2.70%
Project owner – 24.32%
Other – 24.32%
Types of Inspections Performed on Project
Building – 45.95%
Electrical – 37.84%
Plumbing – 29.73%
Mechanical – 32.43%
Fire – 37.84%
All of the above – 70.27%
5
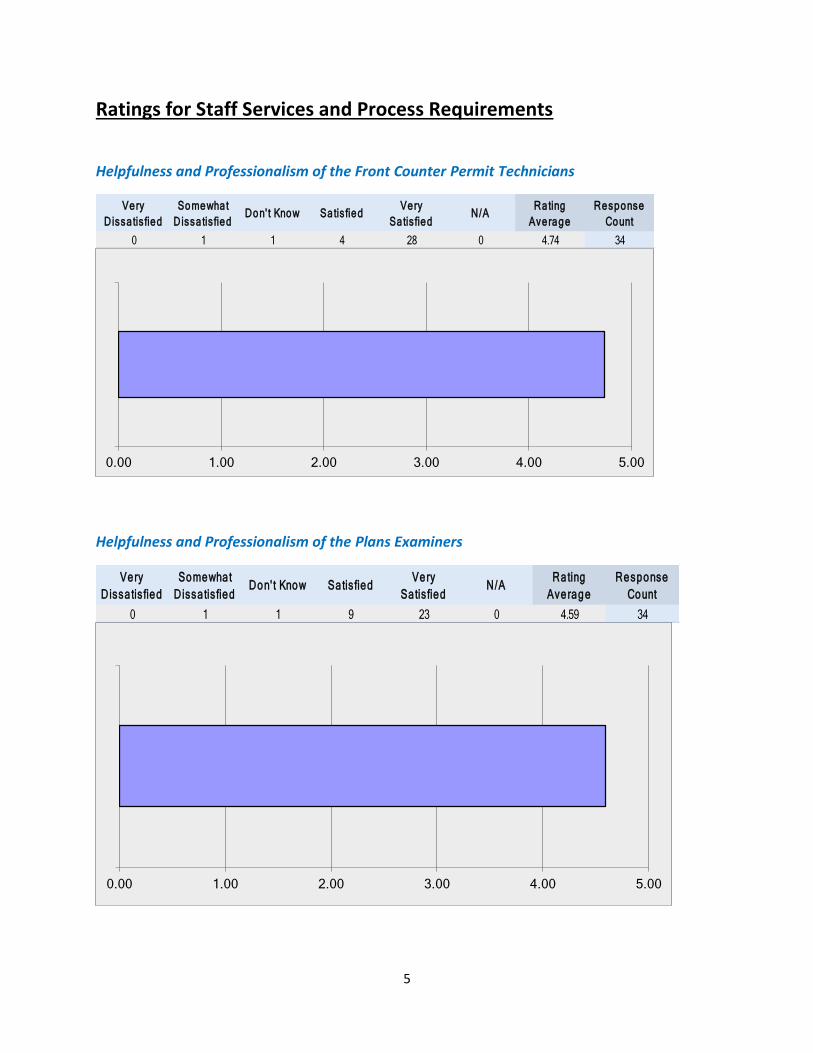
Ratings for Staff Services and Process Requirements
Helpfulness and Professionalism of the Front Counter Permit Technicians
Helpfulness and Professionalism of the Plans Examiners
Very
Dissa tis fied
Somewhat
Dissa tis fiedDon' t Know Satisfied
Very
Sa tis fiedN/A
Rating
Average
Response
Count
0 1 1 4 28 0 4.74 34
Answer Options
0.00 1.00 2.00 3.00 4.00 5.00
Very
Dissa tis fied
Somewhat
Dissa tis fiedDon' t Know Satisfied
Very
Sa tis fiedN/A
Rating
Average
Response
Count
0 1 1 9 23 0 4.59 34
0.00 1.00 2.00 3.00 4.00 5.00
6
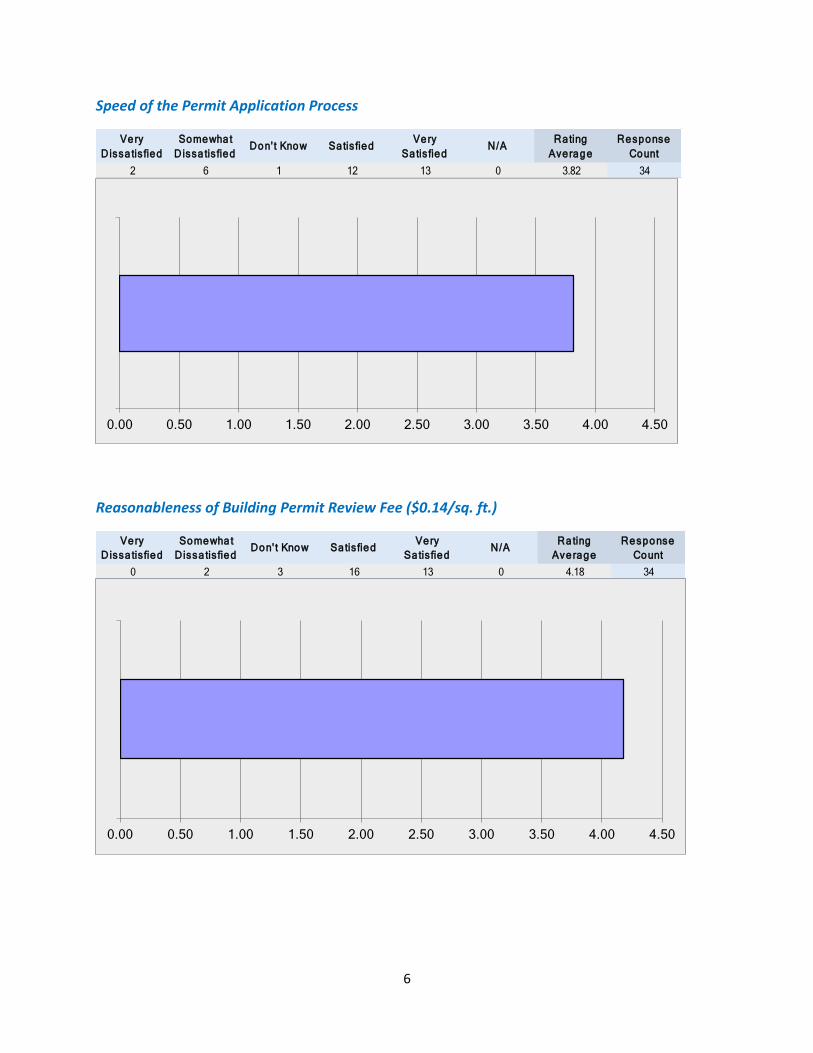
Speed of the Permit Application Process
Reasonableness of Building Permit Review Fee ($0.14/sq. ft.)
Very
Dissa tis fied
Somewhat
Dissa tis fiedDon' t Know Satisfied
Very
Sa tis fiedN/A
Rating
Average
Response
Count
2 6 1 12 13 0 3.82 34
0.00 0.50 1.00 1.50 2.00 2.50 3.00 3.50 4.00 4.50
Very
Dissa tis fied
Somewhat
Dissa tis fiedDon' t Know Satisfied
Very
Sa tis fiedN/A
Rating
Average
Response
Count
0 2 3 16 13 0 4.18 34
0.00 0.50 1.00 1.50 2.00 2.50 3.00 3.50 4.00 4.50
7
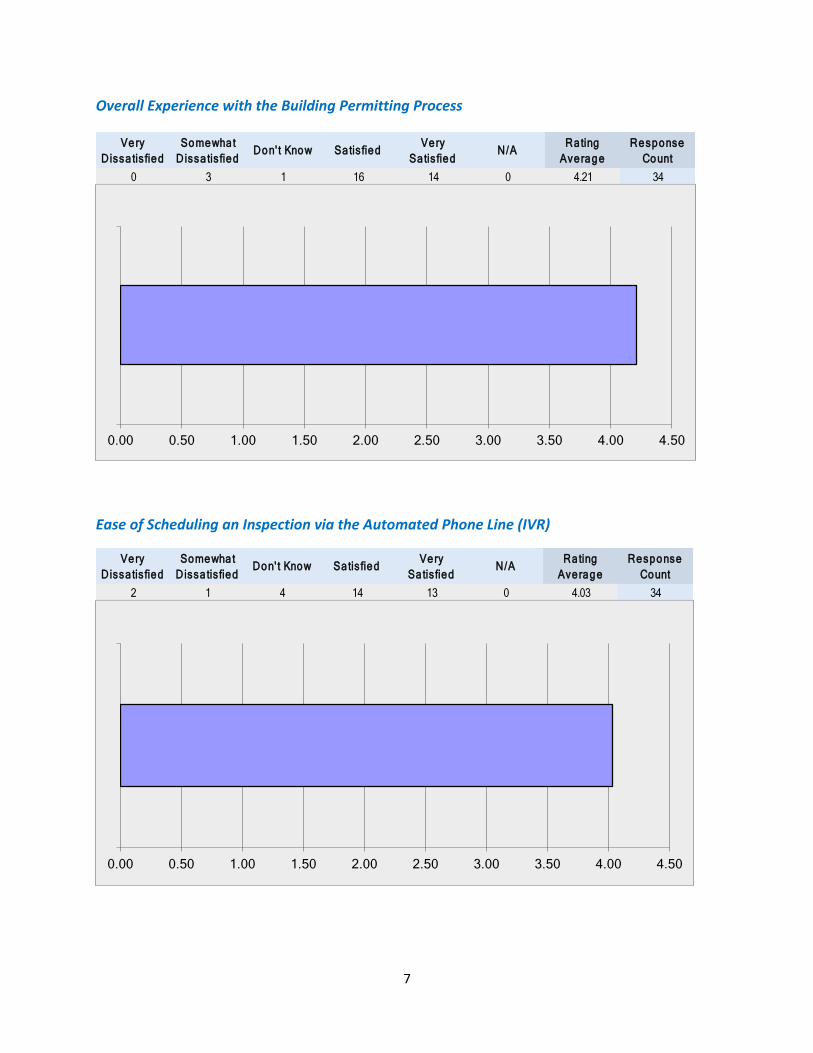
Overall Experience with the Building Permitting Process
Ease of Scheduling an Inspection via the Automated Phone Line (IVR)
Very
Dissa tis fied
Somewhat
Dissa tis fiedDon' t Know Satisfied
Very
Sa tis fiedN/A
Rating
Average
Response
Count
0 3 1 16 14 0 4.21 34
0.00 0.50 1.00 1.50 2.00 2.50 3.00 3.50 4.00 4.50
Very
Dissa tis fied
Somewhat
Dissa tis fiedDon' t Know Satisfied
Very
Sa tis fiedN/A
Rating
Average
Response
Count
2 1 4 14 13 0 4.03 34
0.00 0.50 1.00 1.50 2.00 2.50 3.00 3.50 4.00 4.50
8
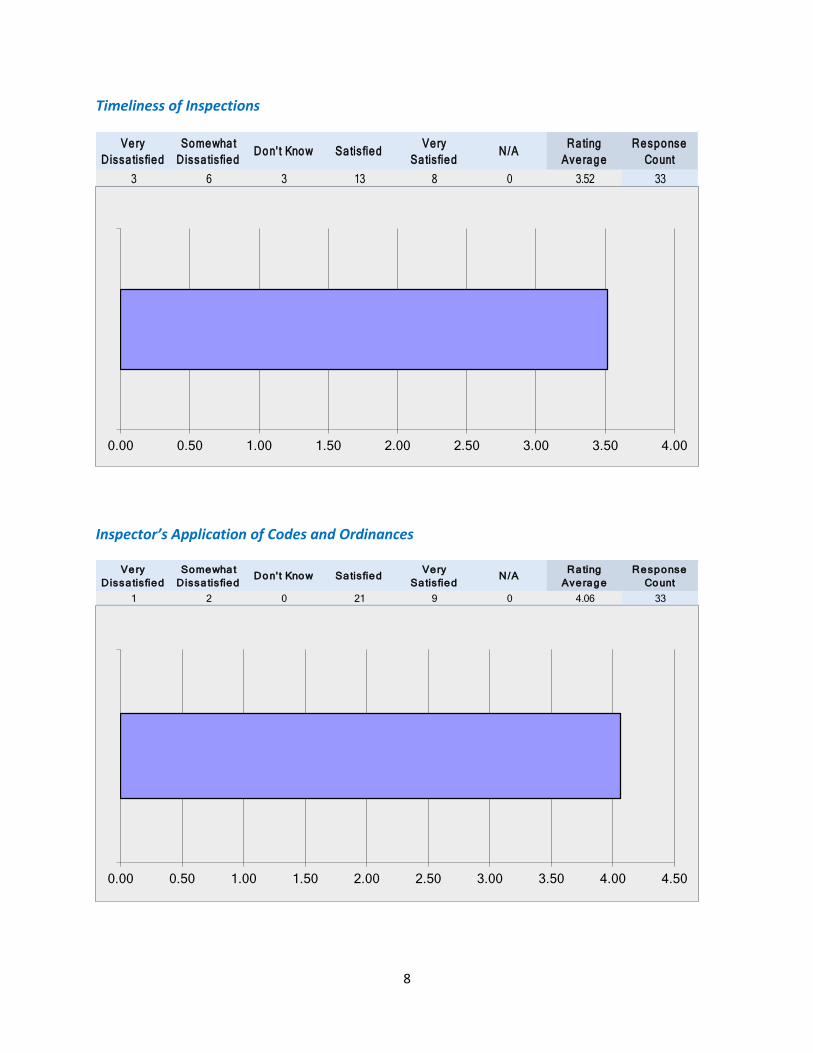
Timeliness of Inspections
Inspector’s Application of Codes and Ordinances
Very
Dissa tis fied
Somewhat
Dissa tis fiedDon' t Know Satisfied
Very
Sa tis fiedN/A
Rating
Average
Response
Count
3 6 3 13 8 0 3.52 33
0.00 0.50 1.00 1.50 2.00 2.50 3.00 3.50 4.00
Very
Dissa tis fied
Somewhat
Dissa tis fiedDon' t Know Satisfied
Very
Sa tis fiedN/A
Rating
Average
Response
Count
1 2 0 21 9 0 4.06 33
0.00 0.50 1.00 1.50 2.00 2.50 3.00 3.50 4.00 4.50
9
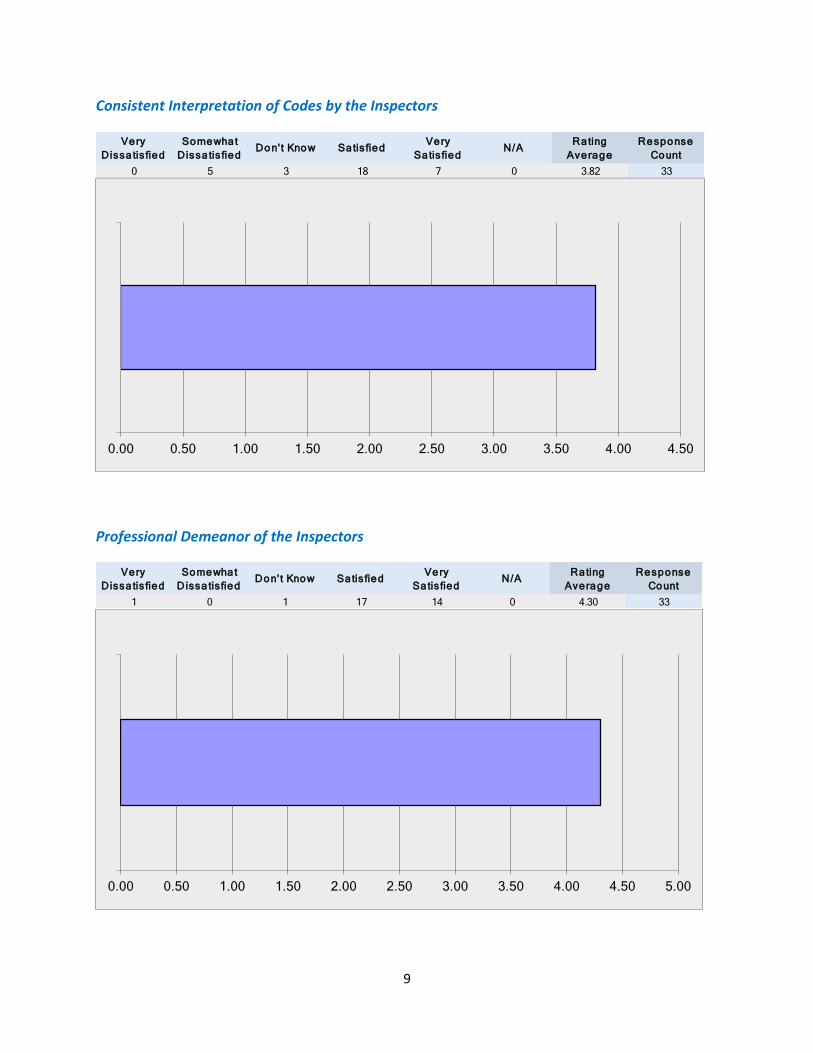
Consistent Interpretation of Codes by the Inspectors
Professional Demeanor of the Inspectors
Very
Dissa tis fied
Somewhat
Dissa tis fiedDon' t Know Satisfied
Very
Sa tis fiedN/A
Rating
Average
Response
Count
0 5 3 18 7 0 3.82 33
0.00 0.50 1.00 1.50 2.00 2.50 3.00 3.50 4.00 4.50
Very
Dissa tis fied
Somewhat
Dissa tis fiedDon' t Know Satisfied
Very
Sa tis fiedN/A
Rating
Average
Response
Count
1 0 1 17 14 0 4.30 33
0.00 0.50 1.00 1.50 2.00 2.50 3.00 3.50 4.00 4.50 5.00
10
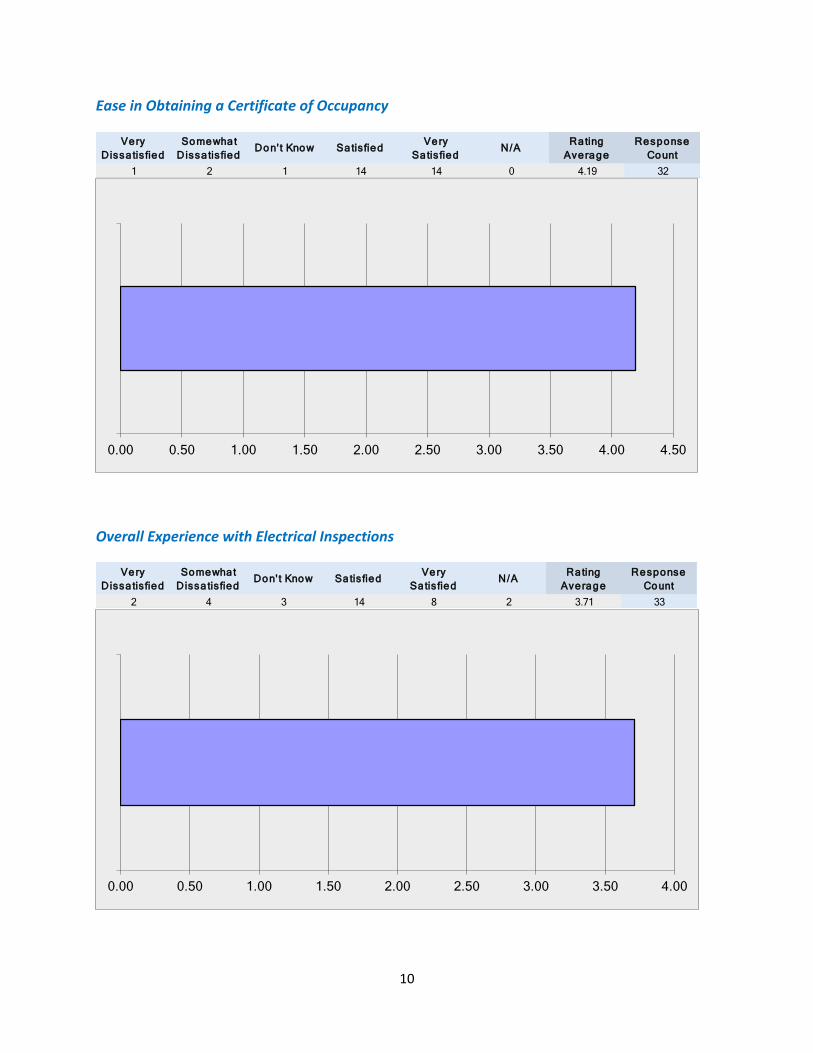
Ease in Obtaining a Certificate of Occupancy
Overall Experience with Electrical Inspections
Very
Dissa tis fied
Somewhat
Dissa tis fiedDon' t Know Satisfied
Very
Sa tis fiedN/A
Rating
Average
Response
Count
1 2 1 14 14 0 4.19 32
0.00 0.50 1.00 1.50 2.00 2.50 3.00 3.50 4.00 4.50
Very
Dissa tis fied
Somewhat
Dissa tis fiedDon' t Know Satisfied
Very
Sa tis fiedN/A
Rating
Average
Response
Count
2 4 3 14 8 2 3.71 33
0.00 0.50 1.00 1.50 2.00 2.50 3.00 3.50 4.00
11
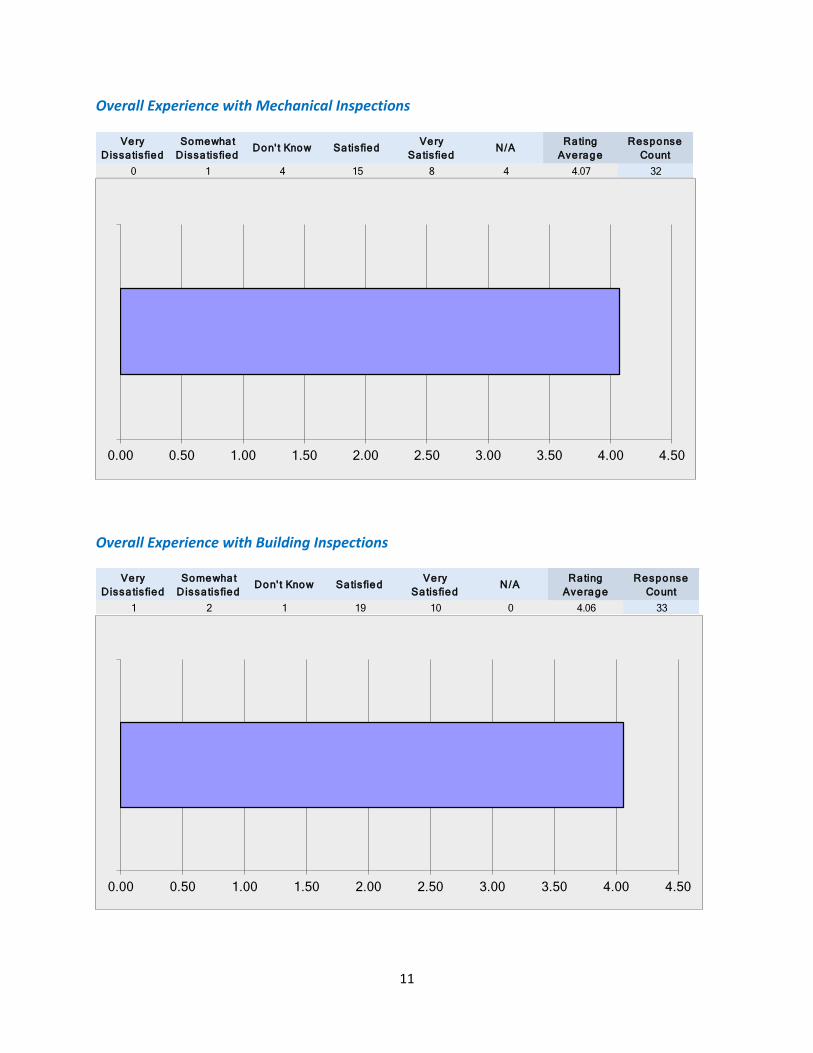
Overall Experience with Mechanical Inspections
Overall Experience with Building Inspections
Very
Dissa tis fied
Somewhat
Dissa tis fiedDon' t Know Satisfied
Very
Sa tis fiedN/A
Rating
Average
Response
Count
0 1 4 15 8 4 4.07 32
0.00 0.50 1.00 1.50 2.00 2.50 3.00 3.50 4.00 4.50
Very
Dissa tis fied
Somewhat
Dissa tis fiedDon' t Know Satisfied
Very
Sa tis fiedN/A
Rating
Average
Response
Count
1 2 1 19 10 0 4.06 33
0.00 0.50 1.00 1.50 2.00 2.50 3.00 3.50 4.00 4.50
12
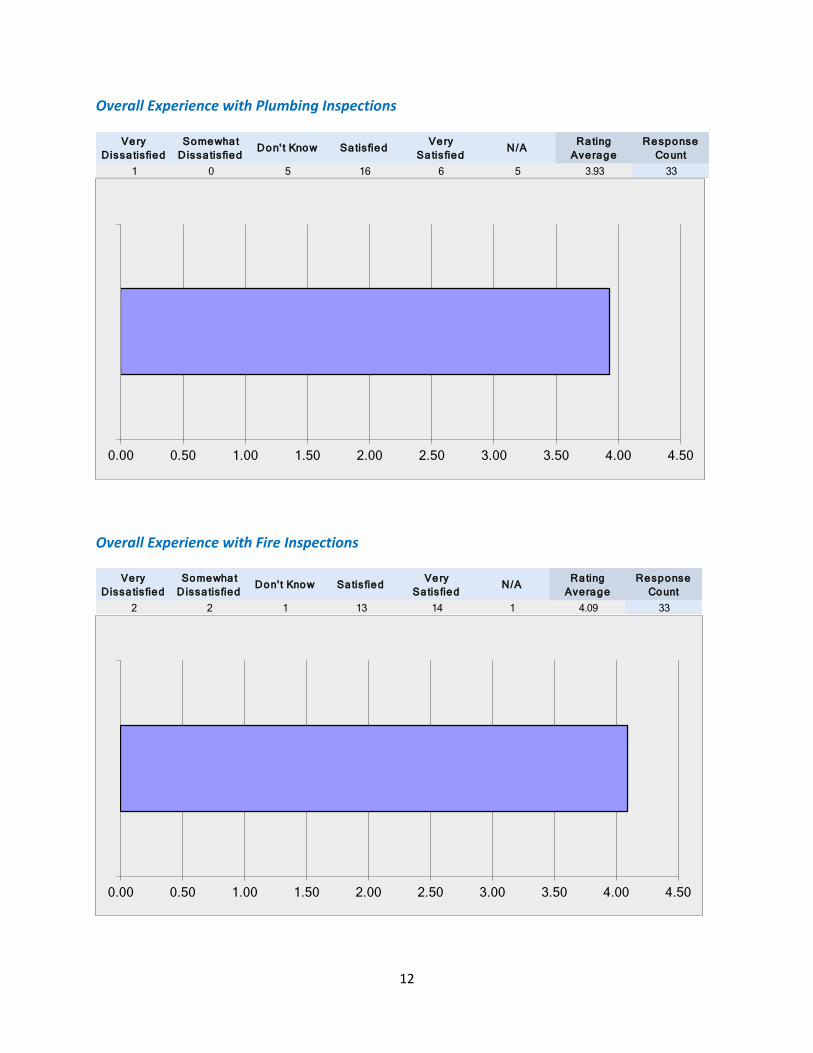
Overall Experience with Plumbing Inspections
Overall Experience with Fire Inspections
Very
Dissa tis fied
Somewhat
Dissa tis fiedDon' t Know Satisfied
Very
Sa tis fiedN/A
Rating
Average
Response
Count
1 0 5 16 6 5 3.93 33
0.00 0.50 1.00 1.50 2.00 2.50 3.00 3.50 4.00 4.50
Very
Dissa tis fied
Somewhat
Dissa tis fiedDon' t Know Satisfied
Very
Sa tis fiedN/A
Rating
Average
Response
Count
2 2 1 13 14 1 4.09 33
0.00 0.50 1.00 1.50 2.00 2.50 3.00 3.50 4.00 4.50
13
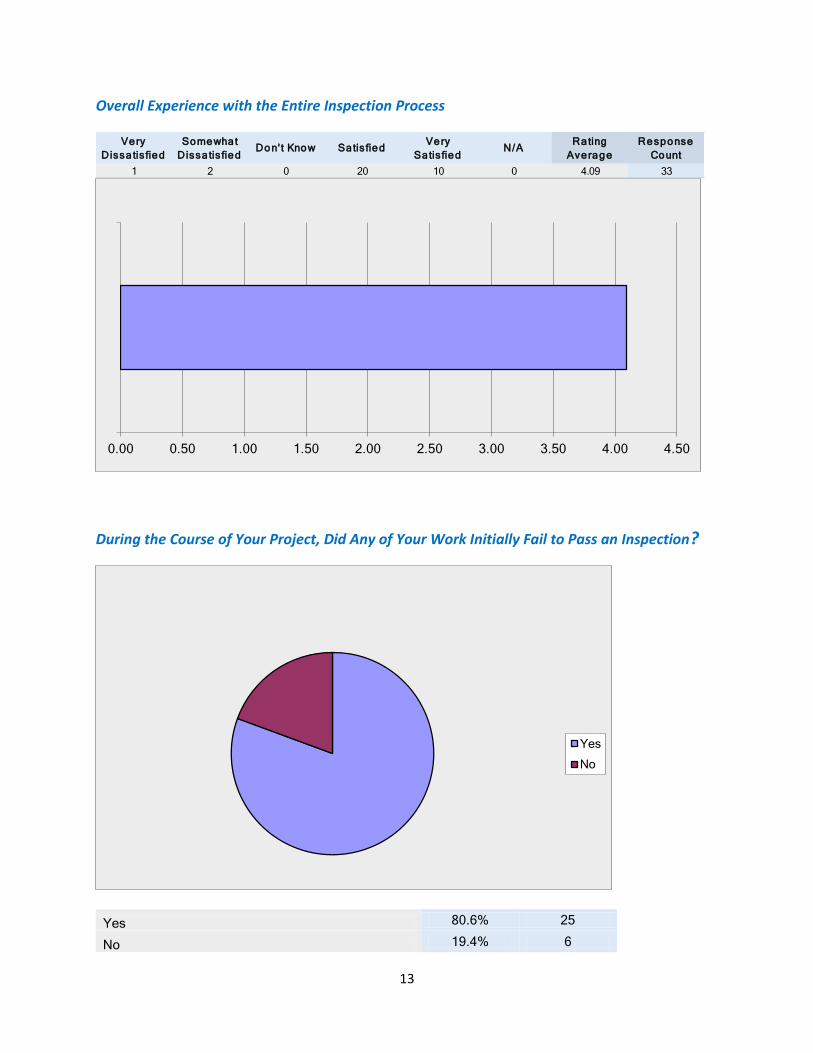
Overall Experience with the Entire Inspection Process
During the Course of Your Project, Did Any of Your Work Initially Fail to Pass an Inspection?
Yes 80.6% 25
No 19.4% 6
Very
Dissa tis fied
Somewhat
Dissa tis fiedDon' t Know Satisfied
Very
Sa tis fiedN/A
Rating
Average
Response
Count
1 2 0 20 10 0 4.09 33
0.00 0.50 1.00 1.50 2.00 2.50 3.00 3.50 4.00 4.50
Yes
No
14
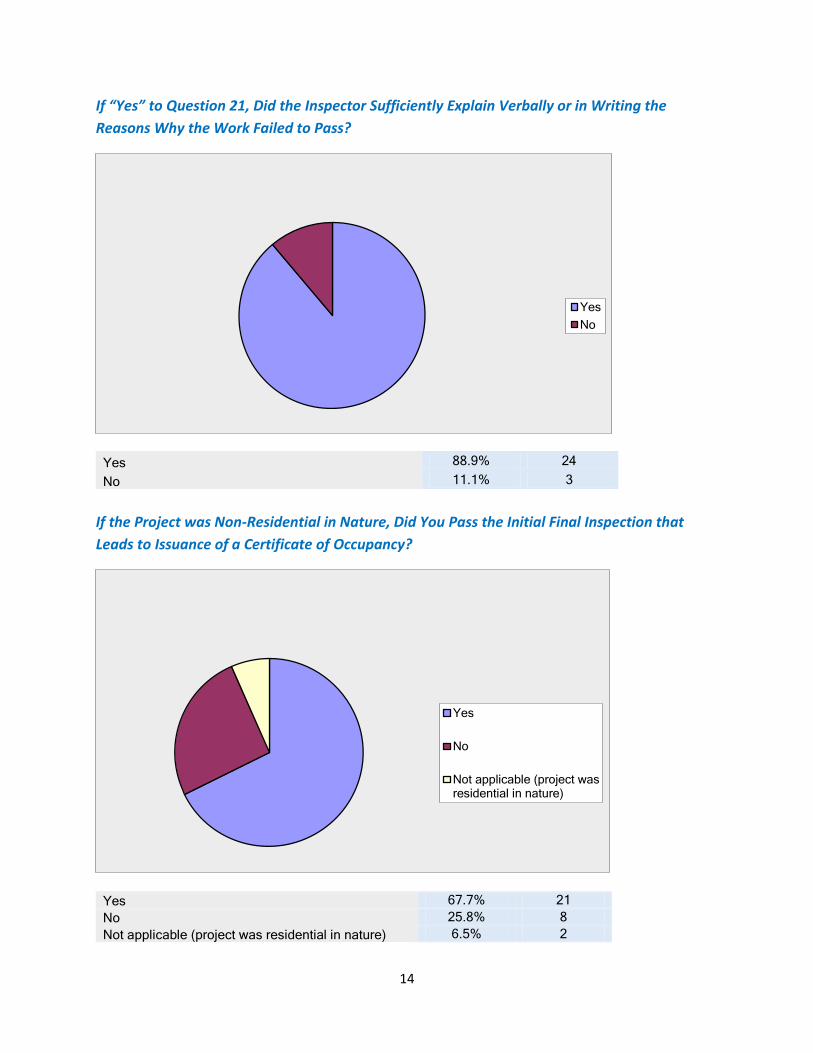
If “Yes” to Question 21, Did the Inspector Sufficiently Explain Verbally or in Writing the
Reasons Why the Work Failed to Pass?
Yes 88.9% 24
No 11.1% 3
If the Project was Non-Residential in Nature, Did You Pass the Initial Final Inspection that
Leads to Issuance of a Certificate of Occupancy?
Yes 67.7% 21
No 25.8% 8
Not applicable (project was residential in nature) 6.5% 2
Yes
No
Yes
No
Not applicable (project wasresidential in nature)
15
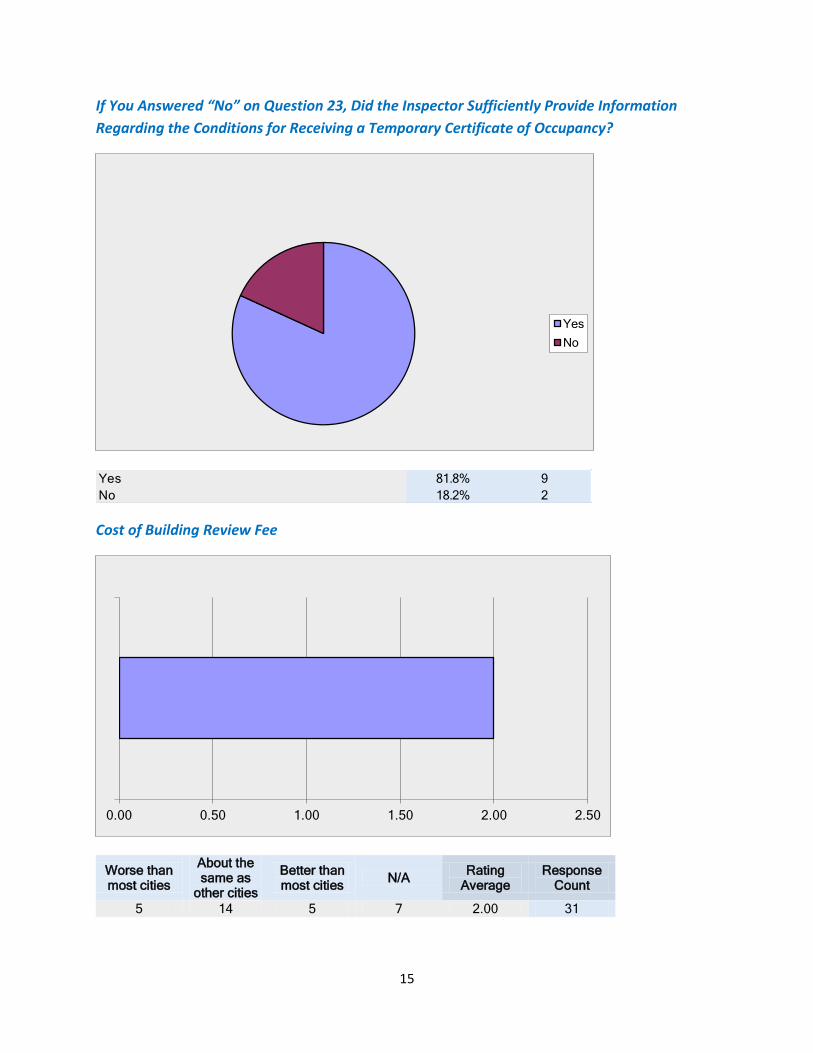
If You Answered “No” on Question 23, Did the Inspector Sufficiently Provide Information
Regarding the Conditions for Receiving a Temporary Certificate of Occupancy?
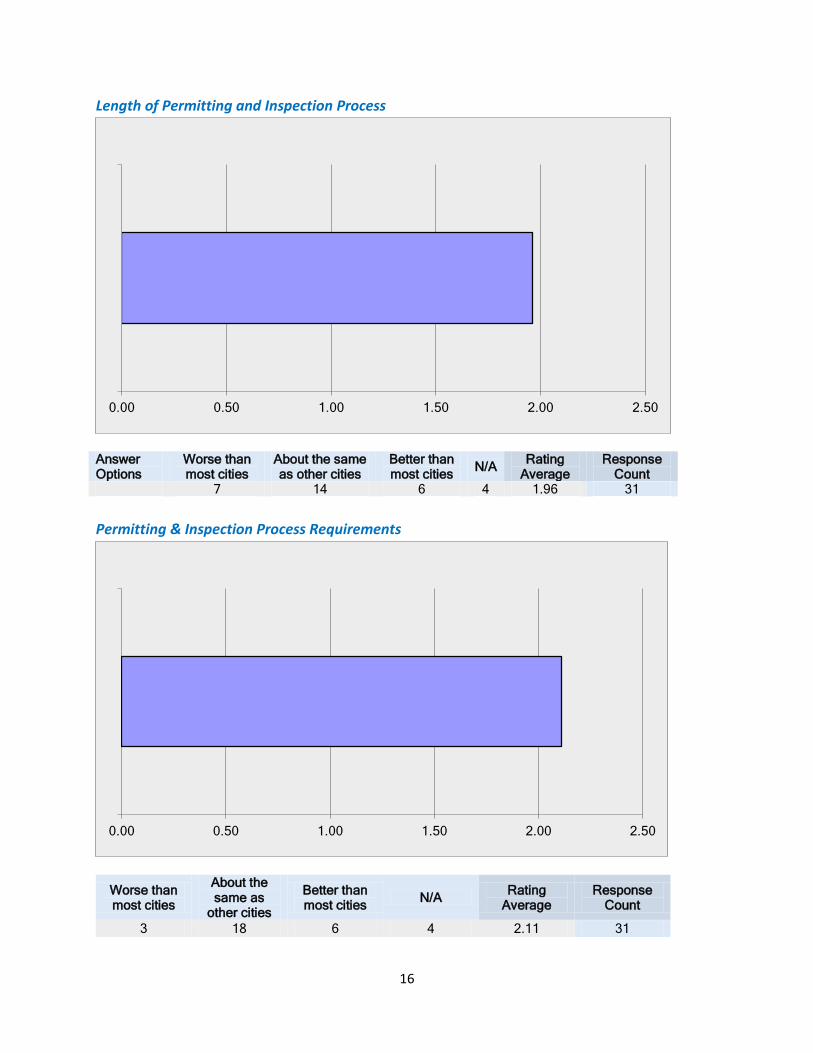
Cost of Building Review Fee
Worse than most cities
About the same as
other cities
Better than most cities
N/A Rating
Average Response
Count
5 14 5 7 2.00 31
Yes
No
81.8% 9
18.2% 2
Yes
No
0.00 0.50 1.00 1.50 2.00 2.50
16
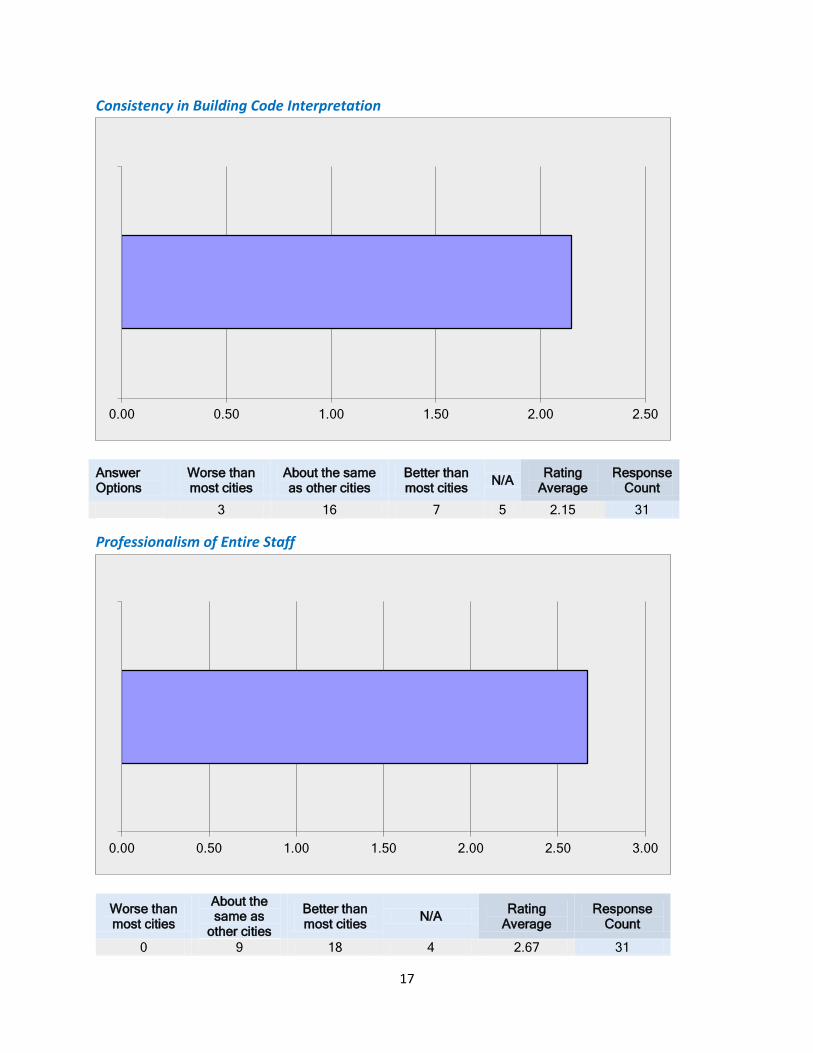
Length of Permitting and Inspection Process
Answer Options
Worse than most cities
About the same as other cities
Better than most cities
N/A Rating
Average Response
Count 7 14 6 4 1.96 31
Permitting & Inspection Process Requirements
Worse than most cities
About the same as
other cities
Better than most cities
N/A Rating
Average Response
Count
3 18 6 4 2.11 31
0.00 0.50 1.00 1.50 2.00 2.50
0.00 0.50 1.00 1.50 2.00 2.50
17
Consistency in Building Code Interpretation
Answer Options
Worse than most cities
About the same as other cities
Better than most cities
N/A Rating
Average Response
Count
3 16 7 5 2.15 31
Professionalism of Entire Staff
Worse than most cities
About the same as
other cities
Better than most cities
N/A Rating
Average Response
Count
0 9 18 4 2.67 31
0.00 0.50 1.00 1.50 2.00 2.50
0.00 0.50 1.00 1.50 2.00 2.50 3.00
18
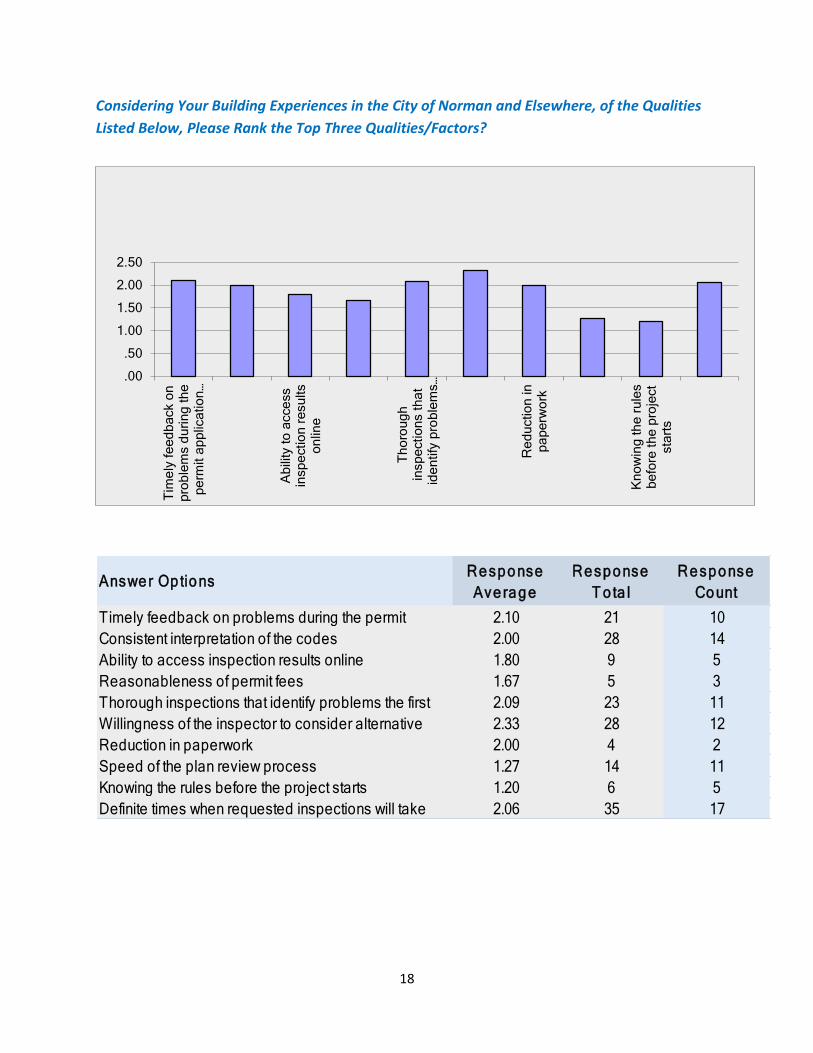
Considering Your Building Experiences in the City of Norman and Elsewhere, of the Qualities
Listed Below, Please Rank the Top Three Qualities/Factors?
.00
.50
1.00
1.50
2.00
2.50
Tim
ely
fe
ed
ba
ck o
np
rob
lem
s d
uri
ng
th
ep
erm
it a
pp
lica
tio
n…
Ab
ility
to
acce
ss
insp
ectio
n r
esu
lts
on
line
Th
oro
ug
hin
sp
ectio
ns t
ha
tid
en
tify
pro
ble
ms…
Re
du
ctio
n in
pa
pe
rwo
rk
Kn
ow
ing
th
e r
ule
sb
efo
re t
he
pro
ject
sta
rts
Response
Ave rage
Response
T o ta l
Response
Count
2.10 21 10
2.00 28 14
1.80 9 5
1.67 5 3
2.09 23 11
2.33 28 12
2.00 4 2
1.27 14 11
1.20 6 5
2.06 35 17
Ability to access inspection results online
Speed of the plan review process
Answer Op tions
Thorough inspections that identify problems the first
Definite times when requested inspections will take
Consistent interpretation of the codes
Reduction in paperwork
Reasonableness of permit fees
Knowing the rules before the project starts
Timely feedback on problems during the permit
Willingness of the inspector to consider alternative