Embed Size (px)
Citation preview

User Satisfaction Surveys in Two Italian University Libraries: Model, Results and Good Practices
5th International Conference on
Qualitative and Quantitative Methods in Libraries
4 - 7 June 2013, «La Sapienza» University, Rome Italy
by Ilaria Moroni from Milano-Bicocca University Library
Workshop «Customer Satisfaction in Education»

Summary
The User Satisfaction Survey
A Conceptual Model
Survey Process and Tool
Main Survey Results
Good Practices

The User Satisfaction Survey

Context
In 2012 the same user satisfaction survey was carried out
in two Italian university libraries: Milano-Bicocca and
Siena.
Both organizations are members of the GIM (Interuniversity
Group for the Monitoring of Academic Libraries) but they are
very different.
Information Milano-Bicocca Siena
Foundation of University 1998 1240
Location Northern Italy Central Italy
Faculties 8 9
Institutional Users 34,634 24,042
Library Sites 3 19
Library Staff 34 [30.64 FTE] 99 [96.45 FTE]

Objectives
We wanted to overall analyze the perceived quality, and
find out users’ behaviors and opinions.
•Who attends libraries, who doesn’t and why?
Library attendance
•How and how often are services used and by whom? What are the reasons behind this?
•How important and satisfying are library services and features to users? What do people think of them?
Library services and features
•What is overall perception of the library and why?
•What are users’ suggestions for improving libraries?
Overall perception

A Conceptual Model

COLLECTIONS
SERVICES
STAFF
COMMUNICATION
SPACES
OPENING TIMES
How?
What?
Where?
When?
Who?
Questions and
features
Why?
Library Features

Consultation
Reading Room Digital
Library
Loan
ILL/DD
Reference
PC and WiFi
OPAC
New Arrivals Report
Newsletter
Digital Reference
Web Site
IL Courses
Photocopying
SERVICES On-site Online
Library Services

Library Services and other Features
SERVICES TIMES SPACES STAFF COLLECTIONS COMMUNICATION
Reading Room X X X
PC and WiFi X X X
Photocopying X X X
Consultation X X X X
Loan X X X X
ILL/DD X X X X
IL courses X X X X
Reference X X X
Digital Reference X X
Newsletter X
New Arrivals Report X X
Web Site X
OPAC X X
Digital Library X X

Variables and useful Questions
FEATURES SATISFACTION IMPORTANCE KNOWLEDGE USE
OPENING TIMES X X
SPACES X X
STAFF X X
COLLECTIONS X X
SERVICES X X X X
COMMUNICATION X X
Closed questions:
• Level of satisfaction and importance for library features
• Level of use, satisfaction and importance for library services
Open questions:
• Reasons for satisfaction/dissatisfaction, and little use of services
• Suggestions for improving library features and services

Survey Process and Tool

Scheduled Activities
This was the survey schedule in both universities.
October 2012-March 2013
Communication Actions
May-September 2012
Data Collection Data Analysis
March-April 2012
Planning Advertising

Survey Tool
We created a survey tool using open and closed questions to
gather both Qualitative and Quantitative data.
We invited all institutional users to fill in the online questionnaire,
through the open source application Lime Survey.
Collected Data
Suggestions
Opinions Behaviors

Questionnaire Sections
The questionnaire was divided into 5 sections.
• User type (student, teacher, scholar, employee and so on)
• Faculty and type of graduate courses User Profile
• Attending university libraries: level, and reasons
• Attending other libraries or not attending libraries: reasons Attendance
• Using services: level (4-point scale), reasons for using/not using
• Importance and Satisfaction level (4-point scale), opinions Services
• Importance and Satisfaction level (4-point scale)
• Opinions about features (opening times, spaces, collections, etc.) Features
• Level of the overall Satisfaction (4-point scale) with the library
• Reasons for evaluation, and suggestions for improving libraries Overall
Perception

Partition of services
In the introduction of survey results, we used a colour
code to identify the library services examined, according to
their prevalent features.
Spaces and tools:
Reading room
PC and WiFi
Photocopying
Collections:
Consultation
Loan
ILL/DD
Staff:
Quick Reference
Reference
IL Courses
Online services:
Website
OPAC
Digital Library
Services

Main Survey Results

Sample Composition
15% of population took part in the survey as for Milano-
Bicocca, and 9% as for Siena.
The two pie charts illustrate the sample composition
according to user type.
Comparing sample and population, in both cases teachers and
scholars took part in the survey to a greater extent.

Library Attendance
The two pie charts illustrate the sample composition as
for what concerns library attendance.
In Siena, a university town, there are more people who attend
university libraries than in Milan, a city full of commuters.
As for Milano-Bicocca, the people who don’t attend university
libraries say they either don’t need them or attend public
libraries, as nearer to their home.

Use of Services
The two pie charts show the sample composition
according to the use of library services.
In Siena there are more people who use only on-site services
than in Milan: 33% compared with 19%.
Among people who don’t attend university libraries, there are
many users of online services: 18% out of 31% in Milan, and
9% out of 10% in Siena.
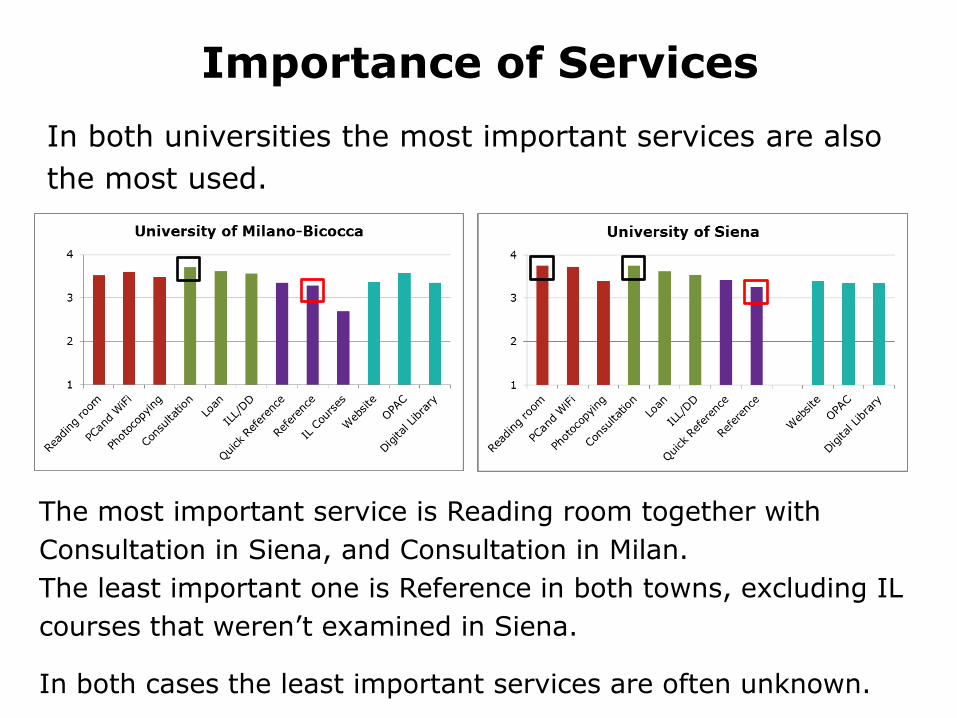
Importance of Services
In both universities the most important services are also
the most used.
The most important service is Reading room together with
Consultation in Siena, and Consultation in Milan.
The least important one is Reference in both towns, excluding IL
courses that weren’t examined in Siena.
In both cases the least important services are often unknown.

Satisfaction with Services
In both universities the least satisfactory services are the
same, whereas the most satisfactory ones are different.
The least satisfactory services are PC/WiFi, Photocopying, and
Website. The most satisfactory ones are Quick Reference and
Consultation in Siena, ILL/DD and IL courses in Milan.
The biggest negative gap between importance and satisfaction occurs for
PC/WiFi (-0,76) in Siena, and for Consultation (-0,43) in Milan.

Importance of Features
The most and least important library features are almost
the same in both universities.
In both cases among the most important library features there
are Spaces, Collections, and Opening Times.
The least important library feature is Communication both in
Milan and in Siena.

Satisfaction with Features
The most satisfactory library features are the same in both
universities, but the least satisfactory ones are different.
Among the most satisfactory library features there are Staff and
Spaces in both cases. The least satisfactory ones are Communication
in Siena, Opening Times and Online Services in Milan.
The biggest negative gap between importance and satisfaction occurs for
Communication (-0,91) in Siena, and for Opening Times (-0,55) in Milan.

Overall Perception
The level of overall satisfaction is average high in both
universities.
The reasons for dissatisfaction and the suggestions for improving
libraries were very useful to understand how to do better in both
contexts.
The gap between importance and satisfaction was useful to identify
priority actions about services and library features.

The table below illustrates the results in Milan.
Library Profiles
The most important Features
The most used Services
User Type Satisfaction
Level
Place
to study
Opening Times, Spaces
Reading Room, PC and WiFi
Students Average
high
Point
to use on-site services
On-site Services, Collections
Consultation, Loan,
Photocopying, OPAC, Quick Reference
Students,
Teachers, Scholars, Graduates
High
Gateway
to online services
Online Services, Communication
Digital Library, OPAC,
Website
Teachers, Scholars, Graduates
High
Mediator for
bibliographic research
Staff, On-site Services
Reference, IL courses,
ILL/DD
Teachers, Scholars, Graduates
Very high
Library Profiles [1]

Mediator Gateway
Place Point
Teachers, Scholars,
Graduates, Graduands
(34%)
Students (63%)
Library Profiles [2]
Users fall into two main categories.

Qualitative Analysis by T-LAB
The diagram shows the Multi Dimensional Scaling analysis on
overall perception in Milano-Bicocca [from Laura Oliva’s thesis].
General evaluation: library, services, satisfying, study
Use of spaces: finding, studying, seat, silence
Specific evaluation: service, opening, improving, online
Use of printed copies: book, loan, copy, available

Good Practices

Realized Activities
In both universities we planned and realized the following
activities, which can be considered Good Practices.
• Organizing staff training courses
• Carrying out internal and external benchmarking
• Taking care of internal and external communication
• Sharing results with various stakeholders
• Gathering users’ suggestions and complaints
• Taking actions to improve libraries

Good Practices
Good Pratices
Learning
Sharing
Improving
To sum up, when you carry out a User Satisfaction
Survey, you could follow these Good Practices.

Thanks for your attention!
Any questions?
Ilaria Moroni
Head of Training, Development and Communication
at the Milano-Bicocca University Library.
Trainer and Consultant
www.biblio.unimib.it


![INDEX [] · n.r.i questionnaire 3 keyman questionnaire with annexures 5 employer-employee scheme questionnaire 11 personal financial questionnaire 12 general occupation questionnaire](https://img.pdfslide.net/doc/110x75/5e7f0927f331ad3020486c35/index-nri-questionnaire-3-keyman-questionnaire-with-annexures-5-employer-employee.jpg)