Embed Size (px)
Citation preview
19.1
ASME Early Career Technical Journal 2009 ASME Early Career Technical Conference, ASME ECTC
October 2-3, 2009, Tuscaloosa, Alabama, USA
CUTTING EDGE PROFILE CHARACTERIZATIONS BY WHITE-LIGHT INTERFEROMETRY
Andrew Ogilvie and Kevin Chou Mechanical Engineering Department
The University of Alabama Tuscaloosa, Alabama, USA
ABSTRACT Diamond coated cutting tools provide several advantages
over traditional cutting tools, specifically in the machining of advanced materials such as composites. One of the main disadvantages of diamond coated cutting tools is the residual stresses induced from the diamond deposition, which lead to tool failure. Moreover, the cutting edge geometry can be critical to the deposition residual stresses of diamond coated tools.
In this study, a white-light interferometer was used to acquire tool edge surface data, and a MATLAB-based algorithm was developed to accurately characterize the tool edge radius and the wedge angle. Commercial carbide inserts with five different edge radii were evaluated. In addition, carbide inserts before and after diamond deposition were evaluated to estimate the coating thickness. The insert edge geometry and coating thickness will allow for a quantitative relationship that predicts the residual stress level at the tool edge.
The results demonstrate the ability of the MATLAB algorithm, both in its accuracy and efficiency. It is also found that large edge radius cases tend to have a greater deviation from the manufactured specification. Moreover, tools with a larger edge radius have a less perfect round profile at the flank face transition. BACKGROUND
In an effort to replace costly polycrystalline diamond (PCD) cutting tools in the machining of advanced materials, technologies such as chemical vapor deposition (CVD) have been developed to apply diamond coatings to cutting tools [1-3]. Diamond coatings have been the subject of several previous studies [4] due to their unique properties and wide applications for the machining of advanced materials. Diamond coated tools have also been studied as to deposition residual stresses with various results reported [5]. Despite their economic advantages, the performance of CVD diamond tools is sorely outmatched by the PCD counterparts.
The less ideal performance of CVD diamond tools is due to their main failure mode, coating delamination [6]. These failures can be catastrophic and are responsible for limiting the
tool life of CVD diamond tooling [7]. The major cause for delamination (which occurs most often at the tool flank) is high stresses and degraded adhesion during machining. High stresses are induced during the diamond deposition processes of the tool’s manufacture.
During the deposition process, the tool substrate (typically cobalt-cemented tungsten carbide, WC-Co) is heated to a high temperature, 800 to 1000 oC, and after diamond deposition, the coated tool is cooled down to room temperature. Due to the differences in the properties of each material, specifically the thermal expansion coefficient, high stresses are imposed upon each material during cooling. The substrate experiences tensile stresses while the diamond coating, which possesses a smaller thermal expansion coefficient, experiences compressive stresses on the order of giga-pascals.
Moreover, the change of geometry around the cutting tip area will generate stress concentrations and yet additional stress components. Information about the cutting edge geometry of a cutting insert is essential to predict the deposition residual stresses. In order to determine the maximum allowable stress endurable by the machining process, the deposition residual stresses must be taken into account. A larger cutting radius will alleviate the stress concentration and may increase the allowable machining stresses for the tool insert, also dependent upon cutting conditions [8].
Cutting edge radius is known as a significant factor to the chip formation and the thermo-mechanical states of the cutting tool, etc., in machining processes. Accurate measurements of cutting edge radius are desired for tool quality control as well as performance evaluation [9], especially for high precision machining such as diamond turning [10]. This is particularly important to diamond coated tools for the reason discussed above, deposition stresses [11]. Cutting edge geometry measurements have long been practiced and investigated. In general, there are contact and non-contact measurement methods, e.g., stylus profilometry and optical projection, respectively. Advanced techniques such as atomic force microscopy have also been developed to measure ultra-sharp edges (order of 10 nm) [12]. Recently, white-light interferometry (WLI) has been applied to surface/profile
19.2
measurements of small parts, e.g., MEMS devices. The powerful surface-profile data capability makes WLI ideal for tool geometry measurements, though less frequently reported. In addition, data processing methods to quantify the edge profiles deserve a closer look to examine the error and uncertainty associated with such methods.
The objective of this research is to apply WLI to investigate carbide tool edge geometry, of different radius specifications, for diamond coated tool practices. A data processing algorithm was developed to objectively evaluate the edge radius and the wedge angle. Moreover, measurements of both uncoated and coated tools were employed attempting to estimate the coating thickness. The results of this research will enable for CVD diamond tool manufacturers to improve the performance of diamond coating tool inserts and lead to their emergence as the optimal tooling for the machining of advanced materials. MEASUREMENT EXPERIMENTATION Instrumentation and Samples
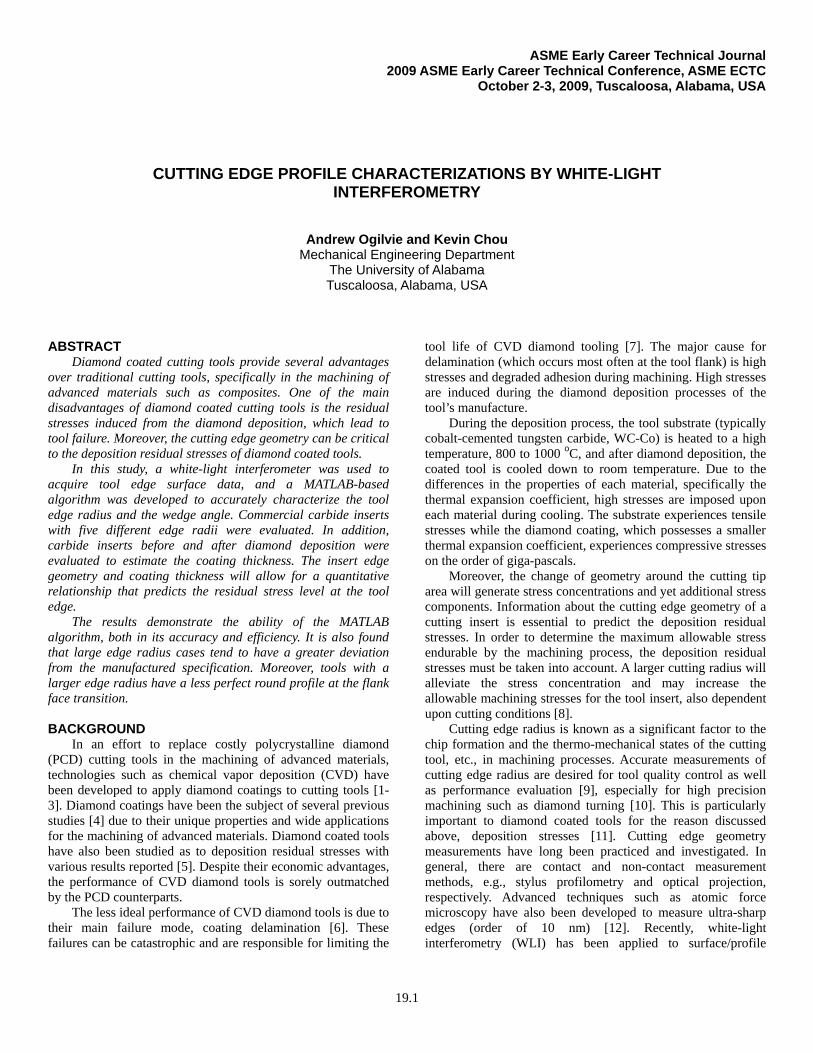
A white light interferometer, NT1100 from Veeco Metrology, was used to collect surface height data around a cutting edge. An objective lens of 50X and a 0.5X field of view lens were used. A low scanning speed and a 0.8% threshold were employed. Commercial WC-Co cutting inserts of square shape were used (SPG422): 12.7 mm width and 3.1 mm thickness. The nominal corner radius was 0.8 mm and the wedge angle was 79o. Five levels of edge radii, nominally 5 µm, 25 µm, 51 µm, 102 µm, and 152 µm were examined. For each level, 10 samples were tested. Both straight cutting edges and the insert corner areas were measured. For straight cutting edges, the single scan mode was used, but the corner area was measured using the stitching function in order to include most corner areas. Figure 1 shows the instrument and measuring setup.
Figure 1. Experimental Setup.
In order to interpret the data from the white light
interferometer, a computer workstation running WYKO Vision software, packaged with the interferometer from the
manufacturer, was used. The Vision software provides over 200 built-in features to quantify and visualize the surface profile data collected by the interferometer [13] for analyses such as roughness. The various displays allow the user to visually confirm that the data captured is representative of the actual tool insert that was measured. Though the software offers profile analysis, it can be complicated by operator’s subjective evaluation. Moreover, accuracy issues inevitably arise for the insert corner area when using Vision analysis. The main features in Vision used in this study were the visualization tools and initial processing. Therefore, more rigorous engineering analysis is required to accurately characterize the tool edge geometry. Once finished with any Vision operations, the raw or processed data can be saved in WYKO’s opd format.
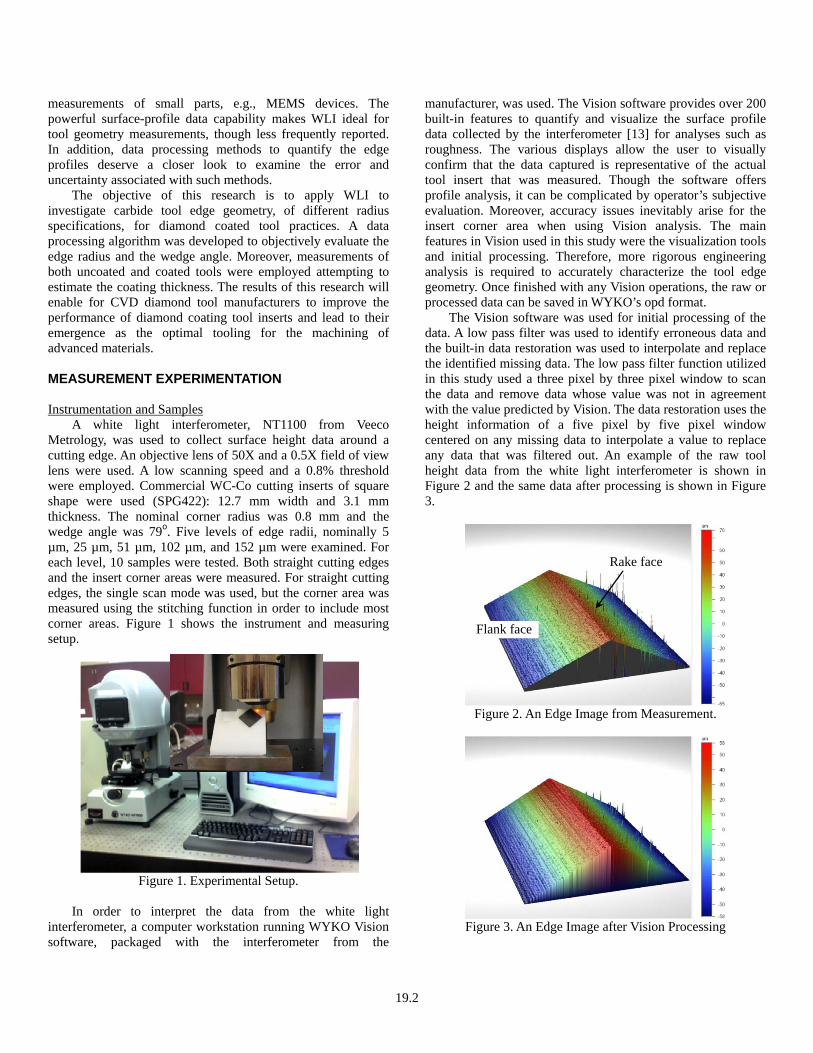
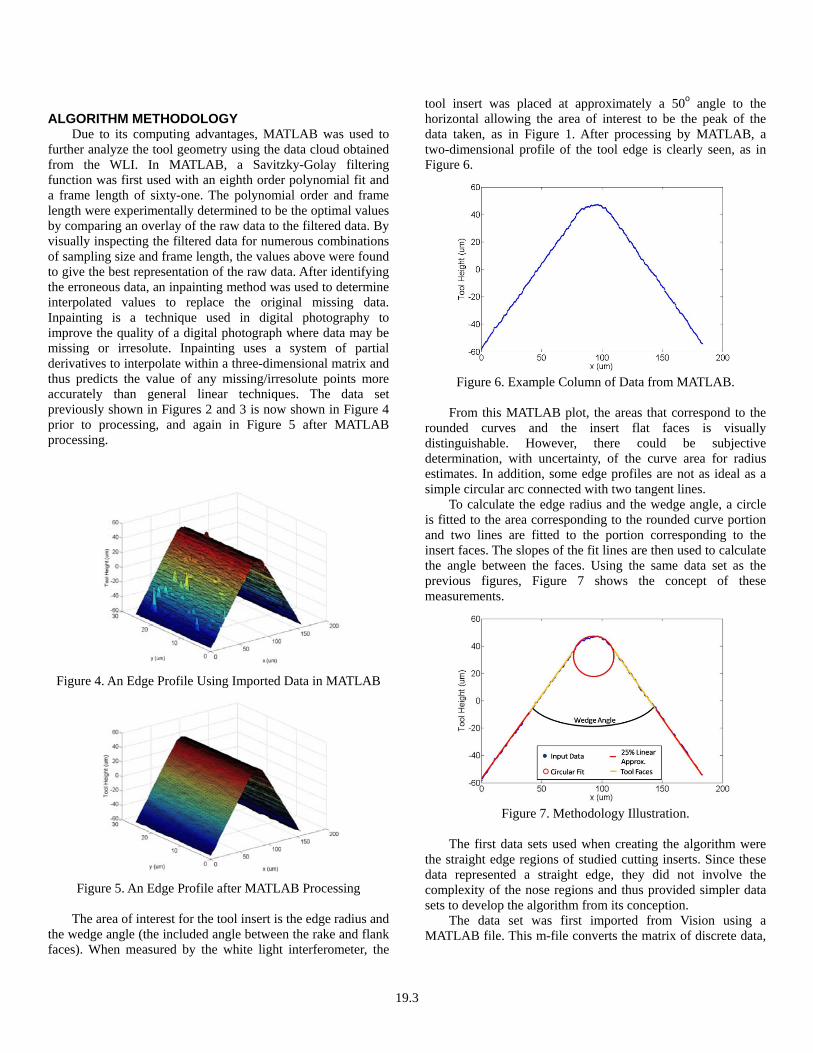
The Vision software was used for initial processing of the data. A low pass filter was used to identify erroneous data and the built-in data restoration was used to interpolate and replace the identified missing data. The low pass filter function utilized in this study used a three pixel by three pixel window to scan the data and remove data whose value was not in agreement with the value predicted by Vision. The data restoration uses the height information of a five pixel by five pixel window centered on any missing data to interpolate a value to replace any data that was filtered out. An example of the raw tool height data from the white light interferometer is shown in Figure 2 and the same data after processing is shown in Figure 3.
Figure 2. An Edge Image from Measurement.
Figure 3. An Edge Image after Vision Processing
Rake face
Flank face
19.3
ALGORITHM METHODOLOGY
Due to its computing advantages, MATLAB was used to further analyze the tool geometry using the data cloud obtained from the WLI. In MATLAB, a Savitzky-Golay filtering function was first used with an eighth order polynomial fit and a frame length of sixty-one. The polynomial order and frame length were experimentally determined to be the optimal values by comparing an overlay of the raw data to the filtered data. By visually inspecting the filtered data for numerous combinations of sampling size and frame length, the values above were found to give the best representation of the raw data. After identifying the erroneous data, an inpainting method was used to determine interpolated values to replace the original missing data. Inpainting is a technique used in digital photography to improve the quality of a digital photograph where data may be missing or irresolute. Inpainting uses a system of partial derivatives to interpolate within a three-dimensional matrix and thus predicts the value of any missing/irresolute points more accurately than general linear techniques. The data set previously shown in Figures 2 and 3 is now shown in Figure 4 prior to processing, and again in Figure 5 after MATLAB processing.
Figure 4. An Edge Profile Using Imported Data in MATLAB
Figure 5. An Edge Profile after MATLAB Processing
The area of interest for the tool insert is the edge radius and
the wedge angle (the included angle between the rake and flank faces). When measured by the white light interferometer, the
tool insert was placed at approximately a 50o angle to the horizontal allowing the area of interest to be the peak of the data taken, as in Figure 1. After processing by MATLAB, a two-dimensional profile of the tool edge is clearly seen, as in Figure 6.
Figure 6. Example Column of Data from MATLAB.
From this MATLAB plot, the areas that correspond to the
rounded curves and the insert flat faces is visually distinguishable. However, there could be subjective determination, with uncertainty, of the curve area for radius estimates. In addition, some edge profiles are not as ideal as a simple circular arc connected with two tangent lines.
To calculate the edge radius and the wedge angle, a circle is fitted to the area corresponding to the rounded curve portion and two lines are fitted to the portion corresponding to the insert faces. The slopes of the fit lines are then used to calculate the angle between the faces. Using the same data set as the previous figures, Figure 7 shows the concept of these measurements.
Figure 7. Methodology Illustration.
The first data sets used when creating the algorithm were
the straight edge regions of studied cutting inserts. Since these data represented a straight edge, they did not involve the complexity of the nose regions and thus provided simpler data sets to develop the algorithm from its conception.
The data set was first imported from Vision using a MATLAB file. This m-file converts the matrix of discrete data,
19.4
of a specified sampling distance (~350 to 400 nm), from the Vision format into a matrix that is used by the algorithm for the duration of that particular data set’s fitting; the imported matrix represents the z axis values of the three-dimensional tool insert. After importing the matrix, corresponding vectors are created for the x and y axes, with the x axis parallel to the insert edge. The previously discussed MATLAB processing is now executed with the imported matrix to smooth the data while preserving the shape of the tool edge.
Once a smoothed matrix is produced, the algorithm runs a loop through the columns of data (in a direction parallel with the insert edge) and determines the slope of the linear regions (that correspond to the tool faces) using a robust linear fitting technique built into MATLAB. For this step, the entire face region is assumed to have the same linear properties of the furthest twenty-five percent of the face region from the insert edge. After numerous trial runs, this criterion was deemed accurate; example results for this process are shown later. The algorithm then determines the very tip of the insert edge by finding the maximum value for the current column and begins iterating outward one x-interval at a time until the slope between two consecutive points is within 99.9% of the slope for the face region on that particular side of the insert edge. When the iteration for the left-hand side ends, the process is repeated for the right-hand side. The locations on the x axis where the iterations end define the curved region of the insert edge. Using this data, a least sum of squared radial deviations method is used to fit the curved edge region with a circle whose radius of is the edge radius of the insert. The slope calculated by the robust fit for the insert faces is used to calculate the angle of the tool edge. These steps are preformed for every column of data in the imported matrix before the loop ends.
After the loop has calculated a radius and angle for every column of data, an average and standard deviation are calculated for the entire matrix. In order to eliminate any outliers, any columns with a radius, x or y-center location outside of three standard deviations from their respective averages are removed from the original matrix and the radius and angle loop is performed again with the modified matrix until no data is removed.
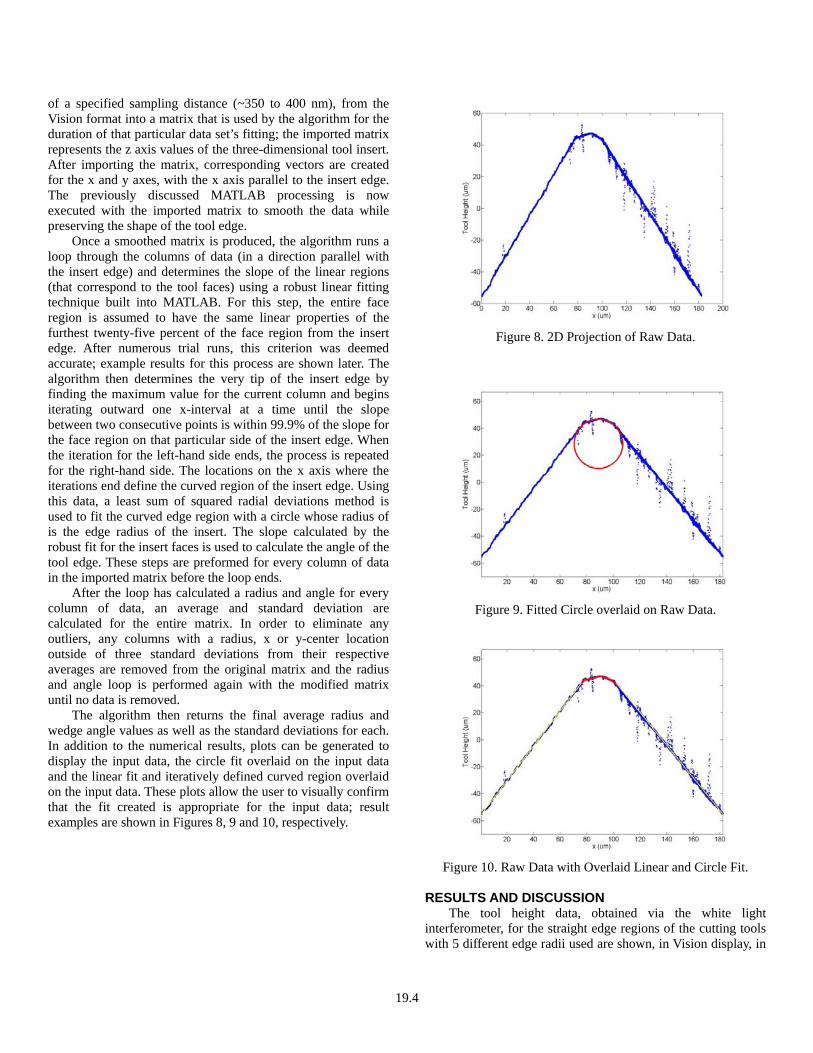
The algorithm then returns the final average radius and wedge angle values as well as the standard deviations for each. In addition to the numerical results, plots can be generated to display the input data, the circle fit overlaid on the input data and the linear fit and iteratively defined curved region overlaid on the input data. These plots allow the user to visually confirm that the fit created is appropriate for the input data; result examples are shown in Figures 8, 9 and 10, respectively.
Figure 8. 2D Projection of Raw Data.
Figure 9. Fitted Circle overlaid on Raw Data.
Figure 10. Raw Data with Overlaid Linear and Circle Fit.
RESULTS AND DISCUSSION
The tool height data, obtained via the white light interferometer, for the straight edge regions of the cutting tools with 5 different edge radii used are shown, in Vision display, in
19.5
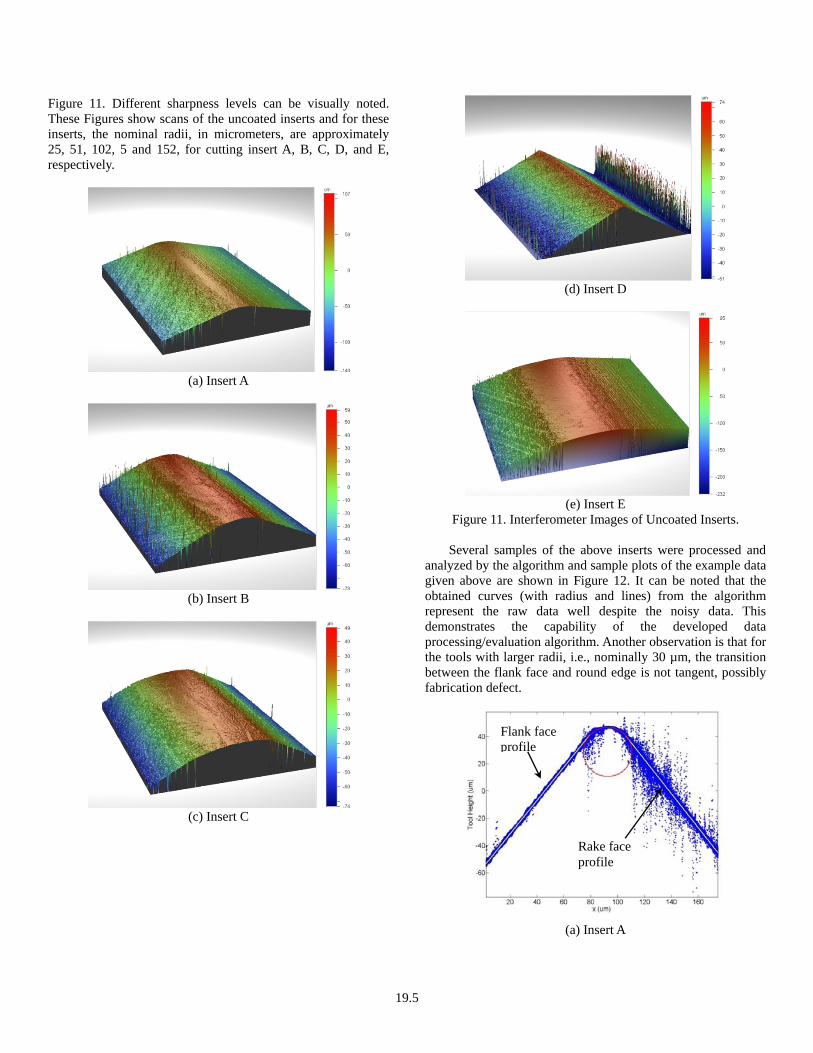
Figure 11. Different sharpness levels can be visually noted. These Figures show scans of the uncoated inserts and for these inserts, the nominal radii, in micrometers, are approximately 25, 51, 102, 5 and 152, for cutting insert A, B, C, D, and E, respectively.
(a) Insert A
(b) Insert B
(c) Insert C
(d) Insert D
(e) Insert E
Figure 11. Interferometer Images of Uncoated Inserts. Several samples of the above inserts were processed and
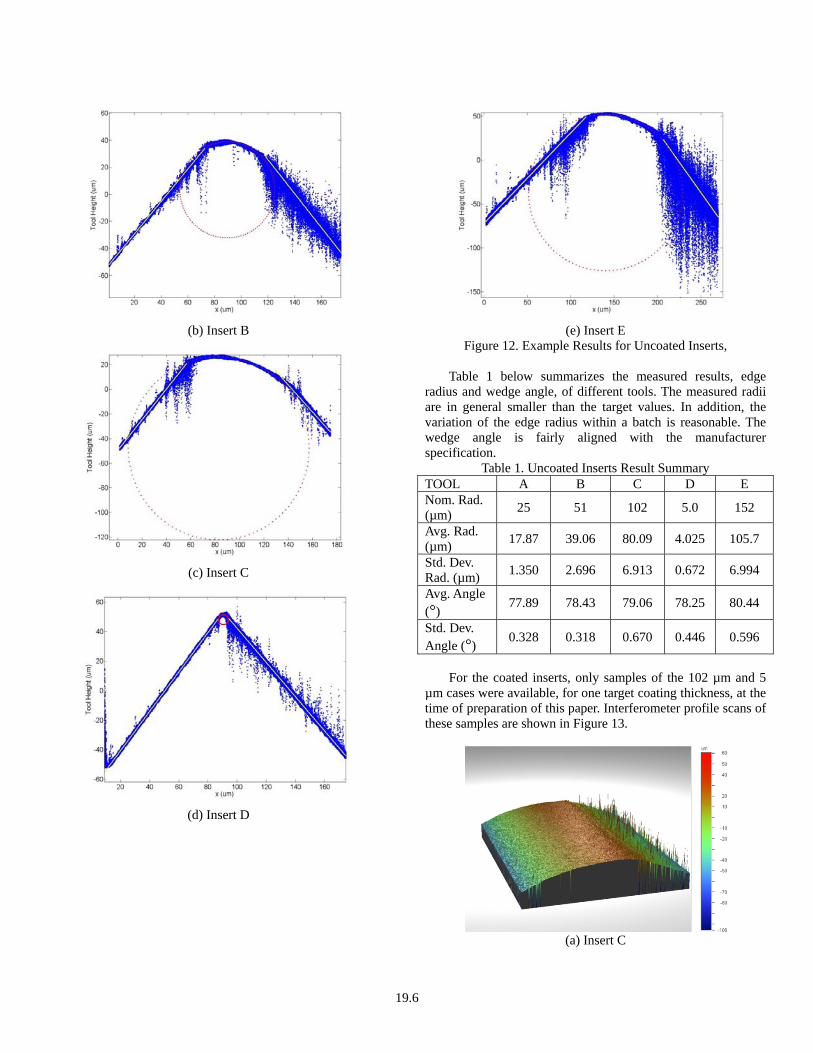
analyzed by the algorithm and sample plots of the example data given above are shown in Figure 12. It can be noted that the obtained curves (with radius and lines) from the algorithm represent the raw data well despite the noisy data. This demonstrates the capability of the developed data processing/evaluation algorithm. Another observation is that for the tools with larger radii, i.e., nominally 30 µm, the transition between the flank face and round edge is not tangent, possibly fabrication defect.
(a) Insert A
Rake face profile
Flank face profile
19.6
(b) Insert B
(c) Insert C
(d) Insert D
(e) Insert E
Figure 12. Example Results for Uncoated Inserts,
Table 1 below summarizes the measured results, edge radius and wedge angle, of different tools. The measured radii are in general smaller than the target values. In addition, the variation of the edge radius within a batch is reasonable. The wedge angle is fairly aligned with the manufacturer specification.
Table 1. Uncoated Inserts Result Summary TOOL A B C D E Nom. Rad. (µm) 25 51 102 5.0 152
Avg. Rad. (µm) 17.87 39.06 80.09 4.025 105.7
Std. Dev. Rad. (µm) 1.350 2.696 6.913 0.672 6.994
Avg. Angle (°) 77.89 78.43 79.06 78.25 80.44
Std. Dev. Angle (°) 0.328 0.318 0.670 0.446 0.596
For the coated inserts, only samples of the 102 µm and 5
µm cases were available, for one target coating thickness, at the time of preparation of this paper. Interferometer profile scans of these samples are shown in Figure 13.
(a) Insert C
19.7
(b) Insert D
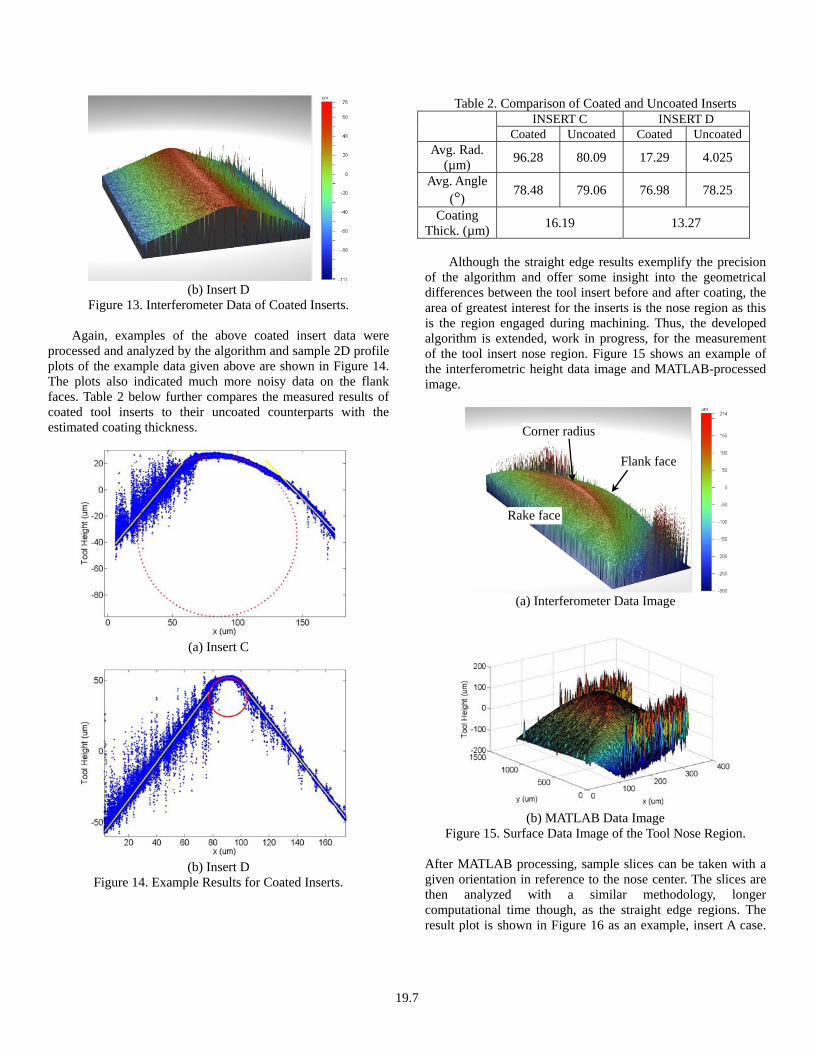
Figure 13. Interferometer Data of Coated Inserts.
Again, examples of the above coated insert data were processed and analyzed by the algorithm and sample 2D profile plots of the example data given above are shown in Figure 14. The plots also indicated much more noisy data on the flank faces. Table 2 below further compares the measured results of coated tool inserts to their uncoated counterparts with the estimated coating thickness.
(a) Insert C
(b) Insert D
Figure 14. Example Results for Coated Inserts.
Table 2. Comparison of Coated and Uncoated Inserts INSERT C INSERT D
Coated Uncoated Coated Uncoated Avg. Rad.
(µm) 96.28 80.09 17.29 4.025
Avg. Angle (°) 78.48 79.06 76.98 78.25
Coating Thick. (µm) 16.19 13.27
Although the straight edge results exemplify the precision
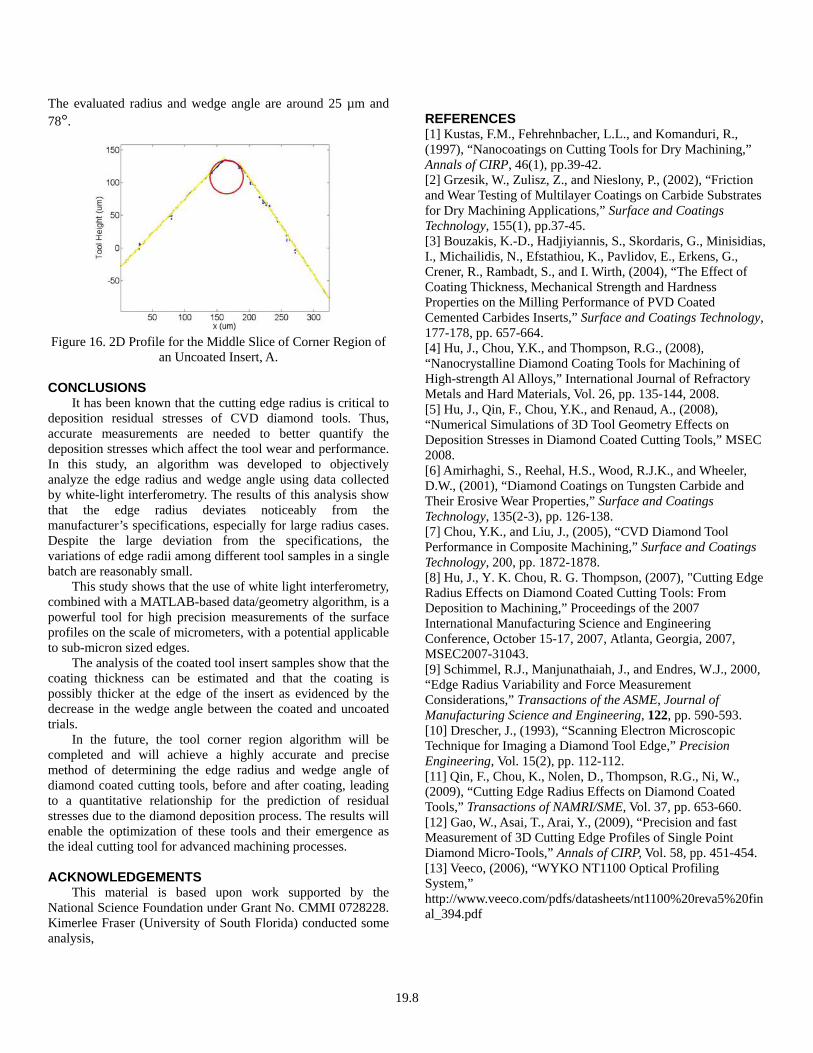
of the algorithm and offer some insight into the geometrical differences between the tool insert before and after coating, the area of greatest interest for the inserts is the nose region as this is the region engaged during machining. Thus, the developed algorithm is extended, work in progress, for the measurement of the tool insert nose region. Figure 15 shows an example of the interferometric height data image and MATLAB-processed image.
(a) Interferometer Data Image
(b) MATLAB Data Image
Figure 15. Surface Data Image of the Tool Nose Region.
After MATLAB processing, sample slices can be taken with a given orientation in reference to the nose center. The slices are then analyzed with a similar methodology, longer computational time though, as the straight edge regions. The result plot is shown in Figure 16 as an example, insert A case.
Rake face
Corner radius
Flank face
19.8
The evaluated radius and wedge angle are around 25 µm and 78°.
Figure 16. 2D Profile for the Middle Slice of Corner Region of
an Uncoated Insert, A.
CONCLUSIONS It has been known that the cutting edge radius is critical to
deposition residual stresses of CVD diamond tools. Thus, accurate measurements are needed to better quantify the deposition stresses which affect the tool wear and performance. In this study, an algorithm was developed to objectively analyze the edge radius and wedge angle using data collected by white-light interferometry. The results of this analysis show that the edge radius deviates noticeably from the manufacturer’s specifications, especially for large radius cases. Despite the large deviation from the specifications, the variations of edge radii among different tool samples in a single batch are reasonably small.
This study shows that the use of white light interferometry, combined with a MATLAB-based data/geometry algorithm, is a powerful tool for high precision measurements of the surface profiles on the scale of micrometers, with a potential applicable to sub-micron sized edges.
The analysis of the coated tool insert samples show that the coating thickness can be estimated and that the coating is possibly thicker at the edge of the insert as evidenced by the decrease in the wedge angle between the coated and uncoated trials.
In the future, the tool corner region algorithm will be completed and will achieve a highly accurate and precise method of determining the edge radius and wedge angle of diamond coated cutting tools, before and after coating, leading to a quantitative relationship for the prediction of residual stresses due to the diamond deposition process. The results will enable the optimization of these tools and their emergence as the ideal cutting tool for advanced machining processes. ACKNOWLEDGEMENTS
This material is based upon work supported by the National Science Foundation under Grant No. CMMI 0728228. Kimerlee Fraser (University of South Florida) conducted some analysis,
REFERENCES [1] Kustas, F.M., Fehrehnbacher, L.L., and Komanduri, R., (1997), “Nanocoatings on Cutting Tools for Dry Machining,” Annals of CIRP, 46(1), pp.39-42. [2] Grzesik, W., Zulisz, Z., and Nieslony, P., (2002), “Friction and Wear Testing of Multilayer Coatings on Carbide Substrates for Dry Machining Applications,” Surface and Coatings Technology, 155(1), pp.37-45. [3] Bouzakis, K.-D., Hadjiyiannis, S., Skordaris, G., Minisidias, I., Michailidis, N., Efstathiou, K., Pavlidov, E., Erkens, G., Crener, R., Rambadt, S., and I. Wirth, (2004), “The Effect of Coating Thickness, Mechanical Strength and Hardness Properties on the Milling Performance of PVD Coated Cemented Carbides Inserts,” Surface and Coatings Technology, 177-178, pp. 657-664. [4] Hu, J., Chou, Y.K., and Thompson, R.G., (2008), “Nanocrystalline Diamond Coating Tools for Machining of High-strength Al Alloys,” International Journal of Refractory Metals and Hard Materials, Vol. 26, pp. 135-144, 2008. [5] Hu, J., Qin, F., Chou, Y.K., and Renaud, A., (2008), “Numerical Simulations of 3D Tool Geometry Effects on Deposition Stresses in Diamond Coated Cutting Tools,” MSEC 2008. [6] Amirhaghi, S., Reehal, H.S., Wood, R.J.K., and Wheeler, D.W., (2001), “Diamond Coatings on Tungsten Carbide and Their Erosive Wear Properties,” Surface and Coatings Technology, 135(2-3), pp. 126-138. [7] Chou, Y.K., and Liu, J., (2005), “CVD Diamond Tool Performance in Composite Machining,” Surface and Coatings Technology, 200, pp. 1872-1878. [8] Hu, J., Y. K. Chou, R. G. Thompson, (2007), "Cutting Edge Radius Effects on Diamond Coated Cutting Tools: From Deposition to Machining,” Proceedings of the 2007 International Manufacturing Science and Engineering Conference, October 15-17, 2007, Atlanta, Georgia, 2007, MSEC2007-31043. [9] Schimmel, R.J., Manjunathaiah, J., and Endres, W.J., 2000, “Edge Radius Variability and Force Measurement Considerations,” Transactions of the ASME, Journal of Manufacturing Science and Engineering, 122, pp. 590-593. [10] Drescher, J., (1993), “Scanning Electron Microscopic Technique for Imaging a Diamond Tool Edge,” Precision Engineering, Vol. 15(2), pp. 112-112. [11] Qin, F., Chou, K., Nolen, D., Thompson, R.G., Ni, W., (2009), “Cutting Edge Radius Effects on Diamond Coated Tools,” Transactions of NAMRI/SME, Vol. 37, pp. 653-660. [12] Gao, W., Asai, T., Arai, Y., (2009), “Precision and fast Measurement of 3D Cutting Edge Profiles of Single Point Diamond Micro-Tools,” Annals of CIRP, Vol. 58, pp. 451-454. [13] Veeco, (2006), “WYKO NT1100 Optical Profiling System,” http://www.veeco.com/pdfs/datasheets/nt1100%20reva5%20final_394.pdf