Embed Size (px)
Citation preview
i
485 Massachusetts Avenue, Suite 2
Cambridge, Massachusetts 02139
617.661.3248 | www.synapse-energy.com
Cutting Electric Bills with
the Clean Power Plan
EPA’s Greenhouse Gas Reduction
Policy Lowers Household Bills:
March 2016 Update
March 17, 2016
AUTHORS
Pat Knight
Avi Allison
Wendy Ong
Nidhi R. Santen, PhD
Elizabeth A. Stanton, PhD

Synapse Energy Economics, Inc. Cutting Electric Bills with the Clean Power Plan i
ACKNOWLEDGMENTS
This report and the research it describes were supported by a grant from the Energy Foundation, whose
mission is to promote the transition to a sustainable energy future.
This document updates the January 14, 2016 release of this report, also titled “Cutting Electric Bills with
the Clean Power Plan.” This update includes revisions to state-specific energy efficiency resource
standards and a revised “Low-EE-CPP” scenario featuring energy efficiency levels in line with the U.S.
Environmental Protection Agency’s expectations of future levels of energy efficiency.

Synapse Energy Economics, Inc. Cutting Electric Bills with the Clean Power Plan ii
EXECUTIVE SUMMARY
In October 2015, the U.S. Environmental Protection Agency finalized its Clean Power Plan requiring
states to begin implementation by developing compliance strategies to reduce carbon pollution from
existing power plants. The deadline for states to submit initial compliance plans was September 2016.
On February 9, 2016, the U.S. Supreme Court issued a stay on EPA’s Clean Power Plan before the D.C.
Circuit Court of Appeals had heard litigation against the rule. This stay removes the requirement to plan
for and comply with the rule while legal challenges work their way through the court system. With this
order, the Supreme Court overruled the D.C. Circuit Court’s decision to deny the request for a stay.
Since the stay was issued a large number of states have announced that they will continue their
planning processes for Clean Power Plan compliance. In addition, on February 16, 2016 governors from
17 states released an Accord for a New Energy Future, which includes the goal of expanding clean
energy generation resources and energy efficiency savings.
Meanwhile, there has been ongoing public, legal, and
legislative debate regarding the economic impacts of
reducing carbon pollution from power plants, particularly
with respect to customer electric bills. Synapse Energy
Economics, Inc. has undertaken an analysis to model how
failing to move forward on Clean Power Plan
implementation will impact household electric bills in the
48 continental U.S. states. Synapse compared costs
associated with state implementation plans that maximize
available energy efficiency strategies (called the “Synapse-
CPP” scenario) to a future in which states are not implementing the Clean Power Plan (“No CPP”). We
found that if states fail to implement the Clean Power Plan, households can expect electric bills that are
on average $17 per month higher in 2030 than they would be with the Clean Power Plan.
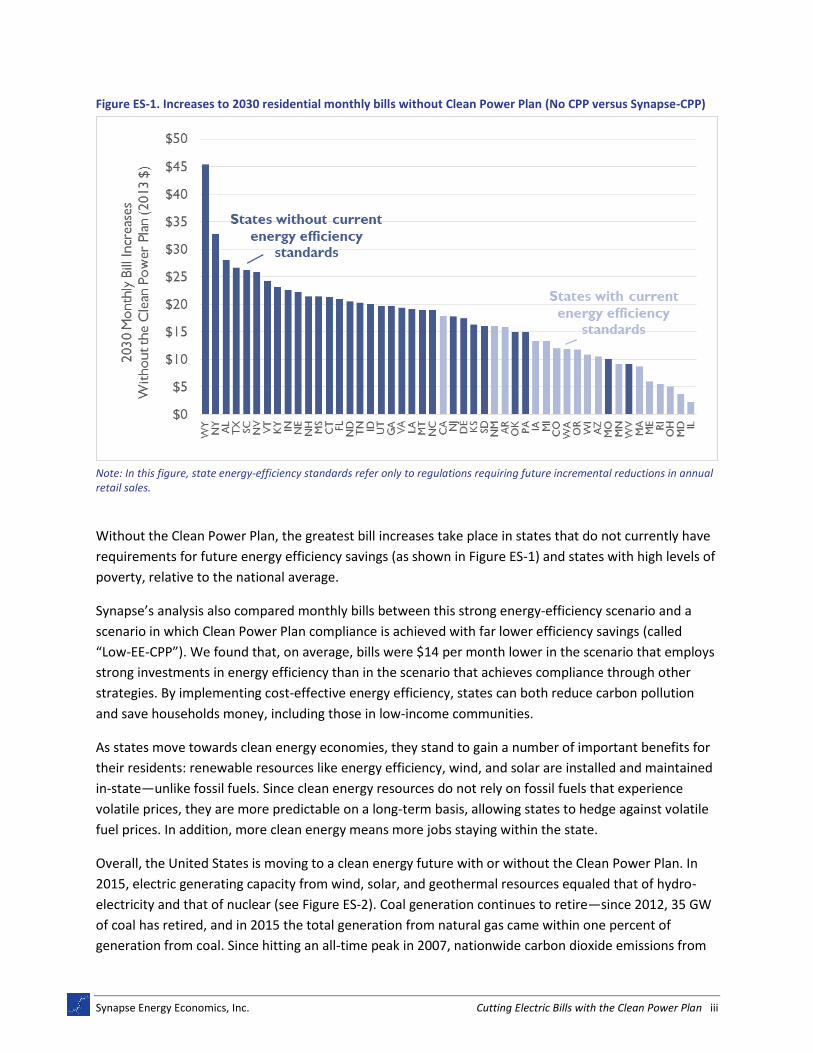
Figure ES-1 illustrates the bill increase that consumers in each state stand to face if the clean energy
investments that represent the most cost-effective path to compliance with the Clean Power Plan do
not come to pass. Increases to household bills without the Clean Power Plan range from a minimum of
$2 per month in Illinois up to a high of $45 per month in Wyoming.
We found that if states fail to implement the Clean Power Plan, households can expect electric bills that are on average $17 per month higher in 2030 than they would be with the Clean Power Plan.
Synapse Energy Economics, Inc. Cutting Electric Bills with the Clean Power Plan iii
Figure ES-1. Increases to 2030 residential monthly bills without Clean Power Plan (No CPP versus Synapse-CPP)
Note: In this figure, state energy-efficiency standards refer only to regulations requiring future incremental reductions in annual retail sales.
Without the Clean Power Plan, the greatest bill increases take place in states that do not currently have
requirements for future energy efficiency savings (as shown in Figure ES-1) and states with high levels of
poverty, relative to the national average.
Synapse’s analysis also compared monthly bills between this strong energy-efficiency scenario and a
scenario in which Clean Power Plan compliance is achieved with far lower efficiency savings (called
“Low-EE-CPP”). We found that, on average, bills were $14 per month lower in the scenario that employs
strong investments in energy efficiency than in the scenario that achieves compliance through other
strategies. By implementing cost-effective energy efficiency, states can both reduce carbon pollution
and save households money, including those in low-income communities.
As states move towards clean energy economies, they stand to gain a number of important benefits for
their residents: renewable resources like energy efficiency, wind, and solar are installed and maintained
in-state—unlike fossil fuels. Since clean energy resources do not rely on fossil fuels that experience
volatile prices, they are more predictable on a long-term basis, allowing states to hedge against volatile
fuel prices. In addition, more clean energy means more jobs staying within the state.
Overall, the United States is moving to a clean energy future with or without the Clean Power Plan. In
2015, electric generating capacity from wind, solar, and geothermal resources equaled that of hydro-
electricity and that of nuclear (see Figure ES-2). Coal generation continues to retire—since 2012, 35 GW
of coal has retired, and in 2015 the total generation from natural gas came within one percent of
generation from coal. Since hitting an all-time peak in 2007, nationwide carbon dioxide emissions from

Synapse Energy Economics, Inc. Cutting Electric Bills with the Clean Power Plan iv
electric generation have fallen to 1995 levels. While the Clean Power Plan will serve as an important
backstop to ensure we do not return to a dirty, high-emitting electricity sector, the transition to a clean
energy future is well underway.
Figure ES-2. Cumulative electric generating capacity in gigawatts

CONTENTS
ACKNOWLEDGMENTS ................................................................................................. I
EXECUTIVE SUMMARY ............................................................................................... II
1. EPA’S EMISSIONS PLAN SAVES MONEY FOR CONSUMERS .......................................... 1
2. THE CLEAN POWER PLAN LOWERS ELECTRIC BILLS .................................................... 2
Strong investments in energy efficiency save ratepayers $17 per month in 2030 ................... 2
Biggest carbon pollution reductions can come with big savings for consumers ...................... 3
Largest bill savings found in states with higher poverty rates .................................................. 5
Largest bill savings found in states with no energy efficiency requirements today ................. 6
Energy efficiency is the cheapest way to reduce carbon pollution ........................................... 7
APPENDIX A: ELECTRIC SECTOR MODEL ....................................................................... 10
Electric Sector ReEDs Model .................................................................................................... 10
Temporal scope ....................................................................................................................... 10
Geographic scope .................................................................................................................... 10
Post-Processing and Bills Analysis ............................................................................................ 11
APPENDIX B: THE “NO CPP” CASE ............................................................................ 13
Sales and Energy Efficiency ...................................................................................................... 13
Renewable Energy .................................................................................................................. 14
Natural Gas Prices ................................................................................................................... 14
Unit Additions, Retirements, and Retrofits .............................................................................. 14
APPENDIX C: CLEAN POWER PLAN COMPLIANT SCENARIOS .............................................. 15

Synapse Energy Economics. Inc. Cutting Electric Bills with the Clean Power Plan 1
1. EPA’S EMISSIONS PLAN SAVES MONEY FOR CONSUMERS
In October 2015, the U.S. Environmental Protection Agency (EPA)
finalized its Clean Power Plan under Section 111(d) of the Clean Air
Act. The Clean Power Plan aims to reduce annual emissions of
carbon dioxide (CO2) from existing fossil fuel‐fired power plants to
approximately 32 percent below 2005 levels by 2030.1 These
emission reductions are part of a greater pattern of an ongoing
transition to a clean energy economy and need not come at an
increased cost to consumers.
Synapse conducted an analysis of the impacts of Clean Power Plan compliance with intensive investment
in clean energy and energy efficiency on electric-sector carbon pollution, costs and benefits to
consumers. Our results are presented in the accompanying policy brief, Stopping the Clean Power Plan
Raises Bills.2 This background report to the brief focuses on state-specific modeling results and
documents the assumptions and methodology of the analysis. For this study, Synapse modeled CO2
emission reductions under three scenarios of the future U.S. electric system:
a business-as-usual “No CPP” case
a “Synapse-CPP” approach to Clean Power Plan compliance that emphasizes cost-effective energy efficiency in addition to new renewables
a “Low-EE-CPP” approach to Clean Power Plan compliance that emphasizes new renewables and expansion of existing natural gas combined-cycle generators
The reference No CPP case is a no-new-policy or business-as-usual scenario in which existing state
renewable portfolio standards and energy efficiency resource standards (defined as regulations
requiring future incremental reductions in annual retail sales) are met but not expanded.3 Growing
electric demand is met largely by expanding current gas-fired generating capacity, and the existing fleets
of coal-fired and nuclear plants are retrofitted to continue operating.
In contrast, both policy cases are designed to meet Clean Power Plan emission reduction targets from
2022 and 2032. While states have many possible avenues to compliance open to them, in these Clean
1 Previous Synapse reports on the implications of the proposed Clean Power Plan and best practices for planning for Consumer
advocates include Knight, P., et al. 2015. Bill Savings in a Clean Energy Future, Part 2, available at: http://synapse-energy.com/sites/default/files/Bill-Savings-Part-Two.pdf; Jackson, S. et al. 2015. Clean Power Plan Handbook. Available at: http://www.synapse-energy.com/sites/default/files/Clean-Power-Plan-Handbook.pdf; and Wilson, R. et al. 2015. Best Practices in Planning for Clean Power Plan Compliance. Available at: http://synapse-energy.com/sites/default/files/NASUCA-Best-Practices-Report-15-025.pdf.
2 The brief can be found at http://www.synapse-energy.com/CPP-Green-Affordable.
3 Standards that are voluntary, apply to past years, or require reductions in peak demand (in MW) are not modeled in the
reference No CPP case.
These emission reductions are part of a greater pattern of an ongoing transition to a clean energy economy and need not come at an increased cost to consumers.

Synapse Energy Economics, Inc. Cutting Electric Bills with the Clean Power Plan 2
Power Plan scenarios, we assume that all states meet the mass-based CO2 emission target covering both
new and existing sources, and that California and states participating in the Regional Greenhouse Gas
Initiative (RGGI)4 meet their own more stringent emission caps. In each Clean Power Plan-compliant
scenario, we assume two groups of states that each trade amongst themselves: RGGI states, and all
other states. In the Low-EE-CPP case, states either meet their existing energy efficiency standards, or
reach 1 percent annual incremental savings by 2025, whichever savings are greater. In the Synapse-CPP
case, states either meet their existing energy efficiency standards, or reach 3 percent annual
incremental savings by 2029, whichever savings are greater. These higher investments in energy
efficiency by 2029 are in the range of current day energy efficiency savings in Arizona, Hawaii,
Massachusetts, Rhode Island, and Vermont.
Investments in energy efficiency and renewables take the place of fossil fuel generation in the compliant
scenarios and, as a result, substantial emissions are avoided, as demonstrated in Synapse’s recent report
on air emissions displacement.5 Synapse’s analysis shows that without the Clean Power Plan the average
household’s monthly electric bill would be $17 higher in 2030 than with the strong energy efficiency
investments in the Synapse-CPP future.
2. THE CLEAN POWER PLAN LOWERS ELECTRIC BILLS
Our analysis found that when states employ the most cost-effective compliance approaches, including
strong investments in energy efficiency, the Clean Power Plan can lead to savings on electric consumers’
bills.
Strong investments in energy efficiency save ratepayers $17 per month in 2030
When states pursue CO2 emission reduction strategies that yield strong energy efficiency savings,
households can expect to see average electric bill savings of $17 per month in 2030 compared to a
future without the Clean Power Plan. Figure 1 shows the difference between 2030 monthly bills for each
state in the Synapse-CPP and No CPP futures. In 2030, average monthly bill savings from the Clean
Power Plan range from a high of $45 per month in Wyoming to a minimum of $2 per month in Illinois.
The difference in bill savings among states depends on many factors, including energy efficiency
investments and the resources used to generate power now and in the future.
4 RGGI states are Connecticut, Delaware, Maine, Maryland, Massachusetts, New Hampshire, New York, Rhode Island, and
Vermont. 5 Biewald, B. et al. 2015. Air Emissions Displacement by Energy Efficiency and Renewable Energy. Available at:
http://www.synapse-energy.com/sites/default/files/Air-Emissions-Displacement-by-Energy-Efficiency-and-Renewable-Energy_0.pdf.

Synapse Energy Economics, Inc. Cutting Electric Bills with the Clean Power Plan 3
Figure 1. 2030 residential monthly bills savings from Clean Power Plan compliance (Synapse-CPP versus No CPP)
Biggest carbon pollution reductions can come with big savings for consumers
Even the states that achieve the largest emission reductions do not have higher bills than they would
without Clean Power Plan compliance. In fact, as shown in Figure 2, many of the states that, under our
strong efficiency Synapse-CPP scenario, achieve the largest emission
reductions in 2030 compared to 2005—such as Alabama, Nevada, and
Wyoming—are among those that save the most on their monthly
electric bills, highlighting the potential to achieve substantial emissions
while saving consumers money. Altogether, six of the seven states
with the highest bill reductions between the No CPP and Synapse-CPP
futures cut their emissions by more than 45 percent between 2005
and 2030.
Many of the states that achieve the largest emission reductions in 2030 are among those that save the most on their monthly electric bill.

Synapse Energy Economics, Inc. Cutting Electric Bills with the Clean Power Plan 4
Figure 2. Relationship between monthly bill savings in the Synapse-CPP and No CPP cases versus CO2 percentage emissions reduction from 2005 to 2030 in the Synapse-CPP case
Note: This figure compares actual historical 2005 emissions with projected 2030 emissions in the Synapse-CPP scenario, in which some
states achieve plan compliance by trading emission allowances with other states. Five states are not shown on this figure because their
2030 emissions are lower than their peak levels but higher than 2005 levels. In California, for example, emissions peaked in 2001 and
are expected to fall by 32 percent by 2030 in our Synapse-CPP case. These five states (California, Idaho, Mississippi, Utah, West Virginia)
have monthly bill savings of between $9 and $21.
The lack of a direct correlation between emission reductions and bill impacts is caused in part by CO2
emission allowance trading. States can choose to either reduce electric emissions within their own
boundaries or purchase emission reduction allowances from out of state—whichever is cheapest. In our
Synapse-CPP scenario, 21 states find it most cost-effective to take advantage of low-cost emission
reduction opportunities in other states in order to achieve compliance (see Figure 3). This allowance
trading is balanced by “over-compliance” in the other 27 states. Market-based coordination of
compliance across the country allows states to take a least-cost approach to reducing emissions.

Synapse Energy Economics, Inc. Cutting Electric Bills with the Clean Power Plan 5
Figure 3. CO2 emissions (Clean Power Plan target and Synapse-CPP result) in 2030 compared to 2005
Note: Five states (California, Idaho, Mississippi, Utah, and West Virginia) see emissions increase between 2005 and 2030 in the Synapse-
CPP scenario. The total emission increases for these five states combined is 6 million metric tons, or less than one-half of one percent of
total U.S. emissions in 2030.
While our modeling does not require states to reduce total in-state CO2 emissions or emissions from
particular plants, states can do so as part of their compliance plan. Indeed, states must include the
interests of environmental justice communities in their planning process.6
Largest bill savings found in states with higher poverty rates
Many of the states with the largest bill savings in this study also have higher-than-average rates of
poverty.7 Of the eight states with the highest monthly bill savings between the Synapse-CPP and No CPP
futures, five have poverty rates in excess of the national rate. These five include Alabama and Kentucky,
two of the five states with the highest poverty rates in the nation (see Figure 4).
6 Horowitz, A., S. Jackson, A. Allison, E. A. Stanton. 2015. Environmental Justice and the Clean Power Plan. Synapse Energy
Economics for the Energy Foundation. 7 The poverty rates referred to in this study represent the percentage of a state’s residents living below the federal poverty
level. The 2014 American Community Survey estimated that, nationwide, 15.5 percent of Americans were living below the federal poverty level.
Synapse Energy Economics, Inc. Cutting Electric Bills with the Clean Power Plan 6
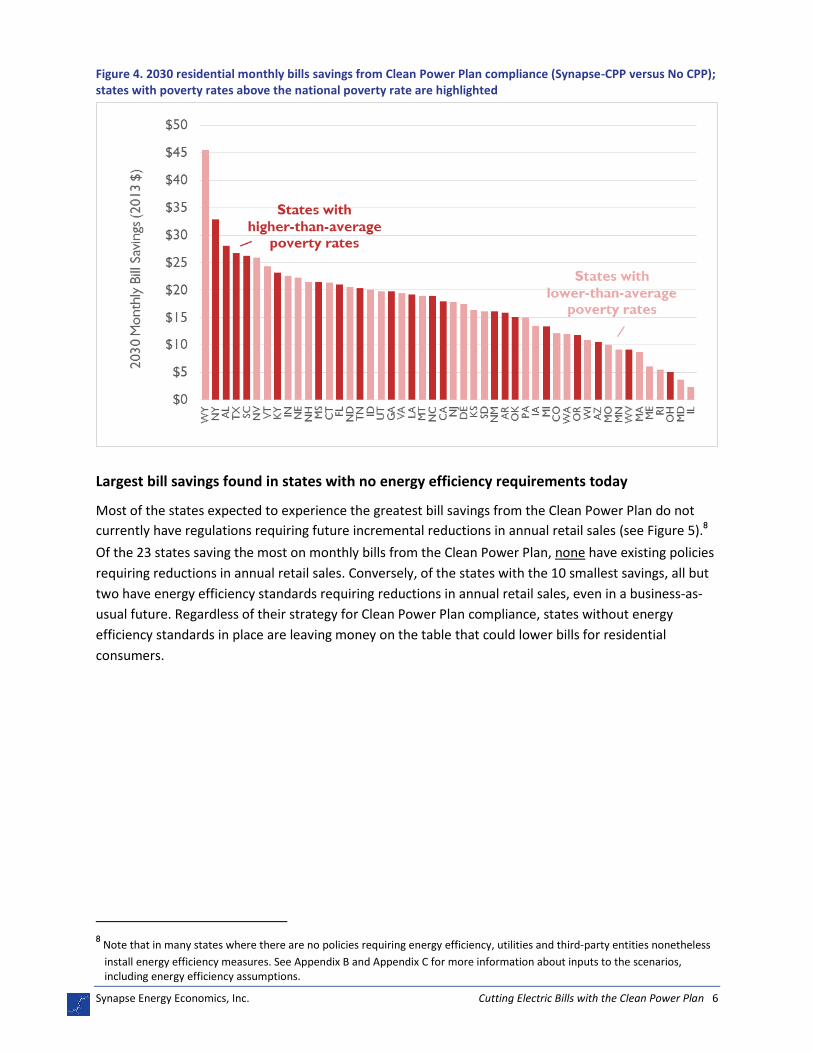
Figure 4. 2030 residential monthly bills savings from Clean Power Plan compliance (Synapse-CPP versus No CPP); states with poverty rates above the national poverty rate are highlighted
Largest bill savings found in states with no energy efficiency requirements today
Most of the states expected to experience the greatest bill savings from the Clean Power Plan do not
currently have regulations requiring future incremental reductions in annual retail sales (see Figure 5).8
Of the 23 states saving the most on monthly bills from the Clean Power Plan, none have existing policies
requiring reductions in annual retail sales. Conversely, of the states with the 10 smallest savings, all but
two have energy efficiency standards requiring reductions in annual retail sales, even in a business-as-
usual future. Regardless of their strategy for Clean Power Plan compliance, states without energy
efficiency standards in place are leaving money on the table that could lower bills for residential
consumers.
8 Note that in many states where there are no policies requiring energy efficiency, utilities and third-party entities nonetheless
install energy efficiency measures. See Appendix B and Appendix C for more information about inputs to the scenarios, including energy efficiency assumptions.

Synapse Energy Economics, Inc. Cutting Electric Bills with the Clean Power Plan 7
Figure 5. 2030 residential monthly bills savings from Clean Power Plan compliance (Synapse-CPP versus No CPP); states with energy efficiency standards currently in place highlighted
Energy efficiency is the cheapest way to reduce carbon pollution
Synapse tested the impact of energy efficiency on the cost of Clean Power Plan compliance by modeling
a Low-EE-CPP case that achieves compliance with the rule using less energy efficiency than the Synapse-
CPP case, but more renewables and natural gas. As shown in Figure 6, the Low-EE-CPP case relies more
heavily on natural gas combined-cycle generation and renewables to achieve the same level of emission
reductions.
Figure 6. Generation mix in the Synapse-CPP and Low-EE-CPP cases

Synapse Energy Economics, Inc. Cutting Electric Bills with the Clean Power Plan 8
Note that in Figure 6, total “reconstituted” electricity services (inclusive of energy efficiency) are slightly
lower in the Synapse-CPP case compared to the Low-EE-CPP case. This is a result of more demand-side
energy efficiency reducing the need for supply-side generation, which, when transmitted to retail
customers undergoes line losses.9 Because energy efficiency avoids these losses, less overall electricity is
needed to meet the same demand requirements.
Because energy efficiency is the lowest-cost electric resource, total system costs are 10 percent higher
in the Low-EE-CPP case than in the higher-efficiency Synapse-CPP case. As a result, average household
electric bills are $14 higher each month than they would be if emission reductions were achieved with
more energy efficiency. Average savings from strong energy efficiency investments by state range from
$24 to $3 per month (see Figure 7).
Figure 7. 2030 residential monthly bills savings from strong energy efficiency investment (Synapse-CPP versus Low-EE-CPP)
States that experience the largest bill savings from high levels of energy efficiency tend to be states with
higher-than-average poverty rates (Figure 8) and states currently lacking an energy efficiency
requirement (Figure 9).
9 Our analysis assumes line losses of about 8 percent.

Synapse Energy Economics, Inc. Cutting Electric Bills with the Clean Power Plan 9
Figure 8. 2030 residential monthly bills savings from strong energy efficiency investment (Synapse-CPP versus Low-EE-CPP); states with poverty rates above the national poverty rate are highlighted
Figure 9. 2030 residential monthly bills savings from strong energy efficiency investment (Synapse-CPP versus Low-EE-CPP); states with energy efficiency standards currently in place highlighted

Synapse Energy Economics, Inc. Cutting Electric Bills with the Clean Power Plan 10
APPENDIX A: ELECTRIC SECTOR MODEL
For all three scenarios, we modeled capacity, generation, emissions, and costs for the electric sector in
Synapse’s adapted version of the National Renewable Energy Laboratory’s (NREL) Regional Energy
Deployment System (ReEDS) model. We then imported the data into Synapse’s Excel-based post-
processing tool.10
Electric Sector ReEDs Model
ReEDS is a long‐term capacity expansion and dispatch model of the electric power system in the lower
48 states. Synapse’s in-house version of the ReEDS model has been adapted to allow for more detailed
outputs by state and sector, and to permit differentiation of energy efficiency expectations by state.
ReEDS assumes the dispatch of electric generating resources on an economic basis and—like most
economic dispatch models—makes no distinction in its methods for modeling regulated and
restructured states.
We modeled compliance with the Clean Power Plan as achieving the state-level mass-based targets that
include estimated emissions from new sources (the “new source complement”) on a biennial basis.11 We
assume that emission allowances are traded both within and across state borders among states in two
separate groups: the nine states that are members of RGGI, and all other states modeled. The
distribution of allowances and allowance revenues within each state is not modeled. The price of
allowances is set endogenously within the model as a shadow price and range from $2 per metric ton to
$20 per metric ton, depending on the year and scenario in question. For the RGGI states, Clean Power
Plan emission caps are replaced with more stringent (lower) RGGI caps in both compliance scenarios.
California complies with AB 32 emission reduction targets in all modeled years.
Temporal scope
The time period of this analysis is the years 2015-2032. ReEDS modeling is performed at two-year
intervals starting in 2014.
Geographic scope
In the ReEDS model, all states in the continental United States are represented. ReEDS divides the
United States into 134 power control areas (PCAs) that are consistent with state boundaries and can be
aggregated to model state impacts. Each PCA is modeled as having a single aggregated “unit” of each
resource type, the size of which is equal to the sum of the capacities of the actual units in that territory.
For this analysis, Synapse modeled the country as a whole to capture interactions between states.
10
This analysis uses the version ReEDS_v2015.2(r28). More information on ReEDS is available at:
http://www.nrel.gov/analysis/reeds. 11
States may choose a variety of approaches to Clean Power Plan compliance. In all mass-based approaches, states must
demonstrate that generation from existing units does not “leak” to new units. One option states can use to address this requirement by implementing the “new source complement” approach: that is, including new units under their mass-based cap.

Synapse Energy Economics, Inc. Cutting Electric Bills with the Clean Power Plan 11
Post-Processing and Bills Analysis
After completing the ReEDS analysis, we used Synapse’s in-house ReEDS Postliminary Reporting Tool
(RePRT) to analyze the compliance of states with both the Clean Power Plan and RGGI caps. We also
used this tool to examine generation, capacity, sales, and system costs for each state in each scenario.
Finally, ReEDS allows us to estimate the state-by-state bill impacts of both the reference case and the
two policy cases. To do this, we relied on the following components, modeled in ReEDS at the PCA level:
Generation and transmission costs: Derived from ReEDS and reported by PCA, these are the system costs associated with capital expenditures, fuel, operations and maintenance, and transmission for all resource types except energy efficiency. We reallocated these costs across all the PCAs in a single North American Electric Reliability Corporation (NERC) region in proportion to annual sales data to approximate the distribution of these costs across ratepayers.
Import/export costs and revenues: Each PCA’s net export or net import of electricity is estimated based on its generation and electric demand. These net imports (or exports) are multiplied by regional energy and capacity prices to estimate the cost of (or revenue from) supplying this additional electricity need. As with generation and transmission costs, we then reallocated the import/export costs and revenues across all the PCAS in a single NERC region to approximate their distribution across ratepayers.
Next, PCA-specific costs are aggregated by state and combined with the following cost components:
Environmental retrofit costs: Estimated using the Synapse Coal Asset Valuation Tool (CAVT)12 model, these include the costs to comply with environmental regulations addressing SO2, NOX, mercury, and particulate emissions, as well as cooling water, effluent, and coal ash control standards.
Pipeline costs: Demand for natural gas in 2032 is compared against natural gas demand in 2014. For each PCA, we estimate new natural gas pipeline costs on the order of $39 billion per quadrillion Btu.13
Energy efficiency program costs: Program administrator costs, also known as utility costs, are calculated at the state level for each case.
Clean Power Plan compliance allowance costs and revenues: Depending on the year, some states require trading in order to comply with the Clean Power Plan’s mass-based targets (that is, targets based on tons of CO2 emissions); they emit more CO2 than the EPA-specified cap allows.14 As a result, some states pay to purchase allowances, while
12
Environmental retrofits assumed in this analysis include selective catalytic reduction, baghouses, activated carbon injection
systems, closed cooling systems, and coal ash and effluent controls. For more information, see also: Knight, P. and J. Daniel. 2015. Forecasting Coal Unit Competitiveness – 2015 Update. Synapse Energy Economics. Available at: http://www.synapse-energy.com/sites/default/files/Forecasting-Coal-Unit-Competitiveness-14-021.pdf. CAVT is available at http://synapse-energy.com/tools/coal-asset-valuation-tool-cavt.
13 ICF International. March 2014. "North American Midstream Infrastructure through 2035: Capitalizing on Our Energy
Abundance.” Available at: http://www.ingaa.org/file.aspx?id=21498. 14
For a detailed discussion of trading in the Clean Power Plan, see recent Synapse blog posts at http://synapse-
energy.com/about-us/blog/tricks-trade-who-can-sell-emissions-credits-whom-clean-power-plan-part-1-2 and http://synapse-energy.com/about-us/blog/tricks-trade-who-can-sell-emissions-credits-whom-clean-power-plan-part-2-2.

Synapse Energy Economics, Inc. Cutting Electric Bills with the Clean Power Plan 12
other states receive revenue for their sale of these allowances. Because both policy cases model exact compliance with the Clean Power Plan in any given year, there are an equal number of allowances being sold as are being bought. In each year, we assume the price the allowances are traded at is equal to the shadow price of CO2 as calculated by ReEDS. Note that because we treat RGGI and the rest of the United States as two separate trading regions, for each combination of policy case and year there are two separate prices: one applied to the RGGI states and the other applied to the rest of the country. In the No CPP case, only RGGI states are assumed to comply with CO2 caps.
State-specific costs were then divided by the kilowatt-hour sales in a given year and scenario to derive
the cost of supply. Costs of supply in a given year are added to a fixed, per-consumer bill component to
estimate each state’s residential electric rate.15 Electric rates were then multiplied by forecasted
monthly residential usage in each year to estimate monthly bills. In each case, it is assumed that all
residential customers are energy efficiency program participants. While it is true that the customers that
experience the highest level of energy efficiency savings opt in to utility energy efficiency programs,
since energy efficiency is also achieved through mandated lighting standards, building codes, and
appliance standards, many consumers also benefit from energy efficiency whether they are aware of it
or not. In the Synapse-CPP case, cumulative savings reach 21 percent of sales by 2030.16
15
The fixed, per-consumer component is typically made up of historical capital costs that have already been incorporated into
electricity rates. It is certainly possible that this component will decrease in the future as the plants in this fixed component are depreciated, or if, as older plants retire, ratepayers are no longer obligated to pay some portion of investments that are no longer used and useful. In this analysis, however, we assume that this bill component remains constant throughout the modeled period. The fixed, per-consumer component is calculated by subtracting the cost of supply rate calculated for 2012 from the statewide residential electric rate reported in the EIA Form 861 for 2012. Actual electric rates can vary widely by utility, even within a single state.
16 This is consistent with the cumulative savings level achieved by “strong” participants in Massachusetts energy efficiency
programs in 2013 through 2015. See Massachusetts Program Administrators, “2013-2015 Massachusetts Joint Statewide Three-Year Electric and Gas Energy Efficiency Plan.” November 2, 2012, see e.g., D.P.U. 12-107, Cape Light Compact, Exhibit 1.

Synapse Energy Economics, Inc. Cutting Electric Bills with the Clean Power Plan 13
APPENDIX B: THE “NO CPP” CASE
The “No CPP” case is a reference (or business-as-usual) case in which states comply with their
Renewable Portfolio Standard and Energy Efficiency Resource Standard requirements, and states with
emission caps not related to the Clean Power Plan (RGGI states and California) meet their required
targets. Note that states’ RGGI emission caps are more stringent (lower) than their Clean Power Plan
mass-based targets. For this reason, only the RGGI caps (and not the Clean Power Plan targets) apply to
RGGI states. In the No CPP case, no additional actions are taken to achieve Clean Power Plan
compliance. Figure 10 presents historical emissions and emissions under the No CPP case, and compares
these to Clean Power Plan mass-based targets with the new source complement and RGGI emission
caps.
Figure 10. Historical emissions, emissions under the No CPP case, and Clean Power Plan mass-based targets with new-source complement and RGGI caps
Note: Both the Clean Power Plan targets and the RGGI emission budget are set in short tons of CO2. Throughout this report we present all emissions in metric tons.
Sales and Energy Efficiency
Annual retail electric sales by state are projected by applying regional growth rates from the Energy
Information Administration’s Annual Energy Outlook (AEO) 2015 Reference case. From this we “back
out” the AEO representation of ongoing savings—estimated at 0.29 percent of 2012 sales—from new
energy efficiency measures and replace it with more detailed forecasts of expected reductions to annual
sales.17 In this scenario, we assume that the 17 states with “on-the-books” energy efficiency policies
17
White, David, et al. 2013 Update. State Energy Efficiency Embedded in Annual Energy Outlook Forecasts. Available at:
http://synapse-energy.com/sites/default/files/SynapseReport.2013-11.0.EE-in-AEO-2013.12-094-Update_0.pdf.
Synapse Energy Economics, Inc. Cutting Electric Bills with the Clean Power Plan 14
continue them through the study period. All other states do not achieve any incremental energy
efficiency savings after 2014.
Renewable Energy
Twenty-six states have renewable portfolio standards that require utilities to procure a percentage of
their retail electricity sales in qualified forms of renewable generation.18 We assume that these targets
are met through the study period. The share of renewables required and types of resources acceptable
for classification as renewable vary from state to state. Note that renewable cost estimates in this
analysis include the extension of the wind production tax credit (PTC) and solar investment tax credit
(ITC) as updated through 2016.
Natural Gas Prices
Projected natural gas prices were derived from the AEO 2015 Reference case. Note that ReEDS uses
natural gas prices based on an endogenous supply-curve formulation, in which cost is a function of the
quantity demanded, with underlying supply curves calibrated to AEO Reference case forecasts.
Unit Additions, Retirements, and Retrofits
In the No CPP case, generating units currently known to be under construction were added to ReEDS
based on whether those units appeared in the 2014 edition of the EIA 860 database of generators. All
nuclear units are assumed to operate for 60-year lifetimes. All other unit additions are dynamic, based
on supply curves of resource costs inherent to ReEDS.
In addition, the reference case features known unit retirements. Retirement data are based on the 2014
edition of EIA’s Form 860, supplemented by ongoing Synapse research on announced retirements. The
reference case also features costs of control technologies projected to be required at coal generators
that continue to operate through the study period. The costs of control technologies that will be
installed at coal plants under existing federal environmental regulations other than the Clean Power
Plan were estimated using Synapse’s CAVT model. These expected retrofits are limited to the years in
which specific units have not yet been retired.
18 In this analysis, we model states in the contiguous United States to have renewable portfolio standards only if current legislation exists requiring utilities to meet a certain portion of future electric sales through the purchase of renewable generation. States with voluntary renewable requirements were not assumed to build incremental renewable capacity unless it was economic for them to do so.

Synapse Energy Economics, Inc. Cutting Electric Bills with the Clean Power Plan 15
APPENDIX C: CLEAN POWER PLAN COMPLIANT SCENARIOS
In addition to using ReEDS to model a No CPP case, Synapse also modeled two “policy” cases, analyzing
two different approaches to Clean Power Plan compliance. The first policy case, the “Synapse-CPP” case,
analyzes a future in which strong energy efficiency is relied upon to meet Clean Power Plan compliance.
This scenario assumes that all states begin to ramp up to the level of energy efficiency savings currently
being attained in Massachusetts, with all states achieving annual incremental savings of 3 percent per
year by 2029.
Massachusetts utilities have attained incremental first-year savings levels above 2.5 percent for 2013
through 2015, and have filed plans to achieve levels at or near 3 percent for 2016 through 2018.19
Several other states are currently achieving annual incremental energy efficiency savings levels above
1.5 percent, including Arizona, Hawaii, Rhode Island, and Vermont. Furthermore, while this analysis does
assume that energy efficiency savings occur in the residential, commercial, and industrial sectors, the
savings modeled in this report are not necessarily limited to coming from utility energy efficiency
programs. Savings could come from other sources, such as state- or federal-level building codes or
appliance standards, third-party vendors, or other sources.
The second policy case, the “Low-EE-CPP” case, examines a future in which energy efficiency reaches 1
percent per year in states that lack more stringent energy efficiency resource standards. States instead
use other strategies, including renewables and redispatch from coal to natural gas combined-cycle
generators, to meet emission reduction requirements.
Under both policy cases, we modeled nationwide compliance with the mass-based Clean Power Plan
target, including new source complements. As in the No CPP case, in both policy cases the RGGI states
and California were modeled as complying with their more stringent emission caps. To avoid emission
leakage out of the RGGI region, we restricted RGGI states to only trading allowances among themselves
while all other states may trade throughout the non-RGGI region.20
19
More information on historic and planned energy efficiency in Massachusetts can be found at http://ma-eeac.org/plans-
updates/ 20
The RGGI states have not yet announced whether or not they will use RGGI has a vehicle for Clean Power Plan compliance,
nor have they stated that they will disallow trading with states outside of RGGI. In this analysis, we assume RGGI policymakers act to maintain the stringency of the already-agreed-upon RGGI emissions caps. Note that ReEDS models the complex, multi-sector, California-specific emissions cap in a separate module; we have not revised NREL’s modeling of California, which includes units within the state having the ability to trade allowances across state lines.