Embed Size (px)
Citation preview

CV-1
EverolimusIntravascular Ultrasound (IVUS)
Results of Study B253 in De Novo Heart Transplantation
Jon A. Kobashigawa, MD
Clinical Professor of Medicine/CardiologyChief, Division of Clinical Faculty Medicine
The David Geffen School of Medicine at UCLA
Medical Director, UCLA Heart Transplant Program
QC

CV-2
Outline of the IVUS Presentation
IVUS background IVUS B253 study
– Primary analysis results
– Bias assessments
– Sensitivity analysis Summary
QC
3.1 mm3.1 mm
3.1 mm3.1 mm
Angiography vs Intravascular UltrasoundAngiography vs Intravascular UltrasoundQC

CV-4
Intimal Area
Intimal Area
Media-adventitialarea
Media-adventitialarea
Media-adventitia (MA)
Cross sectional area (mm2)
Maximal diameter (mm)
Minimal diameter (mm)
Minimal intimal
thickness
Minimal intimal
thickness
Maximalintimal
thickness (MIT)
Maximalintimal
thickness (MIT)
Intimal thickness
Maximal intimal thickness (mm)
Intimal area (mm2)
Minimal intimal thickness (mm)
Lumen areaLumen areaLumen
Cross sectional area (mm2)
Maximal diameter (mm)
Minimal diameter (mm)
Courtesy of R. Starling, Cleveland Clinic.
Intravascular Ultrasound Measurements
QC

CV-5
Segment and Image Selection
18181717
1414
1212
1010
88
66
44
22
16161515
1313
1111
99
77
55
33
11
18 mm18 images
Segments were identified: Automatic pullback (0.5 mm/sec), side branches.Frames at 1-mm intervals for measurements, minimum of 11 matched images.
102-25
QC
CV-6
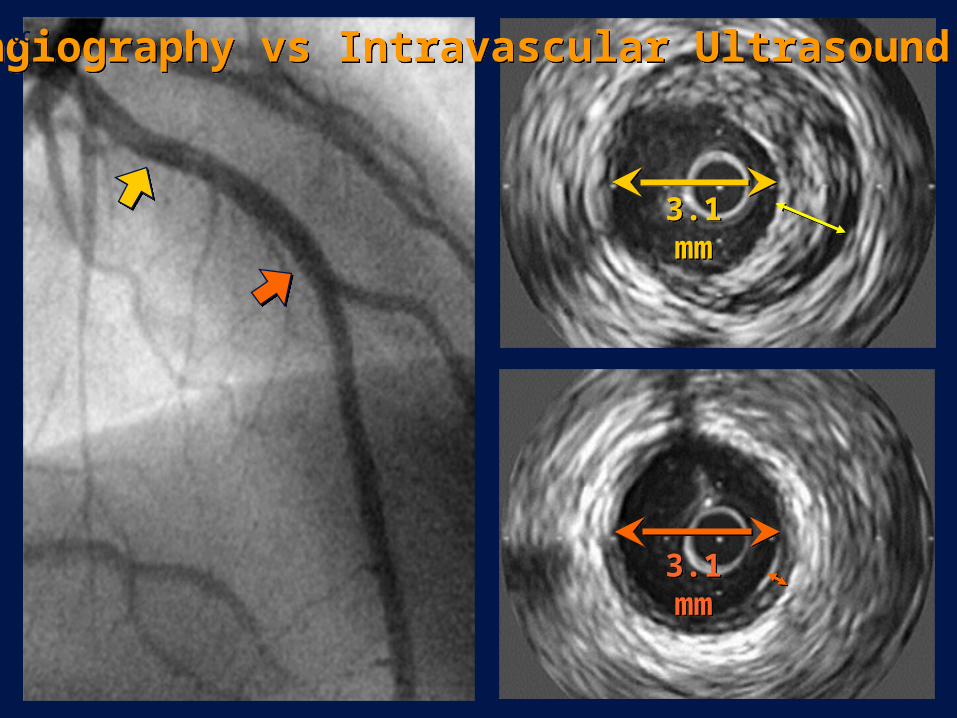
MIT = 0 MIT > 0.5 mm
Baseline (4 to 6 weeks) Year 1
Site-to-Site IVUS Analysis
QC

CV-7Measurement of Maximal Intimal Thickness (MIT) for Transplant Vasculopathy and Outcome
MIT accepted as standard method for CAV measurementa
Change in MIT ≥ 0.5 mm associated withb-d
– Increased major adverse cardiovascular events (MACE: AMI, CHF, PCI, CABG, ICD, SD, CVA, PVD)
– Reduced cardiac and overall survivale
– Represents an important intermediate outcome
a Mintz GS, et al. J Am Coll Cardiol. 2001;37:1478-1492.b Mehra MR, et al. J Heart Lung Transplant. 1995;4:632-639.c Kapadia SR, et al. Curr Opin Cardiol. 1999; 14:140-150.d Kobashigawa, et al. J Am Coll Cardiol. 2005;45:1532-1537.e Tuzcu EM, et al. J Am Coll Cardiol. 2005;45:1538-1542.
112-10
QC
CV-8
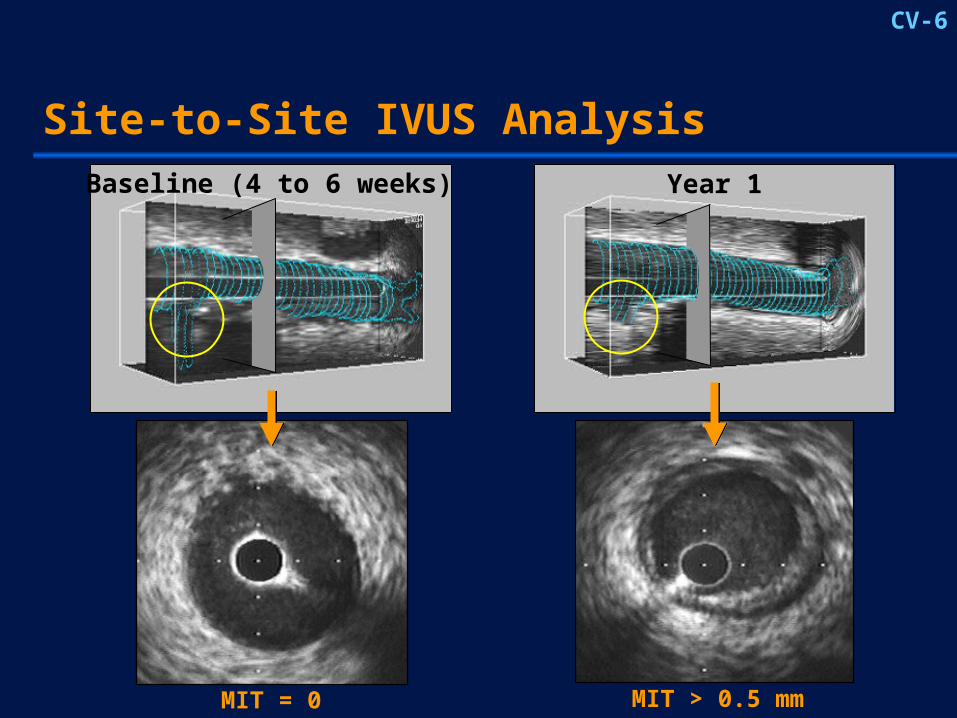
Kobashigawa J, et al. J Am Coll Cardiol. 2005;45:1532-1537.
Multicenter IVUS Validation Study in Heart Transplantation (CAV: Change in MIT ≥ 0.5 mm)
Without CAV at 1 year (n = 101)With CAV at 1 year (n = 24)
Death
Time to event (months)
0 12 24 36 48 60
Fre
edo
m f
rom
eve
nt
(%)
P = 0.025
0
Time to event (months)
Fre
edo
m f
rom
eve
nt
(%)
Nonfatal MACE/death
12 24 36 48 600
10
20
30
40
50
60
70
80
90
100
P = 0.001
QC
0
10
20
30
40
50
60
70
80
90
100
CV-9
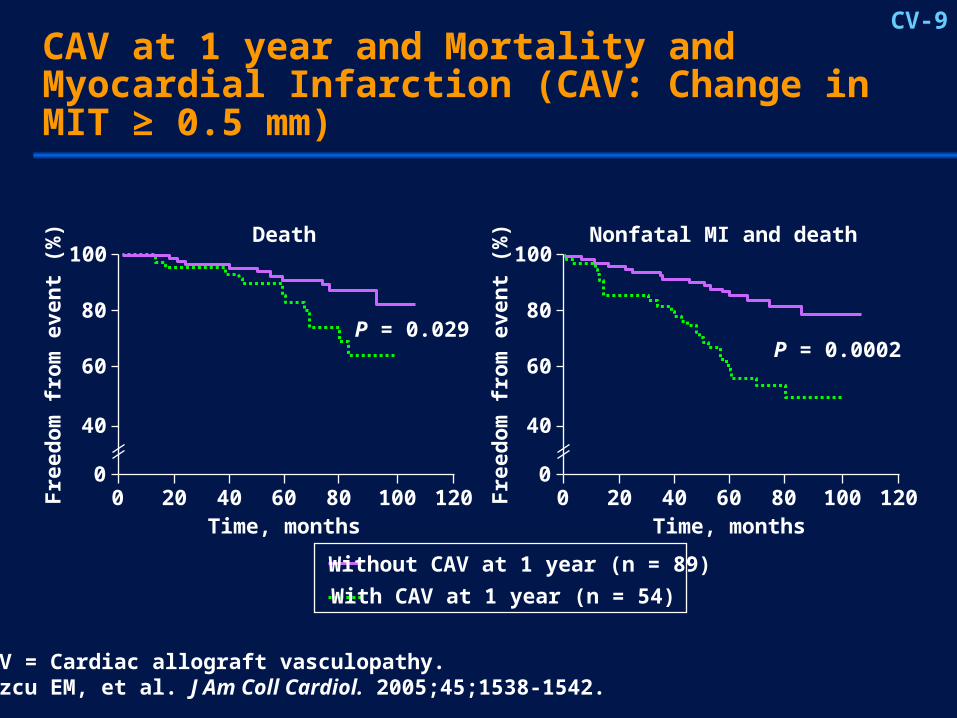
CAV at 1 year and Mortality and Myocardial Infarction (CAV: Change in MIT ≥ 0.5 mm)
CAV = Cardiac allograft vasculopathy.Tuzcu EM, et al. J Am Coll Cardiol. 2005;45;1538-1542.
100
80
60
40
00 20 40 60 80 100 120
Time, months
Death
Fre
edo
m f
rom
eve
nt
(%) 100
80
60
40
00 20 40 60 80 100 120
Time, months
Nonfatal MI and death
P = 0.0002P = 0.029
Without CAV at 1 year (n = 89)
With CAV at 1 year (n = 54)
155-2 Tuzcu - JACC Vol 45 No. 9 2005.pdf Figure 4
QC
Fre
edo
m f
rom
eve
nt
(%)

CV-10
IVUS MethodologyB253 Heart Study
IVUS efficacy assessments performed at baseline and 12 months for patients remaining on study drug
IVUS analysis conducted centrally at an experienced core laboratory at the Cleveland Clinic Foundation by cardiologists blinded to treatment assignments
QC
CV-11
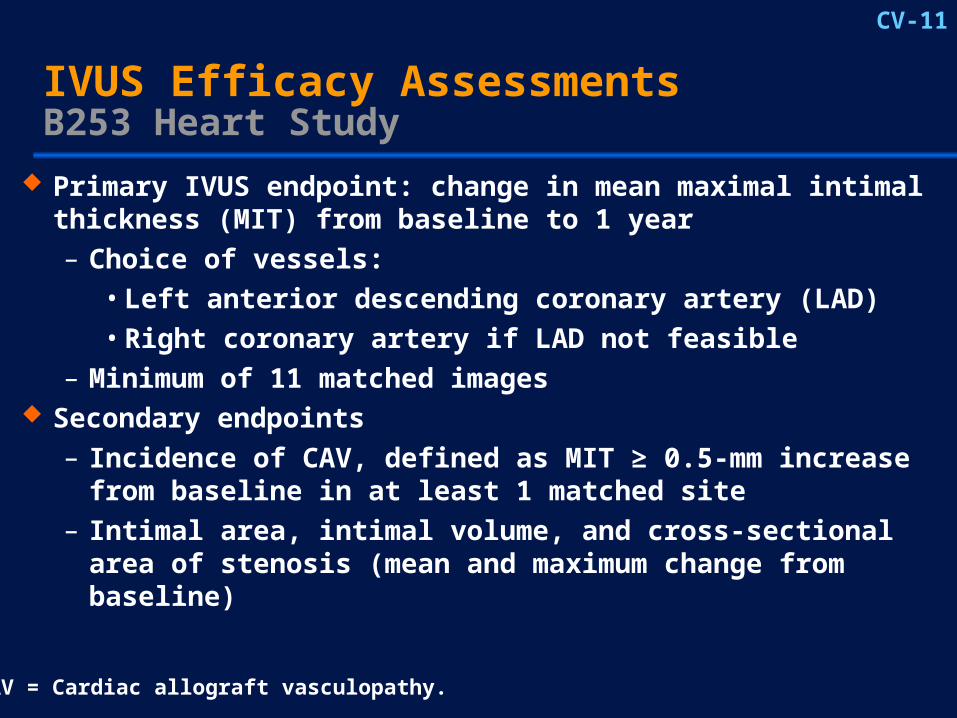
IVUS Efficacy AssessmentsB253 Heart Study
Primary IVUS endpoint: change in mean maximal intimal thickness (MIT) from baseline to 1 year– Choice of vessels:
• Left anterior descending coronary artery (LAD)• Right coronary artery if LAD not feasible
– Minimum of 11 matched images Secondary endpoints
– Incidence of CAV, defined as MIT ≥ 0.5-mm increase from baseline in at least 1 matched site
– Intimal area, intimal volume, and cross-sectional area of stenosis (mean and maximum change from baseline)
CAV = Cardiac allograft vasculopathy.
QC
CV-12
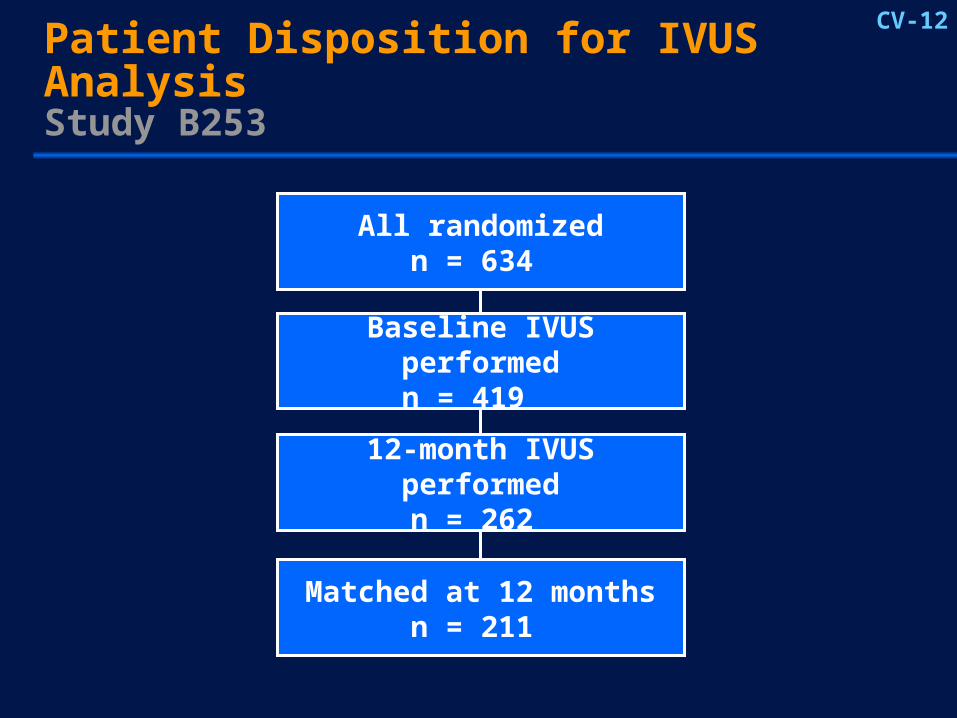
Patient Disposition for IVUS AnalysisStudy B253
All randomizedn = 634
Baseline IVUS performedn = 419
12-month IVUS performedn = 262
Matched at 12 monthsn = 211
another CV slide.ppt205-11
QC
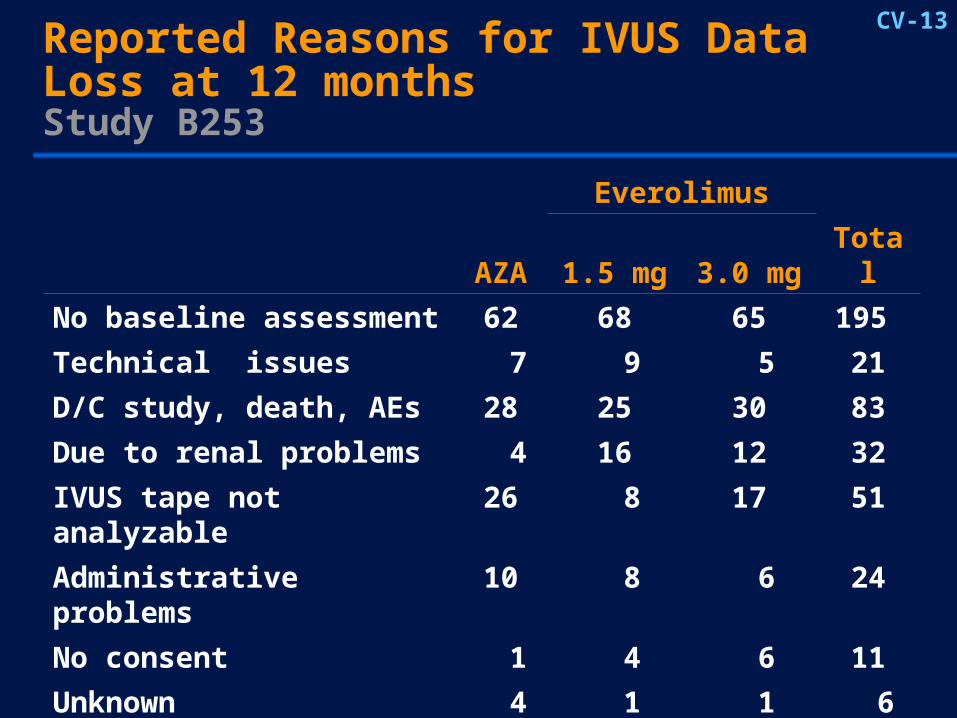
CV-13Reported Reasons for IVUS Data Loss at 12 monthsStudy B253
DRT1962.ppt205-2
Everolimus
AZA 1.5 mg 3.0 mg Total
No baseline assessment 62 68 65 195
Technical issues 7 9 5 21
D/C study, death, AEs 28 25 30 83
Due to renal problems 4 16 12 32
IVUS tape not analyzable 26 8 17 51
Administrative problems 10 8 6 24
No consent 1 4 6 11
Unknown 4 1 1 6
Total 142 139 142 423
QC

CV-14
Baseline DemographicsStudy B253—ITT Population vs IVUS Population
ITT population (N = 634) 12-month IVUS population (N = 211)
RecipientsAZA
n = 214AZA
n = 72
Age, yr (mean ± SD)
50.5 ± 11.5 50.4 ±10.71
Male, n (%) 182 (85.0) 63 (87.5)
Race, n (%)
White 193 (90.2) 63 (87.5)
Black 13 (6.1) 6 (8.3)
Diabetes, n (%)at baseline
36 (16.8) 14 (19.4)
CAD, n (%)at baseline
68 (31.8) 27 (37.5)
GFR < 29 mL/min/1.73m2
at baseline
6 (2.8) 1 (1.4)
QC
10 (14.3)
27 (38.6)
4 (5.7)
5 (7.1)
62 (88.6)
57 (81.4)
51.2 ±10.16
1.5 mgn = 70
Everolimus
49 (23.2)
84 (39.8)
7 (3.3)
11 (5.2)
192 (91.0)
171 (81.0)
52.1 ± 10.8
3.0 mgn = 211
35 (16.7)
78 (37.3)
14 (6.7)
Everolimus
21 (10.0)
181 (86.6)
166 (79.4)
51.2 ± 11.1
1.5 mgn = 209
24 (34.8)*
30 (43.5)
3 (4.3)
4 (5.8)
62 (89.9)
54 (78.3)
51.9 ± 10.90
3.0 mgn = 69
PTT 3.1-4
*P = 0.057 vs AZA

CV-15
*P < 0.05 vs AZA; **P = 0.014 vs AZA; ***P < 0.01 vs AZA; ****P < 0.003 vs AZA
143-53
Everolimus
IVUS measurement:Change from baseline
AZAn = 72
1.5 mgn = 70
3.0 mgn = 69
Mean maximal intimal thickness (MIT) (mm)
0.10 0.04** 0.03****
Mean intimal area (mm2) 0.93 0.41*** 0.22***
Mean cross-sectionalarea of stenosis (%)
5.56 2.07* 1.46*
Mean intimal volume (mm3) 16.56 9.70*** 8.24***
Incidence of vasculopathy (%)(MIT increase ≥ 0.5 mm)
52.8 35.7* 30.4*
12-month IVUS Endpoints Study B253 (Baseline to 1 year)
QC

CV-16Treatment Comparisons of IVUS Variables at 12 months95% CI for Everolimus Minus AZA
Mean Intimal area (mm2)
Mean change in MIT (mm)a
Everolimus 1.5 mg vs AZA Everolimus 3.0 mg vs AZA
–0.06
–0.07
–0.52
–0.71
-1.0 -0.9 -0.8 -0.7 -0.6 -0.5 -0.4 -0.3 -0.2 -0.1 0
Difference (95% CI)
Everolimus better AZA better
a Primary IVUS endpoint.
QC
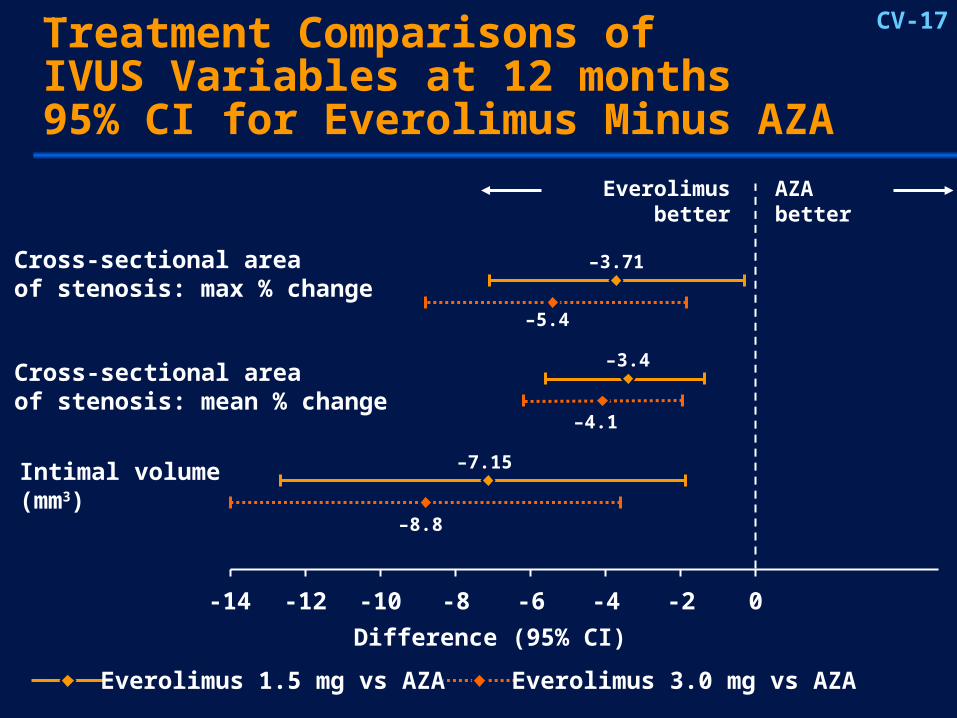
CV-17Treatment Comparisons of IVUS Variables at 12 months95% CI for Everolimus Minus AZA
-14 -12 -10 -8 -6 -4 -2 0
Difference (95% CI)
Intimal volume (mm3)
Cross-sectional areaof stenosis: mean % change
Cross-sectional areaof stenosis: max % change
Everolimus 1.5 mg vs AZA Everolimus 3.0 mg vs AZA
IVUS back-up - Aug 10th.ppt205-12
–7.15
–8.8
–3.4
–4.1
–3.71
–5.4
Everolimus better AZA better
QC
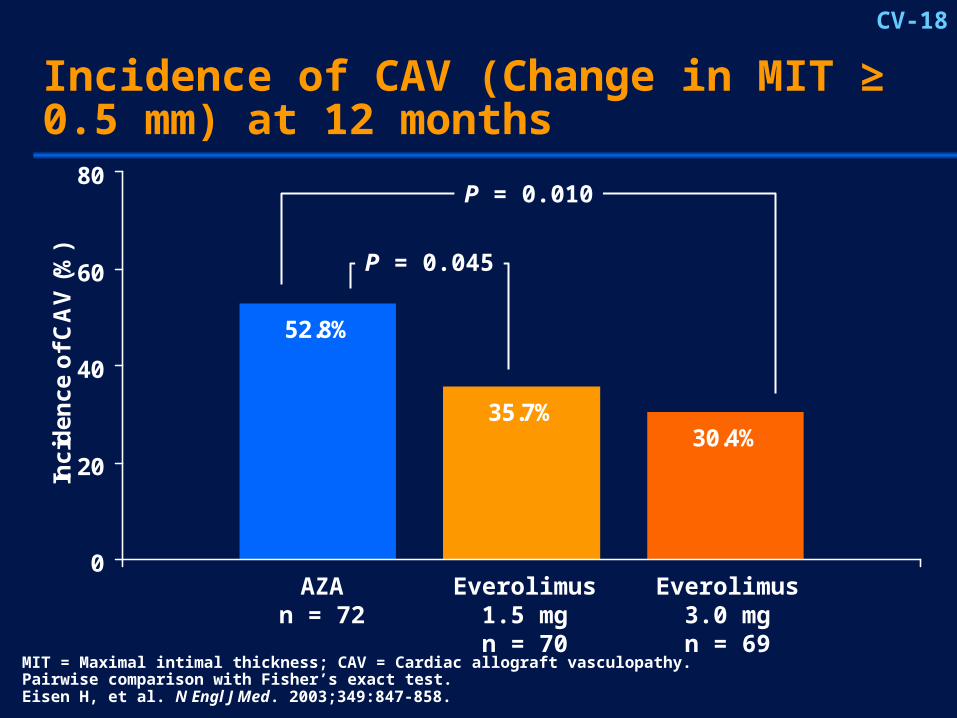
CV-18
52.8%
35.7%30.4%
0
20
40
60
80
Inc
ide
nc
e o
f C
AV
(%
)Incidence of CAV (Change in MIT ≥ 0.5 mm) at 12 months
P = 0.010
P = 0.045
122-34
MIT = Maximal intimal thickness; CAV = Cardiac allograft vasculopathy.Pairwise comparison with Fisher’s exact test.Eisen H, et al. N Engl J Med. 2003;349:847-858.
Everolimus1.5 mgn = 70
Everolimus3.0 mgn = 69
AZAn = 72
QC
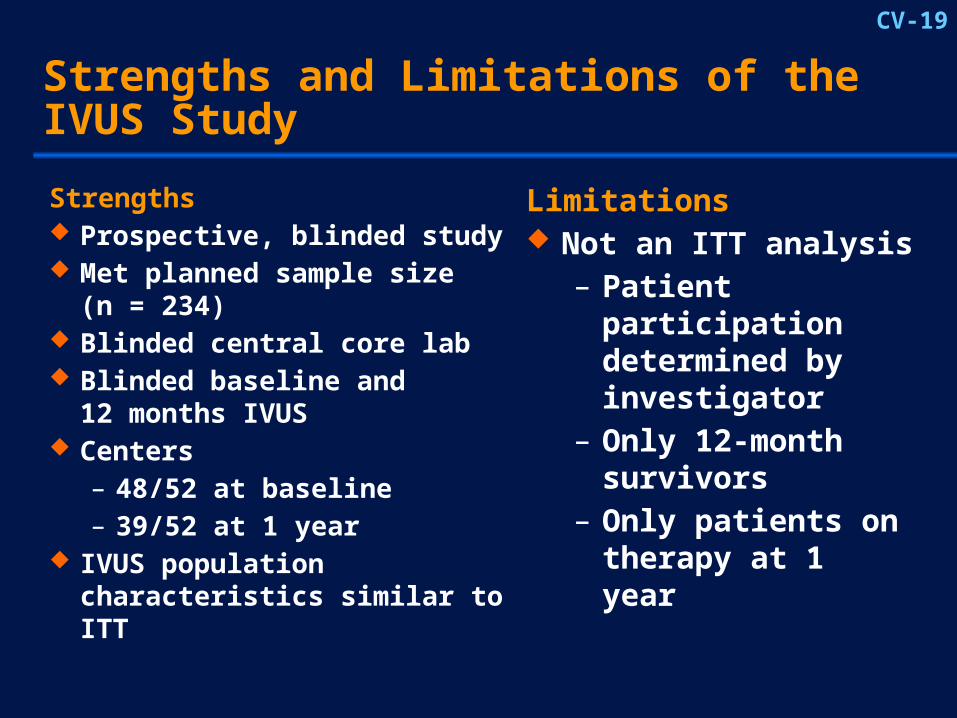
CV-19
Strengths and Limitations of the IVUS Study
Strengths Prospective, blinded study Met planned sample size
(n = 234) Blinded central core lab Blinded baseline and
12 months IVUS Centers
– 48/52 at baseline– 39/52 at 1 year
IVUS population characteristics similar to ITT
Limitations Not an ITT analysis
– Patient participation determined by investigator
– Only 12-month survivors
– Only patients on therapy at 1 year
DRT1962.ppt205-1
QC

CV-20
Assessment of Potential Selection Bias in the IVUS Subpopulation
Purpose– Identify selection bias favoring everolimus
• Demographic and clinical characteristics Plan
– Identify patterns of bias in favor of everolimus arms
– Sensitivity analyses to investigate the impact of potential biases
DRT1962.ppt205-3
QC
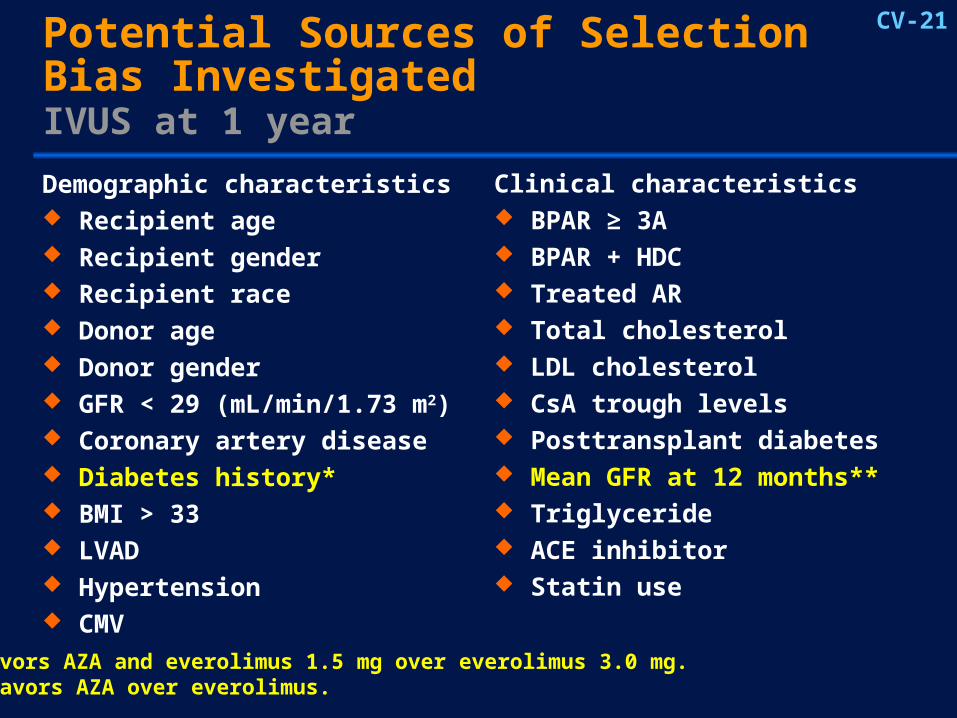
CV-21Potential Sources of Selection Bias InvestigatedIVUS at 1 year Demographic characteristics Recipient age Recipient gender Recipient race Donor age Donor gender GFR < 29 (mL/min/1.73 m2) Coronary artery disease Diabetes history* BMI > 33 LVAD Hypertension CMV
Clinical characteristics BPAR ≥ 3A BPAR + HDC Treated AR Total cholesterol LDL cholesterol CsA trough levels Posttransplant diabetes Mean GFR at 12 months** Triglyceride ACE inhibitor Statin use
*Favors AZA and everolimus 1.5 mg over everolimus 3.0 mg.**Favors AZA over everolimus.
QC
CV-22
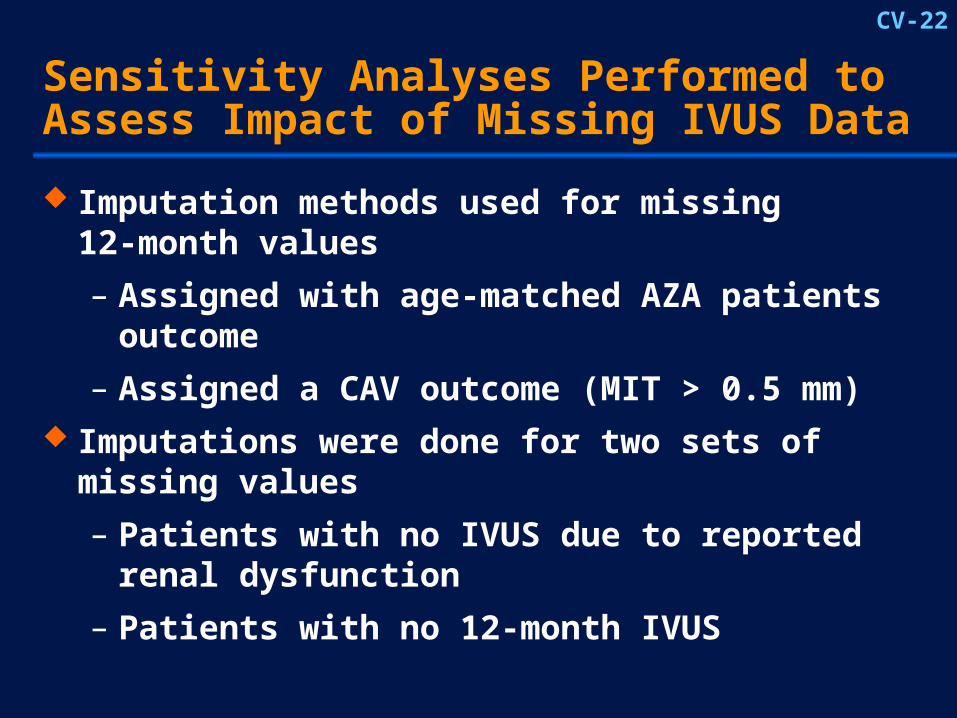
Sensitivity Analyses Performed to Assess Impact of Missing IVUS Data
Imputation methods used for missing 12-month values
– Assigned with age-matched AZA patients outcome
– Assigned a CAV outcome (MIT > 0.5 mm) Imputations were done for two sets of missing
values
– Patients with no IVUS due to reported renal dysfunction
– Patients with no 12-month IVUS
DRT1962.ppt205-9
QC

CV-23
Sensitivity Analysis for Missing Data for CAV (MIT ≥ 0.5 mm)
Difference in CAV (%)
Everolimus 1.5 mg vs AZA
Everolimus 3.0 mg vs AZA
DRT1962.ppt205-10
-40 -30 -20 -10 0 10
• Assigning age-matched AZA MIT
• Assigning CAV
No imputation for CAV (n = 211)12-month IVUS population
–8.5
–9.5
–9.1
–11.3
–17.0
–22.0
• Assigning age-matched AZA MIT
• Assigning CAV
Missing due to renal dysfunction (n = 243)
All missing 12 month values (n = 419)
–12.8
–19.4–8.2
–14.5
Everolimus better AZA better
QC

CV-24
Kaplan-Meier Analysis of Time to First Graft-Related MACE From Month 1 to Month 48 Excluding Patients Who Died Within 30 Days of First Dose
0.5
0.6
0.7
0.8
0.9
1.0
0 180 360 540 720 900 1080 1260 1440 1620
Time (days)
Su
rviv
al d
istr
ibu
tio
n
Everolimus 1.5 mgEverolimus 3.0 mgAZA
Treatment Patients at risk/censored
AZA (n = 211) 186/7 168/18 98/80Everolimus 1.5 mg (n = 202) 184/8 172/15 106/78Everolimus 3.0 mg (n = 206) 175/14 163/23 96/85
emai
l 10/
11/0
5 ex
cel d
atas
ets
P = 0.052, 1.5 mg vs AZAP = 0.356, 3.0 mg vs AZA
QC
1.5 mg3.0 mgAZA

CV-25
MACE SummaryStudy B253—Month 1 to 48
Patients, n (%)a
Everolimus
AZAn = 214
1.5 mgn = 209
3.0 mgn = 211
MACE (total) 43 (22.8) 32 (19.3) 32 (17.5)
Graft-related 33 (17.4) 19 (10.4)* 25 (13.6)
Non–graft-related 14 (7.8) 15 (10.2) 8 (4.4)
Fatal 10 (5.2) 6 (3.7) 7 (4.2)
Nonfatal 39 (21.1) 27 (16.6) 26 (14.0)
A patient may be counted in more than one row.a Percent based on Kaplan-Meier rate. *P = 0.052 based on log-rank test
QC

CV-26
IVUS 12-month Summary
Everolimus demonstrated significant benefit in all IVUS measures of allograft vasculopathy vs AZA
– Smaller increases in maximal intimal thickness
– Lower incidence of CAV
– Smaller increase in intimal area and volume,percent stenosis, and others
Sensitivity analyses support the primary IVUS CAV results
No bias favoring everolimus was detected 48-month MACE data suggest potential for
long-term benefit
110-13
QC

![Efficacy and Safety of Everolimus in Extrapancreatic ... · To evaluate everolimus efficacy, PFS data were available from11studies,in8ofthemasthemedianPFS[14,16–19,23, 24, 26] and](https://img.pdfslide.net/doc/110x75/5c66518c09d3f2e4308c0286/efficacy-and-safety-of-everolimus-in-extrapancreatic-to-evaluate-everolimus.jpg)