Embed Size (px)
Citation preview

R E S E A R CH A R T I C L E
CVSnet: A machine learning approach for automated centralvein sign assessment in multiple sclerosis
Pietro Maggi1,2 | Mário Jo~ao Fartaria3,4 | Jo~ao Jorge5 | Francesco La Rosa4,6 |
Martina Absinta7 | Pascal Sati7 | Reto Meuli6 | Renaud Du Pasquier1 |
Daniel S. Reich7 | Meritxell Bach Cuadra4,6,8 | Cristina Granziera9,10 |
Jonas Richiardi3,6 | Tobias Kober3,4
1Department of Neurology, Lausanne
University Hospital, Lausanne, Switzerland
2Department of Neurology, Saint-Luc
University Hospital, Brussels, Belgium
3Advanced Clinical Imaging Technology,
Siemens Healthcare AG, Lausanne, Switzerland
4Signal Processing Laboratory (LTS5), École
Polytechnique Fédéral de Lausanne, Lausanne,
Switzerland
5Laboratory for Functional and Metabolic
Imaging, École Polytechnique Fédérale de
Lausanne, Lausanne, Switzerland
6Department of Radiology, Lausanne
University Hospital and University of
Lausanne, Lausanne, Switzerland
7Translational Neuroradiology Section,
National Institute of Neurological Disorders
and Stroke, National Institutes of Health,
Bethesda, Maryland
8Medical Image Analysis Laboratory (MIAL),
Centre d'Imagerie BioMédicale (CIBM),
Lausanne, Switzerland
9Neurologic Clinic and Policlinic, Departments
of Medicine, Clinical Research and Biomedical
Engineering, University Hospital Basel and
University of Basel, Basel, Switzerland
10Translational Imaging in Neurology (ThINK)
Basel, Department of Medicine and Biomedical
Engineering, University Hospital Basel and
University of Basel, Basel, Switzerland
Correspondence
Pietro Maggi, Department of Neurology,
Lausanne University Hospital, Rue du Bugnon
46, 1011 Lausanne, Switzerland.
Email: [email protected]
Funding information
Conrad N. Hilton Foundation, Grant/Award
Number: grant#17313; National Multiple
The central vein sign (CVS) is an efficient imaging biomarker for multiple sclerosis
(MS) diagnosis, but its application in clinical routine is limited by inter-rater variability
and the expenditure of time associated with manual assessment. We describe a deep
learning-based prototype for automated assessment of the CVS in white matter MS
lesions using data from three different imaging centers. We retrospectively analyzed
data from 3 T magnetic resonance images acquired on four scanners from two differ-
ent vendors, including adults with MS (n = 42), MS mimics (n = 33, encompassing
12 distinct neurological diseases mimicking MS) and uncertain diagnosis (n = 5). Brain
white matter lesions were manually segmented on FLAIR* images. Perivenular
assessment was performed according to consensus guidelines and used as ground
truth, yielding 539 CVS-positive (CVS+) and 448 CVS-negative (CVS−) lesions. A 3D
convolutional neural network (“CVSnet”) was designed and trained on 47 datasets,
keeping 33 for testing. FLAIR* lesion patches of CVS+/CVS− lesions were used for
training and validation (n = 375/298) and for testing (n = 164/150). Performance was
evaluated lesion-wise and subject-wise and compared with a state-of-the-art
vesselness filtering approach through McNemar's test. The proposed CVSnet
approached human performance, with lesion-wise median balanced accuracy of 81%,
and subject-wise balanced accuracy of 89% on the validation set, and 91% on the
test set. The process of CVS assessment, in previously manually segmented lesions,
was ~ 600-fold faster using the proposed CVSnet compared with human visual
assessment (test set: 4 seconds vs. 40 minutes). On the validation and test sets, the
lesion-wise performance outperformed the vesselness filter method (P < 0.001). The
proposed deep learning prototype shows promising performance in differentiating
MS from its mimics. Our approach was evaluated using data from different hospitals,
enabling larger multicenter trials to evaluate the benefit of introducing the CVS
marker into MS diagnostic criteria.
Abbreviations used: AUC, area under the curve; CVS, central vein sign; FLAIR, 3D T2-weighted fluid-attenuated inversion recovery; GPU, graphics processing unit; MRI, magnetic resonance
imaging; MS, multiple sclerosis; NIR, no information rate; ReLU, rectified linear unit; ROC, receiver operating characteristic; T2*-EPI, T2*-weighted segmented echo-planar imaging; 3D, three-
dimensional; WM, white matter.
Pietro Maggi and Mário Jo~ao Fartaria contributed equally to this work.
Received: 9 December 2019 Revised: 22 January 2020 Accepted: 5 February 2020
DOI: 10.1002/nbm.4283
NMR in Biomedicine. 2020;33:e4283. wileyonlinelibrary.com/journal/nbm © 2020 John Wiley & Sons, Ltd. 1 of 11
https://doi.org/10.1002/nbm.4283

Sclerosis Society (NMSS), Grant/Award
Number: FG 2093-A-1; the European Union's
Horizon 2020 research and innovation
program; Centre d'Imagerie BioMédicale
(CIBM) of the University of Lausanne and the
Leenaards and Jeantet Foundations; University
of Lausanne “relève académique” grant
K E YWORD S
Central vein sign, deep learning, MS mimics, multiple sclerosis
1 | INTRODUCTION
Current magnetic resonance imaging (MRI) diagnostic criteria for multiple sclerosis (MS) are based on the dissemination in time and space of char-
acteristic imaging features of the disease. Although highly useful, the specificity of these criteria is limited, and the risk of misdiagnoses based on
MRI is still substantial.1,2 Consequently, identification of more specific imaging biomarkers for MS is a high-priority area of research.3
The presence of a vein at the center of white matter (WM) lesions, the central vein sign (CVS), has been shown to be an efficient imaging bio-
marker for MS, able to distinguish MS from other conditions exhibiting similar WM abnormalities on MRI.4 In MS, the immunological reaction
leading to the formation of inflammatory WM lesions occurs in the perivascular cuff around small parenchymal veins.5-7 Indeed, pathology studies
as early as the 19th century described the presence of a vein at the center of inflammatory lesions as a hallmark of the MS plaque.8 Today, the
vein at the center of WM lesions can be imaged in vivo using optimized susceptibility-based MRI sequences,9,10 and several studies have shown
that the CVS can accurately distinguish MS from other disorders showing similar T2 hyperintensities on MRI.11-15 Results from a recent multicen-
ter study suggest that the diagnostic performance of this CVS biomarker at clinical field strengths is highly dependent on the type of
susceptibility-based MRI sequence used.16 In this context, recent data from our group using an optimized three-dimensional (3D) T2*-weighted
segmented echo-planar imaging (T2*-EPI) sequence at clinical field strengths9 have shown that the CVS can efficiently discriminate between MS
and inflammatory vasculopathies of the CNS and that this imaging biomarker can accurately predict an MS diagnosis in patients harboring atypical
features for the disease.11,17
However, despite the availability of optimized 3D MRI sequences for CVS detection, there remain substantial technical limitations to applying
this imaging biomarker in daily clinical practice. These limitations are primarily related to the manual, operator-dependent assessment required to
evaluate the CVS in individual scans. Although previously proposed simplified algorithms considerably reduce the time burden associated with
CVS evaluation,18,19 manual assessment generally suffers from inter-rater and intra-rater variability, is time-consuming, and limits the generaliza-
tion of results across different centers and healthcare systems. In order to promote the translation of the CVS imaging biomarker into clinical rou-
tine, a reliable and reproducible method to automatically detect the CVS is needed.
Recently, Dworkin et al proposed an automated method to detect the CVS in WM lesions, based on a vesselness filter combined with a cen-
trality measure.20 The study showed good subject-wise accuracy, but was limited to single-center data collection.11,12 In the present work, we
show results on a broad panel of 12 different MS-mimicking diseases, collected on four different MRI scanners. CVSnet, our approach to automat-
ically assess the CVS, is based on a 3D convolutional neural network architecture.21,22 Because it uses deep learning, it is an end-to-end learning
approach that does not require handcrafted discriminative features or filters. Instead, it learns the most appropriate representations of the data
by minimizing the CVS positive/negative classification error and has the ability to generalize the data. The training of the network performed
using data from four different scanners (two different vendors) and three different imaging centers ensures robustness of the algorithm with
respect to contrast and hardware-related differences. To evaluate the potential of our approach excluding the influence of segmentation errors,
we use manually segmented lesions for validation.
2 | PATIENTS AND METHODS
2.1 | Patients
This is a retrospective analysis of images from 80 patients recruited between September 2016 and November 2018 at the University Hospital of
Lausanne, Switzerland (n = 30), at the Erasmus University Hospital, Brussels, Belgium (n = 36), and at the National Institutes of Neurological Disor-
ders and Stroke, National Institutes of Health, Bethesda, Maryland (n = 14). In all centers, studies were designed to assess the diagnostic utility of
the CVS for differential diagnosis of MS. The included patients had either definite MS according to the 2017 McDonald criteria3 (n = 42) or a vari-
ety of diseases giving WM abnormalities similar to those observed in MS (hereafter termed “MS mimics”; n = 33). Five patients had an uncertain
diagnosis at the time of this study (“uncertain diagnosis”). The included patients with MS-mimic diseases encompassed systemic lupus
erythematosus (n = 7), Sjögren syndrome (n = 4), primary angiitis of the central nervous system (n = 2), antiphospholipid syndrome (n = 1), inflam-
matory amyloid angiopathy (n = 1), Behçet disease (n = 2), sarcoidosis (n = 1), neuromyelitis optica spectrum disorder (n = 6), Susac syndrome
(n = 2), HTLV-1-associated myelopathy/tropical spastic paraparesis (n = 1), migraine (n = 5) and cerebral small vessel disease (n = 1).
2 of 11 MAGGI ET AL.
2.2 | MRI acquisition, postprocessing and manual CVS assessment
All patients underwent a single brain MRI acquisition on a 3 T Magnetom Skyra or Prisma scanner (Siemens Healthcare, Erlangen, Germany) in
Lausanne, a 3 T Ingenia scanner (Philips, Best, the Netherlands) in Brussels, or a 3 T Skyra scanner (Siemens Healthcare, Erlangen, Germany) in
Bethesda. In all centers, 3D T2*-EPI and 3D T2-weighted fluid-attenuated inversion recovery (FLAIR) images were acquired during and after intra-
venous injection of a single dose (0.1 mmol/kg) of gadolinium-based contrast material, as previously described.11 FLAIR images were obtained
with 1-mm isotropic resolution in all centers, whereas 3D T2*-EPI images were obtained with 0.55-mm isotropic resolution in Brussels and
0.65-mm isotropic resolution in Lausanne and Bethesda (Table 1). DICOM images were processed and analyzed using Medical Image Processing,
Analysis, and Visualization (MIPAV; NIH; http://mipav.cit.nih.gov). After bias-field correction and coregistration, FLAIR* images were generated
by voxel-wise multiplication of the FLAIR and the T2*-EPI images, as previously described.10 For each patient, WM lesions were manually seg-
mented on FLAIR* images following the North American Imaging in Multiple Sclerosis (NAIMS) Cooperative consensus on lesion
inclusion/exclusion criteria for central vein analysis.4,11 Two investigators (P.M., M.A.) independently assessed the percentage of CVS+ lesions for
inter-rater reliability, blinded to clinical diagnosis. Disagreements were adjudicated by consensus between the two investigators (see examples in
Figure 1). Manual segmentation and classification of CVS+ and CVS− lesions were used as ground truth. Patients were dichotomized into MS ver-
sus MS mimics based on three previously proposed criteria: (1) the “50% rule”,11 (ie, a 50% CVS+ lesion cut-off to distinguish MS from MS mimics),
(2) the “six-lesion rule”18 and (3) the “three-lesion rule”,19 whereby 10 or three lesions are randomly selected and MS is diagnosed if at least six or
two lesions are CVS+.
In addition, fulfillment of MS MRI criteria for dissemination in space (DIS)3 was assessed for each patient. An average CVS assessment time
for one lesion was estimated and used to compute the total evaluation time for each rule used. All the experiments were run on a workstation
equipped with an nvidia GTX 1080TI graphics processing unit (GPU) and two intel Xeon Gold 6126 central processing units with 192 GB RAM.
2.3 | Automated CVS assessment with a vesselness filter
The “centrality-corrected” vesselness filter method proposed by Dworkin et al20 was reimplemented and used as baseline for comparison. It com-
bines a classical Frangi multiscale vesselness filter23 with a map of the distance to the lesion boundary, thereby down-weighting filter responses
away from the center. Our implementation differs principally from Dworkin et al by using a standard Euclidean distance transform (Matlab func-
tion bwdist) in-house implementation of the multiscale vesselness filter (parameters: α = 0.5, β = 0.5, c = 0.02) and compilation to optimize execu-
tion speed.
A threshold is then applied to the output of the filter. The resulting mask is used as a biomarker for vessel presence and relies on the sum of
the probabilities of voxels within the lesion, estimated by the vesselness filter approach. In order to maximize the performance of the vesselness
filter, the optimal threshold was computed for each validation fold using the operating point from receiver operating characteristic (ROC) analysis.
True positive and false positive rates in the ROC analysis were estimated according to the ground truth.
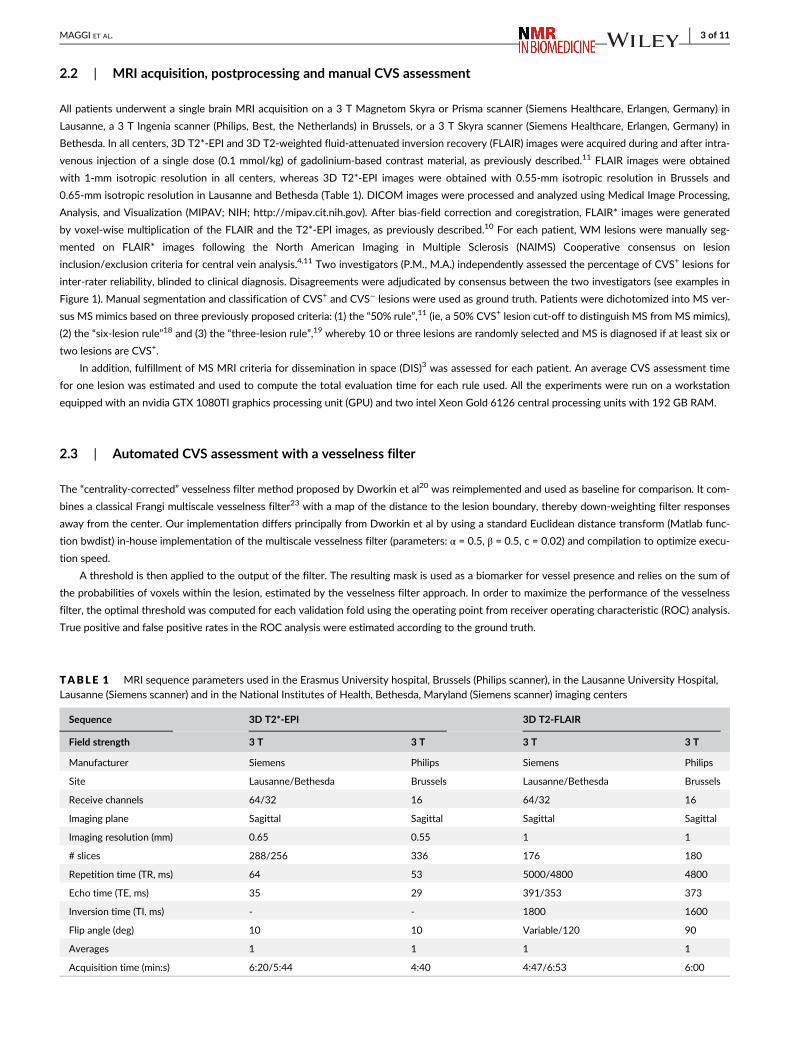
TABLE 1 MRI sequence parameters used in the Erasmus University hospital, Brussels (Philips scanner), in the Lausanne University Hospital,Lausanne (Siemens scanner) and in the National Institutes of Health, Bethesda, Maryland (Siemens scanner) imaging centers
Sequence 3D T2*-EPI 3D T2-FLAIR
Field strength 3 T 3 T 3 T 3 T
Manufacturer Siemens Philips Siemens Philips
Site Lausanne/Bethesda Brussels Lausanne/Bethesda Brussels
Receive channels 64/32 16 64/32 16
Imaging plane Sagittal Sagittal Sagittal Sagittal
Imaging resolution (mm) 0.65 0.55 1 1
# slices 288/256 336 176 180
Repetition time (TR, ms) 64 53 5000/4800 4800
Echo time (TE, ms) 35 29 391/353 373
Inversion time (TI, ms) - - 1800 1600
Flip angle (deg) 10 10 Variable/120 90
Averages 1 1 1 1
Acquisition time (min:s) 6:20/5:44 4:40 4:47/6:53 6:00
MAGGI ET AL. 3 of 11

2.4 | Automated CVS assessment with CVSnet
We designed CVSnet as a three-layer convolutional neural network, each with a 3D convolution, followed by a rectified linear unit (ReLU) and
dropout (P = 0.5). This architecture is broadly inspired by the VGGnet, a classical baseline model for computer vision tasks.24 Our network takes
patches of size 21 x 21 x 21 voxels as input, where the center of mass of each lesion was considered the center of the respective patch. This was
chosen empirically so that samples of lesion tissue would fit within the patch, and to limit feature map sizes (especially in the first layers) to pre-
serve GPU memory and lower the number of parameters. The convolution kernel sizes were (3 x 3 x 3 x 16), (3 x 3 x 3 x 32) and (3 x 3 x 3 x 64).
Our choice of small kernel sizes and limited network depth was motivated mainly by the limited amount of data available, as well as the relatively
small size of features of interest (vessels). This was followed by a fully connected layer of size 32, then a fully connected layer of size 2 with sig-
moid activation (Figure 2). The architecture comprised 71 810 trainable parameters.25
A 10-fold cross-validation was used to train networks, each using 90% of the lesion patches as a training set and 10% as a validation set. Data
augmentation based on three 90-degree rotations about one axis was applied to the training and validation sets. After Gaussian initialization, we
used categorical cross-entropy loss, training with minibatch stochastic gradient descent (Adam optimizer) for 200 epochs with a minibatch size of
20, at a fixed learning rate of 0.001 checking for approximate class balance for each resampling. In each fold, we saved and used as final model
the one providing lowest validation loss in that fold. The weights were initialized with Xavier Gaussian initialization. In each fold, training took an
F IGURE 1 3D FLAIR* images obtained on Siemens (Lausanne University Hospital; (A, B)) and Philips (Erasmus University Hospital; (C, D)) MRIscanners showing central vein sign-positive (CVS+) and -negative (CVS-) lesions. A central vein running through the lesion (arrows) is visible in themajority of white matter lesions in (A) a 28-year-old man and (C) a 27-year-old woman with relapsing–remitting MS. Images from (B) a 25-year-old and (D) a 46-year-old women with Sjögren syndrome show how the central vein sign is not typical of white matter lesions in MS-mimickingdiseases
4 of 11 MAGGI ET AL.

average of 800 (range 600–900) seconds. The classification results for the pure-testing set were obtained using an ensemble method by feeding
each test patch to all 10 trained networks (one per cross-validation fold) and averaging their probability outputs (Figure 2). Even although dropout
is used in each of the ensemble constituent networks, fold-to-fold performance is quite variable (Figure 3), and ensembling enables lower predic-
tion variance for the test set.
From the multicenter cohort, lesions from 47 (24 MS, 20 MS mimic and three uncertain-diagnosis) subjects were used to train the network,
and lesions from 33 (18 MS, 13 MS mimic and two uncertain-diagnosis) subjects selected randomly, were used as a pure-testing set. FLAIR* pat-
ches of CVS+ and CVS− lesions were used for training and validation. In total, 673 (375 CVS+, 298 CVS−) and 314 (164 CVS+, 150 CVS−) patches
were obtained for the training/validation and pure-testing sets, respectively. In the training/validation set, 338 (158 CVS+, 180 CVS−) patches
came from Brussels and 335 (217 CVS+, 118 CVS−) came from Lausanne. In the pure-testing set, 72 (48 CVS+, 24 CVS−) patches came from Brus-
sels, 103 (40 CVS+, 63 CVS−) from Lausanne and 139 (76 CVS+, 63 CVS−) from Bethesda. CVSnet was implemented in Python 3.6.5 (http://www.
python.org), with Keras 2.1.5 (http://keras.io) and TensorFlow 1.6.0.26
2.5 | Evaluation of the CVS assessment and patient differential diagnosis
The performance was evaluated at two levels: (1) lesion-wise: sensitivity, specificity and balanced accuracy (the average of class-wise accuracies)
were computed with respect to the assessment of CVS+ and CVS− lesions on the validation and pure-testing sets. ROC curve analysis was per-
formed, and area under the curve (AUC) values for each of the 10 cross-validation folds were computed; and (2) patient-wise: intraclass correla-
tion coefficient (ICC (3,1))27 between the percentage of CVS+ lesions estimated automatically and manually were estimated for both methods;
sensitivity, specificity, accuracy and balanced accuracy were computed regarding the differentiation between MS and MS mimics based on the
F IGURE 2 methods used for central vein sign (CVS) assessment in white matter lesions. Top stream: A multiscale vesselness enhancementfilter combined with a distance map to estimate centrality-corrected vesselness. Bottom stream: CVSnet, the proposed 3D convolutional neuralnetwork, consists of a simple, repetitive, and relatively shallow architecture. In both methods, we keep one trained version per crossvalidationfold in the cross-validation set. On the test set, we use these 10 different versions of the same algorithm to yield 10 different predictions for eachincoming test patch and average the output (“ensembling”) to yield a single, more stable, prediction
MAGGI ET AL. 5 of 11

50% rule,11 using the classification results of the validation and pure-testing sets. The “uncertain diagnosis” cases were excluded from the patient-
wise analysis. The total CVS assessment time in the pure-testing set was estimated for the vesselness filter, the CVSnet and the manual CVS
assessment rules.
2.6 | Statistical analyses
Demographic and MRI differences were tested with either Kruskal-Wallis test or Mann–Whitney U test as appropriate. Difference in perivenular
frequency between MS and MS-mimics patients was tested using Mann–Whitney U test. Lesion-wise and patient-wise classification results from
the proposed CVSnet and the vesselness method were compared using McNemar's test, and performance was compared with the no information
rate (NIR) corresponding to a zero-rule naive classifier that always vote for the majority class, also using McNemar's test. Statistical analyses were
performed using R 3.5.1 (https://www.R-project.org/).
3 | RESULTS
3.1 | Patient demographics and manual CVS assessment
Clinical and demographic characteristics of MS, MS mimics and uncertain diagnosis cases are reported in Table 2. We found no age or gender dif-
ferences between the groups (P = 0.6). The majority of MS mimics scans fulfilled the 2017 MRI diagnostic criteria for MS dissemination in space
(20/33 patients, 61%). The median number of brain WM lesions did not differ between MS mimics and MS patients (median = 9, range = 1–32
vs. median = 9, range = 1–46, respectively; Mann–Whitney U test = 567, P = 0.2), whereas median lesion volume was smaller for MS mimics com-
pared with MS patients (median = 34 mm3, range = 14–299 vs. median = 52 mm3, range = 29–217, respectively; Mann–Whitney U test = 343,
P = 0.0001). Expert manual CVS assessment following the NAIMS guidelines for lesion inclusion/exclusion criteria4 showed that the frequency of
perivenular lesions was always higher in MS (median = 80%, range = 52%–100%) compared with MS mimics (median = 7%, range = 0%–40%;
Mann–Whitney U test = 0, P < 0.0001; Figure 1). In line with previous results using the same optimized high resolution T2*-EPI sequence adopted
F IGURE 3 Lesion-wise classification using the vesselness filter and the proposed CVSnet. Lesion-wise classification sensitivity, specificity,accuracy and area-under-the-receiver-operating characteristic curve (AUC) for the validation and pure-testing sets, using the vesselness filter(dark gray dots) and the new CVSnet (light gray dots). To indicate variability due to data sampling, in the validation set, each dot shows the resultof one cross-validation fold, the orange crosses represent median, and the orange bars the range between the 25th and 75th percentiles
6 of 11 MAGGI ET AL.

in this study,9,11 the 50% rule achieved 100% accuracy in the differentiation between MS and MS mimics, whereas the simplified algorithm six-
lesion rule18 and the three-lesion rule19 showed a sensitivity of 95% and 88%, specificity of 100% and 93%, and accuracy of 97% and 90%,
respectively. The inter-rater agreement for the percentage of perivenular lesions was almost perfect with a Cohen's k of 0.9 and agreement of
94%. On average, manual CVS assessment of one lesion took 15 seconds, resulting in a total evaluation time on the entire pure-testing set of
40 minutes (50% rule), 28 minutes (six-lesion rule) and 12 minutes (three-lesion rule).
3.2 | Automated CVS assessment
As shown in Figure 3, the CVSnet showed higher performance than the vesselness filter for CVS assessment in both validation (McNemar's
x2 = 28.96, P = 7.40E-08) and pure-testing (McNemar's x2 = 11.93, P = 5.51E-04) sets. In the validation set, median values for the CVSnet were
sensitivity, 81% (range = 74%–91%), specificity, 80% (range = 72%–97%), balanced accuracy, 81% (range = 77%–88%) and AUC, 90%
(range = 84%–93%). For the vesselness filter, sensitivity was 79% (range = 70%–84%), specificity, 74% (range = 66%–81%), balanced accuracy,
76% (range = 73%–80%) and AUC, 77% (range = 72%–82%). A similar performance was achieved in the pure-testing set, where the CVSnet
showed 83%, 75% and 79%, and the vesselness filter showed 67%, 79% and 73%, in sensitivity, specificity and accuracy, respectively (Figure 3).
The total CVS assessment time in the pure-testing set was 80 seconds for the vesselness filter and 4 seconds for CVSnet on a central processing
unit, that is, not employing accelerated GPU-based implementations. Thus, evaluating the CVS for all lesions was ~ 600-fold faster using CVSnet
compared with manual assessment (in the test set it was 4 seconds instead of 40 minutes).
Figure 4 shows a scatter plot of the percentage of CVS+ lesions per patient estimated by both methods against the manual assessment. ICC
(3,1) = 0.83 is higher for the CVSnet in comparison with the vesselness filter [ICC (3,1) = 0.60], showing better consistency with manual
assessment.
Results of the patient-wise analysis regarding the differentiation between MS and MS mimics in terms of true/false positives and true/false
negatives are summarized by the confusion matrices in Figure 5.
Using the 50% rule, the CVSnet achieved sensitivity of 96%/89%, specificity of 80%/92%, accuracy of 89%/90% and balanced accuracy
of 88%/91% for the validation/testing sets. The vesselness filter-based approach reached 79%/61% sensitivity, 60%/77% specificity, accu-
racy of 70%/68% and 70%/69% balanced accuracy for the validation/testing sets. The CVSnet performed better than the vesselness filter,
but the head-to-head difference was not statistically significant (validation: McNemar's x2 = 3.50, P > 0.05; test: McNemar's x2 = 3.27,
TABLE 2 Demographic, clinical, and radiological characteristics of the patient cohort.Abbreviations: DIS, dissemination in space; IQR,interquartile range; PPMS, primary-progressive MS; RRMS, relapsing–remitting MS; SADs, systemic autoimmune disorders (systemic lupuserythematosus, antiphospholipid antibody syndrome, primary angiitis of the central nervous system, Sjögren syndrome, Behçet disease,sarcoidosis); SPMS, secondary-progressive MS.Others: neuromyelitis optica spectrum disorder, Susac syndrome, inflammatory amyloidangiopathy, HTLV1-associated myelopathy/tropical spastic paraparesis, small vessel disease
MS MS mimics Uncertain
Demographics
# patients 42 33 5
Brussels 15 18 3
Lausanne 18 10 2
Bethesda 9 5 -
Median age (IQR), years 44 (24) 45 (17) 48 (8)
Sex (female/male) 33/9 23/10 4/5
Disease subtype
RRMS 34 SADs 15 -
SPMS 6 Migraine 5 -
PPMS 2 Others 13 -
DIS MRI criteria
# (%) patients fulfilling criteria 42/42 (100%) 20/33 (61%) 5/5 (100%)
Manual CVS assessment
CVS+ lesions, median (range) 80% (52%–100%) 7% (0%–40%) 62% (20%–100%)
Uncertain: patient having uncertain diagnosis at the time of the study.
MAGGI ET AL. 7 of 11

P > 0.05). However, note that the CVSnet accuracy was statistically different from the NIR (validation: McNemar's x2 = 11.53, P = 6.85E-
04; test: McNemar's x2 = 5.79, P = 0.02) while the vesselness filter was not (validation: McNemar's x2 = 2.12, P = 0.15; test: McNemar's
x2 = 0.24, P = 0.63).
F IGURE 4 Percentage of CVS+ lesions for each patient, comparing the vesselness filter and CVSnet approaches with respect to manualassessment (ground truth). Different types of diagnoses: MS (circle), MS mimics (triangle), and uncertain diagnosis (square). Colors represent thedifferent scenarios for correct and incorrect disease prediction from both algorithms based on the 50% perivenular rule: green – both algorithmspredicted correctly; yellow – only CVSnet predicted correctly; orange – only vesselness filter predicted correctly; red – both algorithms predictedincorrectly; gray – uncertain diagnosis. The red dashed line indicates the 50% rule. While the percentages diverge somewhat from thoseestimated manually, the CVSnet approach tends to yield estimates leading to a diagnosis consistent with that derived from manual assessmentwith an ICC(3,1) = 0.83
F IGURE 5 Patient-wise classificationconfusion matrices. Differentiationbetween MS and MS mimics usingconfusion matrices for the vesselnessfilter and the proposed CVSnet, on thevalidation and test sets. Within eachconfusion matrix, the top left indicatesthe number of true positives (actual MSpatients predicted as MS), the bottomright true negatives, the top right falsepositives (MS mimics predicted as MS),
and the bottom right false negatives.Note that patients with uncertaindiagnoses are not shown
8 of 11 MAGGI ET AL.

4 | DISCUSSION
We propose a deep learning-based automated detection of the CVS differentiating MS from its mimics with high diagnostic sensitivity,
specificity and accuracy. CVSnet performed nearly as well as the previously obtained proportion of CVS+/CVS- lesions based on manual
rating, often achieving perfect discrimination between MS and its mimics,11,12,17 and is much faster compared with manual rating. Impor-
tantly, this method showed high performance across different scanner types and hospitals, strengthening its potential for clinical
applicability.
Our findings are particularly relevant considering that recent studies using manual CVS classification at clinical field strengths have shown
potential for application of the CVS imaging biomarker in clinical practice.11,13,15-18,28 Importantly, the most recent international panel for MS
diagnosis called for further research on this topic before considering inclusion of the CVS in future MS diagnostic criteria.3 A substantial limitation
to investigating the role of the CVS in large multicenter trials, and in subsequent clinical practice, is the lack of an automated reproducible and
nonoperator-dependent technique that can determine the frequency of CVS+ lesions in individual scans.
The proposed CVSnet uses deep learning and data augmentation strategies and shows the feasibility to achieve accurate results even
in the case of a relatively small dataset for this particular classification problem compared with classical computer vision problems, where
sample sizes are in the tens of thousands. While machine learning has already been proposed to predict various aspects of MS diagnosis
and prognosis,29,30 to our knowledge, this is the first attempt to use machine learning to automatically assess the CVS as diagnostic
biomarker.
Compared with our implementation of a recently proposed approach for automated CVS assessment based on vesselness filter and
centrality,20 the CVSnet showed significantly higher lesion-wise performance and was 20 times faster; in addition, considering the slight class
imbalance, CVSnet performed significantly above the NIR, while our vesselness filter-based methodology did not.
For several reasons, our results are not directly comparable with those reported in Dworkin et al.20 First, the sample size is larger in
our study. Second, our data comes from four different MRI machines while Dworkin et al used data from only one MRI scanner. Third,
exclusion criteria are different: Dworkin et al excluded periventricular lesions, whereas in our study we excluded only lesions not fulfilling
NAIMS criteria, that is, periventricular lesions were only excluded in our study if featuring multiple veins or confluent. Lastly, implementa-
tion differences (as discussed in Section 2) are also likely contribute to some differences. This study presents some limitations. Lesion seg-
mentation was performed manually, and thus the overall process (automated lesion segmentation and CVS classification) cannot yet be
considered fully automated. Of note, the available automatic lesion segmentation algorithms are often limited by false-positive and false-
negative lesions,31 and it is possible that the difference in CVS assessment performance obtained in our study with respect to
previous work20 rests upon the manually applied lesion inclusion/exclusion criteria in the current study. In addition to including larger num-
bers of scans from additional centers, future work should implement a fully automated method able to automatically apply lesion
inclusion/exclusion criteria for CVS assessment. Moreover, future work could investigate other lesion features (such as shape, ovoid
vs. spherical)29 that, together with the CVS, may increase the probability that a given WM lesion results from MS-related inflammatory
demyelination.
In conclusion, the CVSnet presented in this study showed high speed and accurate performance in differentiating MS from other pathological
conditions with similar abnormalities on MRI. Our study represents a step forward towards the translation of this promising imaging biomarker
into daily clinical practice.
ACKNOWLEDGEMENTS
The authors thank Dr Camillo Ribi (Division of Immunology and Allergology, Lausanne University Hospital), Dr Marie Théaudin, Dr Caroline Pot,
Dr Vasiliki Pantazou (Neuroimmunology Unit, Lausanne University Hospital), Dr Prochore S.Kamgang, Dr Monica Ferreira (Division of Internal
Medicine, Hôpital Brugmann, Brussels, Belgium), Dr Bernard Dachy, Dr Raphael Hourez (Neurology Department, Hôpital Brugmann, Brussels, Bel-
gium), Dr Gaetano Perrotta (Neurology Department, Hôpital Erasme, Brussels, Belgium) for their time and help in patient recruitment and manage-
ment; Géraldine le Goff (MS research nurse, Neuroimmunology Unit, Lausanne University Hospital) for helping with patients' clinical and
biological data collection; Julie Absil and Thierry Methens (Hôpital Erasme, Brussels,Belgium) for helping with MRI sequence implementation and
image post-processing; Jean-Baptiste Ledoux(TRM coordinator, service de “radiodiagnostic et radiologie interventionnelle,” Lausanne University
Hospital) for helping with MRI acquisition.
FUNDING INFORMATION
P.M. was supported for this research by the ECTRIMS Clinical Training Fellowship Program and by the University of Lausanne “relève
académique” grant. M.J.F. is a full-time employee of Siemens Healthcare AG. J.J. is supported from the “Centre d'Imagerie BioMédicale (CIBM) of
the University of Lausanne and the Leenaards and Jeantet Foundations". F.L.R. is supported by the European Union's Horizon 2020 research and
innovation program under the Marie Sklodowska-Curie project TRABIT (agreement No 765148). M.A., P.S. and D.S.R. are supported by the Intra-
mural Research Program of the National Institute of Neurological Disorders and Stroke, National Institutes of Health, Bethesda, Maryland. M.A. is
MAGGI ET AL. 9 of 11

supported by the National Multiple Sclerosis Society (NMSS) (FG 2093-A-1) and the Conrad N. Hilton Foundation (grant#17313), unrelated to
the present study. J.R. receives part of his salary from Siemens Healthcare AG and owns shares in Siemens Healthcare AG. T.K. is a full-time
employee of Siemens Healthcare AG and owns shares in Siemens Healthcare AG.
ORCID
Pietro Maggi https://orcid.org/0000-0003-1697-5585
Francesco La Rosa https://orcid.org/0000-0002-9224-4664
Martina Absinta https://orcid.org/0000-0003-0276-383X
Renaud Du Pasquier https://orcid.org/0000-0002-2786-3434
Daniel S. Reich https://orcid.org/0000-0002-2628-4334
Tobias Kober https://orcid.org/0000-0001-7598-9456
REFERENCES
1. Filippi M, Preziosa P, Banwell BL, et al. Assessment of lesions on magnetic resonance imaging in multiple sclerosis: practical guidelines. Brain. 2019;
142:1858-1875.
2. Solomon AJ, Corboy JR. The tension between early diagnosis and misdiagnosis of multiple sclerosis. Nat Rev Neurol. 2017;13:567-572.
3. Thompson AJ, Banwell BL, Barkhof F, et al. Diagnosis of multiple sclerosis: 2017 revisions of the McDonald criteria. Lancet Neurol. 2018;17:162-173.
4. Sati P, Oh J, Constable RT, et al. The central vein sign and its clinical evaluation for the diagnosis of multiple sclerosis: a consensus statement from the
North American Imaging in Multiple Sclerosis Cooperative. Nat Rev Neurol. 2016;12:714-722.
5. Adams CW. The onset and progression of the lesion in multiple sclerosis. J Neurol Sci. 1975;25:165-182.
6. Barnett MH, Prineas JW. Relapsing and remitting multiple sclerosis: pathology of the newly forming lesion. Ann Neurol. 2004;55:458-468.
7. Absinta M, Sati P, Reich DS. Advanced MRI and staging of multiple sclerosis lesions. Nat Rev Neurol. 2016;12:358-368.
8. Adams CW, Poston RN, Buk SJ. Pathology, histochemistry and immunocytochemistry of lesions in acute multiple sclerosis. J Neurol Sci. 1989;92:
291-306.
9. Sati P, Thomasson D, Li N, et al. Rapid, high-resolution, whole-brain, susceptibility-basedMRI of multiple sclerosis.Mult Scler. 2014;20(11):1464-1470.
10. Sati P, George IC, Shea CD, Gaitan MI, Reich DS. FLAIR*: a combined MR contrast technique for visualizing white matter lesions and parenchymal
veins. Radiology. 2012;265:926-932.
11. Maggi P, Absinta M, Grammatico M, et al. Central vein sign differentiates Multiple Sclerosis from central nervous system inflammatory vasculopathies.
Ann Neurol. 2018;83:283-294.
12. Tallantyre EC, Dixon JE, Donaldson I, et al. Ultra-high-field imaging distinguishes MS lesions from asymptomatic white matter lesions. Neurology.
2011;76:534-539.
13. Solomon AJ, Schindler MK, Howard DB, et al. “Central vessel sign” on 3 T FLAIR* MRI for the differentiation of multiple sclerosis from migraine. Ann
Clin Transl Neurol. 2015;3:82-87.
14. Wuerfel J, Sinnecker T, Ringelstein EB, et al. Lesion morphology at 7 Tesla MRI differentiates Susac syndrome from multiple sclerosis. Mult Scler.
2012;18:1592-1599.
15. Cortese R, Magnollay L, Tur C, et al. Value of the central vein sign at 3 T to differentiate MS from seropositive NMOSD. Neurology. 2018;90:e1183-
e1190.
16. Sinnecker T, Clarke MA, Meier D, et al. Evaluation of the central vein sign as a diagnostic imaging biomarker in multiple sclerosis. JAMA Neurol. 2019;
76(12):1446-1456.
17. Maggi P, Absinta M, Sati P, et al. The “central vein sign” in patients with diagnostic “red flags” for multiple sclerosis: A prospective multicenter 3 T
study. Mult Scler. 2019. https://doi.org/10.1177/1352458519876031
18. Mistry N, Abdel-Fahim R, Samaraweera A, et al. Imaging central veins in brain lesions with 3-T T2*-weighted magnetic resonance imaging differenti-
ates multiple sclerosis from microangiopathic brain lesions. Mult Scler. 2016;22:1289-1296.
19. Solomon AJ, Watts R, Ontaneda D, Absinta M, Sati P, Reich DS. Diagnostic performance of central vein sign for multiple sclerosis with a simplified
three-lesion algorithm. Mult Scler. 2018;24:750-757.
20. Dworkin JD, Sati P, Solomon A, et al. Automated integration of multimodal MRI for the probabilistic detection of the central vein sign in white matter
lesions. Am J Neuroradiol. 2018;39:1806-1813.
21. Erickson BJ, Korfiatis P, Kline TL, Akkus Z, Philbrick K, Weston AD. Deep learning in radiology: Does one size fit all? J Am Coll Radiol. 2018;15:
521-526.
22. LeCun Y, Kavukcuoglu K, Farabet C. Convolutional networks and applications in vision. Paper presented at: Proceedings of 2010 IEEE International
Symposium on Circuits and Systems; 30 May–2 June 2010.
23. Frangi AF, Niessen WJ, Vincken KL, Viergever MA. Multiscale vessel enhancement filtering. Paper presented at: Medical Image Computing and
Computer-Assisted Intervention — MICCAI'98; Berlin, Heidelberg.
24. Simonyan K, Zisserman A. Very deep convolutional networks for large-scale image recognition. arXiv. 2014;arXiv:1409.1556S.
25. Fartaria MJ, Jorge J, Maggi P, et al. An ensemble of 3D convolutional neural networks for central vein detection in white matter lesions. Peer-reviewed
abstract, 1st Conference on Medical Imaging with Deep Learning (MIDL 2018), Amsterdam, The Netherlands. https://openreview.net/forum?id=
HJu7eTojG.
26. Abadi M, Agarwal A, Barham P, et al. TensorFlow: large-scale machine learning on heterogeneous distributed systems. arXiv e-prints. 2016;arXiv:
1603.04467.
27. Shrout PE, Fleiss JL. Intraclass correlations: uses in assessing rater reliability. Psychol Bull. 1979;86:420-428.
28. Samaraweera AP, Clarke MA, Whitehead A, et al. The central vein sign in multiple sclerosis lesions is present irrespective of the T2* sequence at 3 T.
J Neuroimaging. 2017;27:114-121.
10 of 11 MAGGI ET AL.

29. Haike Zhang EA, Pongratz V, Mühlau M, Zimmer C, Wiestler B, Eichinger P. Predicting conversion from clinically isolated syndrome to multiple
sclerosis–An imaging-based machine learning approach. Neuroimage Clin. 2019;21:101593.
30. Marzullo A, Kocevar G, Stamile C, et al. Classification of multiple sclerosis clinical profiles via graph convolutional neural networks. Front Neurosci.
2019;13:594.
31. Fartaria MJ, Bonnier G, Roche A, et al. Automated detection of white matter and cortical lesions in early stages of multiple sclerosis. J Magn Reson
Imaging. 2016;43:1445-1454.
How to cite this article: Maggi P, Fartaria MJ, Jorge J, et al. CVSnet: A machine learning approach for automated central vein sign
assessment in multiple sclerosis. NMR in Biomedicine. 2020;33:e4283. https://doi.org/10.1002/nbm.4283
MAGGI ET AL. 11 of 11