Embed Size (px)
Citation preview

Agenda Item 5 CX/CF 14/8/5
February 2014
JOINT FAO/WHO FOOD STANDARDS PROGRAMME
CODEX COMMITTEE ON CONTAMINANTS IN FOODS
Eighth Session The Hague, The Netherlands, 31 March – 4 April 2014
PROPOSED DRAFT REVISION OF THE MAXIMUM LEVELS FOR LEAD IN SELECTED COMMODITIES IN THE GENERAL STANDARD FOR CONTAMINANTS AND TOXINS IN FOOD AND FEED (CODEX STAN 193-1995)
(AT STEP 4)
(Prepared by the Electronic Working Group led by the United States of America)
Codex Members and Observers wishing to submit comments at Step 3 on the proposed draft revision of the maximum levels for lead in the above commodities as stated in points 1-17 of paragraph 65 of the Summary and Recommendations, including possible implications for their economic interests, should do so in conformity with the Uniform Procedure for the Elaboration of Codex Standards and Related Texts (Codex Alimentarius Commission Procedural Manual) before 10 March 2014. Comments should be directed:
to:
Mrs Tanja Åkesson Codex Contact Point Ministry of Economic Affairs P.O. Box 20401 2500 EK The Hague The Netherlands E-mail: [email protected]
with a copy to:
Secretariat, Codex Alimentarius Commission, Joint FAO/WHO Food Standards Programme, Viale delle Terme di Caracalla, 00153 Rome, Italy E-mail: [email protected]
Note: Supportive information is presented in paragraphs 1 through 64 and Appendix I and is not subject to comments at Step 3. In addition, Codex members and observers may wish to provide their views on the recommendation in paragraph 66.
BACKGROUND
1. The 6th session of the Committee on Contaminants in Foods (CCCF) (March 2012), agreed to establish an electronic Working Group (EWG) led by the United States of America to revise the maximum levels (MLs) for lead in fruit juices, milk and milk products, infant formula, canned fruits and vegetables, fruits, and cereal grains (except buckwheat, cañihua and quinoa) in the General Standard for Contaminants and Toxins in Food and Feed (GSCTFF). The Committee also agreed to consider consolidating the MLs for canned fruit and vegetable products.1
2. The 7th session of the CCCF2 (April 2013) agreed to the following:
a. To retain the current MLs of 0.02 mg/kg for milks, 0.2 mg/kg for cereals, and 0.05 mg/kg for juices and nectars from berries and other small fruits, ready-to-drink.
b. To postpone consideration of the proposed draft ML of 0.01 mg/kg for infant formula to the 8th session of CCCF to allow time for interested countries to submit additional data for analysis, with the understanding that if no additional data were made available, the Committee would consider the proposed lower ML for adoption at the 8th session.
1 REP12/CF, paras. 126-127. 2 REP13/CF, paras. 41-21 and Appendix II.
E

CX/CF 14/8/5 2
c. To advance a proposed draft ML of 0.03 mg/kg for fruit juices and nectars, ready-to-drink (excluding juices from berries and other small fruits); a proposed draft ML of 0.1 mg/kg for canned fruits, including canned mixed fruits (excluding canned berry and other small fruits); and a proposed draft ML of 0.1 mg/kg for canned vegetables, including canned mixed vegetables (excluding canned brassica vegetables, canned leafy vegetables and canned legume vegetables) to the 36th session of the Codex Alimentarius Commission for adoption at Step 5/8.
3. The 36th session the Commission (July 2013) agreed to adopt the MLs for fruit juice and canned fruits and vegetables at Step 5, with the understanding that countries that had intervened to object to adoption at Step 5/8 commit to submit data to the GEMS/Food database3 within a year, to allow CCCF to further consider the revision of the MLs in 2015 for submission to the 38th session of the Commission4.
4. The 7th session of the CCCF also agreed to reestablish the EWG led by the United States of America to continue with the review of MLs for lead in fruits, vegetables, milk products and infant formula, follow-on formula and formula for special medical purposes for infants56. The list of participants can be found in Appendix II.
5. The United States of America prepared the draft paper with the technical assistance of the Secretariat of the Food and Agriculture Organization (FAO)/World Health Organization (WHO) Joint Expert Committee on Food Additives (JECFA). Due to the length of time needed for data submission and analysis, the EWG reviewed only one draft of the paper.
INTRODUCTION
6. As a reminder, this work was undertaken in response to the new toxicological evaluation of lead in food conducted by JECFA at its 73rd meeting, at the request of CCCF. In the evaluation7, JECFA stated that exposure to lead is associated with a wide range of effects, including various neurodevelopmental effects, impaired renal function, hypertension, impaired fertility and adverse pregnancy outcomes. Because of the neurodevelopmental effects, foetuses, infants and children are the subgroups that are most sensitive to lead. JECFA withdrew the previously established provisional tolerable weekly intake (PTWI) of 25 μg/kg bw and concluded that it was not possible to establish a new PTWI that would be considered to be health protective. JECFA also concluded that, in populations with prolonged dietary exposures to higher levels of lead, measures should be taken to identify major contributing sources and foods and, if appropriate, to identify methods of reducing dietary exposure that are commensurate with the level of risk reduction.
7. Since no safe level of lead has been identified by JECFA, the focus of the paper was to review occurrence data to determine what percentage of samples can meet proposed new MLs. The paper did not propose MLs based on levels of exposure or on consumption. This approach is consistent with the approach presented previously8.
WORK PROCESS
8. The United States of America requested that EWG members submit data on lead levels in fruits, vegetables, milk products and infant formula, follow-up formula and formula for special medical purposes from the last 10 years to the WHO GEMS/Food database9. The collection, organization, and initial categorization of data were performed by the JECFA Secretariat, in consultation with the EWG, and based on the GEMS/Food database. Analysis of results and decisions about which data were excluded, how data should be presented, and what recommendations should be included were made by the EWG.
9. The first step in analysis of the data was to remove data from our initial extraction that did not meet basic criteria. For example, for fruits and vegetables, we included unprocessed foods, and removed processed foods such as canned goods, jams, and compotes. This process left us with our raw dataset.
10. The second step was to prepare a second dataset based on the limit of quantitation (LOQ) of the analytical method associated with each sample (LOQ-limited dataset). We found that many results in the raw dataset were obtained with methods with a reported LOQ higher than the Codex ML for that food. Further, some of these samples had results reported as nondetects (NDs). NDs obtained with a method with an LOQ higher than the ML may actually be higher than the ML. Furthermore, methods with an LOQ higher than the ML cannot accurately determine whether a food meets the ML. Therefore, for each food category, we prepared a second dataset excluding all results obtained with a method with an LOQ higher than the ML. We also excluded samples that were entered in the GEMS database without an LOQ, as we could not evaluate whether these samples met the LOQ criteria10. Since we believe this dataset is more informative than the raw dataset, which includes results obtained with methods with LOQs higher than the ML, our conclusions are based primarily on the LOQ-limited dataset.
3 Global Environment Monitoring System-Food Contamination Monitoring and Assessment Programme, http://www.who.int/foodsafety/chem/gems/en. 4 REP13/CAC, para 79. 5 REP13/CF, paras. 39-40. 6 In the original discussion paper proposing reevaluation of lead MLs (6th CCCF, CX/CF 12/6/13), the only vegetable groups recommended for reevaluation
were “root and tuber vegetables” and “pulses.” However, at the 6th CCCF, some delegations recommended consideration of other vegetables, such as bulb vegetables and fruiting vegetables. Also, at the 7th CCCF, the Committee recognized the importance of analyzing non-canned vegetables, since some non-canned vegetables have MLs > 0.1 mg/kg (the proposed revised ML for canned vegetables) (CX/CF 13/7/5). Therefore, this document considers all vegetable categories included in the GSCTFF, with the exception of pulses, which will be considered in future work.
7 JECFA. Evaluation of Certain Food Additives and Contaminants. Seventy-third report of the Joint FAO/WHO Expert Committee on Food Additives. WHO Technical Report Series 960.
8 CX/CF 12/6/13, CX/CF13/7/5. 9 Data provided to the GEMS/Food database may come from each country’s domestic production and imported foods. 10 This exclusion may remove a small number of samples with valid results. The EWG determined that this risk was offset by the benefits of having a

CX/CF 14/8/5 3
11. The final step in the analysis was to prepare tables showing the percentage11 of lead level results in the LOQ-limited dataset that meet the current and hypothetical lower MLs and to make recommendations based on those percentages. We attempted to choose a percentage value that would be consistent with current occurrence data and would provide some reduction in lead levels, but without having too significant an impact on international trade. There was no specific rule to identify the appropriate cut-off value, but in general, we recommended reductions in MLs when the percentage of excluded samples was less than 5 percent.
12. Both the raw and LOQ-limited datasets contained NDs, which were treated as zeros in the analysis. In exposure analyses, NDs may be replaced by such values as zero, or a value between zero and the limit of detection (LOD), to provide a more conservative indicator of exposure. In this project, we are not conducting an exposure analysis, but determining what percentage of samples can meet current or proposed new MLs. In this case, replacing NDs by a value between zero and the LOD would underestimate the ability of foods to meet the proposed MLs. Therefore, we replaced NDs with zeros.
ANALYSIS OF INDIVIDUAL FOODS
Fruits
13. The GSCTFF includes MLs for six fruit categories: assorted (sub)tropical fruits, edible peel; assorted (sub)tropical fruits, inedible peel; berries and other small fruits; citrus fruits; pome fruits; and stone fruits. The EWG evaluated each category separately. Although there is no category for dried fruit, the EWG also analyzed dried fruit for informational purposes, because higher lead levels have been associated with this category in the past. We included products that met the criteria in the GSCTFF and the Classification of Foods and Animal Feeds (CAC/MISC 4-1993). We excluded products that appear to have been cooked or otherwise processed, such as foods described as compotes, fruit sauces, jams or other spreads, candied, and chocolate coated. Mixtures or unspecified fruits were not included because there is no category for mixed or unspecified fruits in the GSCTFF.
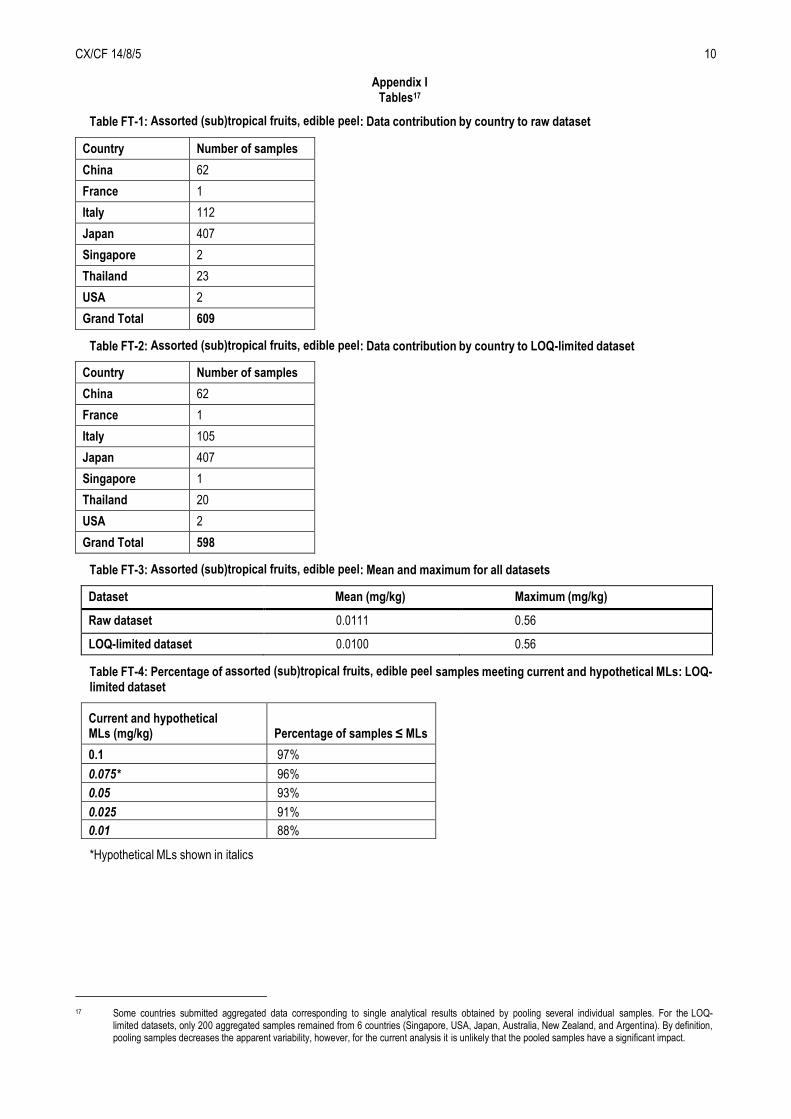
14. Assorted (sub)tropical fruits, edible peel. The assorted (sub)tropical fruits, edible peel raw dataset consisted of 609 results from the GEMS/Food database for samples collected and/or analyzed between 2001 and 2013. We excluded 11 samples with an LOQ > 0.1 mg/kg or no reported LOQ to obtain the LOQ-limited set of 598 samples. Tables FT-1 and FT-2 (in Appendix I) show the breakdown by country of the raw dataset and the LOQ-limited dataset, and Table FT-3 shows the mean and maximum lead levels associated with both datasets. Table FT-4 shows the percentage of assorted (sub)tropical fruit, edible peel samples meeting current and hypothetical MLs for the LOQ-limited dataset.
15. For assorted subtropical fruits, edible peel, 97 percent of the samples in the LOQ-limited dataset (i.e., results obtained with a method with an LOQ ≤ 0.1 mg/kg) met the current Codex ML of 0.1 mg/kg (Table FT-4). This table also indicates that 96 percent of samples may meet a hypothetical ML of 0.075 mg/kg12 and that 93 percent of samples may meet a hypothetical ML of 0.05 mg/kg. Thus, lowering the ML to the hypothetical level of 0.075 mg/kg would eliminate approximately 4 percent of the samples in international trade, while lowering the ML to the hypothetical level of 0.05 mg/kg would eliminate approximately 7 percent of the samples in international trade. The EWG recommends maintaining the current ML of 0.1 mg/kg.
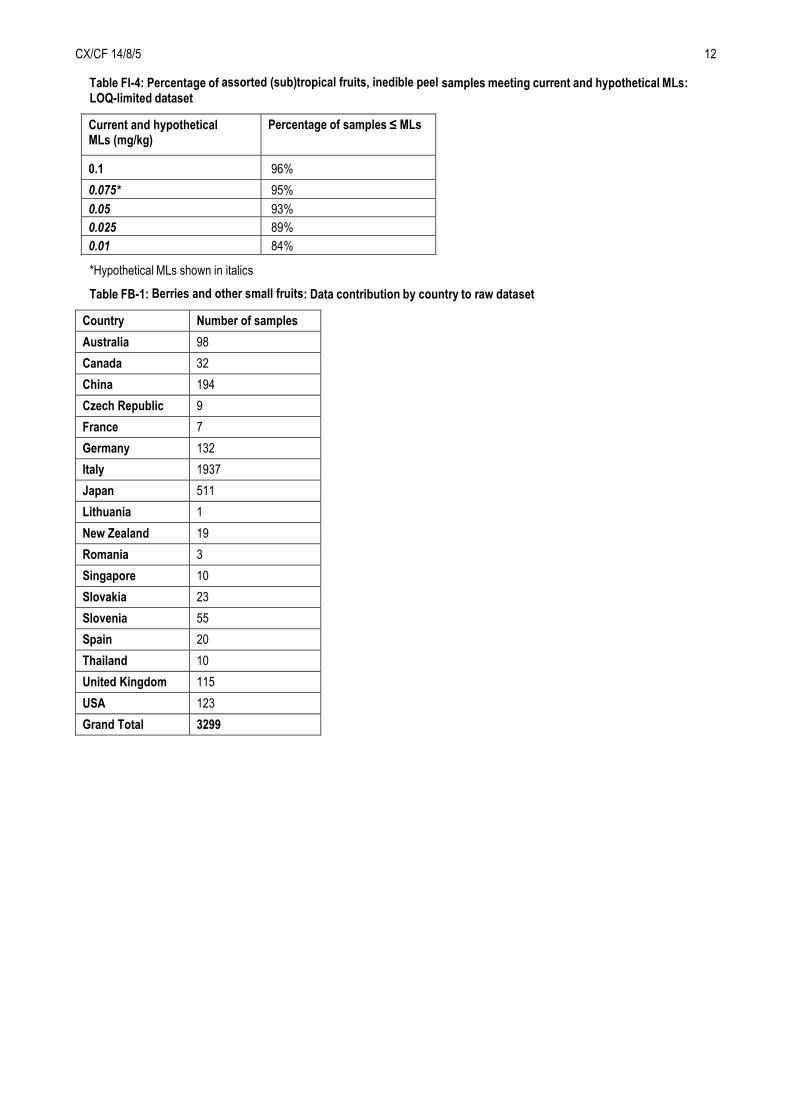
16. Assorted (sub)tropical fruits, inedible peel. The assorted (sub)tropical fruits, inedible peel, raw dataset consisted of 1834 results from the GEMS/Food database for samples collected and/or analyzed between 1998 and 2013. We excluded 92 samples with an LOQ > 0.1 mg/kg or no reported LOQ to obtain the LOQ-limited set of 1742 samples. Tables FI-1 and FI-2 (in Appendix I) show the breakdown by country of the raw dataset and the LOQ-limited dataset, and Table FI-3 shows the mean and maximum lead levels associated with both datasets. Table FI-4 shows the percentage of assorted (sub)tropical fruit, inedible peel samples meeting current and hypothetical MLs for the LOQ-limited dataset.
17. For assorted subtropical fruits, inedible peel, 96 percent of the samples in the LOQ-limited dataset (i.e., results obtained with a method with an LOQ ≤ 0.1 mg/kg) met the current Codex ML of 0.1 mg/kg (Table FI-4). This table also indicates that 95 percent of samples may meet a hypothetical ML of 0.075 mg/kg and that 93 percent of samples may meet a hypothetical ML of 0.05 mg/kg. Thus, lowering the ML to the hypothetical level of 0.075 mg/kg would eliminate approximately 5 percent of the samples in international trade, while lowering the ML to the hypothetical level of 0.05 mg/kg would eliminate approximately 7 percent of the samples in international trade. The EWG recommends maintaining the current ML of 0.1 mg/kg.
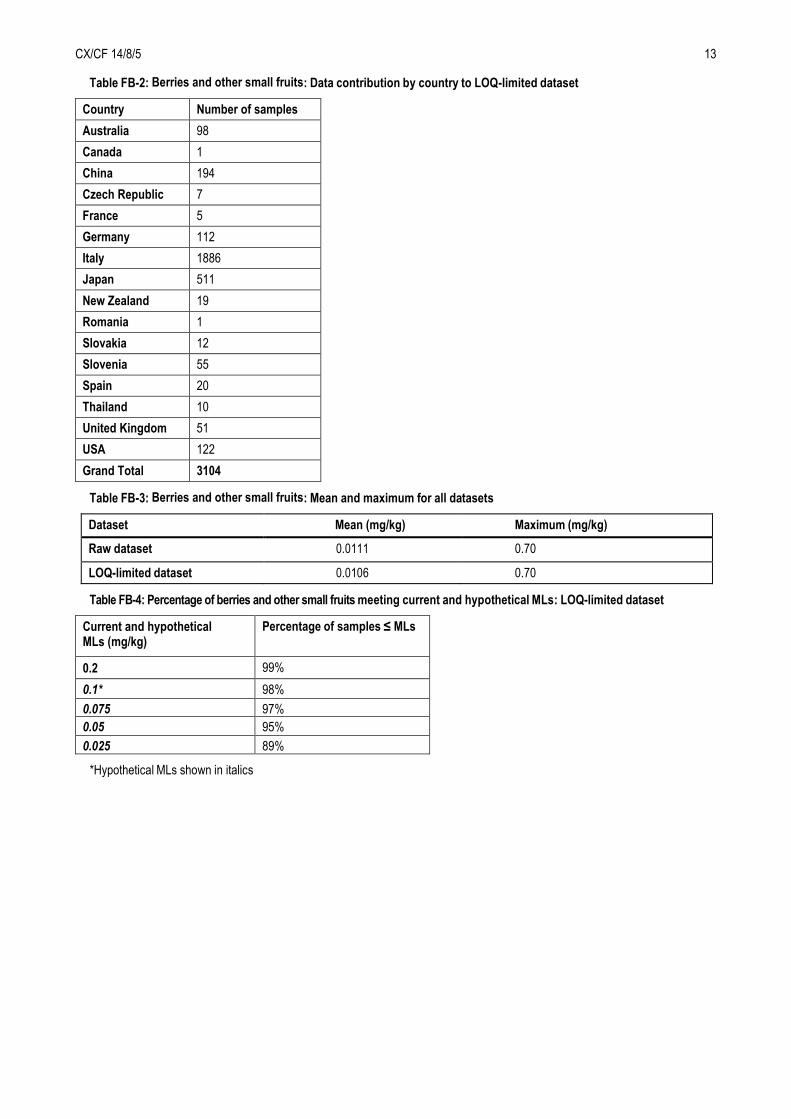
18. Berries and other small fruits. The berries and other small fruits raw dataset consisted of 3299 results from the GEMS/Food database for samples collected and/or analyzed between 1997 and 2013. We excluded 195 samples with an LOQ > 0.2 mg/kg or no reported LOQ to obtain the LOQ-limited set of 3104 samples. Tables FB-1 and FB-2 (in Appendix I) show the breakdown by country of the raw dataset and the LOQ-limited dataset, and Table FB-3 shows the mean and maximum lead levels associated with both datasets. Table FB-4 shows the percentage of berry and other small fruit samples meeting current and hypothetical MLs for the LOQ-limited dataset.
consistent approach to an LOQ requirement and by the possibility that including samples with no reported LOQ could have resulted in inclusion of samples that did not meet our LOQ requirement.
11 These tables are calculated with the Excel rank function. Rank function results are slightly different than results calculated with the Excel percentile.exc function, which is considered more accurate. However, the rank function has the advantage of allowing us to view the impact of specific hypothetical MLs, and therefore was chosen as more appropriate for this document.
12 The GSCTFF states t ha t numerical values for MLs should preferably be regular figures in a geometric scale (e.g., 0.01, 0.02); therefore, values like 0.075 and 0.025 are not desirable as MLs. They are included here because they are useful for showing changes in feasibility.
CX/CF 14/8/5 4
19. For berries and other small fruits, 99 percent of the samples in the LOQ-limited dataset (i.e., results obtained with a method with an LOQ ≤ 0.2 mg/kg) met the current Codex ML of 0.2 mg/kg (Table FB-4). This table also indicates that 98 percent of samples may meet a hypothetical ML of 0.1 mg/kg, 97 percent of samples may meet a hypothetical ML of 0.075 mg/kg, and that 95 percent of samples may meet a hypothetical ML of 0.05 mg/kg. Thus, lowering the ML to the hypothetical level of 0.1 mg/kg would eliminate approximately 2 percent of the samples in international trade, lowering the ML to the hypothetical level of 0.075 mg/kg would eliminate approximately 3 percent of the samples in international trade, and lowering the ML to the hypothetical level of 0.05 mg/kg would eliminate approximately 5 percent of the samples in international trade. These results suggest that the higher ML for berries and other small fruits may not be necessary. The EWG tentatively proposes lowering the ML to 0.1 mg/kg.
20. Citrus fruits. The citrus fruits raw dataset consisted of 1396 results from the GEMS/Food database for samples collected and/or analyzed between 2000 and 2013. We excluded 113 samples with an LOQ > 0.1 mg/kg or no reported LOQ to obtain the LOQ-limited set of 1283 samples. Tables FC-1 and FC-2 (in Appendix I) show the breakdown by country of the raw dataset and the LOQ-limited dataset, and Table FC-3 shows the mean and maximum lead levels associated with both datasets. Table FC-4 shows the percentage of citrus fruit samples meeting current and hypothetical MLs for the LOQ-limited dataset.
21. For citrus fruits, 97 percent of the samples in the LOQ-limited dataset (i.e., results obtained with a method with an LOQ ≤ 0.1 mg/kg) met the current Codex ML of 0.1 mg/kg (Table FC-4). This table also indicates that 94 percent of samples may meet a hypothetical ML of 0.075 mg/kg and that 91 percent of samples may meet a hypothetical ML of 0.05 mg/kg. Thus, lowering the ML to the hypothetical level of 0.075 mg/kg would eliminate approximately 6 percent of the samples in international trade, while lowering the ML to the hypothetical level of 0.05 mg/kg would eliminate approximately 9 percent of the samples in international trade. The EWG recommends maintaining the current ML of 0.1 mg/kg.
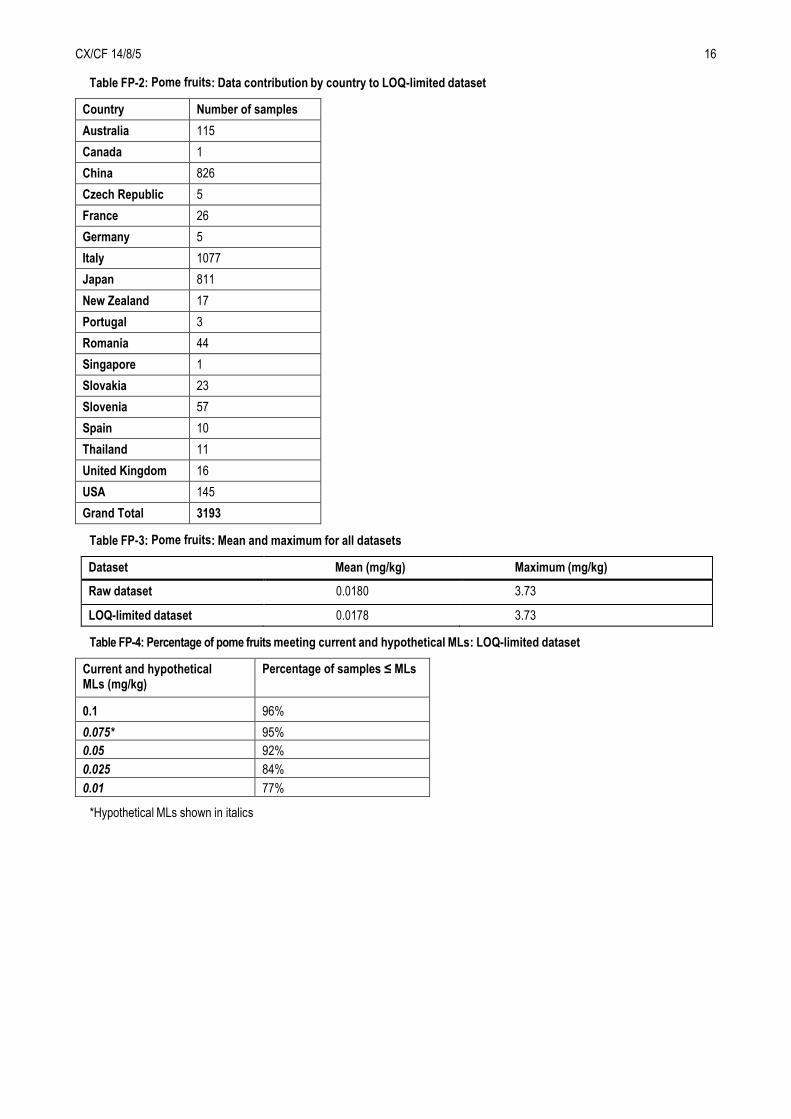
22. Pome fruits. The pome fruits raw dataset consisted of 3407 results from the GEMS/Food database for samples collected and/or analyzed between 1998 and 2013. We excluded 214 samples with an LOQ > 0.1 mg/kg or no reported LOQ to obtain the LOQ-limited set of 3193 samples. Tables FP-1 and FP-2 (in Appendix I) show the breakdown by country of the raw dataset and the LOQ-limited dataset, and Table FP-3 shows the mean and maximum lead levels associated with both datasets. Table FP-4 shows the percentage of pome fruit samples meeting current and hypothetical MLs for the LOQ-limited dataset.
23. For pome fruits, 96 percent of the samples in the LOQ-limited dataset (i.e., results obtained with a method with an LOQ ≤ 0.1 mg/kg) met the current Codex ML of 0.1 mg/kg (Table FP-4). This table also indicates that 95 percent of samples may meet a hypothetical ML of 0.075 mg/kg and that 92 percent of samples may meet a hypothetical ML of 0.05 mg/kg. Thus, lowering the ML to the hypothetical level of 0.075 mg/kg would eliminate approximately 5 percent of the samples in international trade, while lowering the ML to the hypothetical level of 0.05 mg/kg would eliminate approximately 8 percent of the samples in international trade. The EWG recommends maintaining the current ML of 0.1 mg/kg.
24. Stone fruits. The stone fruits raw dataset consisted of 1611 results from the GEMS/Food database for samples collected and/or analyzed between 1997 and 2013. We excluded 123 samples with an LOQ > 0.1 mg/kg or no reported LOQ to obtain the LOQ-limited set of 1488 samples. Tables FS-1 and FS-2 (in Appendix I) show the breakdown by country of the raw dataset and the LOQ-limited dataset, and Table FS-3 shows the mean and maximum lead levels associated with both datasets. Table FS-4 shows the percentage of stone fruit samples meeting current and hypothetical MLs for the LOQ-limited dataset.
25. For stone fruits, 96 percent of the samples in the LOQ-limited dataset (i.e., results obtained with a method with an LOQ ≤ 0.1 mg/kg) met the current Codex ML of 0.1 mg/kg (Table FS-4). This table also indicates that 94 percent of samples may meet a hypothetical ML of 0.075 mg/kg and that 91 percent of samples may meet a hypothetical ML of 0.05 mg/kg. Thus, lowering the ML to the hypothetical level of 0.075 mg/kg would eliminate approximately 6 percent of the samples in international trade, while lowering the ML to the hypothetical level of 0.05 mg/kg would eliminate approximately 9 percent of the samples in international trade. The EWG recommends maintaining the current ML of 0.1 mg/kg.
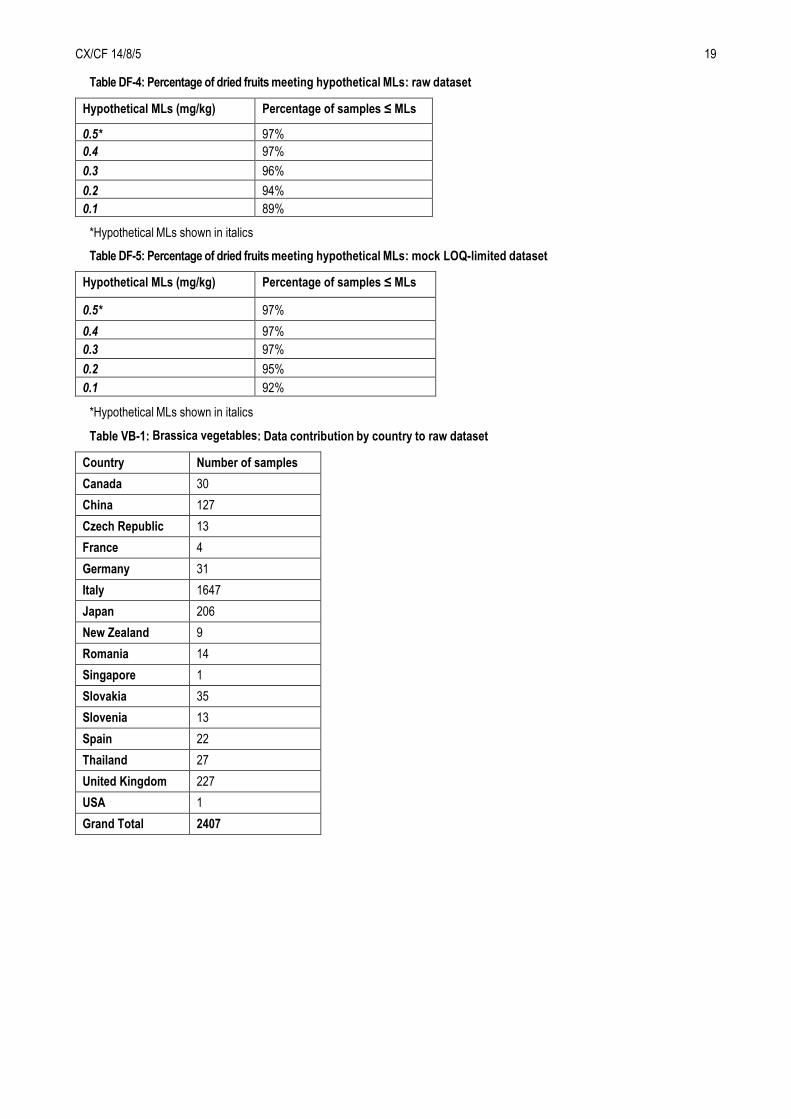
26. Dried fruits. Because elevated lead levels have been associated with dried fruit, the EWG also analyzed dried fruit, although there is no category for dried fruit in the GSCTFF. The dried fruits raw dataset consisted of 790 results from the GEMS/Food database for samples collected and/or analyzed between 1998 and 2013. Because there is no ML for dried fruit, we analyzed the ability of the raw dataset to meet hypothetical MLs. We also assigned a mock LOQ limit of 0.2 mg/kg (corresponding with the ML of 0.2 mg/kg for berries and small fruits) to allow analysis of a mock LOQ-limited dataset. We excluded 147 samples with an LOQ > 0.2 mg/kg or no reported LOQ to obtain the mock LOQ-limited set of 643 samples. Tables DF-1 and DF-2 (in Appendix I) show the breakdown by country of the raw dataset and the mock LOQ-limited dataset, and Table DF-3 shows the mean and maximum lead levels associated with both datasets. Tables DF-4 and DF-5 show the percentage of dried fruit samples meeting current and hypothetical MLs for the raw dataset and the mock LOQ-limited dataset.
27. For dried fruits, 97 percent of the samples in the raw dataset could meet hypothetical MLs of 0.4 to 0.5 mg/kg, 96 percent could meet a hypothetical ML of 0.3 mg/kg, 94 percent could meet a hypothetical ML of 0.2 mg/kg, and 89 percent could meet a hypothetical ML of 0.1 mg/kg. Also, 97 percent of the samples in the mock LOQ-limited dataset could meet hypothetical MLs of 0.3 to 0.5 mg/kg, 95 percent could meet a hypothetical ML of 0.2 mg/kg, and 92 percent could meet a hypothetical ML of 0.1 mg/kg.
28. The terms of reference of the EWG were to look at existing MLs. The EWG has included this section on dried fruits in case the Committee wishes to discuss whether it should pursue new work to set an ML(s) for dried fruits.

CX/CF 14/8/5 5
Vegetables
29. The EWG evaluated seven vegetable categories in the GSCTFF: brassica vegetables; bulb vegetables; fruiting vegetables, cucurbits; fruiting vegetables, other than cucurbits; leafy vegetables; legume vegetables; and root and tuber vegetables. The EWG evaluated each category separately. Although there is no category for stalk and stem vegetables, the EWG also analyzed stalk and stem vegetables for informational purposes, because data on this category was available in the GEMS/Food database. We included products that met the criteria in the GSCTFF and the Classification of Foods and Animal Feeds. We excluded products that appear to have been cooked or otherwise processed, such as foods described as canned, sauces, preserved, salted, marinated, and dried (with the exception of bulb vegetables, as discussed in paragraph 32). Mixtures or unspecified vegetables were not included because there is no category for mixed or unspecified vegetables in the GSCTFF.
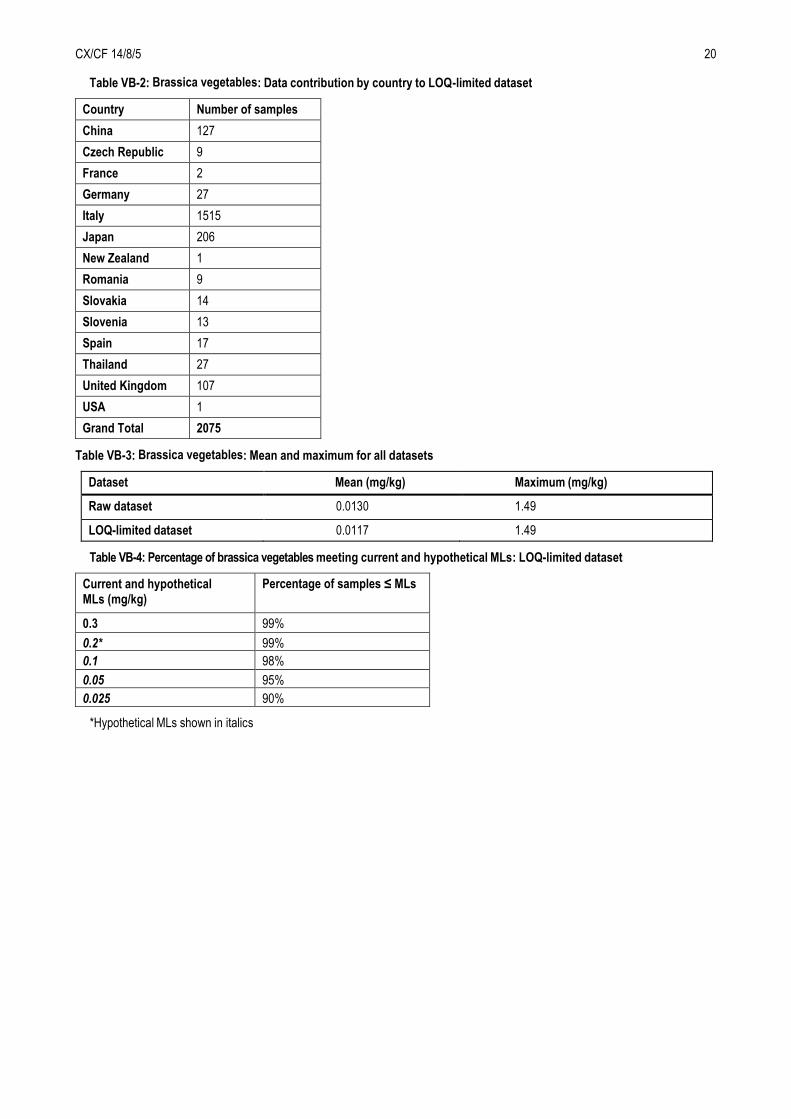
30. Brassica vegetables. The brassica vegetables raw dataset consisted of 2407 results from the GEMS/Food database for samples collected and/or analyzed between 2001 and 2013. (This category excludes kale, as noted in the GSCTFF). We excluded 332 samples with an LOQ > 0.3 mg/kg or no reported LOQ to obtain the LOQ-limited set of 2075 samples. Tables VB-1 and VB-2 (in Appendix I) show the breakdown by country of the raw dataset and the LOQ-limited dataset, and Table VB-3 shows the mean and maximum lead levels associated with both datasets. Table VB-4 shows the percentage of brassica vegetable samples meeting current and hypothetical MLs for the LOQ-limited dataset.
31. For brassica vegetables, 99 percent of the samples in the LOQ-limited dataset (i.e., results obtained with a method with an LOQ ≤ 0.3 mg/kg) met the current Codex ML of 0.3 mg/kg (Table VB-4). This table also indicates that 99 percent of samples may meet a hypothetical ML of 0.2 mg/kg, 99 percent of samples may meet a hypothetical ML of 0.1 mg/kg, and 95 percent may meet a hypothetical ML of 0.05 mg/kg. Thus, lowering the ML to the hypothetical level of 0.1 – 0.2 mg/kg would eliminate approximately 1 percent of the samples in international trade, while lowering the ML to the hypothetical level of 0.05 mg/kg would eliminate approximately 5 percent of the samples in international trade. These results suggest that the higher ML for brassica vegetables may not be necessary. The EWG tentatively proposes lowering the ML to 0.1 mg/kg.
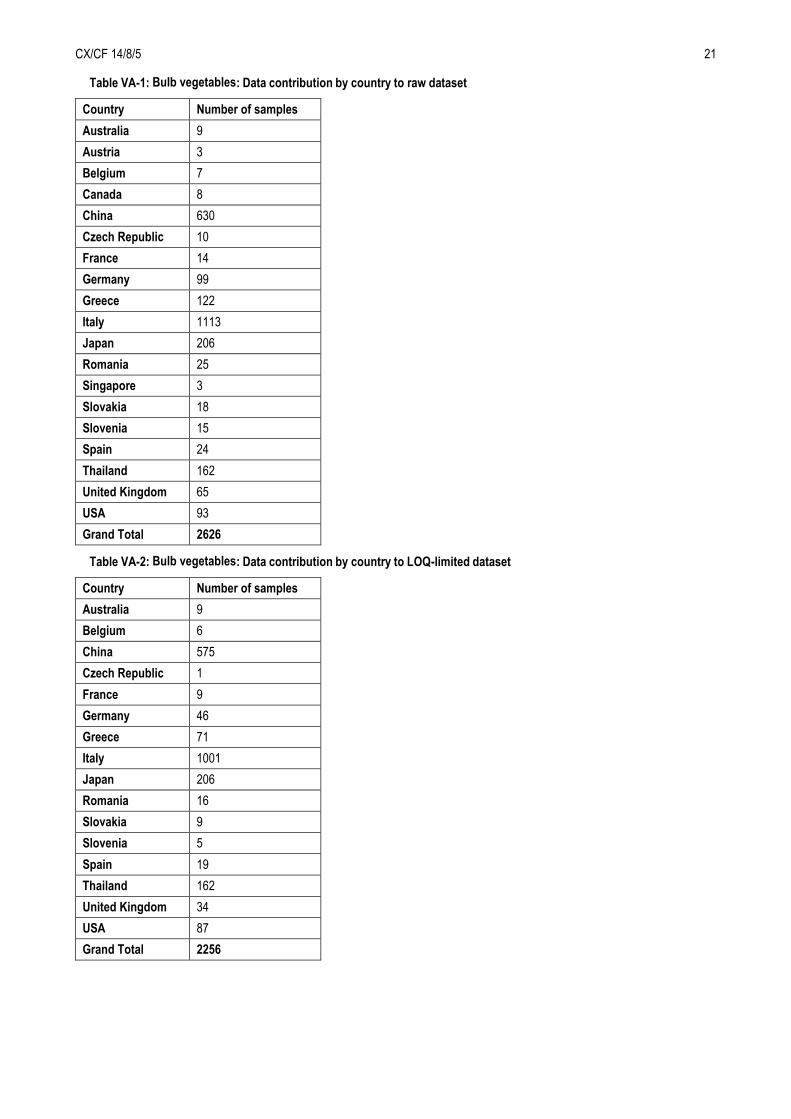
32. Bulb vegetables. For bulb vegetables, we included dried products because the description of bulb vegetables in the Classification of Foods and Animal Feeds includes dry onions and garlic. The bulb vegetables raw dataset consisted of 2626 results from the GEMS/Food database for samples collected and/or analyzed between 2000 and 2013. We excluded 370 samples with an LOQ > 0.1 mg/kg or no reported LOQ to obtain the LOQ-limited set of 2256 samples. Tables VA-1 and VA-2 (in Appendix I) show the breakdown by country of the raw dataset and the LOQ-limited dataset, and Table VA-3 shows the mean and maximum lead levels associated with both datasets. Table VA-4 shows the percentage of bulb vegetable samples meeting current and hypothetical MLs for the LOQ-limited dataset.
33. For bulb vegetables, 93 percent of the samples in the LOQ-limited dataset (i.e., results obtained with a method with an LOQ ≤ 0.1 mg/kg) met the current Codex ML of 0.1 mg/kg (Table VA-4). This table also indicates that 90 percent of samples may meet a hypothetical ML of 0.075 mg/kg and 87 percent of samples may meet a hypothetical ML of 0.05 mg/kg. Thus, lowering the ML to the hypothetical level of 0.075 mg/kg would eliminate approximately 10 percent of the samples in international trade, while lowering the ML to the hypothetical level of 0.05 mg/kg would eliminate approximately 13 percent of the samples in international trade. The EWG recommends maintaining the current ML of 0.1 mg/kg.
34. Fruiting vegetables, cucurbits. The fruiting vegetables, cucurbits, raw dataset consisted of 1952 results from the GEMS/Food database for samples collected and/or analyzed between 1998 and 2013. We excluded 208 samples with an LOQ > 0.1 mg/kg or no reported LOQ to obtain the LOQ-limited set of 1744 samples. Tables VC-1 and VC-2 (in Appendix I) show the breakdown by country of the raw dataset and the LOQ-limited dataset, and Table VC-3 shows the mean and maximum lead levels associated with both datasets. Table VC-4 shows the percentage of fruiting vegetable, cucurbit samples meeting current and hypothetical MLs for the LOQ-limited dataset.
35. For fruiting vegetables, cucurbits, 99 percent of the samples in the LOQ-limited dataset (i.e., results obtained with a method with an LOQ ≤ 0.1 mg/kg) met the current Codex ML of 0.1 mg/kg (Table VC-4). This table also indicates that 98 percent of samples may meet a hypothetical ML of 0.075 mg/kg and 97 percent of samples may meet a hypothetical ML of 0.05 mg/kg. Thus, lowering the ML to the hypothetical level of 0.075 mg/kg would eliminate approximately 2 percent of the samples in international trade, while lowering the ML to the hypothetical level of 0.05 mg/kg would eliminate approximately 3 percent of the samples in international trade. The EWG tentatively proposes lowering the ML to 0.05 mg/kg.
36. Fruiting vegetables, other than cucurbits. In our initial analysis, we excluded mushrooms (specifically cultivated cultivars of Agaricus spp.), but considered including other mushrooms and fungi, based on our interpretations of the notes/remarks section in the GSCTFF (which excludes mushrooms) and the definitions of fungi and mushrooms in Standard for Edible Fungi and Fungust Products (CODEX STAN 38-1981) and the Classification of Foods and Animal Feeds. We found that inclusion of fungi and non-Agaricus mushrooms markedly decreased ML achievability for this category. We therefore decided the mushroom exclusion in the GSCTFF should be interpreted more broadly, and that it would be appropriate to exclude all fungi and edible mushrooms for our analysis of fruiting vegetables, other than cucurbits.

CX/CF 14/8/5 6
37. The fruiting vegetables, other than cucurbits, raw dataset consisted of 2898 results from the GEMS/Food database for samples collected and/or analyzed between 1997 and 2013. We excluded 282 samples with an LOQ > 0.1 mg/kg or no reported LOQ to obtain the LOQ-limited set of 2616 samples. Tables VO-1 and VO-2 (in Appendix I) show the breakdown by country of the raw dataset and the LOQ-limited dataset, and Table VO-3 shows the mean and maximum lead levels associated with both datasets. Table VO-4 shows the percentage of fruiting vegetable, other than cucurbit, samples meeting current and hypothetical MLs for the LOQ-limited dataset.
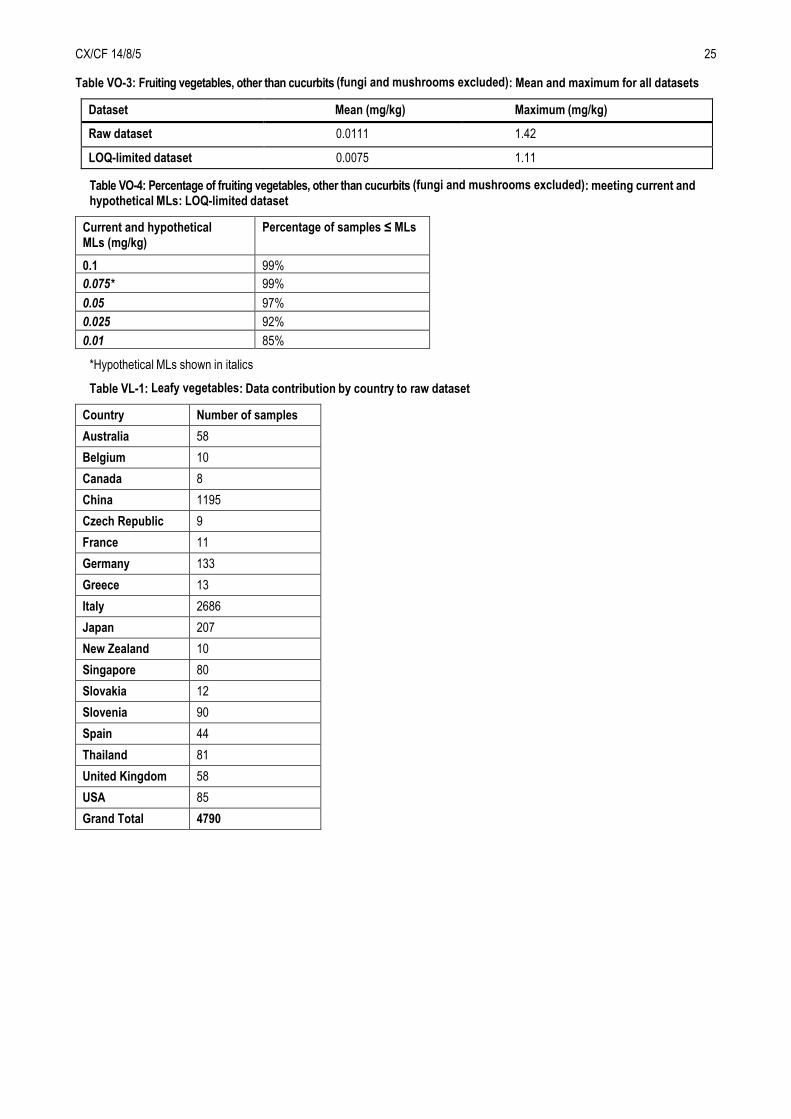
38. For fruiting vegetables, other than cucurbits, 99 percent of the samples in the LOQ-limited dataset (i.e., results obtained with a method with an LOQ ≤ 0.1 mg/kg) met the current Codex ML of 0.1 mg/kg (Table VO-4). This table also indicates that 99 percent of samples may meet a hypothetical ML of 0.075 mg/kg and 97 percent of samples may meet a hypothetical ML of 0.05 mg/kg. Thus, lowering the ML to the hypothetical level of 0.075 mg/kg would eliminate approximately 1 percent of the samples in international trade, while lowering the ML to the hypothetical level of 0.05 mg/kg would eliminate approximately 3 percent of the samples in international trade. The EWG tentatively proposes lowering the ML to 0.05 mg/kg, but excluding fungi and mushrooms.
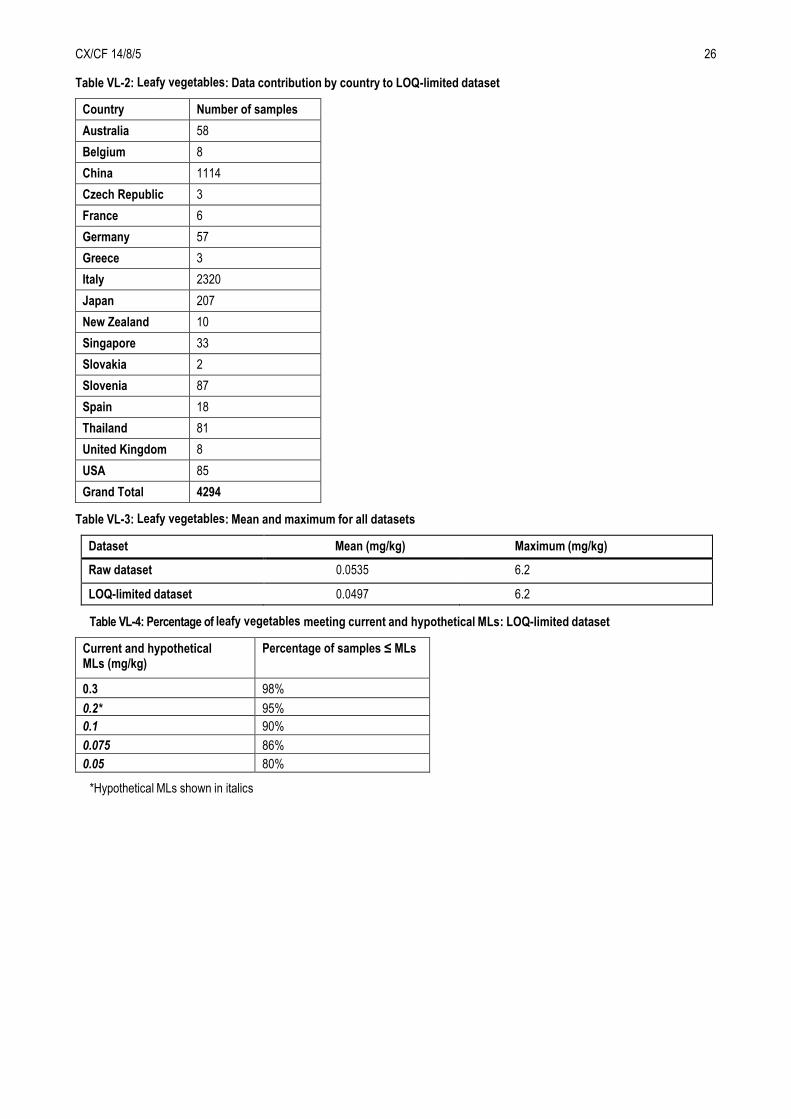
39. Leafy vegetables. The leafy vegetables raw dataset consisted of 4790 results from the GEMS/Food database for samples collected and/or analyzed between 1997 and 2013. (This category includes brassica leafy vegetables but excludes spinach, as noted in the GSCTFF). We excluded 496 samples with an LOQ > 0.3 mg/kg or no reported LOQ to obtain the LOQ-limited set of 4294 samples. Tables VL-1 and VL-2 (in Appendix I) show the breakdown by country of the raw dataset and the LOQ-limited dataset, and Table VL-3 shows the mean and maximum lead levels associated with both datasets. Table VL-4 shows the percentage of leafy vegetable samples meeting current and hypothetical MLs for the LOQ-limited dataset.
40. For leafy vegetables, 98 percent of the samples in the LOQ-limited dataset (i.e., results obtained with a method with an LOQ ≤ 0.3 mg/kg) met the current Codex ML of 0.3 mg/kg (Table VL-4). This table also indicates that 95 percent of samples may meet a hypothetical ML of 0.2 mg/kg and 90 percent of samples may meet a hypothetical ML of 0.1 mg/kg. Thus, lowering the ML to the hypothetical level of 0.2 mg/kg would eliminate approximately 5 percent of the samples in international trade, while lowering the ML to the hypothetical level of 0.1 mg/kg would eliminate approximately 10 percent of the samples in international trade. The EWG recommends maintaining the current ML of 0.3 mg/kg.
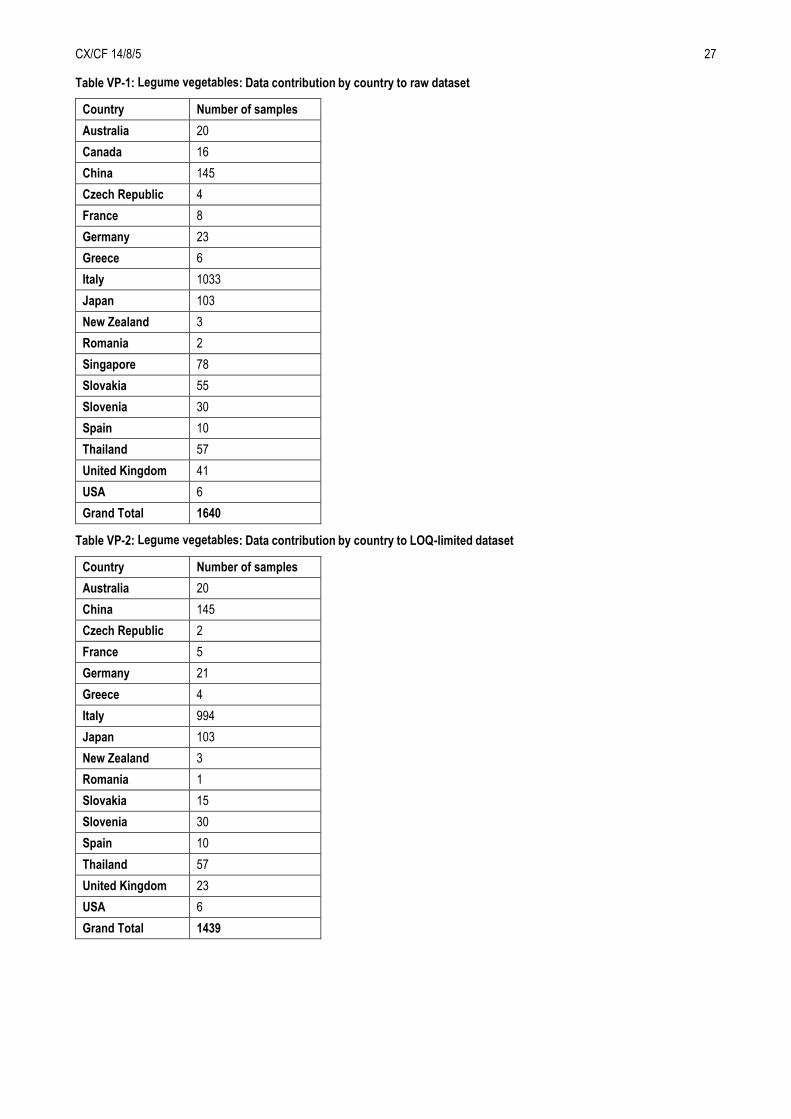
41. Legume vegetables. The legume vegetables raw dataset consisted of 1640 results from the GEMS/Food database for samples collected and/or analyzed between 1997 and 2013. We excluded 201 samples with an LOQ > 0.2 mg/kg or no reported LOQ to obtain the LOQ-limited set of 1439 samples. Tables VP-1 and VP-2 (in Appendix I) show the breakdown by country of the raw dataset and the LOQ-limited dataset, and Table VP-3 shows the mean and maximum lead levels associated with both datasets. Table VP-4 shows the percentage of legume vegetable samples meeting current and hypothetical MLs for the LOQ-limited dataset.
42. For legume vegetables, 99 percent of the samples in the LOQ-limited dataset (i.e., results obtained with a method with an LOQ ≤ 0.2 mg/kg) met the current Codex ML of 0.2 mg/kg (Table VP-4). This table also indicates that 98 percent of samples may meet a hypothetical ML of 0.15 mg/kg, 96 percent of samples may meet a hypothetical ML of 0.1 mg/kg, and 89 percent of samples may meet a hypothetical ML of 0.05 mg/kg. Thus, lowering the ML to the hypothetical level of 0.15 mg/kg would eliminate approximately 2 percent of the samples in international trade, lowering the ML to the hypothetical level of 0.1 mg/kg would eliminate approximately 4 percent of the samples in international trade, and lowering the ML to the hypothetical level of 0.05 mg/kg would eliminate approximately 11 percent of the samples in international trade. The EWG tentatively proposes lowering the ML to 0.1 mg/kg.
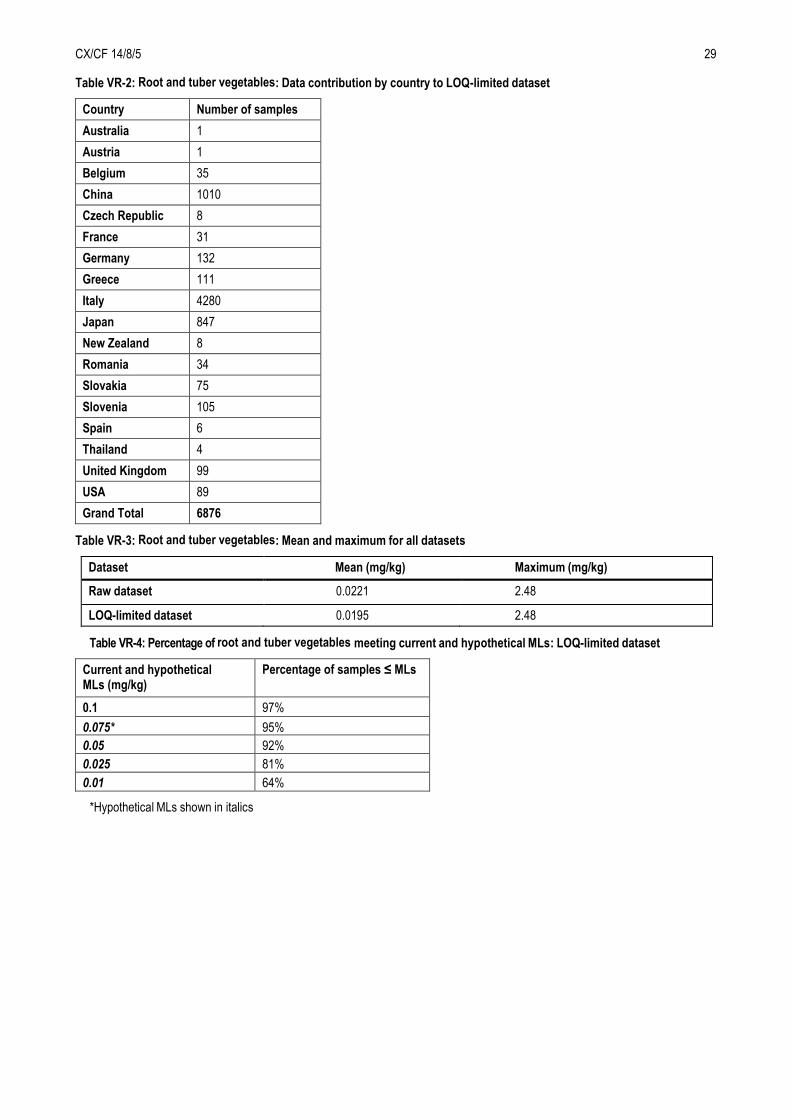
43. Root and tuber vegetables. The root and tuber vegetables raw dataset consisted of 7738 results from the GEMS/Food database for samples collected and/or analyzed between 1997 and 2013. We excluded 862 samples with an LOQ > 0.1 mg/kg or no reported LOQ to obtain the LOQ-limited set of 6876 samples. Tables VR-1 and VR-2 (in Appendix I) show the breakdown by country of the raw dataset and the LOQ-limited dataset, and Table VR-3 shows the mean and maximum lead levels associated with both datasets. Table VR-4 shows the percentage of root and tuber vegetable samples meeting current and hypothetical MLs for the LOQ-limited dataset.
44. For root and tuber vegetables, 97 percent of the samples in the LOQ-limited dataset (i.e., results obtained with a method with an LOQ ≤ 0.1 mg/kg) met the current Codex ML of 0.1 mg/kg (Table VR-4). This table also indicates that 95 percent of samples may meet a hypothetical ML of 0.075 mg/kg, and 92 percent of samples may meet a hypothetical ML of 0.05 mg/kg. Thus, lowering the ML to the hypothetical level of 0.075 mg/kg would eliminate approximately 5 percent of the samples in international trade and lowering the ML to the hypothetical level of 0.05 mg/kg would eliminate approximately 8 percent of the samples in international trade. The EWG recommends maintaining the current ML of 0.1 mg/kg.
CX/CF 14/8/5 7
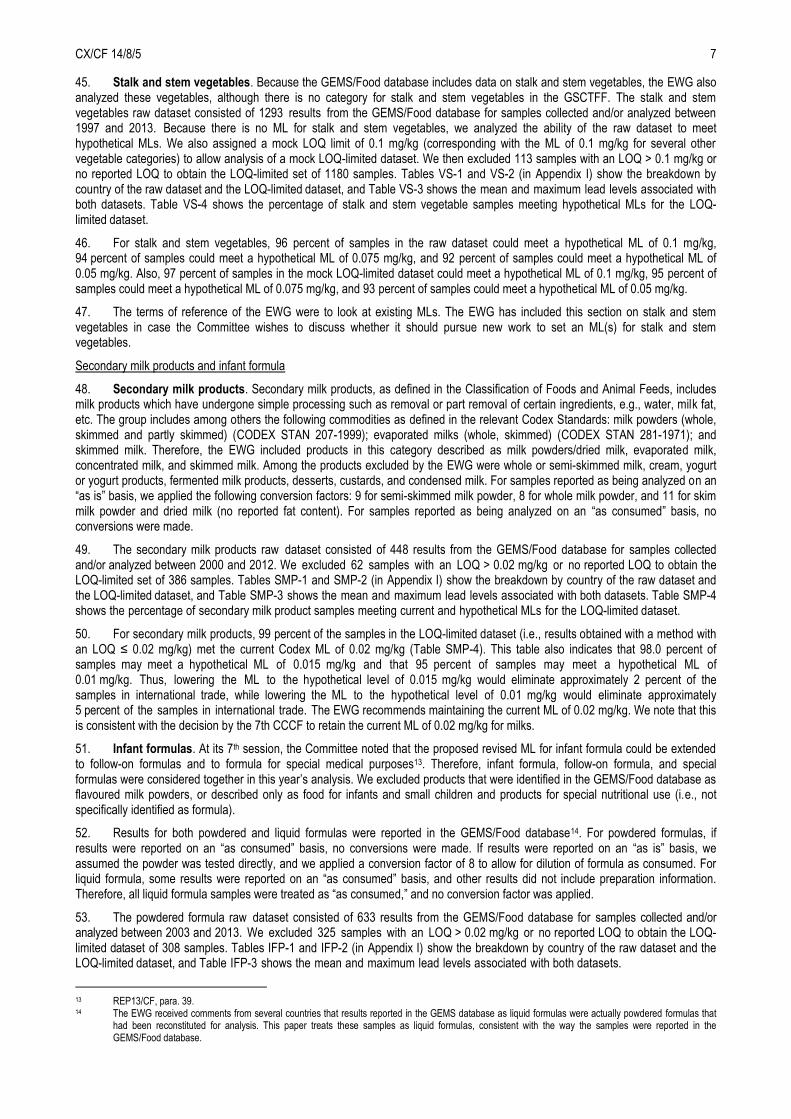
45. Stalk and stem vegetables. Because the GEMS/Food database includes data on stalk and stem vegetables, the EWG also analyzed these vegetables, although there is no category for stalk and stem vegetables in the GSCTFF. The stalk and stem vegetables raw dataset consisted of 1293 results from the GEMS/Food database for samples collected and/or analyzed between 1997 and 2013. Because there is no ML for stalk and stem vegetables, we analyzed the ability of the raw dataset to meet hypothetical MLs. We also assigned a mock LOQ limit of 0.1 mg/kg (corresponding with the ML of 0.1 mg/kg for several other vegetable categories) to allow analysis of a mock LOQ-limited dataset. We then excluded 113 samples with an LOQ > 0.1 mg/kg or no reported LOQ to obtain the LOQ-limited set of 1180 samples. Tables VS-1 and VS-2 (in Appendix I) show the breakdown by country of the raw dataset and the LOQ-limited dataset, and Table VS-3 shows the mean and maximum lead levels associated with both datasets. Table VS-4 shows the percentage of stalk and stem vegetable samples meeting hypothetical MLs for the LOQ-limited dataset.
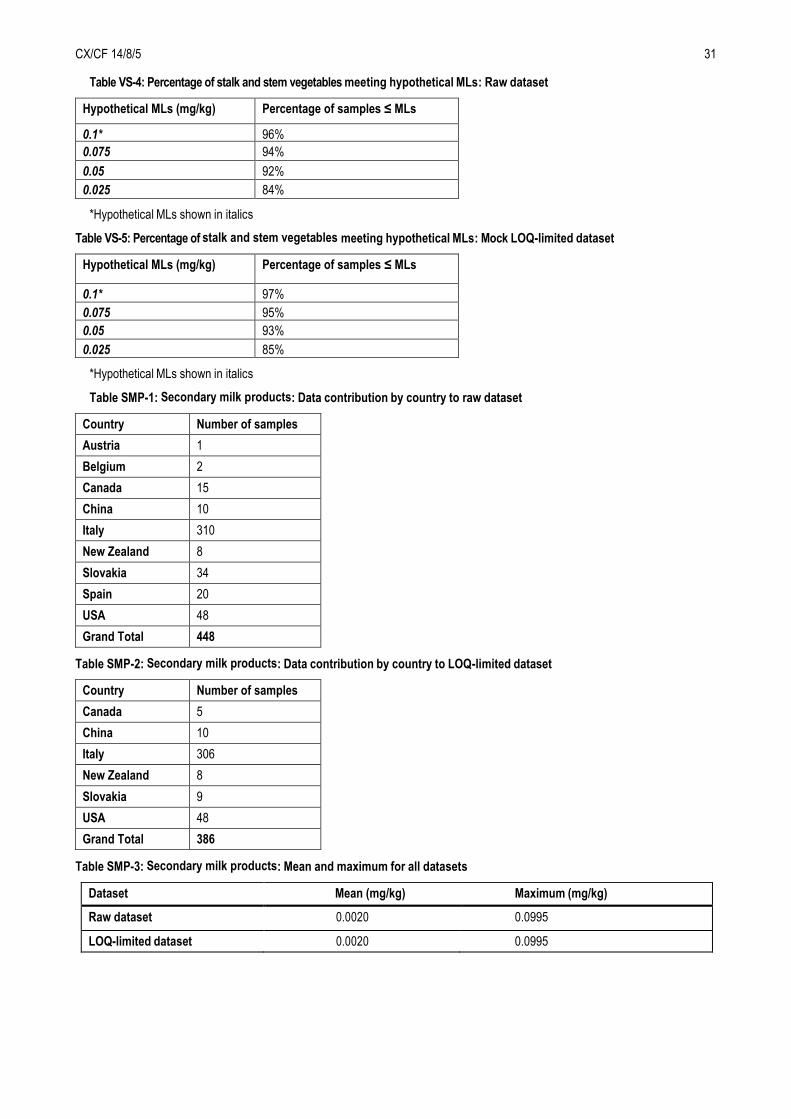
46. For stalk and stem vegetables, 96 percent of samples in the raw dataset could meet a hypothetical ML of 0.1 mg/kg, 94 percent of samples could meet a hypothetical ML of 0.075 mg/kg, and 92 percent of samples could meet a hypothetical ML of 0.05 mg/kg. Also, 97 percent of samples in the mock LOQ-limited dataset could meet a hypothetical ML of 0.1 mg/kg, 95 percent of samples could meet a hypothetical ML of 0.075 mg/kg, and 93 percent of samples could meet a hypothetical ML of 0.05 mg/kg.
47. The terms of reference of the EWG were to look at existing MLs. The EWG has included this section on stalk and stem vegetables in case the Committee wishes to discuss whether it should pursue new work to set an ML(s) for stalk and stem vegetables.
Secondary milk products and infant formula
48. Secondary milk products. Secondary milk products, as defined in the Classification of Foods and Animal Feeds, includes milk products which have undergone simple processing such as removal or part removal of certain ingredients, e.g., water, milk fat, etc. The group includes among others the following commodities as defined in the relevant Codex Standards: milk powders (whole, skimmed and partly skimmed) (CODEX STAN 207-1999); evaporated milks (whole, skimmed) (CODEX STAN 281-1971); and skimmed milk. Therefore, the EWG included products in this category described as milk powders/dried milk, evaporated milk, concentrated milk, and skimmed milk. Among the products excluded by the EWG were whole or semi-skimmed milk, cream, yogurt or yogurt products, fermented milk products, desserts, custards, and condensed milk. For samples reported as being analyzed on an “as is” basis, we applied the following conversion factors: 9 for semi-skimmed milk powder, 8 for whole milk powder, and 11 for skim milk powder and dried milk (no reported fat content). For samples reported as being analyzed on an “as consumed” basis, no conversions were made.
49. The secondary milk products raw dataset consisted of 448 results from the GEMS/Food database for samples collected and/or analyzed between 2000 and 2012. We excluded 62 samples with an LOQ > 0.02 mg/kg or no reported LOQ to obtain the LOQ-limited set of 386 samples. Tables SMP-1 and SMP-2 (in Appendix I) show the breakdown by country of the raw dataset and the LOQ-limited dataset, and Table SMP-3 shows the mean and maximum lead levels associated with both datasets. Table SMP-4 shows the percentage of secondary milk product samples meeting current and hypothetical MLs for the LOQ-limited dataset.
50. For secondary milk products, 99 percent of the samples in the LOQ-limited dataset (i.e., results obtained with a method with an LOQ ≤ 0.02 mg/kg) met the current Codex ML of 0.02 mg/kg (Table SMP-4). This table also indicates that 98.0 percent of samples may meet a hypothetical ML of 0.015 mg/kg and that 95 percent of samples may meet a hypothetical ML of 0.01 mg/kg. Thus, lowering the ML to the hypothetical level of 0.015 mg/kg would eliminate approximately 2 percent of the samples in international trade, while lowering the ML to the hypothetical level of 0.01 mg/kg would eliminate approximately 5 percent of the samples in international trade. The EWG recommends maintaining the current ML of 0.02 mg/kg. We note that this is consistent with the decision by the 7th CCCF to retain the current ML of 0.02 mg/kg for milks.
51. Infant formulas. At its 7th session, the Committee noted that the proposed revised ML for infant formula could be extended to follow-on formulas and to formula for special medical purposes13. Therefore, infant formula, follow-on formula, and special formulas were considered together in this year’s analysis. We excluded products that were identified in the GEMS/Food database as flavoured milk powders, or described only as food for infants and small children and products for special nutritional use (i.e., not specifically identified as formula).
52. Results for both powdered and liquid formulas were reported in the GEMS/Food database14. For powdered formulas, if results were reported on an “as consumed” basis, no conversions were made. If results were reported on an “as is” basis, we assumed the powder was tested directly, and we applied a conversion factor of 8 to allow for dilution of formula as consumed. For liquid formula, some results were reported on an “as consumed” basis, and other results did not include preparation information. Therefore, all liquid formula samples were treated as “as consumed,” and no conversion factor was applied.
53. The powdered formula raw dataset consisted of 633 results from the GEMS/Food database for samples collected and/or analyzed between 2003 and 2013. We excluded 325 samples with an LOQ > 0.02 mg/kg or no reported LOQ to obtain the LOQ-limited dataset of 308 samples. Tables IFP-1 and IFP-2 (in Appendix I) show the breakdown by country of the raw dataset and the LOQ-limited dataset, and Table IFP-3 shows the mean and maximum lead levels associated with both datasets.
13 REP13/CF, para. 39. 14 The EWG received comments from several countries that results reported in the GEMS database as liquid formulas were actually powdered formulas that
had been reconstituted for analysis. This paper treats these samples as liquid formulas, consistent with the way the samples were reported in the GEMS/Food database.
CX/CF 14/8/5 8
54. The liquid formula raw dataset consisted of 197 results from the GEMS/Food database for samples collected and/or analyzed between 1998 and 2011. We excluded 37 samples with an LOQ > 0.02 mg/kg or no reported LOQ to obtain the LOQ-limited dataset of 160 samples. Tables IFL-1 and IFL-2 (in Appendix I) show the breakdown by country of the raw dataset and the LOQ-limited dataset, and Table IFL-3 shows the mean and maximum lead levels associated with both datasets.
55. Tables IFP-4 and IFL-4, respectively, show the percentage of powdered and liquid infant formula samples meeting current and hypothetical MLs for the LOQ-limited datasets. Finally, Table IFL-5 shows the percentage analysis for powdered and liquid formulas combined (468 results in the combined LOQ-limited dataset). For infant formula, 99 percent of the samples in the LOQ-limited dataset (i.e., results obtained with a method with an LOQ ≤ 0.02 mg/kg) met the current Codex ML of 0.02 mg/kg (Table IFL-5). This table also indicates that 97 percent of samples may meet a hypothetical ML of 0.01 mg/kg and 94 percent of samples may meet a hypothetical ML of 0.005 mg/kg. These results are similar to the 2013 results, in which 99 percent of results could meet a hypothetical ML of 0.01 mg/kg and 95 percent could meet a hypothetical ML of 0.005 mg/kg.
56. The results reported in 201315 were based on 175 liquid formula samples in the raw dataset (from Canada, New Zealand, Singapore, and the United States of America) and 138 liquid formula samples in the LOQ-limited set (from New Zealand and the United States of America)16. This year’s analysis includes data from the 2013 analysis and newly reported data, and consists of 830 samples in the raw dataset (from Australia, Austria, Brazil, Canada, China, Czech Republic, Germany, Italy, Japan, New Zealand, Singapore, Slovakia, Spain, Thailand, and the United States of America) and 468 samples in the LOQ-limited set (from Australia, Brazil, China, Czech Republic, Germany, Italy, Japan, New Zealand, Slovakia, Spain, and the United States of America). The 2014 analysis includes data from more countries and regions than in 2013, as requested by the 7th CCCF.
57. Also, in 2013, we noted that 11 of the 138 LOQ-limited results were quantifiable (not NDs), and that only one of these samples was greater than the proposed ML, with a value of 0.011 mg/kg. This year, 81 of the 468 LOQ-limited results were quantifiable, with two values (0.01 mg/kg) equal to the proposed ML and 16 values greater than the proposed ML. These samples consisted of one sample from the United States of America (0.011 mg/kg), four samples from Brazil (ranging from 0.010 to 0.013 mg/kg), and 11 samples from China (ranging from 0.011 to 0.027 mg/kg).
58. Based on these results, we again propose that CCCF consider revising the ML for infant formula, including follow-on formulas and formula for special medical purposes, to 0.01 mg/kg, and maintaining the current note that the ML applies to products “ready to use.”
ADDITIONAL TOPICS
59. The EWG notes that this year’s analysis is based on results for individual fruit and vegetable categories, whereas the analysis supporting the proposed revision of the MLs for canned fruits and vegetables (currently at Step 5) was based on analysis of canned fruits combined and canned vegetables combined. Therefore, the proposed MLs for canned and noncanned fruits and vegetables, reflecting the data reviewed for each category, do not align completely. In the future, the Committee may wish to consider new work on the canned fruits and vegetables that were excluded from consideration at Step 5 at the 7th CCCF (canned berries and other small fruits, canned brassica vegetables, canned leafy vegetables, and canned legume vegetables).
60. One country (New Zealand) noted that the GSCTFF may lack a category for dried fruit because appropriate values might normally be estimated using an appropriate processing factor, but that a separate ML for dried fruit would still be appropriate if there is significant trade in this commodity. Several countries (Australia and Japan) noted that information on the contribution of dried fruit and stalk and stem vegetables to lead exposure would be useful for CCCF to determine whether further work is needed for dried fruits and stalk and stem vegetables.
61. One country (Australia) noted the high rate of exceedances (93 percent) for bulb vegetables.
62. One country (China) did not support the proposal to consider lowering the MLs for fruiting vegetables (cucurbits) and fruiting vegetables (other than cucurbits) to 0.05 mg/kg, citing new Chinese data that have not yet been reported to GEMS.
63. One country (Japan) supported the proposed ML of 0.01 mg/kg for infant formula, but also stated that it is concerned about the availability of a validated analytical method which satisfies recommended performance criteria of the “Guidelines for Establishing Numeric Values for Method Criteria and/or Assessing Methods for Compliance Thereof” in the Procedural Manual. The EWG notes that the 7th CCCF discussed the issue of referring proposed MLs to the Committee on Methods of Analysis and Sampling (CCMAS) for consideration of whether the methodology supports the lower MLs, but determined that the consideration and elaboration of methods of analysis and sampling for the determination of contaminants and naturally occurring toxicants in food and feed was in the remit of CCCF and therefore no further action needed to be taken in this regard.
15 CX/CF 13/7/5 16 This number does not include 147 samples of powdered formula, primarily follow-on formula, which were analyzed separately in 2013.
CX/CF 14/8/5 9
64. Another country (Argentina) noted that approximately 50 percent of the raw infant formula data were obtained with analytical methodology with quantification limits exceeding the MLs set by Codex and expressed concern that if values are reduced to the proposed MLs, most laboratories would not be able to quantify the lead content. In response, the EWG notes that the fact that approximately 50 percent of the results were obtained with an analytical method with an LOQ greater than the current ML does not mean that the current ML should be raised. Regarding the issue of lowering the ML further, we examined the LOQ-limited set of powdered and liquid formulas that was the basis for recommending the new ML, and we determined that approximately 45 percent of the results in this set were obtained with methods with LOQs ≤ 0.01 mg/kg. Therefore, we agree that lowering the ML to 0.01 mg/kg could increase the percentage of samples analyzed with a method for which the LOQ is greater than the ML. However, as it appears that methodology that meets both the current and proposed MLs is available, the EWG still recommends that CCCF consider lowering the ML for infant formula to 0.01 mg/kg.
SUMMARY AND RECOMMENDATIONS
65. In summary, analysis of the submitted occurrence data shows that it may be possible to lower MLs for lead in the GSCTFF for some foods, but that lowering MLs for other foods would be more challenging. The EWG makes the following recommendations.
1. Assorted (sub)tropical fruits, edible peel: Maintain the current ML of 0.1 mg/kg.
2. Assorted (sub)tropical fruits, inedible peel: Maintain the current ML of 0.1 mg/kg.
3. Berries and other small fruits: Consider lowering the ML to 0.1 mg/kg.
4. Citrus fruits: Maintain the current ML of 0.1 mg/kg.
5. Pome fruits: Maintain the current ML of 0.1 mg/kg.
6. Stone fruits: Maintain the current ML of 0.1 mg/kg.
7. Dried fruits: Consider whether to pursue new work to set MLs for dried fruits.
8. Brassica vegetables: Consider lowering the ML to 0.1 mg/kg.
9. Bulb vegetables: Maintain the current ML of 0.1 mg/kg.
10. Fruiting vegetables, cucurbits: Consider lowering the ML to 0.05 mg/kg.
11. Fruiting vegetables, other than cucurbits: Consider lowering the ML to 0.05 mg/kg, but excluding fungi and mushrooms.
12. Leafy vegetables: Maintain the current ML of 0.3 mg/kg.
13. Legume vegetables: Consider lowering the ML to 0.1 mg/kg.
14. Root and tuber vegetables: Maintain the current ML of 0.1 mg/kg.
15. Stalk and stem vegetables: Consider whether to pursue new work to set MLs for stalk and stem vegetables.
16. Secondary milk products: Maintain the current ML of 0.02 mg/kg.
17. Infant formula: Consider lowering the ML for infant formula, including follow-on formulas and formula for special medical purposes, to 0.01 mg/kg.
66. Because work on fruit juices and canned fruits and vegetables will resume in 2015 for consideration at the 9th CCCF, the EWG is not recommending revision of maximum levels of lead in other commodities for next year.
CX/CF 14/8/5 10
Appendix I Tables17
Table FT-1: Assorted (sub)tropical fruits, edible peel: Data contribution by country to raw dataset
Country Number of samples
China 62
France 1
Italy 112
Japan 407
Singapore 2
Thailand 23
USA 2
Grand Total 609
Table FT-2: Assorted (sub)tropical fruits, edible peel: Data contribution by country to LOQ-limited dataset
Country Number of samples
China 62
France 1
Italy 105
Japan 407
Singapore 1
Thailand 20
USA 2
Grand Total 598
Table FT-3: Assorted (sub)tropical fruits, edible peel: Mean and maximum for all datasets
Dataset Mean (mg/kg) Maximum (mg/kg)
Raw dataset 0.0111 0.56
LOQ-limited dataset 0.0100 0.56
Table FT-4: Percentage of assorted (sub)tropical fruits, edible peel samples meeting current and hypothetical MLs: LOQ-limited dataset
Current and hypothetical MLs (mg/kg) Percentage of samples ≤ MLs
0.1 97%
0.075* 96%
0.05 93%
0.025 91%
0.01 88%
*Hypothetical MLs shown in italics
17 Some countries submitted aggregated data corresponding to single analytical results obtained by pooling several individual samples. For the LOQ-
limited datasets, only 200 aggregated samples remained from 6 countries (Singapore, USA, Japan, Australia, New Zealand, and Argentina). By definition, pooling samples decreases the apparent variability, however, for the current analysis it is unlikely that the pooled samples have a significant impact.

CX/CF 14/8/5 11
Table FI-1: Assorted (sub)tropical fruits, inedible peel: Data contribution by country to raw dataset
Country Number of samples
Australia 62
Canada 16
China 151
Czech Republic 9
France 10
Germany 31
Italy 968
Japan 125
New Zealand 25
Romania 13
Singapore 36
Slovakia 7
Spain 10
Thailand 268
USA 103
Grand Total 1834
Table FI-2: Assorted (sub)tropical fruits, inedible peel: Data contribution by country to LOQ-limited dataset
Country Number of samples
Australia 62
Canada 2
China 149
Czech Republic 4
France 6
Germany 28
Italy 944
Japan 125
New Zealand 25
Romania 6
Singapore 8
Slovakia 3
Spain 10
Thailand 267
USA 103
Grand Total 1742
Table FI-3: Assorted (sub)tropical fruits, inedible peel: Mean and maximum for all datasets
Dataset Mean (mg/kg) Maximum (mg/kg)
Raw dataset 0.0124 0.46
LOQ-limited dataset 0.0122 0.46
CX/CF 14/8/5 12
Table FI-4: Percentage of assorted (sub)tropical fruits, inedible peel samples meeting current and hypothetical MLs: LOQ-limited dataset
Current and hypothetical MLs (mg/kg)
Percentage of samples ≤ MLs
0.1 96%
0.075* 95%
0.05 93%
0.025 89%
0.01 84%
*Hypothetical MLs shown in italics
Table FB-1: Berries and other small fruits: Data contribution by country to raw dataset
Country Number of samples
Australia 98
Canada 32
China 194
Czech Republic 9
France 7
Germany 132
Italy 1937
Japan 511
Lithuania 1
New Zealand 19
Romania 3
Singapore 10
Slovakia 23
Slovenia 55
Spain 20
Thailand 10
United Kingdom 115
USA 123
Grand Total 3299
CX/CF 14/8/5 13
Table FB-2: Berries and other small fruits: Data contribution by country to LOQ-limited dataset
Country Number of samples
Australia 98
Canada 1
China 194
Czech Republic 7
France 5
Germany 112
Italy 1886
Japan 511
New Zealand 19
Romania 1
Slovakia 12
Slovenia 55
Spain 20
Thailand 10
United Kingdom 51
USA 122
Grand Total 3104
Table FB-3: Berries and other small fruits: Mean and maximum for all datasets
Dataset Mean (mg/kg) Maximum (mg/kg)
Raw dataset 0.0111 0.70
LOQ-limited dataset 0.0106 0.70
Table FB-4: Percentage of berries and other small fruits meeting current and hypothetical MLs: LOQ-limited dataset
Current and hypothetical MLs (mg/kg)
Percentage of samples ≤ MLs
0.2 99%
0.1* 98%
0.075 97%
0.05 95%
0.025 89%
*Hypothetical MLs shown in italics

CX/CF 14/8/5 14
Table FC-1: Citrus fruits: Data contribution by country to raw dataset
Country Number of samples
Australia 31
China 386
Czech Republic 11
France 22
Italy 517
Japan 210
Lithuania 9
New Zealand 9
Romania 35
Singapore 24
Slovakia 10
Spain 11
Thailand 24
USA 97
Grand Total 1396
Table FC-2: Citrus fruits: Data contribution by country to LOQ-limited dataset
Country Number of samples
Australia 31
China 343
Czech Republic 2
France 16
Italy 503
Japan 210
Lithuania 8
New Zealand 9
Romania 15
Singapore 6
Slovakia 9
Spain 10
Thailand 24
USA 97
Grand Total 1283
Table FC-3: Citrus fruits: Mean and maximum for all datasets
Dataset Mean (mg/kg) Maximum (mg/kg)
Raw dataset 0.0161 1.49
LOQ-limited dataset 0.0149 0.58

CX/CF 14/8/5 15
Table FC-4: Percentage of citrus fruits meeting current and hypothetical MLs: LOQ-limited dataset
Current and hypothetical MLs (mg/kg)
Percentage of samples ≤ MLs
0.1 97%
0.075* 94%
0.05 91%
0.025 84%
0.01 74%
*Hypothetical MLs shown in italics
Table FP-1: Pome fruits: Data contribution by country to raw dataset
Country Number of samples
Australia 115
Canada 16
China 828
Czech Republic 30
France 39
Germany 5
Italy 1138
Japan 811
New Zealand 17
Portugal 3
Romania 106
Singapore 5
Slovakia 40
Slovenia 57
Spain 13
Thailand 11
United Kingdom 28
USA 145
Grand Total 3407
CX/CF 14/8/5 16
Table FP-2: Pome fruits: Data contribution by country to LOQ-limited dataset
Country Number of samples
Australia 115
Canada 1
China 826
Czech Republic 5
France 26
Germany 5
Italy 1077
Japan 811
New Zealand 17
Portugal 3
Romania 44
Singapore 1
Slovakia 23
Slovenia 57
Spain 10
Thailand 11
United Kingdom 16
USA 145
Grand Total 3193
Table FP-3: Pome fruits: Mean and maximum for all datasets
Dataset Mean (mg/kg) Maximum (mg/kg)
Raw dataset 0.0180 3.73
LOQ-limited dataset 0.0178 3.73
Table FP-4: Percentage of pome fruits meeting current and hypothetical MLs: LOQ-limited dataset
Current and hypothetical MLs (mg/kg)
Percentage of samples ≤ MLs
0.1 96%
0.075* 95%
0.05 92%
0.025 84%
0.01 77%
*Hypothetical MLs shown in italics

CX/CF 14/8/5 17
Table FS-1: Stone fruits: Data contribution by country to raw dataset
Country Number of samples
Australia 41
Canada 30
China 412
Czech Republic 19
France 20
Germany 10
Italy 768
Japan 135
New Zealand 10
Romania 14
Singapore 23
Slovakia 20
Spain 20
United Kingdom 2
USA 87
Grand Total 1611
Table FS-2: Stone fruits: Data contribution by country to LOQ-limited dataset
Country Number of samples
Australia 41
China 410
Czech Republic 2
France 10
Germany 10
Italy 742
Japan 135
New Zealand 10
Romania 3
Singapore 8
Slovakia 9
Spain 20
United Kingdom 1
USA 87
Grand Total 1488
Table FS-3: Stone fruits: Mean and maximum for all datasets
Dataset Mean (mg/kg) Maximum (mg/kg)
Raw dataset 0.0185 0.92
LOQ-limited dataset 0.0180 0.92

CX/CF 14/8/5 18
Table FS-4: Percentage of stone fruits meeting current and hypothetical MLs: LOQ-limited dataset
Current and hypothetical MLs (mg/kg)
Percentage of samples ≤ MLs
0.1 96%
0.075* 94%
0.05 91%
0.025 83%
0.01 72%
*Hypothetical MLs shown in italics
Table DF-1: Dried fruits: Data contribution by country to raw dataset
Country Number of samples
Argentina 1
Australia 29
Austria 1
Canada 8
Czech Republic 4
France 19
Italy 294
New Zealand 18
Singapore 82
Slovakia 7
USA 327
Grand Total 790
Table DF-2: Dried fruits: Data contribution by country to mock LOQ-limited dataset
Country Number of samples
Argentina 1
Australia 29
France 13
Italy 264
New Zealand 18
Singapore 11
Slovakia 3
USA 304
Grand Total 643
Table DF-3: Dried fruits: Mean and maximum for all datasets
Dataset Mean (mg/kg) Maximum (mg/kg)
Raw dataset 0.0687 2.72
Mock LOQ-limited dataset 0.0625 2.72
CX/CF 14/8/5 19
Table DF-4: Percentage of dried fruits meeting hypothetical MLs: raw dataset
Hypothetical MLs (mg/kg) Percentage of samples ≤ MLs
0.5* 97%
0.4 97%
0.3 96%
0.2 94%
0.1 89%
*Hypothetical MLs shown in italics
Table DF-5: Percentage of dried fruits meeting hypothetical MLs: mock LOQ-limited dataset
Hypothetical MLs (mg/kg) Percentage of samples ≤ MLs
0.5* 97%
0.4 97%
0.3 97%
0.2 95%
0.1 92%
*Hypothetical MLs shown in italics
Table VB-1: Brassica vegetables: Data contribution by country to raw dataset
Country Number of samples
Canada 30
China 127
Czech Republic 13
France 4
Germany 31
Italy 1647
Japan 206
New Zealand 9
Romania 14
Singapore 1
Slovakia 35
Slovenia 13
Spain 22
Thailand 27
United Kingdom 227
USA 1
Grand Total 2407
CX/CF 14/8/5 20
Table VB-2: Brassica vegetables: Data contribution by country to LOQ-limited dataset
Country Number of samples
China 127
Czech Republic 9
France 2
Germany 27
Italy 1515
Japan 206
New Zealand 1
Romania 9
Slovakia 14
Slovenia 13
Spain 17
Thailand 27
United Kingdom 107
USA 1
Grand Total 2075
Table VB-3: Brassica vegetables: Mean and maximum for all datasets
Dataset Mean (mg/kg) Maximum (mg/kg)
Raw dataset 0.0130 1.49
LOQ-limited dataset 0.0117 1.49
Table VB-4: Percentage of brassica vegetables meeting current and hypothetical MLs: LOQ-limited dataset
Current and hypothetical MLs (mg/kg)
Percentage of samples ≤ MLs
0.3 99%
0.2* 99%
0.1 98%
0.05 95%
0.025 90%
*Hypothetical MLs shown in italics
CX/CF 14/8/5 21
Table VA-1: Bulb vegetables: Data contribution by country to raw dataset
Country Number of samples
Australia 9
Austria 3
Belgium 7
Canada 8
China 630
Czech Republic 10
France 14
Germany 99
Greece 122
Italy 1113
Japan 206
Romania 25
Singapore 3
Slovakia 18
Slovenia 15
Spain 24
Thailand 162
United Kingdom 65
USA 93
Grand Total 2626
Table VA-2: Bulb vegetables: Data contribution by country to LOQ-limited dataset
Country Number of samples
Australia 9
Belgium 6
China 575
Czech Republic 1
France 9
Germany 46
Greece 71
Italy 1001
Japan 206
Romania 16
Slovakia 9
Slovenia 5
Spain 19
Thailand 162
United Kingdom 34
USA 87
Grand Total 2256

CX/CF 14/8/5 22
Table VA-3: Bulb vegetables: Mean and maximum for all datasets
Dataset Mean (mg/kg) Maximum (mg/kg)
Raw dataset 0.0382 4.06
LOQ-limited dataset 0.0334 4.06
Table VA-4: Percentage of bulb vegetables meeting current and hypothetical MLs: LOQ-limited dataset
Current and hypothetical MLs (mg/kg)
Percentage of samples ≤ MLs
0.1 93%
0.075* 90%
0.05 87%
0.025 79%
0.01 70%
*Hypothetical MLs shown in italics
Table VC-1: Fruiting vegetables, cucurbits: Data contribution by country to raw dataset
Country Number of samples
Australia 61
Austria 1
Canada 16
China 148
Czech Republic 5
France 18
Germany 117
Italy 1021
Japan 205
Lithuania 1
New Zealand 27
Romania 16
Singapore 30
Slovakia 26
Spain 21
Thailand 37
United Kingdom 55
USA 147
Grand Total 1952

CX/CF 14/8/5 23
Table VC-2: Fruiting vegetables, cucurbits: Data contribution by country to LOQ-limited dataset
Country Number of samples
Australia 61
Austria 1
China 140
Czech Republic 3
France 8
Germany 83
Italy 969
Japan 205
New Zealand 27
Romania 5
Slovakia 19
Spain 19
Thailand 37
United Kingdom 21
USA 146
Grand Total 1744
Table VC-3: Fruiting vegetables, cucurbits: Mean and maximum for all datasets
Dataset Mean (mg/kg) Maximum (mg/kg)
Raw dataset 0.0094 0.62
LOQ-limited dataset 0.0054 0.36
Table VC-4: Percentage of fruiting vegetables, cucurbits, meeting current and hypothetical MLs: LOQ-limited dataset
Current and hypothetical MLs (mg/kg)
Percentage of samples ≤ MLs
0.1 99%
0.075* 98%
0.05 97%
0.025 94%
0.01 89%
*Hypothetical MLs shown in italics

CX/CF 14/8/5 24
Table VO-1: Fruiting vegetables, other than cucurbits (fungi and mushrooms excluded): Data contribution by country to raw dataset
Country Number of samples
Australia 112
Canada 24
China 147
Czech Republic 9
France 12
Germany 3
Italy 1791
Japan 309
Lithuania 2
New Zealand 19
Portugal 1
Romania 32
Singapore 71
Slovakia 51
Slovenia 12
Spain 44
Thailand 137
United Kingdom 25
USA 97
Grand Total 2898
Table VO-2: Fruiting vegetables, other than cucurbits (fungi and mushrooms excluded): Data contribution by country to LOQ-limited dataset
Country Number of samples
Australia 112
China 137
Czech Republic 3
France 8
Germany 2
Italy 1673
Japan 309
Lithuania 1
New Zealand 19
Romania 12
Singapore 13
Slovakia 23
Slovenia 12
Spain 39
Thailand 137
United Kingdom 19
USA 97
Grand Total 2616
CX/CF 14/8/5 25
Table VO-3: Fruiting vegetables, other than cucurbits (fungi and mushrooms excluded): Mean and maximum for all datasets
Dataset Mean (mg/kg) Maximum (mg/kg)
Raw dataset 0.0111 1.42
LOQ-limited dataset 0.0075 1.11
Table VO-4: Percentage of fruiting vegetables, other than cucurbits (fungi and mushrooms excluded): meeting current and hypothetical MLs: LOQ-limited dataset
Current and hypothetical MLs (mg/kg)
Percentage of samples ≤ MLs
0.1 99%
0.075* 99%
0.05 97%
0.025 92%
0.01 85%
*Hypothetical MLs shown in italics
Table VL-1: Leafy vegetables: Data contribution by country to raw dataset
Country Number of samples
Australia 58
Belgium 10
Canada 8
China 1195
Czech Republic 9
France 11
Germany 133
Greece 13
Italy 2686
Japan 207
New Zealand 10
Singapore 80
Slovakia 12
Slovenia 90
Spain 44
Thailand 81
United Kingdom 58
USA 85
Grand Total 4790
CX/CF 14/8/5 26
Table VL-2: Leafy vegetables: Data contribution by country to LOQ-limited dataset
Country Number of samples
Australia 58
Belgium 8
China 1114
Czech Republic 3
France 6
Germany 57
Greece 3
Italy 2320
Japan 207
New Zealand 10
Singapore 33
Slovakia 2
Slovenia 87
Spain 18
Thailand 81
United Kingdom 8
USA 85
Grand Total 4294
Table VL-3: Leafy vegetables: Mean and maximum for all datasets
Dataset Mean (mg/kg) Maximum (mg/kg)
Raw dataset 0.0535 6.2
LOQ-limited dataset 0.0497 6.2
Table VL-4: Percentage of leafy vegetables meeting current and hypothetical MLs: LOQ-limited dataset
Current and hypothetical MLs (mg/kg)
Percentage of samples ≤ MLs
0.3 98%
0.2* 95%
0.1 90%
0.075 86%
0.05 80%
*Hypothetical MLs shown in italics
CX/CF 14/8/5 27
Table VP-1: Legume vegetables: Data contribution by country to raw dataset
Country Number of samples
Australia 20
Canada 16
China 145
Czech Republic 4
France 8
Germany 23
Greece 6
Italy 1033
Japan 103
New Zealand 3
Romania 2
Singapore 78
Slovakia 55
Slovenia 30
Spain 10
Thailand 57
United Kingdom 41
USA 6
Grand Total 1640
Table VP-2: Legume vegetables: Data contribution by country to LOQ-limited dataset
Country Number of samples
Australia 20
China 145
Czech Republic 2
France 5
Germany 21
Greece 4
Italy 994
Japan 103
New Zealand 3
Romania 1
Slovakia 15
Slovenia 30
Spain 10
Thailand 57
United Kingdom 23
USA 6
Grand Total 1439

CX/CF 14/8/5 28
Table VP-3: Legume vegetables: Mean and maximum for all datasets
Dataset Mean (mg/kg) Maximum (mg/kg)
Raw dataset 0.0288 2.103
LOQ-limited dataset 0.0192 0.93
Table VP-4: Percentage of legume vegetables meeting current and hypothetical MLs: LOQ-limited dataset
Current and hypothetical MLs (mg/kg)
Percentage of samples ≤ MLs
0.2 99%
0.15* 98%
0.1 96%
0.05 89%
0.025 80%
*Hypothetical MLs shown in italics
Table VR-1: Root and tuber vegetables: Data contribution by country to raw dataset
Country Number of samples
Australia 1
Austria 1
Belgium 42
Canada 24
China 1057
Czech Republic 56
France 61
Germany 183
Greece 198
Italy 4459
Japan 847
New Zealand 16
Romania 77
Singapore 9
Slovakia 150
Slovenia 129
Spain 10
Thailand 30
United Kingdom 293
USA 95
Grand Total 7738
CX/CF 14/8/5 29
Table VR-2: Root and tuber vegetables: Data contribution by country to LOQ-limited dataset
Country Number of samples
Australia 1
Austria 1
Belgium 35
China 1010
Czech Republic 8
France 31
Germany 132
Greece 111
Italy 4280
Japan 847
New Zealand 8
Romania 34
Slovakia 75
Slovenia 105
Spain 6
Thailand 4
United Kingdom 99
USA 89
Grand Total 6876
Table VR-3: Root and tuber vegetables: Mean and maximum for all datasets
Dataset Mean (mg/kg) Maximum (mg/kg)
Raw dataset 0.0221 2.48
LOQ-limited dataset 0.0195 2.48
Table VR-4: Percentage of root and tuber vegetables meeting current and hypothetical MLs: LOQ-limited dataset
Current and hypothetical MLs (mg/kg)
Percentage of samples ≤ MLs
0.1 97%
0.075* 95%
0.05 92%
0.025 81%
0.01 64%
*Hypothetical MLs shown in italics

CX/CF 14/8/5 30
Table VS-1: Stalk and stem vegetables: Data contribution by country to raw dataset
Country Number of samples
Australia 31
Belgium 10
Canada 14
China 180
France 6
Germany 6
Italy 927
New Zealand 9
Romania 1
Singapore 2
Slovakia 3
Slovenia 5
Spain 15
Thailand 5
United Kingdom 31
USA 48
Grand Total 1293
Table VS-2: Stalk and stem vegetables: Data contribution by country to LOQ-limited dataset
Country Number of samples
Australia 31
Belgium 8
China 172
France 1
Germany 5
Italy 876
New Zealand 9
Romania 1
Slovakia 2
Slovenia 5
Spain 10
Thailand 5
United Kingdom 7
USA 48
Grand Total 1180
Table VS-3: Stalk and stem vegetables: Mean and maximum for all datasets
Dataset Mean (mg/kg) Maximum (mg/kg)
Raw dataset 0.0183 0.8
Mock LOQ-limited dataset 0.0153 0.64
CX/CF 14/8/5 31
Table VS-4: Percentage of stalk and stem vegetables meeting hypothetical MLs: Raw dataset
Hypothetical MLs (mg/kg) Percentage of samples ≤ MLs
0.1* 96%
0.075 94%
0.05 92%
0.025 84%
*Hypothetical MLs shown in italics
Table VS-5: Percentage of stalk and stem vegetables meeting hypothetical MLs: Mock LOQ-limited dataset
Hypothetical MLs (mg/kg) Percentage of samples ≤ MLs
0.1* 97%
0.075 95%
0.05 93%
0.025 85%
*Hypothetical MLs shown in italics
Table SMP-1: Secondary milk products: Data contribution by country to raw dataset
Country Number of samples
Austria 1
Belgium 2
Canada 15
China 10
Italy 310
New Zealand 8
Slovakia 34
Spain 20
USA 48
Grand Total 448
Table SMP-2: Secondary milk products: Data contribution by country to LOQ-limited dataset
Country Number of samples
Canada 5
China 10
Italy 306
New Zealand 8
Slovakia 9
USA 48
Grand Total 386
Table SMP-3: Secondary milk products: Mean and maximum for all datasets
Dataset Mean (mg/kg) Maximum (mg/kg)
Raw dataset 0.0020 0.0995
LOQ-limited dataset 0.0020 0.0995

CX/CF 14/8/5 32
Table SMP-4: Percentage of secondary milk products meeting current and hypothetical MLs: LOQ-limited dataset
Current and hypothetical MLs (mg/kg)
Percentage of samples ≤ MLs
0.02 99%
0.015* 98%
0.01 95%
0.005 88%
*Hypothetical MLs shown in italics
Table IFP-1: Powdered infant formula: Data contribution by country to raw dataset
Country Number of samples
Austria 28
Brazil 87
China 177
Czech Republic 4
Germany 10
Italy 64
Japan 22
Singapore 37
Slovakia 87
Spain 36
Thailand 81
Grand Total 633
Table IFP-2: Powdered infant formula: Data contribution by country to LOQ-limited dataset
Country Number of samples
Brazil 87
China 101
Czech Republic 3
Germany 4
Italy 47
Japan 22
Slovakia 21
Spain 23
Grand Total 308
Table IFP-3: Powdered infant formula: Mean and maximum for all datasets
Dataset Mean (mg/kg) Maximum (mg/kg)
Raw dataset 0.0012 0.12
LOQ-limited dataset 0.0013 0.0266

CX/CF 14/8/5 33
Table IFP-4: Percentage of powdered infant formula products meeting current and hypothetical MLs: LOQ-limited dataset
Current and hypothetical MLs (mg/kg)
Percentage of samples ≤ MLs
0.02 99%
0.015* 98%
0.01 95%
0.005 92%
*Hypothetical MLs shown in italics
Table IFL-1: Liquid infant formula: Data contribution by country to raw dataset
Country Number of samples
Australia* 22
Canada 16
New Zealand* 8
Singapore 21
USA 130
Grand Total 197
*Samples reported in the GEMS database as liquid formulas were actually powdered formulas that had been reconstituted for analysis. This paper treats these samples as liquid formulas, consistent with the way the samples were reported in the GEMS/Food database.
Table IFL-2: Liquid infant formula: Data contribution by country to LOQ-limited dataset
Country Number of samples
Australia 22
New Zealand 8
USA 130
Grand Total 160
Table IFL-3: Liquid infant formula: Mean and maximum for all datasets
Dataset Mean (mg/kg) Maximum (mg/kg)
Raw dataset 0.0007 0.011
LOQ-limited dataset 0.0004 0.011
Table IFL-4: Percentage of liquid infant formula products meeting current and hypothetical MLs: LOQ-limited dataset
Current and hypothetical MLs (mg/kg)
Percentage of samples ≤ MLs
0.02 100%
0.015* 100%
0.01 99%
0.005 97%
*Hypothetical MLs shown in italics
Table IFL-5: Percentage of liquid and powdered infant formula products meeting current and hypothetical MLs: LOQ-limited dataset
Current and hypothetical MLs (mg/kg)
Percentage of samples ≤ MLs
0.02 99%
0.015* 99%
0.01 97%
0.005 94%
*Hypothetical MLs shown in italics

CX/CF 14/8/5 34
Appendix II: List of Participants
Chair
United States of America
Lauren Posnick Robin
Review Chemist
Office of Food Safety
U.S. Food and Drug Administration
HFS-317
5100 Paint Branch Parkway
College Park, MD 20740
Tel: 240-402-1639
E-mail: [email protected]
Argentina / Argentine
Argentina Codex Contact Point E-mail: [email protected]
Australia / Australie
Dr Leigh Henderson Section Manager, Product Safety Standards Food Standards Australia New Zealand (FSANZ) E-mail: [email protected] Australian Codex Contact Point E-mail: [email protected]
Austria / Autriche
Ms Dr. Daniela Hofstädter Austrian Agency for Health and Food Safety Division Data, Statistics and Risk Assessment Tel: 0043-050-555-25703 E-mail: [email protected]
Belgium / Belgique / Bélgica
Isabel De Boosere Federal Public Service Health, Food Chain Safety and Environment DG Animal, Plant and Food (7th floor) Service Food, Feed and Other Consumption Products Eurostation II Place Victor Horta 40 box 10 1060 Brussels Belgium Tel: +32 2 524 73 84 E-mail:[email protected]
Brazil / Brésil / Brasil
Ms Lígia LINDNER SCHREINER Specialist on Regulation and Health Surveillance National Health Surveillance Agency General Office of Food SIA Trecho 5 Setor Especial 57, Bloco D, 2 andar 71205-050 Brasilia BRAZIL Tel: 55 61 34625399 Fax: 55 61 3462 5313 E-mail: [email protected]
Canada / Canadá
Annie Plourde Chemical Health Hazard Assessment Division Bureau of Chemical Safety, Food Directorate Health Canada E-mail: [email protected]
Robin Churchill E-mail: [email protected]
Kelly Hislop E-mail: [email protected]
China / Chine
Mr. Yongning WU Professor, Chief Scientist MOH Key Lab of Food Safety Risk Assessment China National Center of Food Safety Risk Assessment (CFSA) 7 PanjiayuanNanli 100021 Beijing CHINA Tel: 86-10-67779118 or 52165589 Fax: 86-10-67791253 or 52165489 E-mail: [email protected] / [email protected]
Mr Jingguang LI Professor MOH Key Lab of Food Safety Risk Assessment China National Center of Food Safety Risk Assessment (CFSA) 7 PanjiayuanNanli 100021 Beijing CHINA Tel: 86-10-67791253 E-mail: [email protected]

CX/CF 14/8/5 35
Ms Xiaowei LI MOH Key Lab of Food Safety Risk Assessment China National Center of Food Safety Risk Assessment (CFSA) Building 2 No.37, Guangqulu, Chanoyang District 100022 Beijing CHINA Tel: 86-10-52165435 E-mail: [email protected]
Ms Yi SHAO Research Associate Division II of Food Safety Standards China National Center of Food Safety Risk Assessment (CFSA) Building 2 No.37, Guangqulu, Chanoyang District 100022 Beijing CHINA Tel: 86-10-52165421 E-mail: [email protected]
Colombia / Colombie
Giovanny Cifuentes Rodriguez Profesional Especializado Ministerio de Salud y Protección Social Carrera 13 # 32 – 76 Tel: (571) 3305000 ext 1255. E-mail: [email protected]
Yuby Sulema Ascanio Profesional Universitario INVIMA E-mail: [email protected]
Wilmer Humberto Fajardo Profesional Universitario INVIMAE-mail: [email protected]
Cristian Camilo Diaz Merchan Profesional Especializadoinvima E-mail: [email protected]
Mayra Andrea Arrieta Guevara Profesional Especializado INVIMA E-mail: [email protected]
Jesus Alejandro Estevez Instituto Nacional de Vigilancia de Medicamentos y Alimentos INVIMA, Colombia Carrera 68D No. 17-11 Zona Industrial de Montevideo Bogota, Colombia E-mail: [email protected] / [email protected]
Gustavo Alvaro Wills Profesor asociado Universidad Nacional de Colombia Ciudad Universitaria Depto Ciencias para la produccion Animal Fac. Veterinaria y de Zootecnia U. Nacional - Bogotá Colombia 3165000 ext 19406 E-mail: [email protected] / [email protected]
Cyprus / Chypre / Chipre
Dr Eleni Ioannou- Kakouri Chief Chemist, EFSA focal point Head of Risk Assessment Unit & Quality Assurance Unit State General Laboratory 44 Kimonos Street, 1451 Nicosia, CYPRUS Tel: 0035722809120 Fax: 0035722316434 E-mail: [email protected] / [email protected] / [email protected] http://www.moh.gov.cy/sgl
European Union / Union Européenne / Unión Europea
Frank Swartenbroux Administrator European Commission DG Health and Consumers Unit E.3. – Chemicals, contaminants, pesticides F101 04/57 B-1049 Brussels/Belgium Tel: +32 2 299 38 54 E-mail: [email protected]
India / Inde
Name: Mr. Pramod Siwach Official Position: Assistant Director Institution: Export Inspection Council of India (EIC), Ministry of Commerce and Industry Ndymca, 1 Jai Singh Road, New Delhi 110001 India Tel: +91-11-23341263, 23365540 E-mail: [email protected] India
Mr. Aditya Jain Official Position: Manager Institution: National Dairy Development Board (NDDB), Safdarjang enclave, New Delhi, 110029 Tel: +91-11-49883000 E-mail: [email protected], [email protected] Country: India
Vinod Kotwal Director National Codex Contact Point Food Safety and Standards Authority of India Ministry of Health and Family Welfare FDA Bhawan, Kotla Road, New Delhi -110002 INDIA Tel: +91-11-23237439 E-mail: [email protected]
Japan / Japon / Japón
Mr. Yuusuke UEDA Technical Official Standards and Evaluation Division, Department of Food Safety, Ministry of Health, Labour and Welfare 1-2-2 Kasumigaseki, Chiyoda-ku Tokyo 100-8916, Japan Tel: +81-3-3595-2341 Fax: +81-3-3501-4868 E-mail: [email protected]
CX/CF 14/8/5 36
Mr. Tetsuo URUSHIYAMA Assistant Director Plant Products Safety Division, Food Safety and Consumer Affairs Bureau, Ministry of Agriculture, Forestry and Fisheries 1-2-1 Kasumigaseki, Chiyoda-ku Tokyo 100-8907, Japan Tel: +81-3-3502-0306 Fax: +81-3-3580-8592 E-mail: [email protected] copy to: [email protected]
Mr. Ryouta NAKAMURA Section Chief Food Safety and Consumer Policy Division, Food Safety and Consumer Affairs Bureau, Ministry of Agriculture, Forestry and Fisheries 1-2-1 Kasumigaseki, Chiyoda-ku Tokyo 100-8907, Japan Tel: +81-3-3502-7674 Fax: +81-3-3597-0329 E-mail: [email protected]
Republic of Korea / République de Corée / República de Corea
Gang-bong Lee Ministry of Food and Drug Safety-Contact point E-mail: [email protected] Deputy directior E-mail: [email protected] Hayun Bong Official title: Codex Researcher E-mail address: [email protected]
Malaysia / Malaisie / Malasia
Ms. Nik Shabnam binti Nik Mohd Salleh Deputy Director Standard and Codex Branch Food Safety and Quality Division Ministry of Health Malaysia Tel: +603 8885 0781 E-mail: [email protected] Malaysia Codex Contact Point: [email protected]
Moldova
Dr. Elena Jardan Head of Experimental Toxicology Laboratory Chemical Safety and Toxicology Department National Center for Public Health Ministry of Health Republic of Moldova MD 2028, 67 a Gheorghe Asachi street Tel: +373 22 574-642 Cell: +373 069 508 626 E-mail: [email protected] / [email protected]
New Zealand / Nouvelle-Zélande / Nueva Zelandia
John Reeve Food Risk Assessment Principle Adviser Toxicology Level 10 Pastoral House 25 The Terrace Wellington New Zealand Tel: +64-4 8942533 E-mail: [email protected]
Russian Federation / Fédération de Russie / Federación de Rusia
Sergey Hotimchenko Head of the Laboratory E-mail: [email protected]
Vladimir Bessonov Head of the Laboratory E-mail: [email protected]
Igor Kon Head of the Department E-mail: [email protected]
Spain / Espagne / España
Mª Ignacia Martín de la Hinojosa Position: Arbitral Agrifood Laboratory institution: Ministry of Agriculture, Food and Environment E-mail: [email protected]
Manuela Mirat Temes Position: Arbitral Agrifood Laboratory institution: Ministry of Agriculture, Food and Environment E-mail: [email protected]
Thailand / Thaïlande / Tailandia
Mrs. Chutiwan Jatupornpong Standards officer, Office of Standard Development, National Bureau of Agricultural Commodity and Food Standards, 50 Phaholyothin Road, Ladyao, Chatuchak, Bangkok 10900 Thailand Tel (+662) 561 2277 Fax (+662) 561 3357, (+662) 561 3373 E-mail: [email protected], [email protected]
United Kingdom / Reino Unido
Ian Smith Agricultural Environmental and Process Contaminants Chemical Safety Division Food Standards Agency E-mail [email protected] Tel +44(0)207 276 8375
United States of America / États-Unis d’Amérique / Estados Unidos de América
Nega Beru U.S. Delegate, CCCF Director, Office of Food Safety U.S. Food and Drug Administration HFS-300 5100 Paint Branch Parkway College Park, MD 20740 Tel: 240-402-1700 E-mail: [email protected]
Henry Kim Branch Chief Office of Food Safety U.S. Food and Drug Administration HFS-317 5100 Paint Branch Parkway College Park, MD 20740 Tel: 240-402-2023
CX/CF 14/8/5 37
E-mail: [email protected]
Yinqing Ma Consumer Safety Officer Office of Food Safety U.S. Food and Drug Administration HFS-317 5100 Paint Branch Parkway College Park, MD 20740 Tel: 240-402-2479 E-mail: [email protected]
Lauren Posnick Robin Review Chemist Office of Food Safety U.S. Food and Drug Administration HFS-317 5100 Paint Branch Parkway College Park, MD 20740 Tel: 240-402-1639 E-mail: [email protected]
Uruguay
Raquel Huertas Head of Laboratory LABORATORIO TECNOLOGICO DEL URUGUAY E-mails: TO: [email protected] CC: [email protected]
FoodDrinkEurope
Patrick Fox FoodDrinkEurope E-mail: [email protected] Tel: +3225008756
International Alliance of Dietary/Food Supplement Associations (IADSA)
Yi Fan Jiang Tel: +65 6681 0105 E-mail: [email protected]
David Pineda Ereño Director, Regulatory Affairs Tel: +32 2209 1155 E-mail: [email protected]
International Council of Grocery Manufacturers Associations (ICGMA)
Adrienne Black, PhD, DABT Sr. Manager, Science Policy and Chemical Safety 1-202-637-5972 GMA 1350 I Street NW, Suite 300 Washington, DC 20005 E-mail: [email protected]
International Dairy Federation (IDF)
Mrs. Aurélie Dubois IDF Standards Officer International Dairy Federation (FIL-IDF) Silver Building Bd. Auguste Reyers 70/B 1030 Brussels Belgium Tel.: +32 2 325 67 45 Fax: +32 2 325 6741 E-mail: [email protected]
International Federation of Fruit Juice Producers (IFU)
Dr Hany Farag, BS., JD. Vice-Chairman of the Commission for Legislation of the IFU Vice President - Quality and Regulatory Affairs Dole Packaged Foods, LLC. One Dole Drive Westlake Village, CA 91362 Tel: +1.818.874.4857 / Fax: +1.818.874.6857 E-mail: [email protected] / [email protected]
CX/CF 14/8/5 38
International Special Dietary Foods Industries (ISDI)
Alessandro Fiorelli Secretary General ISDI Rue de l’Association 50 1000 Brussels Belgium TEL + 32 2 209 11 43 FAX + 32 2 219 73 42 Alessandro Fiorelli <[email protected]>
WORLD HEALTH ORGANIZATION (WHO)
FAO/WHO Joint Expert Committee on Food Additives (JECFA)
Philippe Jean-Paul Verger Department of Food Safety and Zoonoses World Health Organization Avenue Appia 1211 Geneva 27 Switzerland Tel: +41 22 791 3569 Fax: +41 22 791 4848 E-mail: [email protected]
Katie Egan Temporary Advisor to WHO US FDA, Retired