Embed Size (px)
Citation preview
i
CYANOBACTERIA PRESENCE IN FOUR LAKES IN THE
HALIFAX REGIONAL MUNICIPALITY (HRM), NOVA SCOTIA
by
Rebecca A. Betts
Submitted in partial fulfilment of the requirements
for the degree of Master of Applied Science
at
Dalhousie University
Halifax, Nova Scotia
July 2018
© Copyright by Rebecca A. Betts, 2018

ii
For Rob and Doug:
I wouldn’t have been here if it wasn’t for you two. Thanks for believing in me.
iii
TABLE OF CONTENTS
LIST OF TABLES ................................................................................................................. vii
LIST OF FIGURES .............................................................................................................. viii
ABSTRACT ............................................................................................................................ xi
LIST OF ABBREVIATIONS USED ................................................................................... xii
ACKNOWLEDGEMENTS.................................................................................................. xiii
CHAPTER 1 INTRODUCTION ............................................................................................ 1
1.1. CYANOBACTERIA .................................................................................................... 1
1.2. CONCERNS ASSOCIATED WITH CYANOBACTERIA ...................................... 3
1.2.1. Algal Blooms and Cyanotoxins .................................................................................. 3
1.2.2. Geosmin and 2-methylisoborneol ............................................................................... 4
1.3. FACTORS THAT INFLUENCE BLOOMS............................................................... 4
1.3.1. Eutrophication ........................................................................................................... 4
1.3.2. Climate Change and Lake Recovery from Acidification ............................................. 5
1.4. ALGAL BLOOMS IN NOVA SCOTIA ..................................................................... 6
1.5. RESEARCH OBJECTIVES ......................................................................................... 8
CHAPTER 2 METHODOLOGY ........................................................................................... 9
2.1. SAMPLE LOCATIONS ............................................................................................... 9
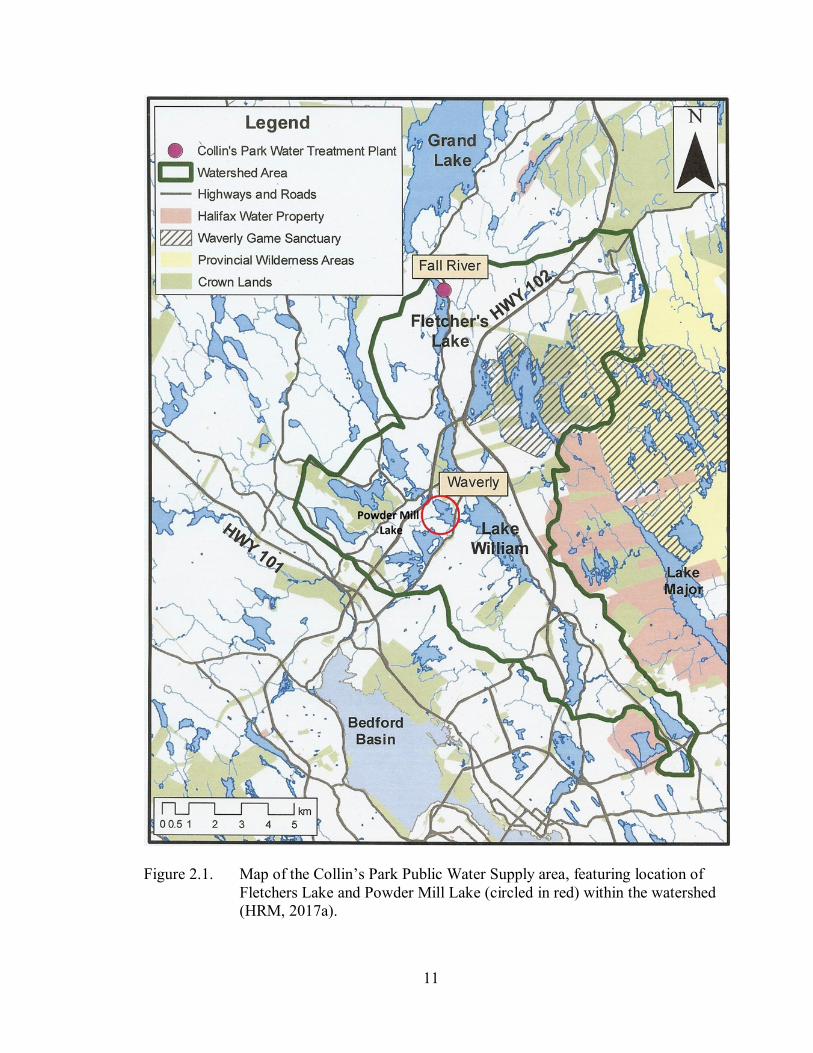
2.1.1. Fletchers Lake ........................................................................................................... 9
2.1.2. Powder Mill Lake .................................................................................................... 12
2.1.3. Pockwock Lake ....................................................................................................... 12
2.1.4. Lake Major .............................................................................................................. 15
2.2. CYANOBACTERIA POPULATION ANALYSIS.................................................. 17
2.2.1. Sample Collection ................................................................................................... 17
2.2.2. Isolation and Filtration ............................................................................................. 18
2.2.3. Storage .................................................................................................................... 19
2.2.4. DNA Extraction ....................................................................................................... 19
2.2.5. Cyanobacteria DNA Sequencing .............................................................................. 20
2.3. WATER CHEMISTRY .............................................................................................. 22
2.3.1. Sample Collection ................................................................................................... 22
2.3.2. Alkalinity and pH .................................................................................................... 23
2.3.3. Total Organic Carbon and Dissolved Organic Carbon .............................................. 23
iv
2.3.4. Total Nitrogen and Total Phosphorus ....................................................................... 23
2.3.5. UV254, Specific Ultraviolet Absorbance, Turbidity and Colour ................................. 24
2.4. ENVIRONMENT DATA ........................................................................................... 24
CHAPTER 3 RESULTS ........................................................................................................ 25
3.1. CYANOBACTERIA POPULATION ANALYSIS.................................................. 25
3.1.1. Fletchers Lake ......................................................................................................... 25
3.1.1.1. Class Chloroplast ............................................................................................. 27
3.1.1.2. Order Gloeobacterales ...................................................................................... 27
3.1.1.3. Order Nostocales.............................................................................................. 28
3.1.1.4. Order Chroococcales ........................................................................................ 29
3.1.1.5. Order Oscillatoriales ........................................................................................ 29
3.1.1.6. Order Pseudanabaenales ................................................................................... 30
3.1.1.7. Order Synechococcales .................................................................................... 30
3.1.2. Powder Mill Lake .................................................................................................... 31
3.1.2.1. Class Chloroplast ............................................................................................. 33
3.1.2.2. Order Gloeobacterales ...................................................................................... 34
3.1.2.3. Order Nostocales.............................................................................................. 34
3.1.2.4. Order Chroococcales ........................................................................................ 35
3.1.2.5. Order Oscillatoriales ........................................................................................ 36
3.1.2.6. Order Pseudanabaenales ................................................................................... 36
3.1.2.7. Order Synechococcales .................................................................................... 37
3.1.3. Pockwock Lake ....................................................................................................... 37
3.1.3.1. Class Chloroplast ............................................................................................. 39
3.1.3.2. Order Gloeobacterales ...................................................................................... 40
3.1.3.3. Order Nostocales.............................................................................................. 40
3.1.3.4. Order Chroococcales ........................................................................................ 41
3.1.3.5. Order Oscillatoriales ........................................................................................ 42
3.1.3.6. Order Pseudanabaenales ................................................................................... 42
3.1.3.7. Order Synechococcales .................................................................................... 43
3.1.4. Lake Major .............................................................................................................. 43
3.1.4.1. Class Chloroplast ............................................................................................. 45
3.1.4.2. Order Gloeobacterales ...................................................................................... 45
3.1.4.3. Order Nostocales.............................................................................................. 45
3.1.4.4. Order Chroococcales ........................................................................................ 45
v
3.1.4.5. Order Oscillatoriales ........................................................................................ 46
3.1.4.6. Order Pseudanabaenales ................................................................................... 46
3.1.4.7. Order Synechococcales .................................................................................... 46
3.2. WATER CHEMISTRY .............................................................................................. 46
3.2.1. Fletchers Lake ......................................................................................................... 46
3.2.1.1. Water Chemistry of Treatment Plant Water ...................................................... 46
3.2.1.2. Water Chemistry of Streams and Tributary Samples ......................................... 47
3.2.2. Powder Mill Lake .................................................................................................... 48
3.2.3. Pockwock Lake ....................................................................................................... 49
3.2.3.1. Water Chemistry of In-Lake Samples ............................................................... 49
3.2.3.2. Water Chemistry of Streams and Tributary Samples ......................................... 50
3.2.4. Lake Major .............................................................................................................. 51
3.2.4.1. Water Chemistry of Pump House Samples ....................................................... 51
3.2.4.2. Water Chemistry of Streams and Tributary Samples ......................................... 52
3.3. ENVIRONMENT DATA ........................................................................................... 53
3.3.1. June ......................................................................................................................... 53
3.3.1.1. Temperature ..................................................................................................... 53
3.3.1.2. Precipitation ..................................................................................................... 53
3.3.1.3. Wind Speed ..................................................................................................... 54
3.3.2. July ......................................................................................................................... 56
3.3.2.1. Temperature ..................................................................................................... 56
3.3.2.2. Precipitation ..................................................................................................... 56
3.3.2.3. Wind Speed ..................................................................................................... 56
3.3.3. August ..................................................................................................................... 58
3.3.3.1. Temperature ..................................................................................................... 58
3.3.3.2. Precipitation ..................................................................................................... 58
3.3.3.3. Wind Speed ..................................................................................................... 58
3.3.4. September ............................................................................................................... 60
3.3.4.1. Temperature ..................................................................................................... 60
3.3.4.2. Precipitation ..................................................................................................... 60
3.3.4.3. Wind Speed ..................................................................................................... 60
3.3.5. October ................................................................................................................... 62
3.3.5.1. Temperature ..................................................................................................... 62
3.3.5.2. Precipitation ..................................................................................................... 62
vi
3.3.5.3. Wind Speed ..................................................................................................... 62
3.3.6. November ................................................................................................................ 64
3.3.6.1. Temperature ..................................................................................................... 64
3.3.6.2. Precipitation ..................................................................................................... 64
3.3.6.3. Wind Speed ..................................................................................................... 64
CHAPTER 4 DISCUSSION ................................................................................................. 66
4.1. CYANOBACTERIA POPULATION ANALYSIS.................................................. 66
4.1.1. Cyanobacteria Presence ........................................................................................... 66
4.1.2. PCR Amplification Failure ...................................................................................... 70
4.1.2.1. Low Cyanobacteria Concentration.................................................................... 70
4.1.2.2. Naturally Occurring Inhibitors ......................................................................... 72
4.1.3. Potential Seasonality Observed in Failed Sample Occurrence .................................. 72
4.2. WATER CHEMISTRY .............................................................................................. 73
4.2.1. Alkalinity and pH .................................................................................................... 73
4.2.2. Total Organic Carbon and Dissolved Organic Carbon .............................................. 73
4.2.3. Total Nitrogen and Total Phosphorus ....................................................................... 74
4.2.4. UV254, Specific Ultraviolet Absorbance, Turbidity and Colour ................................. 75
4.2.5. Data Range for Tributary and Stream Samples ......................................................... 76
4.3. ENVIRONMENT DATA ........................................................................................... 77
CHAPTER 5 CONCLUSION ............................................................................................... 78
REFERENCES ....................................................................................................................... 81
APPENDIX A ........................................................................................................................ 91
APPENDIX B ......................................................................................................................... 96
APPENDIX C ....................................................................................................................... 100
APPENDIX D ...................................................................................................................... 105
vii
LIST OF TABLES
Table 4.1. Comparison of cyanobacteria isolates detected between June and
November, 2016. .................................................................................... 67
Table 4.2. Summary table of cyanobacteria genera associated with cyanotoxins
detected between June and November 2016 ............................................ 68
Table 4.3. Trophic status indexes for TP and TN concentrations according to
CCME (2004) and Nürnberg (1996) ....................................................... 74
viii
LIST OF FIGURES
Figure 1.1. Cyanobacteria assemblages, both coccoid and filamentous, found in
mats and laboratory cultures in Abed et al (2013) ..................................... 2
Figure 2.1. Map of the Collin’s Park Public Water Supply area, featuring location
of Fletchers Lake and Powder Mill Lake (circled in red) within the
watershed (HRM, 2017a) ........................................................................ 11
Figure 2.2. Map of the Pockwock Lake and Tomahawk Lake Watershed areas,
featuring Pockwock Lake within the watershed (HRM, 2017c) ............... 14
Figure 2.3. Map of the Lake Major Watershed area, featuring location of Lake
Major within the watershed (HRM, 2017b) ............................................. 16
Figure 2.4. (a) A 70µm nylon mesh filter; (b) autoclaved tweezers and 0.22 µm
PES filter discs; (c) set up used for vacuum filtration of sample
water through a PES filter ....................................................................... 18
Figure 2.5. Example of a PES filter post vacuum filtration being prepared for
storage .................................................................................................... 19
Figure 2.6. Example calculation for the determination of ratios between detected
cyanobacteria isolates ............................................................................. 21
Figure 3.1. Overall proportion of OTU reads detected in samples from Fletchers
Lake, for September and October. See Appendix A for tabulated
proportion of reads per month and order composition per month............. 26
Figure 3.2. Taxa composition for the class Chloroplast for Fletchers Lake
samples .................................................................................................. 27
Figure 3.3. Taxa composition for the order Nostocales for Fletchers Lake
samples .................................................................................................. 28
Figure 3.4. Taxa composition for the order Chroococcales for Fletchers Lake
samples .................................................................................................. 29
Figure 3.5. Taxa composition for the order Pseudanabaenales for Fletchers Lake
samples .................................................................................................. 30
Figure 3.6. Overall proportion of OTU reads detected in samples from Powder
Mill Lake, for July, August, September, October and November. See
Appendix B for tabulated proportion of reads per month and order
composition per month. .......................................................................... 32
ix
Figure 3.7. Taxa composition for the class Chloroplast for Powder Mill Lake
samples .................................................................................................. 33
Figure 3.8. Taxa composition for the order Nostocales for Powder Mill Lake
samples .................................................................................................. 34
Figure 3.9. Taxa composition for the order Chroococcales for Powder Mill Lake
samples. ................................................................................................. 35
Figure 3.10. Overall proportion of OTU reads detected in samples collected from
in-lake and from tributaries at Pockwock Lake, for July, August,
September and October. See Appendix C for tabulated proportion of
reads per month and order composition per month .................................. 38
Figure 3.11. Taxa composition for the class Chloroplast for Pockwock Lake
samples .................................................................................................. 39
Figure 3.12. Taxa composition for the order Chroococcales for Pockwock Lake
samples .................................................................................................. 41
Figure 3.13. Taxa composition for the order Pseudanabaenales for Pockwock Lake
samples .................................................................................................. 42
Figure 3.14. Overall proportion of OTU reads detected in samples collected from
tributaries and the pump house at Lake Major for July. See Appendix
D for tabulated proportion of reads per month and order composition
per month ............................................................................................... 44
Figure 3.15. Taxa composition for the class Chloroplast for Lake Major samples. ...... 45
Figure 3.16. (a) Temperature data for June, collected from the Bedford Range
weather station (GC, 2016b); (b) Precipitation data for Bedford, NS, for
June, collected from The Weather Network’s historical weather
database (TWN, 2017); (c) Wind speed data for June, collected from
the Bedford Range weather station (GC, 2016b) ..................................... 55
Figure 3.17. (a) Temperature data for July, collected from the Bedford Range
weather station (GC, 2016b); (b) Precipitation data for Bedford, NS, for
July, collected from The Weather Network’s historical weather
database (TWN, 2017); (c) Wind speed data for July, collected from
the Bedford Range weather station (GC, 2016b) ..................................... 57
x
Figure 3.18. (a) Temperature data for August, collected from the Bedford Range
weather station (GC, 2016b); (b) Precipitation data for Bedford, NS, for
August, collected from The Weather Network’s historical weather
database (TWN, 2017); (c) Wind speed data for August, collected
from the Bedford Range weather station (GC, 2016b) ............................. 59
Figure 3.19. (a) Temperature data for September, collected from the Bedford Range
weather station (GC, 2016b); (b) Precipitation data for Bedford, NS, for
September, collected from The Weather Network’s historical weather
database (TWN, 2017); (c) Wind speed data for September, collected
from the Bedford Range weather station (GC, 2016b) ............................. 61
Figure 3.20. (a) Temperature data for October, collected from the Bedford Range
weather station (GC, 2016b); (b) Precipitation data for Bedford, NS, for
October, collected from The Weather Network’s historical weather
database (TWN, 2017); (c) Wind speed data for October, collected
from the Bedford Range weather station (GC, 2016b) ............................. 63
Figure 3.21. (a) Temperature data for November, collected from the Bedford Range
weather station (GC, 2016b); (b) Precipitation data for Bedford, NS, for
November, collected from The Weather Network’s historical weather
database (TWN, 2017); (c) Wind speed data for November, collected
from the Bedford Range weather station (GC, 2016b) ............................. 65
Figure 4.1. A tributary sample undergoes an initial filtration to remove debris
larger than 70 µm prior to vacuum filtration for cyanobacteria
isolation .................................................................................................. 71
xi
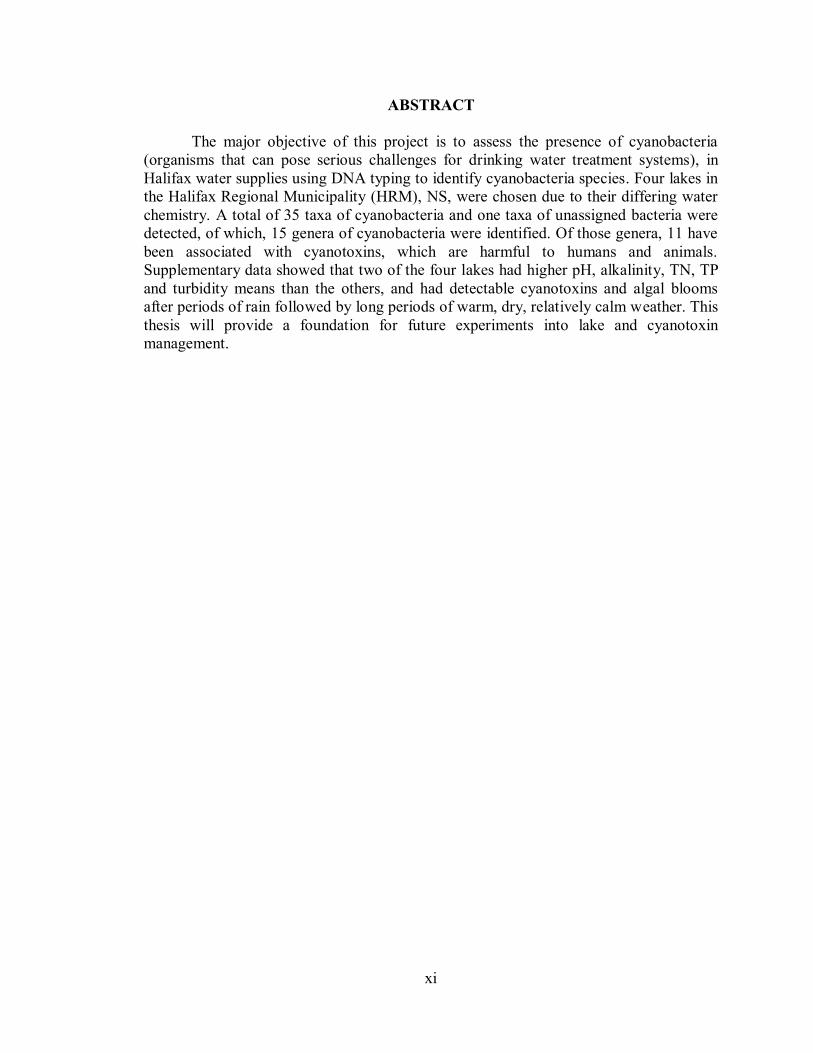
ABSTRACT
The major objective of this project is to assess the presence of cyanobacteria
(organisms that can pose serious challenges for drinking water treatment systems), in
Halifax water supplies using DNA typing to identify cyanobacteria species. Four lakes in
the Halifax Regional Municipality (HRM), NS, were chosen due to their differing water
chemistry. A total of 35 taxa of cyanobacteria and one taxa of unassigned bacteria were
detected, of which, 15 genera of cyanobacteria were identified. Of those genera, 11 have
been associated with cyanotoxins, which are harmful to humans and animals.
Supplementary data showed that two of the four lakes had higher pH, alkalinity, TN, TP
and turbidity means than the others, and had detectable cyanotoxins and algal blooms
after periods of rain followed by long periods of warm, dry, relatively calm weather. This
thesis will provide a foundation for future experiments into lake and cyanotoxin
management.
xii
LIST OF ABBREVIATIONS
BMAA β-methylamino-L-alanine
BSC biological safety cabinet
DOC dissolved organic carbon
MC-LR microcystin-LR
MDL minimum detection limit
MIB 2-methylisoborneol
NOM natural organic matter
NTU Nephelometric Turbidity Units
OTU operational taxanomic unit
PCR polymerase chain reaction
PES polyethersulfone
rRNA ribosomal ribonucleic acid
SUVA specific ultraviolet absorbance
TOC total organic carbon
TN total nitrogen
TP total phosphorous
xiii
ACKNOWLEDGEMENTS
I would like to first thank NSERC, Halifax Water, Luminultra, the CBRM Water Utility,
Mantech, AGAT Laboratories and CBCL, Ltd., without whom our research at CWRS at
Dalhousie University would not be possible. Thank you for your generous contributions.
I would like to thank Dr. Graham Gagnon, Dr. Rob Jamieson, Dr. Ian Spooner, and Dr.
Tony Walker for being on my thesis committee and providing invaluable advice and
expertise.
Thank you to everyone at CWRS, especially the following: Lindsay Anderson, Michael
Brophy and Dave Redden for allowing me to use your data in my thesis; and Nicole
Allward, Heather Daurie, Allison Mackie and Yu Ri Park, for analysing samples, for
keeping the lab in tip-top shape, and for teaching me various lab procedures.
I would like to thank Dr. André Comeau at CGEB-IMR, for analysing my large number
of samples for cyanobacteria, and for being patient whenever I asked questions.
Thank you to Dewey Dunnington (and Dr. Spooner) for letting me come with them to do
sediment core sampling, but also for the use of their boat.
A big thank you to Kyle Connolly, Salam Elborno, Kaycie Lane and Mikaela Zwicker for
driving me out to Powder Mill Lake (and sometimes paddling the kayak with me) so that
I could collect water samples.
Thank you to Dr. Zoreh Asaee, Dr. Mohamad Azadeh, Matt Davidson, Davide De Cicco,
Mehdi Ghasemi and Mobarka Mohamed for being so kind and friendly. I couldn’t have
asked for better office mates.
And a very warm, heartfelt thank you to all of my friends and family who supported me
through these years. I love you all dearly.
1
CHAPTER 1 INTRODUCTION
1.1. CYANOBACTERIA
Cyanobacteria, also known as blue-green algae, are a phylum of single celled
bacteria that have existed for roughly 3.5 billion years and range in size between 0.5 µm
to 40 µm in diameter (Maier et al, 2000; Waterbury, 2006; Percival and Williams, 2014).
Characteristic of this phylum are the presence of phycobiliproteins, specialized accessory
pigments that are arranged into light-harvesting complexes called phycobilisomes
(Whitton and Potts, 2000; Rastogi et al, 2015; Hunter et al, 2017). These pigments,
phycocyanin, phycoerythrin and allophycocyanin, aid chlorophyll-α in photosynthesis,
and give cyanobacteria their blue-green color.
Other notable characteristics of certain cyanobacteria include the presence of gas
vacuoles, heterocysts and/or akinetes (Whitton and Potts, 2000; Percival and Williams,
2014). Gas vacuoles are comprised of large numbers of ridged, hollow gas vesicles that
are stacked together in hexagonal arrays. These gas vacuoles allow cyanobacteria to be
buoyant and thus be move throughout the water column more efficiently than non-motile
microorganisms, even in low light conditions. Heterocysts, which aid in nitrogen fixation,
typically develop when nitrogen becomes a limited resource, giving cyanobacteria an
ecological advantage over eukaryotic algae in nitrogen poor environments. In extremely
adverse conditions, cyanobacteria capable of developing heterocysts can also develop
akinetes, dormant, thick walled cells that can withstand desiccation and extreme
temperatures.
Cyanobacteria can exist in a variety of forms in salt and fresh water environments,
and in soil (Whitton and Potts, 2000; Waterbury, 2006; Moreira et al, 2014). Although
single celled, cyanobacteria can form colonies to form filamentous chains, coccoidal
spheres, free floating planktonic colonies, or mats. They can also form complexes with
other organisms such as green algae, heterotrophic microbes, fungi, or organic material to
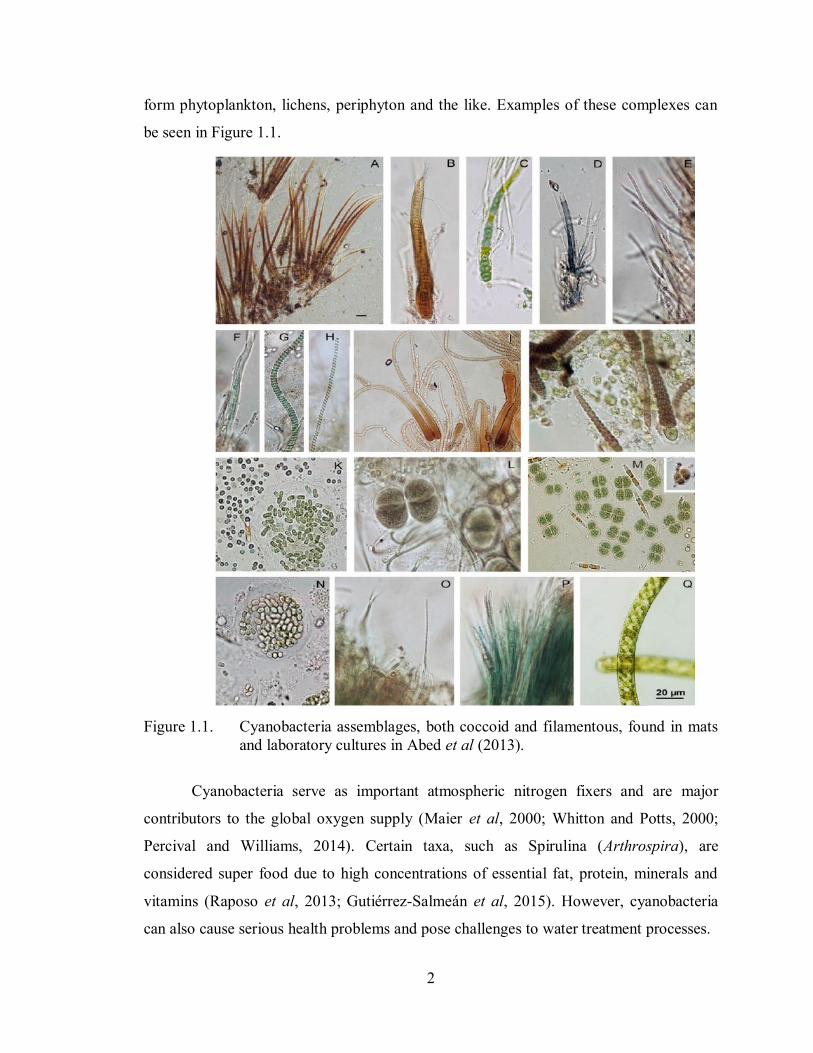
2
form phytoplankton, lichens, periphyton and the like. Examples of these complexes can
be seen in Figure 1.1.
Figure 1.1. Cyanobacteria assemblages, both coccoid and filamentous, found in mats
and laboratory cultures in Abed et al (2013).
Cyanobacteria serve as important atmospheric nitrogen fixers and are major
contributors to the global oxygen supply (Maier et al, 2000; Whitton and Potts, 2000;
Percival and Williams, 2014). Certain taxa, such as Spirulina (Arthrospira), are
considered super food due to high concentrations of essential fat, protein, minerals and
vitamins (Raposo et al, 2013; Gutiérrez-Salmeán et al, 2015). However, cyanobacteria
can also cause serious health problems and pose challenges to water treatment processes.
3
1.2. CONCERNS ASSOCIATED WITH CYANOBACTERIA
1.2.1. Algal Blooms and Cyanotoxins
Algal blooms can block water treatment filters, cause a variety of taste and odour
problems, and can negatively impact lake biota by forming surface scum (Whitton and
Potts, 2000). Surface blooms deoxygenate water and blocks sunlight from reaching lower
water strata, making lakes uninhabitable for flora and fauna alike Algal blooms can
remain for hours, days, or even months under the right conditions.
Although algal blooms can be caused by other organisms, such as flagellates,
diatoms and green algae, blooms caused by cyanobacteria come with a particular health
risk: cyanotoxins (World Health Organization (WHO), 1999; Whitton and Potts, 2000;
Carmichael and Boyer, 2016; Buratti et al, 2017). Cyanotoxins are toxins produced by
cyanobacteria and can be categorized into five toxin classes:
i. Hepatotoxins – Microcystin and nodularin are cyclic peptides that can cause life
threatening liver haemorrhages at acute doses and promote tumour growth. They
are the most common cyanotoxin produced by cyanobacteria.
ii. Neurotoxins – The alkaloids anatoxin and saxitoxin, and the non-proteinogenic
amino acid β-methylamino-L-alanine (BMAA), target nerve axons and synapses.
They can cause a loss of muscle control and death by respiratory distress.
iii. Cytotoxins – Cylindrospermopsin, an alkaloid, invokes widespread tissue damage
to the liver, kidneys and lymphatic tissue.
iv. Dermatotoxins – Aplysiatoxin and lyngbyatoxin are also alkaloids, and can cause
skin irritation and dermal lesions.
v. Endotoxins – All cyanobacteria can cause gastrointestinal distress.
4
1.2.2. Geosmin and 2-methylisoborneol
Cyanobacteria have also been associated with the organic compounds geosmin
and 2-methylisoborneol (MIB), saturated cyclic tertiary alcohols that can cause water to
have a musty flavour and taste, and that are difficult to remove with conventional
treatment processes (Izaguirre et al, 1982; Izaguirre and Taylor, 2004). It has been
reported that both compounds are metabolites produced by cyanobacteria, actinomycetes
and proteobacteria (Suurnäkki et al, 2015; Lee et al, 2017).
1.3. FACTORS THAT INFLUENCE BLOOMS
1.3.1. Eutrophication
Eutrophication in lakes occurs when excessive amounts of nutrients, in particular
nitrogen (N) and phosphorus (P), are added to the water system from sources such as
fertilizer run off, manure, and sewage (Paerl et al, 2015, 2016; Schindler et al, 2016).
Lakes where phosphorus is high in ratio to other nutrients such as carbon and nitrogen,
tend to be more favourable environments for cyanobacteria growth (Schindler et al, 2016;
Verhamme et al, 2016; Lin et al, 2017).
For example, toxic algal blooms influenced by eutrophication due to high levels
of phosphorus from fertilizer, manure and sewage have become a yearly occurrence in
Lake Erie (Kelly, 2015; Barber, 2016). Most notably, in 2014, Toledo, Ohio, was forced
to shut down their water supply systems due to a massive, severely toxic, algal bloom.
For three days, there was a ban on drinking and tap water due to high levels of
microcystin from the algal bloom. More than 400,000 residents in Toledo, and 30,000
residents in South-East Michigan were effected.
In Nova Scotia, it is believed that discharge from mink farms and mink food
processing facilities have been the cause of eutrophication in watersheds in Yarmouth
and Digby County (Taylor, 2009; Brylinsky, 2011). The discharge contains very high
5
concentrations of phosphorus, making it the most likely source of phosphorus available
for cyanobacteria to consume. What complicates matters is that half of all Canadian mink
farms are located in Nova Scotia, of which, 85% of provincial production originated out
of Yarmouth and Digby County as of 2012, making these areas high risk for algae and
cyanobacteria blooms (CBC News, 2012).
1.3.2. Climate Change and Lake Recovery from Acidification
Rising temperatures and longer seasons caused by climate change results in
higher temperatures and prolonged thermal stratification within lakes, preferred growth
conditions for cyanobacteria (Whitton and Potts, 2000; Pick, 2016). Drought conditions
can also be beneficial to cyanobacteria if periods of intense rainfall occurred prior to the
drought, which would affect nutrient flow into watersheds and prolong stratification in
lakes (Paerl et al, 2016; Pick, 2016).
Another factor influencing the rise in algal and cyanobacteria blooms could also
lie in the process of lake recovery from acidification. There are several environmental
factors that affect lake recovery: watershed disturbance, surrounding forest type, wetland
coverage, soil type, bedrock geology, lake topography, hydrology, water chemistry, and
magnitude of acid reduction (Jeffries et al, 2003a; Ginn et al, 2015). Atmospheric acid
deposition of sulfur oxides (SOx) and nitrogen oxides (NOx) via acid rain is particularly
concerning, as the long range transport of these chemicals can cause an increase of
nutrients into nutrient limited ecosystems (Walker et al, 2003).
However, due to emissions regulations in the United States (Clean Air Act),
Canada (Eastern Canada Acid Rain Program), and Europe (United Nation’s Economic
Commission for Europe’s Convention on Long Range Transboundary Air Pollution),
atmospheric acid deposition of SOx and NOx in the form of acid rain has decreased across
North America and Europe since the 1980’s (Stoddard et al, 1999; Jeffries et al, 2003a).
As of 2003, total emissions of sulfur dioxide (SO2) in North America had decreased by
roughly 40% since the 1980’s (Jeffries et al, 2003a). Although NOx affects acidification,
6
SOx plays a more important role in acid deposition and has experienced a larger decrease
than NOx (Jeffries et al, 2003a,b).
In Nova Scotia, lakes are typically acidic due to naturally occurring organic acids
and bedrock geology, whereby silica-based gneiss and granite are acid sensitive due to
limited carbonate sources and low base cation concentrations (Jeffries et al, 2003b; Ginn
et al, 2015). Lake pH has been further depressed by long-range transport of sulphate
(SO42-
) from industrial centers in northeastern United States, the Laurentian Great lakes
Area and local oil refineries and power generating stations, as well as by natural
acidification from organic anions (Ginn et al, 2015).
According to studies performed during the 1990’s, there were no trends showing
lake recovery from acidification in lakes in Nova Scotia (Jeffries et al, 2003a). However,
according to Anderson et al (2017), several drinking water supplies in Nova Scotia have
been showing signs of lake recovery in recent years. Sulfur oxide deposition has been
decreasing, resulting in increased dissolved organic carbon (DOC). There has also been a
rise in natural organic matter (NOM), colour and geosmin occurrence. Lake recovery
from acidification could potentially mean the return of fish populations to water bodies,
and the increase of cyanobacteria activity, as the chemical and biological effects of
acidification are decreased (Jeffries et al 2003a,b).
1.4. ALGAL BLOOMS IN NOVA SCOTIA
As mentioned previously, lakes in Nova Scotia are typically acidic due to
naturally occurring organic acids and bedrock geology (Jeffries et al, 2003b; Ginn et al,
2015). However, due to influencing factors like eutrophication from mink farms, climate
change, and potential lake recovery from acidification, blooms, even toxic blooms caused
by cyanobacteria, have not been unusual to the province within the last decade (Whitton
and Potts, 2000; Taylor, 2009; Brylinsky, 2011; Pick, 2016; Anderson et al, 2017).
7
Mattatall Lake, shared between Colchester County and Cumberland County has
experienced algal blooms since 2005 (Mathieson, 2015; Campbell, 2016; Tetanish,
2016). It has also been reported that these blooms can persist into November or even
January. However, in 2017, there was no bloom observed at Mattatall Lake (Sullivan,
2017). Locals observed that unlike in previous years, the lake was clear, vegetation had
begun to grow on the bottom of the lake, and a species of frog had returned. Yarmouth
County and Digby County have experienced algal blooms every year since 2007
(Province of Nova Scotia (PNS), 2007, 2016f; Wendland, 2011; Lavoie, 2014; Allen,
2016). Of note, blooms have been observed in Lake Fanning, Parr Lake, Ogden Lake and
Lake Vaughan in Yarmouth County, and Porcupine Lake in Digby County.
Other areas of note include Inverness County, where Lake Ainslie has had algal
blooms in 2009 and 2010, and both the Southwest Margaree River and Margaree River
have exhibited blooms in 2009 (PNS, 2009a,b, 2010). Lochaber Lake, located in both
Antigonish County and Guysborogh County, experienced an algal bloom in 2012
(Lochaber Community Development Association, 2012). In Kings County, Lumsden
Pond in the Lumsden Pond Provincial Park in Wolfville was reported to have algal
blooms in 2013 and 2016, while Lake Torment has experienced blooms since at least
2014 (PNS, 2013b, 2014, 2015, 2016b,d; Tetanish, 2016). In 2015, an algal bloom was
reported in Sherbrooke Lake in Lunenburg County, and in 2016 an algal bloom was
reported in Middle River in Pictou County (PNS, 2016e; Tetanish, 2016).
Algal blooms have even been reported in Halifax County, albeit only in recent
years. Algal blooms were reported at Powder Mill Lake in Waverley in 2016, and in
Oathill Lake in Dartmouth in 2017 (PNS, 2016c; Meloney, 2017). However, the bloom in
Oathill Lake was determined to be a green algae bloom, and was not definitively
associated with cyanobacteria.
8
1.5. RESEARCH OBJECTIVES
Information regarding cyanobacteria, cyanotoxins and algal blooms is limited in
Atlantic Canada. This is problematic as climate change and human activity have
exhibited impacts on water chemistry, and resultantly, the ecology of biota in aquatic
environments. As lakes recover from acidification, more organisms, such as
cyanobacteria, have an opportunity to thrive, which increases the risk of cyanotoxins
being present in drinking water supplies and recreational waterways. Short and long term
preventative measures and treatment activities designed to combat blooms and
cyanotoxins cannot be established without first developing an inventory of cyanobacteria
present in lakes.
The major objective of this study was to provide a baseline for future research and
inquiry into cyanobacteria population ecology which will enable future best practices for
lake management in Nova Scotia. To meet this objective, the study was divided into three
subtasks: a) determine the presence and taxa of cyanobacteria in three Halifax water
supplies and one recreational lake using DNA typing, and determine b) water chemistry
and c) environment data to provide context to cyanobacteria population data.
9
CHAPTER 2 METHODOLOGY
2.1. SAMPLE LOCATIONS
2.1.1. Fletchers Lake
Fletchers Lake, also known as Lake Fletcher, shown in Figure 2.1., is located in
Wellington and Fall River, NS, in the Collin’s Park Watershed area, and supplies the
Collin’s Park Water Treatment Plant, built in 2010 (Government of Canada (GC), 2016a;
Halifax Water, 2016; Halifax Water, 2017). It has an area of 100 ha and a maximum
depth of 12 m (PNS, 2016g). Fletchers Lake serves as the water supply for residents of
Wellington, and serves as the lake into which treated wastewater from the plant is
discharged.
The Collin’s Park Watershed is not considered a protected watershed area.
According to the Halifax Regional Municipality (HRM) (2017d), “[the] goal of source
water protection is to maintain, or improve, the quality of drinking water resources before
it reaches the supply plant,” cost effectively and sustainably, for present and future use.
They do this by implementing the following: the Nova Scotia Environment Act (PNS,
2013a) and the Halifax Regional Water Commission Act (PNS, 2017c), which restricts
fishing, hunting and motor vehicle use within the protected watershed area; the Protection
of Property Act (PNS, 2002), which allows land around the lakes within the watershed to
be purchased in an effort to reduce activities such as illegal dumping, off-highway use,
and trespassing; Best Management Practices (Halifax Water, 2010), which attempt to
strike a balance water treatment objectives with forest ecosystem conservation; and
finally, source water monitoring, whereby source water sampling and analysis are
routinely conducted, along with security checks by patrols and citizen watch groups
(HRM, 2017d). Not being a protected watershed, The Collin’s Park Watershed area is
likely more susceptible to anthropogenic forces than other, protected watersheds.
10
A section of the watershed overlaps with the Waverly-Salmon River Long Lake
Wilderness Area and the Waverly Game Sanctuary. The southern tip and eastern edges
share the shoreline with residential houses and Highway 2 (Nova Scotia Trunk 2), while
the rest of the lake is surrounded by forest.
With regards to forest composition, Fletchers Lake is primarily surrounded by
tolerant mixedwoods, but spruce (of note, red and black spruce), hemlock and pine trees
were also present (PNS, 2017d). With regards to geology and mineral presence, Fletchers
Lake overlies the Halifax Formation as well as areas of Middle-Late Devonian muscovite
biotite monzogranite (PNS, 2017a). Slate, siltstone and minor sandstone can be found in
the area. Also present in these areas: granite, granodiorite, diorite, diabase, gabbro,
building stone, aggregate, tin, copper, lead, zinc and base metals (PNS, 2017b).
Between June and October 2016, water samples were collected from Fletchers
Lake by Michael Brophy (MASc student, Dalhousie University), on foot from Fletchers
Lake’s tributaries, while raw water was collected from the Collin’s Park Water Treatment
Plant.
11
Figure 2.1. Map of the Collin’s Park Public Water Supply area, featuring location of
Fletchers Lake and Powder Mill Lake (circled in red) within the watershed
(HRM, 2017a).
12
2.1.2. Powder Mill Lake
Powder Mill Lake, formerly known as Fish Lake, circled in Figure 2.1., is located
in Waverley, NS, and is also within the Collin’s Park Watershed area (Halifax Water,
2016). It has an area of 43 ha and a maximum depth of 13 m (GC, 2016c; PNS, 2016g).
Powder Mill Lake does not act as a water supply source, but rather a recreational lake for
swimming and fishing (PNS, 2016a). It also collects run off from the Nova Scotia
Firefighters School and Highway 2 (Nova Scotia Trunk 2). Residential houses, forest and
Powder Mill Park share Powder Mill Lake’s remaining shoreline. A gravel quarry, owned
by Rocky Lake Quarry Ltd., is also in the area.
Powder Mill Lake is primarily surrounded by a mixture of spruce and pine trees,
as well as tolerant mixedwoods (PNS, 2017d). With regards to geology and mineral
presence, Powder Mill Lake overlies part of the Goldenville Formation (PNS, 2017a).
Quartzose sandstone with a chlorite-rich matrix and gold bearing quartz veins can be
found in the Goldenville Formation. Also present in this area: greywacke, quartzite, slate,
aggregate, tungsten, zinc and lead (PNS, 2017b).
The first three water samples taken from Powder Mill Lake were collected on foot
from the inlet stream, next to Highway 2 and from the shoreline of Powder Mill Park, in
July 2016. However, subsequent samples collected between July and November 2016,
were collected from in-lake using an inflatable kayak. Samples from Powder Mill Lake
were collected by the author.
2.1.3. Pockwock Lake
Pockwock Lake, shown in Figure 2.2., is located in Upper Hammonds Plains, NS,
in the Pockwock Lake and Tomahawk Lake Watershed area, and supplies the J. Douglas
Kline Water Supply Plant, built in 1977 (Halifax Water, 2016; Halifax Water, 2017). It
has an area of 902 ha and a maximum depth of 43 m (PNS, 2016g; Scott, 2004).
Pockwock Lake serves as the water supply for the residents of Halifax, Bedford,
13
Sackville, Fall River, Waverly and Timberlea. The watershed is mostly owned by the
Crown, with a small percentage being considered Halifax Water property. A third of this
watershed is also shared by the Pockwock Wilderness Area (PNS, 2016h). The Pockwock
Lake and Tomahawk Lake Watershed area is designated as a protected watershed area
(HRM, 2017d)
Pockwock Lake is primarily surrounded by spruce and pine trees, but hemlock
and tolerant mixedwoods are also present (PNS, 2017d). With regards to geology and
mineral presence, Pockwock Lake overlies part of the Goldenville Formation and Halifax
Formation, as well as areas of Mid-Late Devonian granodiorite, and Mid-Late Devonian
biotite monzogranite (PNS, 2017a). Slate, siltstone and minor sandstone can be found in
the Halifax Formation area, while quartzose sandstone with a chlorite-rich matrix and
gold bearing quartz veins can be found in the Goldenville Formation. Also present in
these areas: greywacke, quartzite, granite, diorite, diabase, gabboro, aggregate, tungsten,
zinc, lead, building stone, tin and copper (PNS, 2017b).
Water samples were collected from Pockwock Lake between June and November
2016, by Dave Redden (MASc student, Dalhousie University), in-lake with a motorized
boat and on foot from its tributaries.
14
Figure 2.2. Map of the Pockwock Lake and Tomahawk Lake Watershed areas,
featuring Pockwock Lake within the watershed (HRM, 2017c).
15
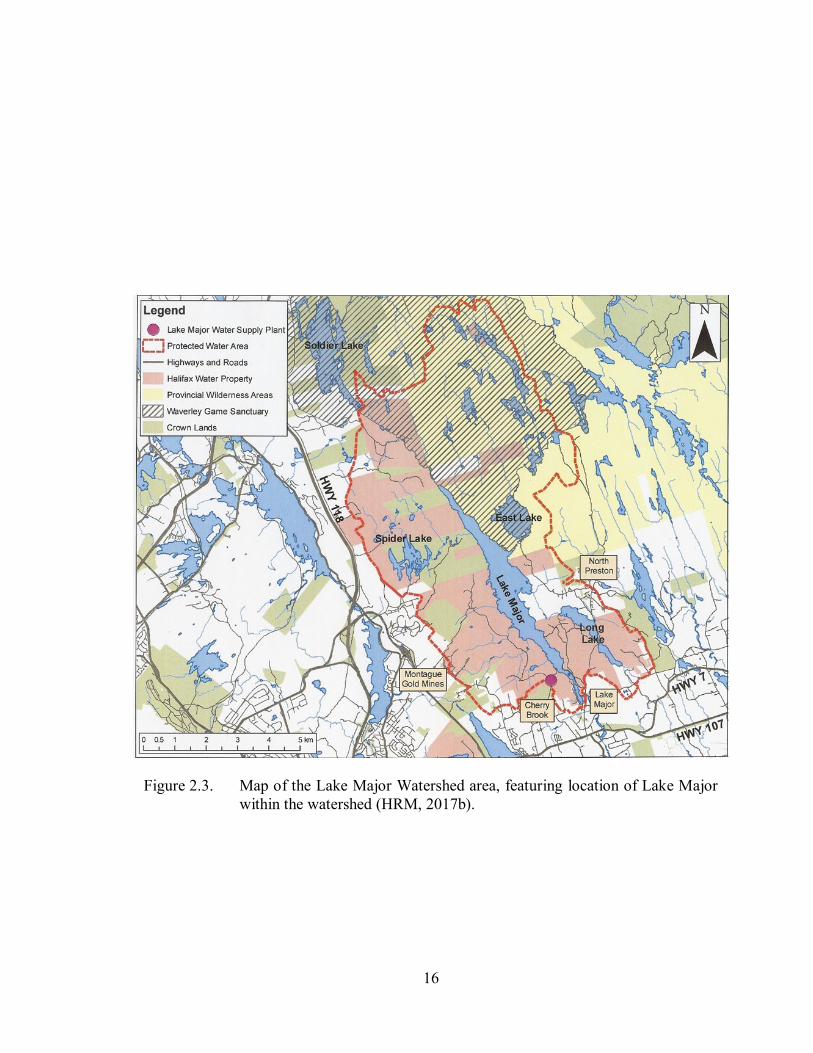
2.1.4. Lake Major
Lake Major, shown in Figure 2.3., is located in Dartmouth, NS, in the Lake Major
Watershed area, and supplies the Lake Major Water Supply Plant, built in 1999 (Halifax
Water, 2016; Halifax Water, 2017). It has an area of 377 ha and a maximum depth of 65
m (PNS, 2016g). Lake Major serves as the water supply for residents in Dartmouth,
Eastern Passage, Cole Harbour, Westphal, Cherry Brook, Montague Mines and North
Preston. Like the Pockwock Lake and Tomahawk Lake Watershed area, the Lake Major
Watershed area is also designated as a protected watershed area (HRM, 2017d). About a
third of the watershed area overlaps with the Waverley-Salmon River Long Lake
Wilderness Area and another third overlaps with the Waverley Game Sanctuary (Halifax
Water, 2016; Halifax Water, 2017). The remaining area is mostly owned by Halifax
Water, followed by the Crown.
Lake Major is primarily surrounded by a mixture of spruce (including red and
black spruce), hemlock and pine trees, but tolerant mixedwoods are also present (PNS,
2017d). With regards to geology and mineral presence, Lake Major also overlies on the
Goldenville and Halifax Formations like Pockwock Lake, as well as areas of Mid-Late
Devonian muscovite biotite monzogranite (PNS, 2017a,b).
Water samples were collected between June and October 2016, from Lake Major
by Lindsay Anderson (PhD student, Dalhousie University), on foot from Lake Major’s
tributaries and from the pump house at the Lake Major Water Supply Plant.
16
Figure 2.3. Map of the Lake Major Watershed area, featuring location of Lake Major
within the watershed (HRM, 2017b).
17
2.2. CYANOBACTERIA POPULATION ANALISYS
2.2.1. Sample Collection
Due to diel vertical migration and the presence of gas vacuoles in bloom forming
cyanobacteria, cyanobacteria of interest were most likely to be in surface water in the late
morning (Whitton and Potts, 2000; Ringelberg, 2010; Sainmont et al., 2012). Therefore,
samples for cyanobacteria identification were planned to have been collected during the
late morning/early afternoon. Unfortunately, due to scheduling conflicts for
transportation to and from the lakes, as well as restricted access to water crafts, samples
were not always collected during the late morning/early afternoon. They were, however,
always collected during daylight hours.
According to the World Health Organization (WHO) (1999), photosynthetic
organisms should be collected in amber glass containers for species identification, and to
be kept cool to restrict photosynthetic and metabolic activity. Using glass containers also
helps keep the organism from adhering to the inner container walls. WHO (1999), also
suggests that for microscopic identification and quantification of cyanobacteria that is
representative of the population present in each lake, 100 mL of water is required from
each designated sample site. Therefore, hypothetically, collecting more than 100 mL of
water per site would increase the likelihood of gathering enough genetic material for
cyanobacteria identification that would be representative of the population present.
However, as previously mentioned, there was limited space available in each water craft
used. Therefore, for the sake of consistency, it was determined that 200-250 mL per
sampling site was needed for cyanobacteria population analysis.
Pre-washed 500 mL amber glass bottles that had been washed in the dishwasher
were used to collect most of the water samples needed for cyanobacteria population
analysis. This provided sufficient sample volumes. However, once again, due to limited
space available in each water craft used, and because 500 mL amber glass bottles were
not always available, 500 mL or 1 L polyethylene bottles were also used. In some
18
instances, the excess water intended for water quality analysis which had been collected
in 1 L polyethylene bottles, was used for cyanobacteria population analysis.
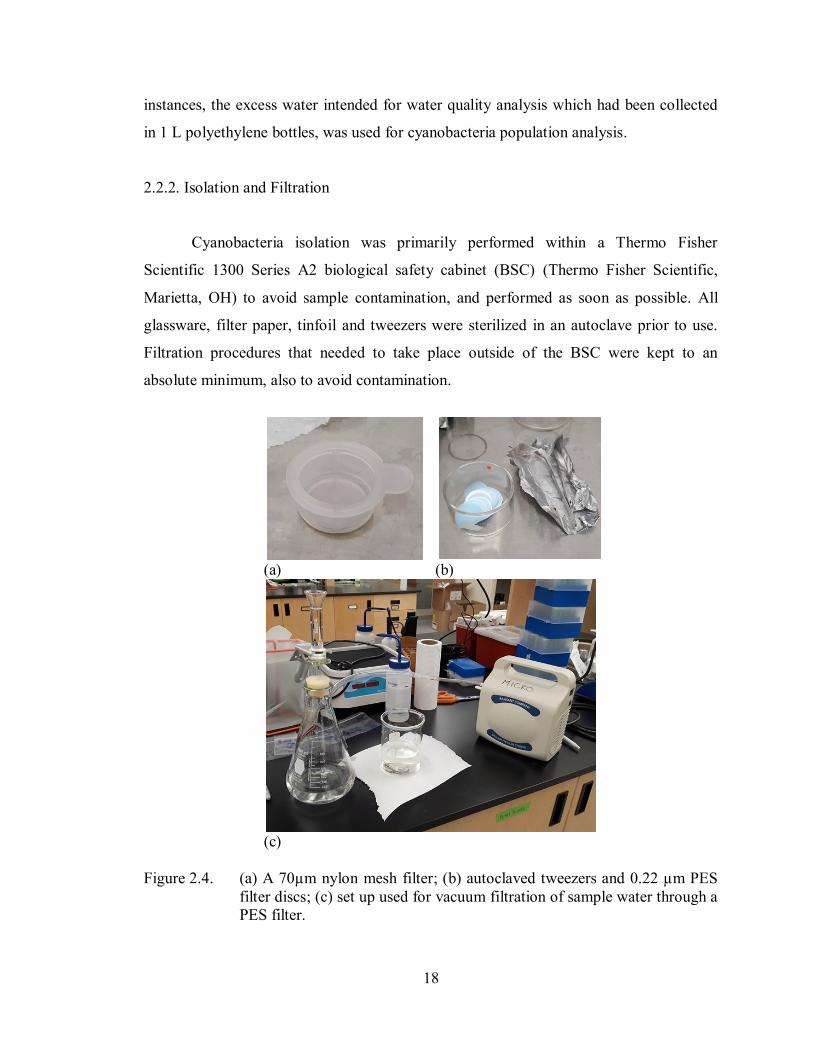
2.2.2. Isolation and Filtration
Cyanobacteria isolation was primarily performed within a Thermo Fisher
Scientific 1300 Series A2 biological safety cabinet (BSC) (Thermo Fisher Scientific,
Marietta, OH) to avoid sample contamination, and performed as soon as possible. All
glassware, filter paper, tinfoil and tweezers were sterilized in an autoclave prior to use.
Filtration procedures that needed to take place outside of the BSC were kept to an
absolute minimum, also to avoid contamination.
(a) (b)
(c)
Figure 2.4. (a) A 70µm nylon mesh filter; (b) autoclaved tweezers and 0.22 µm PES
filter discs; (c) set up used for vacuum filtration of sample water through a
PES filter.
19
Cyanobacteria range in size between 0.5 µm to 40 µm (Maier et al., 2000).
Therefore, water samples collected for cyanobacteria identification were initially
decanted through a 70 µm Falcon nylon mesh cell strainer to remove larger debris. The
filtrate was then filtered through a 0.22 µm Millipore Express Plus PES filter disc via
vacuum filtration through a glass microanalysis filter holder assembly (Advantec MFS,
Inc., Pleasanton, CA). Polyethersulfone (PES) filters were chosen because of their low
protein biding properties, which would allow for easier DNA extraction (MO BIO
Laboratories, 2016a,b). Theoretically, this process would isolate cyanobacteria of all
sizes onto the filter disc. Filters and microanalysis filter holder assembly can be seen in
Figure 2.4.
2.2.3. Storage
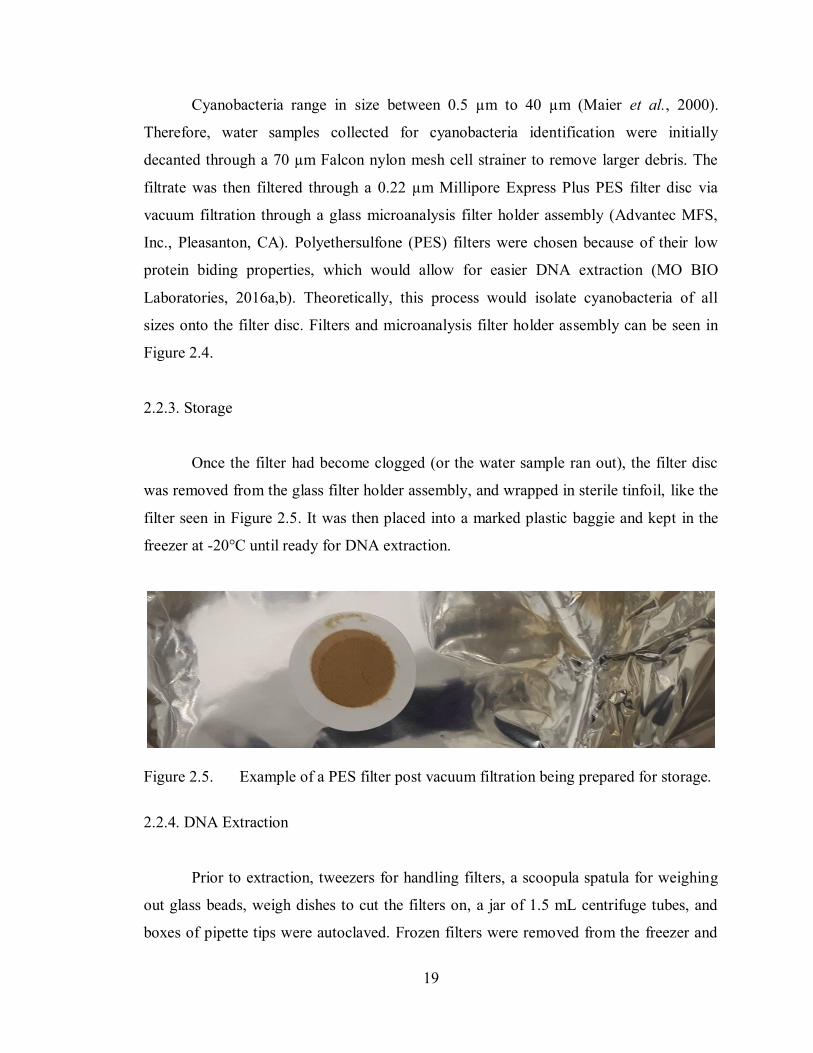
Once the filter had become clogged (or the water sample ran out), the filter disc
was removed from the glass filter holder assembly, and wrapped in sterile tinfoil, like the
filter seen in Figure 2.5. It was then placed into a marked plastic baggie and kept in the
freezer at -20°C until ready for DNA extraction.
Figure 2.5. Example of a PES filter post vacuum filtration being prepared for storage.
2.2.4. DNA Extraction
Prior to extraction, tweezers for handling filters, a scoopula spatula for weighing
out glass beads, weigh dishes to cut the filters on, a jar of 1.5 mL centrifuge tubes, and
boxes of pipette tips were autoclaved. Frozen filters were removed from the freezer and
20
thawed in the BSC. Once thawed, DNA extraction was performed using an Omega Bio-
tek E.Z.N.A. Water DNA Kit (Omega Bio-tek Inc., Norcross, GA), following the
procedure laid out by Omega Bio-tek (2014) in their product manual with minor
adjustments.
For example, the protocol called for centrifugation at 4,000 x g in Step 9 of the
procedure. However, the centrifuge available for use, a Thermo IEC Centra CL2
centrifuge (Thermo Fisher Scientific, Marietta, OH), could only reach a top speed of
3,500 x g. Thus, centrifugation at 3,500 x g at Step 9 was followed instead of
centrifugation at 4,000 x g. Another adjustment made concerned centrifugation tubes. In
Step 10, the procedure required that the cleared supernatant from Step 9 be transferred to
a new, 50 mL centrifuge tube. However, due to the large number of samples that needed
to be processed, 15 mL centrifuge tubes were used at Step 10. The Thermo IEC Centra
CL2 centrifuge had holders for four 50 mL centrifuge tubes or eight 15 mL centrifuge
tubes. Using 15 mL centrifuge tubes at this point decreased the amount of time required
to perform extractions and increased the number of samples that could be processed in a
day. These changes whould have little to no effect on results.
Following a final centrifugation 14,000 x g using a Hettich Mikro 200 centrifuge
(Hettich Lab Technology, Beverly, MA), the 1.5 mL microcentrifuge tube containing the
extracted DNA was capped and stored in the freezer at -20°C until ready for submission.
2.2.5. Cyanobacteria DNA Sequencing
Extracted cyanobacteria DNA was sent to the Centre for Comparative Genomic
and Evolutionary Bioinformatics, Integrated Microbiome Resource laboratory (CGEB-
IMR) at Dalhousie University, for high throughput sequencing.
Primers used for taxa identification were the traditional 16S rRNA universal
bacterial primers 515F-926R (targeting the V4-V5 regions), and the primer pair
CYA359F-CYA781R (targeting the V3-V4 regions) to specifically amplify cyanobacteria
21
genetic material (Nübel et al., 1997; Walters et al., 2015). Sequencing procedures and
library composition followed methods outlined by Comeau et al. (2017). In summary,
two separate DNA dilutions per sample were amplified via polymerase chain reaction
(PCR) using a high fidelity polymerase, verified by gel, purified, normalized and pooled
for sequencing using a 300+300 bp v3 kit on an Illumina MiSeq.
After sequencing, low-quality and chimeric reads were removed before samples
underwent open-reference operational taxonomic unit (OTU) picking at an identity level
of 97% (Comeau et al., 2017). OTU’s were associated with cyanobacteria taxa using
QIIME’s default GreenGenes 13.8, which dates to 2013. Following sample normalization
(i.e. equal number of reads per sample), OTU tables, taxonomic summaries, alpha-
diversity rarefaction plots, and beta-diversity plots were generated. However, for this
project, only OTU tables and taxonomic summaries were focused on.
Once results were received, cyanobacteria isolates were organized by their
affiliated orders, except for OTU’s associated with the class Chloroplast. Organisms
within this class are named according to the eukaryotes they reside in at the order level
and down. This would create confusion when conducting population analysis, so it was
decided to simply organize the chloroplasts by their class, and not their orders.
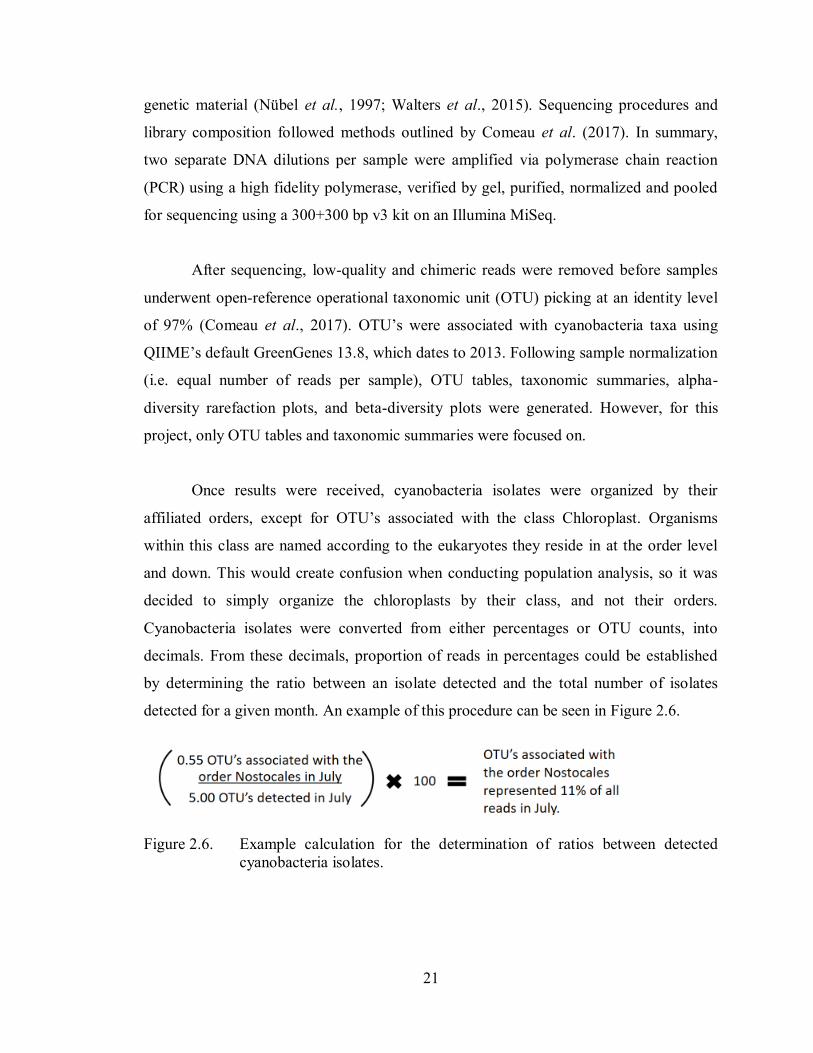
Cyanobacteria isolates were converted from either percentages or OTU counts, into
decimals. From these decimals, proportion of reads in percentages could be established
by determining the ratio between an isolate detected and the total number of isolates
detected for a given month. An example of this procedure can be seen in Figure 2.6.
Figure 2.6. Example calculation for the determination of ratios between detected
cyanobacteria isolates.
22
Once proportions were determined, column graphs showing monthly proportion
of reads (%) for each order/class of cyanobacteria detected per lake were made. Average
proportion of reads were also determined, but were not graphed.
2.3. WATER CHEMISTRY
2.3.1. Sample Collection
It was determined that ten water quality parameters were to be monitored: pH,
total organic carbon (TOC), dissolved organic carbon (DOC), total nitrogen (TN), total
phosphorous (TP), turbidity, UV254, specific ultraviolet absorbance (SUVA), colour, and
alkalinity.
According to the American Public Health Association (APHA), American Water
Works Association (AWWA), and the Water Environment Federation (WEF) (2012), of
these parameters, 40 mL was required to analyse TOC and TN, 40 mL was required to
analyse DOC, 10 mL was required to analyse TP, between 50-100 mL was required to
analyse turbidity, and 40 mL was required to measure alkalinity. To meet these
requirements, as well as have enough left over to conduct analysis on UV254, colour, and
to have extra water if needed, 1 L of water was collected at each sampling site using a 1 L
polyethylene bottle that had been pre-washed in the dishwasher and rinsed with ethanol
prior to use in the field.
The measurement of pH was performed in situ, while the measurement of TOC,
DOC, TN, TP, turbidity, UV254, colour, and alkalinity were performed in the lab within
24 to 48 hours after collection. Laboratory analysis followed procedures laid out by the
APHA, AWWA and WEF (APHA et al, 2012). SUVA was calculated when convenient
after DOC and UV254 results were determined.
Water chemistry data for Fletchers Lake was provided by Michael Brophy (MASc
student, Dalhousie University), and water chemistry data for Powder Mill Lake came
23
from the author. Water chemistry data for Pockwock Lake was provided by Dave Redden
(MASc student, Dalhousie University), while water chemistry data for Lake Major was
provided by Lindsay Anderson (PhD student, Dalhousie University) and Halifax Water.
2.3.2. Alkalinity and pH
Roughly 40mL of raw water sample was used to measure alkalinity with a Mettler
Toledo T50 automated titrator (Mettler Toledo, Columbus, OH) that had a minimum
detection limit (MDL) of 2.44 CaCo3 mg/L, and had been calibrated to stock solutions
with pH of 4, 7 and 10, prior to use. The measurement of pH was performed in situ by
submerging a YSI 650 MDS multiparameter sonde, model number 12C100865 (YSI Inc.,
Yellow Springs, OH), over the side of the water craft being used, and recording the data
presented on screen when the readings stabilized. The sonde was calibrated for pH once a
month.
2.3.3. Total Organic Carbon and Dissolved Organic Carbon
Raw water samples intended for TOC measurement were poured head-space free
into 40 mL pre-cleaned glass vials and preserved with two to three drops of concentrated
phosphoric acid. Samples intended for DOC measurement were first filtered through a
0.45µm GVS UltraSep PES filter disc, which had been pre-rinsed with 500mL of Milli-Q
water. Filtered samples were then poured head-space free into 40mL pre-cleaned glass
vials as well, and preserved with two to three drops of concentrated phosphoric acid.
TOC and DOC were measured using a Shimadzu TOC-V CPH analyzer with an ASI-V
autosampler (Shimadzu Corporation, Kyoto, Japan), that had an MDL of 0.25 ppm.
2.3.4. Total Nitrogen and Total Phosphorus
Raw water samples intended for TN measurement were poured head-space free
into 40mL pre-cleaned glass vials and preserved with two to three drops of concentrated
phosphoric acid. TN was measured using a Shimadzu TNM-1 total nitrogen measuring
24
unit also hooked up to the ASI-V autosampler, which had an MDL of 0.12 ppm. About
10mL of raw water sample intended for TP measurement was poured into pre-cleaned
Fisher Scientific general purpose polypropylene test tubes and preserved with two to
three drops of trace metal grade nitric acid. TP was measured using a Thermo Scientific
XSeries 2 inductively coupled plasma mass spectrometer (ICP-MS) with an ASX-520
autosampler, which had an MDL of 10 ppb.
2.3.5. UV254, Specific Ultraviolet Absorbance, Turbidity and Colour
Raw water samples were used to measure turbidity with a HACH 2100AN
turbidometer (Hach Company, Loveland, CO), which had been initially zeroed with
Milli-Q water and had an MDL of 0.12 NTU. In contrast, UV254 and colour water
samples were first filtered through a 0.45µm GVS UltraSep PES filter disc, which had
been pre-rinsed with 500mL of Milli-Q water. UV254 and colour were measured with a
HACH DR5000 spectrophotometer 190 nm. SUVA was calculated when convenient after
DOC and UV254 were determined.
2.4. ENVIRONMENT DATA
Hourly environment data for temperature and wind speed were collected from the
Bedford Range weather station, located at 44°44'45.09"N, 63°39'42.08"W, in Bedford,
NS, near the Sackville River and Bicentennial Drive overpass. Data was acquired through
the Environment Canada website (GC, 2016b). Daily accumulated precipitation data was
collected from the Weather Network website for Bedford, NS (The Weather Network
(TWN), 2017).
25
CHAPTER 3 RESULTS
3.1. CYANOBACTERIA POPULATION ANALYSIS
3.1.1. Fletchers Lake
A total number of 19 samples were collected from Fletchers Lake on September
14 and 29, and October 19, of 2016, for cyanobacteria population analysis. However, of
the 19 samples, only 14 successfully amplified during PCR. See Appendix A for details
regarding sample sites, collection dates, and sample amplification success.
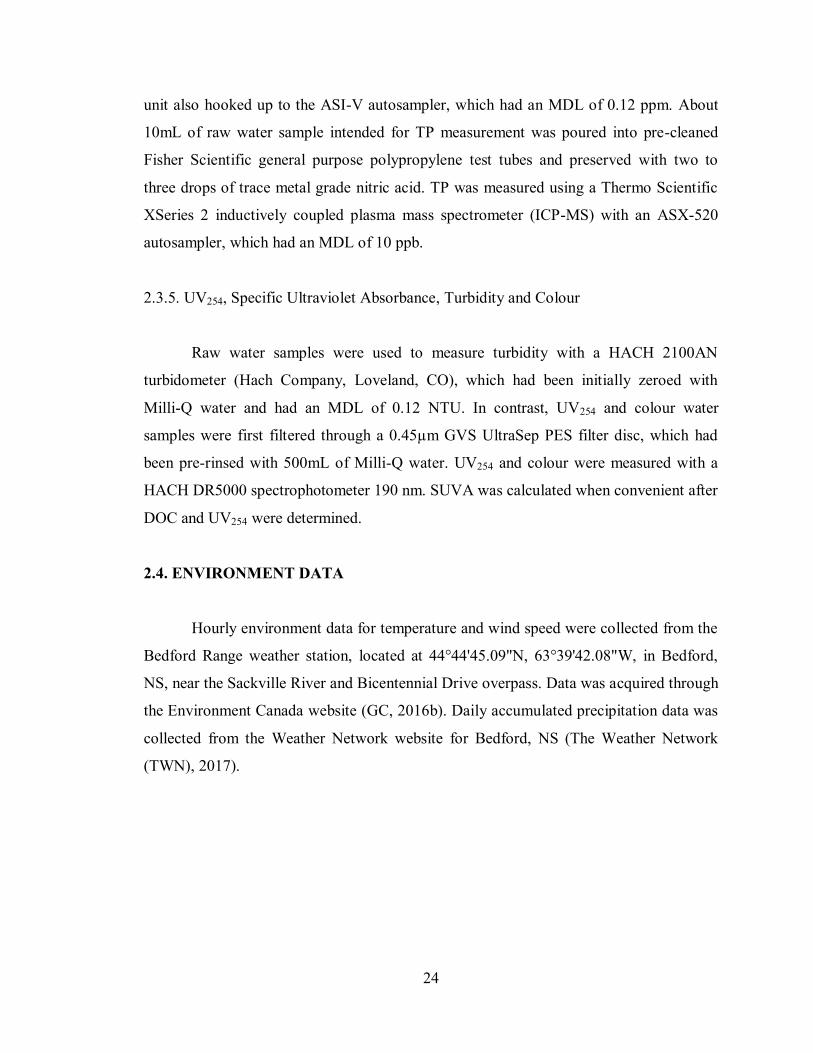
Figure 3.1. depicts the overall proportion of all cyanobacteria OTU reads detected
in the samples, by month. Reads are organized by their affiliated orders, except for
OTU’s affiliated with chloroplasts, which are organized by their associated class of
chloroplast instead of their orders. See Appendix A for tabulated proportion of reads per
month and details concerning order composition per month.
26
Figure 3.1. Overall proportion of OTU reads detected in samples from Fletchers Lake,
for September and October. See Appendix A for tabulated proportion of
reads per month and order composition per month.
Overall, OTU’s that were associated with the order Synechococcales made up
52% of reads in September (mean, 50%), then decreased to 38% in October (mean, 35%).
OTU’s associated with the class Chloroplast represented 27% of the reads in September
(mean, 28%) and increased to 38% of the reads in October (mean, 38%). OTU’s
associated with unassigned OTU’s represented 10% of reads in September (mean, 12%),
and 11% in October (mean, 14%). OTU’s associated with the order Chroococcales
represented 6.3% of reads in September (mean, 6.3%), and 7.9% of reads in October
(mean, 7.4%). OTU’s associated with the orders Gloeobacterales, Nostocales,
Oscillatoriales, Pseudanabaenales and other cyanobacteria not designated to a particular
order, represented less than 5% each (overall and on average), of all OTU’s detected in
September and October.
27
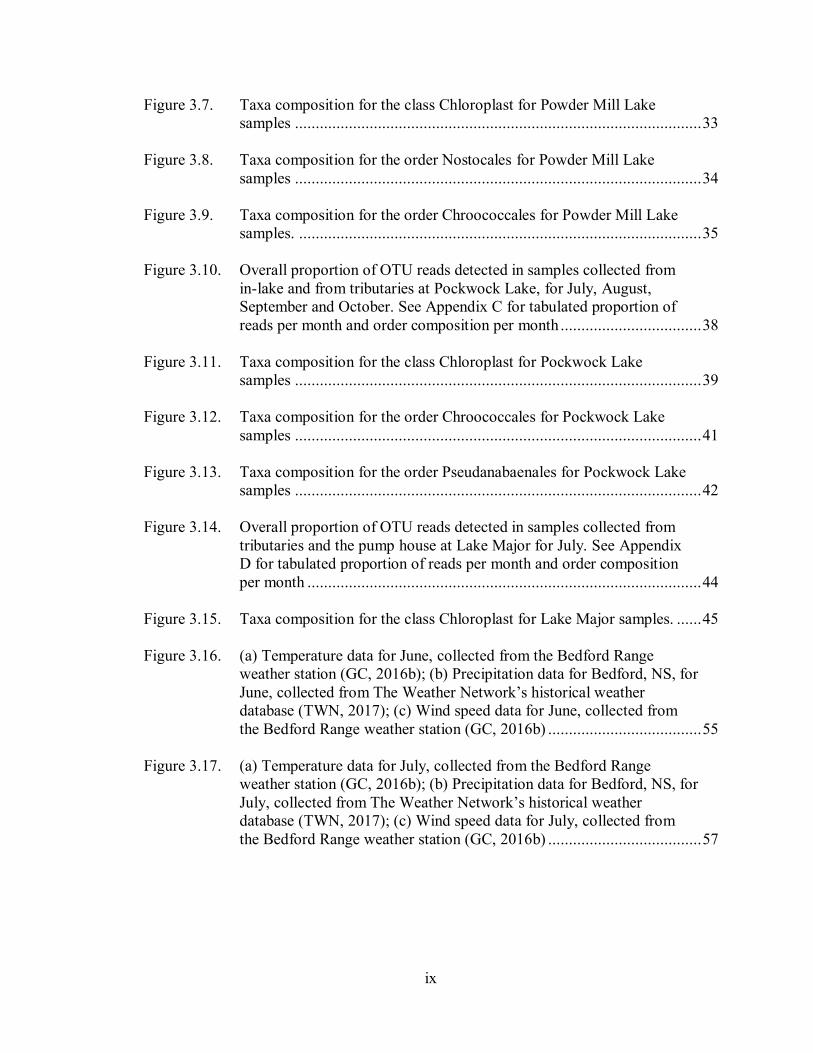
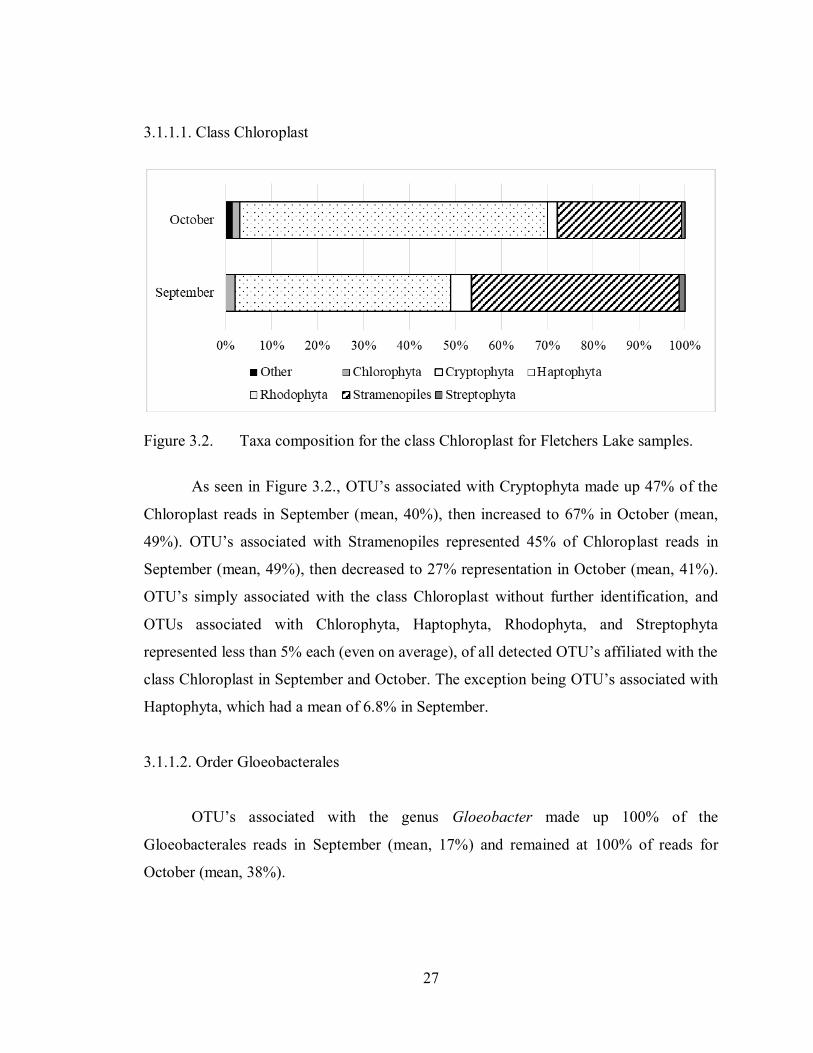
3.1.1.1. Class Chloroplast
Figure 3.2. Taxa composition for the class Chloroplast for Fletchers Lake samples.
As seen in Figure 3.2., OTU’s associated with Cryptophyta made up 47% of the
Chloroplast reads in September (mean, 40%), then increased to 67% in October (mean,
49%). OTU’s associated with Stramenopiles represented 45% of Chloroplast reads in
September (mean, 49%), then decreased to 27% representation in October (mean, 41%).
OTU’s simply associated with the class Chloroplast without further identification, and
OTUs associated with Chlorophyta, Haptophyta, Rhodophyta, and Streptophyta
represented less than 5% each (even on average), of all detected OTU’s affiliated with the
class Chloroplast in September and October. The exception being OTU’s associated with
Haptophyta, which had a mean of 6.8% in September.
3.1.1.2. Order Gloeobacterales
OTU’s associated with the genus Gloeobacter made up 100% of the
Gloeobacterales reads in September (mean, 17%) and remained at 100% of reads for
October (mean, 38%).
28
3.1.1.3. Order Nostocales
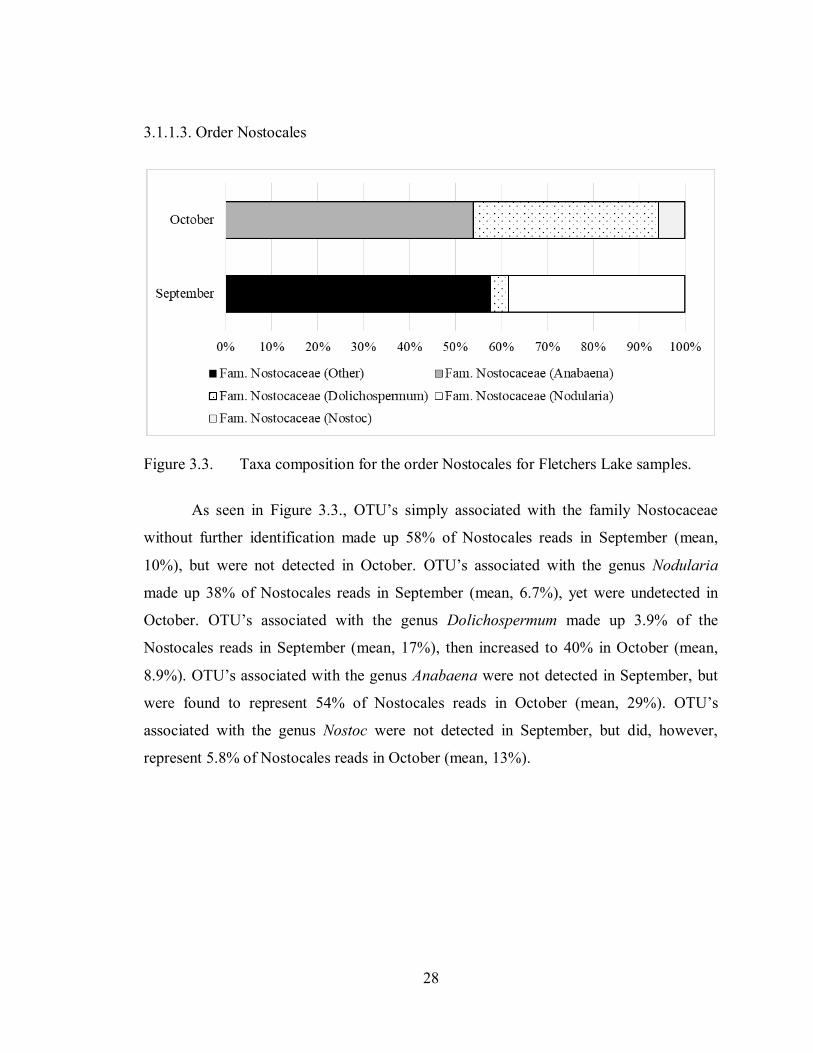
Figure 3.3. Taxa composition for the order Nostocales for Fletchers Lake samples.
As seen in Figure 3.3., OTU’s simply associated with the family Nostocaceae
without further identification made up 58% of Nostocales reads in September (mean,
10%), but were not detected in October. OTU’s associated with the genus Nodularia
made up 38% of Nostocales reads in September (mean, 6.7%), yet were undetected in
October. OTU’s associated with the genus Dolichospermum made up 3.9% of the
Nostocales reads in September (mean, 17%), then increased to 40% in October (mean,
8.9%). OTU’s associated with the genus Anabaena were not detected in September, but
were found to represent 54% of Nostocales reads in October (mean, 29%). OTU’s
associated with the genus Nostoc were not detected in September, but did, however,
represent 5.8% of Nostocales reads in October (mean, 13%).

29
3.1.1.4. Order Chroococcales
Figure 3.4. Taxa composition for the order Chroococcales for Fletchers Lake samples.
As seen in Figure 3.4., OTU’s simply associated with the family Xenococcaceae
without further identification made up 38% of the Chroococcales reads in September
(average, 32%), but decreased to 3.4% in October (average, 15%). OTU’s associated with
the genus Microcystis made up 29% of the Chroococcales reads in September (average,
21%), then decreased to 1.2% of reads in October (average, 5.0%). OTU’s associated
with the family Gomphosphaeriaceae made up 28% of Chroococcales reads in September
(average, 37%), then increased to represent 95% of reads in October (average, 52%).
OTU’s associated with the family Chroococcaceae and the genus Chroococcidiopsis
represented less than 5% each (even on average), of all detected OTU’s affiliated with the
order Chroococcales in September and October. The exception being OTU’s associated
with the family Chroococcaceae, which had a mean of 9.6% in September.
3.1.1.5. Order Oscillatoriales
OTU’s associated with the genus Phormidium were not detected in September.
However, in October, they represented 100% of Oscillatoriales reads (mean, 25%).
30
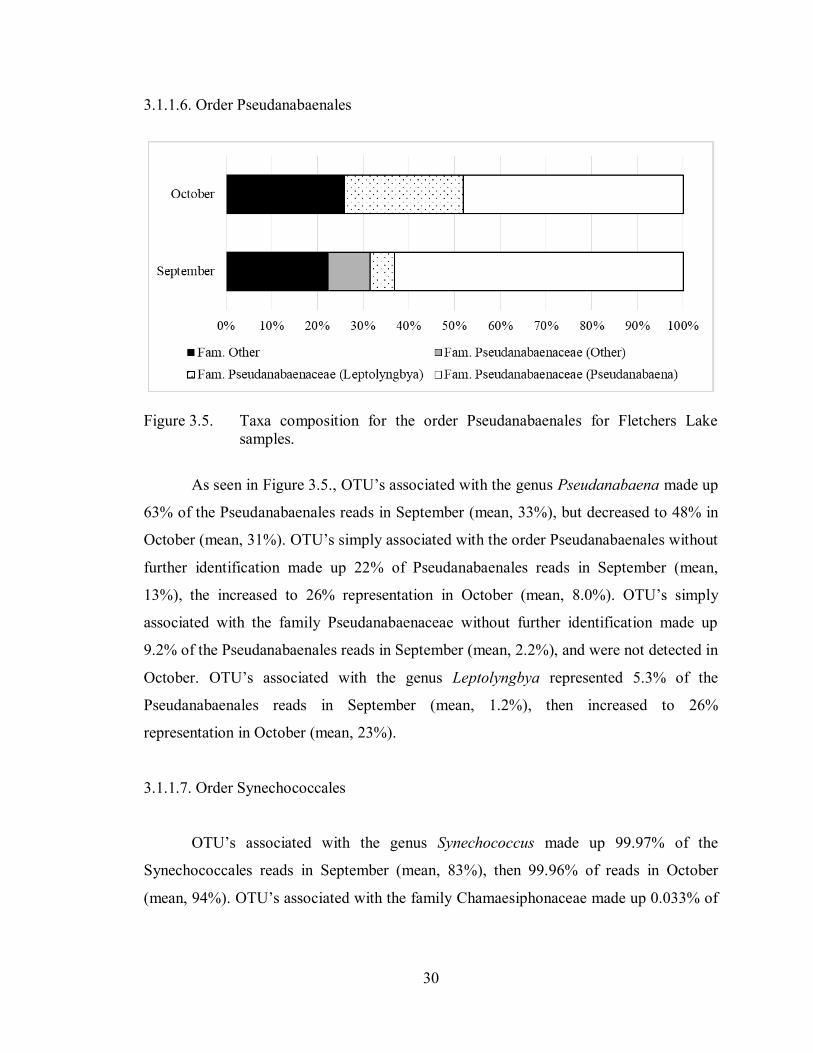
3.1.1.6. Order Pseudanabaenales
Figure 3.5. Taxa composition for the order Pseudanabaenales for Fletchers Lake
samples.
As seen in Figure 3.5., OTU’s associated with the genus Pseudanabaena made up
63% of the Pseudanabaenales reads in September (mean, 33%), but decreased to 48% in
October (mean, 31%). OTU’s simply associated with the order Pseudanabaenales without
further identification made up 22% of Pseudanabaenales reads in September (mean,
13%), the increased to 26% representation in October (mean, 8.0%). OTU’s simply
associated with the family Pseudanabaenaceae without further identification made up
9.2% of the Pseudanabaenales reads in September (mean, 2.2%), and were not detected in
October. OTU’s associated with the genus Leptolyngbya represented 5.3% of the
Pseudanabaenales reads in September (mean, 1.2%), then increased to 26%
representation in October (mean, 23%).
3.1.1.7. Order Synechococcales
OTU’s associated with the genus Synechococcus made up 99.97% of the
Synechococcales reads in September (mean, 83%), then 99.96% of reads in October
(mean, 94%). OTU’s associated with the family Chamaesiphonaceae made up 0.033% of
31
the Synechococcales reads in September (mean, 17%), and 0.035% in October (mean,
6.3%).
3.1.2. Powder Mill Lake
A total number of 55 samples were collected from Powder Mill Lake on July 12
and 28, August 16, 24 and 30, September 10, 16 and 23, October 2, 18 and 30, and
November 7, 13 and 21, of 2016, for cyanobacteria population analysis. See Appendix B
for details regarding sample sites, collection dates, and sample amplification success.
Figure 3.6. depicts the overall proportion of all cyanobacteria OTU reads detected
in the samples, by month. Reads are organized by their affiliated orders, except for
OTU’s affiliated with chloroplasts, which are organized by their associated class of
chloroplast instead of their orders. See Appendix B for tabulated proportion of reads per
month and details concerning order composition per month.
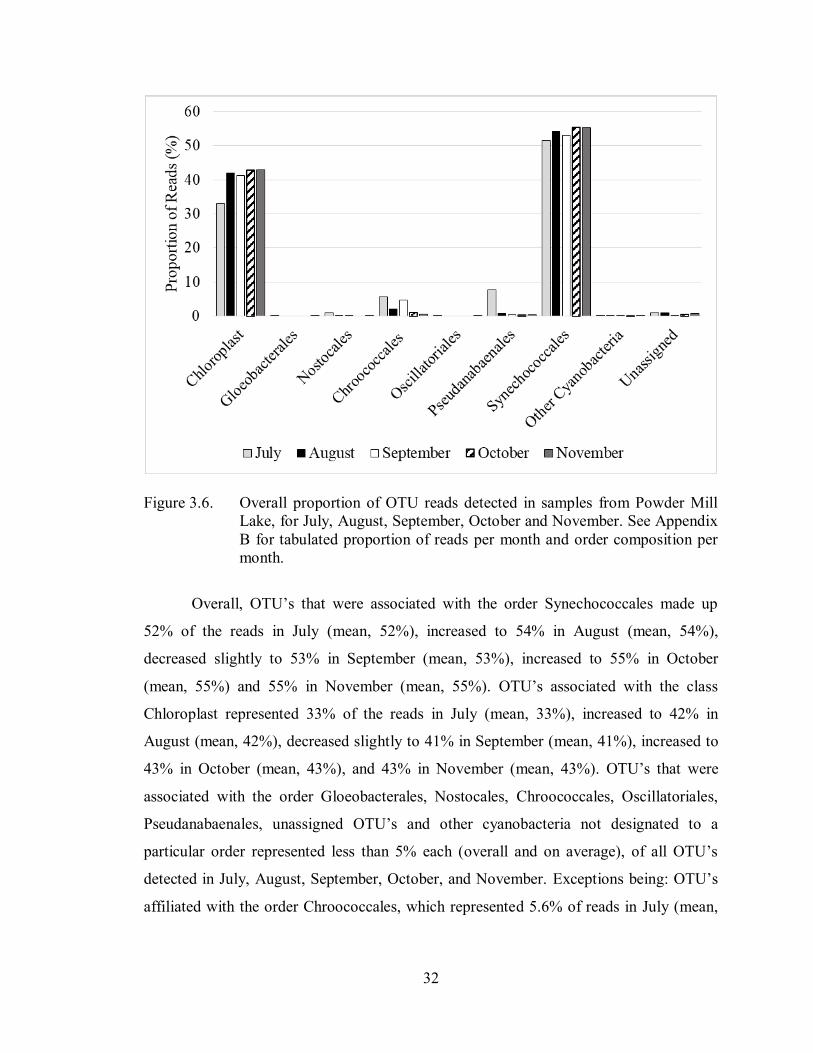
32
Figure 3.6. Overall proportion of OTU reads detected in samples from Powder Mill
Lake, for July, August, September, October and November. See Appendix
B for tabulated proportion of reads per month and order composition per
month.
Overall, OTU’s that were associated with the order Synechococcales made up
52% of the reads in July (mean, 52%), increased to 54% in August (mean, 54%),
decreased slightly to 53% in September (mean, 53%), increased to 55% in October
(mean, 55%) and 55% in November (mean, 55%). OTU’s associated with the class
Chloroplast represented 33% of the reads in July (mean, 33%), increased to 42% in
August (mean, 42%), decreased slightly to 41% in September (mean, 41%), increased to
43% in October (mean, 43%), and 43% in November (mean, 43%). OTU’s that were
associated with the order Gloeobacterales, Nostocales, Chroococcales, Oscillatoriales,
Pseudanabaenales, unassigned OTU’s and other cyanobacteria not designated to a
particular order represented less than 5% each (overall and on average), of all OTU’s
detected in July, August, September, October, and November. Exceptions being: OTU’s
affiliated with the order Chroococcales, which represented 5.6% of reads in July (mean,
33
5.6%), and those associated with the order Pseudanabaenales, which represented 7.6% of
reads in July (mean, 7.6%).
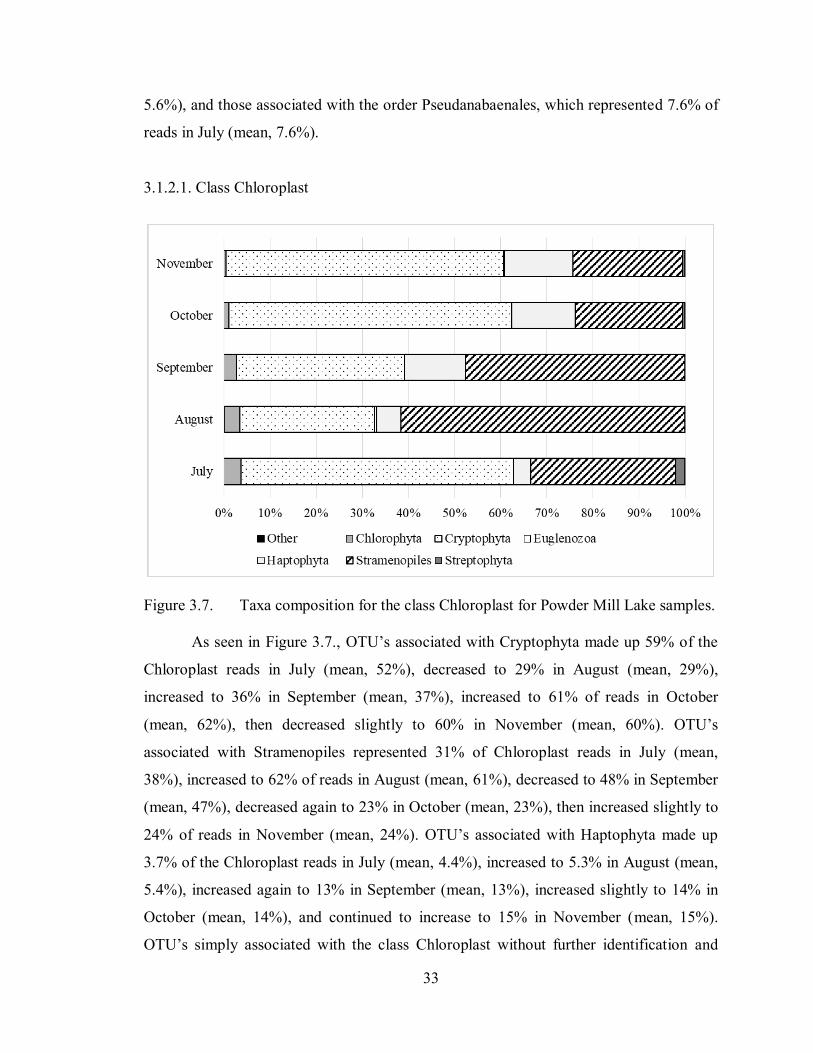
3.1.2.1. Class Chloroplast
Figure 3.7. Taxa composition for the class Chloroplast for Powder Mill Lake samples.
As seen in Figure 3.7., OTU’s associated with Cryptophyta made up 59% of the
Chloroplast reads in July (mean, 52%), decreased to 29% in August (mean, 29%),
increased to 36% in September (mean, 37%), increased to 61% of reads in October
(mean, 62%), then decreased slightly to 60% in November (mean, 60%). OTU’s
associated with Stramenopiles represented 31% of Chloroplast reads in July (mean,
38%), increased to 62% of reads in August (mean, 61%), decreased to 48% in September
(mean, 47%), decreased again to 23% in October (mean, 23%), then increased slightly to
24% of reads in November (mean, 24%). OTU’s associated with Haptophyta made up
3.7% of the Chloroplast reads in July (mean, 4.4%), increased to 5.3% in August (mean,
5.4%), increased again to 13% in September (mean, 13%), increased slightly to 14% in
October (mean, 14%), and continued to increase to 15% in November (mean, 15%).
OTU’s simply associated with the class Chloroplast without further identification and
34
OTU’s affiliated with Chlorophyta, Euglenozoa and Streptophyta represented less than
5% each (even on average), of all detected OTU’s affiliated with the class Chloroplast in
July, August, September, October and November.
3.1.2.2. Order Gloeobacterales
OTU’s associated with the genus Gloeobacter represented 100% of the
Gloeobacterales reads in July (mean, 14%) and in November (mean, 8.3%). They were
not detected in August, September or October.
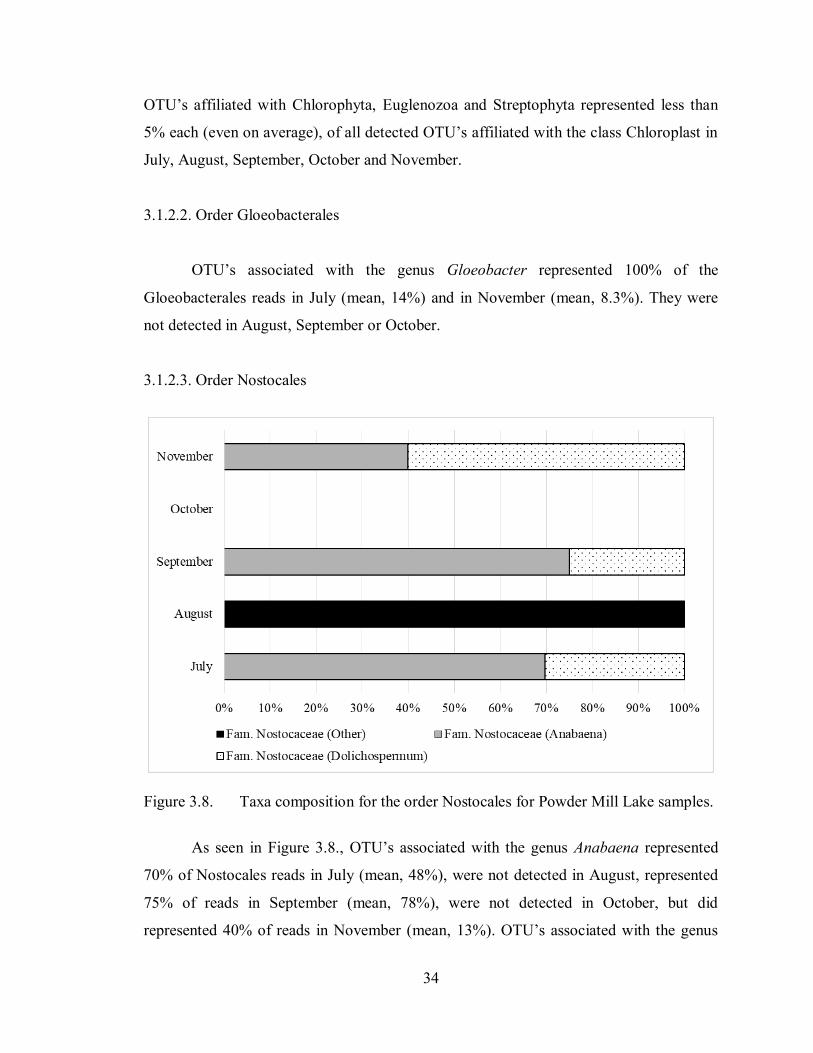
3.1.2.3. Order Nostocales
Figure 3.8. Taxa composition for the order Nostocales for Powder Mill Lake samples.
As seen in Figure 3.8., OTU’s associated with the genus Anabaena represented
70% of Nostocales reads in July (mean, 48%), were not detected in August, represented
75% of reads in September (mean, 78%), were not detected in October, but did
represented 40% of reads in November (mean, 13%). OTU’s associated with the genus
35
Dolichospermum represented 30% of Nostocales reads in July (mean, 24%), were not
detected in August, represented 25% of reads in September (mean, 22%), were not
detected in October, and represented 60% of reads in November (mean, 21%). OTU’s
simply associated with the family Nostocaceae without further identification made up
100% of Nostocales reads in August (mean, 17%), but were not detected for the
remainder of the season.
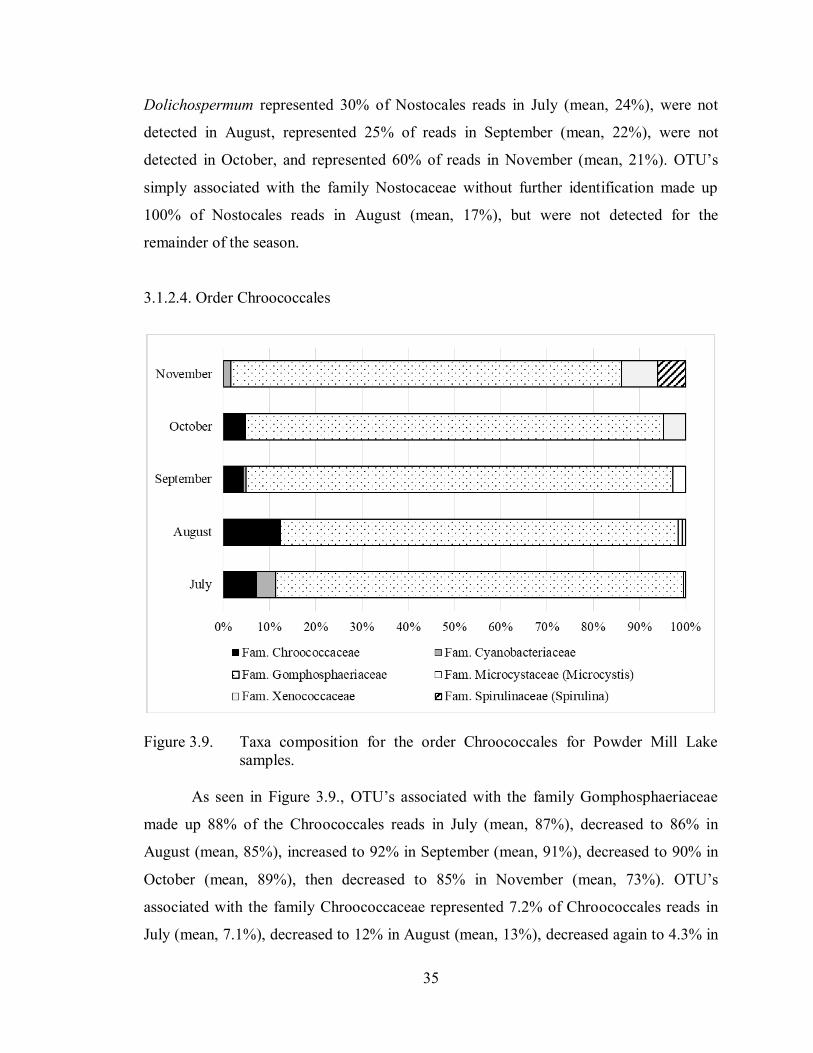
3.1.2.4. Order Chroococcales
Figure 3.9. Taxa composition for the order Chroococcales for Powder Mill Lake
samples.
As seen in Figure 3.9., OTU’s associated with the family Gomphosphaeriaceae
made up 88% of the Chroococcales reads in July (mean, 87%), decreased to 86% in
August (mean, 85%), increased to 92% in September (mean, 91%), decreased to 90% in
October (mean, 89%), then decreased to 85% in November (mean, 73%). OTU’s
associated with the family Chroococcaceae represented 7.2% of Chroococcales reads in
July (mean, 7.1%), decreased to 12% in August (mean, 13%), decreased again to 4.3% in
36
September (mean, 4.6%), increased slightly to 4.8% in October (mean, 5.0%), then were
not detected in November.
OTU’s that were associated with the family Cyanobacteriaceae and
Xenococcaceae, and the genus Microcystis and Spirulina, represented less than 5% each
(overall and on average), of all OTU’s associated with the order Chroococcales detected
in July, August, September, October, and November. Exceptions being: OTU’s affiliated
with the family Cyanobacteriaceae, which represented a mean of 5.2% of Chroococcales
reads in July; OTU’s affiliated with the family Xenococcaceae had a mean of 5.6% in
October and represented 7.8% of reads in November (mean, 8.6%); and OTU’s
associated with the genus Spirulina represented 6.1% of reads in November (mean,
8.9%).
3.1.2.5. Order Oscillatoriales
OTU’s affiliated with the genus Phormidium represented 100% of the
Oscillatoriales reads in July (mean, 14%), and in November (mean, 8.3%). They were not
detected in August, September or October.
3.1.2.6. Order Pseudanabaenales
OTU’s associated with the genus Pseudanabaena made up 98.7% of
Pseudanabaenales reads in July (mean, 94.5%), increased to 100% in August (mean,
100%), decreased to 90% in September (mean, 94.4%), increased to 100% in October
(mean, 75%), and decreased to 97.6% in November (mean, 75%). OTU’s associated with
the order Pseudanabaenales without further identification, the family Pseudanabaenaceae
without further identification, and the genus Leptolyngbya, represented less than 5% each
(overall and on average), of all OTU’s associated with the order Pseudanabaenales
detected in July, August, September, October, and November. Exceptions being: OTU’s
affiliated with the family Pseudanabaenaceae without further identification represented
an average of 8.3% of Pseudanabaenales reads in November, and OTU’s associated with
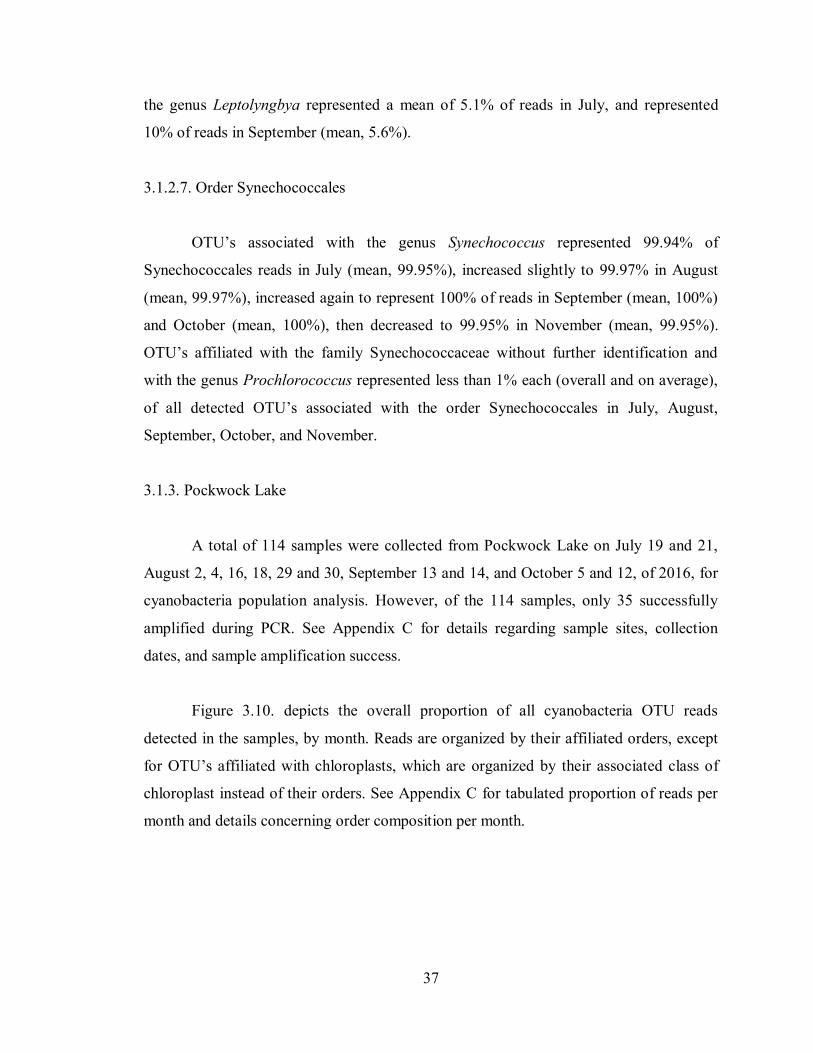
37
the genus Leptolyngbya represented a mean of 5.1% of reads in July, and represented
10% of reads in September (mean, 5.6%).
3.1.2.7. Order Synechococcales
OTU’s associated with the genus Synechococcus represented 99.94% of
Synechococcales reads in July (mean, 99.95%), increased slightly to 99.97% in August
(mean, 99.97%), increased again to represent 100% of reads in September (mean, 100%)
and October (mean, 100%), then decreased to 99.95% in November (mean, 99.95%).
OTU’s affiliated with the family Synechococcaceae without further identification and
with the genus Prochlorococcus represented less than 1% each (overall and on average),
of all detected OTU’s associated with the order Synechococcales in July, August,
September, October, and November.
3.1.3. Pockwock Lake
A total of 114 samples were collected from Pockwock Lake on July 19 and 21,
August 2, 4, 16, 18, 29 and 30, September 13 and 14, and October 5 and 12, of 2016, for
cyanobacteria population analysis. However, of the 114 samples, only 35 successfully
amplified during PCR. See Appendix C for details regarding sample sites, collection
dates, and sample amplification success.
Figure 3.10. depicts the overall proportion of all cyanobacteria OTU reads
detected in the samples, by month. Reads are organized by their affiliated orders, except
for OTU’s affiliated with chloroplasts, which are organized by their associated class of
chloroplast instead of their orders. See Appendix C for tabulated proportion of reads per
month and details concerning order composition per month.
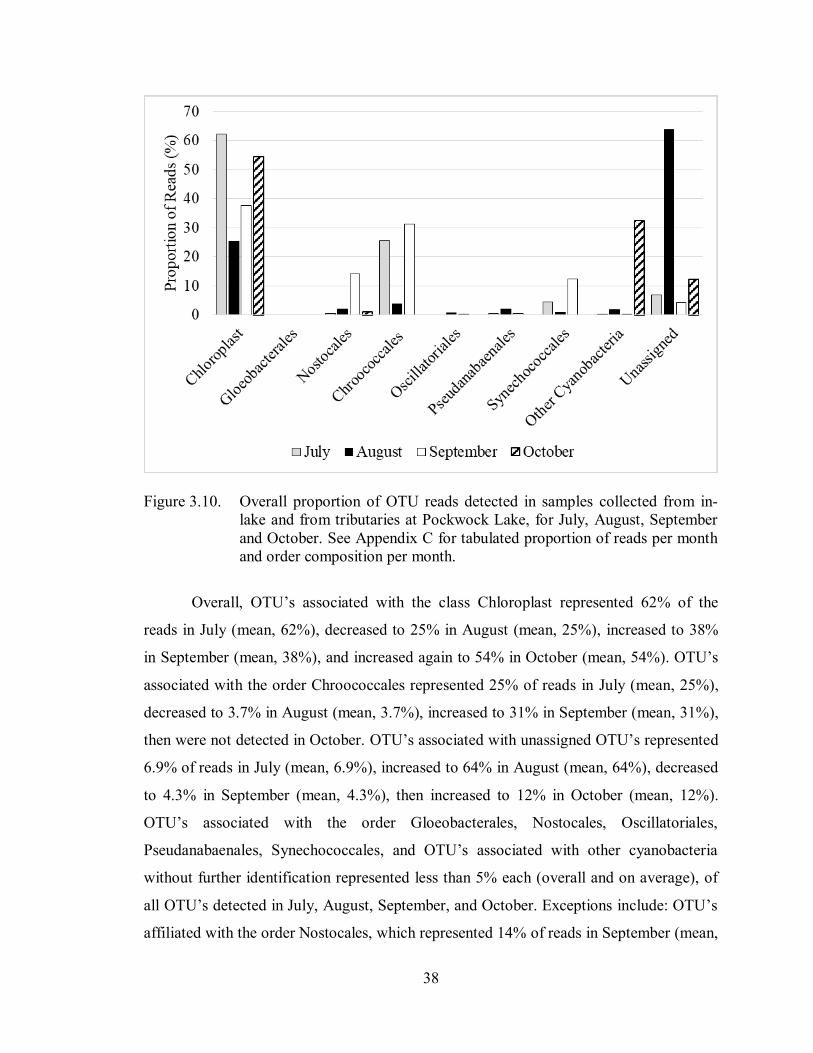
38
Figure 3.10. Overall proportion of OTU reads detected in samples collected from in-
lake and from tributaries at Pockwock Lake, for July, August, September
and October. See Appendix C for tabulated proportion of reads per month
and order composition per month.
Overall, OTU’s associated with the class Chloroplast represented 62% of the
reads in July (mean, 62%), decreased to 25% in August (mean, 25%), increased to 38%
in September (mean, 38%), and increased again to 54% in October (mean, 54%). OTU’s
associated with the order Chroococcales represented 25% of reads in July (mean, 25%),
decreased to 3.7% in August (mean, 3.7%), increased to 31% in September (mean, 31%),
then were not detected in October. OTU’s associated with unassigned OTU’s represented
6.9% of reads in July (mean, 6.9%), increased to 64% in August (mean, 64%), decreased
to 4.3% in September (mean, 4.3%), then increased to 12% in October (mean, 12%).
OTU’s associated with the order Gloeobacterales, Nostocales, Oscillatoriales,
Pseudanabaenales, Synechococcales, and OTU’s associated with other cyanobacteria
without further identification represented less than 5% each (overall and on average), of
all OTU’s detected in July, August, September, and October. Exceptions include: OTU’s
affiliated with the order Nostocales, which represented 14% of reads in September (mean,
39
14%), OTU’s affiliated with the order Synechococcales which represented 12% of reads
in September (mean, 12%), and OTU’s affiliated with other cyanobacteria not designated
to a particular order which represented 32% of reads in October (mean, 32%).
3.1.3.1. Class Chloroplast
Figure 3.11. Taxa composition for the class Chloroplast for Pockwock Lake samples.
Seen in Figure 3.11., OTU’s associated with Stramenopiles represented 56% of
Chloroplast reads in July (mean, 52%), decreased to 46% of reads in August (mean,
32%), decreased to 37% in September (mean, 41%), then increased to 55% in October
(mean, 50%). OTU’s associated with Cryptophyta made up 31% of the Chloroplast reads
in July (mean, 37%), decreased to 18% in August (mean, 15%), increased to 50% in
September (mean, 44%), but decreased to 41% of reads in October (mean, 48%). OTU’s
associated with Chlorophyta made up 6.8% of the Chloroplast reads in July (mean,
7.0%), increased to represent 9.0% of Chloroplast reads in August (mean, 5.5%),
decreased to 3.2% in September (mean, 4.4%), and decreased again to 1.7% in October
(mean, 1.3%). OTU’s affiliated with Streptophyta represented 5.7% of Chloroplast reads
in July (mean, 3.7%), then increased to 15% in August (mean, 8.5%), decreased to 3.0%
40
in September (mean, 1.7%), and were not detected in October. OTU’s associated with the
class Chloroplast without further identification, Euglenozoa, Haptophyta, and
Rhodophyta represented less than 5% each of detected OTU’s affiliated with the class
Chloroplast, in July, August, September, and October. The exceptions being: OTU’s
associated with Euglenozoa represented 11% of Chloroplast reads in August (mean,
5.4%), and OTU’s associated Haptophyta represented 5.7% of Chloroplast reads in
September (mean, 7.9%).
3.1.3.2. Order Gloeobacterales
As mentioned previously, there were no detectable OTU’s associated with the
order Gloeobacterales.
3.1.3.3. Order Nostocales
OTU’s affiliated with the genus Dolichospermum represented 100% of the
Nostocales reads in July (mean, 33%) and August (mean, 14%), then decreased slightly
to 99.7% in September (mean, 83%), and were not detected in October. OTU’s associated
with the genus Nostoc were not detected in July or August, but did represent 0.27% of
Nostocales reads in September (mean, 0.21%), and increased to 100% representation in
October (mean, 50%).
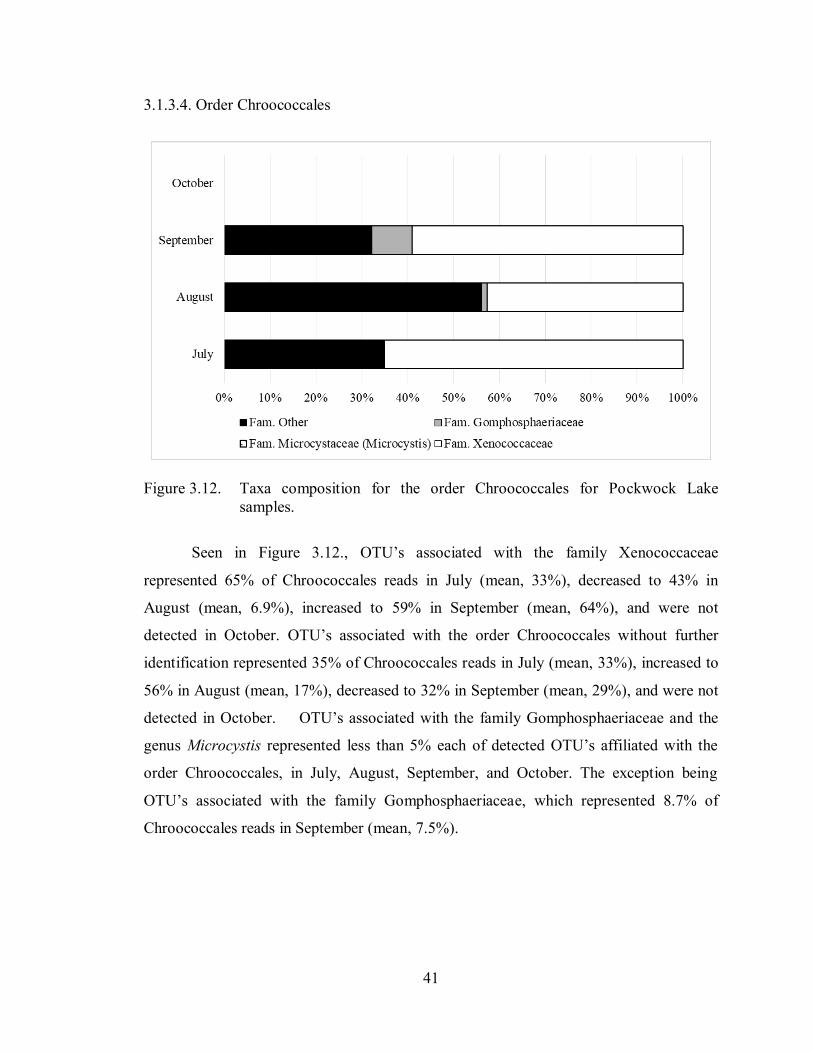
41
3.1.3.4. Order Chroococcales
Figure 3.12. Taxa composition for the order Chroococcales for Pockwock Lake
samples.
Seen in Figure 3.12., OTU’s associated with the family Xenococcaceae
represented 65% of Chroococcales reads in July (mean, 33%), decreased to 43% in
August (mean, 6.9%), increased to 59% in September (mean, 64%), and were not
detected in October. OTU’s associated with the order Chroococcales without further
identification represented 35% of Chroococcales reads in July (mean, 33%), increased to
56% in August (mean, 17%), decreased to 32% in September (mean, 29%), and were not
detected in October. OTU’s associated with the family Gomphosphaeriaceae and the
genus Microcystis represented less than 5% each of detected OTU’s affiliated with the
order Chroococcales, in July, August, September, and October. The exception being
OTU’s associated with the family Gomphosphaeriaceae, which represented 8.7% of
Chroococcales reads in September (mean, 7.5%).
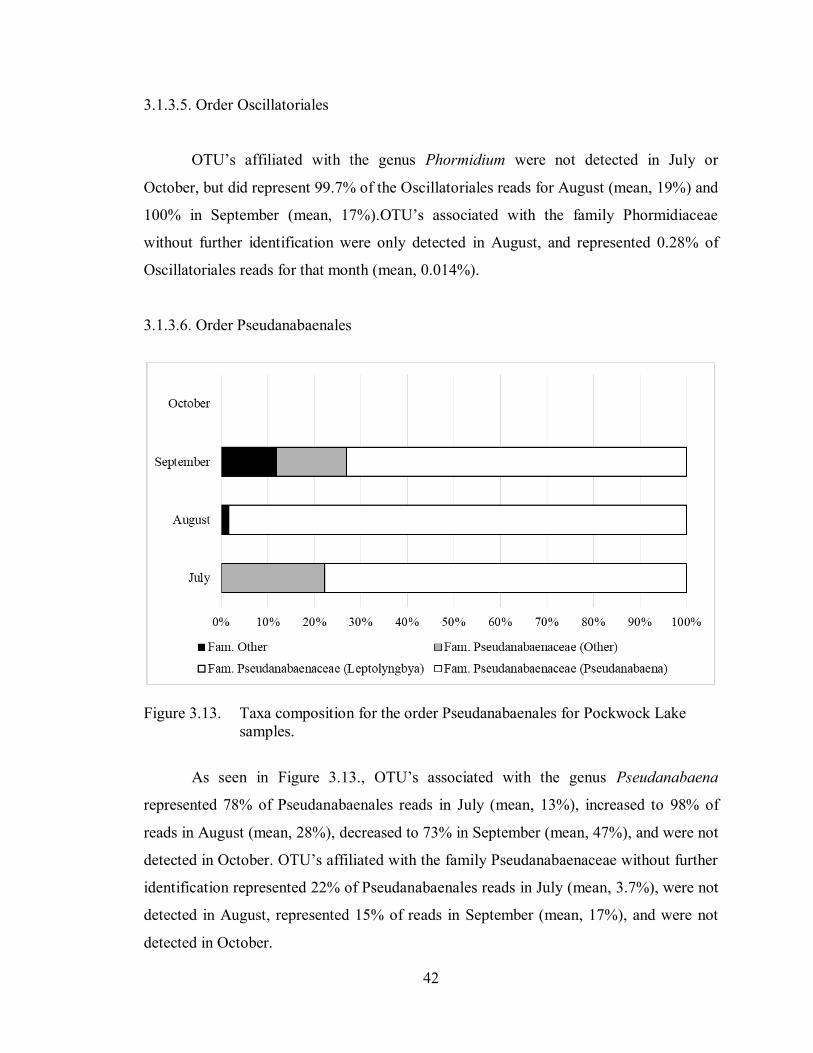
42
3.1.3.5. Order Oscillatoriales
OTU’s affiliated with the genus Phormidium were not detected in July or
October, but did represent 99.7% of the Oscillatoriales reads for August (mean, 19%) and
100% in September (mean, 17%).OTU’s associated with the family Phormidiaceae
without further identification were only detected in August, and represented 0.28% of
Oscillatoriales reads for that month (mean, 0.014%).
3.1.3.6. Order Pseudanabaenales
Figure 3.13. Taxa composition for the order Pseudanabaenales for Pockwock Lake
samples.
As seen in Figure 3.13., OTU’s associated with the genus Pseudanabaena
represented 78% of Pseudanabaenales reads in July (mean, 13%), increased to 98% of
reads in August (mean, 28%), decreased to 73% in September (mean, 47%), and were not
detected in October. OTU’s affiliated with the family Pseudanabaenaceae without further
identification represented 22% of Pseudanabaenales reads in July (mean, 3.7%), were not
detected in August, represented 15% of reads in September (mean, 17%), and were not
detected in October.
43
OTU’s associated with just the order Pseudanabaenales without further
identification and the genus Leptolyngbya, represented less than 5% each (overall and on
average), of all OTU’s associated with the order Pseudanabaenales detected in July,
August, September and October. Exception being those OTU’s affiliated with the order
Pseudanabaenales without further identification, which represented 12% of reads in
September (mean, 19%).
3.1.3.7. Order Synechococcales
OTU’s associated with the genus Synechococcus represented 100% of
Synechococcales reads in July (mean, 50%), decreased slightly to 99.8% in August
(mean, 24%), increased back to 100% representation in September (mean, 100%), and
were not detected in October. OTU’s affiliated with the genus Paulinella were only
detected in August, and represented 0.23% of Synechococcales reads for that month
(mean, 0.078%).
3.1.4. Lake Major
A total of seven samples were collected from Lake Major, and were collected on
June 23, July 28 and October 19, of 2016, for cyanobacteria population analysis.
However, of the seven samples, only two successfully amplified during PCR. The two
successful samples were both collected on July 28. See Appendix D for details regarding
sample sites, collection dates, and sample amplification success.
Figure 3.14 depicts the overall proportion of all cyanobacteria OTU reads
detected in the samples. Reads are organized by their affiliated orders, except for OTU’s
affiliated with chloroplasts, which are organized by their associated class of chloroplast
instead of their orders. See Appendix D for tabulated proportion of reads per month and
details concerning order composition per month.
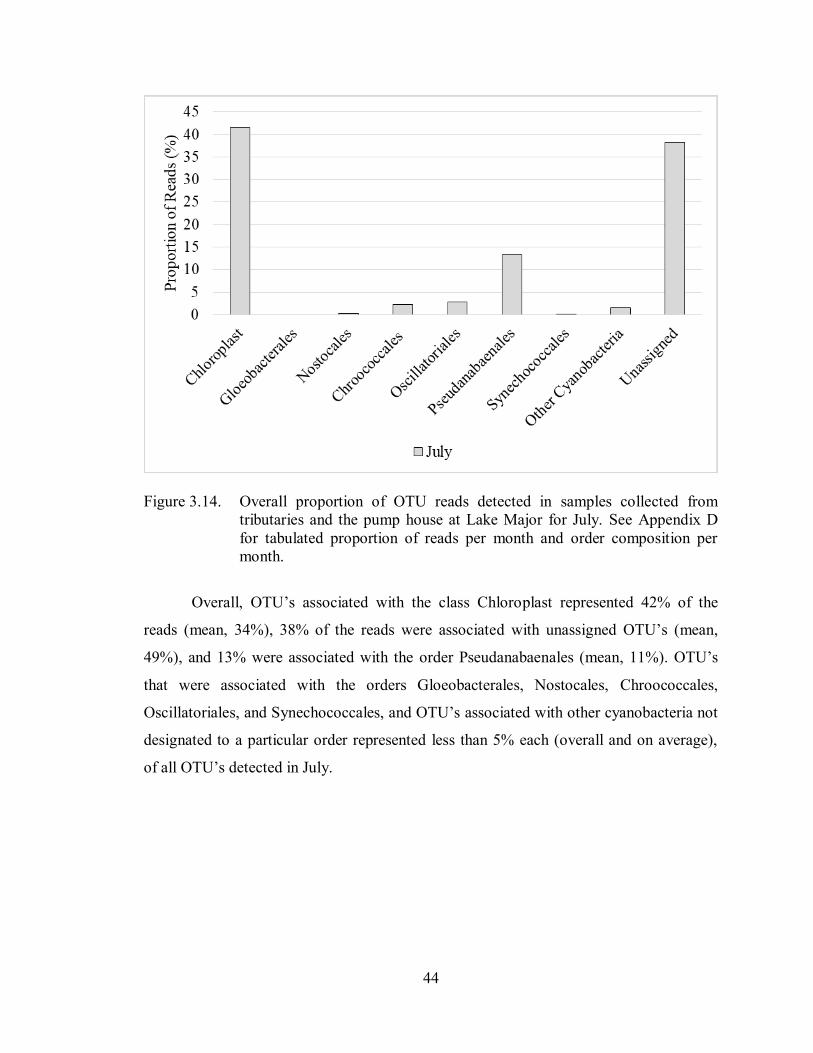
44
Figure 3.14. Overall proportion of OTU reads detected in samples collected from
tributaries and the pump house at Lake Major for July. See Appendix D
for tabulated proportion of reads per month and order composition per
month.
Overall, OTU’s associated with the class Chloroplast represented 42% of the
reads (mean, 34%), 38% of the reads were associated with unassigned OTU’s (mean,
49%), and 13% were associated with the order Pseudanabaenales (mean, 11%). OTU’s
that were associated with the orders Gloeobacterales, Nostocales, Chroococcales,
Oscillatoriales, and Synechococcales, and OTU’s associated with other cyanobacteria not
designated to a particular order represented less than 5% each (overall and on average),
of all OTU’s detected in July.
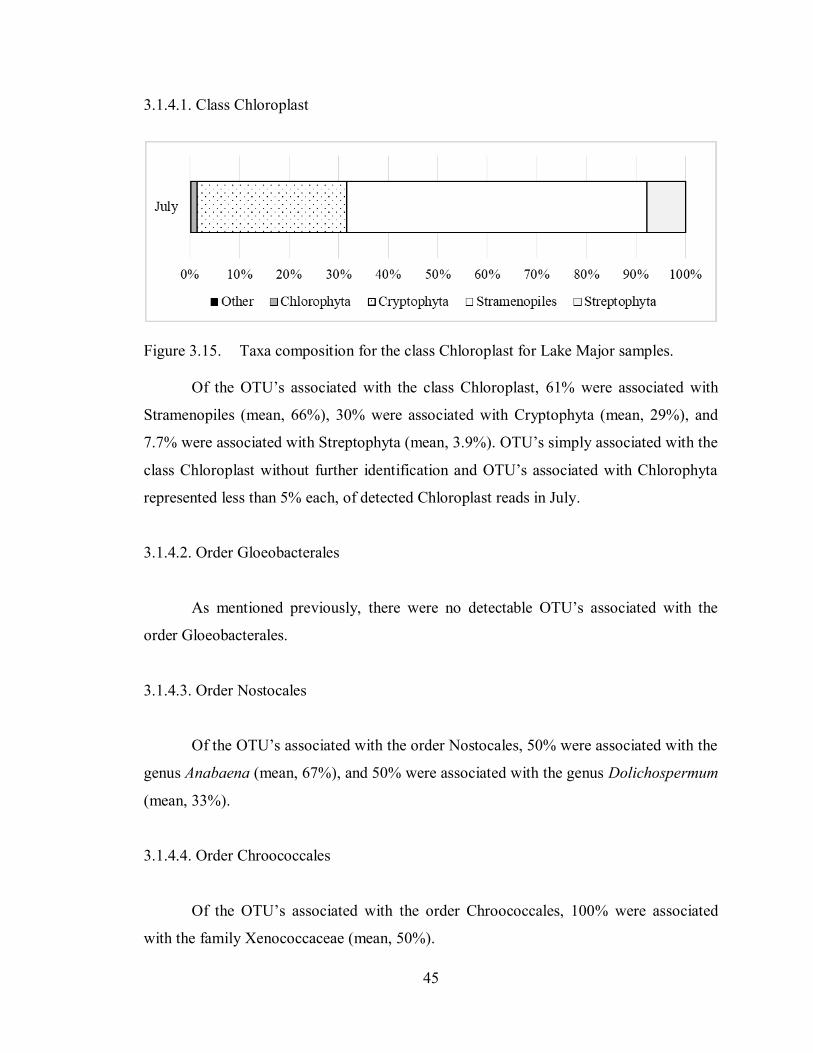
45
3.1.4.1. Class Chloroplast
Figure 3.15. Taxa composition for the class Chloroplast for Lake Major samples.
Of the OTU’s associated with the class Chloroplast, 61% were associated with
Stramenopiles (mean, 66%), 30% were associated with Cryptophyta (mean, 29%), and
7.7% were associated with Streptophyta (mean, 3.9%). OTU’s simply associated with the
class Chloroplast without further identification and OTU’s associated with Chlorophyta
represented less than 5% each, of detected Chloroplast reads in July.
3.1.4.2. Order Gloeobacterales
As mentioned previously, there were no detectable OTU’s associated with the
order Gloeobacterales.
3.1.4.3. Order Nostocales
Of the OTU’s associated with the order Nostocales, 50% were associated with the
genus Anabaena (mean, 67%), and 50% were associated with the genus Dolichospermum
(mean, 33%).
3.1.4.4. Order Chroococcales
Of the OTU’s associated with the order Chroococcales, 100% were associated
with the family Xenococcaceae (mean, 50%).
46
3.1.4.5. Order Oscillatoriales
Of the OTU’s associated with the order Oscillatoriales, 100% were associated
with the genus Phormidium (mean, 50%).
3.1.4.6. Order Pseudanabaenales
Of the OTU’s associated with the order Pseudanabaenales, 99.5% were associated
with the genus Pseudanabaena (mean, 50%) while 0.47% were associated with the genus
Arthronema (mean, 50%).
3.1.4.7. Order Synechococcales
Of the OTU’s associated with the order Synechococcales, 100% were associated
with the genus Synechococcus (mean, 50%).
3.2. WATER CHEMISTRY
3.2.1. Fletchers Lake
3.2.1.1. Water Chemistry of Treatment Plant Water
Monthly means and standard deviations were determined for water samples
collected from the Collin’s Park Water Treatment Plant, and summarised in Appendix A.
Data was provided by Michael Brophy (MASc student, Dalhousie University). Alkalinity
and pH both increased from June to July, decreased from July to August, increased from
August to September, and decreased from September to October, and showed an overall
upward trend. The highest alkalinity mean was found to be 18.02 ± 0.94 CaCO3 mg/L in
September, and the lowest mean was found to be 15.59 CaCO3 mg/L in August, while the
highest pH mean was found to be 6.72 ± 0.40 in September, and the lowest value was
found to be 5.29 in August.
47
TOC increased from June to July, decreased from July to September, and
increased from September to October, and showed an overall downward trend. The
highest TOC mean was determined to be 3.65 ± 0.11 mg/L in July, while the lowest mean
was determined to be 3.08 ± 0.15 mg/L in September. TN decreased from June to
September, and remained somewhat the same from September to October, having an
overall downward trend. The highest TN mean was determined to be 0.24 ± 0.03 mg/L in
June, and the lowest mean was found to be 0.13 ± 0.01 mg/L in September, and 0.13
mg/L in October.
SUVA decreased from June to September, and increased from September to
October, and had an overall downward trend. The highest SUVA mean was determined
to be 3.48 ± 0.38 m-1
absorbance per mg/L of DOC in June, and was lowest in
September, with a mean of 2.12 ± 0.01 m-1
absorbance per mg/L of DOC. Turbidity
decreased from June to August, and increased from August to October, with and overall
upward trend. The highest turbidity mean was determined to be 1.95 NTU in October,
and the lowest mean was determined to be 0.89 NTU in August. Colour was only
collected August to October. Within that time frame, colour decreased from August to
September, and increased from September to October, showing an overall upward trend.
The highest colour value was found to be 9.50 NTU in October, while the lowest mean
was found to be 5.67 ± 0.58 NTU in September.
Data for UV254 and TP were unavailable. However, according to Clement et al
(2007), Fletchers Lake had TP values ranging between 9 µg/L and 12 µg/L in 2000.
3.2.1.2. Water Chemistry of Stream and Tributary Samples
Due to the large variation in values for tributary samples, it was decided to show
the spread of data encountered in samples, along with the means and medians, rather than
simply means and standard deviations. As seen in Appendix A, the highest alkalinity
value was found to be 28.41 CaCO3 mg/L in September, while the lowest value was
48
found to be 0.03 CaCO3 mg/L in July. The highest pH value was found to be 7.34 in
September, and the lowest value was found to be 3.57 in June.
The highest TOC value was determined to be 21.20 mg/L in June, while the
lowest value was determined to be 1.98 mg/L in August. The highest DOC value was
determined to be 20.55 mg/L in June, while the lowest value was determined to be 2.01
mg/L in August. The highest TN value was determined to be 0.61 mg/L in August, and
the lowest value was found to be 0.06 mg/L in July and September.
The highest SUVA value was determined to be 6.71 m-1
absorbance per mg/L of
DOC in July, and was lowest in September, with a value of 1.92 m-1
absorbance per mg/L
of DOC. The highest turbidity value was determined to be 21.93 NTU in June, and the
lowest value was determined to be 0.35 NTU in October. As mentioned previously,
colour was only collected August to October. Within that time frame, the highest colour
value was found to be 146.50 NTU in August, while the lowest value was found to be
6.00 NTU in September. Data for UV254 and TP were unavailable.
3.2.2. Powder Mill Lake
Monthly means and standard deviations were determined for water samples
collected from in-lake collection points at Powder Mill Lake, and summarised in
Appendix B. It should be noted that only pH was collected from July to November, while
the other water quality parameters were collected only in October and November.
Alkalinity decreased from 24.38 ± 2.87 CaCO3 mg/L in October to 21.47 ± 0.72
CaCO3 mg/L in November. From July to August, pH increased, then decreased from
August to October, and increased from October to November, having an overall upward
trend. The highest pH mean was found to be 7.48 ± 0.15 in November, and the lowest
mean was found to be 7.06 ± 0.27 in July.
49
TOC increased from 3.10 ± 0.36 mg/L in October to 3.53 ± 1.41 mg/L in
November. TN increased slightly from 0.13 ± 0.01 mg/L in October, to 0.14 ± 0.01 mg/L
in November. TP was determined to be below the detection limit of 10 µg/L in October
and November.
UV254 increased slightly from 0.07 ± 0.01 cm-1
in October to 0.08 ± 0.001 cm-1
in
November while SUVA increased from 2.11 ± 0.66 m-1
abs per mg/L of DOC in October
to 2.47 ± 0.34 m-1
abs per mg/L of DOC in November. Turbidity increased from 0.67 ±
0.11 NTU in October to 0.93 ± 0.27 NTU in November, while colour increased from 6.25
± 4.41 NTU in October to 9.64 ± 1.22 NTU in November.
3.2.3. Pockwock Lake
3.2.3.1. Water Chemistry of In-Lake Samples
Monthly means and standard deviations were determined for water samples
collected from in-lake collection points at Pockwock Lake, and summarised in Appendix
C. Data was provided by Dave Redden (MASc student, Dalhousie University). Alkalinity
increased from June to July and decreased from July to August. There was no data for
September, however, alkalinity was found to be higher in October than in August. There
may be an overall upward trend. The highest alkalinity mean was found to be 1.85 ± 0.60
CaCO3 mg/L in October, and the lowest mean was found to be 1.04 ± 0.50 CaCO3 mg/L
in June. Data for pH decreased from June to August, and there was no data for
September. However, pH in October was greater than it was in August. There may be an
overall upward trend. The highest pH mean was found to be 5.25 ± 0.04 in October, and
the lowest mean was found to be 5.12 ± 0.22 in August.
TOC increased from June to July, and decreased from July to August. There was
no data for September, but TOC for October was lower than that in August. There may be
an overall downward trend. The highest TOC mean was determined to be 3.60 ± 0.36
mg/L in July, while the lowest mean was determined to be 2.88 ± 0.36 mg/L in October.
50
TN decreased from June to July, and there was no data for August. However, TN for
October was higher than the TN in July. The only surface sample in September was
reported to have a much higher concentration than other surface samples for Pockwock
Lake. However, the value was closer in likeness to concentrations from at-depth samples,
and may have been mislabelled as a surface sample. The highest TN mean was
determined to be 0.09 ± 0.03 mg/L in June and 0.09 ± 0.01 mg/L in October, and the
lowest mean was found to be 0.06 ± 0.01 mg/L in September.
UV254 decreased from June to July, increased from July to August, and decreased
from August to October, showing an overall downward trend. The highest UV254 mean
was determined to be 0.11 ± 0.002 cm-1
in June, and the lowest mean was found in
October at 0.068 ± 0.0008 cm-1
. SUVA decreased from June to July, increased from July
to September, and decreased from September to October. Data shows an overall
downward trend. The highest SUVA mean was determined to be 3.43 ± 0.36 m-1
absorbance per mg/L of DOC in June, and was lowest in October, with a mean of 2.61 ±
0.11 m-1
absorbance per mg/L of DOC. Turbidity increased from June to August, there
was no data for September, and turbidity in October was lower than it was in August.
Data shows an overall downward trend. The highest turbidity mean was determined to be
0.71 ± 0.45 NTU in August, and the lowest mean was determined to be 0.45 ± 0.08 NTU
in October. Colour decreased from June to August, greatly increased in September, and
greatly decreased in October. Data showed an overall downward trend. The highest
colour mean was found to be 37.89 ± 21.69 NTU in September, while the lowest mean
was found to be 10.63 ± 0.72 NTU in October.
Data for TP was unavailable. However, according to Ginn et al (2015), Pockwock
Lake had a TP concentration around 4 µg/L in 2005, 2006.
3.2.3.2. Water Chemistry of Stream and Tributary Samples
Due to the large variation in values for tributary samples, it was decided to show
the spread of data encountered in samples, along with the means and medians, rather than
51
simply means and standard deviations. As seen in Appendix C, the highest alkalinity
value was found to be 53.08 CaCO3 mg/L in August, while the lowest value was found to
be 0.03 CaCO3 mg/L in July. The highest and lowest pH value was observed in June, at
5.89 and 3.90, respectively.
The highest and lowest TOC concentrations were observed in July, at 32.84 mg/L
and 2.40 mg/L, respectively. The highest DOC concentration was determined to be 44.74
mg/L in October, while the lowest value was determined to be 2.30 mg/L in September.
The highest TN concentration was determined to be 3.65 mg/L in August, and the lowest
value was found to be 0.07 mg/L in July.
The highest UV254 value was found to be 1.18 cm-1
in July, and the lowest was
found to be 0.07 cm-1
in July and August. The highest SUVA value was determined to be
6.92 m-1
absorbance per mg/L of DOC in July, and was lowest in August, with a value of
2.38 m-1
absorbance per mg/L of DOC. The highest turbidity value was determined to be
36.92 NTU in July, and the lowest value was determined to be 0.46 NTU in June and
July. The highest and lowest colour value was observed in August, at 688 NTU and 3.00
NTU, respectively. Data for TP was unavailable.
3.2.4. Lake Major
3.2.4.1. Water Chemistry of Pump House Samples
Monthly averages and standard deviations were determined for water samples
collected from the pump house at Lake Major, and summarised in Appendix D. Data was
provided by Lindsay Anderson (PhD student, Dalhousie University) and Halifax Water.
Data for pH increased from June to August, then decreased from August to November,
showing an overall downward trend. The highest pH mean was found to be 5.59 ± 0.06 in
August, and the lowest mean was found to be 5.25 in November.
52
TOC concentration decreased from June to September, and increased from
September to October. TOC data showed an overall downward trend. The highest mean
TOC concentration was determined to be 4.90 ± 1.18 mg/L in October, while the lowest
mean was determined to be 3.98 ± 0.27 mg/L in September.
UV254 decreased from June to August, remained almost the same into September,
and increased from September to November. UV254 data showed an overall downward
trend. The highest UV254 mean was determined to be 0.24 ± 0.01 cm-1
in June, and the
lowest mean was found to be 0.18 ± 0.002 cm-1
in August and 0.18 ± 0.01 cm-1
in
September. SUVA decreased from June to August, increased from August to September,
and decreased from September to October. SUVA data showed an overall downward
trend. The highest SUVA mean was determined to be 5.11 ± 0.16 m-1
absorbance per
mg/L of DOC in June, and was lowest in August, with a mean of 3.93 ± 0.15 m-1
absorbance per mg/L of DOC. Turbidity increased from June to July, decreased from
July to September, increased from September to October, and finally decreased from
October to November. Turbidity data showed an overall downward trend. The highest
turbidity mean was determined to be 0.43 ± 0.08 NTU in July, and the lowest mean was
determined to be 0.29 ± 0.08 NTU in September. Colour decreased from June to
September, then increased from September to November. The highest colour mean was
found to be 44.38 ± 1.94 NTU in June, while the lowest mean was found to be 26.33 ±
0.58 NTU in September.
Data for alkalinity, TN and TP were unavailable. However, according to Clement
et al (2007), Lake Major had TP values ranging between 4 µg/L and 11 µg/L in 2000.
3.2.4.2. Water Chemistry of Stream and Tributary Samples
Once again, due to the large variation in values for tributary samples, it was
decided to show the spread of data encountered in samples, along with the means and
medians, rather than simply means and standard deviations. However, for this data set,
53
only July was reported, as tributary samples for cyanobacteria analysis were only
collected in June and July, and tributary water quality data prior to July was not available.
As seen in Table 3.9., the highest pH value was found to be 6.20, and the lowest
to be 4.50. The highest TOC concentration was found to be 16.07 mg/L, and the lowest
concentration was found to be 3.09 mg/L, respectively. The highest DOC concentration
was determined to be 13.62 mg/L, while the lowest concentration was determined to be
2.76 mg/L. The highest TP concentration was found to be 27.00 µg/L and the lowest was
found to be 5.00 µg/L. The highest turbidity value was determined to be 22.60 NTU, and
the lowest value was determined to be 0.68 NTU. The highest colour value was observed
to be 50.00 NTU and the lowest was observed to be 12 NTU. Data for alkalinity, TN,
UV254 and SUVA were unavailable.
3.3. ENVIRONMENT DATA
3.3.1. June
3.3.1.1. Temperature
After determining the daily maximum, minimum, median, upper quartile and
lower quartile values for temperature data, a box-and-whisker graph, Figure 3.16(a), was
made to show the hourly spread of temperatures per day for the month of June. It was
also determined that the maximum temperature in June was 27.0°C, the minimum
temperature was 3.2°C, and the mean temperature with standard deviation was 14.4°C ±
4.8°C.
3.3.1.2. Precipitation
The maximum volume of precipitation achieved in one day during June was 18.3
mm, while the minimum volume of precipitation was found to be 0.0 mm. The mean
volume of precipitation was 1.9 mm, and the total accumulated volume of precipitation in
54
June was determined to be 55.5 mm. A line graph depicting daily precipitation data
collected in June can be found in Figure 3.16(b).
3.3.1.3. Wind Speed
The maximum wind speed recorded at the Bedford Range weather station in June
was 24.0 km/h, while the minimum wind speed was 0.0 km/h. The mean with standard
deviation was 9.1 km/h ± 5.7 km/h. A time series graph depicting wind speed data for
June can be seen in Figure 3.16(c). The dashed line in Figure 3.16(c), and shown in all
subsequent time series graphs for wind speed in this report, depicts the wind speed
threshold over which algal/cyanobacteria blooms are disrupted and dispersed, which is
around 10.8 km/h (Whitton and Potts, 2000).
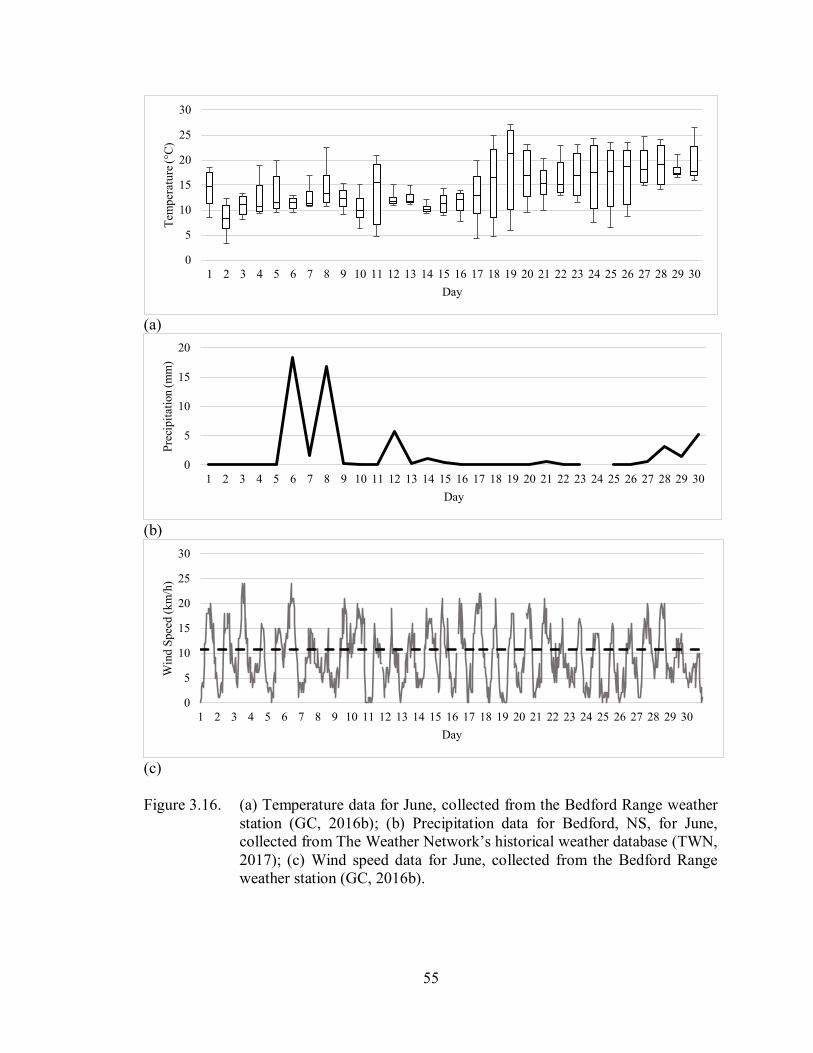
55
(a)
(b)
(c)
Figure 3.16. (a) Temperature data for June, collected from the Bedford Range weather
station (GC, 2016b); (b) Precipitation data for Bedford, NS, for June,
collected from The Weather Network’s historical weather database (TWN,
2017); (c) Wind speed data for June, collected from the Bedford Range
weather station (GC, 2016b).
0
5
10
15
20
25
30
1 2 3 4 5 6 7 8 9 10 11 12 13 14 15 16 17 18 19 20 21 22 23 24 25 26 27 28 29 30
Tem
per
ature
(°C
)
Day
0
5
10
15
20
1 2 3 4 5 6 7 8 9 10 11 12 13 14 15 16 17 18 19 20 21 22 23 24 25 26 27 28 29 30
Pre
cipit
atio
n (
mm
)
Day
0
5
10
15
20
25
30
1 2 3 4 5 6 7 8 9 10 11 12 13 14 15 16 17 18 19 20 21 22 23 24 25 26 27 28 29 30
Win
d S
pee
d (
km
/h)
Day

56
3.3.2. July
3.3.2.1. Temperature
After determining the daily maximum, minimum, median, upper quartile and
lower quartile values for temperature data, a box-and-whisker graph, Figure 3.17(a), was
made to show the hourly spread of temperatures per day for the month of July. It was also
determined that the maximum temperature in July was 29.3°C, the minimum temperature
was 8.2°C, and the mean temperature with standard deviation was 19.0°C ± 4.7°C.
3.3.2.2. Precipitation
The maximum volume of precipitation achieved in one day during July was 16.9
mm, while the minimum volume of precipitation was found to be 0.0 mm. The mean
volume of precipitation was 2.3 mm, and the total accumulated volume of precipitation
was determined to be 69.6 mm. A line graph depicting daily precipitation data collected
in July can be found in Figure 3.17(b).
3.3.2.3. Wind Speed
The maximum wind speed detected at the Bedford Range weather station in July
was 25.0 km/h, while the minimum wind speed was 0.0 km/h. The mean with standard
deviation was 7.7 km/h ± 5.4 km/h. A time series graph depicting wind speed data for
July can be seen in Figure 3.17(c).
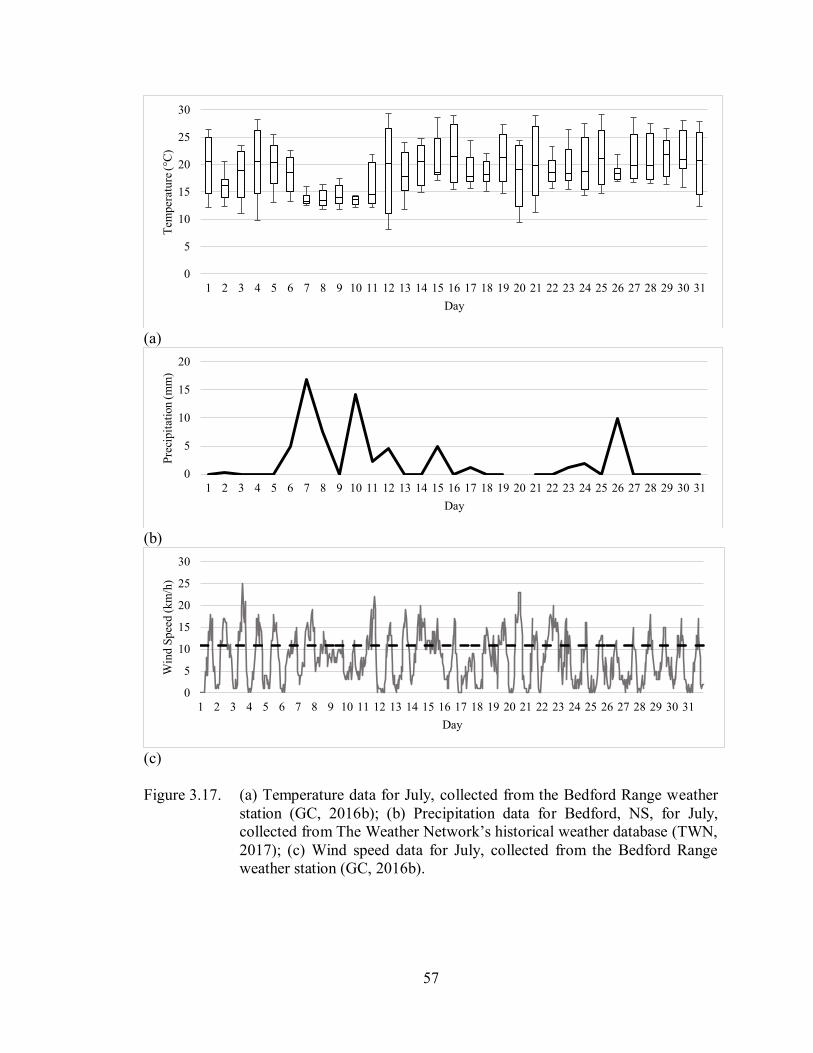
57
(a)
(b)
(c)
Figure 3.17. (a) Temperature data for July, collected from the Bedford Range weather
station (GC, 2016b); (b) Precipitation data for Bedford, NS, for July,
collected from The Weather Network’s historical weather database (TWN,
2017); (c) Wind speed data for July, collected from the Bedford Range
weather station (GC, 2016b).
0
5
10
15
20
25
30
1 2 3 4 5 6 7 8 9 10 11 12 13 14 15 16 17 18 19 20 21 22 23 24 25 26 27 28 29 30 31
Tem
per
ature
(°C
)
Day
0
5
10
15
20
1 2 3 4 5 6 7 8 9 10 11 12 13 14 15 16 17 18 19 20 21 22 23 24 25 26 27 28 29 30 31
Pre
cipit
atio
n (
mm
)
Day
0
5
10
15
20
25
30
1 2 3 4 5 6 7 8 9 10 11 12 13 14 15 16 17 18 19 20 21 22 23 24 25 26 27 28 29 30 31
Win
d S
pee
d (
km
/h)
Day

58
3.3.3. August
3.3.3.1. Temperature
After determining the daily maximum, minimum, median, upper quartile and
lower quartile values for temperature data for August, a box-and-whisker graph, Figure
3.18(a), was made to show the hourly spread of temperatures per day for the month. It
was also determined that the maximum temperature in August was 28.8°C, the minimum
temperature was 8.7°C, and the mean temperature with standard deviation was 19.3°C ±
3.9°C.
3.3.3.2. Precipitation
The maximum volume of precipitation achieved in one day during August was
30.3 mm, while the minimum volume of precipitation was found to be 0.0 mm. The mean
volume of precipitation was 1.4 mm, and the total accumulated volume of precipitation
was determined to be 39.7 mm. A line graph depicting daily precipitation data collected
in August can be found in Figure 3.18(b).
3.3.3.3. Wind Speed
The maximum wind speed detected at the Bedford Range weather station in
August was 24.0 km/h, while the minimum wind speed was 0.0 km/h. The mean with
standard deviation was 7.6 km/h ± 5.3 km/h. A time series graph depicting wind speed
data for August can be seen in Figure 3.18(c).
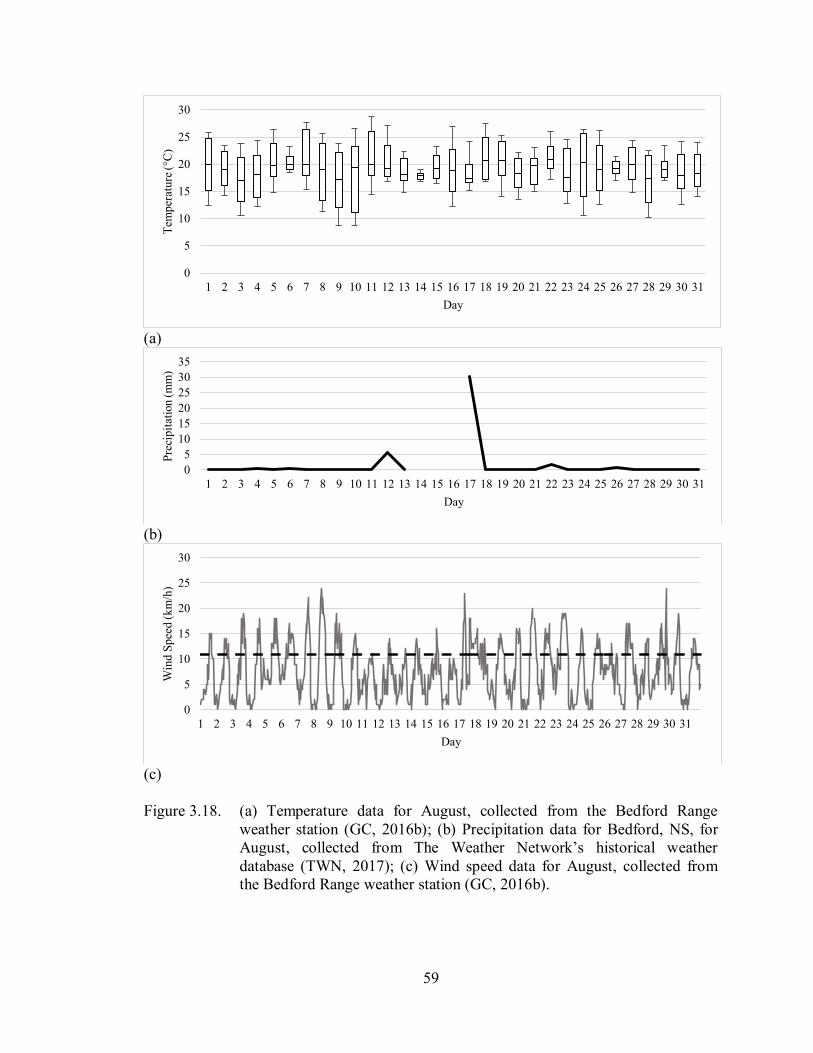
59
(a)
(b)
(c)
Figure 3.18. (a) Temperature data for August, collected from the Bedford Range
weather station (GC, 2016b); (b) Precipitation data for Bedford, NS, for
August, collected from The Weather Network’s historical weather
database (TWN, 2017); (c) Wind speed data for August, collected from
the Bedford Range weather station (GC, 2016b).
0
5
10
15
20
25
30
1 2 3 4 5 6 7 8 9 10 11 12 13 14 15 16 17 18 19 20 21 22 23 24 25 26 27 28 29 30 31
Tem
per
ature
(°C
)
Day
0
5
10
15
20
25
30
35
1 2 3 4 5 6 7 8 9 10 11 12 13 14 15 16 17 18 19 20 21 22 23 24 25 26 27 28 29 30 31
Pre
cipit
atio
n (
mm
)
Day
0
5
10
15
20
25
30
1 2 3 4 5 6 7 8 9 10 11 12 13 14 15 16 17 18 19 20 21 22 23 24 25 26 27 28 29 30 31
Win
d S
pee
d (
km
/h)
Day
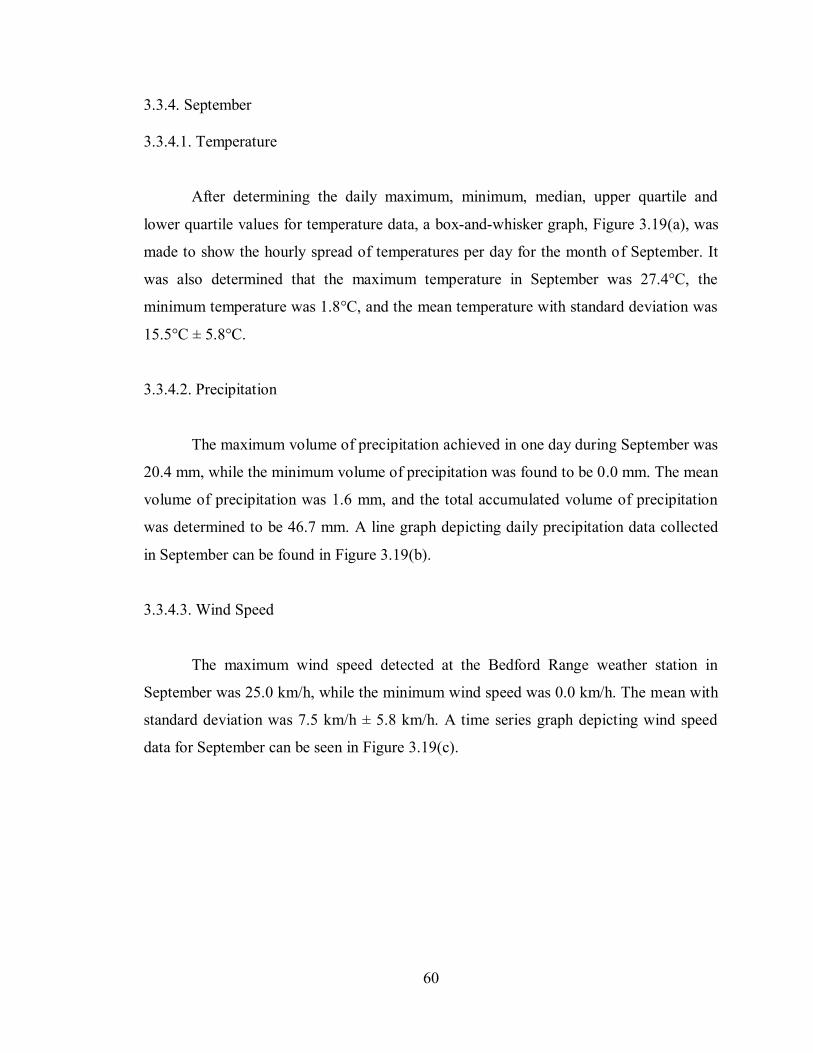
60
3.3.4. September
3.3.4.1. Temperature
After determining the daily maximum, minimum, median, upper quartile and
lower quartile values for temperature data, a box-and-whisker graph, Figure 3.19(a), was
made to show the hourly spread of temperatures per day for the month of September. It
was also determined that the maximum temperature in September was 27.4°C, the
minimum temperature was 1.8°C, and the mean temperature with standard deviation was
15.5°C ± 5.8°C.
3.3.4.2. Precipitation
The maximum volume of precipitation achieved in one day during September was
20.4 mm, while the minimum volume of precipitation was found to be 0.0 mm. The mean
volume of precipitation was 1.6 mm, and the total accumulated volume of precipitation
was determined to be 46.7 mm. A line graph depicting daily precipitation data collected
in September can be found in Figure 3.19(b).
3.3.4.3. Wind Speed
The maximum wind speed detected at the Bedford Range weather station in
September was 25.0 km/h, while the minimum wind speed was 0.0 km/h. The mean with
standard deviation was 7.5 km/h ± 5.8 km/h. A time series graph depicting wind speed
data for September can be seen in Figure 3.19(c).
61
(a)
(b)
(c)
Figure 3.19. (a) Temperature data for September, collected from the Bedford Range
weather station (GC, 2016b); (b) Precipitation data for Bedford, NS, for
September, collected from The Weather Network’s historical weather
database (TWN, 2017); (c) Wind speed data for September, collected from
the Bedford Range weather station (Government of Canada, 2016b).
0
5
10
15
20
25
30
1 2 3 4 5 6 7 8 9 10 11 12 13 14 15 16 17 18 19 20 21 22 23 24 25 26 27 28 29 30
Tem
per
ature
(°C
)
Day
0
5
10
15
20
25
1 2 3 4 5 6 7 8 9 10 11 12 13 14 15 16 17 18 19 20 21 22 23 24 25 26 27 28 29 30
Pre
cipit
atio
n (
mm
)
Day
0
5
10
15
20
25
30
1 2 3 4 5 6 7 8 9 10 11 12 13 14 15 16 17 18 19 20 21 22 23 24 25 26 27 28 29 30
Win
d S
pee
d (
km
/h)
Day
62
3.3.5. October
3.3.5.1. Temperature
After determining the daily maximum, minimum, median, upper quartile and
lower quartile values for temperature data for October, a box-and-whisker graph, Figure
3.20(a), was made to show the hourly spread of temperatures per day for the month. It
was also determined that the maximum temperature in October was 23.8°C, the minimum
temperature was -2.4°C, and the mean temperature with standard deviation was 10.0°C ±
5.4°C.
3.3.5.2. Precipitation
The maximum volume of precipitation achieved in one day during October was
74.5 mm, while the minimum volume of precipitation was found to be 0.0 mm. The mean
volume of precipitation was 7.6 mm, and the total accumulated volume of precipitation
was determined to be 204.7 mm. A line graph depicting daily precipitation data collected
in October can be found in Figure 3.20(b).
3.3.5.3. Wind Speed
The maximum wind speed detected at the Bedford Range weather station in
October was 40.0 km/h, while the minimum wind speed was 0.0 km/h. The mean with
standard deviation was 7.9 km/h ± 6.7 km/h. A time series graph depicting wind speed
data for October can be seen in Figure 3.20(c).
63
(a)
(b)
(c)
Figure 3.20. (a) Temperature data for October, collected from the Bedford Range
weather station (GC, 2016b); (b) Precipitation data for Bedford, NS, for
October, collected from The Weather Network’s historical weather
database (TWN, 2017); (c) Wind speed data for October, collected from
the Bedford Range weather station (GC, 2016b).
-5
0
5
10
15
20
25
30
1 2 3 4 5 6 7 8 9 10 11 12 13 14 15 16 17 18 19 20 21 22 23 24 25 26 27 28 29 30 31
Tem
per
ature
(°C
)
Day
0
10
20
30
40
50
60
70
80
1 2 3 4 5 6 7 8 9 10 11 12 13 14 15 16 17 18 19 20 21 22 23 24 25 26 27 28 29 30 31
Pre
cipit
atio
n (
mm
)
Day
0
5
10
15
20
25
30
35
40
45
1 2 3 4 5 6 7 8 9 10 11 12 13 14 15 16 17 18 19 20 21 22 23 24 25 26 27 28 29 30 31
Win
d S
pee
d (
km
/h)
Day
64
3.3.6. November
3.3.6.1. Temperature
After determining the daily maximum, minimum, median, upper quartile and
lower quartile values for temperature data, a box-and-whisker graph, Figure 3.21(a), was
made to show the hourly spread of temperatures per day for the month of November. It
was also determined that the maximum temperature in November was 15.1°C, the
minimum temperature was -3.6°C, and the mean temperature with standard deviation was
5.0°C ± 4.0°C.
3.3.6.2. Precipitation
The maximum volume of precipitation achieved in one day during November was
20.9 mm, while the minimum volume of precipitation was found to be 0.0 mm. The mean
volume of precipitation was 2.7 mm, and the total accumulated volume of precipitation
was determined to be 75.0 mm. A line graph depicting daily precipitation data collected
in November can be found in Figure 3.21(b).
3.3.6.3. Wind Speed
The maximum wind speed detected at the Bedford Range weather station in
November was 28.0 km/h, while the minimum wind speed was 0.0 km/h. The mean with
standard deviation was 7.9 km/h ± 5.5 km/h. A time series graph depicting wind speed
data for November can be seen in Figure 3.21(c).
65
(a)
(b)
(c)
Figure 3.21. (a) Temperature data for November, collected from the Bedford Range
weather station (GC, 2016b); (b) Precipitation data for Bedford, NS, for
November, collected from The Weather Network’s historical weather
database (TWN, 2017); (c) Wind speed data for November, collected from
the Bedford Range weather station (GC, 2016b).
-5
0
5
10
15
20
1 2 3 4 5 6 7 8 9 10 11 12 13 14 15 16 17 18 19 20 21 22 23 24 25 26 27 28 29 30
Tem
per
ature
(°C
)
Day
0
5
10
15
20
25
1 2 3 4 5 6 7 8 9 10 11 12 13 14 15 16 17 18 19 20 21 22 23 24 25 26 27 28 29 30
Pre
cipit
atio
n (
mm
)
Day
0
5
10
15
20
25
30
1 2 3 4 5 6 7 8 9 10 11 12 13 14 15 16 17 18 19 20 21 22 23 24 25 26 27 28 29 30
Win
d S
pee
d (
km
/h)
Day
66
CHAPTER 4 DISCUSSION
4.1. CYANOBACTERIA POPULATION ANALYSIS
4.1.1. Cyanobacteria Presence
The most dominant group of cyanobacteria isolates observed typically within and
between samples would represent around 50% of the OTU reads, while the second most
dominant group of isolates would represent around 25% to 30% of OTU reads. The third
most dominant isolates would represent around 10% to 20% of OTU reads, while all
remaining groups would represent less than 5% of reads, each. Of note, of the dominant
groups of isolates observed, OTU’s associated with the class chloroplast were usually the
most dominant or second most dominant group amongst all samples collected in 2016.
Samples from tributaries and the Collin’s Park Water Treatment Plant at Fletchers
Lake usually showed four dominant groups of cyanobacteria isolates that each
represented over 5% of OTU reads detected in September and October. Meanwhile,
samples from in-lake sites and one tributary at Powder Mill Lake usually showed two
dominant groups above 5%, with the exception of July, which had four dominant groups
above 5%. Of note, the two most dominant cyanobacteria isolate groups observed in
samples from Fletchers Lake and Powder Mill Lake, every month, were associated with
the order Synechococcales and the class Chloroplast. This may or may not be because
Powder Mill Lake flows into Lake William, which flows into Thomas Lake, which flows
into Fletchers Lake (Soil and Water Conservation Society of Metro Halifax, 2017).
Samples from tributaries and in-lake sites at Pockwock Lake usually showed two to three
dominant groups of cyanobacteria isolates with proportions of reads over 5%, except for
September, which showed four dominant groups above 5%. Meanwhile, samples from
Lake Major tributaries had three dominant groups above 5%.
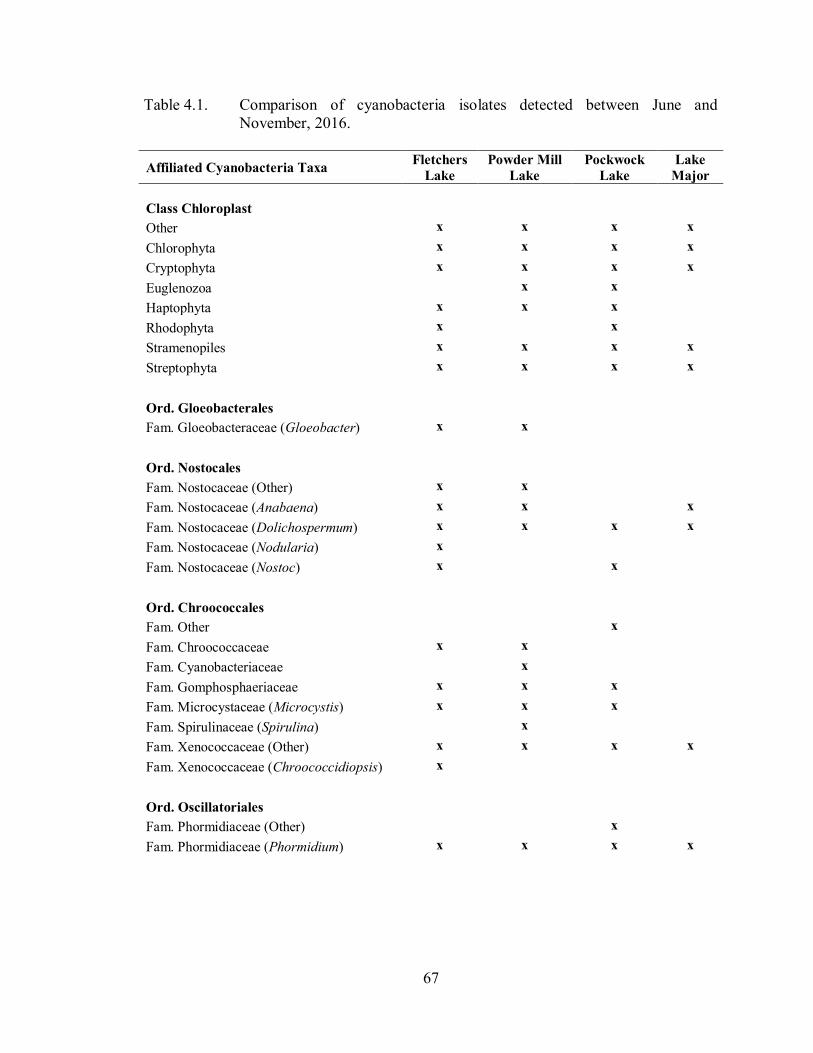
67
Table 4.1. Comparison of cyanobacteria isolates detected between June and
November, 2016.
Affiliated Cyanobacteria Taxa Fletchers
Lake
Powder Mill
Lake
Pockwock
Lake
Lake
Major
Class Chloroplast
Other x x x x
Chlorophyta x x x x
Cryptophyta x x x x
Euglenozoa x x
Haptophyta x x x
Rhodophyta x
x
Stramenopiles x x x x
Streptophyta x x x x
Ord. Gloeobacterales
Fam. Gloeobacteraceae (Gloeobacter) x x
Ord. Nostocales
Fam. Nostocaceae (Other) x x
Fam. Nostocaceae (Anabaena) x x x
Fam. Nostocaceae (Dolichospermum) x x x x
Fam. Nostocaceae (Nodularia) x
Fam. Nostocaceae (Nostoc) x
x
Ord. Chroococcales
Fam. Other x
Fam. Chroococcaceae x x
Fam. Cyanobacteriaceae x
Fam. Gomphosphaeriaceae x x x
Fam. Microcystaceae (Microcystis) x x x
Fam. Spirulinaceae (Spirulina) x
Fam. Xenococcaceae (Other) x x x x
Fam. Xenococcaceae (Chroococcidiopsis) x
Ord. Oscillatoriales
Fam. Phormidiaceae (Other) x
Fam. Phormidiaceae (Phormidium) x x x x
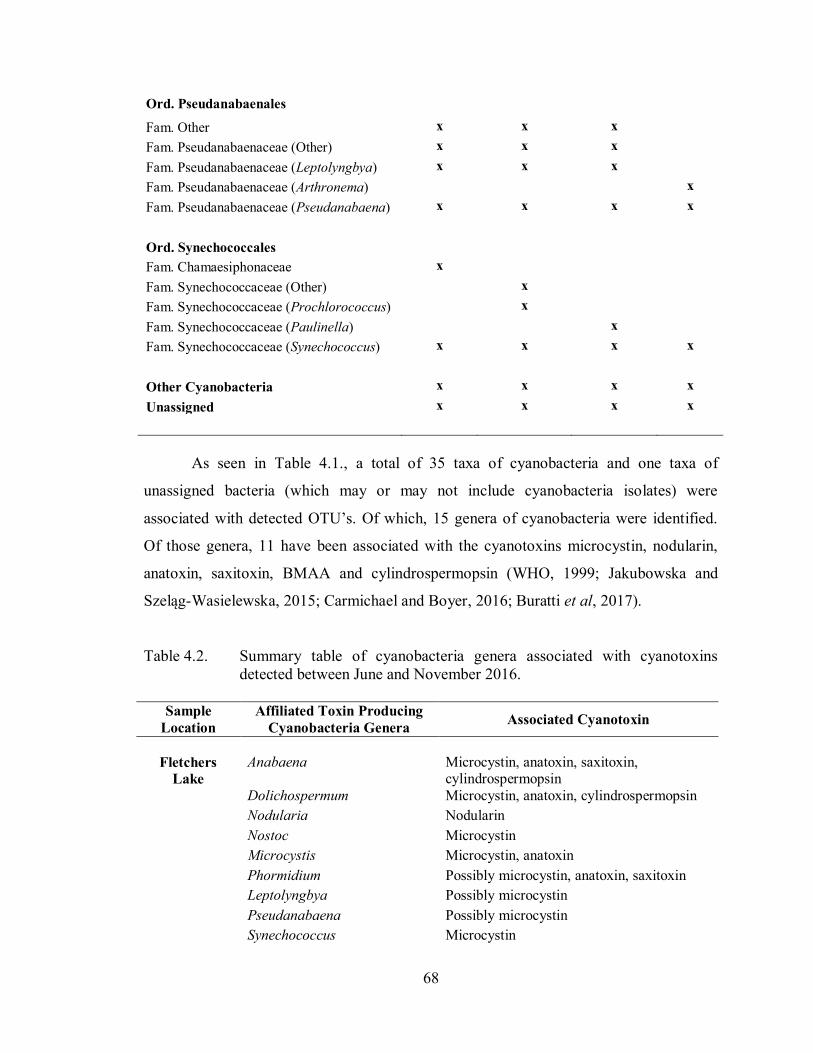
68
Ord. Pseudanabaenales
Fam. Other x x x
Fam. Pseudanabaenaceae (Other) x x x
Fam. Pseudanabaenaceae (Leptolyngbya) x x x
Fam. Pseudanabaenaceae (Arthronema)
x
Fam. Pseudanabaenaceae (Pseudanabaena) x x x x
Ord. Synechococcales
Fam. Chamaesiphonaceae x
Fam. Synechococcaceae (Other) x
Fam. Synechococcaceae (Prochlorococcus) x
Fam. Synechococcaceae (Paulinella) x
Fam. Synechococcaceae (Synechococcus) x x x x
Other Cyanobacteria x x x x
Unassigned x x x x
As seen in Table 4.1., a total of 35 taxa of cyanobacteria and one taxa of
unassigned bacteria (which may or may not include cyanobacteria isolates) were
associated with detected OTU’s. Of which, 15 genera of cyanobacteria were identified.
Of those genera, 11 have been associated with the cyanotoxins microcystin, nodularin,
anatoxin, saxitoxin, BMAA and cylindrospermopsin (WHO, 1999; Jakubowska and
Szeląg-Wasielewska, 2015; Carmichael and Boyer, 2016; Buratti et al, 2017).
Table 4.2. Summary table of cyanobacteria genera associated with cyanotoxins
detected between June and November 2016.
Sample
Location
Affiliated Toxin Producing
Cyanobacteria Genera Associated Cyanotoxin
Fletchers
Lake
Anabaena
Microcystin, anatoxin, saxitoxin, cylindrospermopsin
Dolichospermum Microcystin, anatoxin, cylindrospermopsin
Nodularia Nodularin
Nostoc Microcystin
Microcystis Microcystin, anatoxin
Phormidium Possibly microcystin, anatoxin, saxitoxin
Leptolyngbya Possibly microcystin
Pseudanabaena Possibly microcystin
Synechococcus Microcystin
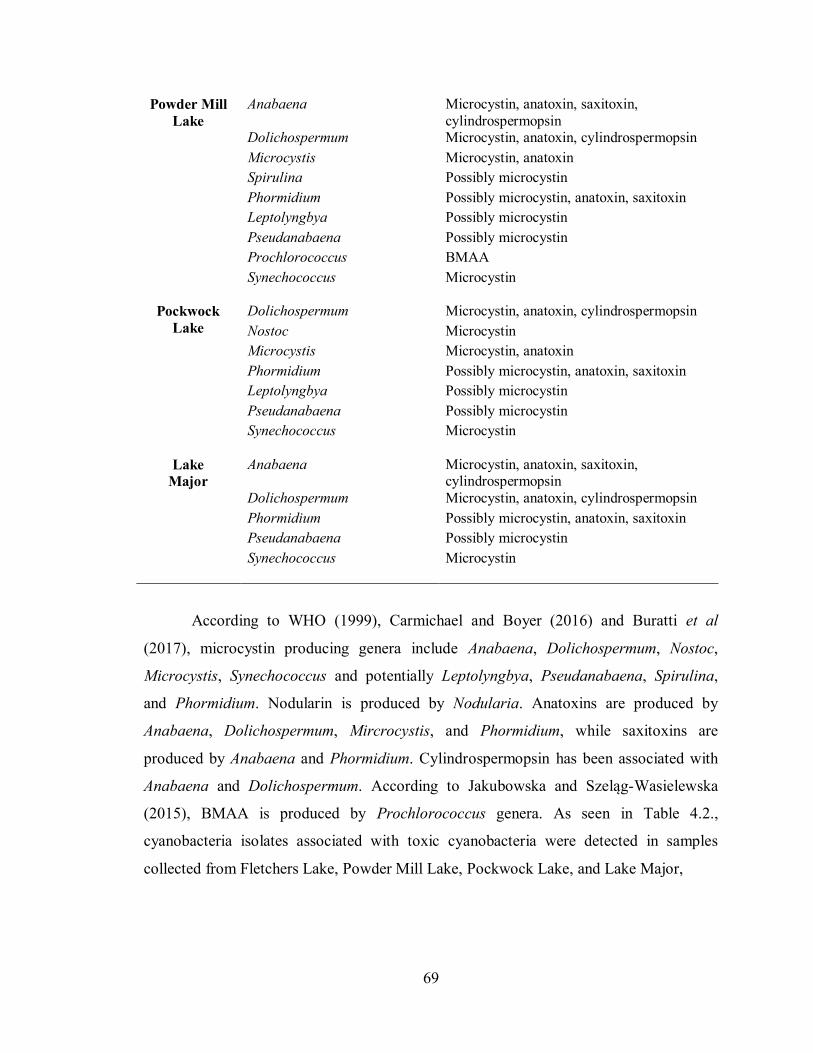
69
Powder Mill
Lake
Anabaena Microcystin, anatoxin, saxitoxin,
cylindrospermopsin Dolichospermum Microcystin, anatoxin, cylindrospermopsin
Microcystis Microcystin, anatoxin
Spirulina Possibly microcystin
Phormidium Possibly microcystin, anatoxin, saxitoxin
Leptolyngbya Possibly microcystin
Pseudanabaena Possibly microcystin
Prochlorococcus BMAA
Synechococcus
Microcystin
Pockwock
Lake
Dolichospermum Microcystin, anatoxin, cylindrospermopsin
Nostoc Microcystin
Microcystis Microcystin, anatoxin
Phormidium Possibly microcystin, anatoxin, saxitoxin
Leptolyngbya Possibly microcystin
Pseudanabaena Possibly microcystin
Synechococcus
Microcystin
Lake
Major
Anabaena Microcystin, anatoxin, saxitoxin, cylindrospermopsin
Dolichospermum Microcystin, anatoxin, cylindrospermopsin
Phormidium Possibly microcystin, anatoxin, saxitoxin
Pseudanabaena Possibly microcystin
Synechococcus Microcystin
According to WHO (1999), Carmichael and Boyer (2016) and Buratti et al
(2017), microcystin producing genera include Anabaena, Dolichospermum, Nostoc,
Microcystis, Synechococcus and potentially Leptolyngbya, Pseudanabaena, Spirulina,
and Phormidium. Nodularin is produced by Nodularia. Anatoxins are produced by
Anabaena, Dolichospermum, Mircrocystis, and Phormidium, while saxitoxins are
produced by Anabaena and Phormidium. Cylindrospermopsin has been associated with
Anabaena and Dolichospermum. According to Jakubowska and Szeląg-Wasielewska
(2015), BMAA is produced by Prochlorococcus genera. As seen in Table 4.2.,
cyanobacteria isolates associated with toxic cyanobacteria were detected in samples
collected from Fletchers Lake, Powder Mill Lake, Pockwock Lake, and Lake Major,
70
However, samples collected from Fletchers Lake showed that OTU’s associated
with toxin producing cyanobacteria each represented less than 2% of all OTU reads, each
month (except for Synechococcus, which represented 52% of reads in September (mean,
50%), and 38% of reads in October (mean, 35%)). Samples collected from Powder Mill
Lake showed that OTU’s affiliated with toxin producing cyanobacteria each represented
less than 1% of all OTU reads, each month (except for Pseudanabaena, which
represented 7.5% of reads in July (mean, 7.5%), and Synechococcus, which represented
between 52% and 55% of reads through July to November (mean, between 52% and
55%)). Pockwock Lake samples showed that OTU’s affiliated with toxin producing
cyanobacteria each represented less than 2% of all OTU reads, each month (except for
Synechococcus, which represented 4.4% of reads in July (mean, 4.4%), and 12% of reads
in September (mean, 12%), and Dolichospermum, which represented 14% of reads in
September (mean, 14%)). OTU’s associated with toxin producing cyanobacteria in Lake
Major samples each represented less than 3% of all OTU reads (except for
Pseudanabaena, which represented 13% of reads in July (mean, 11%)).
There were also toxic cyanobacteria detected in this study that have been detected
in lakes in Quebec and New England in previous years (Fortin et al, 2010; Zamyadi et al,
2012; Ministère du Développement durable, de l’Environnement, de la Faune et des
Parcs, 2014; University of New Hampshire, 2015; Pick, 2016). Anabaena, Phormidium,
Microcystis and Nostoc genera have been detected in New England, while Microcystis,
Anabaena, Dolichospemum and Pseudanabaena genera have been detected in Quebec.
4.1.2. PCR Amplification Failure
4.1.2.1. Low Cyanobacteria Concentration
Samples from Fletchers Lake had the highest PCR amplification success at 74%,
whereas only 58% of samples from Powder Mill Lake amplified successfully. Samples
from Pockwock Lake and Lake Major had low amplification success in comparison,
whereby only 31% of Pockwock Lake samples amplified and only 29% of Lake Major
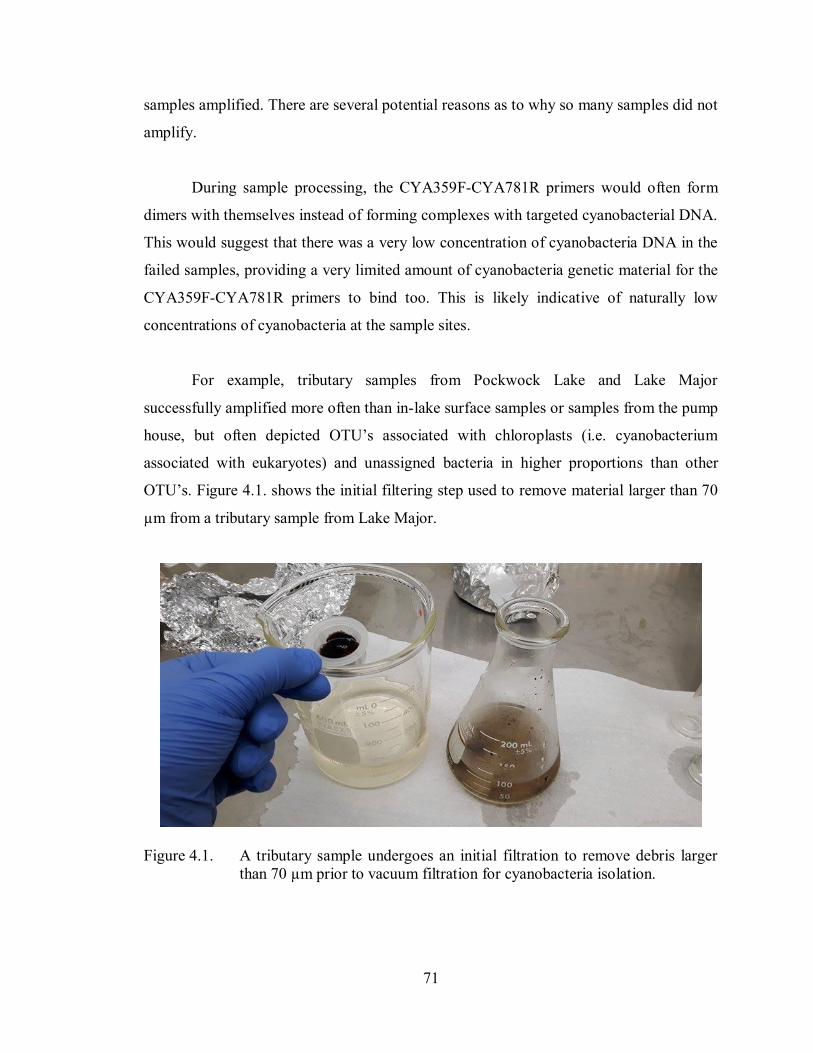
71
samples amplified. There are several potential reasons as to why so many samples did not
amplify.
During sample processing, the CYA359F-CYA781R primers would often form
dimers with themselves instead of forming complexes with targeted cyanobacterial DNA.
This would suggest that there was a very low concentration of cyanobacteria DNA in the
failed samples, providing a very limited amount of cyanobacteria genetic material for the
CYA359F-CYA781R primers to bind too. This is likely indicative of naturally low
concentrations of cyanobacteria at the sample sites.
For example, tributary samples from Pockwock Lake and Lake Major
successfully amplified more often than in-lake surface samples or samples from the pump
house, but often depicted OTU’s associated with chloroplasts (i.e. cyanobacterium
associated with eukaryotes) and unassigned bacteria in higher proportions than other
OTU’s. Figure 4.1. shows the initial filtering step used to remove material larger than 70
µm from a tributary sample from Lake Major.
Figure 4.1. A tributary sample undergoes an initial filtration to remove debris larger
than 70 µm prior to vacuum filtration for cyanobacteria isolation.
72
4.1.2.2. Naturally Occurring Inhibitors
During processing, it was also observed that the 16S rRNA universal bacterial
primers 515F-926R were being compromised as well. This would suggest the presence of
naturally occurring PCR inhibitors in the water, such as compounds from plants, dead
biomass, soil, sewage sludge, and/or waste water (Schrader et al, 2012; Rački et al, 2014;
Jones et al, 2015). Examples of these compounds include humic, fulminic, and tannic
acids, heavy metals, polyphenols, some polysaccharides and pectin.
4.1.3. Potential Seasonality Observed in Failed Sample Occurrence
It was observed that failed samples from Powder Mill Lake tended to occur late
August to mid-October. Similarly, failed samples from Pockwock Lake happened most
often between late August and early October, and were usually surface samples. This
could suggest potential seasonality to cyanobacteria presence in HRM whereby peak
season for surface bloom forming cyanobacteria may occur in the late spring early
summer, instead of late summer/early autumn as experienced in other areas of Canada
and internationally (Gladyshev et al, 2010; Gonçalves et al, 2011; Pan et al, 2013). This
may also suggest that if an algal bloom is observed in these later months in HRM, they
may be caused by other organisms, such as diatoms. Or perhaps, if a toxic cyanobacteria
“bloom” were to occur in late summer/early autumn, it may occur in the water column, as
not all toxic cyanobacteria create surface blooms (Pick, 2016).
Failed samples from Fletchers Lake typically came from specific sites in
September and October. This would suggest that those sites likely exhibit conditions that
may not be suitable for cyanobacteria. Failed samples from Lake Major included losses to
both the tributary set and the pump house water set.
73
4.2. WATER CHEMISTRY
4.2.1. Alkalinity and pH
With regards to treatment plant samples from Fletchers Lake, in-lake samples
from Powder Mill Lake and Pockwock Lake, and pump house samples from Lake Major,
overall, Powder Mill Lake samples exhibited the highest mean alkalinity concentration,
followed by Fletchers Lake, then Lake Major. Pockwock Lake samples had the lowest
mean concentration of alkalinity. This would indicate that Powder Mill Lake has a better
acid-neutralizing capacity than the other lakes in this study, while Pockwock Lake has the
least acid-neutralizing capacity (APHA et al, 2012).
As mentioned previously, most lakes in Nova Scotia under normal conditions
would not exhibit algal or cyanobacteria blooms, as Nova Scotian lakes are typically
acidic due to naturally occurring organic acids and bedrock geology (Jeffries et al, 2003b;
Ginn et al, 2015). Pockwock Lake and Lake Major are good examples. However,
Fletchers Lake and Powder Mill Lake are more neutral, which is concerning, as
freshwater cyanobacteria tend to prefer neutral to alkaline water sources with a pH
between 6 and 10 (Chandra and Rajashekhar, 2016). This difference may be the result of
activities from the Collin’s Park Water Treatment Plant, the Nova Scotia Fire Fighters
School, or the Rocky Lake gravel quarry. It could also be the result of run off from road
ways and residences near the lakes.
4.2.2. Total Organic Carbon and Dissolved Organic Carbon
Results for TOC and DOC were very similar, therefore, only the TOC
concentrations were reported. Once again, with regards to non-stream/non-tributary
samples, overall, Lake Major samples exhibited the highest mean TOC concentration,
followed by Fletchers Lake, then Powder Mill Lake. Pockwock Lake samples had the
lowest mean TOC concentration. As TOC is used as a measurement of natural organic
matter, it can be said that Lake Major has a higher concentration of organic matter than
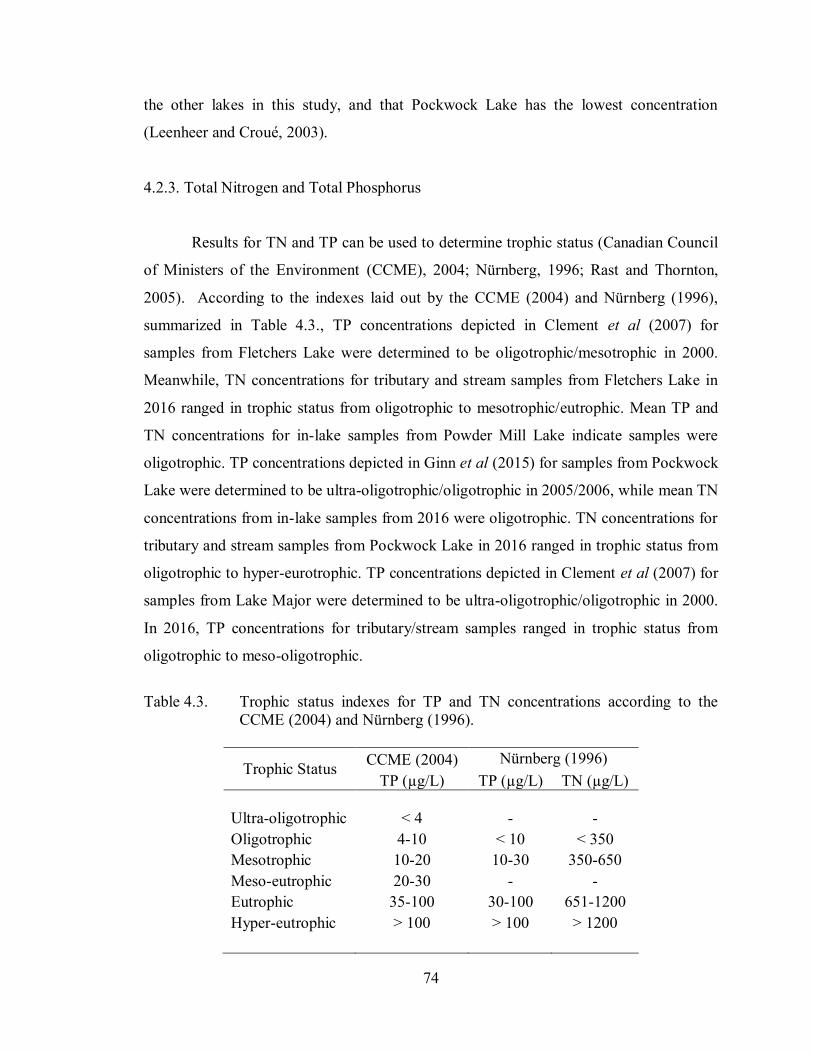
74
the other lakes in this study, and that Pockwock Lake has the lowest concentration
(Leenheer and Croué, 2003).
4.2.3. Total Nitrogen and Total Phosphorus
Results for TN and TP can be used to determine trophic status (Canadian Council
of Ministers of the Environment (CCME), 2004; Nürnberg, 1996; Rast and Thornton,
2005). According to the indexes laid out by the CCME (2004) and Nürnberg (1996),
summarized in Table 4.3., TP concentrations depicted in Clement et al (2007) for
samples from Fletchers Lake were determined to be oligotrophic/mesotrophic in 2000.
Meanwhile, TN concentrations for tributary and stream samples from Fletchers Lake in
2016 ranged in trophic status from oligotrophic to mesotrophic/eutrophic. Mean TP and
TN concentrations for in-lake samples from Powder Mill Lake indicate samples were
oligotrophic. TP concentrations depicted in Ginn et al (2015) for samples from Pockwock
Lake were determined to be ultra-oligotrophic/oligotrophic in 2005/2006, while mean TN
concentrations from in-lake samples from 2016 were oligotrophic. TN concentrations for
tributary and stream samples from Pockwock Lake in 2016 ranged in trophic status from
oligotrophic to hyper-eurotrophic. TP concentrations depicted in Clement et al (2007) for
samples from Lake Major were determined to be ultra-oligotrophic/oligotrophic in 2000.
In 2016, TP concentrations for tributary/stream samples ranged in trophic status from
oligotrophic to meso-oligotrophic.
Table 4.3. Trophic status indexes for TP and TN concentrations according to the
CCME (2004) and Nürnberg (1996).
Trophic Status CCME (2004) Nürnberg (1996)
TP (µg/L) TP (µg/L) TN (µg/L)
Ultra-oligotrophic < 4 - -
Oligotrophic 4-10 < 10 < 350
Mesotrophic 10-20 10-30 350-650
Meso-eutrophic 20-30 - -
Eutrophic 35-100 30-100 651-1200
Hyper-eutrophic > 100 > 100 > 1200
75
Picoplankton have an advantage in oligotrophic lakes when light conditions are
favorable and grazing impacts are low (Callieri and Stockner, 2000, 2002). They also
suggest that single celled picocyanobacteria prefer oligotophic to mesotrophic conditions,
while colony forming picocyanobacteria prefer mesotrophic to eutrophic conditions. As
seen in this study, Synechococcus, a single celled, toxin producing picocyanobacteria,
was associated with large proportions of OTU reads in samples from Fletchers Lake and
Powder Mill Lake. However, this was not the case for samples from Pockwock Lake and
Lake Major. In contrast, OTU’s associated with Prochlorococcus, another single celled,
toxin producing picocyanobacteria, were only detected in Powder Mill Lake samples, and
only in a very small proportion compared to other cyanobacteria.
4.2.4. UV254, Specific Ultraviolet Absorbance, Turbidity and Colour
UV254, unlike TOC and DOC, only roughly indicates overall NOM (Leenheer and
Croué, 2003). Like mean TOC concentration, pump house samples from Lake Major had
the highest mean UV254 reading. In-lake samples from Pockwock Lake had higher mean
UV254 readings than Powder Mill Lake. SUVA can be used to describe the presence and
aromaticity of DOC compounds (Leenheer and Croué, 2003). For example, high SUVA
values are indicative of high concentrations of hydrophobic, aromatic NOM, like humic
substances (Hansen et al, 2016). As mentioned previously, humic substances are naturally
occurring PCR inhibitors (Schrader et al, 2012; Rački et al, 2014; Jones et al, 2015).
Therefore, one would expect that the failed samples mentioned earlier would be more
likely to occur in lakes with high SUVA values, and during times when SUVA is high.
However, this was not always the case. Although samples from the pump house at Lake
Major did fail, and had higher mean SUVA values than the other lakes in this study,
samples from the Collin’s Park Treatment Plant at Fletchers Lake had the second highest
mean SUVA values, and did not fail throughout the season. In-lake samples from
Pockwock Lake had higher mean SUVA values than in-lake samples from Powder Mill
Lake, and had a lower amplification success rate than samples from Powder Mill Lake.
Also interesting to note, is that failed samples from Powder Mill Lake and Pockwock
76
Lake more often occurred during August through to October, when mean SUVA was
lower than in other months.
Turbidity measures the intensity of suspended and colloidal matter (APHA,
2012). Samples collected from the Collin’s Park Treatment Plant had the highest mean
turbidity readings, followed by in-lake samples from Powder Mill Lake, and in-lake
samples from Pockwock Lake. Samples from the pump house at Lake Major had the
lowest mean turbidity readings. Therefore, it can be said that samples from Fletchers
Lake had a higher intensity of scattered light than other lakes in this study. Meanwhile,
Lake Major had a lower intensity of scattered light than the other lakes. When turbidity is
removed, the true colour of samples can be ascertained (APHA, 2012). Lake Major had
the highest mean colour value, followed by Pockwock Lake, and Fletchers Lake. Powder
Mill Lake had the lowest mean colour of the lakes in this study. Theoretically,
photoautotrophs, like cyanobacteria, may be hindered by altered wavelengths through the
water column. Alternatively, because of the phycobiliproteins that cyanobacteria possess,
they may have an advantage over other photosynthetic organisms in aquatic
environments with intense light scattering. With this in mind, it could be possible that
suspended and colloidal matter could contain or be made of cyanobacteria.
4.2.5. Data Range for Tributary and Stream Samples
With regards to tributary and stream samples, Pockwock Lake tributaries usually
had wider ranges of water quality values than Fletchers Lake and Lake Major, while Lake
Major tributary samples typically had the smallest range of values. Exceptions being with
pH, where Fletchers Lake tributaries exhibited the widest range of values, and with
SUVA, where Pockwock Lake tributaries and Fletchers Lake tributaries had similar
SUVA ranges.
77
4.3. ENVIRONMENT DATA
Environmental conditions that are preferential to cyanobacteria include intense
rainfall events followed by calm weather with warm water temperature, decreased mixing
and turbulence, minimal grazing by zooplankton, and low mean irradiance (Whitton and
Potts, 2000). This pairing of rainfall events with drought/drought like conditions affects
nutrient loads into lakes, and prolongs stratification (Paerl et al, 2016).
This was seen in 2016 as severe drought conditions were declared in Nova Scotia
that year (Ward, 2016). This particularly unusual event marked the driest summer since
the late 1800’s. As this drought occurred, an algal bloom at Powder Mill Lake was
reported on July 8 (PNS, 2016c). Prior to this event, precipitation events between June 6
and 8 were followed by almost four weeks of dry weather, and increased temperatures.
However, wind was inconsistent, cycling almost equally above and below the 10.8 km/h
threshold for bloom dispersal (Whitton and Potts, 2000).
In early September, it was noted that there was increased vegetation/algae growth
along the shoreline of Fletchers Lake. Despite there not being an official bloom,
microcystin, specifically microcystin-LR (MC-LR), was detected in July, 2016 (Brohpy,
2017). According to Brophy (2017), MC-LR concentrations increased above the
maximum allowable concentration (MAC) of 1.5 µg/L set by Health Canada for MC-LR
in drinking water, from July to September, then decreased below detection limit after
September/October (Health Canada, 2017). However, MC-LR concentrations remained
below 20 µg/L, the MAC set by Health Canada for total microcystin concentration
allowed in recreational water supplies, throughout 2016 (Health Canada, 2012). Prior to
this event, August had one major rain event, with the remainder of the month being quite
dry and warm. Similarly, the beginning of September was quite dry and warm, as well.
Wind seemed slightly more likely to be around or under the 10 km/h threshold for bloom
dispersal leading up to early September.
78
CHAPTER 5 CONCLUSIONS
In general, information regarding cyanobacteria, cyanotoxins and algal blooms is
limited in Atlantic Canada. This is problematic in the face of climate change and human
activities. The objective of this study was to provide a baseline for future research into
cyanobacteria population ecology which will enable future best practices for lake
management in Nova Scotia.
Results of this study have shown the presence of at least 35 taxa of cyanobacteria
and one taxa of unassigned bacteria, of which, 15 genera of cyanobacteria were
identified. Of those genera, 11 have been associated with cyanotoxins. However, OTU’s
affiliated with toxin producing cyanobacteria typically represented 1-3% of all OTU’s
detected each month (with some exceptions).
Results have also shown that samples which failed PCR amplification may have
been the result of naturally low cyanobacteria DNA concentrations and/or presence of
naturally occurring inhibitors, and may have exhibited seasonality, as PCR amplification
failure typically happened to samples collected between August and September, from in-
lake sample sites. Also, samples collected from Fletchers Lake and Powder Mill Lake
had a higher success rate for PCR amplification than samples collected from Pockwock
Lake and Lake Major.
Supplementary water quality and environmental data showed that Fletchers Lake
and Powder Mill Lake, both unprotected water bodies, had higher pH, alkalinity, TN, TP
and turbidity averages than Pockwock Lake and Lake Major. It was also determined that
there were periods of rain followed by long periods of warm, dry, relatively calm weather
prior to microcystin detection at Fletchers Lake, and prior to the algal bloom detection at
Powder Mill Lake.
Ultimately, cyanobacteria remain unpredictable and more experiments will need
to be made to better understand these organisms. This thesis will hopefully provide the
79
baseline necessary for which those experiments can be built for the benefit of Nova
Scotia as it develops best practices for lake and cyanotoxin management.
For future research, there are many avenues down which experiments can be
made concerning cyanobacteria. Most notably, now that there is an idea of which
cyanobacteria are present in lakes in HRM, laboratory cultures can be made to identify
cyanobacteria to the species level. From there, the following experiments could be run:
1) A partnership with another laboratory would allow researchers to delve into
bioinformatics and gene expression for toxin production, which would be more useful as
not all toxic cyanobacteria create blooms (Pick, 2016).
2) The determination of cyanobacteria population ecology within the water column and
throughout lakes and tributaries might be used to identify areas of potential risk (i.e. areas
or ecological niches where toxic cyanobacteria taxa may be more likely appear). It would
also be beneficial to compare cyanobacteria population and water chemistry data between
pre- and post-treatment plant samples, and distribution system samples
3) Correlations between water chemistry and cyanobacteria presence could be made. For
example, further research with TOC and DOC could be used to determine sources of
dissolved organic matter (DOM) that would affect aquatic food webs, especially with
regards to cyanobacteria and the grazers that consume them (Hansen et al, 2016). Paired
with colour, turbidity, UV254, and SUVA data, research would provide insight into the
impact of DOM on light scattering throughout the water column on organisms that
photosynthesize.
4) Correlations between metals and cyanobacteria presence could also be made. For
example, Sorichetti et al (2014) suggests that there may be a correlation between iron
(Fe) availability, cyanobacteria growth, and competition for Fe that may be more
influential than TN and TP concentration.

80
5) Further studies into using geosmin and MIB to monitor cyanobacteria occurrence, and
utilize flow cytometry or FEEM to monitor phycocyanin and phycoerythrin to monitor
cyanobacteria as well.
6) Conduct further studies into other organisms that can cause harmful algal blooms.
81
REFERENCES
Abed, R., Barry, M., Kindi, S., and Golubic, S. (2013). Structure and cyanobacterial
species composition of microbial mats in an Arabian Desert stream. African Journal of
Microbiology Research, 7(15): 1434-1442.
Allen, C. (2016, July 05). Algae bloom continues in Yarmouth County and beyond. The
Digby Courier. Retrieved from: http://www.digbycourier.ca/news/regional/algae-bloom-
continues-in-yarmouth-county-and-beyond-37688/
Anderson, L., Krkošek, W., Stoddart, A., Trueman, B., and Gagnon, G. (2017). Lake
recovery through reduced sulfate deposition: A new paradigm for drinking water
treatment. Environmental Science and Technology, 51 (3), 1414−1422.
American Public Health Association, American Water Works Association, and Water
Environment Federation (2012). Standard Methods for the Examination of Water and
Wastewater. Washington, DC: APHA.
Barber, S. (2016, Jun 13). Lake Erie’s toxic algae bloom forecast for summer 2016.
EcoWatch. Retrieved from: http://www.ecowatch.com/lake-eries-toxic-algae-bloom-
forecast-for-summer-2016-1891172391.html
Brophy, M. (2017). Understanding water quality and the presence of mycrocystin-LR in a
small drinking water supply. Halifax, NS; Dalhousie University.
Brylinsky, M. (2011). Water quality survey of ten lakes located in the Carleton River
watershed area of Digby and Yarmouth Counties, Nova Scotia. Nova Scotia Department
of the Environment. Retrieved from:
https://www.novascotia.ca/nse/surface.water/docs/Yarmouth.Area.Lakes.Water.Quality.
Assessment.pdf
Buratti, F., Manganelli, M., Vichi, S., Stefanelli, M., Scardala, S., Testai, E., and Funari,
E. (2017). Cyanotoxins: producing organisms, occurrence, toxicity, mechanism of action
and human health toxicological risk evaluation. Archives of Toxicology, 91(3): 1049-
1130.
Callieri, C. and Stockner, J. (2000). Picocyanobacteria success in oligotrophic lakes: fact
of fiction? Journal of Limnology, 59(1): 72-76.
Callieri, C. and Stockner, J. (2002). Freshwater autotrophic picoplankton: a review.
Journal of Limnology, 61(1): 1-14.
Campbell, F. (2016, Sep 10). No answers for toxic blue-green algae bloom on Mattatall
Lake. Local Xpress. Retrieved from: https://www.localxpress.ca/local-news/no-answers-
for-toxic-blue-green-algae-bloom-on-lake-mattatall-410559
82
Canadian Council of Ministers of the Environment (2004). Canadian water quality
guidelines for the protection of aquatic life: Phosphorus: Canadian Guidance Framework
for the Management of Freshwater Systems. In: Canadian environmental quality
guidelines. Winnipeg, MB: Canadian Council of Ministers of the Environment.
Carmichael, W. and Boyer, G. (2016). Health impacts from cyanobacteria harmful algae
blooms: Implications for the North American Great Lakes. Harmful Algae, 54: 194-212.
CBC News (2012, Apr 02). Mink farms likely polluted lakes, study finds. CBC News.
Retrieved from: http://www.cbc.ca/news/canada/nova-scotia/mink-farms-likely-polluted-
lakes-study-finds-1.1238053
Chandra, S. and Rajashekhar, M. (2016). Effect of pH on freshwater cyanobacteria
isolated from different habitats of southern Karnataka. International Journal of Life
Sciences and Technology, 9(7): 56-64.
Clement, P., Keizer, P., Gordon, D., Clair, T., and Hall, G. (2007). Synoptic water quality
survey of selected Halifax Regional Municipality Lakes on 28–29 March 2000. Canadian
Technical Report of Fisheries and Aquatic Science. 2726. Dartmouth, NS; Bedford
Institute of Oceanography.
Comeau, A., Douglas, G., and Langille, A. (2017). Microbiome helper: A custom and
streamlined workflow for microbiome research. American Society for Microbiology, 2(1):
1-11.
Fortin, N., Aranda-Rodriguez, R., Jing, H., Pick, F., Bird, D., and Greer, W. (2010).
Detection of microcystin-producing cyanobacteria in Missisquoi Bay, Quebec, Canada,
using quantitative PCR. Applied and Environmental Microbiology, 76(15): 5105-5112.
Ginn, B., Rajaratnam, T., Cumming, B., and Smol, J. (2015). Establishing realistic
management objectives for urban lakes using paleolimnological techniques: an example
from Halifax Region (Nova Scotia, Canada). Lake and Reservoir Management, 31(2): 92-
108.
Gladyshev, M., Sushchik, N., Makhutova, O., Dubovskaya, O., Kravchuk, E., Kalachova,
G., and Khromechek, E. (2010). Correlations between fatty acid composition of seston
and zooplankton and effects of environmental parameters in a eutrophic Siberian
reservoir. Limnologica, 40: 343-357.
Gonçalves, R., Villafañe, V., Medina, C., Barbieri, E., and Helbling, W. (2011). Plankton
dynamics and photosynthesis in a eutrophic lake in Patagonia (Argentina): influence of
grazer abundance and UVR. Latin American Journal of Aquatic Research, 39(1): 117-
130.
83
Government of Canada (2016a). Fletchers Lake (formerly Lake Fletchers). Retrieved
from: http://www4.rncan.gc.ca/search-place-
names/unique/fadd4af0af5f11d892e2080020a0f4c9
Government of Canada (2016b). Hourly data reports for Bedford Range, Nova Scotia.
Retrieved from:
http://climate.weather.gc.ca/climate_data/hourly_data_e.html?hlyRange=2004-09-
24%7C2016-12-
04&dlyRange=%7C&mlyRange=%7C&StationID=43123&Prov=NS&urlExtension=_e.
html&searchType=stnProx&optLimit=specDate&Month=12&Day=4&StartYear=1840&
EndYear=2016&Year=2016&selRowPerPage=25&Line=0&txtRadius=25&optProxType
=navLink&txtLatDecDeg=44.881111111111&txtLongDecDeg=63.508611111111&time
frame=1
Government of Canada (2016c). Powder Mill Lake (formerly Fish Lake). Retrieved from:
http://www4.rncan.gc.ca/search-place-
names/unique/96ea4042afe711d892e2080020a0f4c9
Gutiérrez-Salmeán, G., Fabila-Castillo, L., and Chamorro-Cevallos, G. (2015).
Nutritional and toxicological aspects of Spirulina (Arthrospira). Nutrición Hospitalaria,
32(1): 34-40.
Halifax Regional Municipality (2017a). Collin’s Park Public Water Supply Area.
Retrieved from: https://www.halifax.ca/sites/default/files/documents/home-
property/water/CollinsParkMap.pdf
Halifax Regional Municipality (2017b). Lake Major Watershed Area. Retrieved from:
https://www.halifax.ca/sites/default/files/documents/home-
property/water/LakeMajorMap.pdf
Halifax Regional Municipality (2017c). Pockwock Lake and Tomahawk Lake Watershed
Area. Retrieved from: https://www.halifax.ca/sites/default/files/documents/home-
property/water/PockwockTomahawkMap.pdf
Halifax Regional Municipality (2017d). Source Water Protection. Retrieved from:
https://www.halifax.ca/home-property/halifax-water/water-services/source-water-
protection
Halifax Water (2017a). Water Supply and Treatment. Retrieved from:
http://www.halifax.ca/HalifaxWater/WaterQuality/treatment.php
Halifax Water (2016). Halifax Water Watersheds. Retrieved from:
http://www.halifax.ca/halifaxwater/sourcewater/watersheds.php
Halifax Water (2010). Halifax Water Best Management Practices for Halifax Water and
Crown Managed Lands. Halifax, NS: Halifax Water.
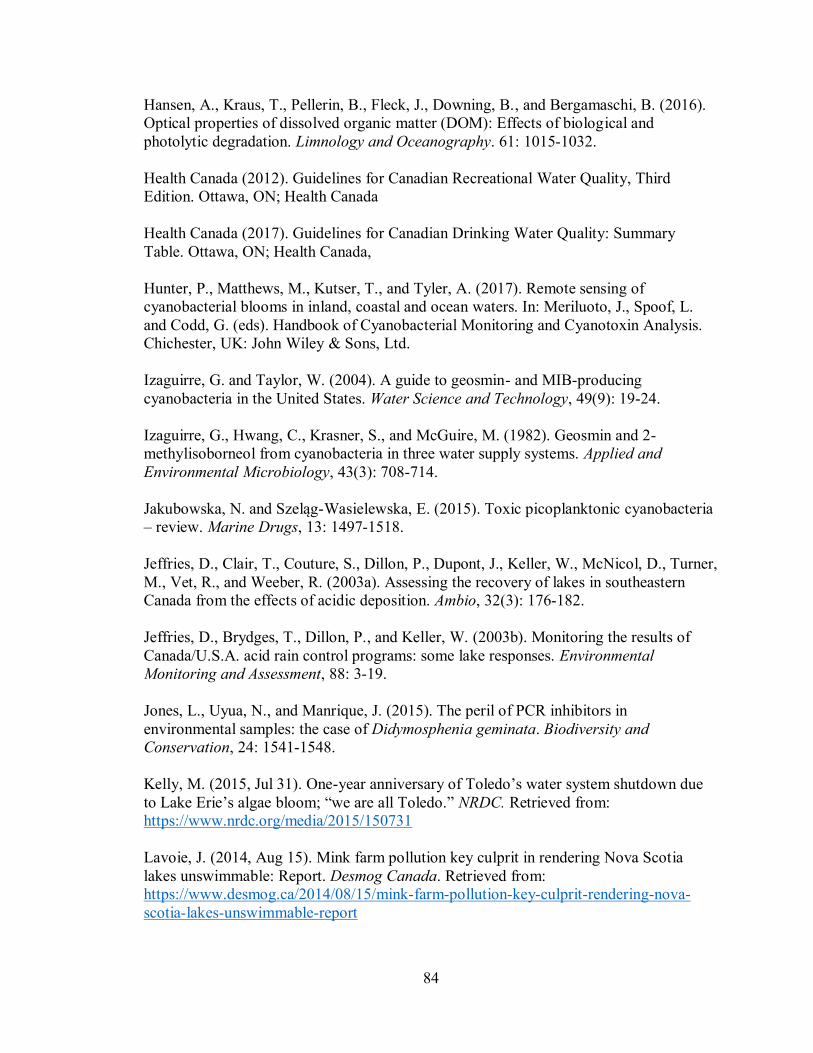
84
Hansen, A., Kraus, T., Pellerin, B., Fleck, J., Downing, B., and Bergamaschi, B. (2016).
Optical properties of dissolved organic matter (DOM): Effects of biological and
photolytic degradation. Limnology and Oceanography. 61: 1015-1032.
Health Canada (2012). Guidelines for Canadian Recreational Water Quality, Third
Edition. Ottawa, ON; Health Canada
Health Canada (2017). Guidelines for Canadian Drinking Water Quality: Summary
Table. Ottawa, ON; Health Canada,
Hunter, P., Matthews, M., Kutser, T., and Tyler, A. (2017). Remote sensing of
cyanobacterial blooms in inland, coastal and ocean waters. In: Meriluoto, J., Spoof, L.
and Codd, G. (eds). Handbook of Cyanobacterial Monitoring and Cyanotoxin Analysis.
Chichester, UK: John Wiley & Sons, Ltd.
Izaguirre, G. and Taylor, W. (2004). A guide to geosmin- and MIB-producing
cyanobacteria in the United States. Water Science and Technology, 49(9): 19-24.
Izaguirre, G., Hwang, C., Krasner, S., and McGuire, M. (1982). Geosmin and 2-
methylisoborneol from cyanobacteria in three water supply systems. Applied and
Environmental Microbiology, 43(3): 708-714.
Jakubowska, N. and Szeląg-Wasielewska, E. (2015). Toxic picoplanktonic cyanobacteria
– review. Marine Drugs, 13: 1497-1518.
Jeffries, D., Clair, T., Couture, S., Dillon, P., Dupont, J., Keller, W., McNicol, D., Turner,
M., Vet, R., and Weeber, R. (2003a). Assessing the recovery of lakes in southeastern
Canada from the effects of acidic deposition. Ambio, 32(3): 176-182.
Jeffries, D., Brydges, T., Dillon, P., and Keller, W. (2003b). Monitoring the results of
Canada/U.S.A. acid rain control programs: some lake responses. Environmental
Monitoring and Assessment, 88: 3-19.
Jones, L., Uyua, N., and Manrique, J. (2015). The peril of PCR inhibitors in
environmental samples: the case of Didymosphenia geminata. Biodiversity and
Conservation, 24: 1541-1548.
Kelly, M. (2015, Jul 31). One-year anniversary of Toledo’s water system shutdown due
to Lake Erie’s algae bloom; “we are all Toledo.” NRDC. Retrieved from:
https://www.nrdc.org/media/2015/150731
Lavoie, J. (2014, Aug 15). Mink farm pollution key culprit in rendering Nova Scotia
lakes unswimmable: Report. Desmog Canada. Retrieved from:
https://www.desmog.ca/2014/08/15/mink-farm-pollution-key-culprit-rendering-nova-
scotia-lakes-unswimmable-report
85
Lee, J., Rai, P., Jeon, Y., Kim, K., and Kwon, E. (2017). The role of algae and
cyanobacteria in the production and release of odorants in water. Environmental
Pollution, 227: 252-262.
Leenheer, J. and Croué, J. (2003). Characterizing dissolved aquatic organic matter.
Environmental Science and Technology, 18-26.
Lin, W., Zhao, D., and Luo, J. (2017). Distribution of alkaline phosphatase genes in
cyanobacteria and the role of alkaline phosphatase on the acquisition of phosphorus from
dissolved organic phosphorous for cyanobacterial growth. Journal of Applied Phycology,
DOI: 10.1007/s10811-017-1267-3.
Lochaber Community Development Association (2012). Blue-green algae alert for
Lochaber Lake. Retrieved from: https://www.lochaber.ca/blue-green-algae-alert-for-
lochaber-lake/
Maier, R.M., Pepper, I.L., and Gerba, C.P. (2000). Environmental Microbiology. San
Diego, CA; Academic Press.
Mathieson, D. (2015, Jun 18). Neurotoxin producing algae found in Mattatall Lake.
Amherst News. Retrieved from:
http://www.cumberlandnewsnow.com/news/local/neurotoxin-producing-algae-found-in-
mattatall-lake-31266/
Meloney, N. (2017, Oct 09). Ecosystem revival set back by unexpected algae bloom in
Dartmouth lake. CBC News. Retrieved from: http://www.cbc.ca/news/canada/nova-
scotia/plankton-oathill-lake-dartmouth-bob-rutherford-algae-1.4346536
Ministère du Développement durable, de l’Environnement, de la Faune et des Parcs
(2014). Bilan de la gestion des épisodes de fleurs d’eau d’algues bleu-vert, de 2007 à
2012. Quebéc City, QC; Gouvernement du Québec.
MO BIO Laboratories (2016a). DNeasy Power Water Kit. Retrieved from:
https://mobio.com/products/dna-isolation/water/powerwaterr-dna-isolation-kit.html
MO BIO Laboratories (2016b). DNeasy Power Water Sterivex Kit. Retrieved from:
https://mobio.com/products/dna-isolation/water/powerwaterr-sterivextm-dna-isolation-
kit.html
Moreira, C., Ramos, V., Azevedo, J., and Vasconcelos, V. (2014). Methods to detect
cyanobacteria and their toxins in the environment. Applied Microbiology and
Technology, 98(19): 8073-8082.
Nübel, U., Garcia-Pichel, F., and Muyzer, G. (1997). PCR Primers to amplify 16S rRNA
genes from cyanobacteria. Applied and Environmental Microbiology, 63(8): 3327-3332.
86
Nürnberg, G. (1996). Trophic state of clear and colored, soft- and hardwater lakes with
special consideration of nutrients, anoxia, phytoplankton and fish. Lake Reservoir
Management. 12(4): 432–447.
Omega Bio-tek, Inc. (2014). E.Z.N.A. Water DNA Kit Product Manual. Norcross, GA:
Omega.
Paerl, H., Gardner, W., Havens, K., Joyner, A., McCarthy, M., Newell, S., Qin, B., and
Scott, J. (2016). Mitigating cyanobacterial harmful algal blooms in aquatic ecosystems
impacted by climate change and anthropogenic nutrients. Harmful Algae, 54: 213-222.
Paerl, H., Xu, H., Hall, N., Rossignol, K., Joyner, A., Zhu, G., and Qin, B. (2015)
Nutrient limitation dynamics examined on a multi-annual scale in Lake Taihu, China:
Implications for controlling eutrophication and harmful algal blooms. Journal of
Freshwater Ecology, 30(1): 5-24.
Pan, J., Bournod, C., Cuadrado, D., Vitale, A., and Piccolo, M. (2013). Interaction
between estuarine microphytobenthos and physical forcings: the role of atmospheric and
sedimentary factors. International Journal of Geosciences, 4: 352-361.
Percival, S. and Williams, D. (2014). Cyanobacteria. In: Percival, S., Yates, M.,
Williams, D., Chalmers, R. and Gray, N. Microbiology of Waterborne Diseases,
Microbiological Aspects and Risks. London, UK: Elsevier Ltd.
Pick, F. (2016). Blooming algae: a Canadian perspective on the rise of toxic
cyanobacteria. Canadian Journal of Fisheries and Aquatic Sciences, 73(7): 1149-1158.
Province of Nova Scotia (2017a). Geoscience and Mines Branch, Geoscience Atlas
Interactive Map. Retrieved from:
https://fletcher.novascotia.ca/DNRViewer/?viewer=Geoscience
Province of Nova Scotia (2017b). Geoscience and Mines Branch, Mineral Resource Land
Use Atlas Interactive Map. Retrieved from:
https://fletcher.novascotia.ca/DNRViewer/?viewer=MRLU
Province of Nova Scotia (2017c). Halifax Regional Water Commission Act, Chapter 55
of the Acts of 2007, amended 2012, c. 60; 2016, c. 23, An Act Respecting the Halifax
Regional Water Commission. Retrieved from the Nova Scotia Legislature website:
https://nslegislature.ca/sites/default/files/legc/statutes/halifax%20regional%20water%20c
ommission.pdf
Province of Nova Scotia (2017d). Significant Species and Habitats Database, Provincial
Landscape Viewer. Retrieved from: https://nsgi.novascotia.ca/plv/
87
Province of Nova Scotia (2016a). Angler’s Handbook and 2016 Summary of
Regulations. Retrieved from:
https://novascotia.ca/fish/documents/Anglers_Handbook_2016.pdf
Province of Nova Scotia (2016b). Blue green algae bloom in Lake Torment. Retrieved
from: https://novascotia.ca/news/release/?id=20160624010
Province of Nova Scotia (2016c). Blue green algae bloom in Powder Mill Lake.
Retrieved from: https://novascotia.ca/news/release/?id=20160708002
Province of Nova Scotia (2016d). Blue-green algae in Kings County. Retrieved from:
https://novascotia.ca/news/release/?id=20160923005
Province of Nova Scotia (2016e). Blue green algae in Pictou County. Retrieved from:
https://novascotia.ca/news/release/?id=20160817010
Province of Nova Scotia (2016f). Blue green algae in Yarmouth County. Retrieved from:
https://novascotia.ca/news/release/?id=20160818007
Province of Nova Scotia (2016g). Nova Scotia Lake Survey Program Interactive Map.
Retrieved from:
http://nse.maps.arcgis.com/apps/webappviewer/index.html?id=7ded7a30bef44f848e8a4fc
8672c89bd
Province of Nova Scotia (2016h). Pockwock Wilderness Area. Retrieved from:
https://novascotia.ca/nse/protectedareas/wa_pockwock.asp
Province of Nova Scotia (2015). Blue green algae bloom in Lake Torment. Retrieved
from: https://novascotia.ca/news/release/?id=20150814003
Province of Nova Scotia (2014). Blue green algae bloom in Lake Torment. Retrieved
from: https://novascotia.ca/news/release/?id=20140627010
Province of Nova Scotia (2013a). Environment Act, Chapter 1 of the Acts of 1994-1995
amended 1998, c. 18, s. 557; 1999 (2nd Sess.), c. 12, s. 76; 2001, c. 6, s. 103; 2004, c. 3,
ss. 20, 21; 2006, c. 2, s. 3; 2006, c. 30; 2011, c. 61, An Act to Reform the Environmental
Laws of the Province and to Encourage and Promote the Protection, Enhancement and
Prudent Use of the Environment. Retrieved from the Nova Scotia Legislature website:
https://nslegislature.ca/sites/default/files/legc/statutes/environment.pdf
Province of Nova Scotia (2013b). Lumsden Pond Beach Re-Opened. Retrieved from:
https://novascotia.ca/news/release/?id=20130816010
Province of Nova Scotia (2010). Suspected algae bloom spotted in Lake Ainslie.
Retrieved from: https://novascotia.ca/news/release/?id=20100901004
88
Province of Nova Scotia (2009a). Algae bloom reported in Margaree Rivers. Retrieved
from: https://novascotia.ca/news/release/?id=20090923009
Province of Nova Scotia (2009b). Lake Ainslie algae test results. Retrieved from:
https://novascotia.ca/news/release/?id=20090925012
Province of Nova Scotia (2007). Algae bloom in three Nova Scotia Lakes. Retrieved
from: https://novascotia.ca/news/release/?id=20070718004
Province of Nova Scotia (2002). Protection of Property Act, Chapter 363 of the revised
statutes, 1989, amended 2001, c. 12, s. 47. Retrieved from the Nova Scotia Legislature
website: https://nslegislature.ca/sites/default/files/legc/statutes/protect.htm
Rački, N., Dreo, T., Gutierrez-Aguirre, I., Blejec, A., and Ravnikar, M. (2014). Reverse
transcriptase droplet digital PCR shows high resilience to PCR inhibitors from plant, soil
and water samples. Plant Methods, 10(1): 1-10.
Raposo, M., Costa de Morais, R., and Bernardo de Morais, A. (2013). Health applications
of bioactive compounds from marine microalgae. Life Sciences, 93: 479-486.
Rast, W. and Thornton, J. (2005). The phosphorus loading concept and the OECD
eutrophication programme: Origin, application, and capabilities. In: O’Sullivan, P. and
Reynolds, C. (eds). The lakes handbook: Lake restoration and rehabilitation. Malden,
MA: Blackwell Publishing.
Rastogi, R., Sonani, R., and Madamwar, D. (2015). Effects of PAR and UV radiation on
the structure and functional integrity of phycocyanin, phycoerythrin, and allophycocyanin
isolated from the marine cyanobacterium Lyngbya sp. A09DM. Photochemistry and
Photobiology, 91(4): 837-844.
Ringelberg, J. (2010). Diel vertical migration of zooplankton in lakes and oceans causal
explanations and adaptive significances. London: Springer.
Sainmont, J., Thygesen, U., and Visser, A. (2012). Diel vertical migration arising in a
habitat selection game. Theoretical Ecology, 6(2): 241-251.
Scott, R. (2004). Pockwock Lake water quality assessment: Effects of forest harvesting
activity on surface water quality, final report. Halifax, NS: CWRS.
Schindler, D., Carpenter, S., Chapra, S., Hecky, R., and Orihel, D. (2016). Reducing
phosphorous to curb lake eutrophication is a success. Environmental Science and
Technology, 50(17): 8923-8929.
Schrader, C., Schielke, A., Ellerbroek, L., and Johne, R. (2012). PCR inhibitors –
Occurrence, properties and removal. Journal of Applied Microbiology, 113: 1014-1026.
89
Soil and Water Conservation Society of Metro Halifax (2017). Narrative on lakes/rivers
within the Halifax municipality. Retrieved from:
http://lakes.chebucto.org/WATERSHEDS/narrative.html#shubenacadieriver
Sorichetti, R., Creed, I., and Trick, C. (2014). Evidence for iron-regulated cyanobacterial
predominance in oligotrophic lakes. Freshwater Biology. 59: 679-691.
Stoddard, J., Jeffries, D., Lükewille, A., Clair, T., Dillon, P., Driscoll, C., Forsius, M.,
Johannessen, M., Kahl, J., Kellogg, J., Kemp. A, Mannio, J., Monteith, D., Murdoch, P.,
Patrick, S., Rebsdorf, A., Skjelkvåle, B., Stainton, M., Traaen, T., van Dam, H., Webster,
K., Wieting, J., and Wilander, A. (1999). Regional trends in aquatic recovery from
acidification in North America and Europe. Nature, 401: 575-578.
Sullivan, H. (2017, Nov 09). Mattatall Lake appears clear of green toxic algae blooms.
Truro Daily News. Retrieved from: http://www.trurodaily.com/news/mattatall-lake-
appears-clear-of-green-toxic-algae-blooms-160654/
Suurnäkki, S., Gomez-Saez, G., Rantala-Ylinen, A., Jokela, J., Fewer, D., and Sivonen,
K. (2015). Identification of geosmin and 2-methylisoborneol in cyanobacteria and
molecular detection methods for the producers of these compounds. Water Research, 68:
56-66.
Taylor, D. (2009). A water quality survey of nine lakes in the Carleton River watershed
area, Yarmouth County, Nova Scotia. Water and Wastewater Branch, Nova Scotia
Environment. Retrieved from:
https://novascotia.ca/nse/surface.water/docs/Yarmouth.Area.Lakes.Report.with.Appendic
es.pdf
Tetanish, R. (2016, Feb 09). Growth of blue-green algae across Nova Scotia a concern:
Dal AC prof. Annapolis County Spectator. Retrieved from:
http://www.annapoliscountyspectator.ca/news/local/growth-of-blue-green-algae-across-
nova-scotia-a-concern-dal-ac-prof-165/
The Weather Network (2017). Historical weather: Bedford, NS. Retrieved from:
https://www.theweathernetwork.com/ca/weather/historical-weather/nova-scotia/bedford
University of New Hampshire (2015). Toxic cyanobacteria of New England, “The Dirty
Dozen.” Center for Freshwater Biology. Retrieved from:
http://cfb.unh.edu/CyanoKey/indexCyanoQuickGuide.html
Verhamme, E., Redder, T., Schlea, D., Grush, J., Bratton, J., and DePinto, J. (2016).
Development of the Western Lake Erie Ecosystem Model (WLEEM): Application to
connect phosphorus loads to cyanobacteria biomass. Journal of Great Lakes Research,
42(6): 1193-1205.
90
Walker, T., Crittenden, P., and Young, S. (2003). Regional variation in the chemical
composition of winter snow pack and terricolous lichens in relation to sources of acid
emissions in the Usa river basin, northeast European Russia. Environmental Pollution,
125(3): 401-412
Walters, W., Hyde, E., Berg-Lyons, D., Ackermann, G., Humphrey, G., Parada, A.,
Gilbert, J., Jansson, J., Caporaso, J., Fuhrman, J., Apprill, A., and Knight, R. (2015).
Improved bacterial 16S rRNA Gene (V4 and V4-V5) and fungal internal transcribed
spacer marker gene primers for microbial community surveys. American Society for
Microbiology, 1(1): 1-10.
Ward, R. (2016, Sep 18). Nova Scotia drought unusual, catches people unprepared. CBC
News. Retrieved from: http://www.cbc.ca/news/canada/nova-scotia/drought-agriculture-
canada-weather-dry-water-wells-farms-1.3767563
Waterbury, J. (2006). The Cyanobacteria—Isolation, Purification and Identification. In:
Dworkin, M., Falkow, S., Rosenberg, E., Schleifer, K., Stackebrandt, E. (eds). The
Prokaryotes. New York, NY: Springer.
Wendland, S. (2011, Jan 25). Murky waters. Halifax Media Co-op. Retrieved from:
http://halifax.mediacoop.ca/fr/story/murky-waters/5815
Whitton, B. and Potts, M. (Eds.) (2000). The Ecology of Cyanobacteria: Their diversity
in time and space. Netherlands: Kluwer Academic Publishers.
World Health Organization (WHO) (1999). Toxic Cyanobacteria in Water: A guide to
their public health consequences, monitoring and management. London, UK: E & FN
Spon.
Zamyadi, A., McQuaid, N., Prévost, M., and Dorner, S. (2012). Monitoring of potentially
toxic cyanobacteria using an online multi-probe in drinking water sources. Journal of
Environmental Monitoring, 14: 579-588.

91
APPENDIX A
Fletchers Lake
Collection dates, Sample Sites, Monthly Proportion of Reads and Monthly Order
Composition for Cyanobacteria Population Analysis, Along with Monthly Water
Chemistry Data for Treatment Plant Water and Tributary Samples
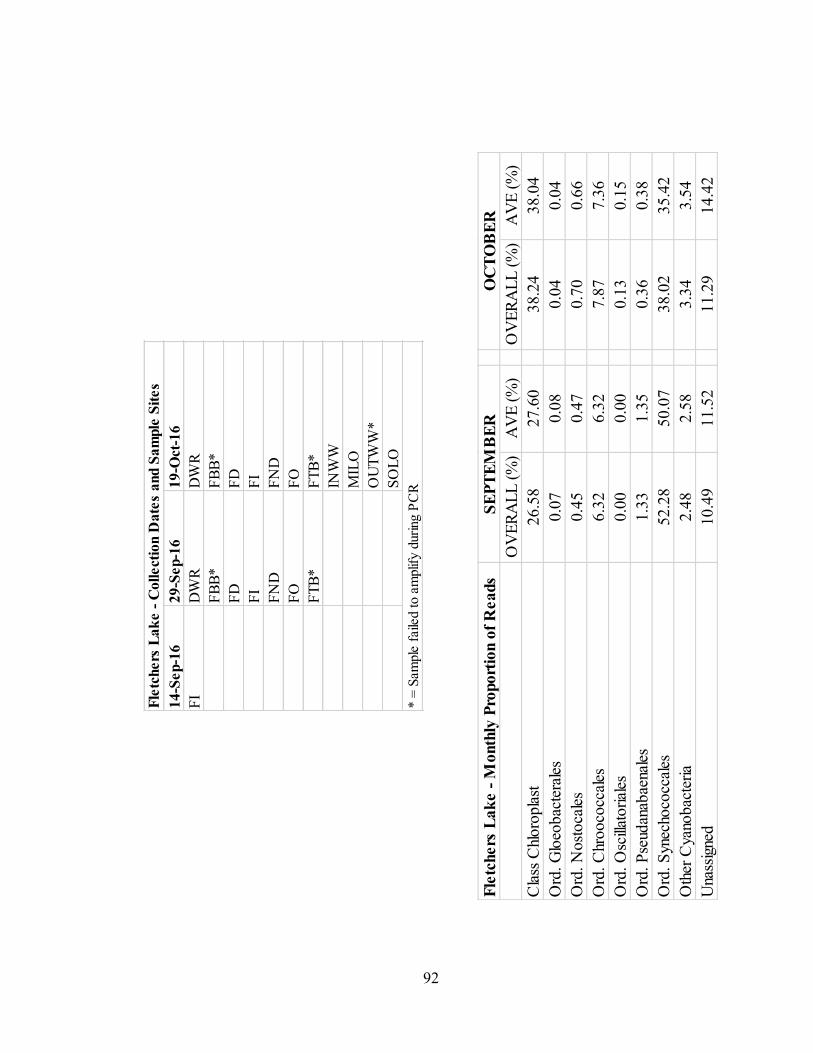
92
14
-Sep-1
62
9-S
ep-1
619
-Oct
-16
FI
DW
RD
WR
FB
B*
FB
B*
FD
FD
FI
FI
FN
DF
ND
FO
FO
FT
B*
FT
B*
INW
W
MIL
O
OU
TW
W*
SO
LO
Fle
tch
ers
La
ke -
Collect
ion
Da
tes
and S
am
ple
Sit
es
* =
Sam
ple
faile
d t
o a
mplif
y d
uri
ng P
CR
Fle
tchers
La
ke -
Mo
nth
ly P
ropo
rtio
n o
f R
ea
ds
OV
ER
AL
L (
%)
AV
E (
%)
OV
ER
AL
L (
%)
AV
E (
%)
Cla
ss C
hlo
ropla
st2
6.5
82
7.6
03
8.2
43
8.0
4
Ord
. G
loeo
bac
tera
les
0.0
70
.08
0.0
40
.04
Ord
. N
ost
oca
les
0.4
50
.47
0.7
00
.66
Ord
. C
hro
oco
ccal
es
6.3
26
.32
7.8
77
.36
Ord
. O
scill
ato
rial
es0
.00
0.0
00
.13
0.1
5
Ord
. P
seud
anab
aena
les
1.3
31
.35
0.3
60
.38
Ord
. S
ynec
hoco
ccal
es5
2.2
85
0.0
73
8.0
23
5.4
2
Oth
er C
yano
bac
teria
2.4
82
.58
3.3
43
.54
Una
ssig
ned
10.4
91
1.5
21
1.2
91
4.4
2
SE
PT
EM
BE
RO
CT
OB
ER
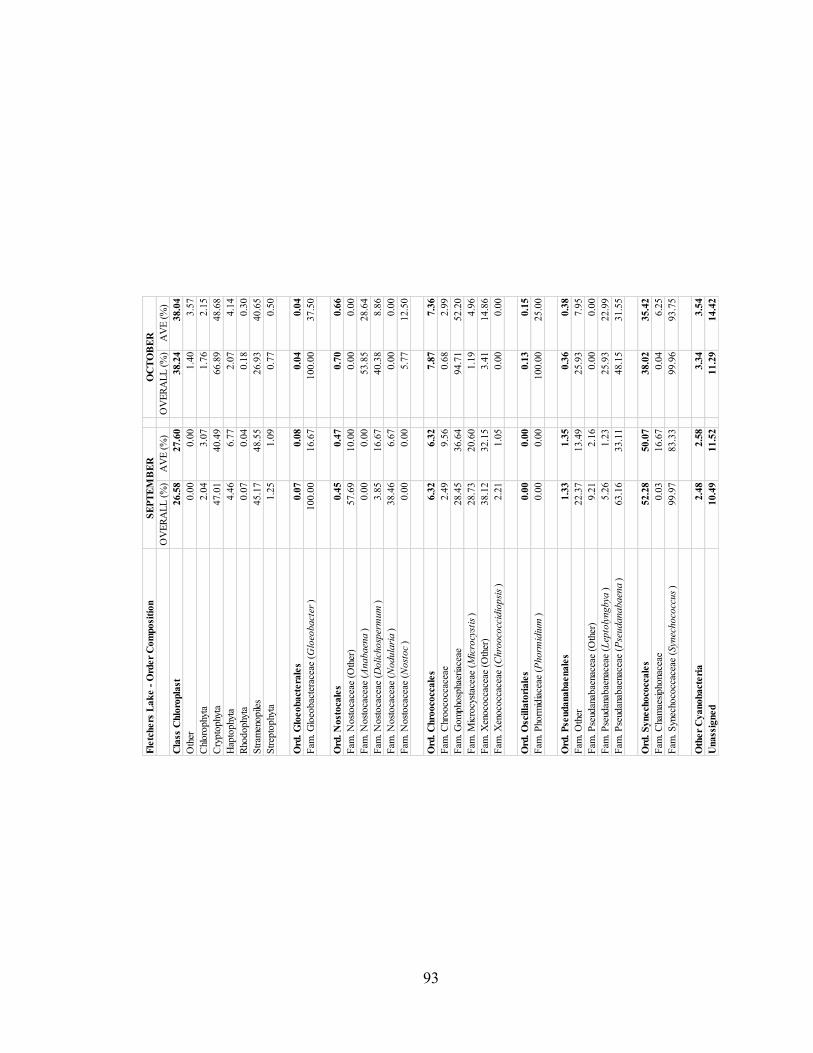
93
Fle
tchers
Lak
e -
Ord
er
Com
posi
tion
OV
ER
AL
L (
%)
AV
E (
%)
OV
ER
AL
L (
%)
AV
E (
%)
Cla
ss C
hlo
ropla
st26.5
827.6
038.2
438.0
4
Oth
er0.0
00.0
01.4
03.5
7
Chl
oro
phy
ta2.0
43.0
71.7
62.1
5
Cry
pto
phy
ta47.0
140.4
966.8
948.6
8
Hap
tophy
ta4.4
66.7
72.0
74.1
4
Rho
dophy
ta0.0
70.0
40.1
80.3
0
Str
amen
opile
s45.1
748.5
526.9
340.6
5
Str
epto
phy
ta1.2
51.0
90.7
70.5
0
Ord
. G
loeobact
era
les
0.0
70.0
80.0
40.0
4
Fam
. G
loeo
bac
tera
ceae
(G
loeo
bact
er)
100.0
016.6
7100.0
037.5
0
Ord
. N
ost
oca
les
0.4
50.4
70.7
00.6
6
Fam
. N
ost
oca
ceae
(O
ther
)57.6
910.0
00.0
00.0
0
Fam
. N
ost
oca
ceae
(A
nabaen
a)
0.0
00.0
053.8
528.6
4
Fam
. N
ost
oca
ceae
(D
olich
osp
erm
um
) 3.8
516.6
740.3
88.8
6
Fam
. N
ost
oca
ceae
(N
odula
ria
) 38.4
66.6
70.0
00.0
0
Fam
. N
ost
oca
ceae
(N
ost
oc
)0.0
00.0
05.7
712.5
0
Ord
. C
hro
oco
ccale
s 6.3
26.3
27.8
77.3
6
Fam
. C
hrooco
ccac
eae
2.4
99.5
60.6
82.9
9
Fam
. G
om
pho
spha
eria
ceae
28.4
536.6
494.7
152.2
0
Fam
. M
icro
cyst
acea
e (M
icro
cyst
is)
28.7
320.6
01.1
94.9
6
Fam
. X
enoco
ccac
eae
(Oth
er)
38.1
232.1
53.4
114.8
6
Fam
. X
enoco
ccac
eae
(Chro
oco
ccid
iopsi
s)
2.2
11.0
50.0
00.0
0
Ord
. O
scilla
tori
ale
s0.0
00.0
00.1
30.1
5
Fam
. P
horm
idia
ceae
(P
horm
idiu
m)
0.0
00.0
0100.0
025.0
0
Ord
. P
seudanabaenale
s1.3
31.3
50.3
60.3
8
Fam
. O
ther
22.3
713.4
925.9
37.9
5
Fam
. P
seud
anab
aena
ceae
(O
ther
)9.2
12.1
60.0
00.0
0
Fam
. P
seud
anab
aena
ceae
(L
epto
lyngbya
)5.2
61.2
325.9
322.9
9
Fam
. P
seud
anab
aena
ceae
(P
seudanabaen
a)
63.1
633.1
148.1
531.5
5
Ord
. S
ynech
oco
ccale
s52.2
850.0
738.0
235.4
2
Fam
. C
ham
aesi
pho
nace
ae0.0
316.6
70.0
46.2
5
Fam
. S
ynec
hoco
ccac
eae
(Syn
echoco
ccus
)99.9
783.3
399.9
693.7
5
Oth
er
Cyanobact
eri
a2.4
82.5
83.3
43.5
4
Unass
igned
10.4
911.5
211.2
914.4
2
SE
PT
EM
BE
RO
CT
OB
ER
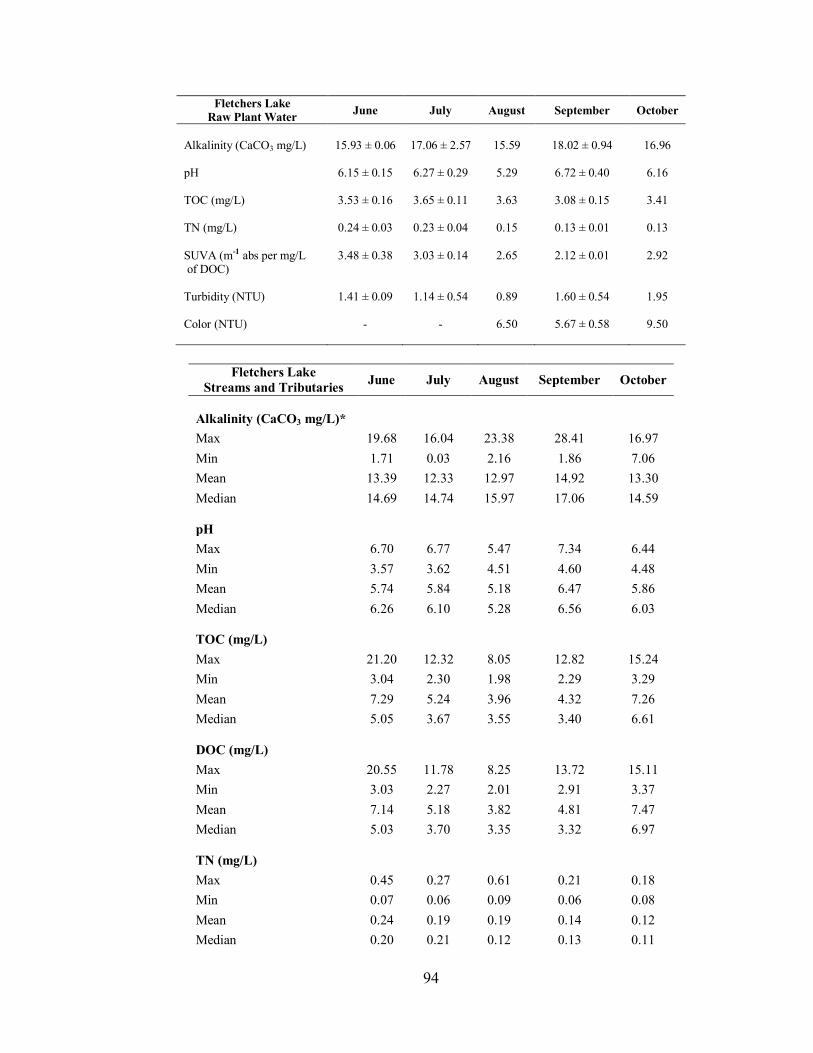
94
Fletchers Lake
Raw Plant Water June July August September October
Alkalinity (CaCO3 mg/L) 15.93 ± 0.06 17.06 ± 2.57 15.59 18.02 ± 0.94 16.96 pH 6.15 ± 0.15 6.27 ± 0.29 5.29 6.72 ± 0.40 6.16 TOC (mg/L) 3.53 ± 0.16 3.65 ± 0.11 3.63 3.08 ± 0.15 3.41 TN (mg/L) 0.24 ± 0.03 0.23 ± 0.04 0.15 0.13 ± 0.01 0.13
SUVA (m-1 abs per mg/L of DOC)
3.48 ± 0.38 3.03 ± 0.14 2.65 2.12 ± 0.01 2.92
Turbidity (NTU) 1.41 ± 0.09 1.14 ± 0.54 0.89 1.60 ± 0.54 1.95 Color (NTU)
- - 6.50 5.67 ± 0.58 9.50
Fletchers Lake
Streams and Tributaries June July August September October
Alkalinity (CaCO3 mg/L)*
Max 19.68 16.04 23.38 28.41 16.97
Min 1.71 0.03 2.16 1.86 7.06
Mean 13.39 12.33 12.97 14.92 13.30
Median 14.69 14.74 15.97 17.06 14.59
pH
Max 6.70 6.77 5.47 7.34 6.44
Min 3.57 3.62 4.51 4.60 4.48
Mean 5.74 5.84 5.18 6.47 5.86
Median 6.26 6.10 5.28 6.56 6.03
TOC (mg/L)
Max 21.20 12.32 8.05 12.82 15.24
Min 3.04 2.30 1.98 2.29 3.29
Mean 7.29 5.24 3.96 4.32 7.26
Median 5.05 3.67 3.55 3.40 6.61
DOC (mg/L)
Max 20.55 11.78 8.25 13.72 15.11
Min 3.03 2.27 2.01 2.91 3.37
Mean 7.14 5.18 3.82 4.81 7.47
Median 5.03 3.70 3.35 3.32 6.97
TN (mg/L)
Max 0.45 0.27 0.61 0.21 0.18
Min 0.07 0.06 0.09 0.06 0.08
Mean 0.24 0.19 0.19 0.14 0.12
Median 0.20 0.21 0.12 0.13 0.11
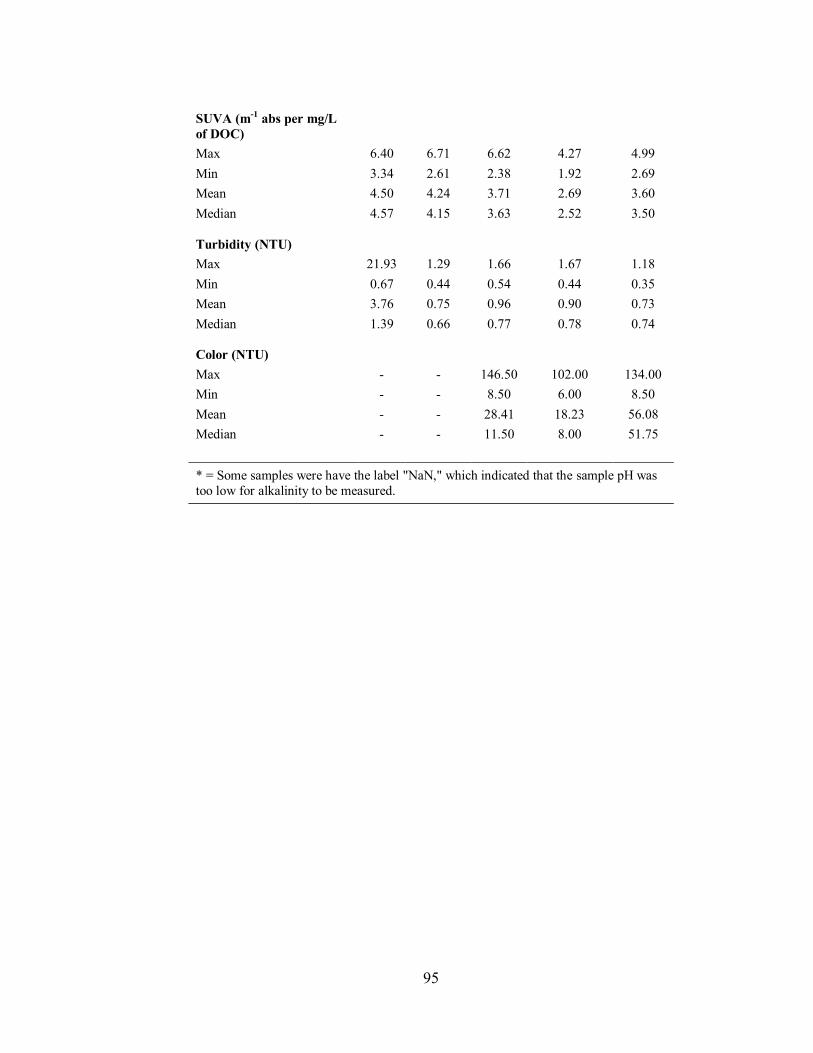
95
SUVA (m-1
abs per mg/L
of DOC)
Max 6.40 6.71 6.62 4.27 4.99
Min 3.34 2.61 2.38 1.92 2.69
Mean 4.50 4.24 3.71 2.69 3.60
Median 4.57 4.15 3.63 2.52 3.50
Turbidity (NTU)
Max 21.93 1.29 1.66 1.67 1.18
Min 0.67 0.44 0.54 0.44 0.35
Mean 3.76 0.75 0.96 0.90 0.73
Median 1.39 0.66 0.77 0.78 0.74
Color (NTU)
Max - - 146.50 102.00 134.00
Min - - 8.50 6.00 8.50
Mean - - 28.41 18.23 56.08
Median - - 11.50 8.00 51.75
* = Some samples were have the label "NaN," which indicated that the sample pH was
too low for alkalinity to be measured.

96
APPENDIX B
Powder Mill Lake
Collection dates, Sample Sites, Monthly Proportion of Reads and Monthly Order
Composition for Cyanobacteria Population Analysis, Along with Monthly Water
Chemistry Data for In-Lake Samples
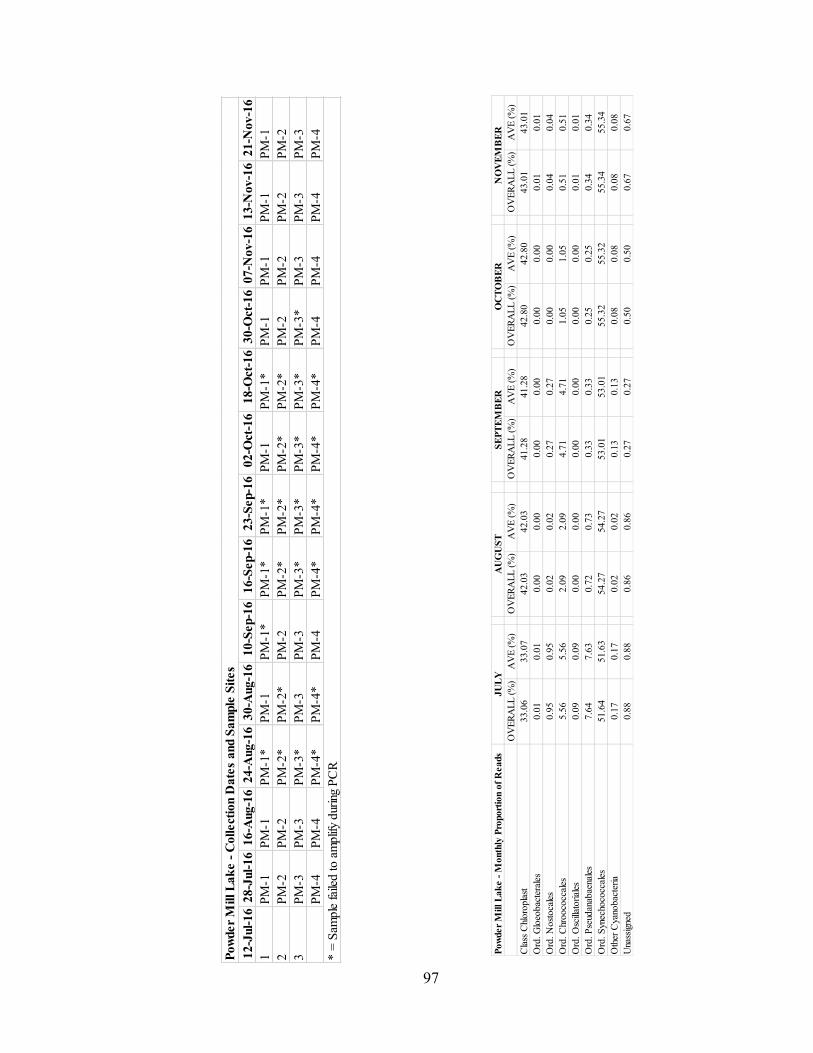
97
Pow
der
Mill L
ak
e -
Month
ly P
roport
ion o
f R
eads
OV
ER
AL
L (
%)
AV
E (
%)
OV
ER
AL
L (
%)
AV
E (
%)
OV
ER
AL
L (
%)
AV
E (
%)
OV
ER
AL
L (
%)
AV
E (
%)
OV
ER
AL
L (
%)
AV
E (
%)
Cla
ss C
hloro
pla
st33.0
633.0
742.0
342.0
341.2
841.2
842.8
042.8
043.0
143.0
1
Ord
. G
loeo
bac
tera
les
0.0
10.0
10.0
00.0
00.0
00.0
00.0
00.0
00.0
10.0
1
Ord
. N
ost
oca
les
0.9
50.9
50.0
20.0
20.2
70.2
70.0
00.0
00.0
40.0
4
Ord
. C
hrooco
ccal
es
5.5
65.5
62.0
92.0
94.7
14.7
11.0
51.0
50.5
10.5
1
Ord
. O
scill
atorial
es0.0
90.0
90.0
00.0
00.0
00.0
00.0
00.0
00.0
10.0
1
Ord
. P
seud
anab
aena
les
7.6
47.6
30.7
20.7
30.3
30.3
30.2
50.2
50.3
40.3
4
Ord
. S
ynec
hoco
ccal
es51.6
451.6
354.2
754.2
753.0
153.0
155.3
255.3
255.3
455.3
4
Oth
er C
yano
bac
teria
0.1
70.1
70.0
20.0
20.1
30.1
30.0
80.0
80.0
80.0
8
Una
ssig
ned
0.8
80.8
80.8
60.8
60.2
70.2
70.5
00.5
00.6
70.6
7
JU
LY
AU
GU
ST
SE
PT
EM
BE
RO
CT
OB
ER
NO
VE
MB
ER
12-J
ul-
16
28-J
ul-
16
16-A
ug-1
624-A
ug-1
630-A
ug-1
610-S
ep-1
616-S
ep-1
623-S
ep-1
602-O
ct-1
618-O
ct-1
630-O
ct-1
607-N
ov-1
613-N
ov-1
621-N
ov-1
6
1P
M-1
PM
-1P
M-1
*P
M-1
PM
-1*
PM
-1*
PM
-1*
PM
-1P
M-1
*P
M-1
PM
-1P
M-1
PM
-1
2P
M-2
PM
-2P
M-2
*P
M-2
*P
M-2
PM
-2*
PM
-2*
PM
-2*
PM
-2*
PM
-2P
M-2
PM
-2P
M-2
3P
M-3
PM
-3P
M-3
*P
M-3
PM
-3P
M-3
*P
M-3
*P
M-3
*P
M-3
*P
M-3
*P
M-3
PM
-3P
M-3
PM
-4P
M-4
PM
-4*
PM
-4*
PM
-4P
M-4
*P
M-4
*P
M-4
*P
M-4
*P
M-4
PM
-4P
M-4
PM
-4
Pow
der
Mill L
ak
e -
Collect
ion D
ate
s and S
am
ple
Sit
es
* =
Sam
ple
fai
led to a
mplif
y dur
ing
PC
R
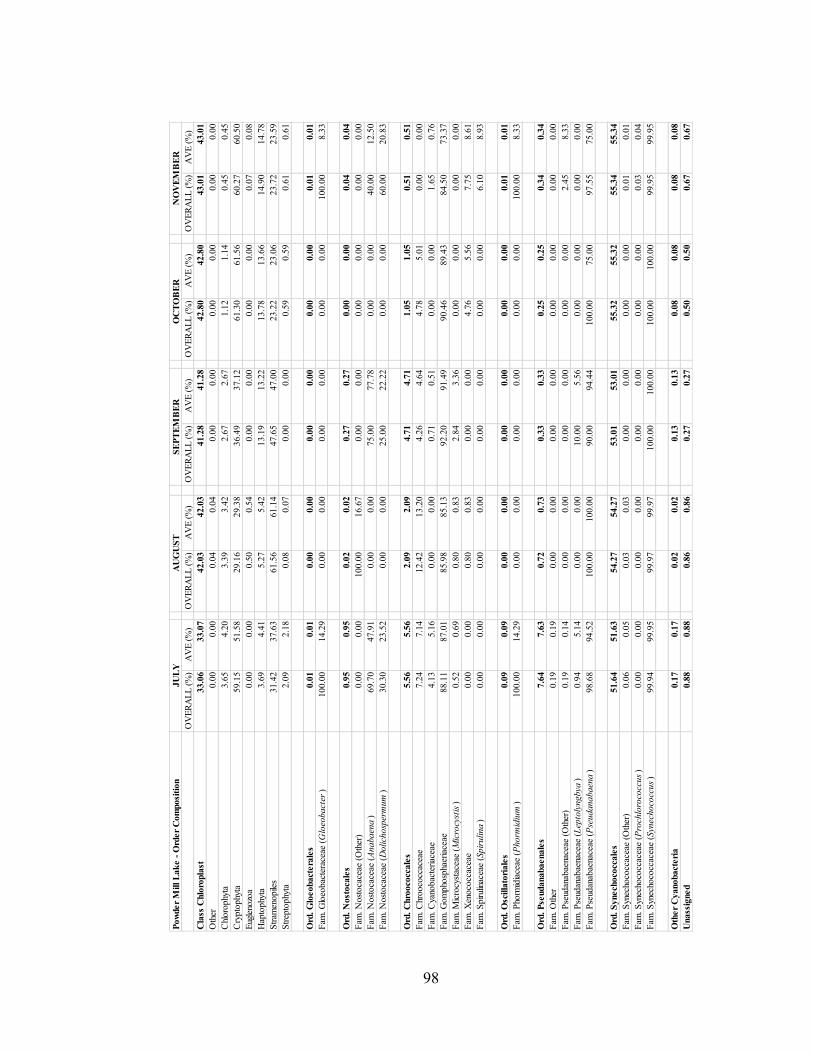
98
Pow
der
Mill L
ak
e -
Ord
er
Com
posi
tion
OV
ER
AL
L (
%)
AV
E (
%)
OV
ER
AL
L (
%)
AV
E (
%)
OV
ER
AL
L (
%)
AV
E (
%)
OV
ER
AL
L (
%)
AV
E (
%)
OV
ER
AL
L (
%)
AV
E (
%)
Cla
ss C
hlo
ropla
st33.0
633.0
742.0
342.0
341.2
841.2
842.8
042.8
043.0
143.0
1
Oth
er0.0
00.0
00.0
40.0
40.0
00.0
00.0
00.0
00.0
00.0
0
Chl
oro
phy
ta3.6
54.2
03.3
93.4
22.6
72.6
71.1
21.1
40.4
50.4
5
Cry
pto
phy
ta59.1
551.5
829.1
629.3
836.4
937.1
261.3
061.5
660.2
760.5
0
Eug
leno
zoa
0.0
00.0
00.5
00.5
40.0
00.0
00.0
00.0
00.0
70.0
8
Hap
tophy
ta3.6
94.4
15.2
75.4
213.1
913.2
213.7
813.6
614.9
014.7
8
Str
amen
opile
s31.4
237.6
361.5
661.1
447.6
547.0
023.2
223.0
623.7
223.5
9
Str
epto
phy
ta2.0
92.1
80.0
80.0
70.0
00.0
00.5
90.5
90.6
10.6
1
Ord
. G
loeobact
era
les
0.0
10.0
10.0
00.0
00.0
00.0
00.0
00.0
00.0
10.0
1
Fam
. G
loeo
bac
tera
ceae
(G
loeo
bact
er)
100.0
014.2
90.0
00.0
00.0
00.0
00.0
00.0
0100.0
08.3
3
Ord
. N
ost
oca
les
0.9
50.9
50.0
20.0
20.2
70.2
70.0
00.0
00.0
40.0
4
Fam
. N
ost
oca
ceae
(O
ther
)0.0
00.0
0100.0
016.6
70.0
00.0
00.0
00.0
00.0
00.0
0
Fam
. N
ost
oca
ceae
(A
nabaen
a)
69.7
047.9
10.0
00.0
075.0
077.7
80.0
00.0
040.0
012.5
0
Fam
. N
ost
oca
ceae
(D
olich
osp
erm
um
) 30.3
023.5
20.0
00.0
025.0
022.2
20.0
00.0
060.0
020.8
3
Ord
. C
hro
oco
ccale
s 5.5
65.5
62.0
92.0
94.7
14.7
11.0
51.0
50.5
10.5
1
Fam
. C
hrooco
ccac
eae
7.2
47.1
412.4
213.2
04.2
64.6
44.7
85.0
10.0
00.0
0
Fam
. C
yano
bac
teriac
eae
4.1
35.1
60.0
00.0
00.7
10.5
10.0
00.0
01.6
50.7
6
Fam
. G
om
pho
spha
eria
ceae
88.1
187.0
185.9
885.1
392.2
091.4
990.4
689.4
384.5
073.3
7
Fam
. M
icro
cyst
acea
e (M
icro
cyst
is)
0.5
20.6
90.8
00.8
32.8
43.3
60.0
00.0
00.0
00.0
0
Fam
. X
enoco
ccac
eae
0.0
00.0
00.8
00.8
30.0
00.0
04.7
65.5
67.7
58.6
1
Fam
. S
pirul
inac
eae
(Spir
ulina
)0.0
00.0
00.0
00.0
00.0
00.0
00.0
00.0
06.1
08.9
3
Ord
. O
scilla
tori
ale
s0.0
90.0
90.0
00.0
00.0
00.0
00.0
00.0
00.0
10.0
1
Fam
. P
horm
idia
ceae
(P
horm
idiu
m)
100.0
014.2
90.0
00.0
00.0
00.0
00.0
00.0
0100.0
08.3
3
Ord
. P
seudanabaenale
s7.6
47.6
30.7
20.7
30.3
30.3
30.2
50.2
50.3
40.3
4
Fam
. O
ther
0.1
90.1
90.0
00.0
00.0
00.0
00.0
00.0
00.0
00.0
0
Fam
. P
seud
anab
aena
ceae
(O
ther
)0.1
90.1
40.0
00.0
00.0
00.0
00.0
00.0
02.4
58.3
3
Fam
. P
seud
anab
aena
ceae
(L
epto
lyngbya
)0.9
45.1
40.0
00.0
010.0
05.5
60.0
00.0
00.0
00.0
0
Fam
. P
seud
anab
aena
ceae
(P
seudanabaen
a)
98.6
894.5
2100.0
0100.0
090.0
094.4
4100.0
075.0
097.5
575.0
0
Ord
. S
ynech
oco
ccale
s51.6
451.6
354.2
754.2
753.0
153.0
155.3
255.3
255.3
455.3
4
Fam
. S
ynec
hoco
ccac
eae
(Oth
er)
0.0
60.0
50.0
30.0
30.0
00.0
00.0
00.0
00.0
10.0
1
Fam
. S
ynec
hoco
ccac
eae
(Pro
chlo
roco
ccus
)0.0
00.0
00.0
00.0
00.0
00.0
00.0
00.0
00.0
30.0
4
Fam
. S
ynec
hoco
ccac
eae
(Syn
echoco
ccus
)99.9
499.9
599.9
799.9
7100.0
0100.0
0100.0
0100.0
099.9
599.9
5
Oth
er
Cyanobact
eri
a0.1
70.1
70.0
20.0
20.1
30.1
30.0
80.0
80.0
80.0
8
Unass
igned
0.8
80.8
80.8
60.8
60.2
70.2
70.5
00.5
00.6
70.6
7
JU
LY
AU
GU
ST
SE
PT
EM
BE
RO
CT
OB
ER
NO
VE
MB
ER
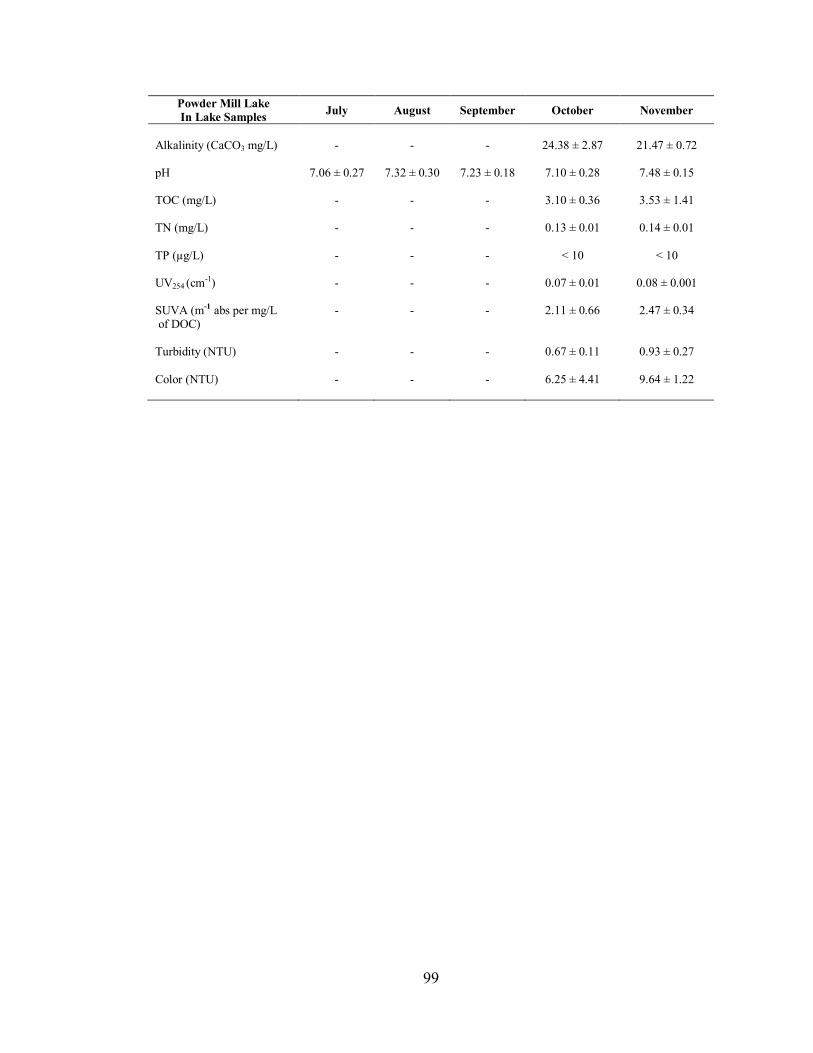
99
Powder Mill Lake
In Lake Samples July August September October November
Alkalinity (CaCO3 mg/L) - - - 24.38 ± 2.87 21.47 ± 0.72 pH 7.06 ± 0.27 7.32 ± 0.30 7.23 ± 0.18 7.10 ± 0.28 7.48 ± 0.15 TOC (mg/L) - - - 3.10 ± 0.36 3.53 ± 1.41 TN (mg/L) - - - 0.13 ± 0.01 0.14 ± 0.01
TP (µg/L) - - - < 10 < 10 UV254 (cm-1) - - - 0.07 ± 0.01 0.08 ± 0.001 SUVA (m-1 abs per mg/L of DOC)
- - - 2.11 ± 0.66 2.47 ± 0.34
Turbidity (NTU) - - - 0.67 ± 0.11 0.93 ± 0.27
Color (NTU)
- - - 6.25 ± 4.41 9.64 ± 1.22
100
APPENDIX C
POCKWOCK LAKE
Collection dates, Sample Sites, Monthly Proportion of Reads and Monthly Order
Composition for Cyanobacteria Population Analysis, Along with Monthly Water
Chemistry Data for In-Lake and Tributary Samples
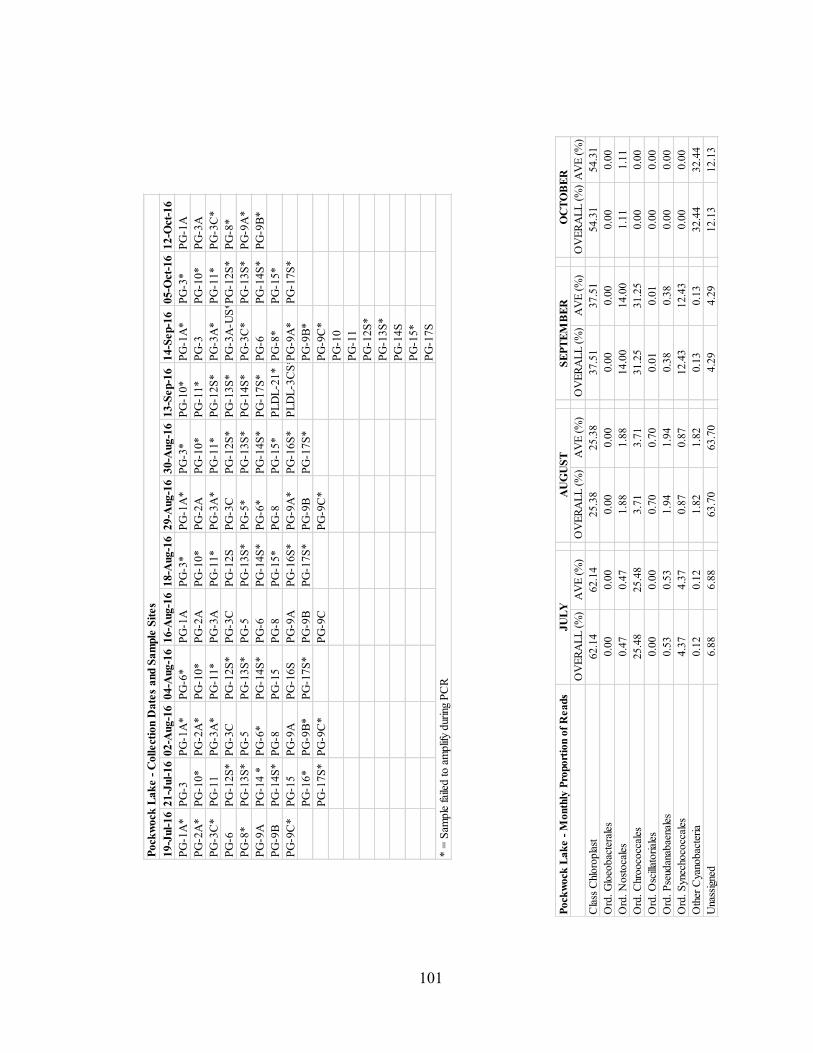
101
Po
ckw
ock
La
ke -
Mo
nth
ly P
ropo
rtio
n o
f R
ea
ds
OV
ER
AL
L (
%)
AV
E (
%)
OV
ER
AL
L (
%)
AV
E (
%)
OV
ER
AL
L (
%)
AV
E (
%)
OV
ER
AL
L (
%)
AV
E (
%)
Cla
ss C
hlo
ropla
st6
2.1
46
2.1
42
5.3
82
5.3
83
7.5
13
7.5
15
4.3
15
4.3
1
Ord
. G
loeo
bac
tera
les
0.0
00
.00
0.0
00
.00
0.0
00
.00
0.0
00
.00
Ord
. N
ost
oca
les
0.4
70
.47
1.8
81
.88
14.0
01
4.0
01
.11
1.1
1
Ord
. C
hro
oco
ccal
es
25.4
82
5.4
83
.71
3.7
13
1.2
53
1.2
50
.00
0.0
0
Ord
. O
scill
ato
rial
es0
.00
0.0
00
.70
0.7
00
.01
0.0
10
.00
0.0
0
Ord
. P
seud
anab
aena
les
0.5
30
.53
1.9
41
.94
0.3
80
.38
0.0
00
.00
Ord
. S
ynec
hoco
ccal
es4
.37
4.3
70
.87
0.8
71
2.4
31
2.4
30
.00
0.0
0
Oth
er C
yano
bac
teria
0.1
20
.12
1.8
21
.82
0.1
30
.13
32.4
43
2.4
4
Una
ssig
ned
6.8
86
.88
63.7
06
3.7
04
.29
4.2
91
2.1
31
2.1
3
JU
LY
AU
GU
ST
SE
PT
EM
BE
RO
CT
OB
ER
19
-Jul-
16
21
-Jul-
16
02
-Aug
-16
04
-Aug
-16
16
-Aug
-16
18
-Aug
-16
29
-Aug
-16
30
-Aug
-16
13
-Sep-1
61
4-S
ep-1
60
5-O
ct-1
61
2-O
ct-1
6
PG
-1A
*P
G-3
PG
-1A
*P
G-6
*P
G-1
AP
G-3
*P
G-1
A*
PG
-3*
PG
-10
*P
G-1
A*
PG
-3*
PG
-1A
PG
-2A
*P
G-1
0*
PG
-2A
*P
G-1
0*
PG
-2A
PG
-10
*P
G-2
AP
G-1
0*
PG
-11
*P
G-3
PG
-10
*P
G-3
A
PG
-3C
*P
G-1
1P
G-3
A*
PG
-11
*P
G-3
AP
G-1
1*
PG
-3A
*P
G-1
1*
PG
-12
S*
PG
-3A
*P
G-1
1*
PG
-3C
*
PG
-6P
G-1
2S
*P
G-3
CP
G-1
2S
*P
G-3
CP
G-1
2S
PG
-3C
PG
-12
S*
PG
-13
S*
PG
-3A
-US
*PG
-12
S*
PG
-8*
PG
-8*
PG
-13
S*
PG
-5P
G-1
3S
*P
G-5
PG
-13
S*
PG
-5*
PG
-13
S*
PG
-14
S*
PG
-3C
*P
G-1
3S
*P
G-9
A*
PG
-9A
PG
-14
*P
G-6
*P
G-1
4S
*P
G-6
PG
-14
S*
PG
-6*
PG
-14
S*
PG
-17
S*
PG
-6P
G-1
4S
*P
G-9
B*
PG
-9B
PG
-14
S*
PG
-8P
G-1
5P
G-8
PG
-15
*P
G-8
PG
-15
*P
LD
L-2
1*
PG
-8*
PG
-15
*
PG
-9C
*P
G-1
5P
G-9
AP
G-1
6S
PG
-9A
PG
-16
S*
PG
-9A
*P
G-1
6S
*P
LD
L-3
CS
*PG
-9A
*P
G-1
7S
*
PG
-16
*P
G-9
B*
PG
-17
S*
PG
-9B
PG
-17
S*
PG
-9B
PG
-17
S*
PG
-9B
*
PG
-17
S*
PG
-9C
*P
G-9
CP
G-9
C*
PG
-9C
*
PG
-10
PG
-11
PG
-12
S*
PG
-13
S*
PG
-14
S
PG
-15
*
PG
-17
S
* =
Sam
ple
fai
led
to
am
plif
y d
urin
g P
CR
Po
ckw
ock
La
ke -
Co
llect
ion D
ate
s a
nd S
am
ple
Sit
es
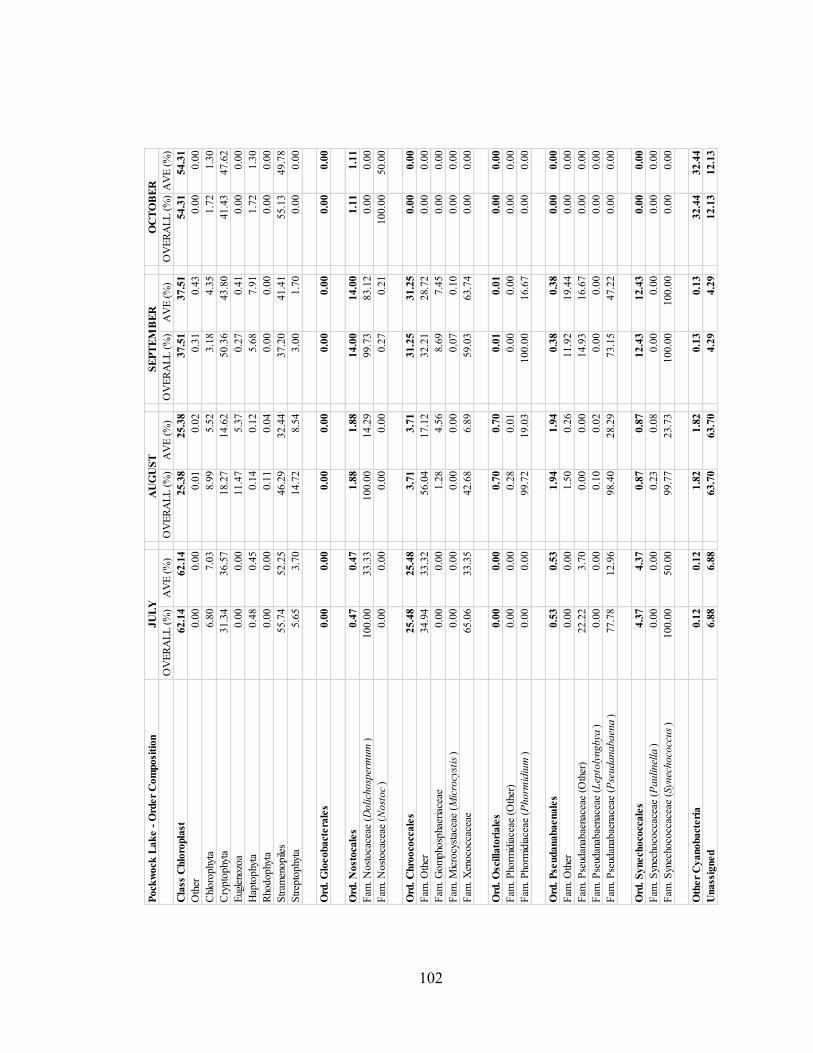
102
Pock
wock
Lak
e -
Ord
er
Com
posi
tion
OV
ER
AL
L (
%)
AV
E (
%)
OV
ER
AL
L (
%)
AV
E (
%)
OV
ER
AL
L (
%)
AV
E (
%)
OV
ER
AL
L (
%)
AV
E (
%)
Cla
ss C
hlo
ropla
st62.1
462.1
425.3
825.3
837.5
137.5
154.3
154.3
1
Oth
er0.0
00.0
00.0
10.0
20.3
10.4
30.0
00.0
0
Chl
oro
phy
ta6.8
07.0
38.9
95.5
23.1
84.3
51.7
21.3
0
Cry
pto
phy
ta31.3
436.5
718.2
714.6
250.3
643.8
041.4
347.6
2
Eug
leno
zoa
0.0
00.0
011.4
75.3
70.2
70.4
10.0
00.0
0
Hap
tophy
ta0.4
80.4
50.1
40.1
25.6
87.9
11.7
21.3
0
Rho
dophy
ta0.0
00.0
00.1
10.0
40.0
00.0
00.0
00.0
0
Str
amen
opile
s55.7
452.2
546.2
932.4
437.2
041.4
155.1
349.7
8
Str
epto
phy
ta5.6
53.7
014.7
28.5
43.0
01.7
00.0
00.0
0
Ord
. G
loeobact
era
les
0.0
00.0
00.0
00.0
00.0
00.0
00.0
00.0
0
Ord
. N
ost
oca
les
0.4
70.4
71.8
81.8
814.0
014.0
01.1
11.1
1
Fam
. N
ost
oca
ceae
(D
olich
osp
erm
um
) 100.0
033.3
3100.0
014.2
999.7
383.1
20.0
00.0
0
Fam
. N
ost
oca
ceae
(N
ost
oc
)0.0
00.0
00.0
00.0
00.2
70.2
1100.0
050.0
0
Ord
. C
hro
oco
ccale
s 25.4
825.4
83.7
13.7
131.2
531.2
50.0
00.0
0
Fam
. O
ther
34.9
433.3
256.0
417.1
232.2
128.7
20.0
00.0
0
Fam
. G
om
pho
spha
eria
ceae
0.0
00.0
01.2
84.5
68.6
97.4
50.0
00.0
0
Fam
. M
icro
cyst
acea
e (M
icro
cyst
is)
0.0
00.0
00.0
00.0
00.0
70.1
00.0
00.0
0
Fam
. X
enoco
ccac
eae
65.0
633.3
542.6
86.8
959.0
363.7
40.0
00.0
0
Ord
. O
scilla
tori
ale
s0.0
00.0
00.7
00.7
00.0
10.0
10.0
00.0
0
Fam
. P
horm
idia
ceae
(O
ther
)0.0
00.0
00.2
80.0
10.0
00.0
00.0
00.0
0
Fam
. P
horm
idia
ceae
(P
horm
idiu
m)
0.0
00.0
099.7
219.0
3100.0
016.6
70.0
00.0
0
Ord
. P
seudanabaenale
s0.5
30.5
31.9
41.9
40.3
80.3
80.0
00.0
0
Fam
. O
ther
0.0
00.0
01.5
00.2
611.9
219.4
40.0
00.0
0
Fam
. P
seud
anab
aena
ceae
(O
ther
)22.2
23.7
00.0
00.0
014.9
316.6
70.0
00.0
0
Fam
. P
seud
anab
aena
ceae
(L
epto
lyngbya
)0.0
00.0
00.1
00.0
20.0
00.0
00.0
00.0
0
Fam
. P
seud
anab
aena
ceae
(P
seudanabaen
a)
77.7
812.9
698.4
028.2
973.1
547.2
20.0
00.0
0
Ord
. S
ynech
oco
ccale
s4.3
74.3
70.8
70.8
712.4
312.4
30.0
00.0
0
Fam
. S
ynec
hoco
ccac
eae
(Paulinel
la)
0.0
00.0
00.2
30.0
80.0
00.0
00.0
00.0
0
Fam
. S
ynec
hoco
ccac
eae
(Syn
echoco
ccus
)100.0
050.0
099.7
723.7
3100.0
0100.0
00.0
00.0
0
Oth
er
Cyanobact
eri
a0.1
20.1
21.8
21.8
20.1
30.1
332.4
432.4
4
Unass
igned
6.8
86.8
863.7
063.7
04.2
94.2
912.1
312.1
3
JU
LY
AU
GU
ST
SE
PT
EM
BE
RO
CT
OB
ER
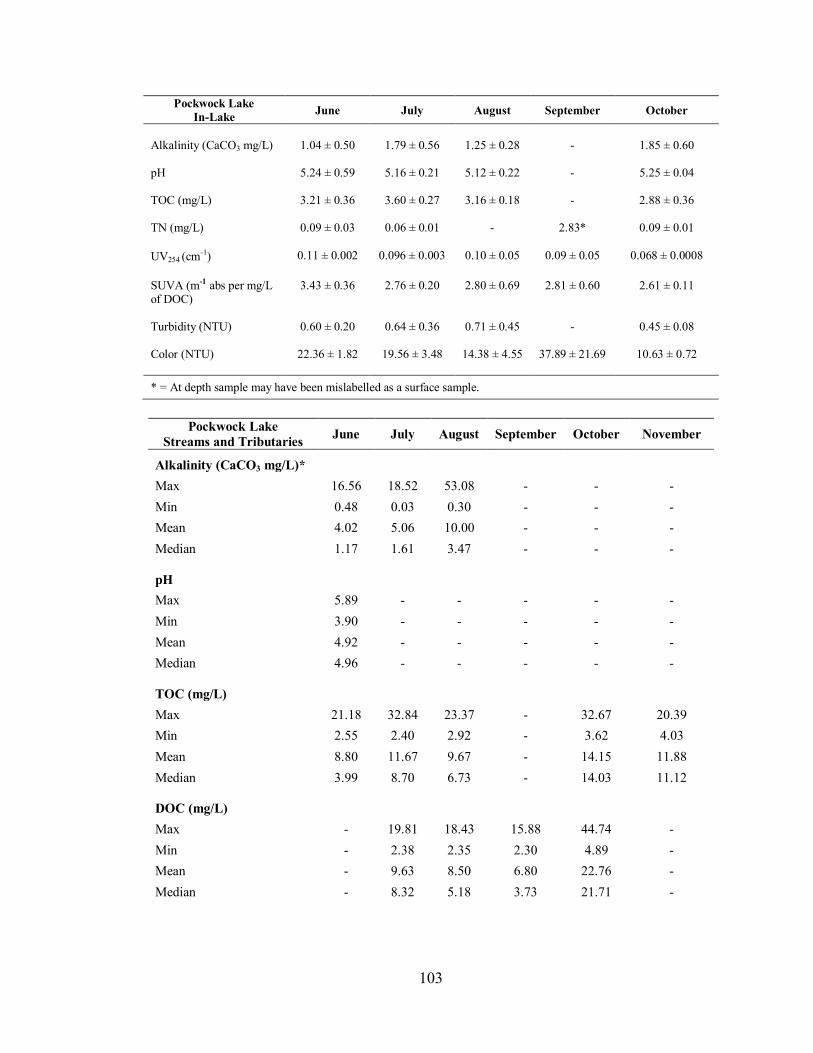
103
Pockwock Lake
In-Lake June July August September October
Alkalinity (CaCO3 mg/L)
1.04 ± 0.50
1.79 ± 0.56
1.25 ± 0.28
-
1.85 ± 0.60
pH
5.24 ± 0.59 5.16 ± 0.21 5.12 ± 0.22 - 5.25 ± 0.04
TOC (mg/L)
3.21 ± 0.36 3.60 ± 0.27 3.16 ± 0.18 - 2.88 ± 0.36
TN (mg/L)
0.09 ± 0.03 0.06 ± 0.01 - 2.83* 0.09 ± 0.01
UV254 (cm-1)
0.11 ± 0.002 0.096 ± 0.003 0.10 ± 0.05 0.09 ± 0.05 0.068 ± 0.0008
SUVA (m-1 abs per mg/L of DOC)
3.43 ± 0.36 2.76 ± 0.20 2.80 ± 0.69 2.81 ± 0.60 2.61 ± 0.11
Turbidity (NTU)
0.60 ± 0.20 0.64 ± 0.36 0.71 ± 0.45 - 0.45 ± 0.08
Color (NTU)
22.36 ± 1.82 19.56 ± 3.48 14.38 ± 4.55 37.89 ± 21.69 10.63 ± 0.72
* = At depth sample may have been mislabelled as a surface sample.
Pockwock Lake
Streams and Tributaries June July August September October November
Alkalinity (CaCO3 mg/L)*
Max 16.56 18.52 53.08 - - -
Min 0.48 0.03 0.30 - - -
Mean 4.02 5.06 10.00 - - -
Median 1.17 1.61 3.47 - - -
pH
Max 5.89 - - - - -
Min 3.90 - - - - -
Mean 4.92 - - - - -
Median 4.96 - - - - -
TOC (mg/L)
Max 21.18 32.84 23.37 - 32.67 20.39
Min 2.55 2.40 2.92 - 3.62 4.03
Mean 8.80 11.67 9.67 - 14.15 11.88
Median 3.99 8.70 6.73 - 14.03 11.12
DOC (mg/L)
Max - 19.81 18.43 15.88 44.74 -
Min - 2.38 2.35 2.30 4.89 -
Mean - 9.63 8.50 6.80 22.76 -
Median - 8.32 5.18 3.73 21.71 -
104
TN (mg/L)
Max 1.06 1.34 3.65 - 0.30 0.23
Min 0.08 0.07 0.09 - 0.12 0.09
Mean 0.29 0.36 0.61 - 0.20 0.16
Median 0.20 0.26 0.29 - 0.19 0.15
UV254 (cm-1
)
Max 0.87 1.18 1.09 - - -
Min 0.11 0.07 0.07 - - -
Mean 0.37 0.53 0.41 - - -
Median 0.19 0.42 0.15 - - -
SUVA (m-1
abs per mg/L
of DOC)
Max - 6.92 6.01 - - -
Min - 2.85 2.38 - - -
Mean - 4.66 4.23 - - -
Median - 4.61 3.87 - - -
Turbidity (NTU)
Max 34.50 36.92 17.00 - - -
Min 0.46 0.46 0.74 - - -
Mean 4.92 6.40 3.89 - - -
Median 1.23 0.98 2.02 - - -
Color (NTU)
Max 475.00 494.00 688.00 421.00 - -
Min 19.00 21.00 3.00 63.00 - -
Mean 137.05 153.78 150.27 186.63 - -
Median 81.00 47.50 66.00 158.50 - -
* = Some samples were have the label "NaN," which indicated that the sample pH was too low for
alkalinity to be measured.
105
APPENDIX D
LAKE MAJOR
Collection dates, Sample Sites, Monthly Proportion of Reads and Monthly Order
Composition for Cyanobacteria Population Analysis, Monthly Water Chemistry Data for
Pump House and Tributary Samples
106
La
ke M
ajo
r -
Mo
nth
ly P
ropo
rtio
n o
f R
ea
ds
OV
ER
AL
L (
%)
AV
E (
%)
Cla
ss C
hlo
ropla
st4
1.5
63
4.1
1
Ord
. G
loeo
bac
tera
les
0.0
00
.00
Ord
. N
ost
oca
les
0.2
50
.23
Ord
. C
hro
oco
ccal
es
2.2
31
.82
Ord
. O
scill
ato
rial
es2
.78
2.2
7
Ord
. P
seud
anab
aena
les
13.3
01
0.8
8
Ord
. S
ynec
hoco
ccal
es0
.12
0.1
6
Oth
er C
yano
bac
teria
1.4
81
.92
Una
ssig
ned
38.2
84
8.6
2
JU
LY
23
-Jun-1
62
8-J
ul-
16
20
-Oct
-16
3*
LM
G-1
*L
M R
aw 1
*
LM
G-3
*L
M R
aw 2
*
LM
G-6
A
LM
G-7
La
ke M
ajo
r -
Co
llect
ion D
ate
s a
nd S
am
ple
Sit
es
* =
Sam
ple
faile
d t
o a
mplif
y d
uri
ng P
CR
107
La
ke M
ajo
r -
Ord
er
Co
mpo
siti
on
OV
ER
AL
L (
%)
AV
E (
%)
Cla
ss C
hlo
ropla
st41.5
634.1
1
Oth
er0.1
50.0
8
Chl
oro
phy
ta1.3
40.6
8
Cry
pto
phy
ta30.2
129.4
0
Str
amen
op
iles
60.5
765.9
4
Str
epto
phy
ta7.7
43.9
1
Ord
. G
loeo
ba
ctera
les
0.0
00.0
0
Ord
. N
ost
oca
les
0.2
50.2
3
Fam
. N
ost
oca
ceae
(A
na
ba
ena
)50.0
066.6
7
Fam
. N
ost
oca
ceae
(D
olich
osp
erm
um
) 50.0
033.3
3
Ord
. C
hro
oco
cca
les
2.2
31.8
2
Fam
. X
eno
cocc
acea
e 100.0
050.0
0
Ord
. O
scilla
tori
ale
s2.7
82.2
7
Fam
. P
horm
idia
ceae
(P
ho
rmid
ium
)100.0
050.0
0
Ord
. P
seuda
na
ba
ena
les
13.3
010.8
8
Fam
. P
seud
anab
aena
ceae
(A
rth
ron
ema
)0.4
750.0
0
Fam
. P
seud
anab
aena
ceae
(P
seu
dan
aba
ena
)99.5
350.0
0
Ord
. S
ynech
oco
cca
les
0.1
20.1
6
Fam
. S
ynec
hoco
ccac
eae
(Syn
ech
oco
ccu
s)
100.0
050.0
0
Oth
er
Cy
ano
ba
cteri
a1.4
81.9
2
Una
ssig
ned
38.2
848.6
2
JU
LY
108
Lake Major
Pump House Water June July August September October November
pH 5.48 5.51 ± 0.07 5.59 ± 0.06 5.56 ± 0.23 5.27 ± 0.15 5.25 TOC (mg/L) 4.86 ± 0.04 4.76 ± 0.24 4.47 ± 0.14 3.98 ± 0.27 4.90 ± 1.18 - UV254 (cm-1) 0.24 ± 0.01 0.21 ± 0.01 0.18 ± 0.002 0.18 ± 0.01 0.19 ± 0.01 0.20 SUVA (m-1 abs per mg/L of DOC)
5.11 ± 0.16 4.58 ± 0.26 3.93 ± 0.15 4.60 ± 0.32 4.20 ± 0.43 -
Turbidity (NTU) 0.40 ± 0.02 0.43 ± 0.08 0.31 ± 0.03 0.29 ± 0.08 0.33 ± 0.04 0.32 Color (NTU)
44.38 ± 1.94 35.33 ± 3.37 27.50 ± 1.91 26.33 ± 0.58 27.67 ± 3.06 32
Lake Major
Streams and Tributaries July
pH
Max 6.20
Min 4.50
Mean 5.57
Median 5.79
TOC (mg/L)
Max 16.07
Min 3.09
Mean 7.26
Median 6.96
DOC (mg/L)
Max 13.62
Min 2.76
Mean 6.56
Median 5.30
TP (µ/L)
Max 27.00
Min 5.00
Mean 15.25
Median 14.50
Turbidity (NTU)
Max 22.60
Min 0.68
Mean 6.54
Median 1.43

109
Color (NTU)
Max 50.00
Min 12.00
Mean 33.50
Median 36.00