Embed Size (px)
Citation preview

05Fa c t s

Fact
s

Financial InformationFacts
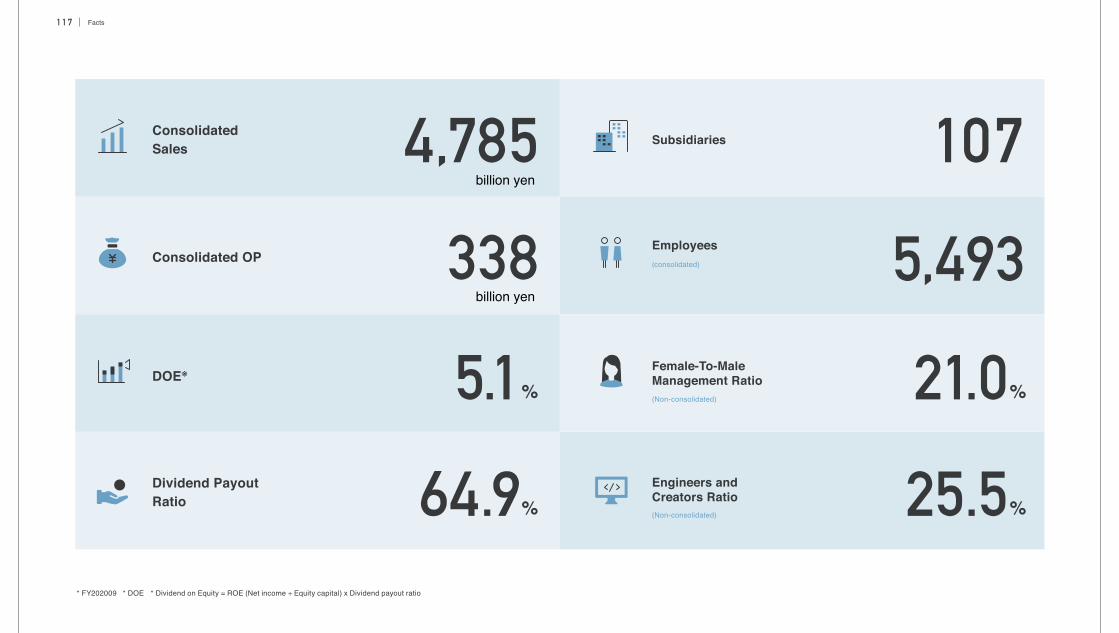
Facts1 1 7
64.9%
338DOE※ 5.1%
4,785billion yen
billion yen
21.0%
25.5%
5,493
107
Dividend PayoutRatio
Consolidated OP
ConsolidatedSales
Female-To-MaleManagement Ratio
Subsidiaries
(Non-consolidated)
Employees(consolidated)
Engineers andCreators Ratio(Non-consolidated)
* FY202009 * DOE * Dividend on Equity = ROE (Net income ÷ Equity capital) x Dividend payout ratio
Financial Information
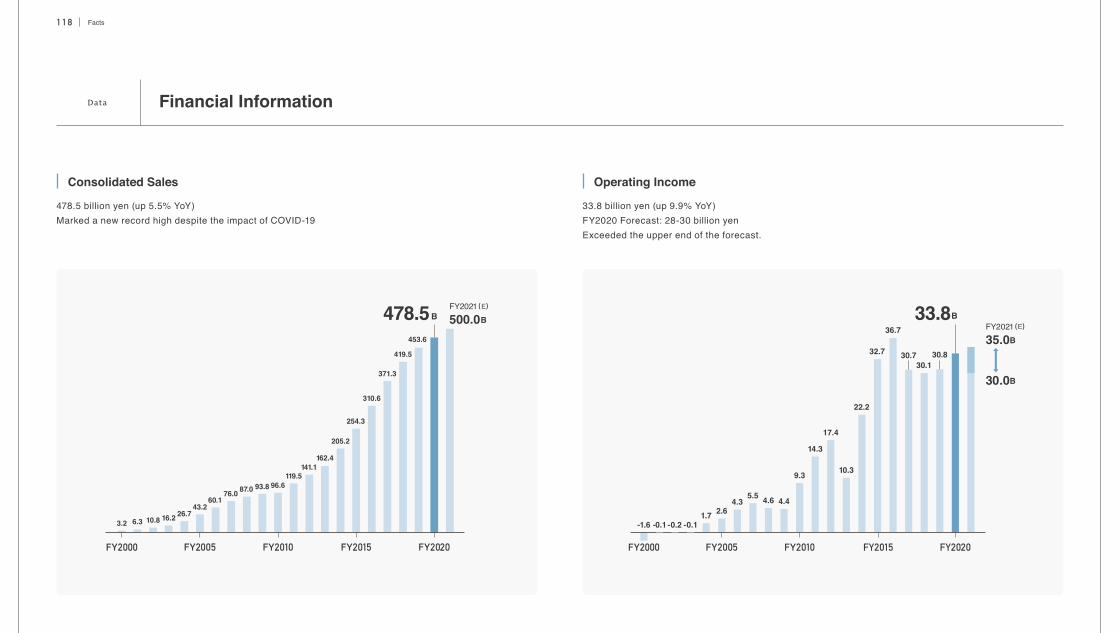
Consolidated Sales
478.5 billion yen (up 5.5% YoY)Marked a new record high despite the impact of COVID-19
Operating Income
33.8 billion yen (up 9.9% YoY)FY2020 Forecast: 28-30 billion yenExceeded the upper end of the forecast.
Facts1 1 8
FY2000 FY2005 FY2010 FY2020
478.5BFY2021(E)
500.0B
3.2 6.3 10.8 16.2 26.743.2
60.176.0 87.0 93.8 96.6
119.5141.1
162.4
205.2
254.3
310.6
371.3
419.5
453.6
FY2015
33.8B
FY2000 FY2005 FY2010 FY2020FY2015
FY2021(E)
35.0B
30.0B
-1.6 -0.1 -0.2 -0.11.7 2.6
4.35.5 4.6 4.4
9.3
14.3
17.4
10.3
22.2
32.7
36.7
30.730.1
30.8
Data
Facts1 1 9
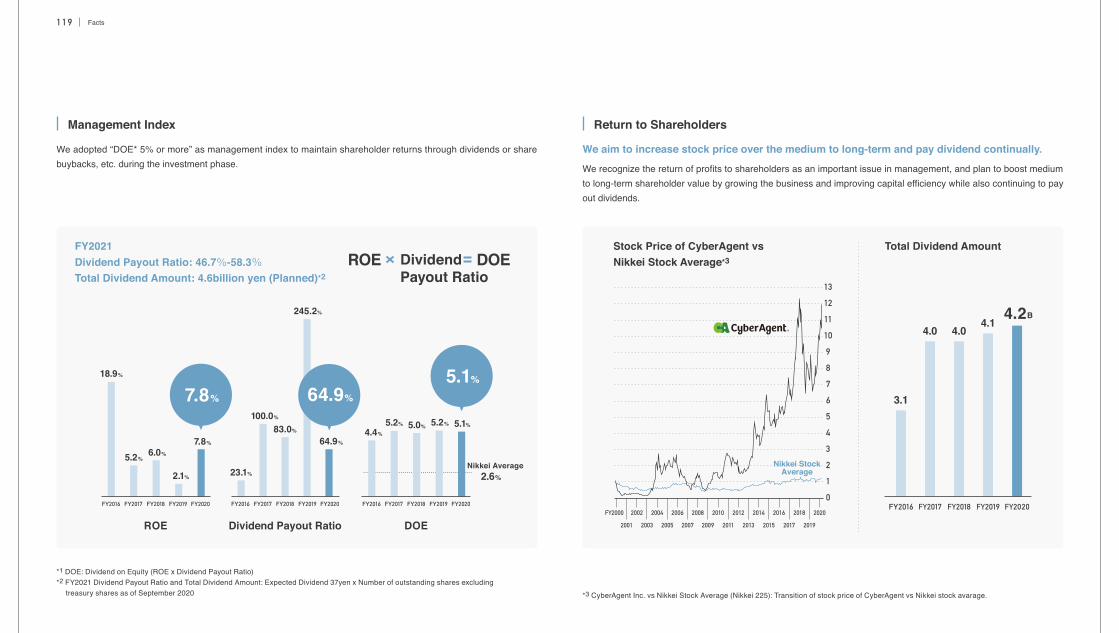
2.6%Nikkei Average
4.4%
5.2% 5.2% 5.1%5.0%
18.9%
5.2%6.0%
2.1%
7.8%
FY2016 FY2017 FY2018 FY2019 FY2020
23.1%
100.0%
83.0%
245.2%
64.9%
FY2016 FY2017 FY2018 FY2019 FY2020 FY2016 FY2017 FY2018 FY2019 FY2020
DOEROE Dividend Payout Ratio
7.8%
5.1%
64.9%
ROE DOEDividendPayout Ratio
FY2021Dividend Payout Ratio: 46.7%-58.3%Total Dividend Amount: 4.6billion yen (Planned)*2
Management Index
We adopted “DOE* 5% or more” as management index to maintain shareholder returns through dividends or share buybacks, etc. during the investment phase.
Return to Shareholders
We recognize the return of profits to shareholders as an important issue in management, and plan to boost medium to long-term shareholder value by growing the business and improving capital efficiency while also continuing to pay out dividends.
Stock Price of CyberAgent vsNikkei Stock Average*3
FY2016 FY2017 FY2018 FY2019 FY2020
3.1
4.0 4.04.1
4.2B
Total Dividend Amount
Nikkei StockAverage
0
1
2
3
4
5
6
7
8
9
10
11
12
13
FY2000 2002 2004 2006 2008 2010 2012 2014 2016 2018 2020
2001 2003 2005 2007 2009 2011 2013 2015 2017 2019
*1 DOE: Dividend on Equity (ROE x Dividend Payout Ratio)*2 FY2021 Dividend Payout Ratio and Total Dividend Amount: Expected Dividend 37yen x Number of outstanding shares excluding treasury shares as of September 2020 *3 CyberAgent Inc. vs Nikkei Stock Average (Nikkei 225): Transition of stock price of CyberAgent vs Nikkei stock avarage.
We aim to increase stock price over the medium to long-term and pay dividend continually.
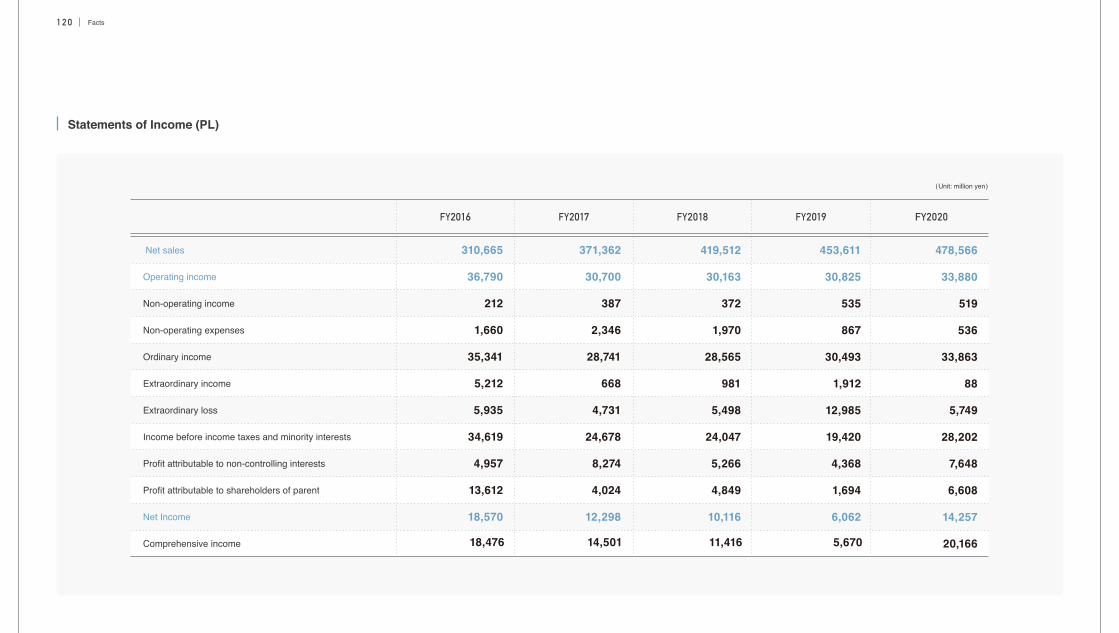
Statements of Income (PL)
Facts1 2 0
(Unit: million yen)
FY2016 FY2017 FY2018 FY2019 FY2020
Net sales
Operating income
Non-operating income
Non-operating expenses
Ordinary income
Extraordinary income
Extraordinary loss
Income before income taxes and minority interests
Profit attributable to non-controlling interests
Profit attributable to shareholders of parent
Net Income
310,665
36,790
212
1,660
35,341
5,212
5,935
34,619
4,957
13,612
18,570
18,476
371,362
30,700
387
2,346
28,741
668
4,731
24,678
8,274
4,024
12,298
14,501
419,512
30,163
372
1,970
28,565
981
5,498
24,047
5,266
4,849
10,116
11,416
453,611
30,825
535
867
30,493
1,912
12,985
19,420
4,368
1,694
6,062
5,670
478,566
33,880
519
536
33,863
88
5,749
28,202
7,648
6,608
14,257
20,166Comprehensive income
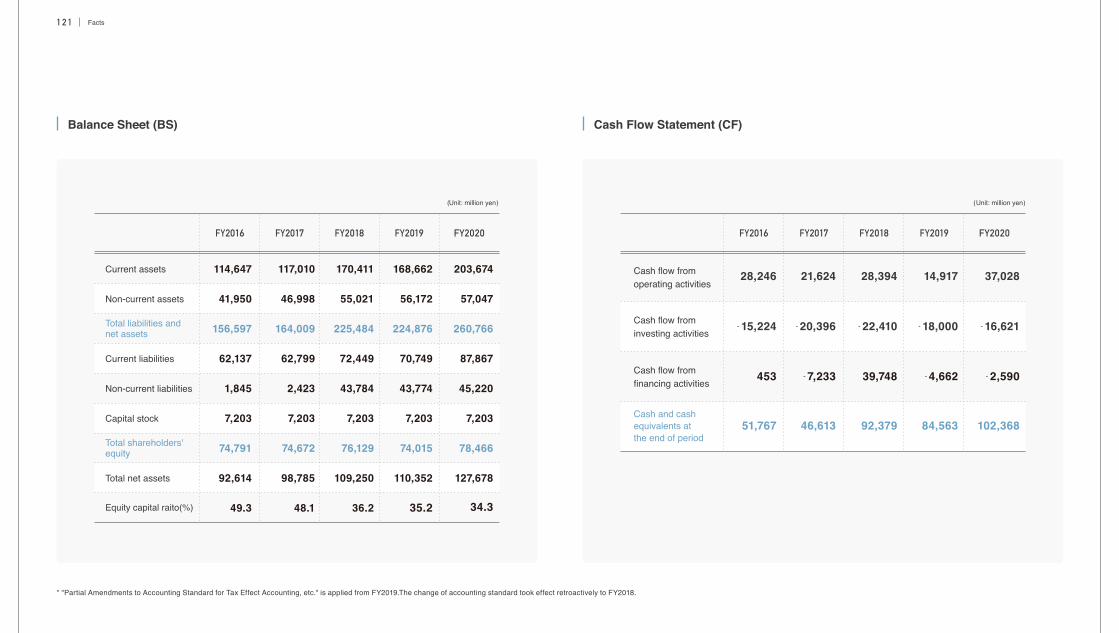
Balance Sheet (BS) Cash Flow Statement (CF)
(Unit: million yen)
FY2016 FY2017 FY2018 FY2019 FY2020
Current assets
Non-current assets
Total liabilities and net assets
Current liabilities
Non-current liabilities
Capital stock
Total shareholders' equity
Total net assets
Equity capital raito(%)
114,647 117,010 170,411 168,662 203,674
41,950 46,998 55,021 56,172 57,047
156,597 164,009 225,484 224,876 260,766
62,137 62,799 72,449 70,749 87,867
1,845 2,423 43,784 43,774 45,220
7,203 7,203 7,203 7,203 7,203
74,791 74,672 76,129 74,015 78,466
92,614 98,785 109,250 110,352 127,678
49.3 48.1 36.2 35.2 34.3
Cash flow fromoperating activities
Cash flow from investing activities
Cash flow from financing activities
Cash and cash equivalents at the end of period
28,246
- 15,224
453
51,767
21,624
- 20,396
- 7,233
46,613
28,394
- 22,410
39,748
92,379
14,917
- 18,000
- 4,662
84,563
37,028
- 16,621
- 2,590
102,368
* "Partial Amendments to Accounting Standard for Tax Effect Accounting, etc." is applied from FY2019.The change of accounting standard took effect retroactively to FY2018.
(Unit: million yen)
FY2016 FY2017 FY2018 FY2019 FY2020
Facts1 2 1
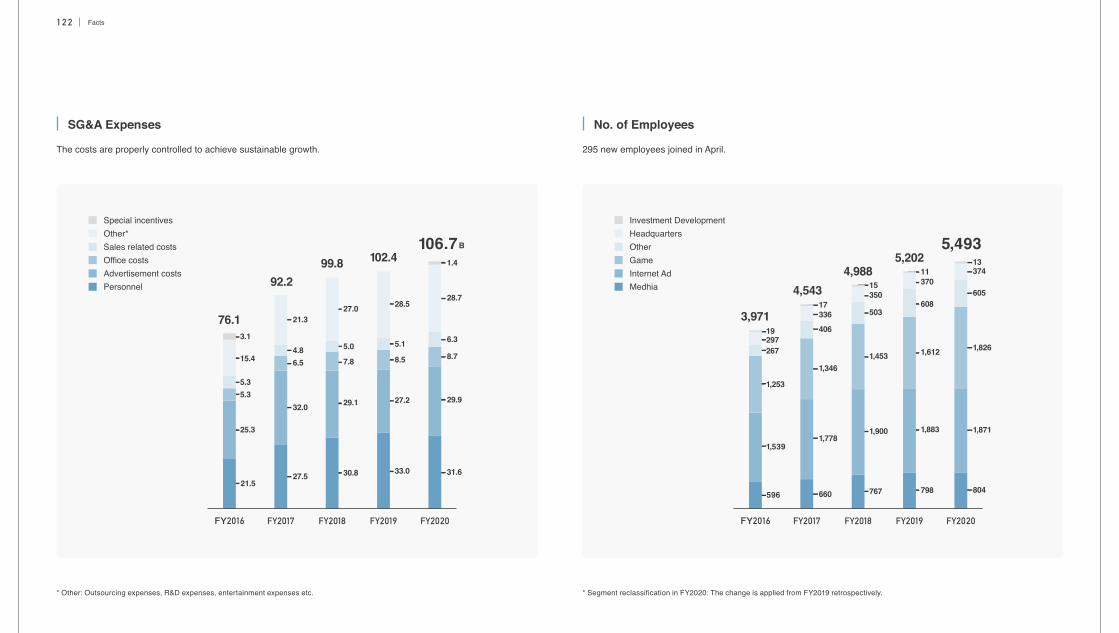
21.5
25.3
5.35.3
15.4
3.1
27.5
32.0
6.54.8
21.327.0
5.0
7.8
29.1
30.8 33.0
27.2
8.5
5.1
28.528.7
1.4
6.3
8.7
29.9
31.6
FY2016 FY2017 FY2018 FY2019 FY2020
92.2
76.1
99.8 102.4106.7B
Special incentivesOther*Sales related costsOffice costsAdvertisement costsPersonnel
Facts1 2 2
SG&A Expenses
The costs are properly controlled to achieve sustainable growth.
No. of Employees
295 new employees joined in April.
* Other: Outsourcing expenses, R&D expenses, entertainment expenses etc. * Segment reclassification in FY2020: The change is applied from FY2019 retrospectively.
596
1,539
1,253
26729719
660
1,778
1,346
406
33617
503
35015
1,453
1,900
767 798
1,883
1,612
37011
608605
37413
1,826
1,871
804
FY2016 FY2017 FY2018 FY2019 FY2020
4,543
3,971
4,9885,202
5,493Investment DevelopmentHeadquartersOtherGameInternet AdMedhia
Facts1 2 3
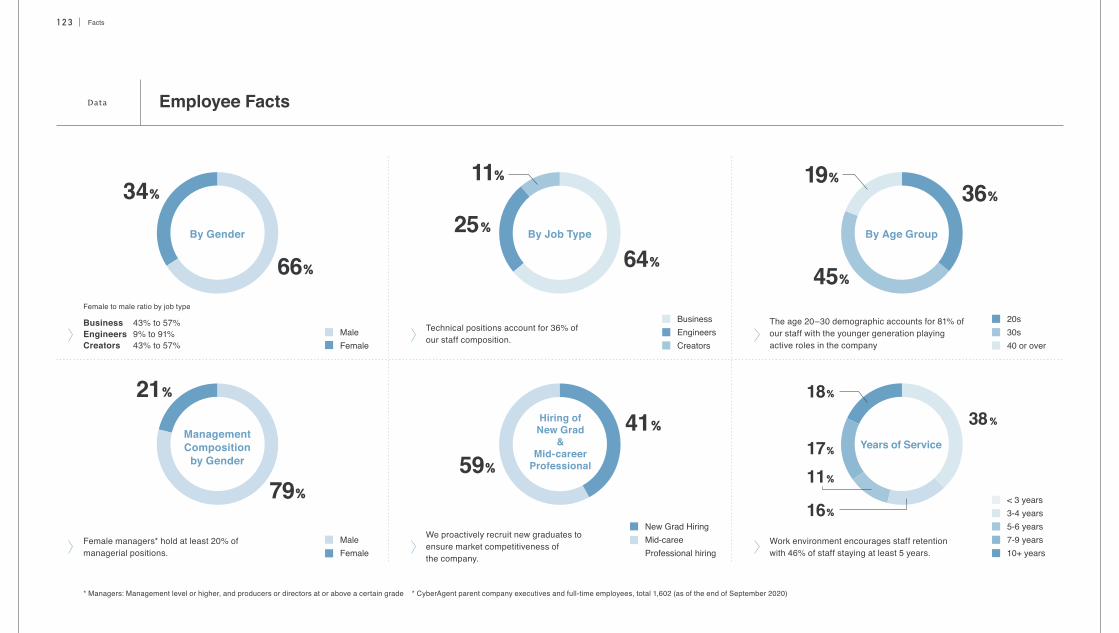
Employee FactsData
* Managers: Management level or higher, and producers or directors at or above a certain grade * CyberAgent parent company executives and full-time employees, total 1,602 (as of the end of September 2020)
BusinessEngineersCreators
20s30s40 or over
MaleFemale
34%
66%
25%
11%
64%45%
19%36%
Female to male ratio by job type
Business 43% to 57%Engineers 9% to 91%Creators 43% to 57%
Technical positions account for 36% of our staff composition.
The age 20–30 demographic accounts for 81% of our staff with the younger generation playing active roles in the company
By Job Type By Age Group
New Grad HiringMid-careeProfessional hiring
MaleFemale
21%
79%59%
41%
16%
11%
38%ManagementComposition
by Gender
Female managers* hold at least 20% of managerial positions.
We proactively recruit new graduates to ensure market competitiveness of the company.
Work environment encourages staff retention with 46% of staff staying at least 5 years.
Hiring ofNew Grad
&Mid-career
Professional
< 3 years3-4 years5-6 years7-9 years10+ years
17%
18%
Years of Service
By Gender
Facts1 2 4
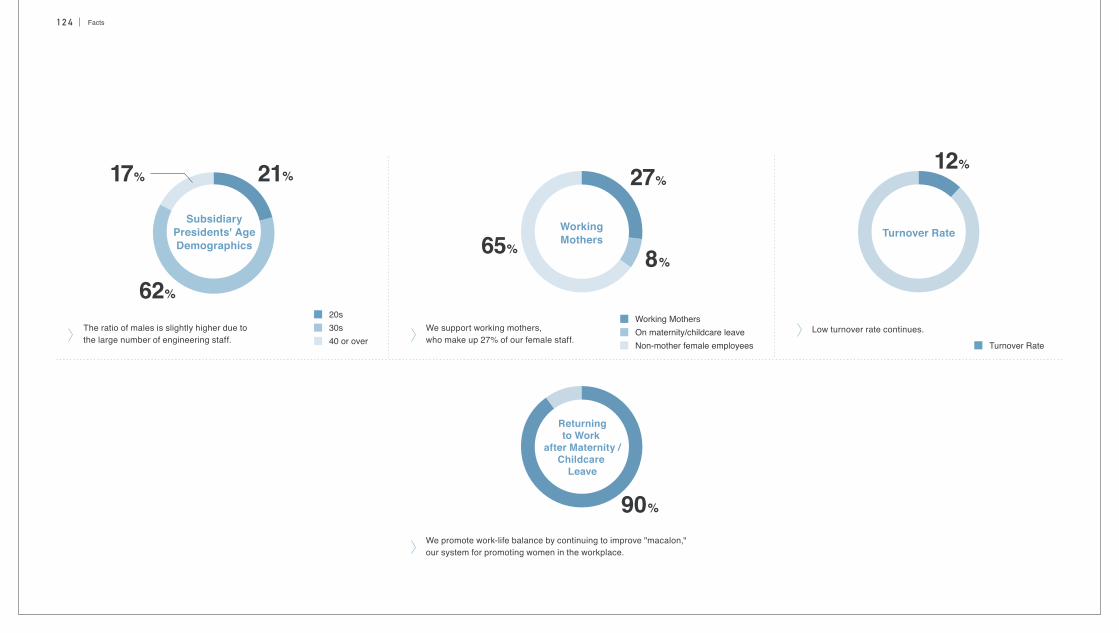
Working MothersOn maternity/childcare leaveNon-mother female employees Turnover Rate
62%
17% 21%
SubsidiaryPresidents' AgeDemographics
We support working mothers, who make up 27% of our female staff.
Low turnover rate continues.
27%
65% 8%
WorkingMothers
12%
We promote work-life balance by continuing to improve "macalon," our system for promoting women in the workplace.
90%
Returningto Work
after Maternity /Childcare
Leave
20s30s40 or over
The ratio of males is slightly higher due to the large number of engineering staff.
Turnover Rate
Company OverviewFacts
Focus on Internet growth markets.
Seize opportunities to enter adjacent markets.
Always keep things FRESH!
Build teams that emphasize character over talent.
Commit ourselves fully to recruitment.
Build an organization that encourages success at all levels; eliminate seniority.
Eliminate the disadvantages of scale.
Be honest when you need help; work together to make things better.
Create an environment that attracts talented, loyal employees.
Holds ourselves to consistently high standards in obeying the law.
Remember that hubris leads to failure.
Risk takers deserve second chances.
Compete creatively.
Always remember that we are Team CyberAgent.
Become a global company by developing Internet services for the world.
Mission Statement
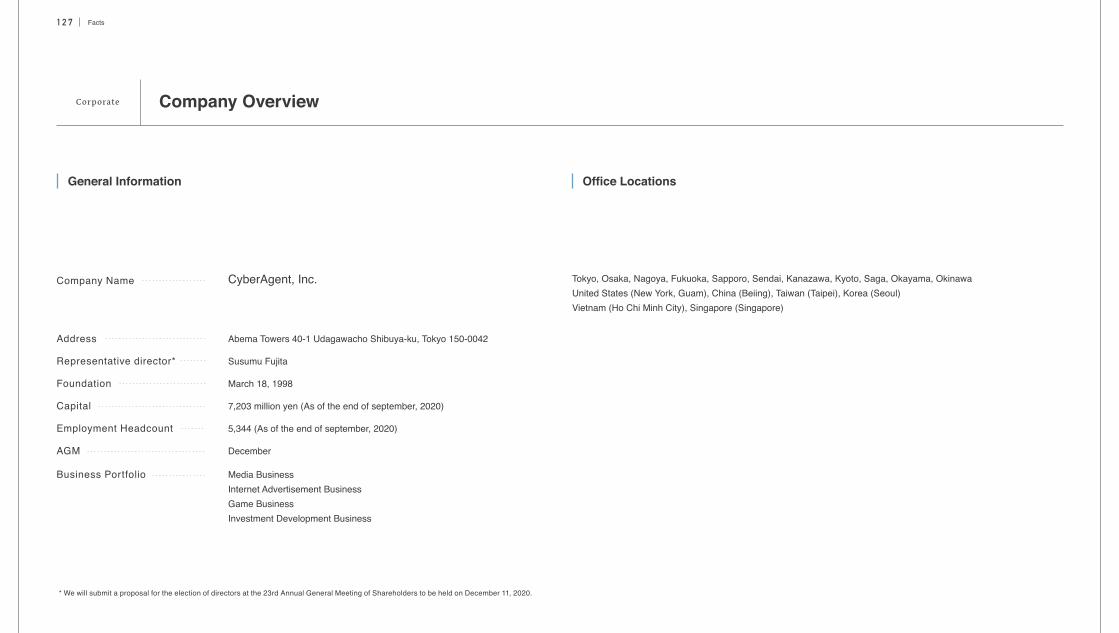
Company Name CyberAgent, Inc.
Address
Representative director*
Foundation
Capital
Employment Headcount
Abema Towers 40-1 Udagawacho Shibuya-ku, Tokyo 150-0042
Susumu Fujita
March 18, 1998
7,203 million yen (As of the end of september, 2020)
5,344 (As of the end of september, 2020)
DecemberAGM
Tokyo, Osaka, Nagoya, Fukuoka, Sapporo, Sendai, Kanazawa, Kyoto, Saga, Okayama, OkinawaUnited States (New York, Guam), China (Beiing), Taiwan (Taipei), Korea (Seoul)Vietnam (Ho Chi Minh City), Singapore (Singapore)
Media BusinessInternet Advertisement BusinessGame BusinessInvestment Development Business
Business Portfolio
Company Overview
General Information Office Locations
Facts1 2 7
* We will submit a proposal for the election of directors at the 23rd Annual General Meeting of Shareholders to be held on December 11, 2020.
Corporate
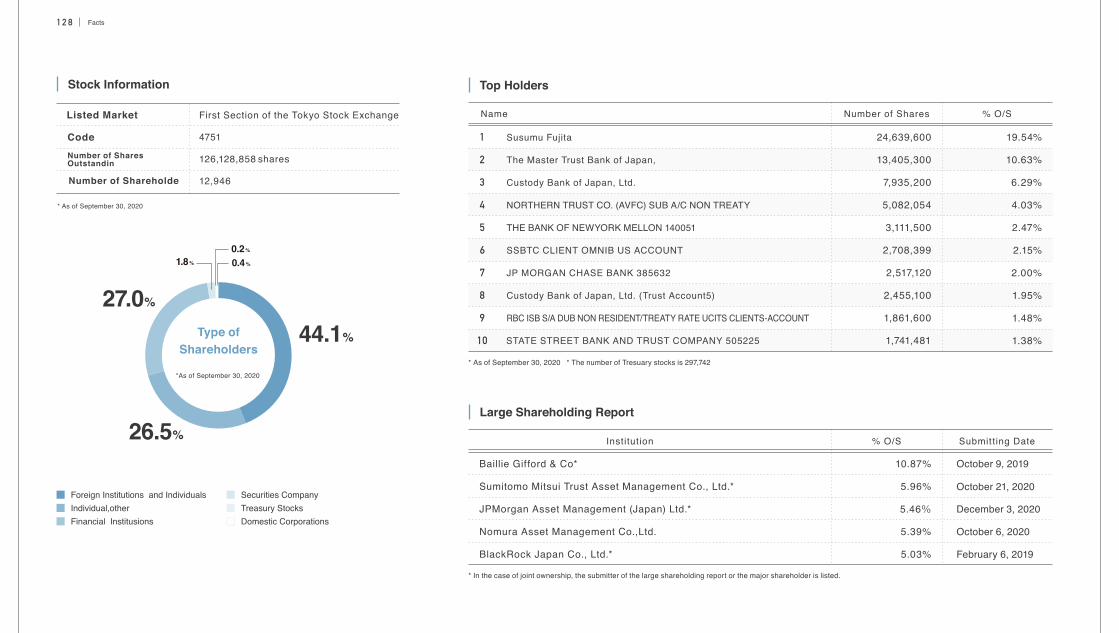
1.8%
0.2%
0.4%
44.1%Type ofShareholders
26.5%
27.0%
Stock Information
Listed Market
Number of Shareholde
Number of Shares Outstandin
Code
First Section of the Tokyo Stock Exchange
4751
126,128,858 shares
12,946
Facts1 2 8
24,639,600
13,405,300
7,935,200
5,082,054
3,111,500
2,708,399
2,517,120
2,455,100
1,861,600
1,741,481
Susumu Fujita
The Master Trust Bank of Japan,
Custody Bank of Japan, Ltd.
NORTHERN TRUST CO. (AVFC) SUB A/C NON TREATY
THE BANK OF NEWYORK MELLON 140051
SSBTC CLIENT OMNIB US ACCOUNT
JP MORGAN CHASE BANK 385632
Custody Bank of Japan, Ltd. (Trust Account5)
RBC ISB S/A DUB NON RESIDENT/TREATY RATE UCITS CLIENTS-ACCOUNT
STATE STREET BANK AND TRUST COMPANY 505225
1
2
3
4
5
6
7
8
9
10
Number of SharesName % O/S
Baillie Gifford & Co*
Sumitomo Mitsui Trust Asset Management Co., Ltd.*
JPMorgan Asset Management (Japan) Ltd.*
Nomura Asset Management Co.,Ltd.
BlackRock Japan Co., Ltd.*
10.87%
5.96%
5.46%
5.39%
5.03%
October 9, 2019
October 21, 2020
December 3, 2020
October 6, 2020
February 6, 2019
Institution % O/S Submit ting Date
* As of September 30, 2020 * The number of Tresuary stocks is 297,742
* As of September 30, 2020
19.54%
10.63%
6.29%
4.03%
2.47%
2.15%
2.00%
1.95%
1.48%
1.38%
Top Holders
Large Shareholding Report
* In the case of joint ownership, the submitter of the large shareholding report or the major shareholder is listed.
Foreign Institutions and IndividualsIndividual,otherFinancial Institusions
Securities CompanyTreasury StocksDomestic Corporations
*As of September 30, 2020
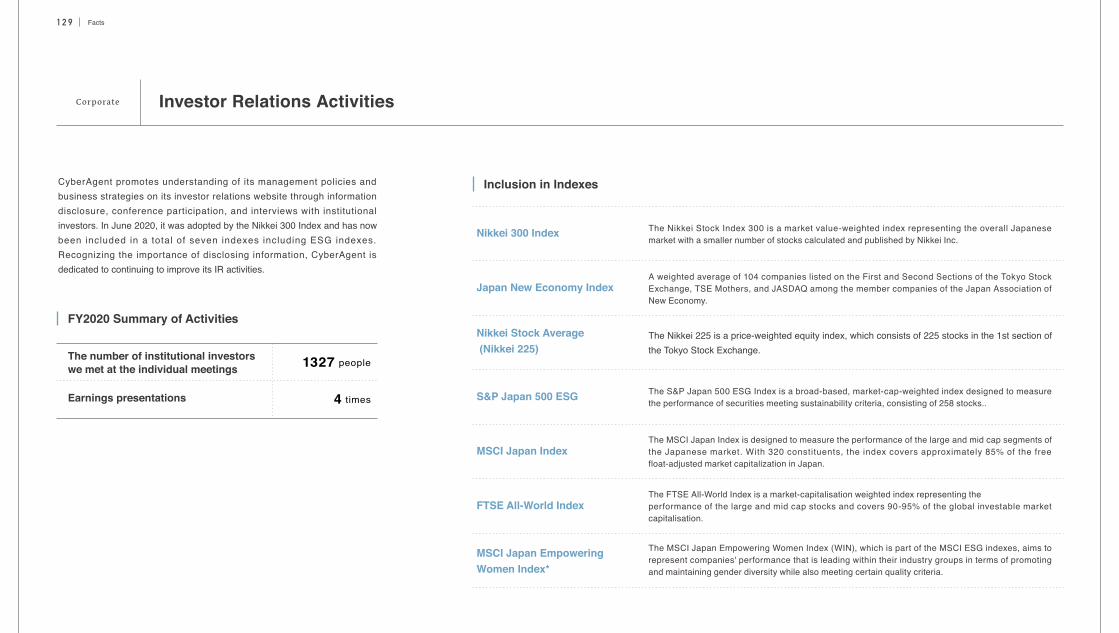
FY2020 Summary of Activities
The number of institutional investors we met at the individual meetings
Earnings presentations
1327 people
4 times
The Nikkei Stock Index 300 is a market value-weighted index representing the overall Japanese market with a smaller number of stocks calculated and published by Nikkei Inc.
A weighted average of 104 companies listed on the First and Second Sections of the Tokyo Stock Exchange, TSE Mothers, and JASDAQ among the member companies of the Japan Association of New Economy.
The MSCI Japan Index is designed to measure the performance of the large and mid cap segments of the Japanese market. With 320 constituents, the index covers approximately 85% of the free float-adjusted market capitalization in Japan.
The Nikkei 225 is a price-weighted equity index, which consists of 225 stocks in the 1st section of the Tokyo Stock Exchange.
The S&P Japan 500 ESG Index is a broad-based, market-cap-weighted index designed to measure the performance of securities meeting sustainability criteria, consisting of 258 stocks..
The FTSE All-World Index is a market-capitalisation weighted index representing theperformance of the large and mid cap stocks and covers 90-95% of the global investable market capitalisation.
Nikkei 300 Index
Japan New Economy Index
MSCI Japan Index
Nikkei Stock Average (Nikkei 225)
S&P Japan 500 ESG
FTSE All-World Index
MSCI Japan EmpoweringWomen Index*
The MSCI Japan Empowering Women Index (WIN), which is part of the MSCI ESG indexes, aims to represent companies' performance that is leading within their industry groups in terms of promoting and maintaining gender diversity while also meeting certain quality criteria.
Investor Relations Activities
Facts1 2 9
Inclusion in IndexesCyberAgent promotes understanding of its management policies and business strategies on its investor relations website through information disclosure, conference participation, and interviews with institutional investors. In June 2020, it was adopted by the Nikkei 300 Index and has now been included in a total of seven indexes including ESG indexes. Recognizing the importance of disclosing information, CyberAgent is dedicated to continuing to improve its IR activities.
Corporate
IR Awards
Facts1 3 0
CyberAgent placed in the top three in seven categories in the Gaming, Internet & Software sector.
MSCI ESG Research provides MSCI ESG Ratings on global public and a few private companies on a scale of AAA (leader) to CCC (laggard), according to exposure to industry-specific ESG risks and the ability to manage those risks relative to peers. As of 2020, CyberAgent received an MSCI ESG Rating of A.
The All-Japan Executive Team 2020by institutional Investor Research
Most Honored Company
Best CEO
Best CFO
Best IR Professional
Best IR Program
Best IR Team
Best ESG
MSCI ESG Ratings - A
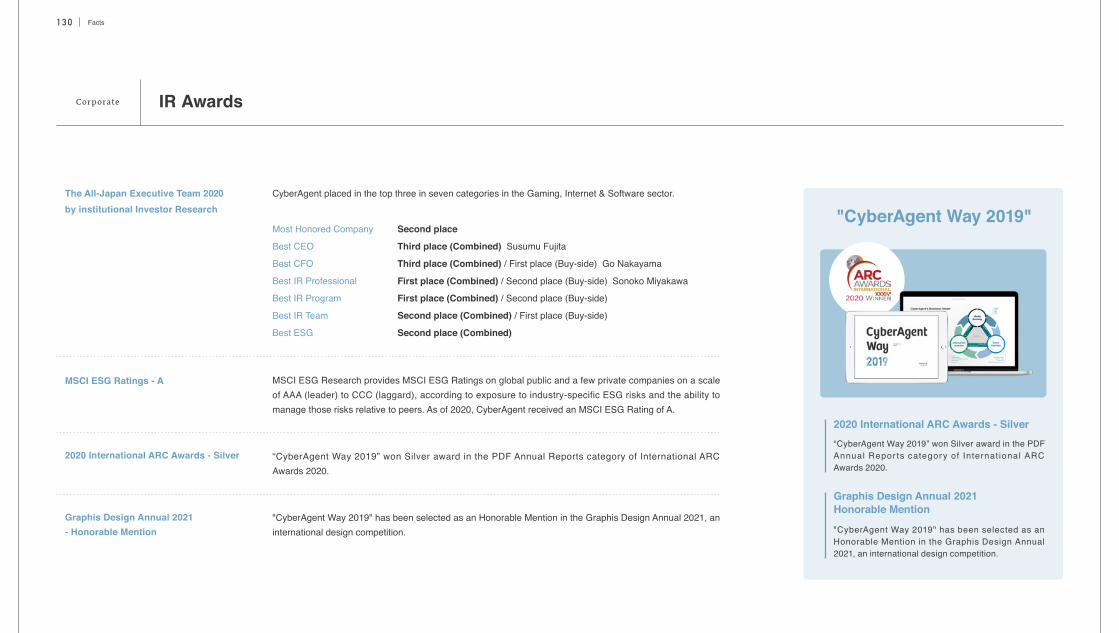
“CyberAgent Way 2019” won Silver award in the PDF Annual Reports category of International ARC Awards 2020.
2020 International ARC Awards - Silver
"CyberAgent Way 2019" has been selected as an Honorable Mention in the Graphis Design Annual 2021, an international design competition.
Graphis Design Annual 2021 - Honorable Mention
Second place
Third place (Combined) Susumu Fujita
Third place (Combined) / First place (Buy-side) Go Nakayama
First place (Combined) / Second place (Buy-side) Sonoko Miyakawa
First place (Combined) / Second place (Buy-side)
Second place (Combined) / First place (Buy-side)
Second place (Combined)
"CyberAgent Way 2019"
2020 International ARC Awards - Silver
Graphis Design Annual 2021Honorable Mention
“CyberAgent Way 2019” won Silver award in the PDF Annual Repor ts category of Internat ional ARC Awards 2020.
"CyberAgent Way 2019" has been selected as an Honorable Mention in the Graphis Design Annual 2021, an international design competition.
Corporate
1 3 1 Facts
Strengthening Communication with our Investor Website
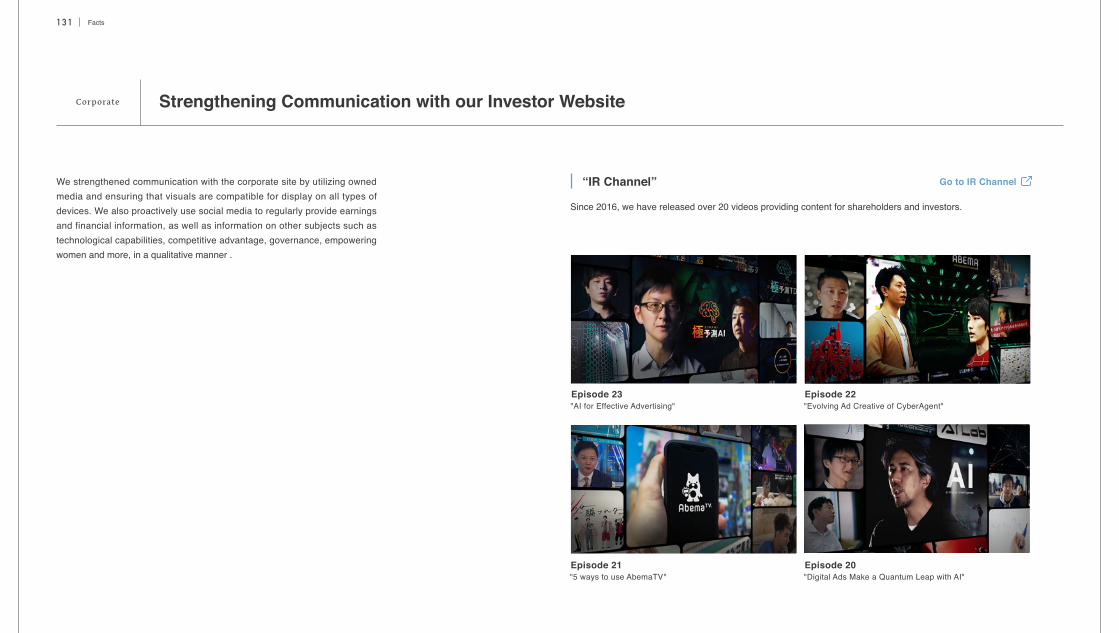
Go to IR Channel“IR Channel”
Since 2016, we have released over 20 videos providing content for shareholders and investors.
Episode 23"AI for Effective Advertising"
Episode 22"Evolving Ad Creative of CyberAgent"
Episode 20"Digital Ads Make a Quantum Leap with AI"
Episode 21"5 ways to use AbemaTV"
We strengthened communication with the corporate site by utilizing owned media and ensuring that visuals are compatible for display on all types of devices. We also proactively use social media to regularly provide earnings and financial information, as well as information on other subjects such as technological capabilities, competitive advantage, governance, empowering women and more, in a qualitative manner .
Corporate
Find us on social media
https://www.facebook.com/CyberAgent-Inc-239078019444837/Facebook
twitter.com/CyberAgent_PRTwitter
youtube.com/c/cyberagentofficialYoutube
@cyberagent_irLINE
Facts1 3 2
twitter.com/susumu_fujitaCEO Susumu Fujita on Twitter
twitter.com/ca_recruit_infoTwitter for HR and recruiting
instagram.com/ca_recruit_info/Instagram for HR and recruiting
Corporate
Disclosure Policy
Facts1 3 3
Basic policy for disclosure Quiet Period
CyberAgent, Inc. ( the "Company") will swiftly provide shareholders and investors with information while emphasizing transparency, fairness. The Company will disclose information under the timely disclosure regulations specified by the Financial Instruments and Exchange Act and the Tokyo Stock Exchange. Simultaneously, the Company provides prompt and proactive disclosure of material information that is not subject to the timely disclosure regulations, which could influence investors' investment decisions.
Method for disclosing information
According to the rules, the Company discloses the information subject to the timely disclosure regulations on the Tokyo Stock Exchange website through the timely disclosure network (TDnet). The released information, as well as the information that is not subject to the timely disclosure regulations will be uploaded to the Company's investor relations website to inform investors accurately and equally.
We may provide earnings forecasts in addition to the earnings forecasts we file with the Tokyo Stock Exchange, where we are listed. Also, news releases, earnings presentations, question-and-answer sessions at analyst meetings, etc., may contain information about our plans, prospects, strategies, etc. The information the Company publishes is based upon the currently available information, which involves risks and uncertainties. There can be no assurance that forward-looking statements will prove accurate or achieved, as actual results may differ materially from those anticipated in such statements.
In order to prevent the leakage of important corporate information and ensure fairness, we have a quiet period "from two weeks before the end of the fiscal quarter to the earnings release day" as a general rule. In this period, the Company refrains from answering questions regarding our results and giving relevant comments. However, this does not apply to the occurrence of material events that we believe will have a significant impact on the investment decisions of investors, even during this period.
Forward-looking statement
Corporate
Investor Inquiries
Download Fact Sheet Excel
Contact
IR&SR Division, CyberAgent, Inc.