Embed Size (px)
Citation preview
Cycle Atlanta and OneBusAway: Driving innovation through the data ecosystems of civic computing
Christopher A. Le Dantec1, Kari E. Watkins2, Russ Clark3, Elizabeth Mynatt3
1 School of Literature, Media, & Communication; 2 School of Civil and Environmental Engineering;
3 Institute for People and Technology; Georgia Institute of Technology, Atlanta Georgia, USA.
[email protected], [email protected], [email protected], [email protected]
Abstract. Smart cities and digital democracy have begun to converge around mobile computing, enabling, web services, and different operational and shared databases to create new opportunities for civic engagement for concerned citi-zens as well as new efficiencies for public services provided by local govern-ment. While many of these projects remain siloed to specific departments of lo-cal government, when viewed in aggregate, they begin to fill in a more complex picture of how piecemeal projects are changing the relationship between local government and the public. As an example of this change, we describe our partnership with multiple city and regional agencies in Atlanta. We discuss a pair of projects that together, aim to transform Atlanta’s transportation system by more effectively connecting the public to transportation services and to the processes of infrastructure planning. The projects we present here—Cycle At-lanta and OneBusAway—are part of a larger civic computing agenda where models of digital democracy and smart cities combine to create a data ecosys-tem where citizens produce and consume different forms of data to enable bet-ter infrastructure planning and to enhance alternative modes of transportation.
Keywords: Digital Democracy, Smart Cities, Civic Computing, Urban Infor-matics
1 Introduction
Computing research into the role of technology in supporting citizens and government goes back decades [18, 19, 31, 33]. Within that legacy, researchers have looked at applying computing in different social [20, 23, 41], community [6, 29, 31], and politi-cal contexts [12, 18, 19]. Many of these earlier systems and experiments focused on the ways in which computing technology helped communities engage with each other in democratic discourse. These earlier systems have two main characteristics in com-mon: first, they were based on supporting communities through strengthening social ties and building social capital to contend with local issues [13, 31]; second, they drew on a strong connection between online activity and local physical community—a critical component that Carrol argues has been ignored in more recent research [5].
In contrast to these early examples that focused on social ties and place, the past five years have seen the emergence of a new form of technology-mediated public participation where the systems are not discursive, but instead rely on sensing and data collection as the primary mode of interaction. Examples of this class of system range from platforms and systems like SeeClickFix (www.seeclickfix.com), Public-Stuff (www.publicstuff.com), and Street Bump (www.streetbump.org), which each enable the public to submit data about urban conditions; to projects like Seattle in Progress (www.seattleinprogress.com) or the Atlanta Infrastructure Map (http://www.infrastructuremap.org) which present to the public data from land use offices and infrastructure planning departments. This broad category of data-based ways of integrating local government and institutions with the public relies on the production and exchange of data between the two.
In the context of Atlanta, multiple city and regional agencies have partnered with Georgia Tech to develop a robust pair of projects that aim to transform the city’s transportation system by more effectively connecting the public to transportation services and the processes of infrastructure planning. The projects we present here—Cycle Atlanta and OneBusAway—are part of a larger civic computing agenda where models of digital democracy and smart cities come together to create a data ecosystem where citizens produce and consume different forms of data to enable better infra-structure planning and to enhance alternative modes of transportation.
2 App-Driven Civic Computing: Smart Cities, Smart Citizens
The move toward app- and data-driven modes of civic computing is closely tied to two larger movements: first is the emerging trends in smart cities where urban opera-tions are driven by data generated through sensor networks [26, 39], instrumented infrastructure [8, 28] and participatory sensing [7, 32]; second, the ongoing move toward digital democracy where the internet and mobile computing create opportuni-ties to augment face-to-face democratic processes with asynchronous means of partic-ipation [14]. These two movements complement the notion that mobile apps and data-driven practices can have a transformative effect both on the efficacy with which public policy and operations decisions are made within an urban area and on the expe-rience that citizens have of the city as they make use of services and infrastructures. In particular, it enables new ways of participating in civic processes mediated by technology, creating new kinds of democratization in determining how those process-es are accessed and enacted [15].
One domain where these different elements come together is through urban trans-portation, where cities and citizens desire more sustainable transportation networks. Our current auto-oriented transportation system is implicated in numerous issues of health and sustainability [37]: for example, the transportation sector accounts for 27% of greenhouse gas end-use emissions, 43% of which is due to the travel of passenger cars [38]; moreover, the reliance on cars compounds the ill affects of a sedentary lifestyle as the risk of obesity increases 6% with every additional hour spent commut-ing in a car [10].
The deleterious consequences on personal and environmental health and the com-bination of the social awareness occurring within the demographic groups moving into urban centers creates an opportunity for specifically addressing issues in trans-portation. These opportunities combine the political will to develop attractive urban centers and to develop the technical strategies of smart city programs and new models of digital democracy and participatory planning to create a collaborative ecosystem of government, citizens, and data.
The apps that we have created in partnership with agencies in metropolitan Atlanta aim to improve access to existing transportation services and to enable new forms of participation in the public process of developing future transportation infrastructures in the city. Taken together, these projects begin to address the instrumental challenges of developing a working data ecology that supports both institutional and individual decision making through the production, exchange, and consumption of different forms of data. Importantly, this ecology is self-reinforcing where data produced and shared with other nodes in the system create feedback loops that help refine further data production, sharing, and use.
3 Civic Data Ecosystems
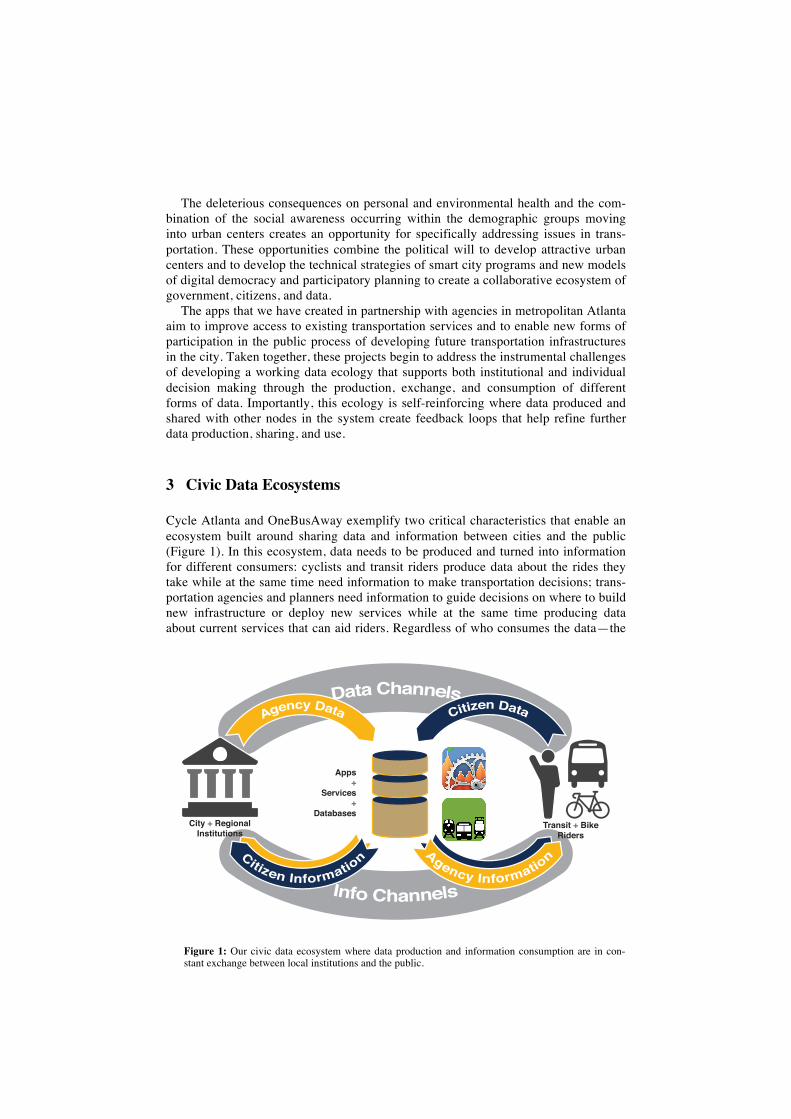
Cycle Atlanta and OneBusAway exemplify two critical characteristics that enable an ecosystem built around sharing data and information between cities and the public (Figure 1). In this ecosystem, data needs to be produced and turned into information for different consumers: cyclists and transit riders produce data about the rides they take while at the same time need information to make transportation decisions; trans-portation agencies and planners need information to guide decisions on where to build new infrastructure or deploy new services while at the same time producing data about current services that can aid riders. Regardless of who consumes the data—the
Figure 1: Our civic data ecosystem where data production and information consumption are in con-stant exchange between local institutions and the public.
Info Channels
Data ChannelsCitizen DataAgency Data
Agency Informatio
nCitizen Information
Apps+
Services+
DatabasesCity + Regional
InstitutionsTransit + Bike
Riders
transit-using public or transit agencies’ employees and city planners—sustainable transportation choices require data production and information sharing.
Key to the data ecosystem we are describing here is that the data neither exist pure-ly in the hands of the public nor purely in the hands of transit agencies. Each endpoint produces data, some of which is useful as information to external consumers and some of which is useful as information in a direct feedback loop. In both cases, a feedback mechanism enables data streams to lead to information for consumption, planning, and action: Cycle Atlanta provides a new data source for the city by collect-ing data from cyclists who provide the city with information about the routes they do and do not take as well as issues they encountered en route (potholes, traffic signals that don’t turn green, parking in bike lanes); OneBusAway enables a new data source for transit riders by aggregating data from regional transit agencies and providing users a single point of access for real-time bus and train arrival information.
These two projects create a set of opportunities to broaden access to data and to in-formation with important implications on how decisions are made, who participates, and how that participation is translated more broadly into transit network and infra-structure changes. At the same time, these projects help shed light onto the kinds tensions and trade-offs requiring immediate negotiation between the notion of data production as a form of ground-truth measurement and data production as a form of public participation. The former is often assumed to reflect the state of the world—the location of buses and time of arrival—while the latter is bound up with issue advoca-cy and subjective experience.
3.1 Cycle Atlanta: Configuring Participation through Data Collection Cycle Atlanta (cycleatlanta.org) was launched in October 2012 and uses the geo-locative capabilities of smartphones to record and upload cycling routes. Each record-ed route provides a record of how the cyclist navigated the city, including the purpose of the ride and any rider-added notes. The app also includes the ability to record spe-cific locations with photos and text descriptions and collects optional demographic data including a self-assessment of cycling ability, cycling history, and current cy-cling frequency as indicators of comfort level to aid analysis.
As described above, Cycle Atlanta bridges the domains of digital democracy and smart cities by creating a platform for cyclists to influence policy making through data production. Much in the way the vision of digital democracy decouples demo-cratic participation from the requirements of in-person participation, when cyclists record a ride, they are contributing to the planning process without having to attend a public meeting. To illustrate this, following the initial launch of the app, over 1500 cyclists have contributed (and continue to contribute) data about their daily rides through the app. In contrast, during the same period, less than 50 people turned up at public hearings related to the same project to discuss and advocate for particular bike facilities.
Asynchronous public participation enabled by the app allows more people to pro-vide input into the planning process, solving one of the ongoing challenges in urban planning by removing the constraint of attending public meetings in order to move toward broad and substantial public participation. However, while the app lead to a difference in quantities of participation, it also created a difference in kind of partici-
pation: by recording their rides and sharing that data with city planners, Atlanta cy-clists enacted a new form of civic participation accomplished through their collected data. These data are not just a metric of cycling traffic patterns, but are a form of public advocacy that changes how cyclists interact with local policy making. These changes span the individual experience and personal contribution of a single cyclist and ways in which cyclists collectively and strategically advocate for change. By turning public participation into a data-driven activity, the work to collect the data, the visibility of the collected data, and the sense-making needed with the data all need to account not just for messiness, subjectivity, and bias, but for the intentional acts of the individuals behind the data collection.
3.1.1 Interpreting Data Production for Planning Since the app and the data collected were meant to be a component of, and alternative to, the public meeting, then we need to look more carefully at the patterns of use in order to respond constructively to individual contributions and aggregate trends. In a simple analysis, we looked at one key characteristic from the data set: how often users recorded rides along the same route. Using this metric, two categories were instruc-tive for describing the patterns of use through the app: the first is what we call casual users—people who recorded fewer than 5 repeated rides (a repeated ride was one where the cyclist traveled the same route); the second group, habitual users was de-fined as those who recorded particular routes more than 5 times. The bulk of our app user base fell into the casual user category (88% of the user population) but this group produced less than two-thirds of the data (64%).
In contrast, the habitual users contributed a disproportionate amount of data. Even though they were a substantial minority in the overall pool of app users (12%), their over-representation in the data set meant routes they cared about were much more visible. This disparity was particularly exaggerated at the high end of the habitual user pool where a handful of riders were contributing 30 times more data than the casual users. When viewed in aggregate, this meant the routes preferred by specific individ-uals were demonstrably more visible when the data were mapped, creating an ambig-uous resource for planners using the data in their analysis [22].
3.1.2 Data Production and Community Benefits As a material practice, the collection of ride data by cyclists represents different ways of knowing about the city, ways that are configured by the smartphone and features of the app deployed to record rides. Recorded routes only show the road taken, not the road preferred; route choice analysis is limited to a delta between the recorded route and an optimal route model (e.g., one based on geography, traffic speed and density, total distance, or proximity to existing cycling infrastructure or amenities); and differ-entiating between habitual users of the app and those whose use was infrequent cre-ates incompatibilities in how popular routes are identified and interpreted.
Taking the position that data produced by cyclists in the city leads to knowledge to guide the development of new infrastructure imposes trade-offs about what data to excise and under what conditions. On the other hand, a starting position that the data result from ways of knowing about the city produces a different set of trade-offs. This shift introduces new ways to circulate the cycling route data in the ecosystem of cy-
clists and planners. The knowledge and advocacy represented in the data provides a resource for planners seeking to tap into local expertise and tacit knowledge and for cyclists who can share their experiences on how best to navigate the city. The app creates a kind of cycling infrastructure that is not realized through street-striping or buffered bike lanes, but through an ecosystem of data and information flows that enables new forms of action and new opportunities for shared knowledge.
3.2 OneBusAway: Configuring Participation through Data Sharing In contrast to the data-production focus of Cycle Atlanta, OneBusAway (http://onebusaway.org) is a set of information tools that provide access to real-time arrival predictions and other transit information for a city’s bus and train network. OneBusAway (OBA) was originally co-developed by researchers (including the co-author) at the University of Washington in an effort to bring expertise in computing and transportation system together in order to improve the transit system for the riding public [9]. The OBA app is available on a full range of platforms, including native applications on the iPhone, Android, and Windows Phone, a website, a short-messaging service (SMS), and an Interactive Voice Recognition (IVR) system; it also drives a number of large public displays in store windows near busy transit stops.
Following the success of OBA in Puget Sound (Seattle), other regions began to ex-press interest in replicating the program in their local community. Acting on an op-portunity to link a number of geographically-diverse regions with similar goals in the area of sustainability, the OBA project has grown into a diverse nation-wide commu-nity that includes representation from academia, transit agencies, industry, and inde-pendent developers. This community has supported the expansion of the project to become a multi-region platform that easily allows the integration of new cities—including Seattle, Tampa, Atlanta, and New York City [1]—and which has enabled new services like the “TextMyBus” service launched in Detroit. Altogether, OBA now serves over 400,000 unique weekly across the country.
3.2.1 Agency Accountability and Open Data for Developers For real-time transit applications such as OBA to function, they must have access to data provided by the transit agencies. In some cases, transit agencies create rider in-formation applications in-house or contract with vendors to create such applications. Over the past decade, many transit agencies have begun to publish their schedule data online for public consumption, and in recent years, this online data has transitioned to using standardized data formats such as the General Transit Feed Specification (GTFS) to allow third-party developers to create their own applications that consume the data. At the same time, agencies have also begun to include transit vehicle loca-tion and real-time station and stop arrival predictions among the data. This “open data” approach follows a national trend among public agencies in multiple sectors to improve transparency and invite broader participation in the design of citizen ser-vices. In his May 9, 2013 executive order, “Making Open and Machine Readable the New Default for Government Information”, President Obama begins that “Openness in government strengthens our democracy, promotes the delivery of efficient and effective services to the public, and contributes to economic growth. As one vital benefit of open government, making information resources easy to find, accessible,
and usable can fuel entrepreneurship, innovation, and scientific discovery that im-proves Americans' lives and contributes significantly to job creation.”
As of 2012, there were no transit agencies in Georgia with open data and no source of real-time transit information (RTI) in the region, putting Atlanta behind the nation-al trend toward providing open schedule data [43]. Unlike other cities where OBA was deployed, Atlanta did not have a large crossover between transit riders and tech-nology advocates, therefore the transit agencies in the region had not yet been con-fronted with the idea of providing a higher-level of information to riders or of having third-party developers interested in working with their data. This created a num-ber of early hurdles to overcome, including demonstrating the benefit of RTI systems to ridership, aggregating data from the regional transit system, and creating a conver-sation across the regional transit agencies about the importance of sharing data with the public.
This last point was the most important as the status quo had been to keep transit system data private, which prevented the transit agencies from participating in a civic data ecosystem—to the detriment of area transit riders, and to the detriment of more effective management of services by the transit agencies. Concurrent with the de-ployment of OBA in Atlanta, MARTA, the city’s core transit agency, also released an RTI app of their own, thus validating the need for better transit information in the region. OBA still serves as the regional RTI aggregator.!
3.2.2 Changing Travel Behavior through Information The underlying goal of OBA is to make it easier for riders to use public transportation and thereby increase rider satisfaction. As opposed to driving or cycling, transit riders are sacrificing a certain amount of control over their trip and they must trust that the vehicle will arrive and in a timely manner. Studies of transit riders using RTI have found many benefits, including increased perception of personal security and in-creased satisfaction with transit service [9, 11, 44]. With regard to wait times, a study of perceived and actual wait times found that riders without RTI, perceived their wait time as greater than the measured wait time while the perceived waiting for riders with RTI more closely matched measured time [42]. In addition, mobile RTI users in the study were observed to wait almost 2 minutes less per trip than those arriving using traditional schedule information.
Furthermore, Carrel et al. showed that riders will adapt to unreliable service by choosing alternative transit service [4]. Studies in Seattle and Tampa showed that riders self-report an increase in trips, particularly in the off-peak, a beneficial result since the transit system will have additional capacity at that point [2, 9]. Two recent studies of riders in Chicago and New York showed that real-time information can increase transit ridership by approximately 1.8-2.2% [3, 36].
Often, one of the limitations of data returned to transit agencies from surveys is that it is not possible to track rider behavior change with any fidelity: only gross ag-gregate trends can be examined. We had an opportunity to address this limitation in our own project because Atlanta was one of the few cities in the US that had imple-mented a contactless smart card ticketing system prior to deploying RTI. This enabled us to examine changes in trip-making patterns using smart card data. In order to un-
derstand which smart card users were also real-time users, a short online survey was conducted in which respondents were asked about their use of RTI and for their unique 16-digit smart card ID number. The smart card ID number was then used to link the survey response to the corresponding smart card trip history; and this joint smart card/survey dataset allowed for a disaggregate before-after analysis of transit trips in which users of RTI were compared with non-users.
By linking these data together, transit agencies and planners in Atlanta have a new tool at their disposal to better understand how ride habits change once robust RTI options have been deployed. Even though the RTI systems in Atlanta is still relatively recent, making the impact on overall ridership more difficult to discern, the kinds of data that are present within the civic data ecosystem give Atlanta transit agencies deeper insight into how people respond to such systems so they can tailor the features and locations of their RTI systems to create opportunities for infrequent riders to consider transit alternatives.
3.2.3 Understanding Transit Rider Preferences and Desires OBA, and other similar transit apps, provide information from the transit agency to the riders. However, data can also feed from one rider to another or can be used by planners and engineers working on behalf of the city and regional agencies to under-stand the travel patterns of riders and to gain valuable feedback directly from riders as they experience the system.
One example of how transit riders can provide information to one another through such a system is Carnegie Mellon’s Tiramisu Transit [35, 45]. In the absence of automated vehicle location (AVL) data to identify where transit vehicles were located in real-time, the developers created a smartphone application to allow riders to self-identify their location as they board a bus. Tiramisu also provided an option for the rider to indicate problems, positive experiences, suggestions, and other data, such as the level of fullness of the bus, which aids people with disabilities to choose the bus they want to access. Although many transit systems now have AVL, the addition-al crowdsourcing of data such as vehicle fullness may supplement instrumentation.
Similarly, OBA has a feature wherein a user can submit feedback that a bus or train did not arrive as predicted. Such a feature was particularly useful when King County Metro in Seattle was transitioning from one AVL system to another and errors were widespread. The precise time and location of the error is automatically reported by the system and with only a simple categorization of the error experienced, the rider can report the information. This allows the agency to take advantage of the ubiquitous presence of riders to aid in final testing of a system [11]. With a good relationship and data transfer capabilities between smartphone application developers and the transit agency, these feedback systems can go beyond just errors with the real-time infor-mation being presented to the rider to incorporate general feedback on the system as a whole, enabling riders to comment about the service or pieces of infrastructure (dirty bus, graffiti) they experience.
Within Atlanta, we are using OBA as a testbed to assess how riders would like to receive transit information, including how riders execute a frequent trip, an infrequent trip, and a new trip by seeking out information about routes, schedules and on-time arrival information. We are assessing how frequent bus or rail service must be for
riders to adapt to having no schedule if RTI information is available, thus freeing agencies to operate transit services in real-time with buffers to meet a schedule. A substantial component of this work is using the transit trip planning tools and loca-tion-based smartphone applications to collect data from the rider to allow agencies to observe when and where people are trying to travel. For example, visualizations of OBA in Seattle show where riders are accessing the app [27], and with a large enough percentage of the system ridership using the app, begin to paint a picture of travel patterns throughout the day. These data can be merged with data provided by Google, transit agencies, and developers, to understand desired trips, even if those trips are not executed on transit.
4 Conclusion
As technology is used to create and mediate forms of civic engagement, we need to attend to how the affordances of those technologies support (or discourage) different kinds of democratic participation. van Dijk uses a combination of models of democra-cy, models of communication, and models of social interaction to begin to scaffold a robust theoretical basis for understanding digital democracy [40]. The point is that different technology interventions have different communication and interaction af-fordances [25], and those affordances enable or impede the means and the ends of civic computing systems designed to support the functioning of local government.
In the examples presented in this paper, the differences between a city government equipping its citizens with smartphone apps to record their bike rides, or an infor-mation sharing platform to improve the access to and quality of transportation system information both require different levels of direct and directed participation. These technologies change the nature of transparency, of fairness, and of representation through new tools for data production in public processes meant to enable citizen participation in planning policy development; they also change access to service in-formation, making data available to improve bus system use through a more informed and better supported riding public.
In both cases, the aim is neither to blindly embrace technology as a solution for en-gaging in civic participation [34], nor is it to dismiss altogether the possibility for positive change when deploying mobile and social computing to mediate how we work together as communities [24]. Instead, the aim is to take deliberate steps to understand both how technology can be taken up in the hands of motivated and con-cerned citizens and, when that occurs, how local institutions and processes need to evolve in the face of these new civic data ecosystems.
One of the challenges in these civic data ecosystems is that the combination of da-ta, and the agency and intent exercised through the act of their collection exist in a world where issue advocacy still normally occurs in public fora—through council meetings, neighborhood association meetings, or a range of locally developed pro-cesses that are in place to both solicit specific feedback regarding governance and urban planning [16]. Indeed, the notion of digital democracy is to augment those in-person processes with technology tools rather than replace them outright [14]. How-ever, by shifting civic engagement from a synchronous experience of advocacy via
discourse in public fora to an asynchronous experience where advocacy occurs via collected data, we dramatically change the conditions of public participation and introduce new forms of argumentation into the milieu.
Just as van Dijk enumerated how the affordances of different systems amplify and impede different democratic ends [40], the affordances of the smartphones and the particular design choices made in two transportation apps discussed here come with inherent limitations on how the public participates. By focusing exclusively on mobile interactions, these systems privilege data collection and as a consequence, impede alternate forms of providing feedback and input: if cyclists or transit riders are not participating in the civic data ecosystem then they become less visible to governing institutions and less able to act in response to new data and information flows enabled by this ecosystem.
At a minimum, addressing the challenges of broadening public involvement through data-based civic participation means engaging with the epistemic questions bound up in data as a form of participation. We need to be able to account for data production [17, 30], attending to the ways the data often convey authority divorced from the agency motivating their production [22]. Building up new practices of civic participation could be accomplished by attending to two theoretical and practical areas: first, addressing the challenge of linking individual acts of data production through person devices to forms of collective action, thereby supporting the formation of publics around a shared set of issues [20, 21]; second, examining the practices that emerge around app use and participation in digital modes of civic participation so that expectations for impact and relevancy are met with appropriate feedback mechanisms to help sustain participation over time. Ultimately, meaningful public participation is an expression of agency, of expertise, of tacit knowledge, and of individual and com-munity identity. As we continue to develop and broaden the scope of civic data eco-systems, we need to attend to these attributes and seek productive partnerships be-tween citizens, institutions, and the technologies upon which they increasingly rely
References
1.! Barbeau, S.J., Borning, A., and Watkins, K. OneBusAway Multi-Region—Rapidly Expand-ing Mobile Transit Apps to New Cities. Center for Urban Transportation Research 17, 4 (2014), 14.
2.! Brakewood, C., Barbeau, S., and Watkins, K. An experiment evaluating the impacts of real-time transit information on bus riders in Tampa, Florida. Transportation Research Part A: Policy and Practice 69, (2014), 409–422.
3.! Brakewood, C., Macfarlane, G., and Watkins, K.E. The Impact of Real-time Information on Bus Ridership in New York City. Transportation Research Part C: Emerging Technolo-gies, (2015).
4.! Carrel, A., Halvorsen, A., and Walker, J.L. Passengers' perception of and behavioral adapta-tion to unreliability in public transportation. Transportation Research Record: Journal of the Transportation Research Board 2351, 1 (2013), 153–162.
5.! Carroll, J.M. and Rosson, M.B. A Trajectory for Community Networks. The Information Society 19, 5 (2003), 381–393.
6.! Carroll, J.M. and Rosson, M.B. Wild at Home: The Neighborhood as a Living Laboratory for HCI. ACM Trans. Comput.-Hum. Interact. 20, 3 (2013).
7.! Doran, D., Gokhale, S., and Dagnino, A. Human Sensing for Smart Cities. Proceedings of the 2013 IEEE/ACM International Conference on Advances in Social Networks Analysis and Mining, ACM (2013), 1323–1330.
8.! Erickson, T., Podlaseck, M., Sahu, S., Dai, J.D., Chao, T., and Naphade, M. The Dubuque Water Portal: Evaluation of the Uptake, Use and Impact of Residential Water Consumption Feedback. Proceedings of the SIGCHI Conference on Human Factors in Computing Sys-tems, ACM (2012), 675–684.
9.! Ferris, B., Watkins, K., and Borning, A. OneBusAway: results from providing real-time arrival information for public transit. Proceedings of the SIGCHI Conference on Human Factors in Computing Systems, (2010), 1807–1816.
10.!Frank, L.D., Andresen, M.A., and Schmid, T.L. Obesity relationships with community design, physical activity, and time spent in cars. American Journal of Preventive Medicine 27, 2 (2004), 87–96.
11.!Gooze, A., Watkins, K.E., and Borning, A. Benefits of real-time transit information and impacts of data accuracy on rider experience. Transportation Research Record: Journal of the Transportation Research Board 2351, 1 (2013), 95–103.
12.!Gordon, E., Schirra, S., and Hollander, J. Immersive planning: a conceptual model for designing public participation with new technologies. Environment and Planning B: Plan-ning and Design 38, (2011), 509–519.
13.!Granovetter, M.S. The Strength of Weak Ties. The American Journal of Sociology, 6 (1973). 14.!Hacker, K.L. and van Dijk, J., eds. Digital Democracy: Issues of Theory and Practice.
Sage Publications, Inc, 2001. 15.!Hippel, E. Democratizing innovation. Cambridge, 2005. 16.!Innes, J.E. Information in Communicative Planning. Journal of the American Planning
Association 64, 1 (2007), 52–63. 17.!Klaebe, H., Adkins, B., Foth, M., and Hearn, G. Embedding an Ecology Notion in the
Social Production of Urban Space. In M. Foth, ed., Handbook of Research on Urban Infor-matics. Information Science Reference, New York, 2009, 179–194.
18.!Kling, R. Automated information systems as social resources in policy making. ACM '78: Proceedings of the 1978 annual conference, ACM (1978), 666–674.
19.!Kling, R. Automated Welfare Client-Tracking and Service Integration: The Political Econ-omy of Computing. Communications of the ACM 21, 6 (1978), 484–493.
20.!Le Dantec, C.A. Participation and Publics: Supporting Community Engagement. CHI '12: Proceedings of the SIGCHI Conference on Human Factors in Computing Systems, (2012), 1351–1360.
21.!Le Dantec, C.A. and DiSalvo, C.F. Infrastructuring and the Formation of Publics in Partici-patory Design. Social Studies of Science 43, 2 (2013), 241–264.
22.!Le Dantec, C.A., Asad, M., Misra, A., and Watkins, K. Planning with Crowdsourced Data: Rhetoric and Representation in Transportation Planning. To Appear In CSCW'15, (2015).
23.!Le Dantec, C.A., Farrell, R.G., Christensen, J.E., Bailey, M., Ellis, J.B., Kellogg, W.A., and Edwards, W.K. Publics in practice: ubiquitous computing at a shelter for homeless mothers. CHI '11: Proceedings of the SIGCHI Conference on Human Factors in Computing Systems, ACM Request Permissions (2011), 1687–1696.
24.!Morozov, E. The Net Delusion. PublicAffairs, 2011. 25.!Norman, D.A. The Psychology of Everyday Things. Basic Books, 1988. 26.!Olivares, T., Royo, F., and Ortiz, A.M. An Experimental Testbed for Smart Cities Applica-
tions. Proceedings of the 11th ACM International Symposium on Mobility Management and Wireless Access, ACM (2013), 115–118.
27.!OneBusAway, ed. OneBusAway frequency of stop access over 24-hours. 2011. 28.!Perera, C., Zaslavsky, A., Christen, P., and Georgakopoulos, D. Sensing as a service model
for smart cities supported by Internet of Things. Transactions on Emerging Telecommuni-cations Technologies 25, 1 (2014), 81–93.
29.!Pinkett, R. and O'Bryant, R. Building Community, Empowerment and Self-Sufficiency. Information, Communication & Society 6, 2 (2003), 187–210.
30.!Räsänen, M. and Nyce, J.M. The Raw is Cooked: Data in Intelligence Pracitce. Science, Technology & Human Values 38, 5 (2013), 655–677.
31.!Rogers, E.M., Collins-Jarvis, L., and Schmitz, J. The PEN Project in Santa Monica: Interac-tive Communication, Equality, and Political Action. Journal of the American Society for In-formation Science 45, 6 (1994), 401–410.
32.!Roitman, H., Mamou, J., Mehta, S., Satt, A., and Subramaniam, L.V. Harnessing the Crowds for Smart City Sensing. Proceedings of the 1st International Workshop on Multi-modal Crowd Sensing, ACM (2012), 17–18.
33.!Sackman, H. A public philosophy for real time information systems. AFIPS '68 (Fall, part II): Proceedings of the December 9-11, 1968, fall joint computer conference, part II, ACM (1968), 1491–1498.
34.!Shirky, C. Here Comes Everybody. The Penguin Press, New York, 2008. 35.!Steinfeld, A., Zimmerman, J., Tomasic, A., Yoo, D., and Aziz, R.D. Mobile transit infor-
mation from universal design and crowdsourcing. Transportation Research Record: Jour-nal of the Transportation Research Board 2217, 1 (2011), 95–102.
36.!Tang, L. and Thakuriah, P.V. Ridership effects of real-time bus information system: A case study in the City of Chicago. Transportation Research Part C: Emerging Technologies 22, (2012), 146–161.
37.!Transportation Research Board of the National Academies. Critical Issues in Transporta-tion. 2013.
38.!US Environmental Protection Agency. Fast Facts: US Transportation Sector Greenhouse Gas Emissions, 1990–2011. 2013.
39.!Vakali, A., Anthopoulos, L., and Krco, S. Smart Cities Data Streams Integration: Experi-menting with Internet of Things and Social Data Flows. Proceedings of the 4th Internation-al Conference on Web Intelligence, Mining and Semantics (WIMS14), ACM (2014), 60:1–60:5.
40.!van Dijk, J. Models of Democracy and Concepts of Communication. In K.L. Hacker and J. van Dijk, eds., Digital Democracy: Issues of Theory and Practice. SAGE Publications Ltd, 2000, 30–53.
41.!Voida, A., Dombrowski, L., Hayes, G.R., and Mazmanian, M. Shared values/conflicting logics: working around e-government systems. CHI '14: Proceedings of the 32nd annual ACM conference on Human factors in computing systems, (2014), 3583–3592.
42.!Watkins, K.E., Ferris, B., Borning, A., Rutherford, G.S., and Layton, D. Where Is My Bus? Impact of mobile real-time information on the perceived and actual wait time of transit rid-ers. Transportation Research Part A: Policy and Practice 45, 8 (2011), 839–848.
43.!Wong, J. Leveraging the General Transit Feed Specification for Efficient Transit Analysis. Transportation Research Record: Journal of the Transportation Research Board 2338, 1 (2013), 11–19.
44.!Zhang, F., Shen, Q., and Clifton, K.J. Examination of traveler responses to real-time infor-mation about bus arrivals using panel data. Transportation Research Record: Journal of the Transportation Research Board 2082, 1 (2008), 107–115.
45.!Zimmerman, J., Tomasic, A., Garrod, C., Yoo, D., Hiruncharoenvate, C., Aziz, R., Thiruvengadam, N.R., Huang, Y., and Steinfeld, A. Field trial of tiramisu: crowd-sourcing bus arrival times to spur co-design. Proceedings of the SIGCHI Conference on Human Fac-tors in Computing Systems, (2011), 1677–1686.