Embed Size (px)
Citation preview

E211 – Operations Planning II
SSCHOOL OF CHOOL OF EENGINEERINGNGINEERING EE211 211 –– OOPERATIONS PERATIONS PPLANNING IILANNING II

� Recall the utilization versus waiting time:
� The higher the utilization of a process, the longer the queue in front of that process
� In Flexsim, the utilization statistics can be obtained by examining the ‘state’ result.
� However, it is not so straightforward if the arrival
Finding the Bottleneck
SSCHOOL OF CHOOL OF EENGINEERINGNGINEERING EE211 211 –– OOPERATIONS PERATIONS PPLANNING IILANNING II
� However, it is not so straightforward if the arrival is batched. When there is no item to be processed, obviously there is no utilization! This is not due to bottlenecks occurring upstream.
When the current bottleneck operation is alleviated, other operations with higher utilization may become bottleneck again.
Study of Cycle Time Improvement
� Study each measure one at a time. For example, adding one more operator/forklift; adding one more packaging station, etc.
� Document the improvement in cycle time and cost of implementing the measure.
� If significant improvement is sought, may have
SSCHOOL OF CHOOL OF EENGINEERINGNGINEERING EE211 211 –– OOPERATIONS PERATIONS PPLANNING IILANNING II
� If significant improvement is sought, may have to combine two or more measures.
� Basically a trial-and-error optimization process!

Simulation Techniques Learnt
Specify exact
arrival of items
using ‘Arrival
Schedule’ under
arrival style
SSCHOOL OF CHOOL OF EENGINEERINGNGINEERING EE211 211 –– OOPERATIONS PERATIONS PPLANNING IILANNING II
Specify type of item for each arrival
Specify batch size for each arrival

To differentiate two types of items, set a
Simulation Techniques Learnt
After items are generated from the source:
SSCHOOL OF CHOOL OF EENGINEERINGNGINEERING EE211 211 –– OOPERATIONS PERATIONS PPLANNING IILANNING II
types of items, set a unique attribute for each type.
Notify VisualTool of the entry of each item into the processes.

When modeling with mobile resources (operators, transporters), pay attention to the speed, distance as
Simulation Techniques Learnt
SSCHOOL OF CHOOL OF EENGINEERINGNGINEERING EE211 211 –– OOPERATIONS PERATIONS PPLANNING IILANNING II
speed, distance as well as time units.
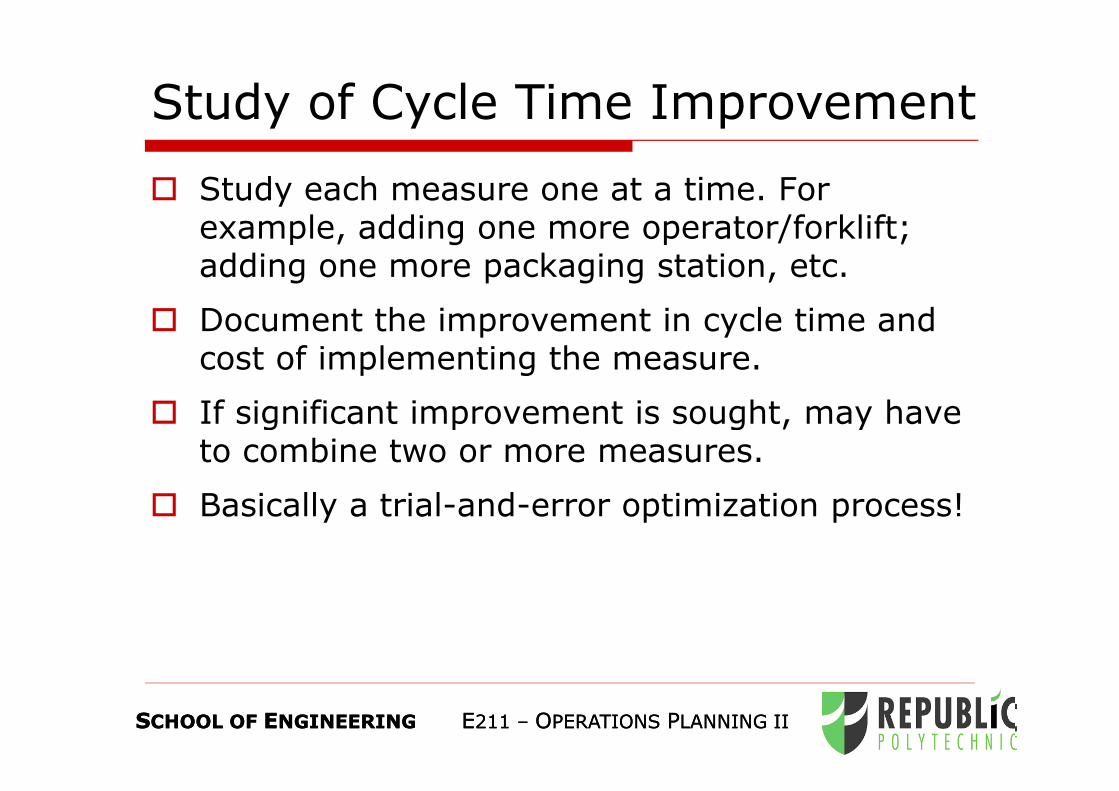
When using more than 1 operator (transporter) for one route, use a dispatcher or the ‘direct’ Technique(using the <A> key).
Simulation Techniques Learnt
SSCHOOL OF CHOOL OF EENGINEERINGNGINEERING EE211 211 –– OOPERATIONS PERATIONS PPLANNING IILANNING II

To route different
item types to
different objects,
specify a ‘send to
port’ rule under
flow tab of object.
Simulation Techniques Learnt
SSCHOOL OF CHOOL OF EENGINEERINGNGINEERING EE211 211 –– OOPERATIONS PERATIONS PPLANNING IILANNING II

Available/Collected Information from Running Simulation
Production Common Holding Area
Packaging (Running & Trekking)
Storage Rack
(Running)
Common Storage Bin
Storage Rack
(Trekking)
Conveyor
Conveyor
Operator
Forklift
Packaging (Running & Trekking)
ArrivalTime ItemName ItemType Quantity
0 Running shoes 2 30
900 Trekking shoes 1 40
2100 Running shoes 2 30
3900 Trekking shoes 1 40
4200 Running shoes 2 30
6300 Running shoes 2 30
6900 Trekking shoes 1 40
SSCHOOL OF CHOOL OF EENGINEERINGNGINEERING EE211 211 –– OOPERATIONS PERATIONS PPLANNING IILANNING II
Setup time at
packaging station
Triangular (5, 15, 10) seconds for both
types of shoes
Packaging for
Trekking shoes Normal ~ (60, 25) seconds
Packaging for
Running Shoes Normal ~ (45, 15) seconds
Trekking Shoes
Schedule
Batch of 40 products every 50 minutes, 6
batches daily
Running Shoes
Schedule
Batch of 30 products every 35 minutes,
10 batches daily
Forklift truck 8400 Running shoes 2 30
9900 Trekking shoes 1 40
10500 Running shoes 2 30
12600 Running shoes 2 30
12900 Trekking shoes 1 40
14700 Running shoes 2 30
15900 Trekking shoes 1 40
16800 Running shoes 2 30
18900 Running shoes 2 30

Current Process Flow
Packaging Station Utilization
SSCHOOL OF CHOOL OF EENGINEERINGNGINEERING EE211 211 –– OOPERATIONS PERATIONS PPLANNING IILANNING II
Average Cycle Time (based on 10 replications): 1451.7 seconds (24 minutes 12 seconds)
Operator Utilization
Packaging Station has higher utilization rate, and is more likely to be the bottleneck
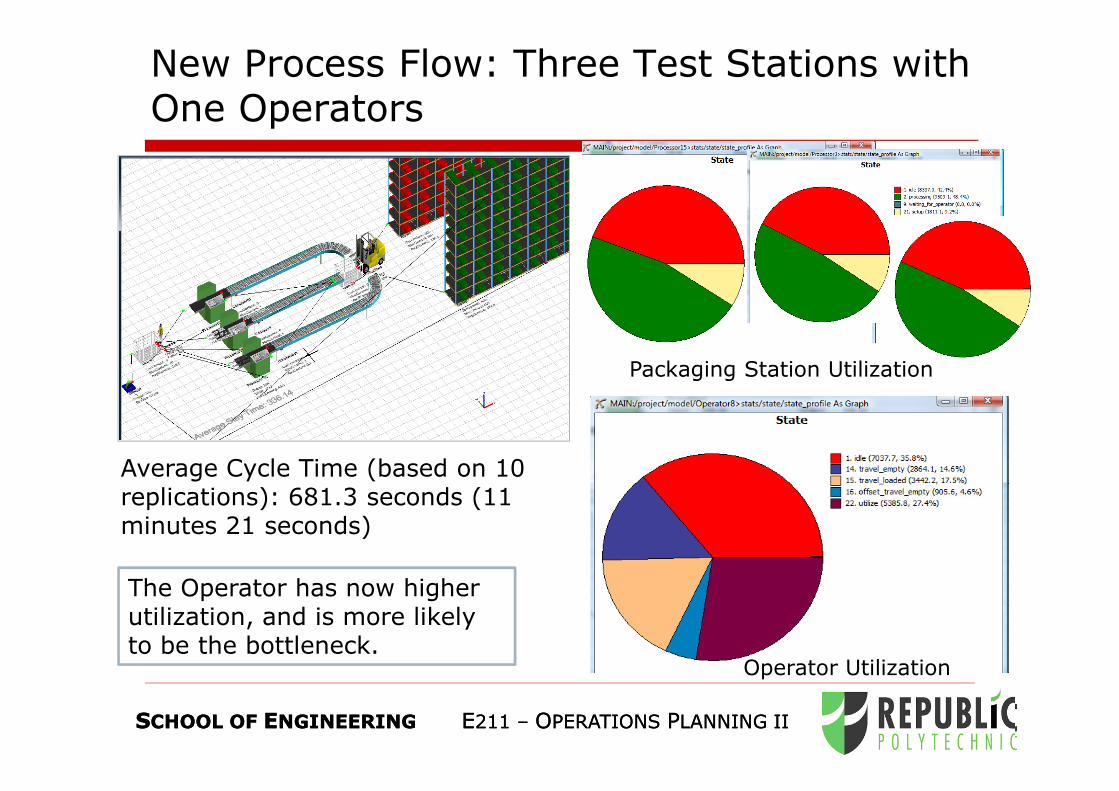
New Process Flow: Three Test Stations with One Operators
Packaging Station Utilization
SSCHOOL OF CHOOL OF EENGINEERINGNGINEERING EE211 211 –– OOPERATIONS PERATIONS PPLANNING IILANNING II
Average Cycle Time (based on 10 replications): 681.3 seconds (11 minutes 21 seconds)
Operator Utilization
The Operator has now higher utilization, and is more likely to be the bottleneck.

New Process Flow: Three Test Stations with Two Operators
Packaging Station Utilization
SSCHOOL OF CHOOL OF EENGINEERINGNGINEERING EE211 211 –– OOPERATIONS PERATIONS PPLANNING IILANNING II
Average Cycle Time (based on 10 replications): 610.7 seconds (10 minutes 11 seconds)
Packaging Station now has higher utilization, and is more likely to be the bottleneck
Operator Utilization

Statistical Comparison: 2-Sample t-test
� How can you statistically prove that the proposed alternative can improve cycle time by at least 700 seconds?
� Use 2-Sample t-test under the following assumptions:
� Collected data are independent of one another;
� Each of the two samples (current and improved) is drawn from normally distributed population;
Cycle Time (Seconds)
Current3 QC stations + 1
operator
1412.78 675.73
1541.9 694.68
1424.99 681.22
1280.21 661.21
SSCHOOL OF CHOOL OF EENGINEERINGNGINEERING EE211 211 –– OOPERATIONS PERATIONS PPLANNING IILANNING II
distributed population;
� The two populations have unequal variance
� Statistical hypotheses
� Null hypothesis (H0): The difference in cycle time between current and improved method is less and equal to 700 seconds;
� Alternative hypothesis (H1): The difference in cycle time between current and improved method is greater than 700 seconds.
1280.21 661.21
1592.13 700.21
1475.32 680.04
1501.98 689.56
1456.35 668
1376.8 679.67
1454.24 682.75

Statistical Comparison: 2-Sample t-test
Excel>Data>Data Analysis>t-Test: Two-Sample Assuming Unequal Variances.
SSCHOOL OF CHOOL OF EENGINEERINGNGINEERING EE211 211 –– OOPERATIONS PERATIONS PPLANNING IILANNING II
Level of significanceThe improvement on cycle time (between current and proposed alternative) you want to statistically prove

Statistical Comparison: 2-Sample t-test
� Compare t-statistic with critical value: t-statistic > critical value.
� Or compare p-value
t-Test: Two-Sample Assuming Unequal Variances
Variable 1 Variable 2
Mean 1451.67 681.307
Variance 7579.743711 135.8573344
Observations 10 10
Hypothesized
SSCHOOL OF CHOOL OF EENGINEERINGNGINEERING EE211 211 –– OOPERATIONS PERATIONS PPLANNING IILANNING II
� Or compare p-value with significance level: p-value < 0.05.
� Conclusion: Reject H0 and conclude that the proposed alternative can improve cycle time by at least 700 seconds.
Hypothesized
Mean Difference 700
df 9
t Stat 2.533141595
P(T<=t) one-tail 0.016034819
t Critical one-tail 1.833112923
P(T<=t) two-tail 0.032069637
t Critical two-tail 2.262157158

Conclusion
� Packaging station is the bottleneck of the current packaging and stock-in process.
Configuration Average Cycle Time (based on 10
replications)
Current 1451.7 seconds (24 minutes 12 seconds)
3 packaging stations with 1 operator 681.3 seconds (11 minutes 21 seconds)
3 packaging stations with 2 operators 610.7 seconds (10 minutes 11 seconds)
SSCHOOL OF CHOOL OF EENGINEERINGNGINEERING EE211 211 –– OOPERATIONS PERATIONS PPLANNING IILANNING II
process.
� However the bottleneck operation also may have higher percentage of idle time. This is because arrivals are batched; sometimes resources may be idle in between the arrival batches.
� By improving the bottleneck operation (add in one more packaging station and/or operator), average cycle time can be improved.
� By statistical comparison, such as 2-Sample t-test, we can conclude whether the proposed alternative can effectively improve the cycle time.

Learning Objectives
� Modeling and simulation of a typical production line using a simulation software.
� Identify bottleneck operations in the process flow through simulation modeling and analysis.
� Recommend how to alleviate bottleneck operations (improve cycle time); and how to simulate proposed alternatives using Flexsim.
SSCHOOL OF CHOOL OF EENGINEERINGNGINEERING EE211 211 –– OOPERATIONS PERATIONS PPLANNING IILANNING II
alternatives using Flexsim.
� Use statistical test to conclude whether the proposed alternative can effectively alleviate the bottleneck (improve the cycle time).

![Continuous Quality Improvement€¦ · CQI ! Insurance that the quality improvement cycle is being carried out ! [What is the quality improvement cycle in a typical surveying business?]](https://img.pdfslide.net/doc/110x75/605bd7ced247e414281f20ee/continuous-quality-improvement-cqi-insurance-that-the-quality-improvement-cycle.jpg)