Embed Size (px)
Citation preview

NASA Contractor Report 182126
f -
//_ 7-_e/9_
/_,B _ 90
Cyclic Fatigue Damage Characteristics
Observed for Simple Loadings Extendedto Multiaxial Life Prediction
j_
David J. Jones and Peter Kurath
University of IllinoisUrbana, Illinois
June 1988
Prepared forLewis Research Center
Under Grant NAG3-465
G3/39
N88-& 5C 16
Unclas
0.148390
National Aeronautics and
Space Administration


Cyclic Fatlgue Damage Characterlstlcs Observed for S|mple
Loadings Extended to Multiaxlal Life Prediction
David J. Jones and Peter Kurath
University of IllinoisDepartment of Mechanical Engineering
Urbana, Illinois
SUMMARY
Fully reversed uniaxial strain controlled fatigue tests were performed on
smooth cylindrical specimens made of 304 stainless steel. Fatigue life data
and cracking observations for uniaxial tests were compared with life data and
cracking behavior observed in Fully reversed torsional tests. It was
determined that the product of maximum principal strain amplitude and maximum
principal stress (Smith, Watson, Topper parameter) provided the best
correlation of fatigue lives for these two loading conditions. Implementation
of this parameter is in agreement with observed physical damage and it
accounts For the variation of stress-strain response, which is unique to
specific loading conditions.
Biaxial fatigue tests were conducted on tubular specimens employing both
in-phase and out-of-phase tension-torsion cyclic strain paths. Cracking
observations indicated that the physical damage which occurred in the biaxial
tests was similar to the damage observed in uniaxial and torsional tests. The
Smith, Watson, Topper parameter was then extended to predict the fatigue lives
resulting from the more complex loading conditions. The correlation of the
biaxial Fatigue lives with experimental data was within a factor of 2½, when
strain hardening due to out-of-phase loading was incorporated into the life
estimation analysis.

ACKNOWLEDGMENTS
Funding for this research was provided by N.A.S.A under Grant No.
NAG3-465. Julie Bannantine is thanked for her insightful advice stemming
from her previous research. Kent Elam expertly machined all specimens. Matt
Bohnert is thanked for his assistance in examining the replica data.
11

TABLE OF CONTENTS
Io
Page
SUMMARY .......................................................... IACKNOWLEDGMENTS................................................. 11LIST OF SYMBOLS.................................................. v
INTRODUCTION ..................................................... I
i.I Background .................................................. iI.i.I Material ............................................. i
1.1.2 Fatigue Testing ...................................... 21.1.3 Purpose and Scope .................................... 6
. EXPERIMENTAL PROGRAM............................................. 82.1 Test System ................................................. 82.2 Specimen Description ........................................ 82.3 Test Program ................................................ 92.4 Crack Observations .......................................... 9
o DISCUSSION ...................................................... 113.1 Uniaxial and Torsional Results ............................. Ii
3.1.1 Surface Crack Observations .......................... Ii3.1.2 Fracture Surface Observations ....................... 12
3.1.3 Selection of Damage Parameter ....................... 133.2 Multiaxial Results ......................................... 17
3.2.1 Analysis of Biaxial Paths ........................... 173.2.2 Biaxial Surface Crack Observations .................. 193.2.3 Biaxial Fatigue Life Predictions .................... 21
4. CONCLUSIONS..................................................... 24
LIST OF REFERENCES.................................................. 26
TABLES .............................................................. 29
FIGURES ............................................................. 34
APPENDIX A .......................................................... 64
APPENDIX B.......................................................... 81
111

i! I Z

b
C
C
m
E
G
K,K'
2Nf,Nf
Nt
n,n'
B
Y
^
Y
I
Yf
A_T ax
AEe
AEp
AEt
E
LIST OF SYMBOLS
Fatigue strength
Smith, Watson, Topper Coefficient
Fatigue ductility exponent
Material constant
Linear elastic modulus
Shear modulus
Monotonic, cyclic strength coefficient
Number of reversals cycles to failure
Transition fatigue life, cycles
Monotonic, cyclic strain hardening exponent
Smith, Watson, Topper exponent
Torsional strain
Maximum shear strain amplitude
Torsional fatigue shear ductility coefficient
Maximum principal strain amplitude
Elastic strain amplitude
Plastic strain amplitude
Total strain amplitude
Axial strain
Principal strain amplitude on secondary plane
Ei,_2,c 3 Principal strains
c_ Fatigue ductility coefficient^
cn Strain amplitude normal to the plane of maximum shearstrain amplitude
o Axial stress
aoa Cyclic axial stress range
oTax
ORECEDING pAGE BLANK NOT FILMED
Maximum principal stress on plane of maximum principal
strain amplitude

of'^
ono
T
Fatigue strength coefficient
Mean stress normal to the plane of maximum shear strain amplitude
Torsional stress
v|

INTRODUCTION
Fatigue due to cyclic loading must often be considered when designing
components for structures and machinery. Accurate fatigue life predictions
are imperative to insure safety and component reliability. Often a component
subjected to a multiaxial state of stress and/or strain which may radically
alter the fatigue life for a given material. Uniaxial cyclic loading is a
commontest procedure. Correlation of uniaxial fatigue data to other stress
or strain states is useful in the development of multiaxial life prediction
models. In order to develop a relation between fatigue lives under uniaxial
and multiaxial stress states, it would be useful to first correlate uniaxial
and torsional test data.
Cyclic biaxial tension-torsion loading has been categorized as either in-
phase or out-of-phase. In-phase loading occurs when the axial and torsional
loading signals are applied such that no phase lag exists between them. Out-
of-phase loading is characterized by a phase difference between the command
signals. Phenomenological observations such as crack growth and crack
direction can be used to justify the extension of life prediction models
developed for uniaxial and torsional loadings to life prediction for more
complex multiaxial loadings.
1.1 Background
1.1.1 Material
In 1913, Harry Brearely of Sheffield, England observed that an
experimental steel containing 0.25% carbon and 13%chromiumdid not rust when
exposed to the atmosphere. Because of its resistance to corrosion, this
material becameknown as stainless steel, and was subsequently developed for
use in aircraft engine exhaust valves during World War I. Since that time, a
variety of stainless steels have been developed with applications ranging from

cutlery to turbine blades [I]. The ASMcommittee on WroughtStainless Steels
characterizes stainless steel as any ferrous alloy containing a minimumof 10%
chromium. Additional alloying elements such as nickel, molybdenum and
titanium may be added to enhance the mechanical properties, while maintaining
corrosive resistance [2].
It is the resistance to corrosion that makes stainless steel attractive
for many specialized uses. The corrosion resistance of stainless steel
results from the interaction of chromium and oxygen to form a protective film
on the surface of the metal [3]. Within the family of stainless steels there
are martensitic, ferritic, austenitic, and precipitation hardenable micro-
structures which depend on alloying elements and heat treatment. Stainless0 0
steels are commonly used in higher temperature environments (400 -1200 C)
because of their ability to resist corrosion and scaling. Additionally at
these temperatures stainless steel retains a greater percentage of its room
temperature mechanical properties than do other materials such as steel and
0
aluminum. For example, at 300 C, the tensile strength of 316 stainless steel
is 87% of its tensile strength at room temperature [4].
An austenitic 304 stainless steel was chosen for this investigation. Its
chemical composition is reported in Table I. This can be compared with the
ASM specifications for variations in chemical composition that are allowable
for the 304 stainless steel category. Type 304 is one of the most commonly
used stainless steels because of its relatively low cost and ability to resist
0
corrosion at temperatures up to 400 C without a severe reduction in mechanical
properties [3]. Applications of 304 stainless steel include heat exchangers,
pressure vessels, and cookware.
] !

1.1.2 Fatigue Testing
Since 1850 it has been documentedthat components in structures and
machinery have failed due to repeated loadings. These failures caused
considerable concern amongdesigners and have resulted in muchconjecture with
regard to their origin [5]. The earliest laboratory experiments involved the
examination of varying cyclic stress levels on specimen Fatigue life. In
1856Wohler [6] conducted stress controlled cyclic loading tests on railroad
axle steel using a rotating bending test fixture. He reported his data by
plotting stress amplitude versus cycles to failure (S-N curve). It was
observed that below a certain stress amplitude the material seemedto have an
infinite life (greater than 106 cycles). This stress level becameknown as
the endurance limit, and was the scope of muchof the early research done in
fatigue.
In 1910, Basquin [7] proposed the following relation between the fully
reversed stress amplitude and the fatigue life:
4o
'2Nf) ba = of ( (I)2
Later investigators modified Basquin's relation to correspond to the elastic
strain amplitude aEe/2 = aOa/(2E ). This relation is appropriate when the
elastic strain amplitude is at least an order of magnitude greater than the
plastic strain amplitude. Coffin [81 referred to this regime as high cycle
fatigue (HCF).
In 1954, Coffin [9] and Manson [I0] introduced a relation between the
plastic strain amplitude and the fatigue life, which is similar to Basquin's
relation for the stress amplitude.

__ = ci_(2Nf)C (2)2
This parameter is applicable for low cycle fatigue (LCF) which is defined by
Committee E9 of A.S.T.M. as "...characterized by the presence of macroscopic
cyclic plastic strains.., as evidenced by a stress strain hysteresis loop"
[11]. Manson later argued that the fatigue resistance of a material, which
was subjected to an arbitrary strain level, could be characterized by the
elastic and plastic strain components. Therefore the above equations were
combined and the total strain amplitude was expressed as:
AEt A_e a_p ok (2Nf)b +: T + 2 : T _k (2Nf)c(3)
As early as 1886 investigators have considered the problems of fatigue
due to complex multiaxial cyclic loading. A review of multiaxial fatigue
investigations is found in Refs. 12 through 14. One of the earliest
investigations was conducted by Lanza
combined torsion and bending on shafts.
with the existing design criterion and
nonconservative for fatigue loading.
[151, who examined the effect of
He compared his experimental data
found that these criterion were
The determination of long life fatigue characteristics was the object of
much of the early research in multiaxial fatigue. As with uniaxial fatigue,
long life damage analysis for multiaxial fatigue has been based on the cyclic
stress excursion. An example of a stress based multiaxial fatigue life
estimation criterion is the relation proposed by Guest [16].
(oI - o2) + m(o I + o2) = constant(4)
!1 1

Later researchers suggested that the fatigue life of ductile materials will be
dependent on the maximum shear stress resulting from cyclic loading, while the
maximum principal stress will determine the fatigue life for brittle materials
[14].
As design criterion became more demanding and the need for component
reliability increased, a corresponding need for accurate multiaxial low cycle
life prediction models resulted. Both stress based and strain based
parameters have been used to analyze low cycle Fatigue data. Brown and Miller
[17] have suggested that a strain based parameter is most appropriate for
multiaxial fatigue correlation. They argue that Fatigue crack growth is a
localized phenomenon and is constrained by the deformation of the bulk
material surrounding the crack tip. As a result bulk strains are assumed to
control fatigue crack growth.
Many of the investigations in biaxial Fatigue have employed loading paths
For which both load channels (e.g., axial and torsional) are applied
simultaneously with no difference in phase or frequency. These are denoted as
in-phase loading paths. The first out-of-phase Fatigue tests were conducted
by Mason and Delaney [18] in 1921. They applied bending and torsion stresses
with a phase difference of 90 ° and noted that the fatigue life was less than
if each component of the stress was applied separately.
Fatigue failure analysis was greatly enhanced as researchers began to
examine crack formation and growth. Ewing and Humphrey [191 were among the
earliest investigators to systematically examine and document surface crack
formation of a cyclically loaded laboratory specimen. The principal aspect of
their research involved the examination of slip lines and their effect on
fatigue crack Formation. This research and similar investigations have caused
many to view Fatigue as a two stage process: initiation and propagation.

Forsyth [20] noted that slip band cracking is dependent on the shear
stress range acting on the slip plane. Therefore, he predicted that cracks
would initiate on planes of maximumshear stress, which he referred to as
Stage I cracking. He states "Thus cracks will form on those planes most
closely aligned with the maximumshear stress directions in the component
fatigue specimen." [20]. Fatigue crack propagation can occur on the same
plane as crack initiation or it can occur on planes perpendicular to the
maximumprincipal stress. Forsyth referred to propagation perpendicular to
principal stress planes as Stage II crack growth. The characterization of
fatigue as a two stage process has required investigators to examine and
define crack initiation and propagation. Estimates for initiated cracks have
ranged from 10-4 mmto 2.5 mm[21].
1.1.3 Purpose and Scope
Both uniaxial and biaxial (in-phase and out-of-phase) fatigue tests
were performed. Smoothcylindrical specimens were used for uniaxial testing,
while thin walled tubes were employed for all the other tests. Surface
fatigue crack development for all tests was monitored via surface replication
procedures. Fracture surfaces from uniaxial tests were examined employing
scanning electron microscopy. Fatigue life data and cracking observations
from uniaxial testing were compared with previous results [221 from fully
reversed torsional loading. It was determined that a good correlation between
these two tests is possible implementing a damageparameter which employs the
product of the maximumprincipal strain amplitude and the maximumprincipal
stress. This parameter was first proposed by Smith, Watson, and Topper
[23]. Similarities in the cracking behavior were used to substantiate the
implementation of this damageparameter. This parameter was then employed to
analyze more complex biaxial fatigue strain paths. Surface cracking charac-
i]I!

teristics were used to justify the extension of the Smith, Watson, and Topper
parameter (SWT) for 304 Stainless Steel subjected to more complex multiaxial
loadings.

2. EXPERIMENTALPROGRAM
2.1 Test System
Strain controlled tests were conducted on 304 stainless steel uniaxial
specimens using a two post axial servo-hydraulic test frame with a 90 KNload
cell. An axial clip on extensometer with a 12.7 mmgage length was used to
measurestrain. Test control and data acquisition were achieved with a micro-
computer system. Resolution of the load and strain signals were 20 N (~.7MPa)
and 5 X lO-6mm/mmrespectively.
A stiffened servo-hydraulic tension-torsion test frame with 222 KNaxial
capacity and 2.25 KN-mtorsional capacity was used to perform biaxial strain
controlled tests on tubular specimens. Signal generation and data acquisition
were also accomplished with a microcomputer. An internal extensometer was
used to measure both axial and torsional strains {24]. Resolution of the
axial and torsional loads were 0.01KN and 0.07 N-mrespectively. Axial and
torsional strains were resolved to 1.0 x lO-4mm/mmand 2.0 x 10⁻⁴ mm/mm
respectively.
2.2 SpecimenDescription
Uniaxial fatigue and monotonic test specimens were designed in accordance
with ASTME-606 and ASTMA-370 respectively. A 15 mmgauge length and 6.35 mm
gauge diameter were chosen for this investigation. Tubular specimens with a
25.4 mmgage length, 33 mmouter diameter and a 25.4 mminner diameter were
used for all other testing. Specimendetails are depicted in Figs. 1 and 2.
Specimen surfaces were polished to a 0.3 micron finish to achieve specimen
uniformity. This also relieves residual surface stresses induced during
machining, and assures a smooth surface to facilitate acetate tape crack
replication procedures.

2.3 Test Program
Monotonic tensile tests were performed on two specimens. Baseline
material properties from these tests are reported in Table 2. Constant
amplitude fully reversed strain controlled tests were performed on eight 304
stainless steel uniaxial specimens. Cyclic data was recorded at logarithmic
intervals. Failure was defined as a 50%load drop from the maximumtensile
load experienced by the specimen on the last recorded cycle. This failure
criteria usually corresponded to complete separation of the specimen. Strain
amplitudes and fatigue lives of the uniaxial specimens tested are listed in
Table 3. Data From uniaxial tests was comparedwith previous data from fully
reversed torsional tests [22I.
Eight tubular specimens were tested in biaxial fatigue using strain as
the controlled parameter. Four different biaxial strain paths (C, N, P and Q)
were employed and are shown in Fig. 3. For strain amplitudes examined, the
resulting fatigue lives were on the order of 105 to 106 cycles. This was
combined with data from a previous investigation in which, for the samebi-
axial strain paths, the fatigue lives were on the order of 103 to 104 cycles
[22I. Again data was recorded at logarithmic intervals. An axial load drop
of 10 percent, from the previously recorded cycle, was used to define specimen
failure. This failure criteria corresponded to a failure crack length of at
least 3 mm.
2.4 Crack Observations
Surface crack growth was monitored using an acetyl cellulose film
replicating procedure to record surface features of the specimen at cyclic
intervals corresponding to approximately 10% of estimated fatigue life.
Acetate film was dissolved on the specimen surface by applying acetone between
the film and specimen surface with a syringe. The film was then allowed to

lO
soTidify for approx_mateTy i_ m_nutes. When removed from the specimen
surface, the film was placed between two glass slides to protect the
replica. Crack length and surface features were examined with a transmitted
light optical microscope. More details of the replication procedure are given
by Fash [25]. Fracture surfaces from uniaxial testing were examined with a
JEOL Model JSM-25S scanning electron microscope (SEM). The SEM was used
because it provided greater resolution than the optical microscope.
II
3. DISCUSSION
3.1 Uniaxial and Torsional Results
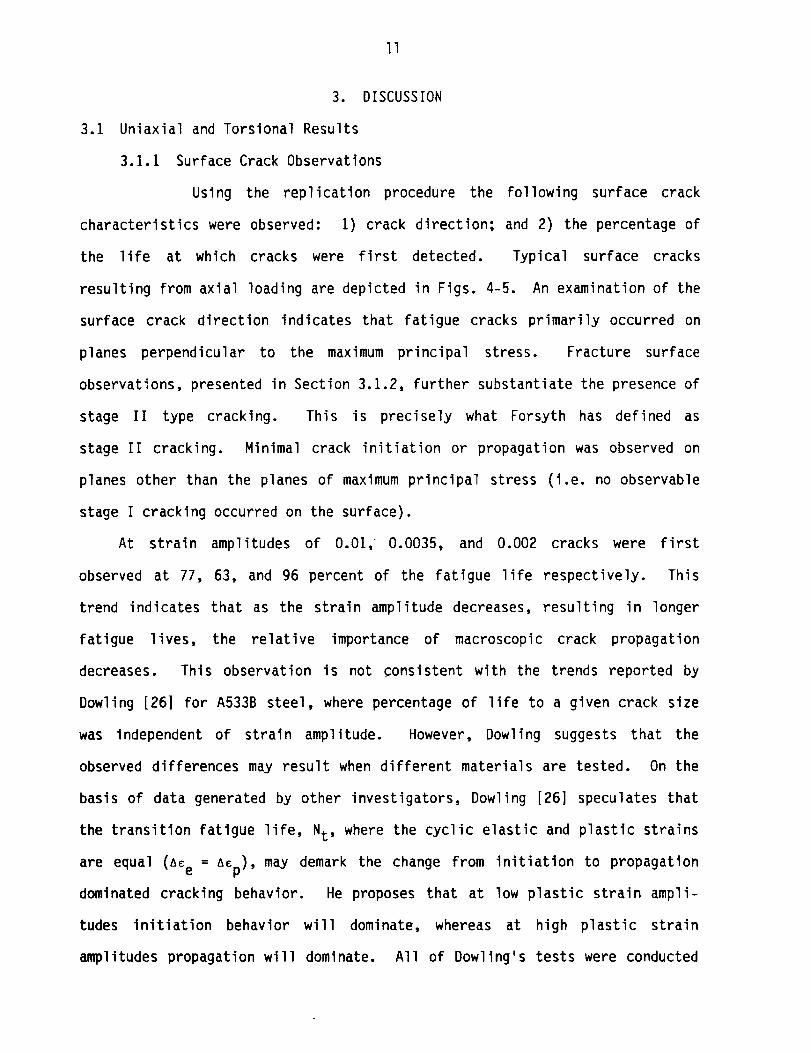
3.1.1 Surface Crack Observations
Using the replication procedure the following surface crack
characteristics were observed: I) crack direction; and 2) the percentage of
the life at which cracks were first detected. Typical surface cracks
resulting from axial loading are depicted in Figs. 4-5. An examination of the
surface crack direction indicates that Fatigue cracks primarily occurred on
planes perpendicular to the maximumprincipal stress. Fracture surface
observations, presented in Section 3.1.2, further substantiate the presence of
stage II type cracking. This is precisely what Forsyth has defined as
stage II cracking. Minimal crack initiation or propagation was observed on
planes other than the planes of maximumprincipal stress (i.e. no observable
stage I cracking occurred on the surface).
At strain amplitudes of 0.01, 0.0035, and 0.002 cracks were first
observed at 77, 63, and 96 percent of the fatigue life respectively. This
trend indicates that as the strain amplitude decreases, resulting in longer
fatigue lives, the relative importance of macroscopic crack propagation
decreases. This observation is not consistent with the trends reported by
Dowling [26] for A533B steel, where percentage of life to a given crack size
was independent of strain amplitude. However, Dowling suggests that the
observed differences may result when different materials are tested. On the
basis of data generated by other investigators, Dowling [26] speculates that
the transition fatigue life, Nt, where the cyclic elastic and plastic strains
are equal (AEe = aEp), may demark the change from initiation to propagation
dominated cracking behavior. He proposes that at low plastic strain ampli-
tudes initiation behavior will dominate, whereas at high plastic strain
amplitudes propagation will dominate. All of Dowllng's tests were conducted

12
at strain levels that resulted in fatigue lives less than Nt. If one con-
siders propagation dominated behavior as accounting for more than fifty
percent of the fatigue life, then the present data does not support Dowling's
hypothesis. Specifically at a strain amplitude of 0.01, for which A_p > ACe,
crack nucleation dominated the fatigue life.
3.1.2 Fracture Surface Observations
Examination of fracture surfaces on both a macroscopic and micro-
scopic level has been employed to lend considerable insight and understanding
of failure modes. Three fracture surface characteristics were observed in
this investigation: On a macroscopic level, I) the presence of "river
markings" indicating the point of crack initiation; on a microscopic level, 2)
the existence of micro-voids and 3) fatigue striations were observed. A SEM
was used to examine the axial test fracture surfaces. Typical results are
illustrated in Figs. 6-7. The first photograph of each series depicts an
overall view of the specimen failure surface. The region of fatigue crack
initiation is indicated by number i and the direction of fatigue crack
propagation is indicated by increasing numerical value. Adjacent photographs
depict a magnified view of each of these areas. The presence of striations
provides much information about the mode of failure and will therefore be the
topic of subsequent discussion.
Several investigators have speculated that fatigue striations correspond
in a one to one fashion to each stress or strain cycle {27,281. Forsyth {281
has categorized striations as either brittle or ductile. Brittle striations
are observed to propagate along crystallographic planes and therefore are
dependent on material microstructure. Ductile striations occur once plastic
crack tip deformation occurs. Therefore crack propagation resulting in
ductile striations is dependent on the direction of maximum tensile stress.

13
The presence of ductile striations was observed on all failure surfaces
examined. This is particularly evident in regions 2-5 for all but the highest
strain amplitude tests (Fig. 8). Brittle striations seem to be present in
region i for the lower amplitude tests (Fig. 9). One explanation for the
change from brittle to ductile striations is the increased stress intensity
factor as the crack propagates. As the stress intensity increases, resulting
in higher local tensile stresses, ductile striation Formation is enhanced. It
is noted that ductile striations in region i are only present for the highest
strain amplitude tests (Fig. 8). This is reasonable because the stress levels
required to Form this type of striation are most likely to occur at higher
strain amplitudes.
Forsyth [28] has also noted that striation spacings will be determined by
the stress or strain amplitude. A comparison of striations in the same region
for specimens experiencing different strain amplitudes illustrates this
phenomenon. The striations observed in the lower amplitude tests are closer
together than the striations in the high amplitude tests. This fact supports
the assumption that there is a relation between the formation of striations
and the number of cycles.
Fracture surfaces were examined for any evidence of stage I cracking. If
stage I cracks were present they would be expected to grow at an angle of 45 °
to the specimen axis for a uniaxial test specimen. No crack growth in this
direction was observed. The presence of fatigue striations in region I is an
indication of stage II cracking.
3.1.3 Selection of Damage Parameter
Fully reversed uniaxial fatigue data is often analyzed via a maxi-
mum principal strain amplitude approach employing the Basquin-Coffin/Manson
relationship (Eq. 3). Uniaxial data generated in this investigation is pre-

14
sented in Fig. 10. The solid lines correspond to the elastic, plastic and
total strain components of Eq. 3. Uniaxial fatigue data is often employed in
the analysis of torsional and other multiaxial fatigue strain states.
In Fig. ii torsional and axial fatigue data are compared using the
maximum principal strain amplitude as suggested by Coffin and Manson. It is
noted that the solid lines shown in the figure are intended as an aid in
viewing the data and are not derived from Eq. 3. The fully reversed torsional
data (R = -i) was generated from tests conducted on tubular specimens (TableY
4). Two of these tube specimens were tested in uniaxial fatigue at strain
amplitudes of 0.0035 and 0.0046 at a strain ratio, R = -I {221. The livesE
resulting from these two uniaxial tests agree well with the data from the
smooth specimen tests. This indicates that for this material, geometry
effects are negligible when comparing uniaxial smooth and tubular specimen
data. Using this parameter, torsional fatigue lives for a given principal
strain amplitude are greater than axial fatigue lives by a factor of 3.
The shear stress and/or strain amplitude experienced by a material has
been suggested as an important factor in determining its fatigue life
[24,29,301. A comparison of axial and torsional fatigue lives using the
maximum shear strain amplitude as a damage parameter is illustrated in
Fig. i0. Using this shear parameter an order of magnitude difference between
axial and torsional fatigue lives is observed.
An explanation of the effectiveness of these two damage criterion can be
made with the aid of cracking observations. As discussed previously, uniaxial
smooth specimens primarily displayed stage II cracking, which is determined by
the maximum principal strain amplitude. Torsional specimens, however, experi-
ence both stage I and stage II cracks [221. Stage II cracking dominated the
cracking behavior of the torsional tests, especially at longer fatigue lives
(Fig. 13). Therefore, it is expected that the principal strain parameter will
i |i

15
be more effective in correlating torsional and axial fatigue data at longer
lives. The discrepancy between axial and torsional data using the shear
parameter (Fig. 12) is expected because damage formulations based on principal
strain have been shown to be most effective for materials dominated by
Stage II cracking.
Socie et al. [30] proposed a modification to the Brown-Miller [17]
parameter in the form
!
^ ^ ^ , Tf by + En + Ono/E : yf (2Nf)c +--_ (2NF) . (5)
This was used to correlate LCF data for Inconel 718 under various
uniaxial and multiaxial cyclic loading conditions. Cracking observations of
this material indicate shear crack dominated fatigue lives [24,29,30I. At the
strain amplitudes investigated, specimens subjected to both tensile and
torsional loading predominantly displayed shear cracking. The suggested
damage parameter correlated fatigue lives for Inconel 718 to within a factor
of two.
However, using this parameter to correlate axial and torsional 304 stain-
less steel data (Fig. 14), a Factor of 5 difference in life is observed. This
correlation is an improvement over the maximum shear strain parameter
(Fig. 12), but is still not as effective as the principal strain parameter
(Fig. 11). For the torsional strain amplitudes examined here, stage I
cracking only occurred during the First 5 to 35 percent of the fatigue life.
Lack of observable stage I cracking in uniaxial tests and the presence of
limited stage I cracking in torsional tests indicates that a shear based
parameter is not appropriate to correlate both sets of data. Examining the
two loading conditions more closely it is observed that when applied to fully
reversed torsional tests, Socie's parameter will be equivalent to the maximum
16
shear strain amplitude parameter. However, in uniaxial tests a strain normal
to the plane of maximum shear strain results (Fig. 15). Under fully reversed
uniaxial conditions, the E term will improve correlations with torsional datan
in comparison to a simple shear strain amplitude parameter.
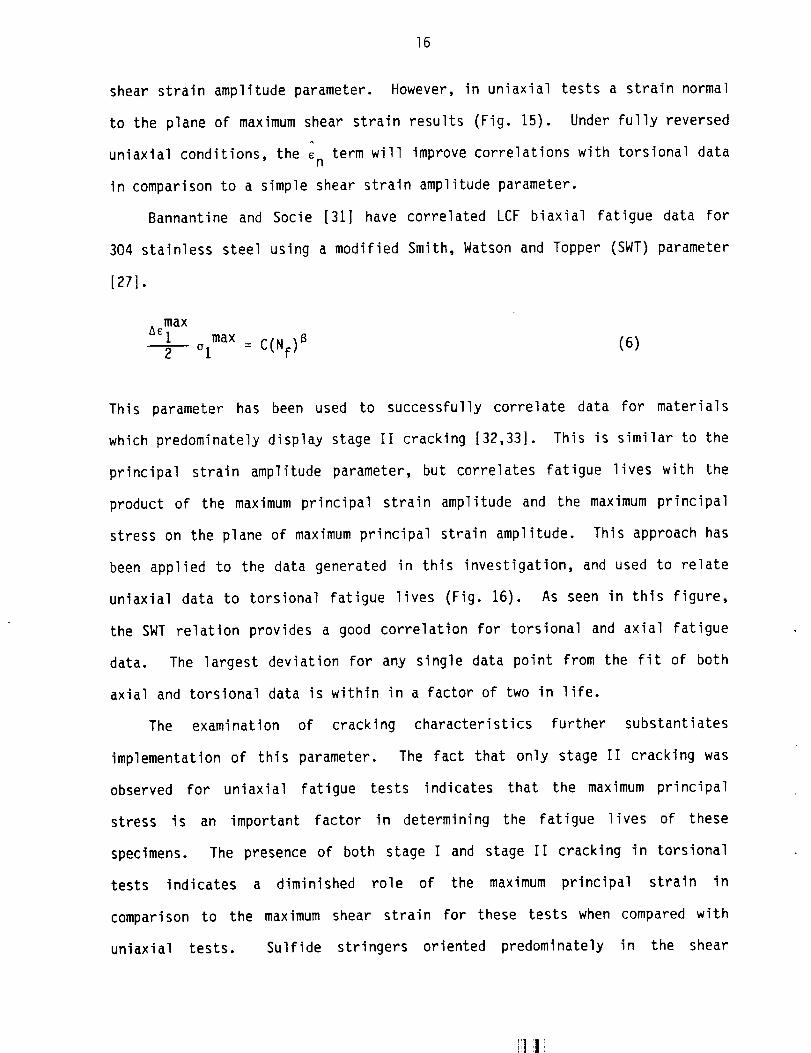
Bannantine and Socie [311 have correlated LCF biaxial fatigue data for
304 stainless steel using a modified Smith, Watson and Topper (SWT) parameter
[271.
a maxEl max B
2 °I = C(NF) (6)
This parameter has been used to successfully correlate data for materials
which predominately display stage II cracking t32,331. This is similar to the
principal strain amplitude parameter, but correlates fatigue lives with the
product of the maximum principal strain amplitude and the maximum principal
stress on the plane of maximum principal strain amplitude. This approach has
been applied to the data generated in this investigation, and used to relate
uniaxial data to torsional fatigue lives (Fig. 16). As seen in this figure,
the SWT relation provides a good correlation for torsional and axial fatigue
data. The largest deviation For any single data point from the fit of both
axial and torsional data is within in a factor of two in life.
The examination of cracking characteristics further substantiates
implementation of this parameter. The fact that only stage II cracking was
observed for uniaxial fatigue tests indicates that the maximum principal
stress is an important factor in determining the fatigue lives of these
specimens. The presence of both stage i and stage II cracking in torsional
tests indicates a diminished role of the maximum principal strain in
comparison to the maximum shear strain for these tests when compared with
uniaxial tests. Sulfide stringers oriented predominately in the shear
rl l!

17
orientation for torsional tests could also be responsible for the observation
of shear direction cracks. However, the dominant cracking behavior in these
tests is characterized by stage II cracks, except at the highest shear strain
amplitude (Fig. 17). This indicates that the maximum principal stress ampli-
tude is eminent in determining the fatigue life.
As seen in Fig. 14 the principal stress for a given shear strain will be
greater for a uniaxial test than for a fully reversed torsional test. There-
fore, using the product of the principal stress and strain as a damage param-
eter will improve correlation between axial and torsional fatigue lives. This
parameter is similar to the simple principal strain parameter discussed
earlier, but it accounts for the differing stress states occurring in
torsional and axial tests. The tensile stress for the same tensile strain
range is lower in a tension test.
3.2 Multiaxial Results
3.2.1 Analysis of Biaxial Strain Paths
Four biaxial loading histories (path O, N, P, Q) employed in this
investigation are depicted in Fig. 5. Each of these biaxial paths have the
point y = ¢3 E in common). Path C is proportional and paths N, P, and Q are
non-proportional out-of-phase loadings.
A Mohr's circle analysis, similar to the method used in Ref. 29, has been
employed to illustrate differences between these strain states. For the bi-
axial proportional path, C, (Fig. 16), the points x and y represent planes
which are parallel and perpendicular to the specimen axis respectively. It is
noted that the two planes of maximum principal strain amplitude will not
change orientation with regard to the specimen during a loading cycle. How-
ever, the plane of maximum principal strain does change between these two
planes during the loading cycle. This is illustrated by examining the state

18
of strain at points 3 and 5 (Fig. 16). From the Mohr's circle analysis it is
seen that the plane of maximum principal strain at point 5 is oriented at an
angle of 180 ° on Mohr's circle from its position at point 3 (this corresponds
to a 90 ° change with regard to the specimen orientation). This change in the
principal strain plane is characteristic of any fully reversed loading. The
maximum principal strain will occur on one of the two planes for any loading
with an axial component. The maximum principal strain experienced during the
loading cycle occurs at point 2. This plane is differentiated from the plane
of principal strain at point 8 by the Fact that the value of the principal
stress is greater at point 2 than at point 8. As a result the largest value
of the SWT parameter will be on this plane, and physical damage would be
expected to occur on this plane.
Non-proportional and out-of-phase path characteristics are visualized by
employing the same concepts used for the proportional loading. The 90 ° out-
of-phase path is depicted in this manner in Fig. 17. An important character-
istic of out-of-phase loading is that the orientation of the principal strain
plane is not constant with regard to the specimen axis, rather it rotates
continuously during the loading cycle. Another important characteristic of
this type of loading path is that the maximum principal stress and the maximum
principal strain do not necessarily occur at the same point during the loading
cycle. This type of behavior (Fig. 18) will only be observed when plastic
deformation, resulting in stress-strain hysteresis, occurs. When implementing
the SWT parameter to analyze this type of deformation behavior, one would
choose the plane of maximum principal strain amplitude and use the maximum
principal stress experienced by that plane.
Figures 19 through 22 depict the principal and shear strain amplitudes
experienced on each plane for the biaxial loading paths examined. Also shown
are the values of fatigue damage calculated via Eq. (5) (Socie's shear

19
parameter) and Eq. (6) (SWT parameter) for these planes. The values of the
four parameters depicted in these figures were obtained from an analytical
deformation model incorporating out-of-phase strain hardening. This model
compared favorably with experimental results. The 0° plane corresponds to
the plane which is perpendicular to the specimen axis. For angles less than
0° one would rotate in the clockwise direction from the 0° plane. For
proportional in-phase loadings (Fig. 19) the planes of maximum shear strain
amplitude and maximum principal strain amplitude are oriented at an angle of
45° with respect to one another. It should be noted that for the 90 ° out-of-
phase and box path (Figs. 20 and 22), planes of maximum shear strain amplitude
can occur at an angle which is less than 45 ° from the plane of maximum prin-
cipal strain amplitude. This is a deformation characteristic sometimes dis-
played by out-of-phase loadings. The two box path (Fig. 21) does not display
this phenomenon, even though it is an out-of-phase loading. Additionally, for
in-phase loadings the plane experiencing either the maximum principal strain
amplitude or maximum shear strain amplitude correspond to the maximum value of
fatigue damage calculated by Eqs. (5) and (6), respectively (Fig. 19).
Examination of Figs. 20 through 22 reveals that this is not always the case
for out-of_phase loadings, and the interpretation of the damage parameters is
not as straightforward. Cracking behavior will be employed to clarify this
difference in the subsequent discussion.
3.2.2 Biaxial Surface Crack Observations
The replication procedure previously described was used to monitor
surface crack growth and crack direction which occurred in biaxial Fatigue
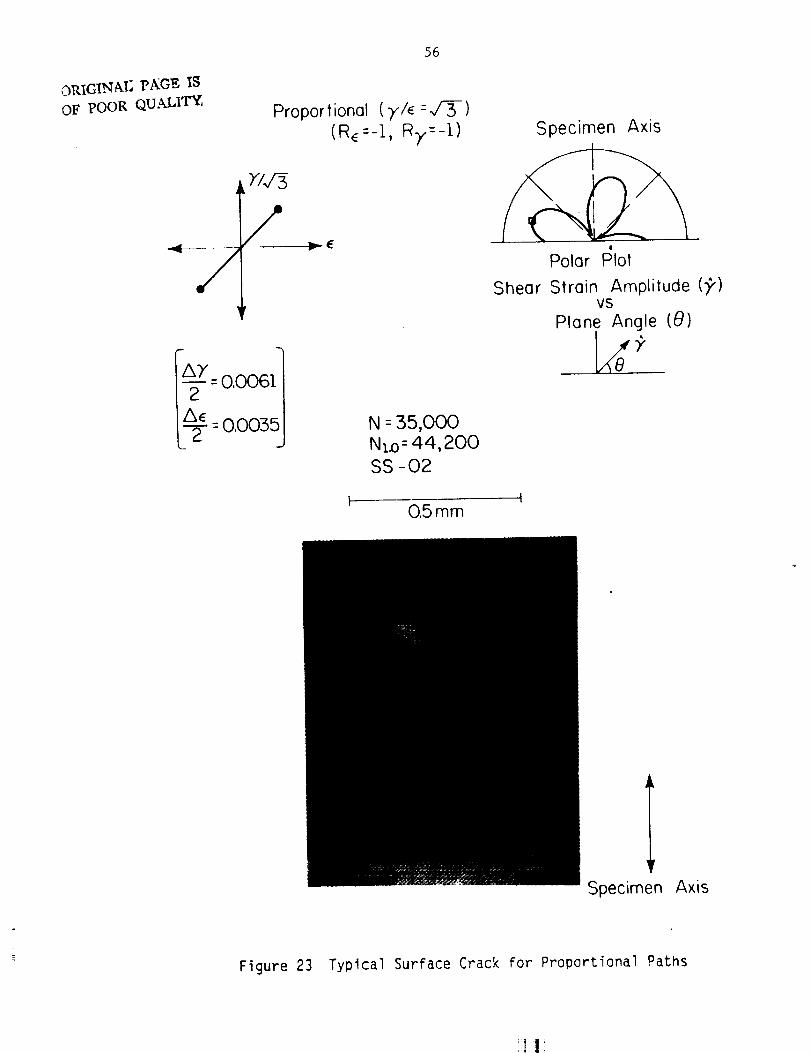
tests (Sec. 2.4). Initial crack growth occurred near the plane of maximum
principal strain amplitude for the proportional path C. It is also noted that
the shear strain amplitude on this plane is zero (Fig. 19). AFter initiation

20
on this plane the crack changes direction and grows on a new plane which is
max plane (Fig. 23) Thisoriented at approximately 10° degrees from the a_ 1
new plane experiences a principal strain amplitude, AE_, which is nearly the
same magnitude as a_imax(aE _ ~ 0.9 aElmax). This secondary plane is
distinguished from the plane of initiation by the presence of a shear strain
amplitude that is approximately equal to 1/2 aymax for the entire cycle, as
• maxopposed to no shear strain on the a_I plane. Fatigue life predictions were
made on the basis of stress-strain response on the plane of maximum principal
strain amplitude. This is considered to be the most damaging plane for this
material. The fact that long crack growth for path C occurred on a plane
which experiences a principal strain amplitude that is less than aElmax may
account for the slight increase in experimentally observed lives when compared
to SWT predicted lives. Mixed mode fracture mechanics type crack growth may
dominate the "long" crack direction and growth rate [34], but since crack
formation dominates the fatigue life for these tests no effort will be made to
elaborate on "long" crack growth. The quote marks on "long" result from the
lack of consensus in defining long and short cracks.
Cracks nucleate on the plane of maximum principal strain amplitude for
the 90 ° out-of-phase, Box, and Two Box (N, P, Q, respectively). Crack
propagation from the Two Box path, Q, (Fig. 24) appears to take place during
the nominal fully reversed tensile part of the loading cycle with no shear
strain, even though it is not the plane of maximum principal strain ampli-
tude. As seen in Fig. 20, the maximum principal strain amplitude is essen-
tially constant on all planes for the 90 ° out-of-phase path, which indicates
numerous specimen orientations could experience similar fatigue damage.
Therefore a distinct cracking direction is not as likely to occur for this
loading path. A change in cracking directions was observed for paths N, P,
and Q, (Figs. 24-26). A possible explanation for the change in crack direc-

21
tion also could cite mixed mode fracture mechanics longer crack growth. The
fact that less than I0 percent of the life was spent in crack propagation on a
plane other than the plane of initial crack growth (Figs. 27 and 28) indicates
that it will have a minimal effect on the fatigue life for the tests
conducted.
From the previously discussed torsional and axial tests it was determined
that the cracking behavior of this material is characterized by Stage II
cracking. This is further substantiated by the observation that in biaxial
fatigue tests cracks nucleated on maximum principal strain amplitude planes.
This cracking behavior appears to dominate damage accumulation for the range
of fatigue lives investigated. Appendix A contains documentation of crack
growth versus number of cycles obtained from the acetate tape replicas.
Photos providing similar data, as presented in Figs. 23-26, of the crack
direction for all tests are summarized in Appendix B.
3.2.3 Biaxial Fatigue Life Predictions
Fatigue Life predictions for multiaxial loading conditions should
account for the variation of stress-strain response uniquely associated with
each loading path. Additionally, life prediction parameters should coincide
with physical damage observations. Specifically, an appropriate parameter
should take into account crack initiation and growth direction. The previous
examination of fully reversed torsional and axial cracking behavior estab-
lished that cracking in 304 stainless steel occurs in the direction perpen-
dicular to the maximum principal strain amplitude (Stage II). Correlation of
fatigue lives with the maximum principal strain amplitude was deemed
appropriate because this was in agreement with the observed physical damage,
which was dominated by Stage II cracking.

22
This concept is now extended to the prediction of the multiaxial fatigue
lives resulting from the loading paths under examination. Socie [35J has
generalized the
follows:
Smith-Watson-Topper parameter for multiaxial loading as
_2
= , , b+c of _2ba_l almax of ef (2Nf) +_ (2Nf, (7)2
It is important to note that the coefficients and exponents on the right hand
side of the equation are material constants and can be obtained from the axial
smooth specimen strain-life data. The terms on the left hand side of the
equation are interpreted as the maximum principal strain amplitude and the
maximum stress normal to that plane. For out-of-phase loadings this does not
always imply the maximum value of the damage parameter.
McDowell et al. [361 has investigated the stress-strain response of 304
stainless steel under conditions of multiaxial out-of-phase cyclic loading.
He observed that this material displays cyclic hardening resulting from out-
of-phase loadings. The degree of hardening is more pronounced than the cyclic
hardening experienced during in-phase loading as is illustrated in Fig. 29.
In other words, the stable cyclic stress strain response for out-of-phase
tests differs from that of in-phase tests and is dependent on the degree of
nonproportionality in the path under consideration.
The SWT parameter has been employed to predict fatigue lives for both the
in-phase and out-of-phase paths under investigation. The cyclic loading
conditions investigated display shorter lives for out-of-phase tests. This
parameter is deemed appropriate for two reasons: 1) Correlation of fatigue
lives with the maximum principal strain amplitude is consistent with the
observed physical damage. Specifically, as previously discussed, initial
crack formation resulting from both in-phase and out-of-phase tests displayed

23
Stage II characteristics. 2) The degree of cyclic hardening, which is
dependent on the degree of non-proportionality, is taken into account with the
maximumprincipal stress term. The correlation of the fatigue life data,
generated in this investigation, with the SWTparameter is illustrated in
Fig. 30. The theoretical life predictions resulting From both forms of the
SWTparameter, Eqs. 6 and 7, are displayed in this figure (linear and bilinear
respectively). It is noted, that for the range of fatigue lives under
consideration, that both forms of the SWTparameter give very similar life
predictions. Fully reversed uniaxial data was used to fit Eqs. 4 and 7.
The implementation of the SWTparameter for these various biaxial loading
conditions illustrates the importance of accurately modeling the stress-strain
response which results from various biaxial cyclic loadings. This parameter
provides a good life prediction model for 304 stainless steel, a material
which fails in a tensile manner, when the stress strain response of out-of-
phase loadings is taken into account.

24
4. CONCLUSIONS
i. Uniaxial strain controlled tests were conducted on 304 stainless steel.
Axial fatigue lives and cracking observations were compared with previous data
for torsional tests.
a. Stage II cracking dominated fatigue lives for uniaxial specimens at
all strain amplitudes tested. Crack growth data from previous
research [23] indicates that except For LCF torsional tests (i.e. <
10,000 cycles) only 5 to 35 percent of the fatigue life was spent
initiating and propagating stage I cracks.
b. Macroscopic crack propagation accounted For a greater percentage of
the fatigue life as strain amplitude increased.
c. Macroscopic cracking behavior indicates that a damage parameter based
on principal strain amplitude is most appropriate for this material.
d. The Smith, Watson, Topper parameter, a modification to the principal
strain amplitude theory, correlates axial and torsional fatigue
lives, to within a factor of two.
2. Biaxial strain controlled Fatigue tests were conducted on 304 stainless
steel. Observed physical damage was used to substantiate th extension of the
SWT damage parameter to multiaxial fatigue life predictions.
a. Stage II type cracking dominated the fatigue lives for both the in-
phase and out-of-phase biaxial tests.
b. At the strain amplitudes investigated, fatigue lives were dominated
by crack nucleation.
c. The stable cyclic stress-strain response differed for proportional
and out-of-phase ]oadJngs. A higher stable stress response for a
given strain amplitude was observed for the out-of-phase tests in
comparison to proportional Ioadings.
F11

25
dD
e.
Correlation of both In-phase and out-of-phase testing with the SWT
parameter to within a factor of 2½ with regard to life is possible
due to the observed damage mechanism (i.e., crack direction) being
consistent with prior data and consideration of the stress-strain
response which is dependent on the type of loading (i.e. in-phase or
out-of-phase).
Longer crack growth directions change for the biaxial loadings
considered, and for components or specimens where "long" crack growth
dominates the fatigue life, alternate damage assessment may be
appropriate.

26
REFERENCES
1. Elliott, D., and Tupholine, S. M., An Introduction to Steel Selection:
Part 2_ Stainless Steels, Oxford University Press, 1981.
2_ Metals Handbook, Ninth Edition, Vol. 3, Properties and Selection:
Stainless Steels_ Tool Materials and Special Purpose Metals, The AmericanSociety for Metals, 1980, pp. 882.
3. Source Book on Stainless Steels, ASM, American Society for Metals, 1980,
pp. 408.
4. Peckner, Donald, and Berstein, I. M., Handbook of Stainless Steels,
McGraw-Hill Inc., 1977, pp. 800.
. Peters,n, R. E., "Discussions of a Century Ago Concerning the Nature ofFatigue and Review of Some of the Subsequent Researches Concerning theMechanism of Fatigue," ASTM Bulletin, American Society for Testing andMaterials, 1950, pp. 50-56.
6. Wolher, A., Zeitschrift fur Bauwesan, Vol. 8, 1858, p. 641.
7. Basquin, O. H., "The Exponential Law of Endurance Tests," Proc. ASTM,
1910, pp. 625-630.
. Coffin, L. F., Jr., "Fatigue at High Temperature - Prediction andInterpretation," Proceedings The Institute of Mechanical Engineers,Vol. 188, 1974, pp. 109-127.
9. Coffin, L. F. Jr., " A Study of Cyclic Thermal Stresses on a Ductile
Metal," Transactions: ASME, Vol. 76, 1954, pp. 931-950.
10. Manson, S. S., "Behavior of Materials Under Conditions of Thermal
Stresses," Proc., Heat Transfer Symposium, University of Michigan Research
Institute, 1953, pp. 9-10.
11. Coffin, L. F., Jr., "Fatigue at High Temperature-Prediction and
Interpretation," James Clayton Lecture, Proceedings of the Institute of
Mechanical Engineers, Vol. 188, 1974, pp. 109-127.
12. Findley, W. N., "Fatigue of Metals under Combinations of Stresses," Trans.
ASME, Vol. 79, 1957, pp. 1337-1348.
13. Garud, Y. S., "Multiaxial Fatigue: A Survey of the State of the Art,"Journal of Testing and Evaluation, Vol. 9, No. 3, May 1981, pp. 165-178.
14. Krempl, E. "The Influence of State of Stress on Low-Cycle Fatigue ofStructural Materials: A Literature Survey and Interpretive Report," ASTM
STP549, American Society of Testing Materials, 1974, pp. 46.
15. Lanza, G., "Strength of Shafting Subjected to Both Twisting and Bending,"Transactions ASME, Vol. 8, 1886, pp. 130-144.
16. Guest, J. J., "Recent Research on Combined Stress," Proceedings
Institution of Automobile Engineers, Vol. 35, Dec. 1940, pp. 33-72 and146-171.
] l!

27
17. Brown, M. W., and Miller, K. J., "A Theory for Fatigue Under Multiaxial
Stress-Strain Condition," Proc._ Inst. Mech. Enqrs., Vol. 187, 1973.
18. Mason, W., and Delaney, W. J., "Alternating Combined Stress Experiments,"
Reports British Association for the Advancement of Science, London, 1921,pp. 329-341.
19. Ewing, J. A., and J. C. W. Humphrey, "The Fracture of Metals and Repeated
Alterations of Stress," Philosophical Trans. of the Royal Society ofLondon, Series A, Vol. 200, 1903, Part 1, pp. 241-250.
20. Forsyth, P. J. E., "A Two Stage Process of Fatigue Crack Growth,"
Proceedinqs of the Symposium on Crack Propagation, Cranfield, England,1961, pp. 76-94.
21. Kurath, P., Socie, D. F., and Morrow, J., "A Nonarbitrary Fatigue Crack
Size Concept to Predict Total Fatigue Lives," Technical Report AFDL-TR-79-
3144, Air Force Flight Dynamics Laboratory, Wright-Patterson AFB, Ohio,Dec. 1979, pp. 53.
22. Bannantine, J. A., "Observations of Tension and Torsion Fatigue CrackingBehavior and the Effect on Multiaxial Damage Correlations," M.S. Thesis,Department of Mechanical Engineering, University of Illinois at Urbana-Champaign, Urbana, IL, 1986.
23. Smith, K. N., Watson, P., and Topper, T. H., "A Stress-Strain Function for
the Fatigue of Metals," Journal of Materials, Vol. 5, No. 4, Dec. 1970,pp. 767-778.
24. Waill, L. E., "Crack Observations in Biaxial Fatigue," M.S. Thesis,Department of Mechanical Engineering, University of Illinois at Urbana-Champaign, Urbana, IL, 1983, pp. 61.
25. Fash, J. W., "Fatigue Crack Initiation and Growth in Gray Cast Iron,"
Fracture Control Program, Report No. 35, College of Engineering,University of Illinois, 1980, pp. 47-50.
26. Dowling, N. E., "Crack Growth during Low-Cycle Fatigue of Smooth Axial
Specimens," Cyclic Stress-Strain and Plastic Deformation Aspects of
Fatigue Crack Growth, ASTM STP 637 Ed., American Society for Testing andMaterials, 1977, pp. 97-112.
27. Jacquelin, B., Hourlier, F., and Pineau, A., "Crack Initiation Under Low-
Cycle Multiaxial Fatigue in Type 316L Stainless Steel," Transactions ASME,Vol. 105, 1983, pp. 138-143.
28. Forsyth, P. J. E., "Fatigue Damage and Crack Growth in Aluminum Alloys,"ACTA Metallurqica, Vol. 11,f 1963, pp. 703-715.
29. Koch, J. L., "Proportional and Non-Proportional Biaxial Fatigue of Inconel
718," M.S. Thesis, Department of Mechanical Engineering, University ofIllinois at Urbana-Champaign, Urbana, II, 1985, pp. 146.
30. Socie, D. F., and Shield, T. W., "Mean Stress Effects in Biaxial Fatigue
of Inconel 718," J. of Enqineerinq Materials and Technology, Vol. 106,1984, pp. 227-232.

28
31. Bannantine, J. A., and Socie, D. F., "Observations of Cracking Behavior inTension and Torsion Low Cycle Fatigue," Presented at ASTMConference onLowCycle Fatigue: Directions for the Future (to be published as an ASTMSTP) Bolton Landing, NY, Sept. 30 - Oct. 4, 1985.
32. Socie, D. F., Fash, J. W., Downing, S. D., "Fatigue of Grey Cast Iron,"Fracture Control Program No. 44, University of Illinois at Urbana-Champaign,October, 1982.
33. Furman, Peter J., "Fatigue of Grey Cast Iron under Axial and BendingLoads," M.S. Thesis, Department of Mechanical Engineering, University ofIllinois at Urbana-Champaign,Urbana, IL, 1983, pp. 50.
34. Hua, C. T., "Fatigue Damageand Small Crack Growth During BiaxialLoading," Ph.D. Thesis, Department of Mechanical and IndustrialEngineering, University of Illinois at Urbana-Champaign, 1983, 158 pp.
35. Socie, D. F., "Multiaxial Fatigue DamageModels," submitted to Journal of
Engineering Materials and Technoloqy, 1986.
36. McDowell, D. L., and Socie, D. F., "Transient and Deformation Behavior
Under Cyclic Nonproportional Loading," Multiaxial Fatigue ASTM STP 853,K. J. Miller and M. W. Brown, Eds., American Society for Testing and
Materials, Philadelphia, 1985, pp. 64-87.
] !

29
Table 1
Composition of 304 Stainless
Element Actual Min
Chromium 19.2
Nickel 10.8
Manganese 1.6Silicon 0.40
Phosphorous < 0.01Carbon 0.057
Sulfur 0.023
18.0
8.0
Steel
Max
20.0010.502.001.000.0450.080.03

30
Table 2
Baseline Material Properties
Monotonic Tensile Properties
E_
Oy2%,
0
U'
of,
_f,
%RA,
K
n,
Rb
Elastic Modulus
.2% Offset Yield Strength
Ultimate Strength
True Fracture Strength
True Fracture Strain
% Reduction in Area
Strain Hardening Coefficient
Strain Hardening Exponent
Rockwell Hardness
183 GPa
325 MPa
650 MPa
1400 MPa
1.61
8O
1210 MPa
0.193
72
Axial Cyclic Properties
E9
oF
b
I
_f
C
K'
n'
(R = -1)
Elastic Modulus
Fatigue Strength Coefficient
Fatigue Strength Exponent
Fatigue Ductility Coefficient
Fatigue Ductility Exponent
Cyclic Strain Hardening Coefficient
Cyclic Strain Hardening Exponent
185 GPa
1000 MPa
-0.114
0.171
-0.4O2
1660 MPa
0.287
Torsional Cyclic Properties (Ry = -1)
G
_f
b
Yf
C
K'
n'
Torsional Modulus
Fatigue Strength Coefficient
Fatigue Strength Exponent
Fatigue Ductility Coefficient
Fatigue Ductility Exponent
Cyclic Strength Coefficient
Cyclic Strain Hardening Exponent
82.8 GPa
709 MPa
-0.121
0.315
-0.353
785
0.295
IRi

31
Table 3
Uniaxial Constant Amplitude Fatigue
Material: 304 Stainless Steel
Data
Spec. acl2
No.
Stable Half
Rc E a_p/2
(GPa)
Life Response
_o/2 oo
(MPa) (MPa)
Nf
(cycles)
O3 0.0100
09 0.0100
06 0.0060
06* 0.0046
O1 0.0035
I0 0.0035
Ii 0.0035
15" 0.0035
12 0.0020
2 0.0020
-I -- 0.0080
-i 191 0.0078
-I 172 0.0038
-i -- 0.0031
-i -- 0.0021
-i 186 0.0021
-i 194 0.0021
-i -- 0.0022
-I 192 0.0008
-i 172 0.0008
383 2.0
426 -1.4
379 -21.9
279 0
261 5.8
258 -9.1
266 8.4
240 -2.2
230 16.5
206 2.9
1,070
1,167
6,080
10,300
30,700
33,530
29,000
38,500
286,400
333,100
*Tubular Specimen Data [22]
32
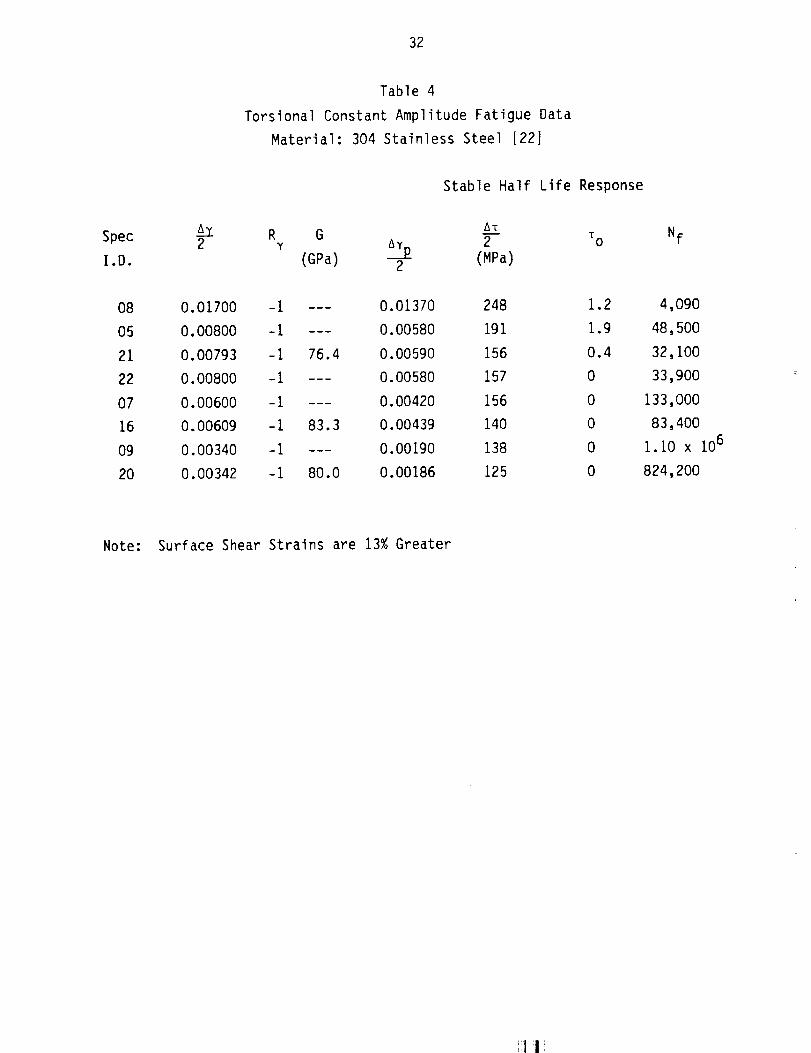
Table 4
Torsional Constant Amplitude Fatigue Data
Material: 304 Stainless Steel [22J
Spec
I.D.
Stable Half Life Response
_2C R G A__Ty ay_ 2(GPa) (MPa)
08 0.01700 -I --- 0.01370 248
05 0.00800 -i --- 0.00580 191
21 0.00793 -I 76.4 0.00590 156
22 0.00800 -i --- 0.00580 157
07 0.00600 -i --- 0.00420 156
16 0.00609 -i 83.3 0.00439 140
09 0.00340 -i --- 0.00190 138
20 0.00342 -i 80.0 0.00186 125
TO Nf
1.2
1.9
0.4
0
0
0
0
0
4,090
48,500
32,100
33,900
133,000
83,400
i. I0 X 106
824,200
Note: Surface Shear Strains are 13% Greater
I I
33
0 0 0 00 0 0 00 O_ 0 0
_ 0
0 0 0 0_ 0 0t'_ 0 0
0 0 _ 0 0 0 0 0,-_ 0 _ 0 CO 0 0 0
_ _ 0 0 CO 0 0
0 _ 0 0,--- OJ
.4-)
.r--
n:I r---
LJ.J
ILl
I'--" 0
I---
L_ (/I (.,S'IDa_ ,., <12
-_ c- --Jl--
•,- -I-) 0
_-- _ 0
_ °. _ _
_- °t-O l,.-
or-
m i'-/
I-'-
_ O -w
0 0 0 00 0 0 0
0 0 0m m m
'_" '_ 0 0
I
Ch ,-_ 0'I 00 0 O0
O,J _ {:::) 0I
O0 r--. uO t._,,--4 .,,,..--4 ,,---i ,r.-,l
0 0 0 0
0 0 0 0
0 0 0 0
0 0 0 0
0 0 0 0
0 0 0 0_" 0 0 0
I I I
_D _ WD _
_ 0 0
0 0 0 0
0 0 0 00 0 0 0
0 0 0 C)
0 0 0 0
0 0 0 0•--_ 0 0 0
0 0 0 r'_r-
0 0 0 "::I"
0 0 0 0
C_ 0 C_ 00 0 0 0
0 0 0 0
0 0 0 0
0 00 0 0
I _ _
I _ _ O_II I_ CO
L",,J _ r-"-I I I I
r-., _)
r-., L._
L_ _ 0 0
0 0 0 0
0 0 0 00 0 0 0
0 0 0 0
0 C_ 0 0
<]
_ _ _ _ _ 0 0
0 0 0 0 0 0 0 00 0 0 0 0 0 0 0 8888
¢M ¢M _'- r--
0 0 0 00 0 0 0
c; c; c; c;
0 _ _I I I I I I I !
_ 00 _ _I I I I
0 0 _I I I I
L/') L,,") G")
"1'- W
0__ ___
Z

34
c_Jr_
J
_J7 _
°____ °,-4 ,_
O
c_
EC_
i mm
T z
/ \
r_
0
E.r-
c'-
U
CL
f_
C_
aJi..
LID

35
O3
II
o,J
iI
I ("JIII
4
I
IIII
c L{_Iic'J
"_ I iI I
C). -_ I I CO
| I I r_I I II
I
I II II II II II I' I
C_
i,
=4.=.--
T oc.
i/Ico
°_
u'1coJE
r--1
coJE
, i=...
_J0Jci
b_
.i--
x
n_
c_J
f,,-
°,-.
i,

36
(D(I)
o0
(.J3
(D
om
E)..0---
o0
0PO
0
oo..E:
0EL
o_
"0CD
o,0
0
DD
m
E3C0
..4---
Or_0--0
EL
nq
C0
Qm
<_
Av
C_
X0
r'n
n
x:0
m
z __ .ca
D_
o0Ob
r---
GJ4._
OJ
f-
4_
f.-0
J_
0_
_r_
0d
X
.if
rn
_J
::J
oBI
I.L
iii iI_

37
ORi_LNA_ _nv
OF POOR QUALITY
IA_22Er:O
:0,01 I
N :i000N: 1167
SS09
AXIAL
(R_:-I,R¥ =1) Specimen Axis
Polar Plot
Shear Strain Amplitude ()i,)vs
Plane Angle (8)
N :Ii00N:I167SS09
0,5 mm t I0,5 mm
Specimen Axis
Figure 4 Typical Surface Crack Features, -_ : O.OI

38
oPJGINAL ['_"-' :"
OF POOR QUALITY
AXIAL
( R_ =-1, R),, =1 )
N = 24,500
Nf =29,000
SSl1
I I0,1 mm
Specimen Axis
Polar Plot
Sheer Stroin Amplitude ()?,')vs
PIGne Angle (8)
Specimen Axis
Figure 5 Typical Surface Crack Features, --_ = 0.0035

00,
0
0II
¢'d
0I
¢/)¢/)
0
0
s._
¢/)
L_
0
Ii
wm
It.m
wm
X<
39
r.--iC9
8II
t"El_¢10
_'_0
U
q-
{1)
GJ-'1
°r,-
tiC)
or-

40
OO
IIN
t@,¢1
,,r,,=
Itot0tO,,,,O
o
tO,,,,t...._
to
t.._
4,,,,a
O
i....
Lk
t_,i,,0,,,,a
It.i
,i
X<
L_
C30
0
II
&.C
l.,,
0I-U
IIK
_3
q_
I-
I1/i-
,r'-
I-l-
or-
1.1-
l-
-i--
=
OP_GYNAL PAGE I8
DE POOR QU,\1.TT¥

41
(apn.l.!ldwV
q0
u!oJlS) 8/_V
t.O
l.r)
(12
¢.2
v
t.1,,,,.
Z
R
00c$
Ill
I,#'lI,#'l
l,=.-
l"-0r_
C)
04-
___
4-°r--
_.J
a-a
O0
,r-
LL

r-4
(5
-4---
03
UO
c
E_
CO
©ro
_0
S- E
o,4_
42
0
U'3
_o
o_
rr)
0(5
4_4J¢I_ °t--
r_,-1
,l E
t-O _-
0-_
.._ ,_.-
U') _o_,t-
(1.) ,---u
x _-
Q) _-E_ o --,i
Z o×
l_r-E,r.-0 m
aJI-
,r--
ill!i_

43
O
.i m
09 CD
O X
o4
m
q.)q_
O9
u0(i)
C-
O.4---
09
©rr)
uOq.)
L)
LD
Z
C)
(I)I-
(3")
i,
r--_
C5C5
r,9
C)C)c_

,7"/V_I
AYT: o,oo8
Ii
I
J
"-E
44TORSION
(R_= 1, R7:-1) Specimen Axis
DRIG/NAE PAGE
.OF, POOR QUALITY Polar Plot
Shear Strain Amplitude (_,')vS
Plane Angle (8)
N =48,000
Nz.o= 42,000
SS-05
t 0.5 mm
Specimen Axis
Figure ii Typical Surface Crack Features, _-_Y= 0.008

45
i--IC5
r--t0c_
310u_÷ u_+/V V
u*)
or)
V
Z
£-
4-)_JE
£-
O.
L)0
C
u'l
ii:1
0
t-O
V1L0
I--
e-
r.-.-
,I--
x
4-0
Cou_
.t-
O
¢...)
,--i
iI#
u_

46
T
-0"
O" O'mox
Torsion Tension
TensionTorsion
Figure 13 Comparison of Axial and Torsional Stress and Strain States

47
o.
Z
r--1
C5
l'-
0
r- $._0
0
ml
r
• r- 0
Xl--
0 0
o _
,r,-
l.-
n4..JE,r-OE
G.)S-

48
ORIG[NAI_ PAGE IS
OF. POOR QUALITY,TORSION
(R_: 1, RT:-l)
E
Ay:o,o 72
____£E= 0
L 2N = 800
Nlo = 1,570SS-08
0,5 mm
Specimen Axis
Polar Plot
Shear Strain Amplitude (_,)vs
Plane Angle (8)
Specimen Axis
Figure 15 Typical Surface Crack Features, _-_: 0.017
I I _

49
Linear, Proportional
y/2
1)
E 12345678
_>t 4
, 1234567 8 6y
@
2) (5) 4)
(6) (7)(5) (8)
Figure 16 Illustration of the State of Strain for Proportional Path

50
90 ° Out of Phgse
d_
j
E
_
5 5 7 1 5 5
3 5 7 1 3 5I I I I w I
_tr
Y'Planes
(1)
JX
(2) (3) (4)
(5) (6) (7) (8)
Figure 17 Illustration of the State of Strain for 90 ° Out-of-Phase Path

51
-- -----Ib- E
90 ° out of Phose
S8._T
R
E
SS
STAINLESS STEEL SPEC SS13 COMPOSITE PLOT
F Maximum Stress
_axlmum Strain
e.g8 8.58
AXIAL STRAIN E,-e_
Figure 18 Stress Strain Response for Out-of-Phase Loading

_52
Od
\\
\\\
\\
0Qo o°-
0If)
C3_C
• 1
"C3CD0
_J
oc_-_.o
c-
O°c-
O
o
0_
g0/
*r'-
E
e--r-- --
L
0
0°r--
or-
l-
.Il-
l,
!i 1_

53
/! / '
] ,0Q o
o c5 S
if3
if,
0
0 _
if')
I

54
I'O OJ
<:3
!!
0
rl,
X0
r_
03:
I'--
r-
AJ
4-0
E0
5,-I'O
::J
LI-

55
r-4-}rt_
P,
X0
d
:3
°r-"
E
E,r-
I...4J
4-0
(,-
0,r,-
,r-"
L
_M
l-
,r-LL
ORIGINAI_ p/_GE IS
OF POOR QU._LITY,
56
Proportional (¥/E :.Y_-)
(RE =-1, RT:-I)
/
r/J3
/•,---E
Z_7" 0,0061
---_: 0,0035L.
N = 55,000
N x_)= 4 4,200
SS -02
t I0,5mm
Specimen Axis
Polar F_lot
Shear Strain Amplitude (_')VS
Plane Angle (e)
ISpecimen Axis
Figure 23 Typical Surface Crack For Proportional Paths

57
DRIG_rNAE PACg Ig
OF POOR _UAI.[Ty
90 ° OUT OF
(R_ =-1, R7
r =0,0020
-- E
PHASE
:-1)Specimen Axis
Polor Plot
Sheer Str(]in Amplitude ()_)vs
Plone Angle (8)
Ni,o = 35,300N : 25,000 SS - 29 N : 40,000
I I IO, 2 mm L,O mm
Sl:ecimen Axis
Figure 24 Typical Surface Crack for 90 ° Out-of-Phase Path

ORIGINAL pAGE I$
OE POOR QUALITY
58
TWO BOX PATH
(RE:-I, Ry:I) Specimen Axis
!
A7T :O'OO2Z
:0,0014N : 190,0OO
Nl,o: 182,OOO
SS-52
1,O mm
\ /
\/Polar Plot
Shear Strain Amplitude (_')VS
Plane Angle (0)
ISpecimen Axis
Figure 25 Typical Surface Crack For Two Box Path
] I_

59
D_GINAE PAGE IS
DF. POOR QUALITy
)'/,/_
BOX PATH
(RE=-I, Ry=l )
E
-_Y=0.0024I
L- :o.oo qN --85,OOO
0,5 mm
Nl.o= 90,100
SS-51
Specimen Axis
Polar Plot
Shear Strain Amplitude (_-)vs
Plane Angle (8)
N :95,000
I1,0 mm
!
Specimen Axis
Figure 26 Typical Surface Crack for Box Path

60
00qlo
Ol
C---4---
0£3_
_ (-- {1.)
0 0O_C0 c---0_
0o_
[]
[]
E3-
I I oC,,J _ 0 _
{ww}0
X
a,J4-
°
v _J
Z ot-
30f,,-
U
$,-
{XI t-..
,r-
!!11

61
f...
0
[]
C_
I
i
m
m
m
i
B
m
m
[]
I I
m
m
0 0
0 0 0 Eli]lIE]O]_i _
- 0 0 0 -,- 0 0 0.41,--
Ck O-
mOO
m
_ 0
___a_ __-_ "6-o 0-_=__ ×o_o
C/_ "-- 00-o_r o°O_ m
0 I-- G_ Obm o,,1,,o 4eOOO
II'_ O,J
(ww) o
o
oOCD
u_
Z
a
0 _o
L/I
4_
OJI--
X
I
G.IE
OJ
c-
O
tm
o
¢D
u
t_3
o0

62
ssaJIS
Coi
O
-,I==.-
CO
_:Ic--
IC
0
c/I
C
"E
-r-"
U _C;"_ 0
q- JiiZO r,,
II_ I.i.,.0 0IA I
01--. .i,-I
EE"_0 C
(-,)
Ohc_J
Q.I
IJ_
i!I !I _

63
r-I
(1)(1) 00(1) 0 0
(/3 o --CL
-_ o3•_ .o _ o
__O_ I-m0r_ • 4 nu _ I_, o
I
t
L._
2
(_. r-I
or)
(D
Z
n:l .i-_
E
• r-- fl_
• v-- I,-
c 0_l---
r- 00 m
0
¢t_ .t-•e- 1_XC,_
0 °_"
It- ,_,,-
o_m o
• v"- '_-
.t_
ic_. r"E._--0 _
0

64
APPENDIX A: CRACK GROWTH DATA
LIST OF TABLES
TABLE
A.1
A.2
A.3
A.4
A.5
A.6
A.7
A.8
A.9
A. IO
A.11
A.12
A.13
A.14
A.15
A.16
PAGE
Proportional,
Proportional,
Proportional,
Proportional,
A_ Ay__- = 0.0025, _ - 0.00432 ................. 65
A__ = 0.0025, _]C = 0.00432 ................ 66
0.00 , 0.00 .................
a_ _ 0 0035 69Torsional _-- = 0 =, , j .JooolJJm,eooloiJoe_oommm..
as90 ° Out-of-Phase, -- = 0.00353, = 0.00612 70...oooe.....
90 ° Out-of-Phase, _- = 0.00353, = 0,00612 ............ 71
90 ° Out-of-Phase, _- = 0.062, = 0.0035 ............... 72
90 ° Out-of-Phase, _- = 0.002, =0.0035 ................. 73
Box, _- = 0.0025, = 0.00432 ........................... 74
a_ _ 0 00432 75Box, _- = 0.0025, = . ...........................
Box, a_ ___- = 0.0014, = 0.0024 ............................ 76
Box, _ = 0.0014, _]C= 0.0024 ............................ 77
Two Box, _- = 0.0025, = 0.0043 ........................ 78
AETwo Box, _- = 0.0014, ay = 0.0024 .79
.Q.o.,o.....,..o,._,.ww
T_o_o×,_: ooo14,_: ooo24........................8o
!II!

65
Table A.I
Stainless Steel 304
Crack Growth Data
Specimen I.D. SS12 (Path C)
R = -I R = -IE y
a_/2 : 0.0025 ay/2 = 0.00432
N (cycles) L (mm) a I (mm) a2 (mm) a3 (mm)
50,000
45,000
40,000
35,000
30,000
25,000
3.769 0 3.769
1.225 0 1.225
0.612 0 0.612
0.319 0 0.319
0.175 0 0.175
0.047 0 0.047
0
0
0
0
0
0
Comments
Note: High
crack density;
failure is caused
by crack linkage

66
Table A.2
Stainless Steel 304
Crack Growth Data
Specimen I.D. SS02 (Path C)
R = -I R = -IE Y
A_/2 = 0.0025 ay/2 = 0.00432
N (cycles) L (mm) a I (mm) a2 (mm) a3 (mm)
53,031 9.08 0 9.08 0
45,000 1.05 0 1.05 0
35,000 0.37 0 0.37 0
25,000 0.12 0 0.12 0
15,000 0.05 0 0.05 0
I0,000 0.05 0 0.05 0
5,000 0.02 0 0.02 0
Comments
1 I!

67
Table A.3
Stainless Steel 304
Crack Growth Data
Specimen I.D. SS25 (Path C)
R = -I R = -Ic y
AE/2 = 0.0014 Ay/2 = 0.0024
N (cycles) L (mm) aI (mm) a2 (mm) a3 (mm) Comments
Failure 12.15 1.89 0.612 10.08 No visible
cracks before
failure.

N (cycles)
68
Table A.4
Stainless Steel 304
Crack Growth Data
Specimen I.D. SS26 (Path C)
R = -l R = -lE y
Ac/2 = 0.0014 ay/2 = 0.0024
L (mm) aI (mm) a2 (mm) a3 (mm)
Failure 18.9 ll.O 1.35
Comments
6.41No visible cracks
before failure.
i]I:

69
Table A.5
Stainless Steel 304
Crack Growth Data
Specimen I.D. SS27 (Path B)
R = 1 R =-IE y
a_/2 = 0 ay/2 = 0.0035
N (cycles) L (mm) a I (mm) a2 (mm) a3 (mm)
Failure 5.58 2.93 2.30 2.29
1,090,000 2.64 1.31 2.30 0.81
1,040,000 1.87 0.86 2.30 0.50
990,000 1.39 0.57 2.30 0.38
960,000 1.35 0.48 2.30 0.35
930,000 1.20 0.38 2.30 0.29
900,000 1.12 0.27 2.30 0.28
870,000 1.08 0.26 2.30 0.21
840,000 0.98 0.25 2.30 0.20
810,000 0.95 0.24 2.30 0.15
780,000 0.84 0.17 2.30 0.14
720,000 0.80 0.15 2.30 0.09
690,000 0.76 0.12 2.30 0.08
660,000 0.76 0.10 2.30 0.04
630,000 0 0.07 2.30 0
600,000 0 0.07 2.30 0
0 0 0 2.30 0
Comments
a3 bifurcates
Crack starts at
stringer inclusion

7O
Table A.6
Stainless Steel 304
Crack Growth Data
Specimen I.D. SSIO (Path N)
R = -I R = -IY
a_/2 = 0.00353 ay/2 = 0.00612
N (cycles) L (mm) aI (mm) a2 (mm) a3 (mm)
3,562 9.57 0 9.57 0
3,000 0 0 0 0
Comments

71
Table A.7
Stainless Steel 304Crack Growth Data
Specimen I.D. SS13 (Path N)
R = -I R = -IY
A_/2 = 0.00353 ay/2 = 0.00612
N (cycles) L (mm) a I (mm) a2 (mm) a3 (mm)
3,733 5.46 0 5.46 0
3,600 0 0 0 0
Comments

72
Table A.8
Stainless Steel 304
Crack Growth Data
Specimen I.D. SS28 (Path N)
R = -I R = -IE y
AE/2 = 0.002 ay/2 = 0.0035
N (cycles) L (mm) aI (mm) a2 (mm) a3 (mm)
49,818 -9.61 -4.85 -0.176 -4.80
45,000
40,000
35,000
30,000
25,000
20,000
15,000
i0,000
5,000
2.770 1.330 0.171
1.196 0.522 0.171
0.487 0.200 0.171
0.277 0.059 0.171
0.139 0 0.139
0.134 0 0.134
0.130 0 0.130
0.130 0 0.130
0.129 0 0.129
1.380
0.554
0.130
0.060
0
0
0
0
0
Comments
Cracks are too
thick for
accurate
measurement.
Bifurcation
I I!

73
Table A.9
Stainless Steel 304
Crack Growth Data
Specimen I.D. SS29 (Path N)
RE = -i Ry = -1
AE/2 = 0.002 ay/2 = 0.0035
(cycles) L (mm) a I (mm) a2 (mm) a3 (mm)
45,000 ~i0.08 4.420 -0.120 5.770
40,000 2.350 1.147 -0.114 1.149
35,000 0.910 0.422 0.III 0.430
30,000 0.335 0.152 0.III 0.119
25,000 0.152 0.040 0.III 0.038
20,000 0 0 0 0
Comments
Crack is
very thin

74
Table A.IO
Stainless Steel 304
Crack Growth Data
Specimen I.D. SS03 (Path P)
R = -I R = -IY
a_/2 = 0.0025 Ay/2 = 0.00432
N (cycles) L (mm) a I (mm) a2 (mm) a3 (mm)
5,013 0.72 0.130 0.601 0.II0
5,000 0.65 0.123 0.601 0.059
4,500 0.48 0 0.48 0
4,000 0.28 0 0.28 0
3,500 0.22 0 0.22 0
3,000 0.22 0 0.22 0
2,500 0.18 0 0.18 0
1,500 0.i0 0 0.i0 0
1,000 0.08 0 0.08 0
500 0.08 0 0.08 0
50 0.08 0 0.08 0
0 0.08 0 0.08 0
Comments
Change in crack
direction
Scratch on
specimen

75
Table A.11
Stainless Steel 304Crack Growth Data
Specimen I.D. SSII (Path P)
R = -I R = -iE y
AE/2 = 0.0025 ay/2 = 0.00432
N (cycles) L (mm) a I (mm) a2 (mm) a3 (mm)
6,202 I0.00 0 I0.00 0
6,O00 0 0 0 0
6,000 0.923 0 0.923 0
5,500
5,000
4,560
4,000
3,500
3,000
0.444
0.241
0.141
0.125
0.119
0.063
0 0.444
0 0.241
0 0.141
0 0.125
0 0. 119
0 0.063
0
0
0
0
0
0
Comments
Non-failure
crack

76
Table A.12
Stainless Steel 304Crack Growth Data
Specimen I.D SS30(Path P)
R : -I R = -Ic y
AE/2 = 0,.0014 ay/2 = 0.0024
N (cycles) L (mm) aI (mm) a2 (mm) a3 (mm)
89,312 2.760 1.389 -0.084 1.424
85,000 1.516 0.783 0.077 0.658
80,000 0.641 0.315 0.077 0.283
75,000 0.393 0.143 0.077 0.116
70,000 0.235 0.132 0.077 0.042
65,000 0.147 0.079 0.077 0
60,000 0 0 0 0
Comments
a 3 bifurcates

77
Table A.13
Stainless Steel 304Crack Growth Data
SpecimenI.D. SS31 (Path P)
R = -I R = -Iy
aE/2 = 0.0014 ay/2 = 0.0024
(cycles) L (mm) aI (mm) a2 (mm)
I00,000 3.010 1.264 0.740
95,000 1.853 0.661 0.740
90,000 0.982 0.254 0.740
86,638 0.789 0.025 0.740
85,000 0.727 0 0.727
80,000 0.506 0 0.506
75,000 0.339 0 0.339
70,000 0.246 0 0.246
65,000 0.177 0 0.177
60,000 0.128 0 0.128
a3 (mm)
1.135
0.574
0.160
0.059
0
0
0
0
0
0
Comments
Bifurcation

78
Table A.14
Stainless Steel 304
Crack Growth Data
Specimen I.D. SS04 (Path Q)
R = -I R = -IE Y
AE/2 = 0.0025 Ay/2 = 0.0043
N (cycles) L (mm) a I (mm) a 2 (mm) a 3 (mm)
9,000 3.00 1.07 0.938 1.18
8,000 1.60 0.36 0.938 0.395
7,000 0.69 0 0.69 0
6,000 0.37 0 0.37 0
5,000 0.18 0 0.18 0
4,000 0.ii 0 0.II 0
3,000 0.07 0 0.07 0
2,000 0.06 0 0.06 0
1,000 0.03 0 0.03 0
i00 0.01 0 0.01 0
Comments
Change in
crack direction
] I Y

79
Table A.15
Stainless Steel 304
Crack Growth Data
Specimen I.D. SS32 (Path Q)
R = -I R = -IE y
AE/2 = 0.0014 ay/2 = 0.0024
N (cycles) L (mm) a I (mm) a2 (mm) a3 (mm)
200,000 25.4 17.7 0.44 7.7
190,000 2.16 2.16 0 0
180,000 0.69 0.69 0 0
170,000 0.304 0.304 0 0
160,000 0.09 0.09 0 0
Comments
Crack is ex-
tremely thin

8O
Table A.16
Stainless Steel 304Crack Growth Data
Specimeni.D. SS33 (Path Q)
R = -I R = -IY
AE/2 = 0.0014 Ay/2 = 0.0024
N (cycles) L (mm) a I (mm) a2 (mm) a3 (mm)
205,000 5.52 0 5.52
200,000 2.54 0 2.54
195,000 1.34 0 1.34
190,000 0.727 0 0.727
185,000 0.384 0 0.384
180,000 0.195 i 0 0.195
Comments
Crack is ex-
tremely thin
I !

81
APPENDIX B: TYPICAL SURFACE CRACK FEATURES
LIST OF FIGURES
FIGUREPAGE
B.I
B.2
B.3
B.4
B.5
B.6
B.7
B.8
B.9
B.IO
B.11
B.12
Proportional Path, _- = 0.0035, = 0.0061 .............. 82
Proportional Path, _- = 0.0014, = 0.0024 .............. 83
Proportional Path, _- = 0.0014, = 0.0024 .............. 84
90 ° Out-of-Phase, _--= 0.00353, = 0.00612 ............ 85
90 ° Out-of Phase, _-= 0.002, = 0.0035 ............... 86
90° Out-of-Phase, _-- = 0.002, = 0.0035 ............... 87
Box Path, A__ = 0.0025, _-_ = 0.0043 ...................... 88
_e ayBox Path, _- = 0.0014, _- = 0.0024 ...................... 89
a_ 0.0014 _2C = 0.0024 ....... 90Box Path, _- = , ..............
ac _ = 0.0043 ................. 91Two Box Path, _-- = 0.0025, 2
Two Box Path, _-- = 0.0014, = 0.0024 .................. 92
A_ ay = 0.0024 ................. 93Two Box Path, _-- = 0.0014, 2

82
oRIC,ZNM5 p_GE IS
OF pOOR QUALITY, Proportional (y/E :.,/-5-)
(RE :-1, Ry---1)
/
r/.,r3
---_: O,O06t
--_-: 0,0055N : 55,000
Nl.o =44,200
SS -02
Specimen Axis
Polar I_loi
Shear Strain Amplitude ()")VS
Plane Angle (e)
-----------40.5mm
Specimen Axis
Figure B.I
A_ = 0.0035 A_._=0.0061Proportional Path, _-- ' 2

83
Proportional ( y/E =v/5 - )
(R_ :-1, RT.=-l)
•'--- Er
:0,0023
:0,0015..9
N : 356,000Nx.o: 340,000SS - 26
DRICINAL PAGE /.S
OF POOR QUALITy
Specimen Axis
Polar Plot
Shear Strain Amplitude (_')VS
Plane Angle (8)
5.0mm
Figure B.2
T
lSpecimen
ac a--Z= 0.0024Proportional Path, _-= 0.0014, 2
Axis

84
Proportional (y/e =,v/T)
(R_ =-1, RX=-I)
/r
--_= 0,0023
--._- : 0,0015 N = 440,000Nl.o= 420,000SS -25
Specimen Axis
Polar Plot
Shear Strain Amplitude (_)VS
Plane Angle (a)
I I5.0mm
ORL_E_AIL PAGE IS lOF POOR QUALITY.
Specimen Axis
a_ _-_ 0.0024Proportional Path, _- = 0.0014, =Figure B.3
[l I

85 DRLrCPqAT; _KG_ .."B
OF POOR QUALITY
90 ° OUT OF PHASE
(RE =-1, Ry=-I)
y/,/-_
r_0.00353
0,5 mm
N = 3730
Nt.o- 3730
SS - 13
t F
Specimen Axis
Polar Plot
Shear Strain Ampli)ude (_')V5
Plane Angle (8)
1,25 mm
Specimen Axis
Figure B.4A_ _ = 0.00612
go o Out-of-Phase, _--= 0.00353, 2

86
oR_C£A_ pAGE I$
OF POOR QUALITY
90 ° OUT OF
(RE =-1, R_.
_'/,/_
__. _020
PHASE
=-1)
N: 30,000
Nt,o = 38,600
SS -28
[ I0,2mm
Specimen Axis
Polar Plot
Shear Strain Amplitude (_)vs
Plane Angle (8)
N : 45,800
t]-,0 mm
Specimen Axis
Figure B.5 _--£_= 0.002, ay : 0.003590 ° Out-of Phase, 2 2
] I

87
O_CL'g_L PAGI_ I8
OP POOP, QUALITy
90 ° OUT OF
(RE =-1, Ry
y/,/-_-
r = 0,0020
-- E
PHASE
:-i)
N = 25,000
Nl,o= 35,300
SS - 29
Specimen Axis
Polar Plot
Shear Strain Amplitude (_')VS
Plane Angle (a)
k
N = 40,000
I t t tO. 2 mm 1.0 mm
Figure B.6
Sl::ecimen Axis
AE90 ° Out-of-Phase, _--= 0.002, = 0.0035

88
ORIG/NAE PAGE I$
OF POOR QUALITY
7/4__k
r
AY= 0,0043
)
AE--T : 0.0025
BOX PATH
(RE=-1, R),=I )
l,.- Er
N : 5500
Nt.o: 6200
SS- 11
0,5mm
Specimen Axis
\
\/
//
Polar Plot
Shear Strain Amplitude ()t,)VS
Plane Angle (8)
_E
Flgure B.7 Box Path,
lSpecimen Axis
= 0.0025, __L= 0.0043
F11

I__i 0'00241O,O014J
Crack A
89
BOX PATH
(R< :-1, RT.= 1)
N- 85,000
Nlo= 82,100
SS -30
]-.0 am
OF PO0", -',T ,, f.TTy
Specimen Axis
Polar Plot
Shear Strain Amplitude (_,)vs
Plane Angle (e)
I Crack B
Specimen Axis
Figure B.8 Box Path, _-_ : 0.0014, _ : 0.0024

ORIGINAL pAGE I2
OF pOOR QUALITY
¥= 0.0024]
=O.OOi4J
N : 85,000
0,5 mm
9O
BOX PATH
(R(=-I, RT=I )
Ni.o =90,100
SS-31
Specimen Axis
I/\.Polar Plot
Sheor Strain Amplitude (?;')vs
Plane Angle (8)
N :95,000
I I1,O mm
ISpecimen Axis
Figure B.9 Box Path, _-= 0.0014, = 0.0024

91 OR/OIN.4L PAOE fS
OF POOR QUALITy
TWO BOX PATH
(RE: =-1, RT,=l)
F1'i:
i
E
-_: O.OO45
---_: O,OO25N - 6000Nl,o=7340SS - 04
Specimen Axis
\;/Polar Plot
Shear Strain Amplitude (_')VS
Plane Angle (0)
0,5 mm
5
Figure B.IO
ISpecimen Axis
Two Box Path, p = 0.0025, p = 0.0043

AYy:o.oo24
_ :0.0014
92
TWO BOX PATH
( R( =-1, R),: 1 )
•"- Er
N : 190,OOO
N_,o:182,OOO
SS-52
Specimen Axis
t\ /
\./Polor Plot
Sheor Stroin Amplitude ()/,)VS
Plone Angle (8)
I1,O mm
Specimen Axis
Figure B.11 A¢ __tTWO Box Path, _-= 0.0014, = 0.0024

93
TWO BOX PATH
( RE=-1, R_. - i )
R_-GI_YAL PAGp_,• "-POOR ,-,.. Z_
WUALITy
Specimen Axis
T/,/3-
--_- =0,0024
--_= 0.0014 N : 180,000
NLo: 192,200
SS-55
0,2 mm
\ /
\ //
Polor Plot
Sheor Stroin Amplilude (_')VS
Plone Angle (8)
TI'
Specimen Axis
Figure B.12 Two Box Path, _--= 0.0014, = 0.0024

[_J/_._A Report Documentation PageNal_onal AeronauhcS and
Space AdmLn_st ration
1. Report No. 2. Government Accession No. 3. Recipient's Catalog No.
NASA CR-182] 264. Title and Subtitle 5. Report Date
June 1988Cyclic Fatigue Damage Characterlstics Observed
for Simple Loadings Extended to MultiaxlalLife Prediction
7. Author(s)
David 3. 3ones and Peter Kurath
9. Performing Organization Name and Address
University of Illinois
Dept. of Mechanical EngineeringUrbana, Illinois
12. Sponsoring Agency Name and Address
National Aeronautlcs and Space AdministrationLewis Research Center
Cleveland, Ohio 44135-3191
6. Performing Organization Code
8. Pedorming Organization Report No.
None
10. Work Unit No.
506-60-12
11. Contract or Grant No.
NAG3-465
13. Type of Report and Period Covered
Technical Memorandum
14.Sponsoring Agency Code
15. Supplementa_ Notes
Project Manager, Alan D. Freed, Structures Division, NASA Lewis Research Center.
16' Abstract
Fully reversed uniaxlal strain controlled fatlgue tests were performed on smooth
cyIlndrical specimens made of 304 stalnless steel. Fatigue life data and crack-
ing observations For uniaxlal tests were compared wlth life data and crackingbehavior observed in Fully reversed torslonal tests. It was determined that the
product of maximum princlpal strain amplitude and maximum principal stress(Smith, Watson, Topper parameter) provided the best correlatlon of Fatigue lives
For these two loading conditions. Implementation of this parameter is in agree-
ment with observed physical damage and it accounts For the variation of stress-
strain response, which is unique to speciflc loading conditions. Biaxial fatigue
tests were conducted on tubular specimens employing both in-phase and out-of-phase tension-torsion cyclic strain paths. Cracking observations indicated that
the physical damage which occurred In the biaxlal tests was similar to the damage
observed in uniaxial and torsional tests. The Smith, Watson, and Topper parame-
ter was then extended to predict the fatigue lives resulting From the more com-
plex loading conditions. The correlation of the biaxlal fatigue lives wlth
experlmental data was within a Factor of 2%, when strain hardening due to out-of-
phase loading was incorporated Into the life estimation analysis.
t7, Key Words (Suggested by Author(s))
Metal fatlgueCrack Initiation
Damage mapsMultlaxial fatlgue
18 Distribution Statement
Unc]asslfied - Unlimited
Subject Category 39
19. Security Classif. (of this repot)
Unclasslfled20. Securi_ Classif. (of this page)
UnclassiFled21. No of pages 22. Price"
gg A05
NASA FORM 1626 OCT86"For sale by the National Technical Information Service, Springfield, Virginia 22161
o US GOVERNMENT PRIN13NG OFFICE: 19_ 548-157/60435