Embed Size (px)
Citation preview
Cycling mobility in The NetherlandsAn overview
Tom Godefrooij > Chattanooga, 23rd of September 2013
Content
> Dutch cycling culture
> Dutch context: some statistics
> Cycling-inclusive policy development
> Intermodality
Dutch cycling culture
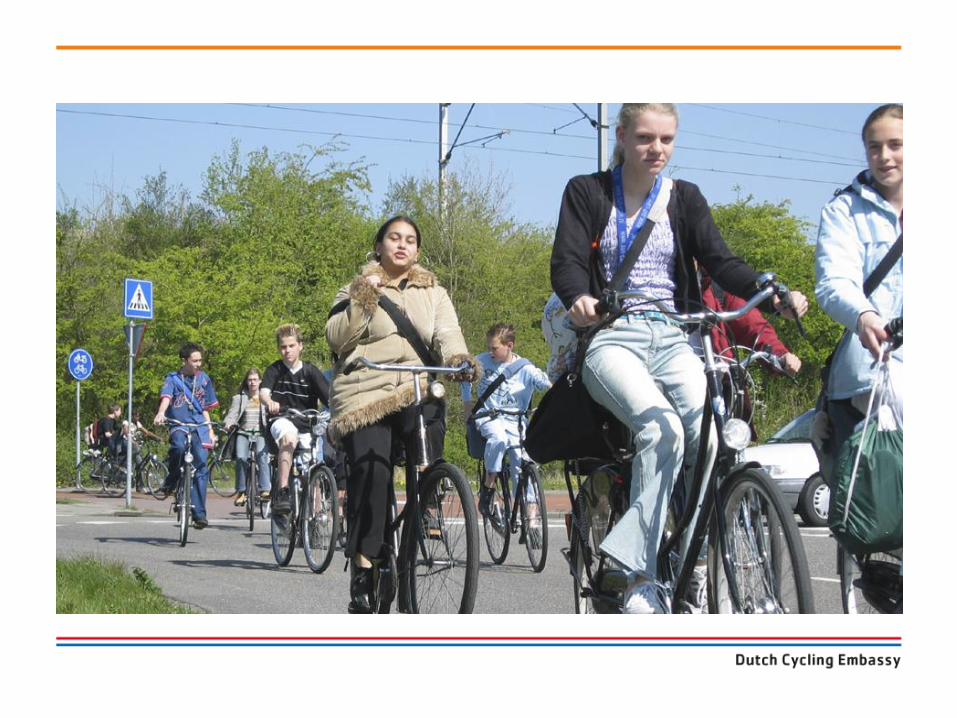
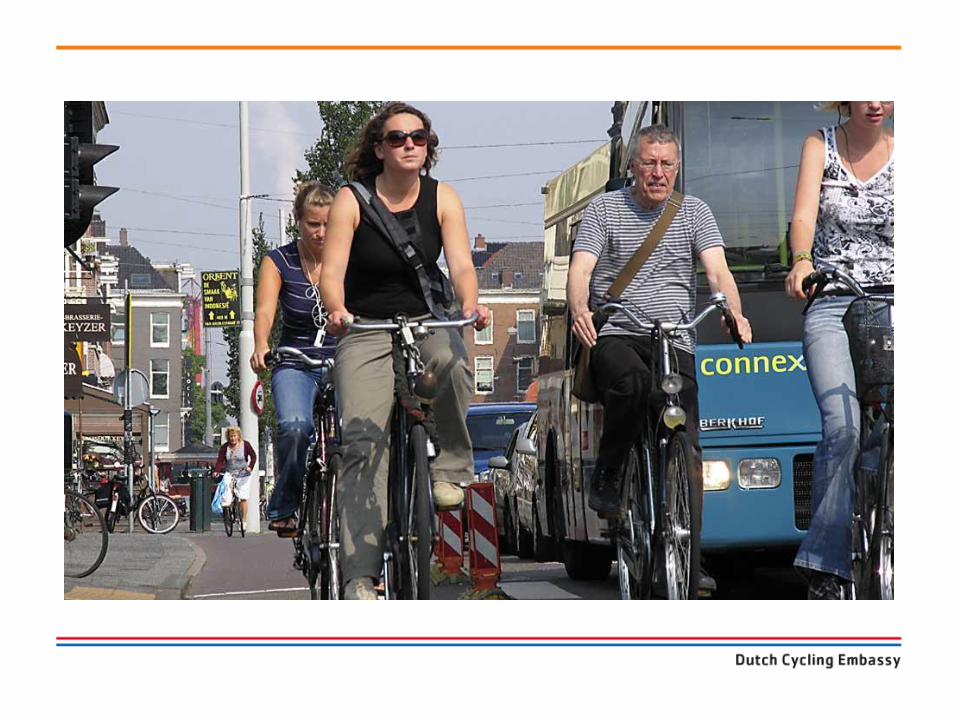
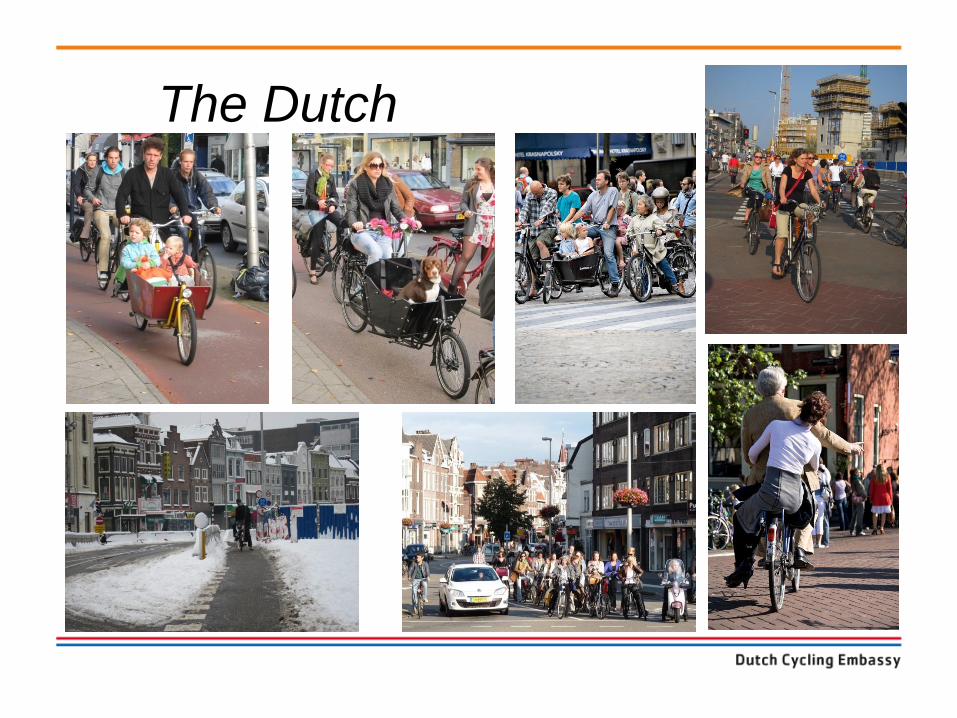
The Dutch
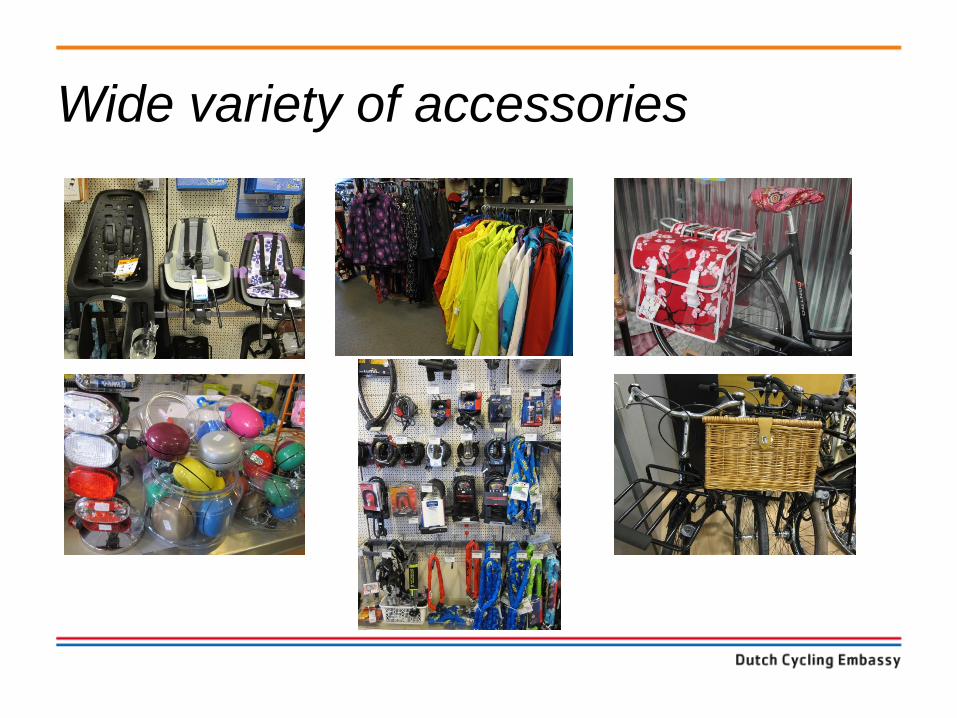
Wide variety of accessories
Dutch context: some statistics
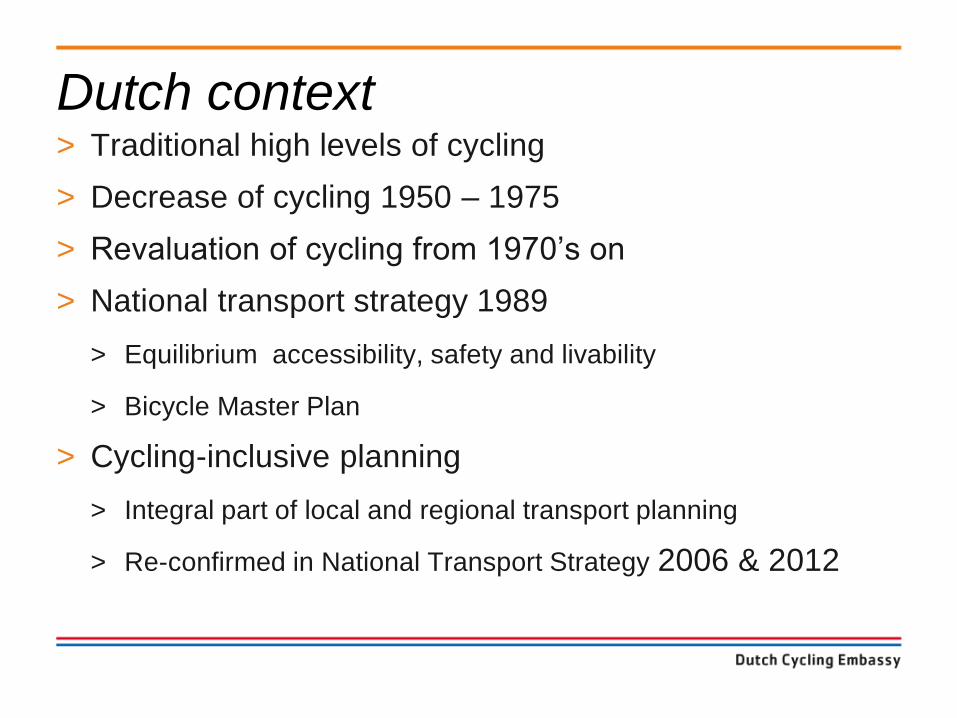
Dutch context> Traditional high levels of cycling
> Decrease of cycling 1950 – 1975
> Revaluation of cycling from 1970’s on
> National transport strategy 1989
> Equilibrium accessibility, safety and livability
> Bicycle Master Plan
> Cycling-inclusive planning
> Integral part of local and regional transport planning
> Re-confirmed in National Transport Strategy 2006 & 2012
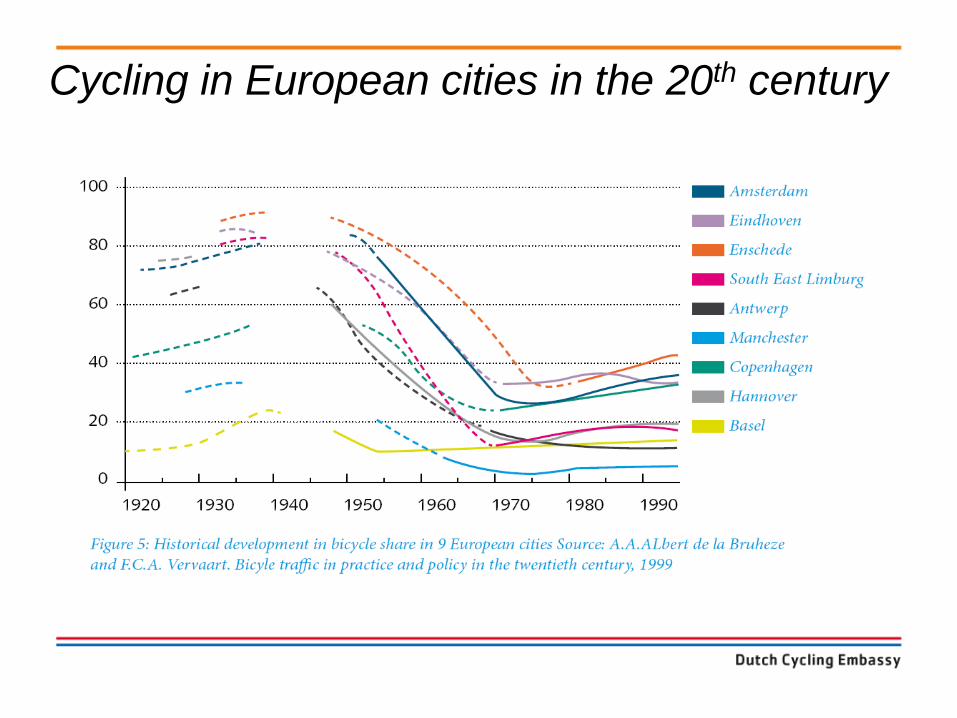
Cycling in European cities in the 20th century
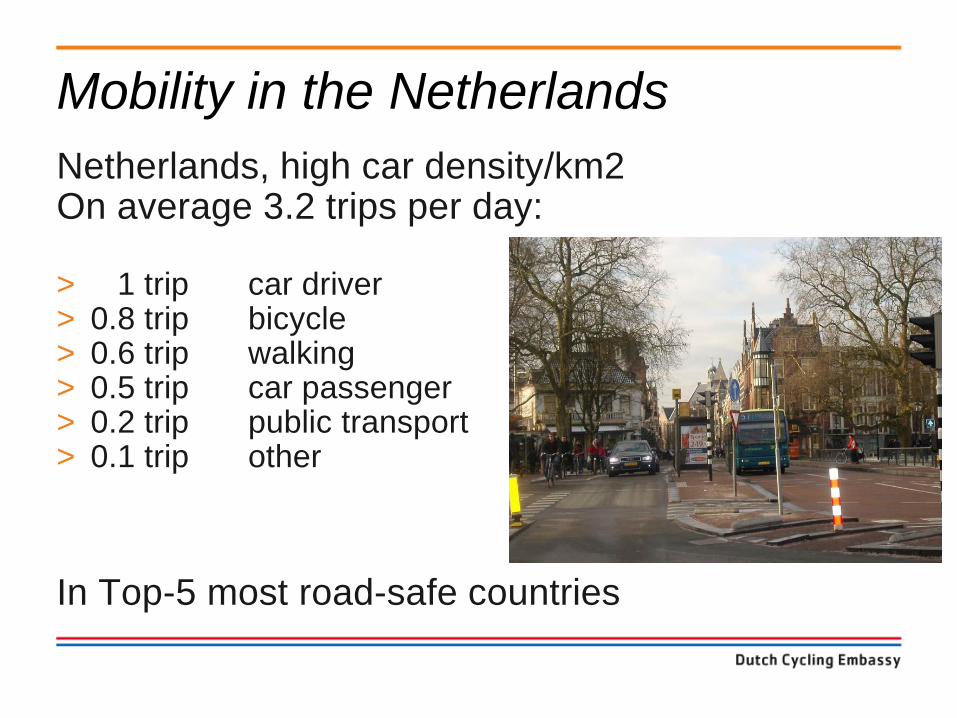
Mobility in the Netherlands
Netherlands, high car density/km2On average 3.2 trips per day:
> 1 trip car driver> 0.8 trip bicycle> 0.6 trip walking> 0.5 trip car passenger> 0.2 trip public transport> 0.1 trip other
In Top-5 most road-safe countries
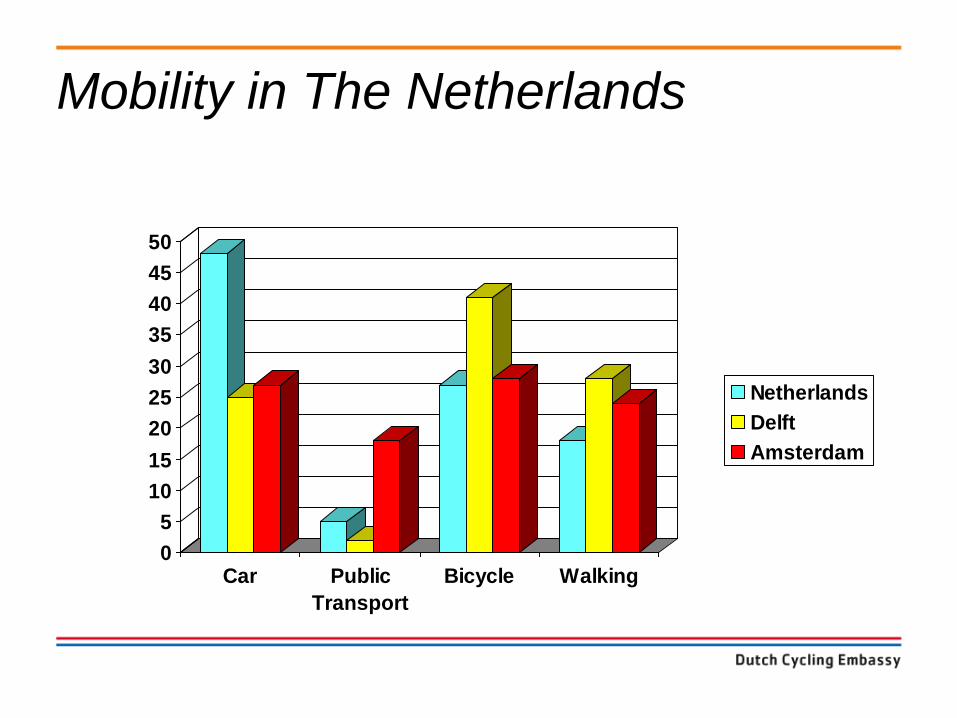
Mobility in The Netherlands
0
5
10
15
20
25
30
35
40
45
50
Car Public
Transport
Bicycle Walking
Netherlands
Delft
Amsterdam
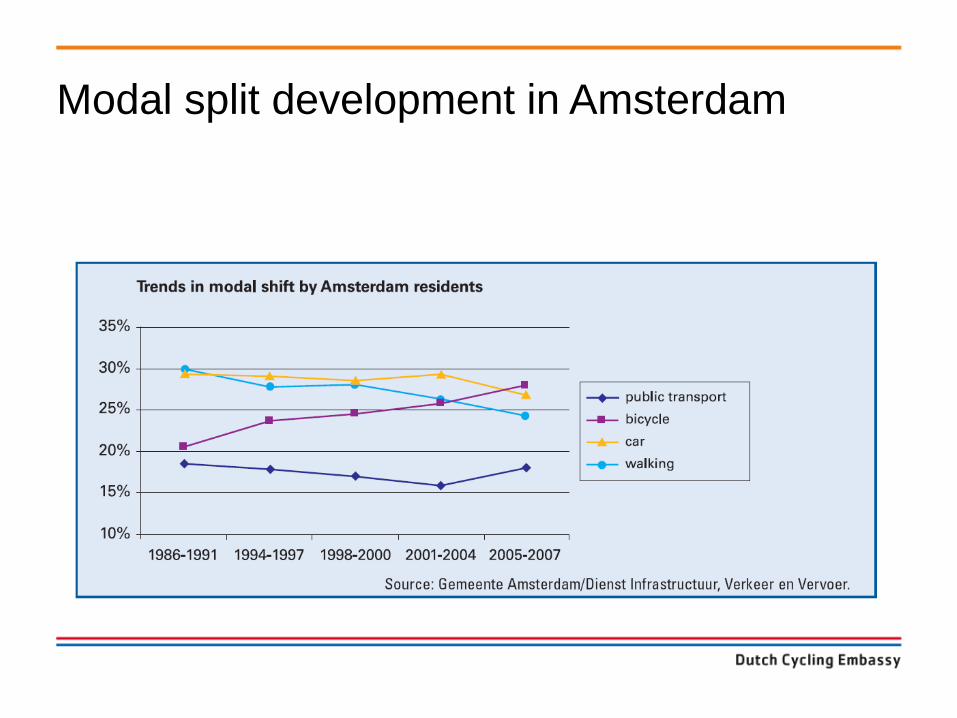
Modal split development in Amsterdam
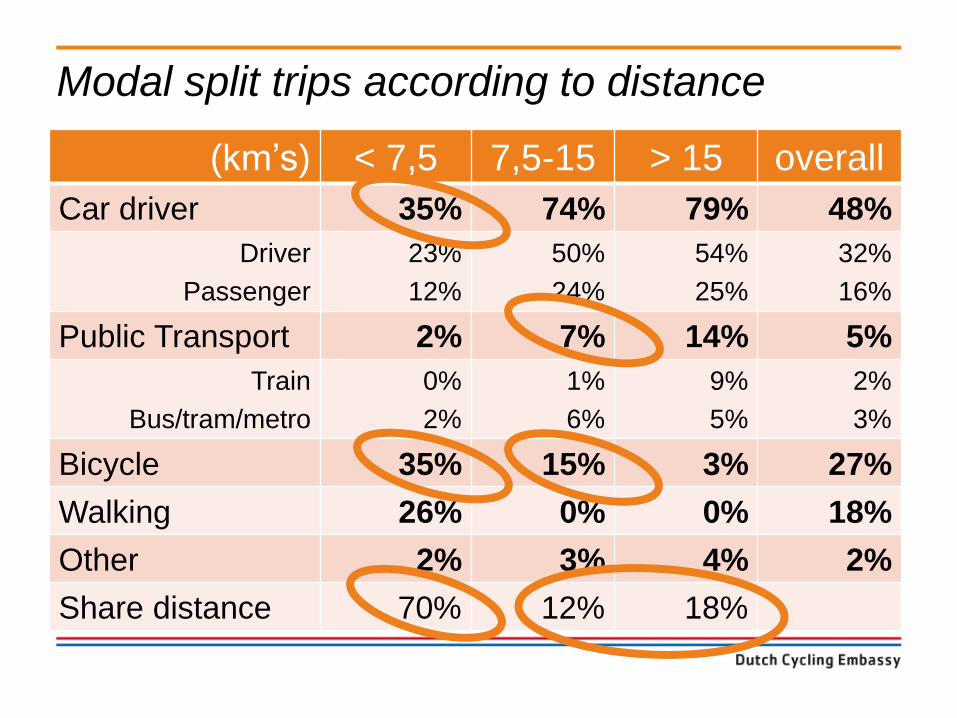
Modal split trips according to distance
(km’s) < 7,5 7,5-15 > 15 overall
Car driver 35% 74% 79% 48%
Driver
Passenger
23%
12%
50%
24%
54%
25%
32%
16%
Public Transport 2% 7% 14% 5%
Train
Bus/tram/metro
0%
2%
1%
6%
9%
5%
2%
3%
Bicycle 35% 15% 3% 27%
Walking 26% 0% 0% 18%
Other 2% 3% 4% 2%
Share distance 70% 12% 18%
Faqs and figures > Netherlands
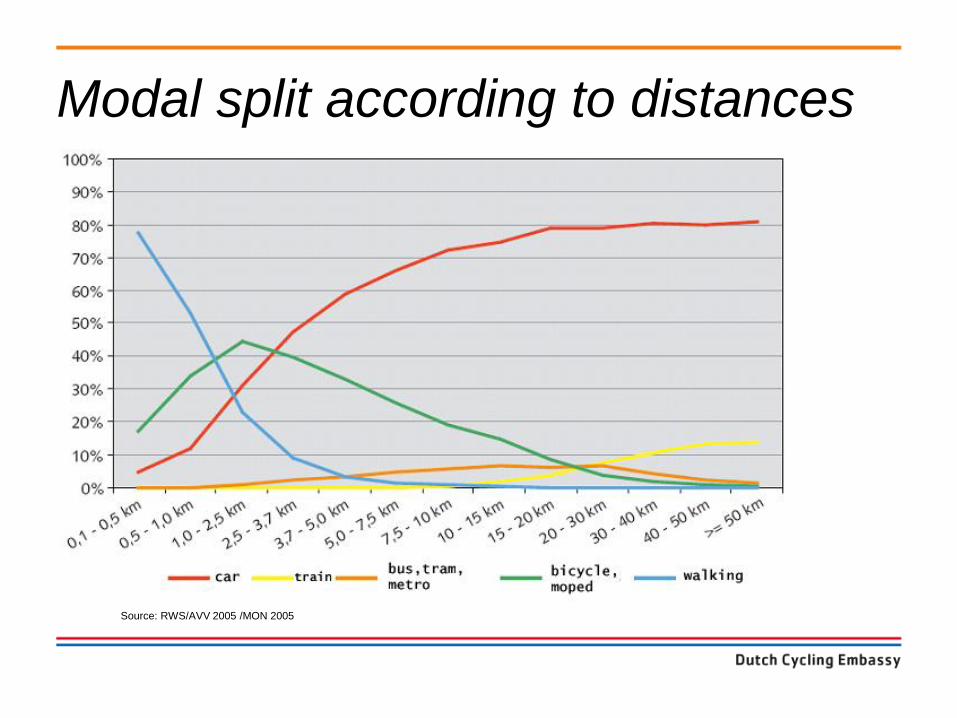
Source: RWS/AVV 2005 /MON 2005
Modal split according to distances
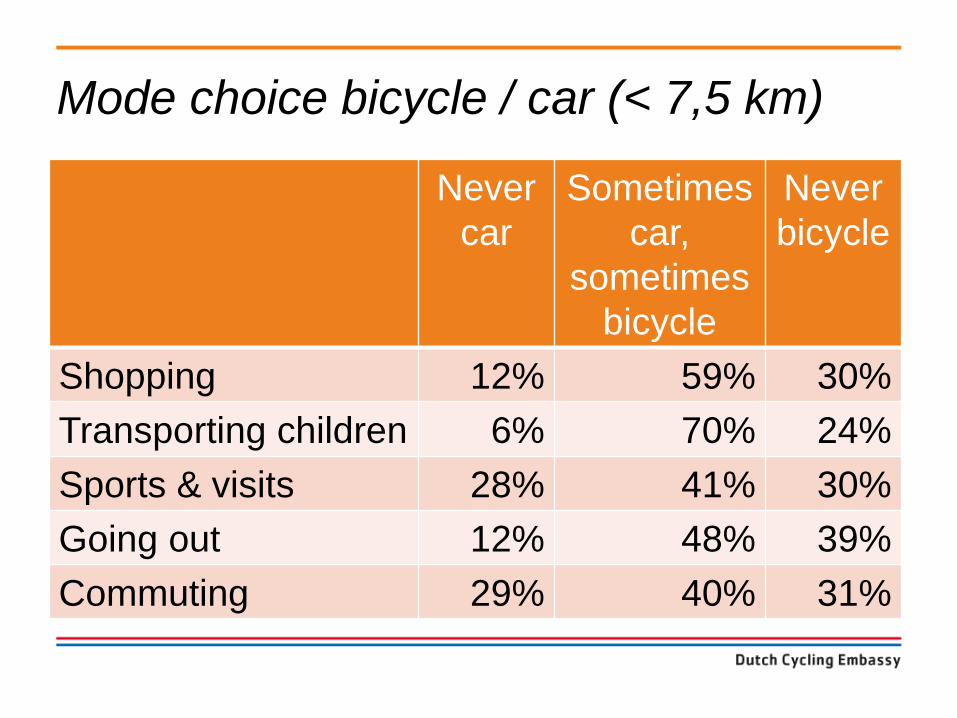
Mode choice bicycle / car (< 7,5 km)
Never
car
Sometimes
car,
sometimes
bicycle
Never
bicycle
Shopping 12% 59% 30%
Transporting children 6% 70% 24%
Sports & visits 28% 41% 30%
Going out 12% 48% 39%
Commuting 29% 40% 31%
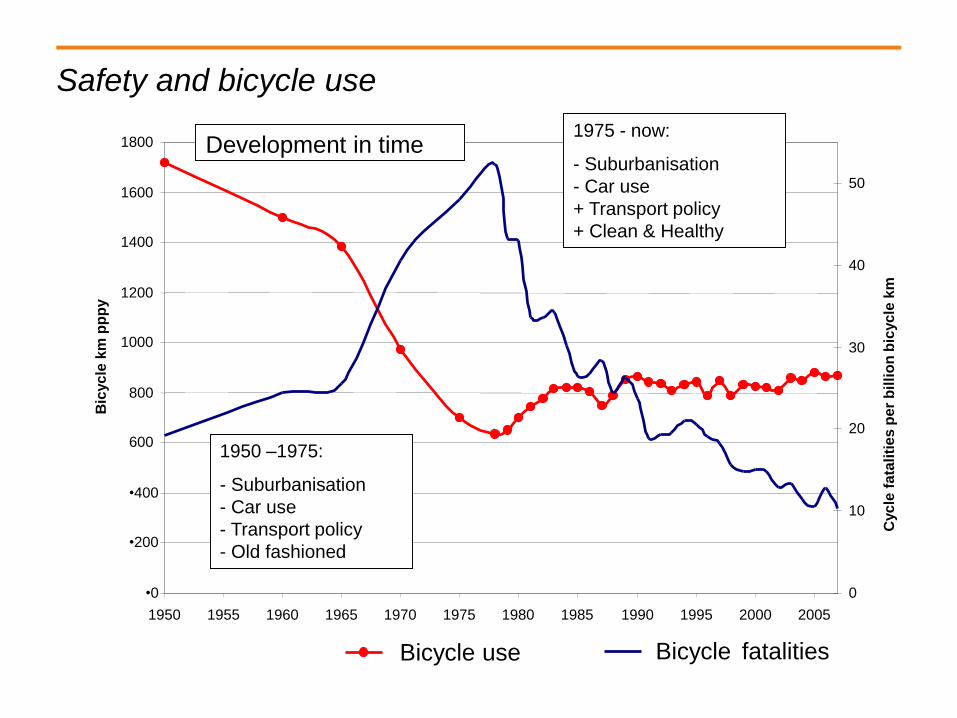
Safety and bicycle use
•0
•200
•400
600
800
1000
1200
1400
1600
1800
1950 1955 1960 1965 1970 1975 1980 1985 1990 1995 2000 2005
Bic
yc
le k
m p
pp
y
0
10
20
30
40
50
Cyc
le f
ata
liti
es p
er
bil
lio
n b
icyc
le k
m
Bicycle use Bicycle fatalities
1950 –1975:
- Suburbanisation
- Car use
- Transport policy
- Old fashioned
1975 - now:
- Suburbanisation
- Car use
+ Transport policy
+ Clean & Healthy
Development in time
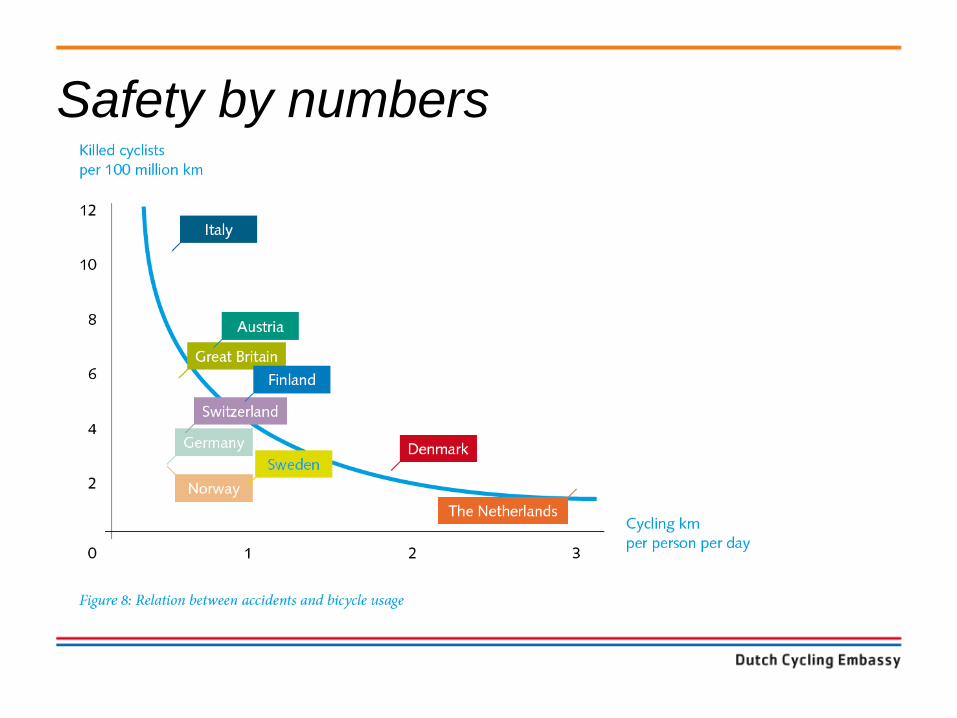
Safety by numbers
Faqs and figures > Netherlands
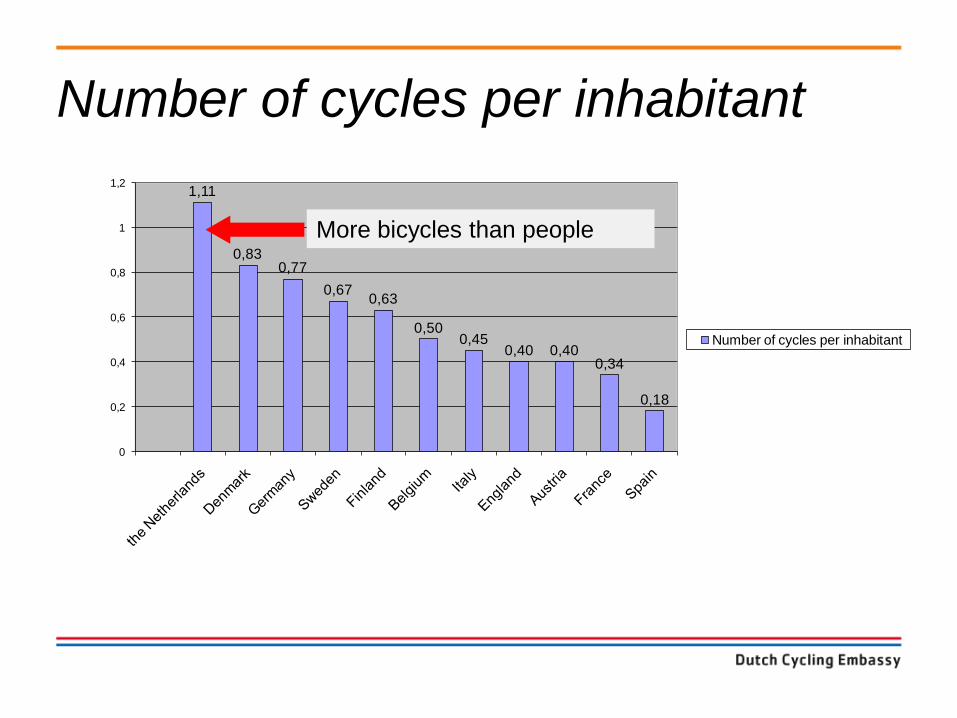
1,11
0,830,77
0,670,63
0,500,45
0,40 0,400,34
0,18
0
0,2
0,4
0,6
0,8
1
1,2
Number of cycles per inhabitant
More bicycles than people
Number of cycles per inhabitant
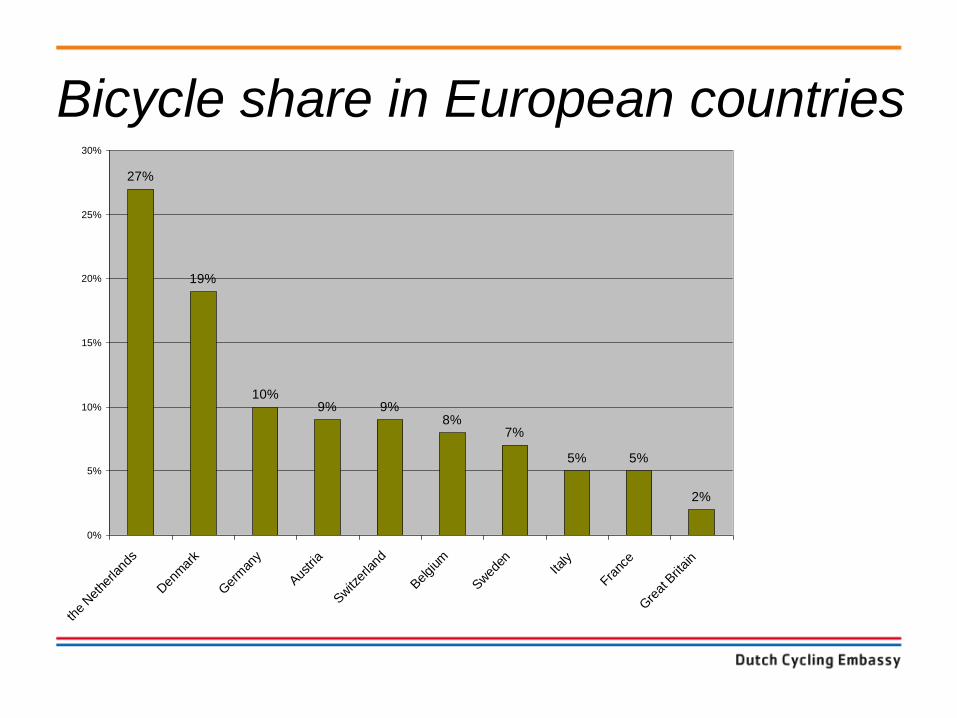
Bicycle share in European countries
27%
19%
10%9% 9%
8%7%
5% 5%
2%
0%
5%
10%
15%
20%
25%
30%
the
Net
herla
nds
Den
mar
k
Ger
man
y
Aus
tria
Switz
erland
Belgi
um
Swed
enIta
ly
Franc
e
Gre
at B
ritain
Cycling-inclusive policy development
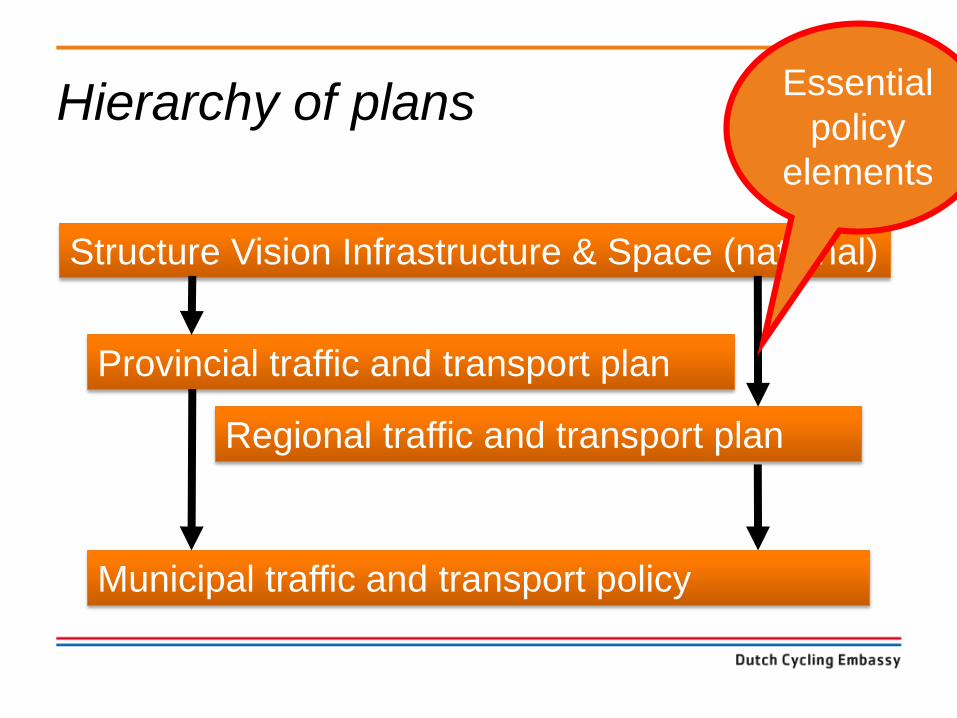
Hierarchy of plans
Structure Vision Infrastructure & Space (national)
Provincial traffic and transport plan
Regional traffic and transport plan
Municipal traffic and transport policy
Essential
policy
elements
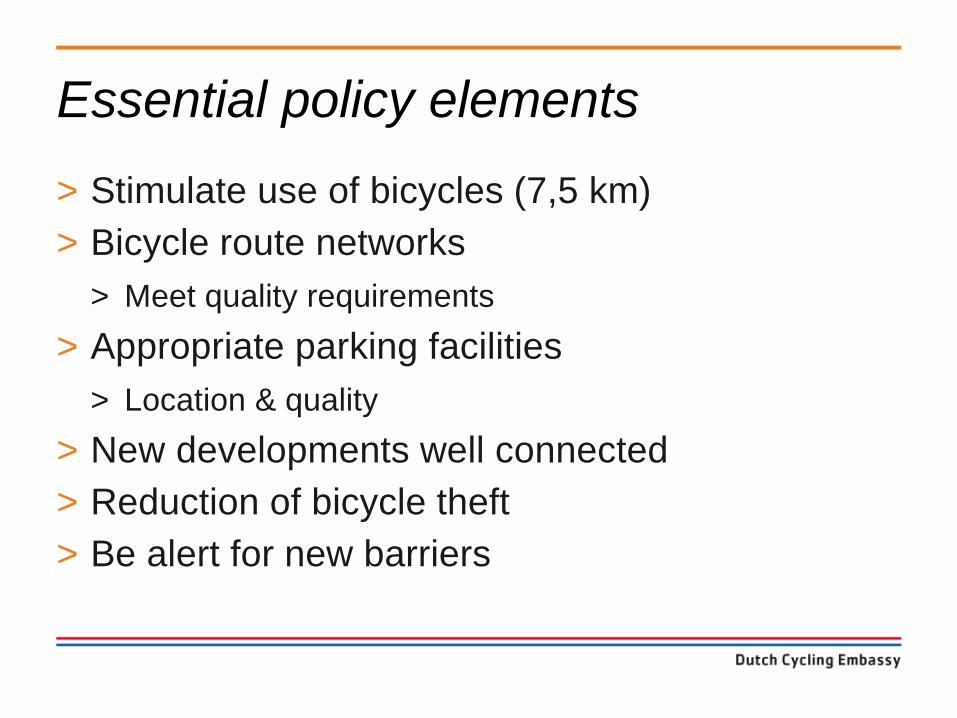
Essential policy elements
> Stimulate use of bicycles (7,5 km)
> Bicycle route networks
> Meet quality requirements
> Appropriate parking facilities
> Location & quality
> New developments well connected
> Reduction of bicycle theft
> Be alert for new barriers
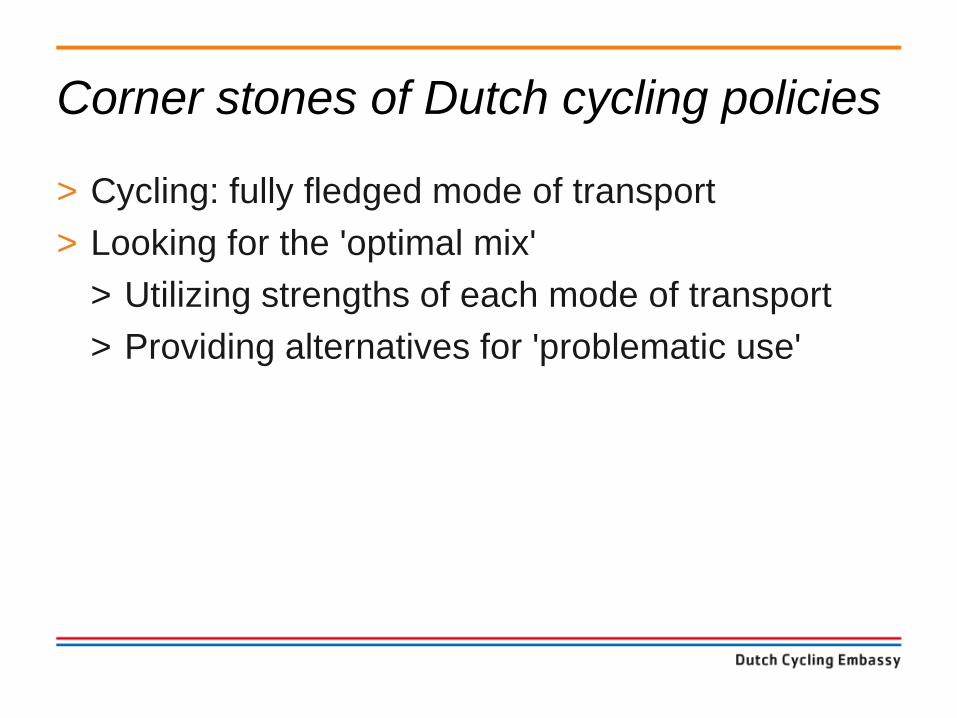
Corner stones of Dutch cycling policies
> Cycling: fully fledged mode of transport
> Looking for the 'optimal mix'
> Utilizing strengths of each mode of transport
> Providing alternatives for 'problematic use'
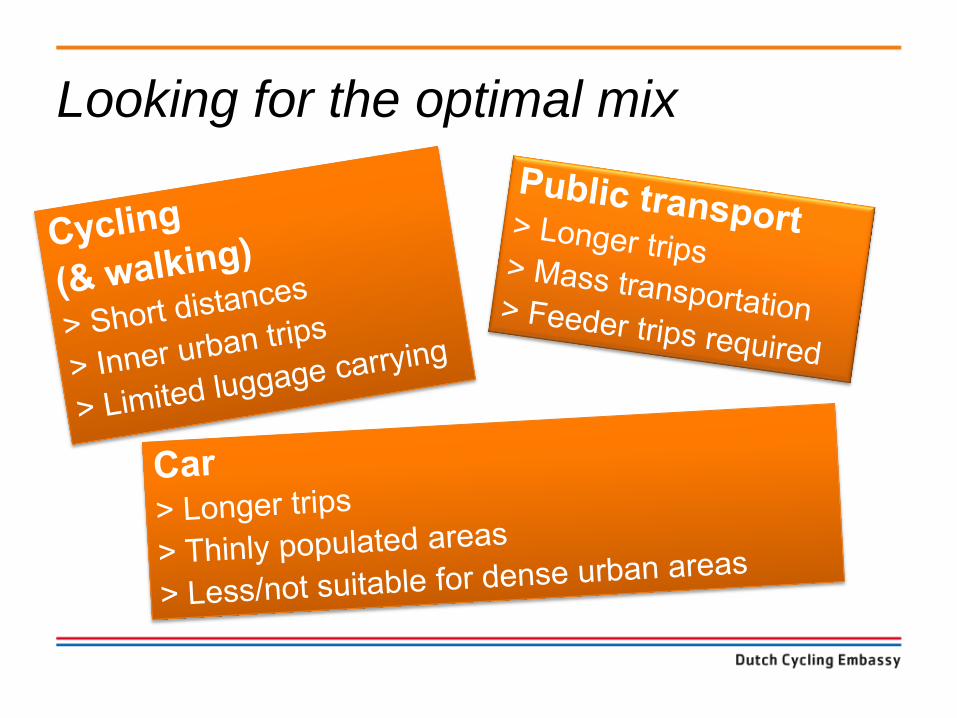
Looking for the optimal mix
How to ‘sell’ cycling?
Distinguish between
> Society
> Policy makers / politicians
> Individuals
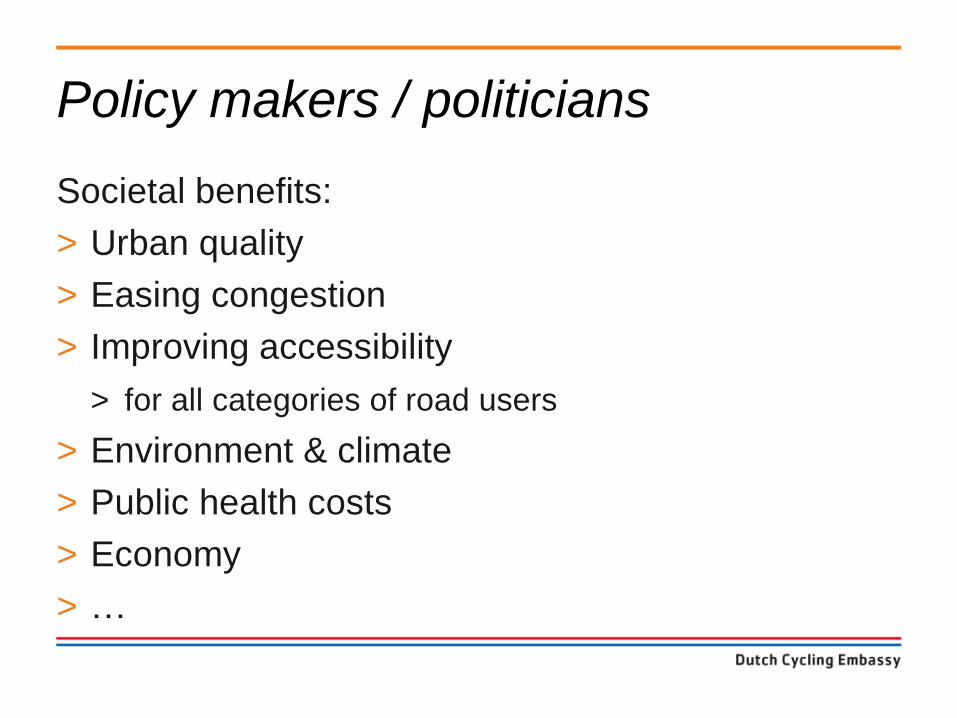
Policy makers / politicians
Societal benefits:
> Urban quality
> Easing congestion
> Improving accessibility
> for all categories of road users
> Environment & climate
> Public health costs
> Economy
> …
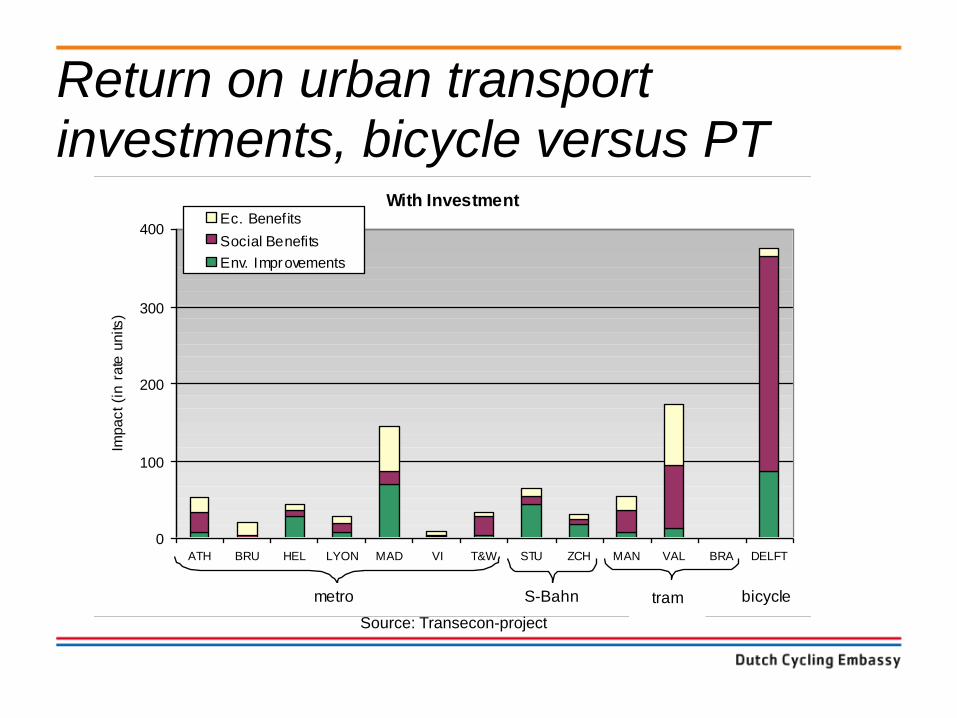
Return on urban transport investments, bicycle versus PT
With Investment
0
100
200
300
400
ATH BRU HEL LYON MAD VI T&W STU ZCH MAN VAL BRA DELFT
Impact (i
n r
ate
units
)
Ec. Benefits
Social Benefits
Env. Improvements
metro tramS-Bahn bicycle
Source: Transecon-project
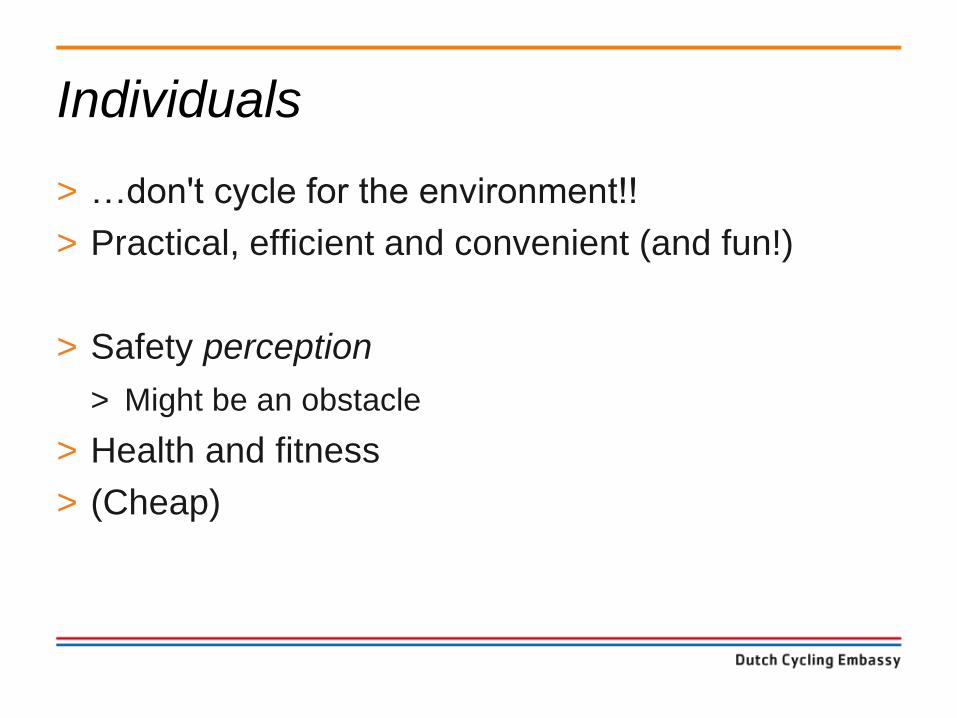
Individuals
> …don't cycle for the environment!!
> Practical, efficient and convenient (and fun!)
> Safety perception
> Might be an obstacle
> Health and fitness
> (Cheap)
So the challenge is…
> …to make cycling
> Convenient
> Practical
> Safe
> Safety is not the ultimate goal but a pre-condition
Intermodality
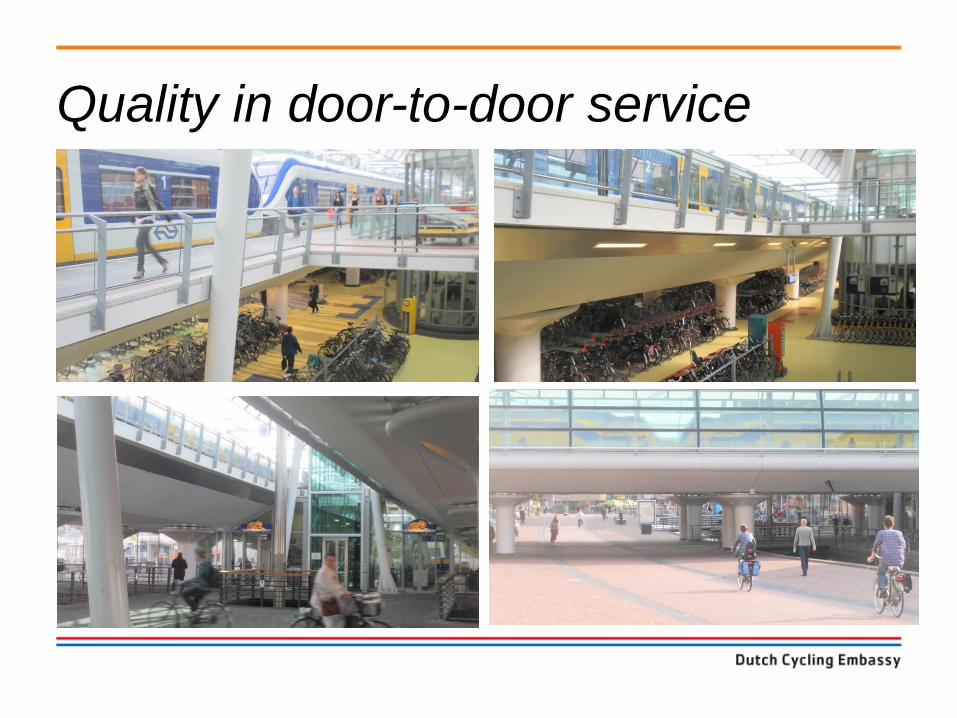
Quality in door-to-door service
Bicycle & Public Transport
Complementary modes
Only combined strengths can compete with
private motorised traffic
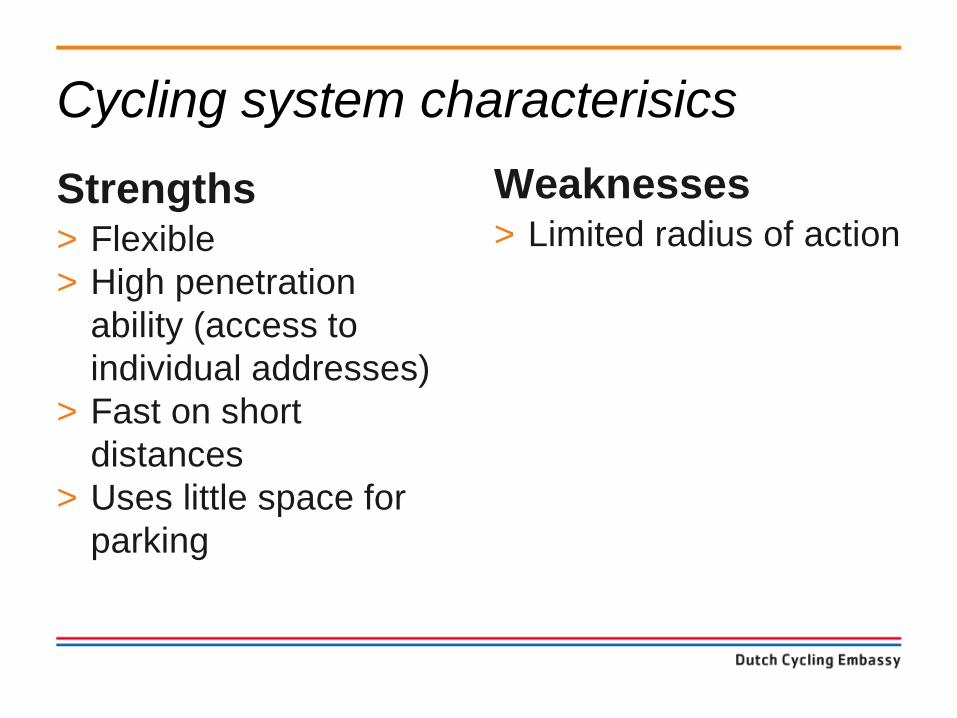
Cycling system characterisics
Strengths> Flexible
> High penetration
ability (access to
individual addresses)
> Fast on short
distances
> Uses little space for
parking
Weaknesses> Limited radius of action
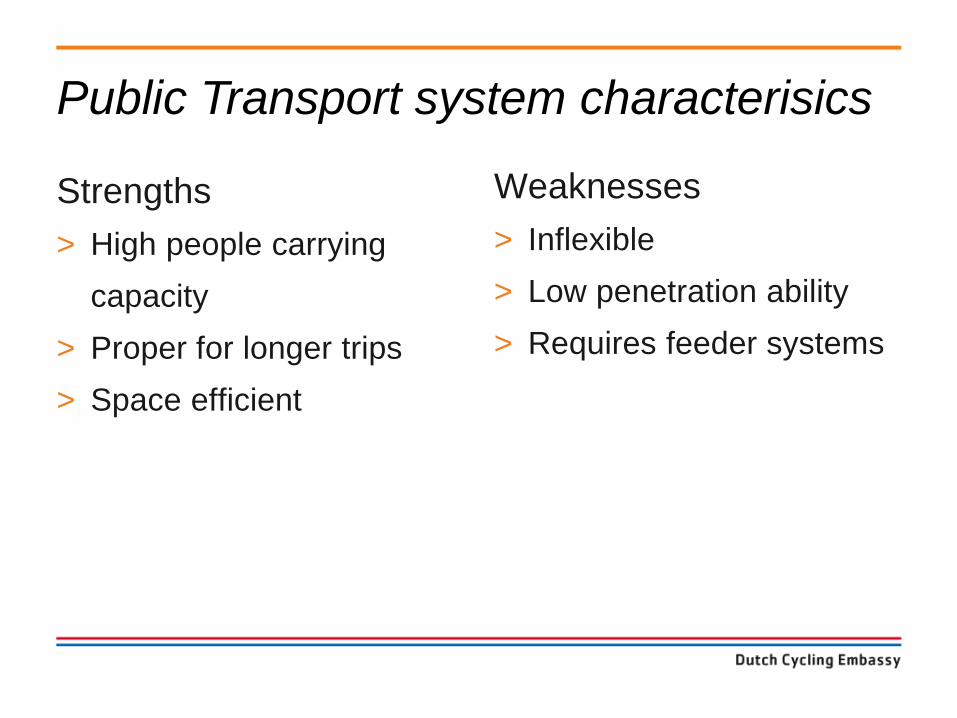
Public Transport system characterisics
Strengths
> High people carrying
capacity
> Proper for longer trips
> Space efficient
Weaknesses
> Inflexible
> Low penetration ability
> Requires feeder systems
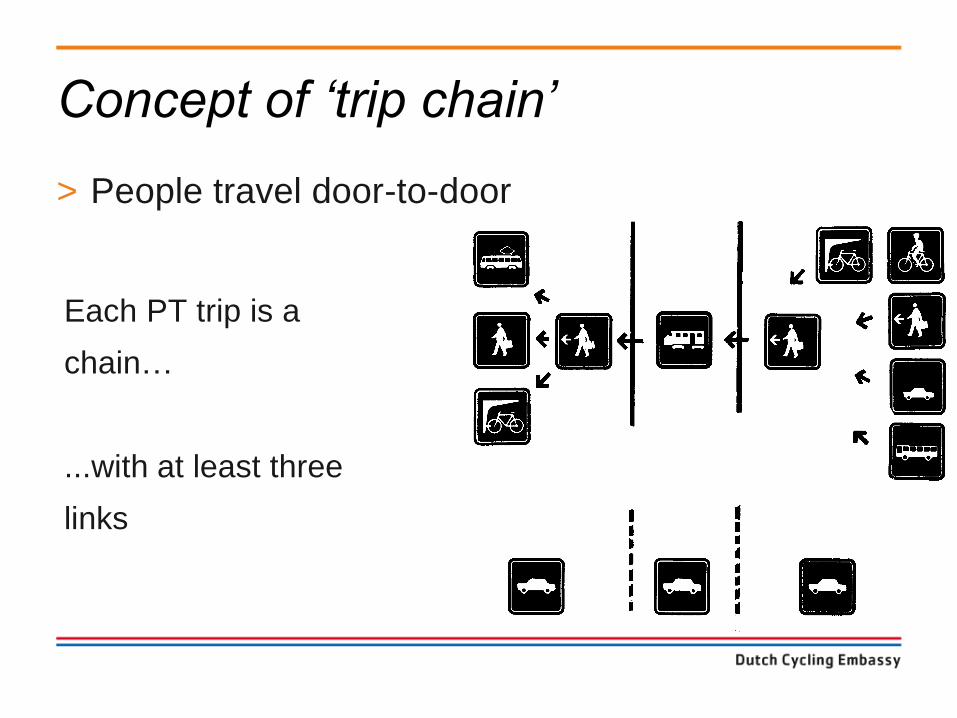
Concept of ‘trip chain’
> People travel door-to-door
Each PT trip is a
chain…
...with at least three
links
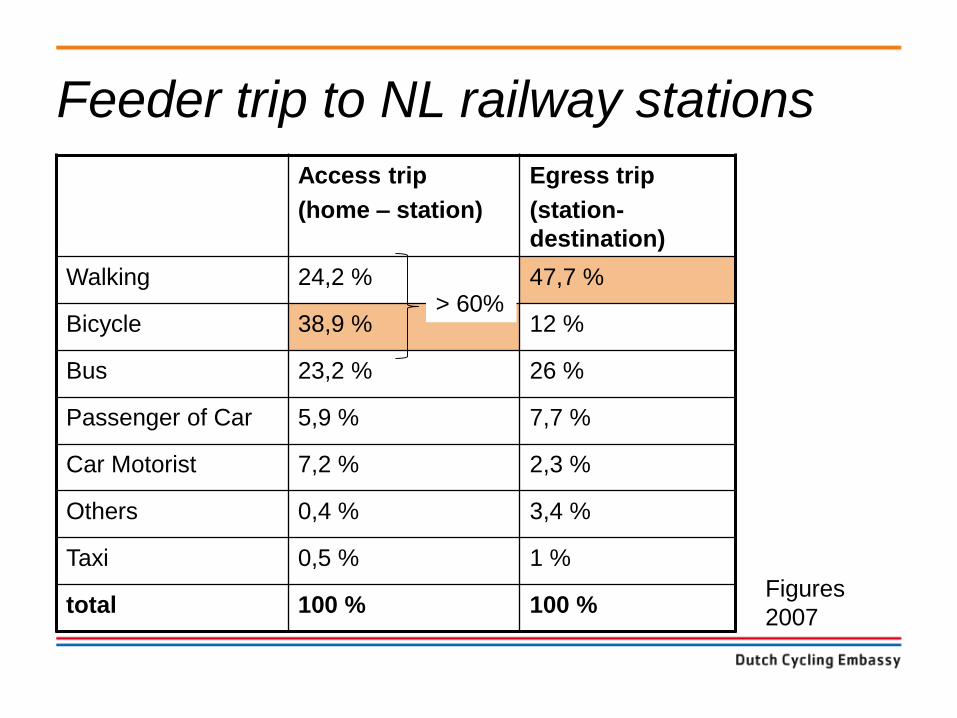
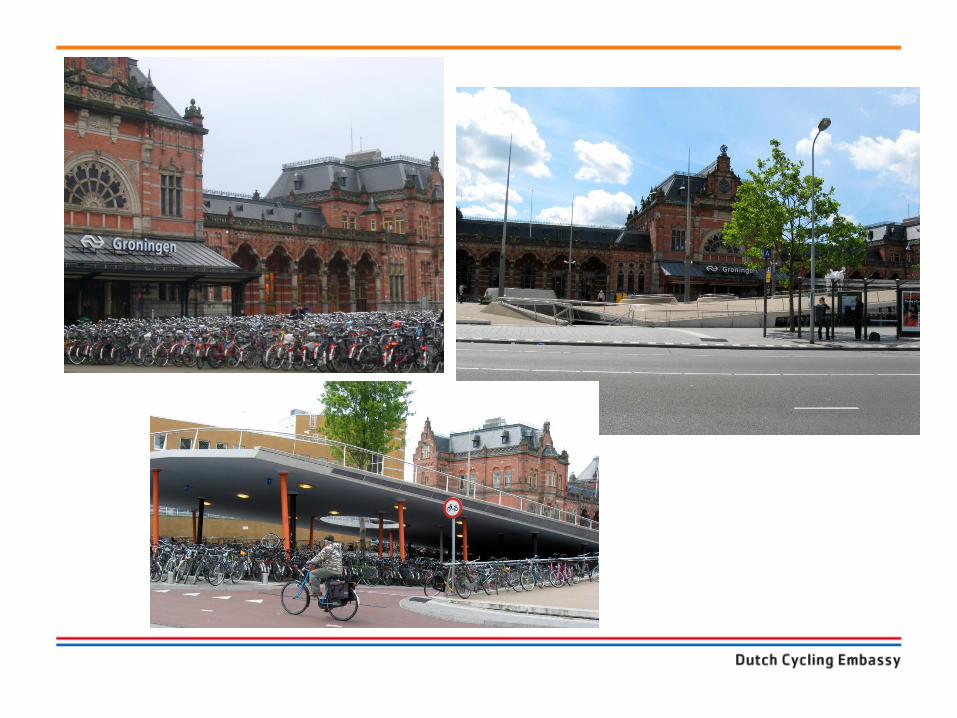
Feeder trip to NL railway stations
Access trip
(home – station)
Egress trip
(station-
destination)
Walking 24,2 % 47,7 %
Bicycle 38,9 % 12 %
Bus 23,2 % 26 %
Passenger of Car 5,9 % 7,7 %
Car Motorist 7,2 % 2,3 %
Others 0,4 % 3,4 %
Taxi 0,5 % 1 %
total 100 % 100 %
> 60%
Figures
2007
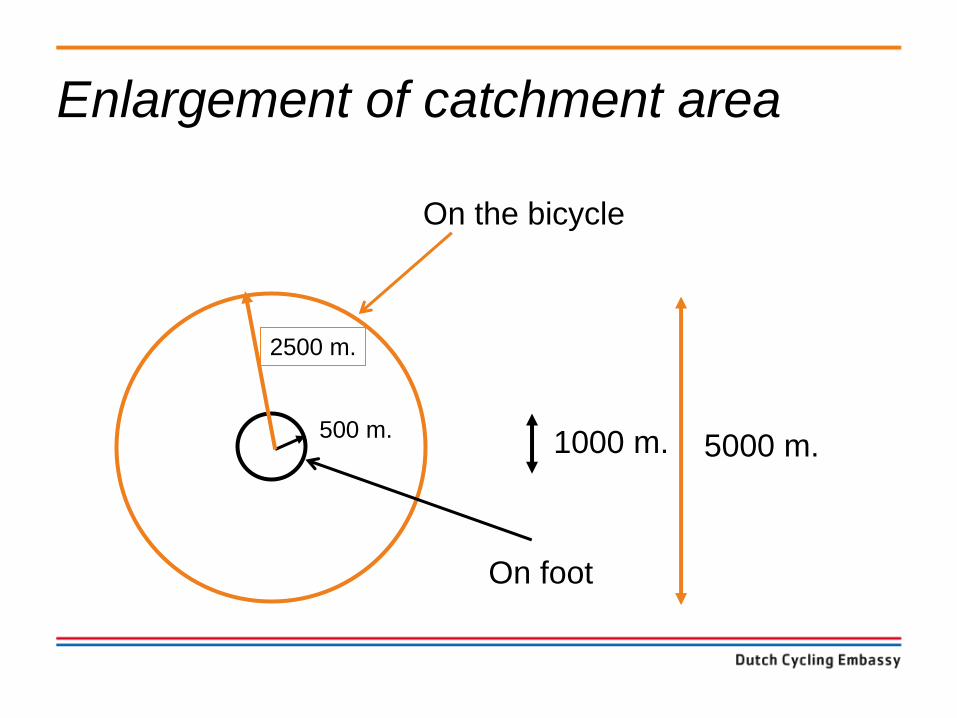
Enlargement of catchment area
1000 m. 5000 m.
2500 m.
500 m.
On the bicycle
On foot
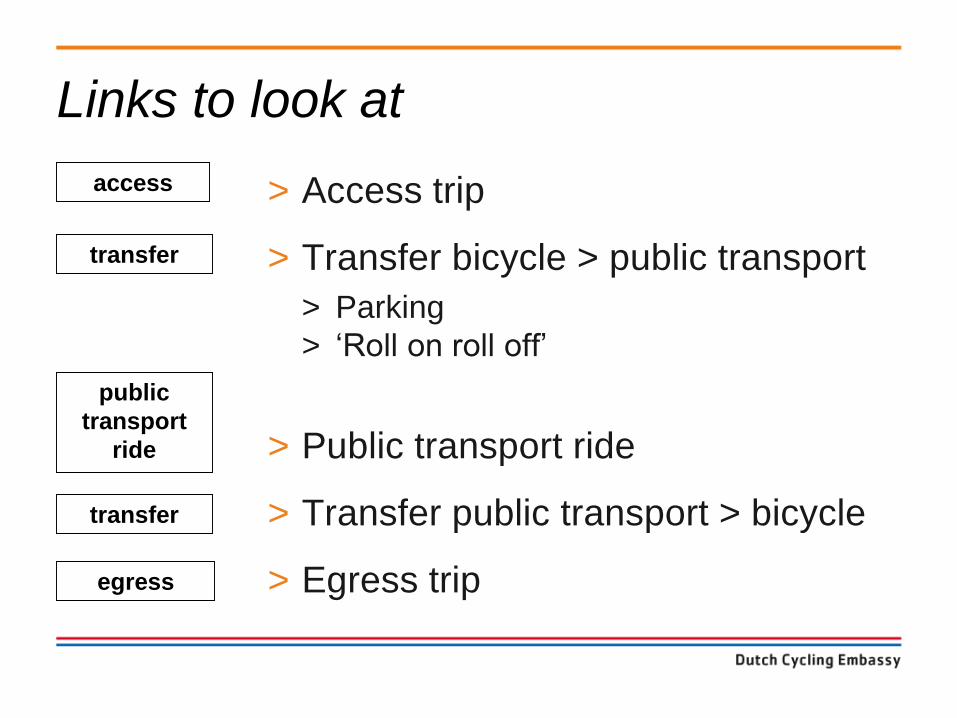
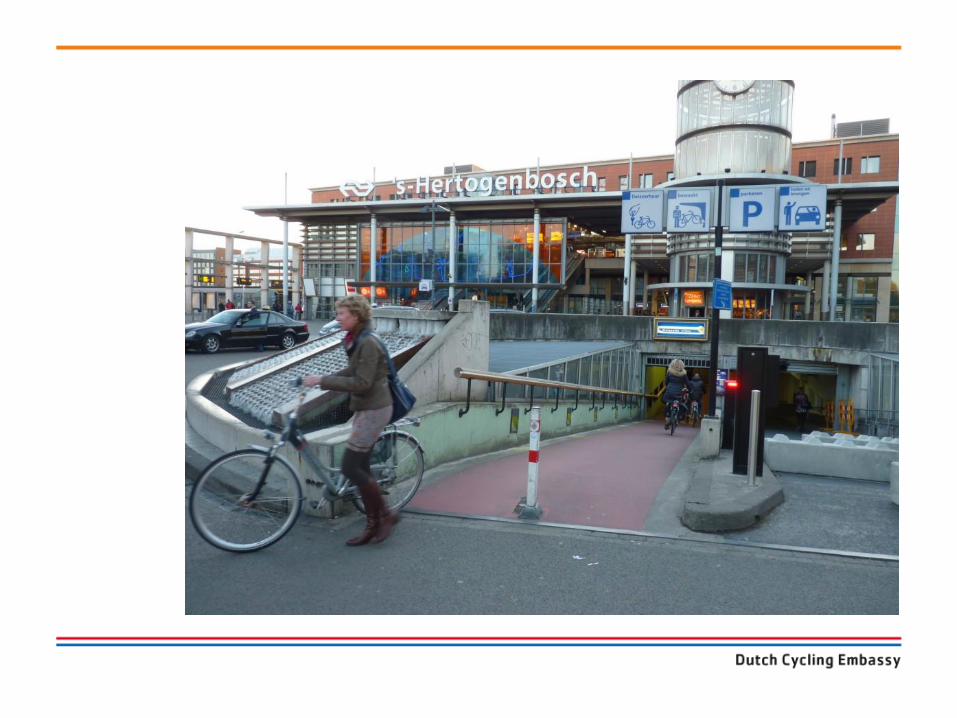
Links to look at
> Access trip
> Transfer bicycle > public transport
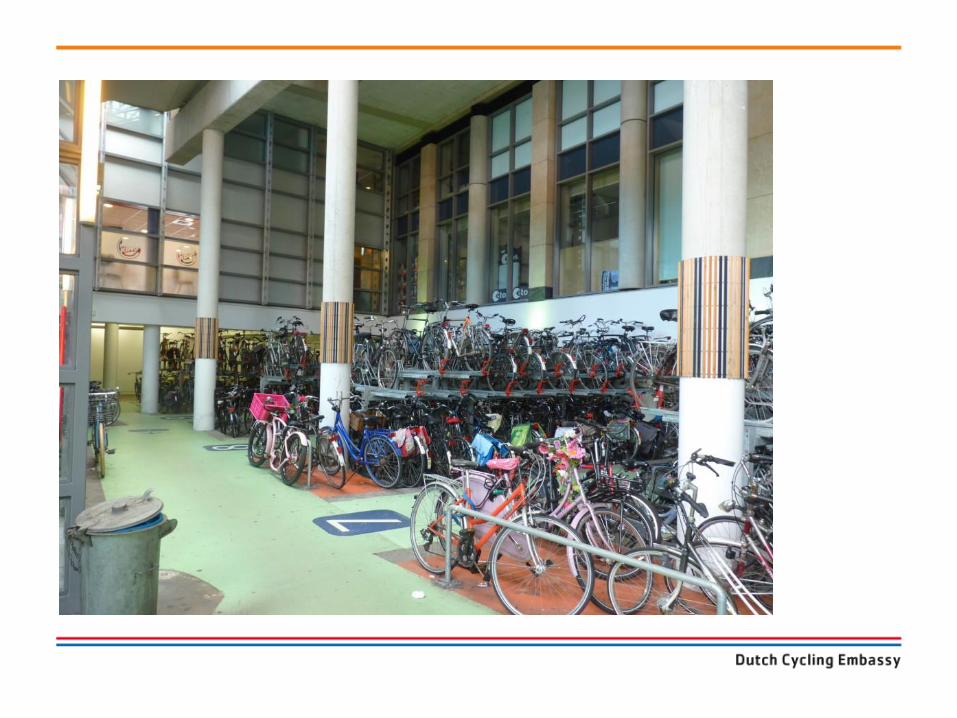
> Parking
> ‘Roll on roll off’
> Public transport ride
> Transfer public transport > bicycle
> Egress trip
access
transfer
public
transport
ride
transfer
egress
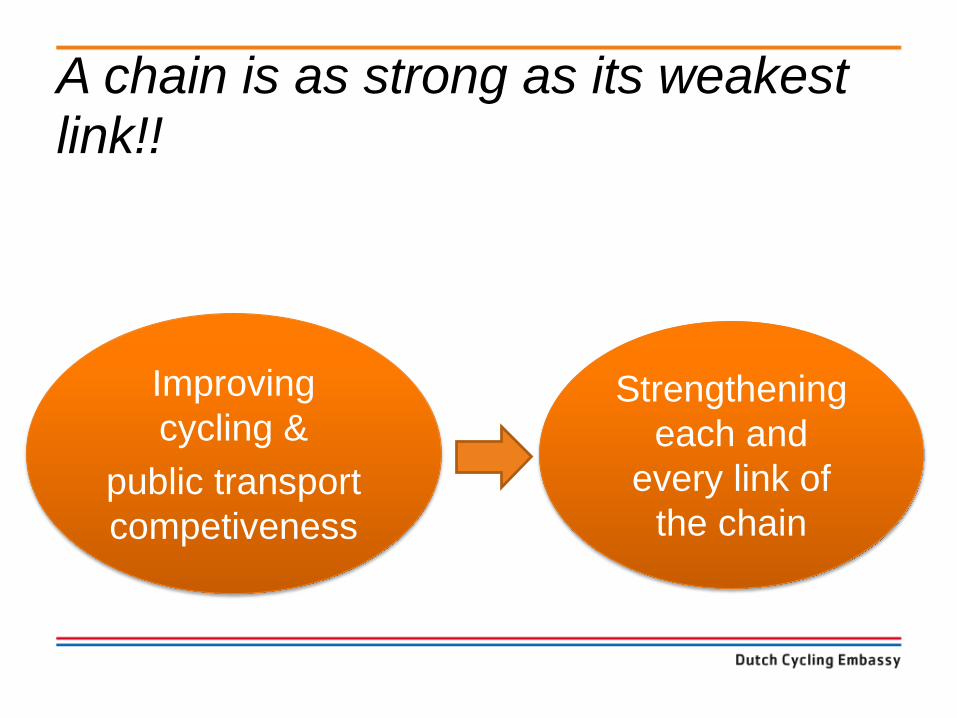
A chain is as strong as its weakest link!!
Improving
cycling &
public transport
competiveness
Strengthening
each and
every link of
the chain
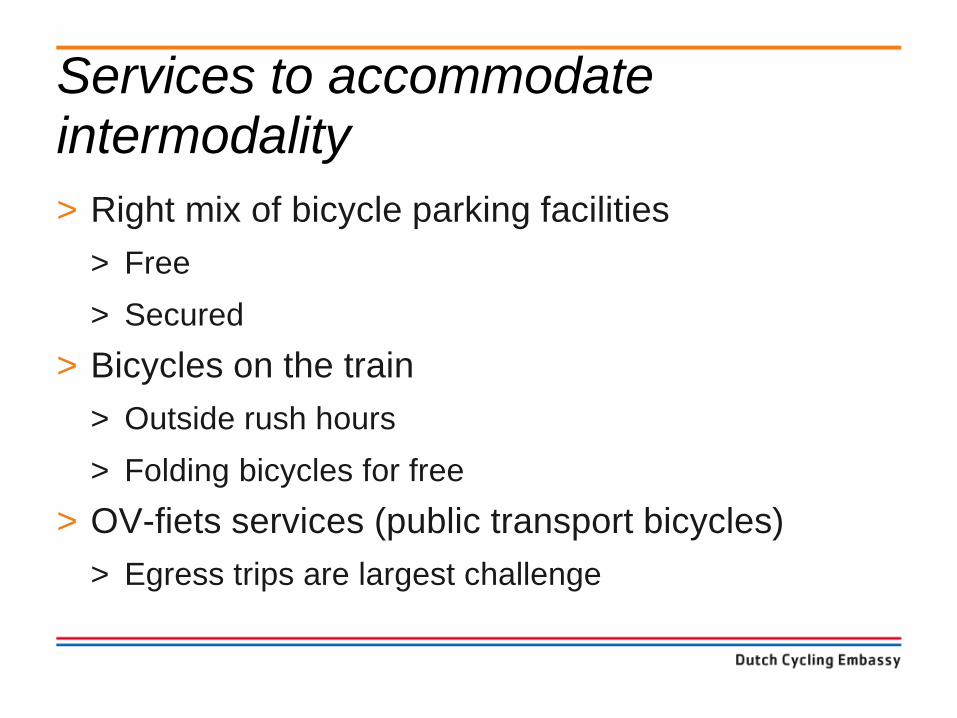
Services to accommodate intermodality
> Right mix of bicycle parking facilities
> Free
> Secured
> Bicycles on the train
> Outside rush hours
> Folding bicycles for free
> OV-fiets services (public transport bicycles)
> Egress trips are largest challenge
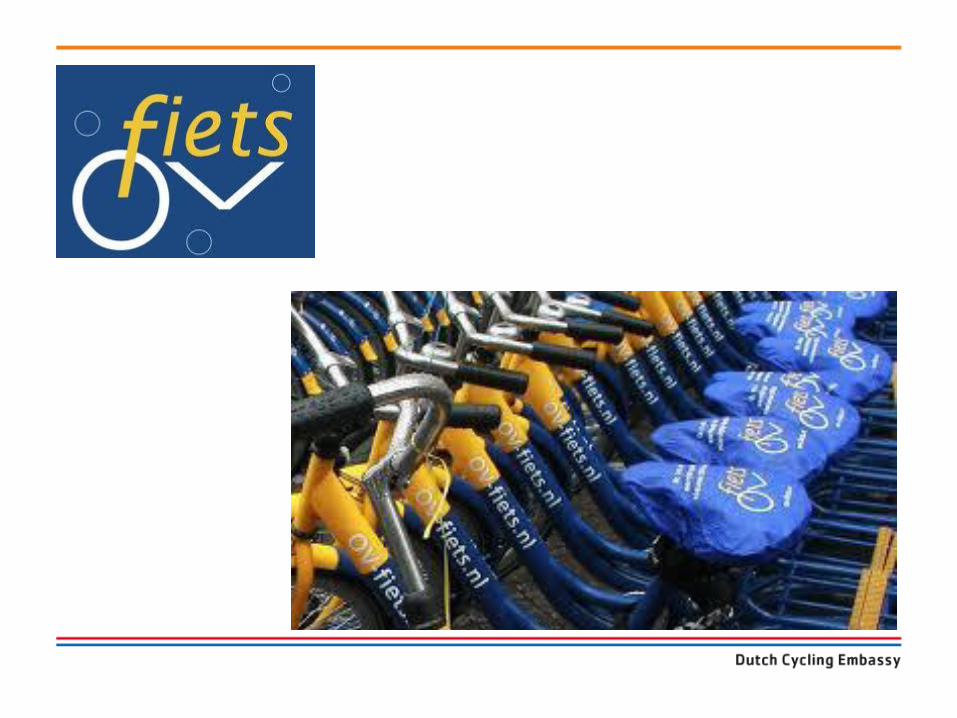
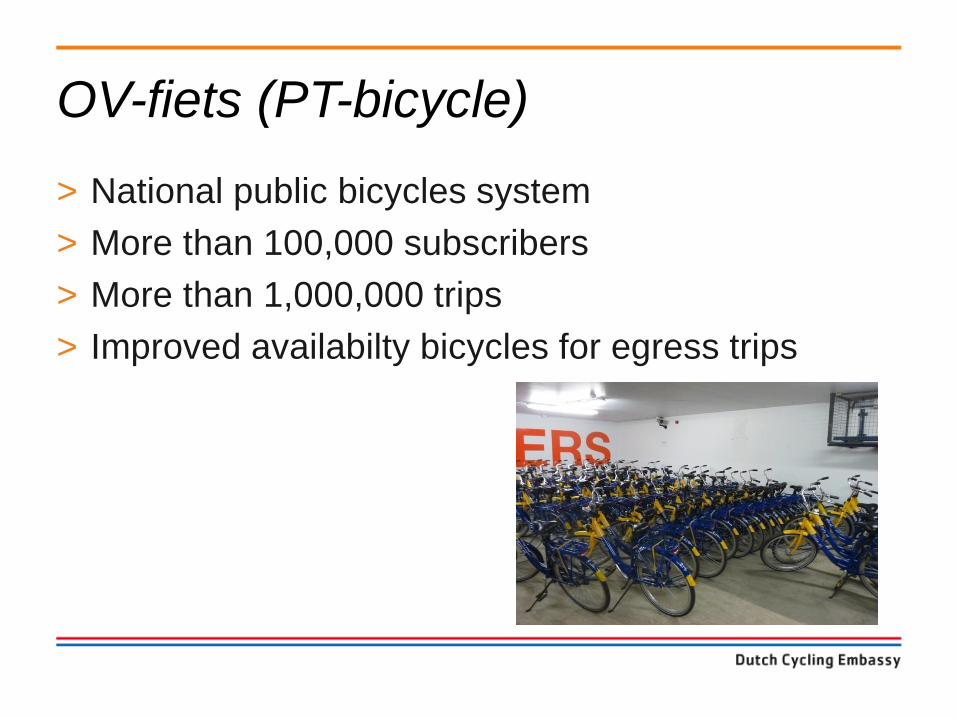
OV-fiets (PT-bicycle)
> National public bicycles system
> More than 100,000 subscribers
> More than 1,000,000 trips
> Improved availabilty bicycles for egress trips
Conclusion
The Netherlands
> Tradition of cycling….
> …needs to be fostered
> Bicycles and accessories reflect utilitarian nature
> Supported by policies
> Public transport gains from cycling