Embed Size (px)
Citation preview
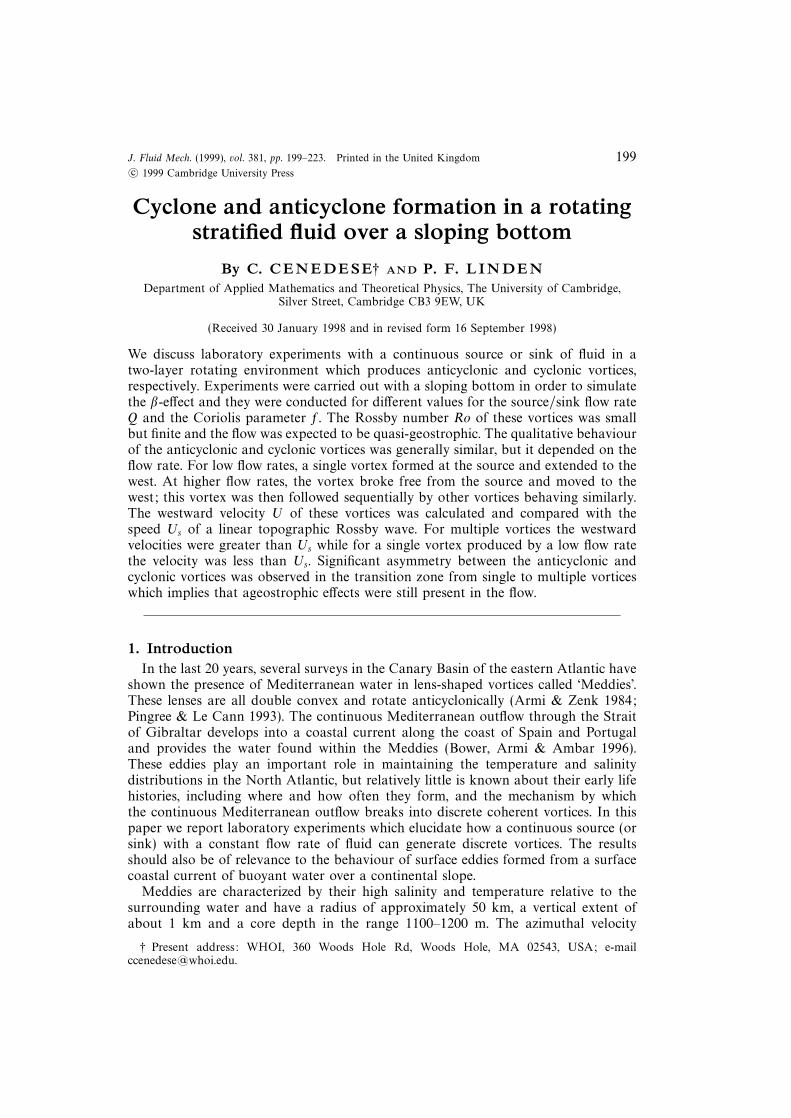
J. Fluid Mech. (1999), vol. 381, pp. 199–223. Printed in the United Kingdom
c© 1999 Cambridge University Press
199
Cyclone and anticyclone formation in a rotatingstratified fluid over a sloping bottom
By C. C E N E D E S E† AND P. F. L I N D E NDepartment of Applied Mathematics and Theoretical Physics, The University of Cambridge,
Silver Street, Cambridge CB3 9EW, UK
(Received 30 January 1998 and in revised form 16 September 1998)
We discuss laboratory experiments with a continuous source or sink of fluid in atwo-layer rotating environment which produces anticyclonic and cyclonic vortices,respectively. Experiments were carried out with a sloping bottom in order to simulatethe β-effect and they were conducted for different values for the source/sink flow rateQ and the Coriolis parameter f. The Rossby number Ro of these vortices was smallbut finite and the flow was expected to be quasi-geostrophic. The qualitative behaviourof the anticyclonic and cyclonic vortices was generally similar, but it depended on theflow rate. For low flow rates, a single vortex formed at the source and extended to thewest. At higher flow rates, the vortex broke free from the source and moved to thewest; this vortex was then followed sequentially by other vortices behaving similarly.The westward velocity U of these vortices was calculated and compared with thespeed Us of a linear topographic Rossby wave. For multiple vortices the westwardvelocities were greater than Us while for a single vortex produced by a low flow ratethe velocity was less than Us. Significant asymmetry between the anticyclonic andcyclonic vortices was observed in the transition zone from single to multiple vorticeswhich implies that ageostrophic effects were still present in the flow.
1. IntroductionIn the last 20 years, several surveys in the Canary Basin of the eastern Atlantic have
shown the presence of Mediterranean water in lens-shaped vortices called ‘Meddies’.These lenses are all double convex and rotate anticyclonically (Armi & Zenk 1984;Pingree & Le Cann 1993). The continuous Mediterranean outflow through the Straitof Gibraltar develops into a coastal current along the coast of Spain and Portugaland provides the water found within the Meddies (Bower, Armi & Ambar 1996).These eddies play an important role in maintaining the temperature and salinitydistributions in the North Atlantic, but relatively little is known about their early lifehistories, including where and how often they form, and the mechanism by whichthe continuous Mediterranean outflow breaks into discrete coherent vortices. In thispaper we report laboratory experiments which elucidate how a continuous source (orsink) with a constant flow rate of fluid can generate discrete vortices. The resultsshould also be of relevance to the behaviour of surface eddies formed from a surfacecoastal current of buoyant water over a continental slope.
Meddies are characterized by their high salinity and temperature relative to thesurrounding water and have a radius of approximately 50 km, a vertical extent ofabout 1 km and a core depth in the range 1100–1200 m. The azimuthal velocity
† Present address: WHOI, 360 Woods Hole Rd, Woods Hole, MA 02543, USA; [email protected].
200 C. Cenedese and P. F. Linden
of these lenses is approximately 0.2 m s−1 at radii between 30 and 45 km. Aftertheir formation, Meddies are advected rapidly along the topography with a velocityranging between 13 cm s−1 and 34 cm s−1 (Bower et al. 1996). They are observed to belong-lived structures (Armi et al. 1988) with a translation that is mainly to the Southcovering 1100 km in two years. Two dimensionless parameters are important for thiskind of flow: the Rossby number Ro = ζ/f, where ζ is the relative vorticity and fis the planetary vorticity, and the Burger number B = (g′H)1/2/fL, where g′ is thereduced gravity, H is the fluid depth and L is a characteristic horizontal lengthscale.For Meddies Ro ≈ 0.04 and B ≈ 2. A low Rossby number suggests that the flow isquasi-geostrophic and a Burger number of order of unity suggests that the buoyancyforces and the Coriolis forces are in balance, since the horizontal scale of the motionis of the same order of magnitude as the Rossby radius of deformation.
Davey & Killworth (1989) determined the flow produced by a confined source ofbuoyancy in an otherwise single layer of water using a reduced-gravity model ona β-plane (the upper layer is assumed to be passive). In their numerical model thesource filled an area of the order of the Rossby deformation radius across and theflow rate was constant. A nonlinear shallow-water model was used and the solutiongave three regimes. For weak forcing the solution was linear and a single vortex wasproduced, taking the form of a ‘tube’ of fluid extending westward from the sourceas a zonal flow, with north–south flow only near the source and at the front of theextending tube. With increasing amplitude of the forcing nonlinear terms becamesignificant. The zonal flow was then unstable and a series of anticyclonic eddies, eachof which propagated westward, was observed. For greater forcing the motion was notresolved by their numerical calculation.
Laboratory experiments investigating the flow produced by a source of less-densefluid in an otherwise single-layer rotating environment were conducted by Linden(1991). A sloping bottom was used in order to simulate the β-effect. Anticyclonicvortices developed at the surface and two different patterns of behaviour wereobserved. At low flow rates a single vortex formed in the centre of the tank andextended to the west. For larger flow rates a single vortex broke free from the sourceand moved to the west, followed by other vortices behaving in the same fashion. Inthese experiments the vortex was isolated inside the denser layer and the interfacebeneath the vortex surfaces intersected the free surface to form a front.
The present paper is an extension of this work in two respects, both associatedwith the effects of finite Rossby number. The introduction of buoyant water toform a surface vortex (Linden 1991) introduces ageostrophic effects associated withthe front where the edge of the buoyant vortex intersects the free surface. Here weinvestigate the flow produced by a source in the upper layer of a pre-existing two-layerrotating environment, thus removing these ageostrophic effects of the front. The wateradded at the source is of the same density as the water in the upper layer, and theconsequent baroclinic vortex deforms the interface. However, the variations of layerdepth are small compared with the layer depth, so that the flow is approximately quasi-geostrophic (QG). The second extension examines the behaviour of both anticyclonicand cyclonic vortices. A sink in the upper layer was used to generate barocliniccyclonic vortices. In the geostrophic approximation there is no dynamical differencebetween cyclones and anticyclones of the same vorticity structure, and comparisonbetween the source and sink experiments gives further information on the importanceof ageostrophic effects in these flows.
The experimental apparatus is described in § 2. The results are given in § 3 and arecompared with the one-layer results in § 4. The conclusions of the work are discussedin § 5.
Cyclone and anticyclone formation in a stratified fluid 201
Flowmeter
Lights
Camera
R1R1R1
R2
s
q1q1q1
q2
x
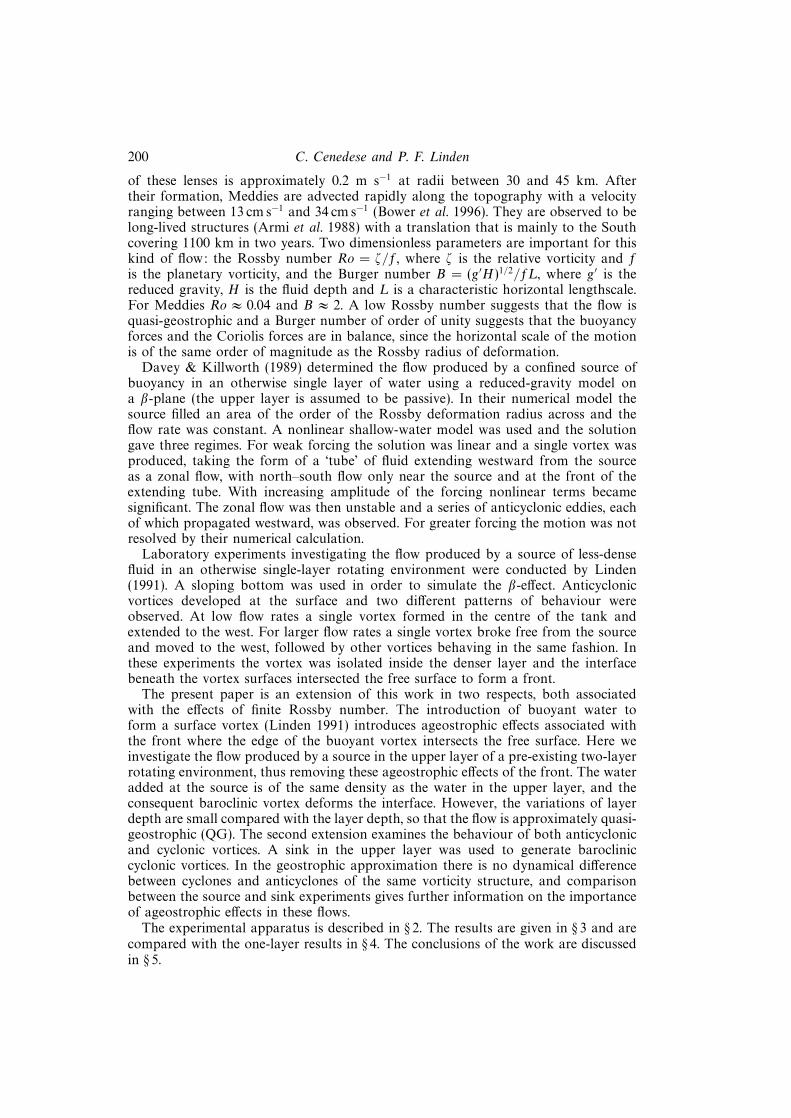
Figure 1. Diagram showing the experimental apparatus.
2. The experimentsA sketch of the apparatus is shown in figure 1. The experiments were conducted
in a transparent Perspex tank of depth 35 cm with a square base measuring 45 cm.This was mounted on a direct-drive, 1m diameter, rotating turntable with a verticalaxis of rotation. We used a square tank to avoid optical distortion from side viewsassociated with a circular tank. The tank was centred on the vertical rotation axis ofthe table and had a bottom slope (s) to simulate the β-effect. The use of a slopingbottom to represent a β-plane is strictly valid only for a unstratified fluid. In the two-layer stratification used here, the slope provides an equivalent potential vorticity (PV)gradient in the lower layer, but there is not a direct representation of the PV gradientin the upper layer. Nevertheless, the thermal wind coupling across the interface impliesthat the motion in the upper layer is also influenced by the lower-layer PV gradient.Hence, the essential features of a β-plane are captured using a slope in this case wherethe shallowest part of the tank corresponded to the ‘northern’ shore of the northernhemisphere topographic β-plane. East was to the right looking onshore, west was tothe left and south was the deepest end. A reservoir (R1) of dyed fluid of density ρ1
was connected to a flow meter through a plastic tube of 0.6 cm diameter. In turnthe flow meter was connected through more plastic tube to a copper pipe, of 0.3 cminner diameter, that ended in the middle of the tank. A small piece of sponge wasattached to the open end of the pipe, so as to reduce the mixing between the flowfrom the pipe and the environment. A gravity-fed source was achieved by positioningthe reservoir (R1) on the top of the rotating table, and a sink was generated by fixingthe reservoir (R1) below the tank. In both cases the constant head driving the injectionor withdrawal equates to a constant flow rate Q through the tube.
The two-layer environment was produced by first adding a layer of depth H2 ofwater of density ρ2 and leaving the whole system to come to a state of solid-bodyrotation. Dyed water, of density ρ1 < ρ2, was added from a reservoir (R2) througha float at a low flow rate (in order to minimize mixing on the interface betweenthe two layers) to form the second layer of depth H1. The addition of the secondlayer caused a density interface perturbation, and the experiment was only startedafter this perturbation had decayed and the system was close to solid-body rotation.
202 C. Cenedese and P. F. Linden
Exp. no. f(s−1) Q(cm3 s−1)† g′(cm s−1) H2/H1 W (cm)‡A 1.0 +3.0 0.36 0.32 15.9B 3.3 +3.0 0.36 0.25 8.7C 1.0 −2.0 0.46 0.33 12.6D 3.3 −3.0 0.46 0.51 8.7
† Q > 0 for a source, Q < 0 for a sink.‡ W is the north–south horizontal scale of the flow.
Table 1. Parameters in the experiments analysed with the particle tracking technique.
(Diffusion of the scalar, in this case salt, producing the density field means thatcomplete solid-body rotation is not achieved. However, residual circulations werealways a very small fraction (≈1%) of the motions induced by the source or sink).For anticyclonic vortices, fluid of density ρ1 from the reservoir R1 was added at aconstant flow rate Q through the source positioned at the surface of the second layer.For cyclonic vortices, fluid of density ρ1 was withdrawn from the top layer into thereservoir R1 at a constant flow rate Q through a pipe positioned at the surface ofthe upper layer. In both experiments the density difference was achieved by usingsalt solution as the lower layer. Consequently the two fluids were miscible and somemixing between them occurred along the interface of the two layers. However, theamount of mixing was small and is neglected (typically the interface was about 0.5 cmthick). The buoyancy forces were due to the reduced gravity g′ = g|ρ2−ρ2|/ρ2, whereg is the gravitational acceleration acting on the interface. In the experiments g′ wasfixed at 0.36 cm s−2 except for Exp C and Exp D (see table 1) where g′ = 0.46 cm s−2.The Coriolis parameter f varied from 0.6 s−1 to 3.3 s−1 and the slope of the bottomwas fixed at s = tan α = 0.42, where α is the angle between the slope and thehorizontal (see figure 1). The flow rate covered the range 0.55 6 Q 6 4.50 cm3 s−1
and the ratio of the layer depths, measured in the middle of the tank, was fixed atH2/H1 = 0.5, except for the four experiments in table 1. The Rossby number of thevortices, defined as the absolute value of the ratio of the relative vorticity and theCoriolis parameter, ranged from 0.12 to 0.30 and the Rossby radius of deformation,
a = (g′H1/21 H
1/22 f−2)0.5, varied from 0.57 cm to 3.15 cm.
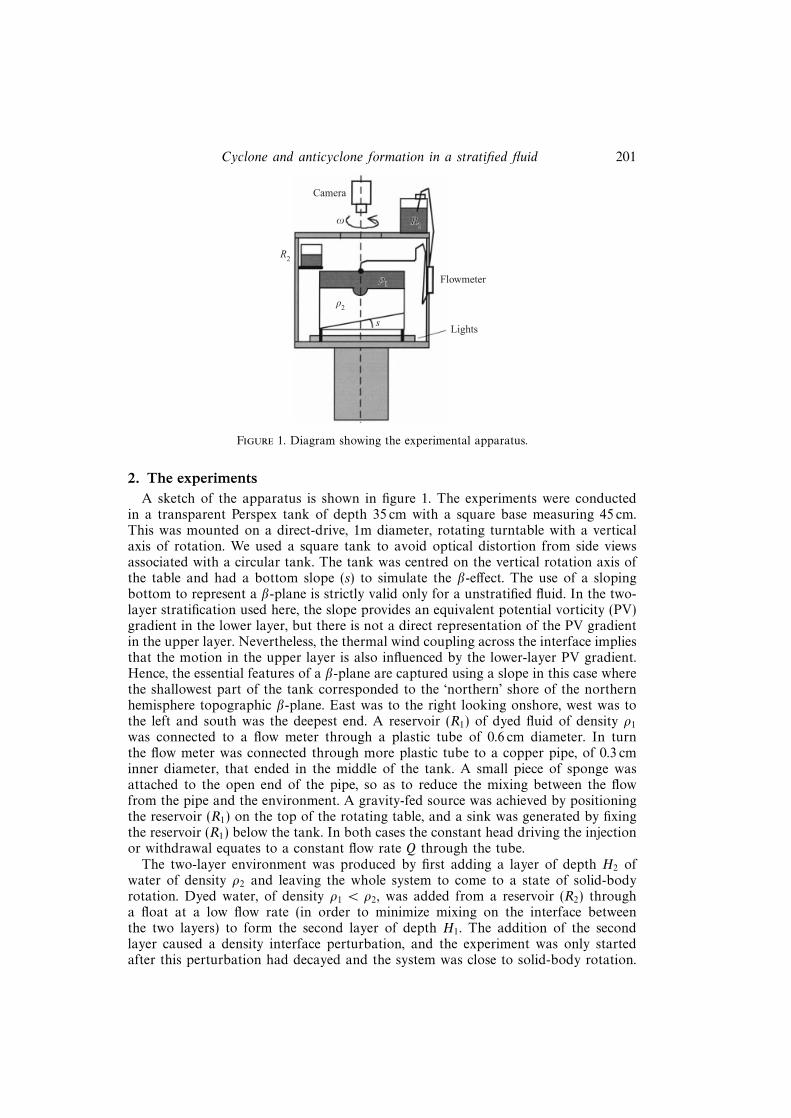
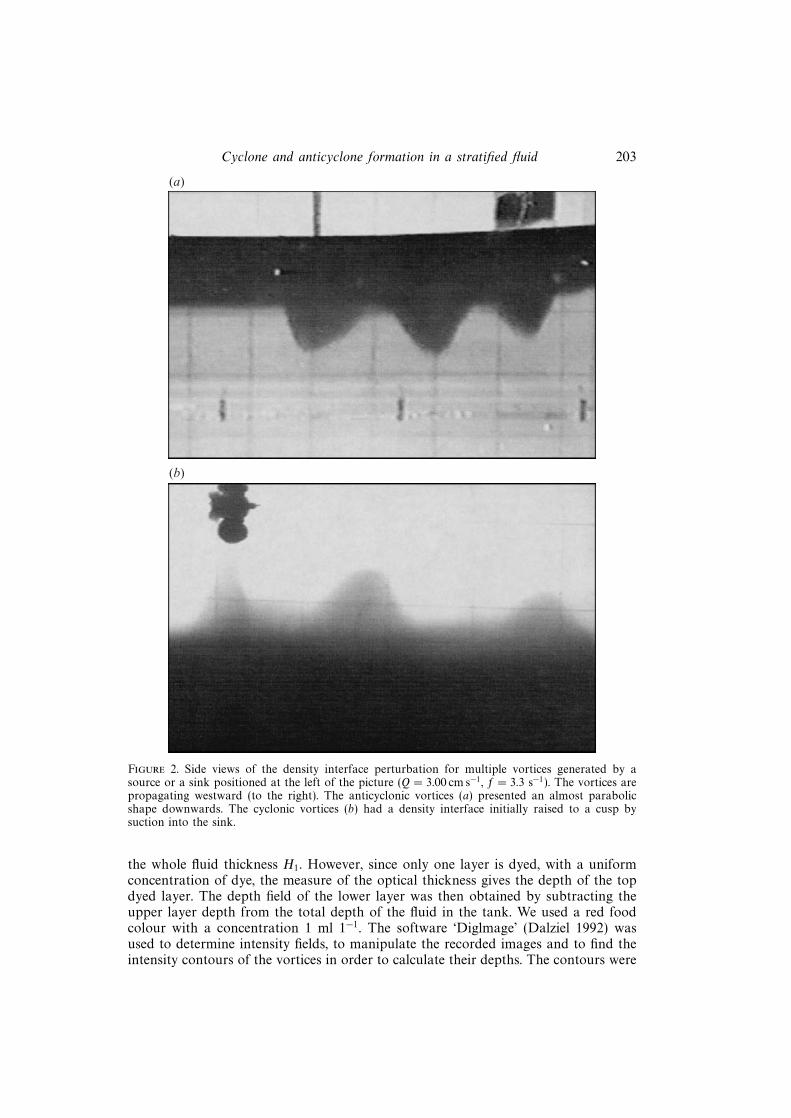
Flow visualization and measurements of the velocity and depth fields were obtainedfrom video recordings the flow. A video camera was mounted above the tank andfixed to the turntable so that the velocity measurements were obtained in the rotatingframe. A mirror was set up on one side of the table in order to record a verticalside view of the vortices. The side view of the anticyclonic vortices (figure 2 a) wasvisualized by dying the top layer and using the same dye concentration in the sourcefluid. For the cyclonic vortices (figure 2 b) the bottom layer was dyed and clear waterwas drawn from the top layer through the sink.
In order to measure the depth fields for both anticyclonic and cyclonic vorticesthe top layer was dyed and the video camera recorded a plan view of the flow. Thereduction in intensity of light transmitted through the top dyed layer during theexperiment was measured and compared to that through the top dyed layer with noflow at the beginning of the experiment (for details see Cenedese & Dalziel 1998).In order to do this with the camera positioned above the tank light sources wereplaced under the tank. In fact this technique, also referred to as a measurementof optical thickness, gives a measure of the average concentration of the dye over
Cyclone and anticyclone formation in a stratified fluid 203
(b)
(a)
Figure 2. Side views of the density interface perturbation for multiple vortices generated by asource or a sink positioned at the left of the picture (Q = 3.00 cm s−1, f = 3.3 s−1). The vortices arepropagating westward (to the right). The anticyclonic vortices (a) presented an almost parabolicshape downwards. The cyclonic vortices (b) had a density interface initially raised to a cusp bysuction into the sink.
the whole fluid thickness H1. However, since only one layer is dyed, with a uniformconcentration of dye, the measure of the optical thickness gives the depth of the topdyed layer. The depth field of the lower layer was then obtained by subtracting theupper layer depth from the total depth of the fluid in the tank. We used a red foodcolour with a concentration 1 ml 1−1. The software ‘Diglmage’ (Dalziel 1992) wasused to determine intensity fields, to manipulate the recorded images and to find theintensity contours of the vortices in order to calculate their depths. The contours were
204 C. Cenedese and P. F. Linden
determined at time increments of ∆t. For the single-vortex case the extreme westernedge of the vortex, evaluated by sight, was located with an uncertainty < 0.6 cm. Forthe multiple-vortices case the position of the centre of each vortex was evaluated bysight with the same uncertainty. From these measurements the data were fitted by astraight line whose slope then gave the velocity Ui of the vortices, where i = 1, 2, . . . , n,for n vortices in a run. When i > 1 the average velocity U was calculated.
A similar procedure was used to calculate the phase speed Up of waves observedin the transition from single to multiple vortices described in § 3.1.1. In this case theintensity contour of the wave was marked and the position of the crest of the wavedetermined at set intervals of time.
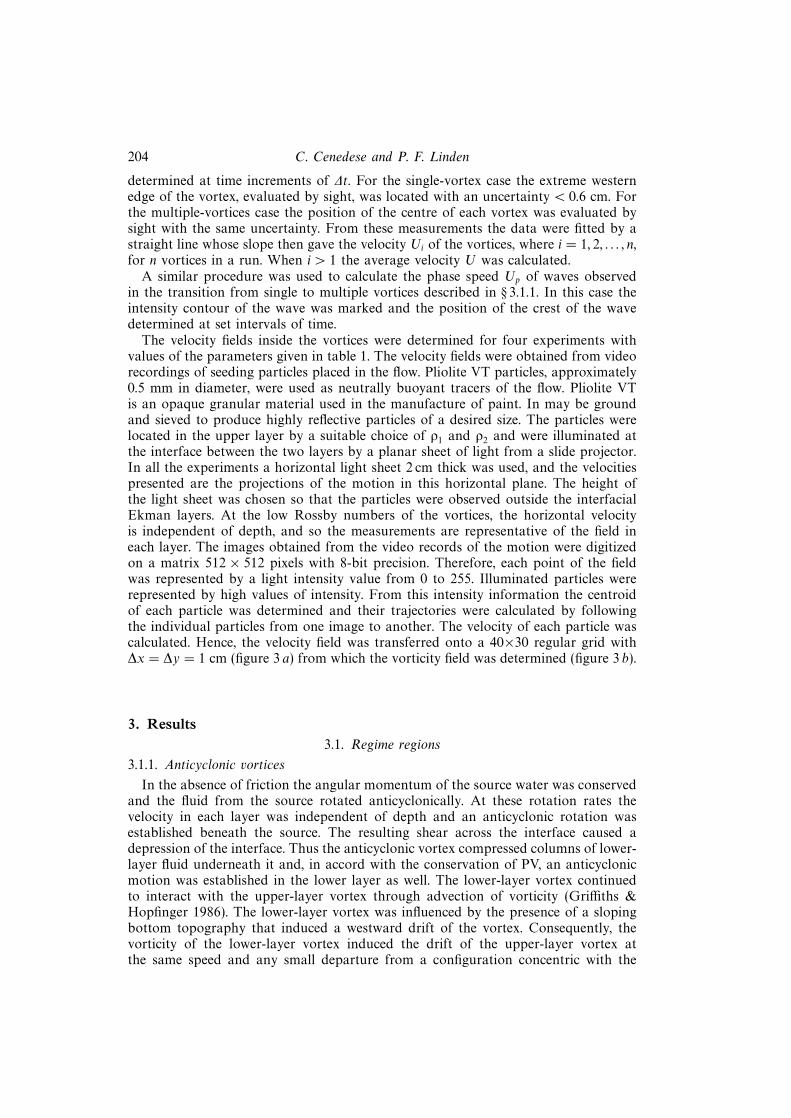
The velocity fields inside the vortices were determined for four experiments withvalues of the parameters given in table 1. The velocity fields were obtained from videorecordings of seeding particles placed in the flow. Pliolite VT particles, approximately0.5 mm in diameter, were used as neutrally buoyant tracers of the flow. Pliolite VTis an opaque granular material used in the manufacture of paint. In may be groundand sieved to produce highly reflective particles of a desired size. The particles werelocated in the upper layer by a suitable choice of ρ1 and ρ2 and were illuminated atthe interface between the two layers by a planar sheet of light from a slide projector.In all the experiments a horizontal light sheet 2 cm thick was used, and the velocitiespresented are the projections of the motion in this horizontal plane. The height ofthe light sheet was chosen so that the particles were observed outside the interfacialEkman layers. At the low Rossby numbers of the vortices, the horizontal velocityis independent of depth, and so the measurements are representative of the field ineach layer. The images obtained from the video records of the motion were digitizedon a matrix 512 × 512 pixels with 8-bit precision. Therefore, each point of the fieldwas represented by a light intensity value from 0 to 255. Illuminated particles wererepresented by high values of intensity. From this intensity information the centroidof each particle was determined and their trajectories were calculated by followingthe individual particles from one image to another. The velocity of each particle wascalculated. Hence, the velocity field was transferred onto a 40×30 regular grid with∆x = ∆y = 1 cm (figure 3 a) from which the vorticity field was determined (figure 3 b).
3. Results3.1. Regime regions
3.1.1. Anticyclonic vortices
In the absence of friction the angular momentum of the source water was conservedand the fluid from the source rotated anticyclonically. At these rotation rates thevelocity in each layer was independent of depth and an anticyclonic rotation wasestablished beneath the source. The resulting shear across the interface caused adepression of the interface. Thus the anticyclonic vortex compressed columns of lower-layer fluid underneath it and, in accord with the conservation of PV, an anticyclonicmotion was established in the lower layer as well. The lower-layer vortex continuedto interact with the upper-layer vortex through advection of vorticity (Griffiths &Hopfinger 1986). The lower-layer vortex was influenced by the presence of a slopingbottom topography that induced a westward drift of the vortex. Consequently, thevorticity of the lower-layer vortex induced the drift of the upper-layer vortex atthe same speed and any small departure from a configuration concentric with the
Cyclone and anticyclone formation in a stratified fluid 205
(b)
(a)30
25
20
15
10
5
00 5 10 15 20 25 30 35 40
25
20
15
10
5
5 10 15 20 25 30 35
–0.12
–0.06
0
0.06
0.12
0.18
0.24
x (cm)
y (c
m)
x (cm)
y (c
m)
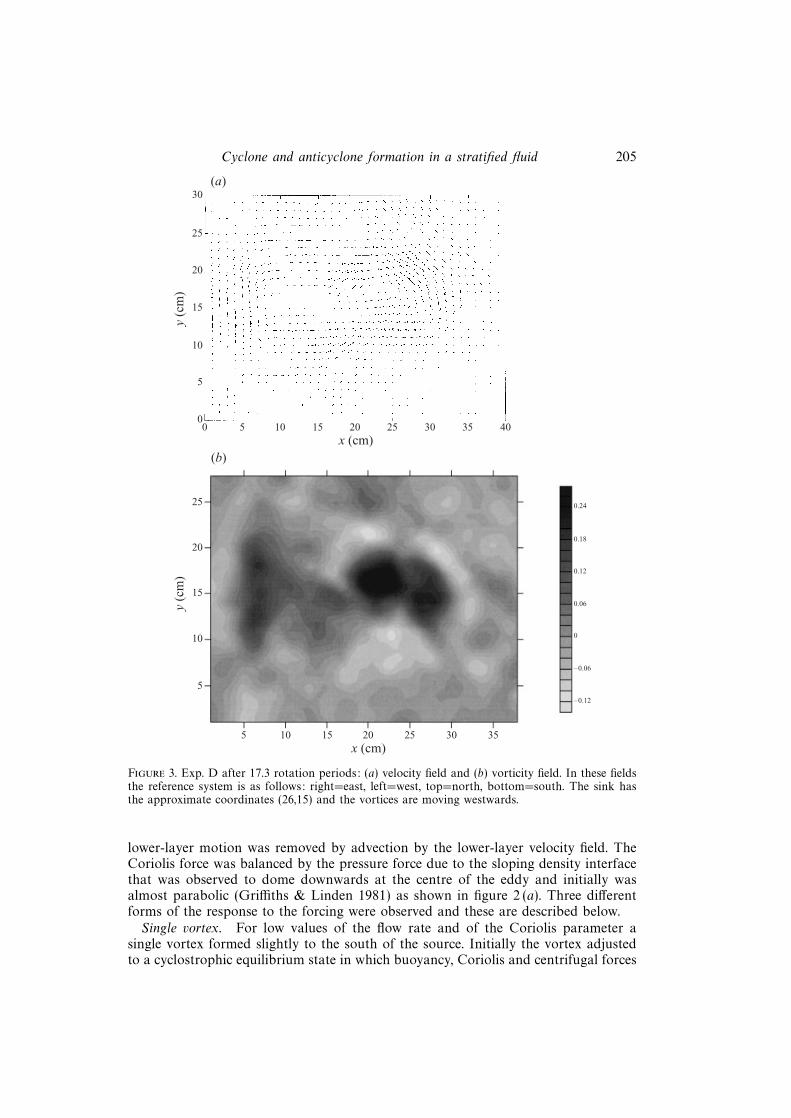
Figure 3. Exp. D after 17.3 rotation periods: (a) velocity field and (b) vorticity field. In these fieldsthe reference system is as follows: right=east, left=west, top=north, bottom=south. The sink hasthe approximate coordinates (26,15) and the vortices are moving westwards.
lower-layer motion was removed by advection by the lower-layer velocity field. TheCoriolis force was balanced by the pressure force due to the sloping density interfacethat was observed to dome downwards at the centre of the eddy and initially wasalmost parabolic (Griffiths & Linden 1981) as shown in figure 2 (a). Three differentforms of the response to the forcing were observed and these are described below.
Single vortex. For low values of the flow rate and of the Coriolis parameter asingle vortex formed slightly to the south of the source. Initially the vortex adjustedto a cyclostrophic equilibrium state in which buoyancy, Coriolis and centrifugal forces
206 C. Cenedese and P. F. Linden
(c) (d )
(a) (b)
(e) ( f )
(g)
Figure 4. For caption see facing page.
Cyclone and anticyclone formation in a stratified fluid 207
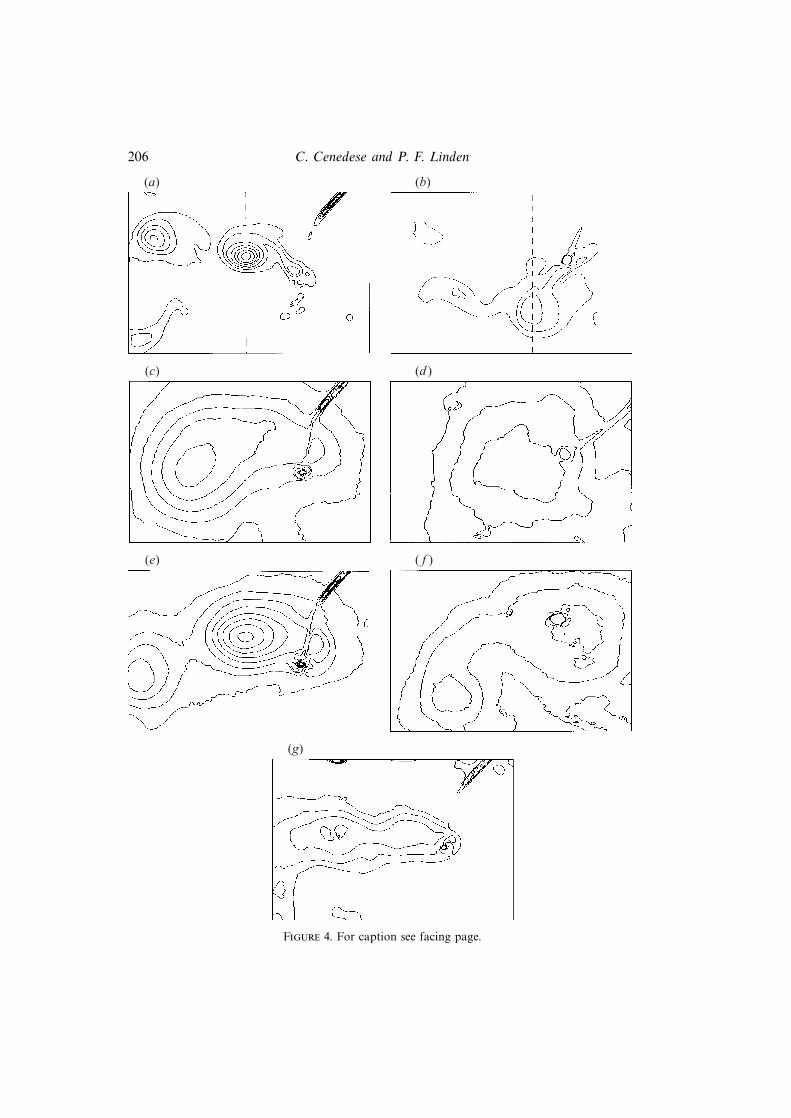
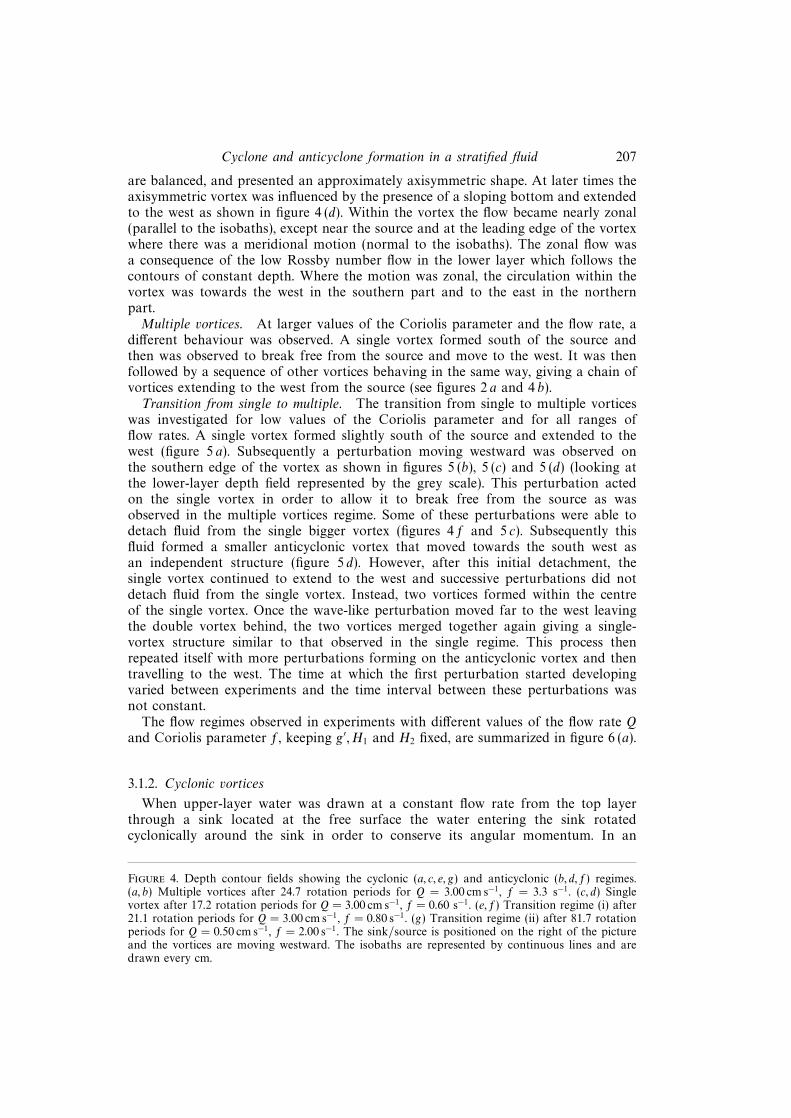
are balanced, and presented an approximately axisymmetric shape. At later times theaxisymmetric vortex was influenced by the presence of a sloping bottom and extendedto the west as shown in figure 4 (d). Within the vortex the flow became nearly zonal(parallel to the isobaths), except near the source and at the leading edge of the vortexwhere there was a meridional motion (normal to the isobaths). The zonal flow wasa consequence of the low Rossby number flow in the lower layer which follows thecontours of constant depth. Where the motion was zonal, the circulation within thevortex was towards the west in the southern part and to the east in the northernpart.
Multiple vortices. At larger values of the Coriolis parameter and the flow rate, adifferent behaviour was observed. A single vortex formed south of the source andthen was observed to break free from the source and move to the west. It was thenfollowed by a sequence of other vortices behaving in the same way, giving a chain ofvortices extending to the west from the source (see figures 2 a and 4 b).
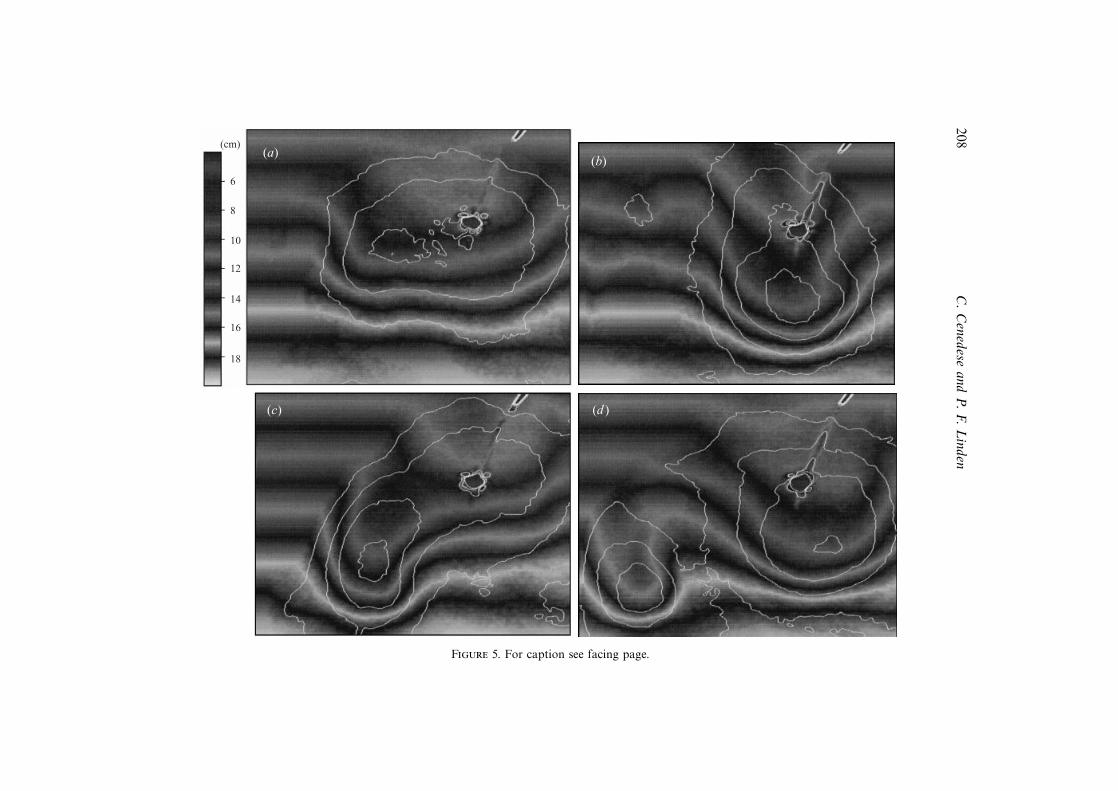
Transition from single to multiple. The transition from single to multiple vorticeswas investigated for low values of the Coriolis parameter and for all ranges offlow rates. A single vortex formed slightly south of the source and extended to thewest (figure 5 a). Subsequently a perturbation moving westward was observed onthe southern edge of the vortex as shown in figures 5 (b), 5 (c) and 5 (d) (looking atthe lower-layer depth field represented by the grey scale). This perturbation actedon the single vortex in order to allow it to break free from the source as wasobserved in the multiple vortices regime. Some of these perturbations were able todetach fluid from the single bigger vortex (figures 4 f and 5 c). Subsequently thisfluid formed a smaller anticyclonic vortex that moved towards the south west asan independent structure (figure 5 d). However, after this initial detachment, thesingle vortex continued to extend to the west and successive perturbations did notdetach fluid from the single vortex. Instead, two vortices formed within the centreof the single vortex. Once the wave-like perturbation moved far to the west leavingthe double vortex behind, the two vortices merged together again giving a single-vortex structure similar to that observed in the single regime. This process thenrepeated itself with more perturbations forming on the anticyclonic vortex and thentravelling to the west. The time at which the first perturbation started developingvaried between experiments and the time interval between these perturbations wasnot constant.
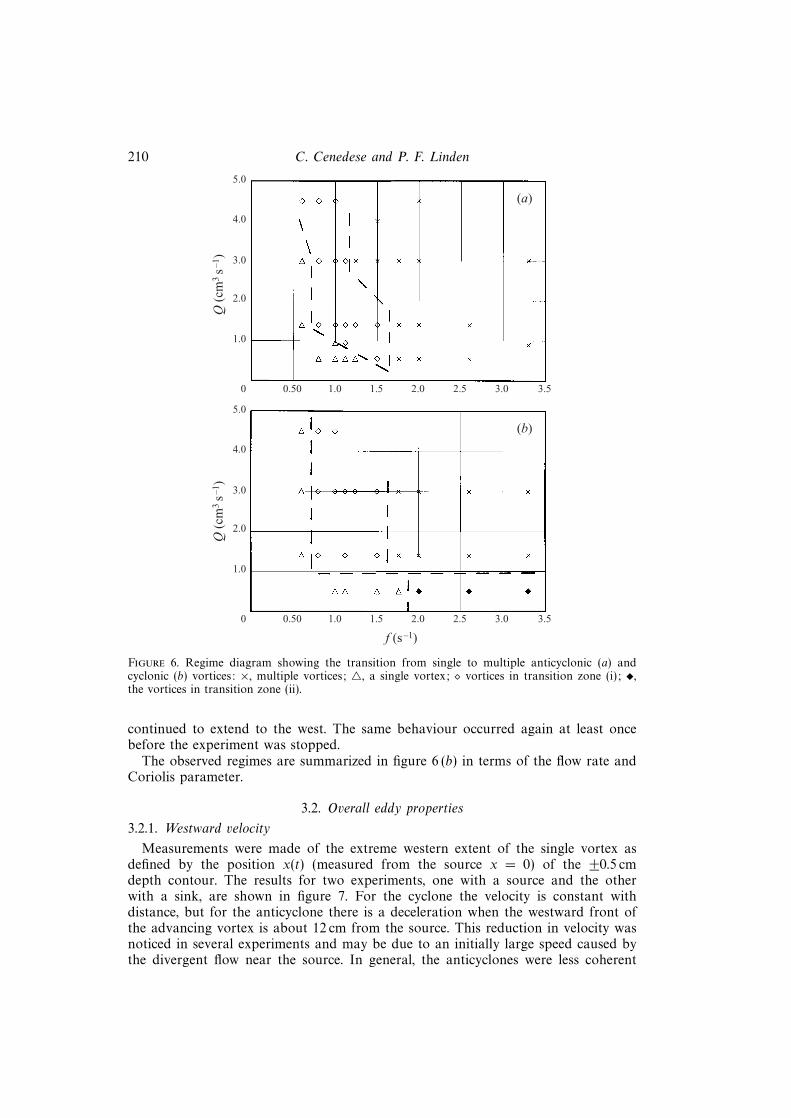
The flow regimes observed in experiments with different values of the flow rate Qand Coriolis parameter f, keeping g′, H1 and H2 fixed, are summarized in figure 6 (a).
3.1.2. Cyclonic vortices
When upper-layer water was drawn at a constant flow rate from the top layerthrough a sink located at the free surface the water entering the sink rotatedcyclonically around the sink in order to conserve its angular momentum. In an
Figure 4. Depth contour fields showing the cyclonic (a, c, e, g) and anticyclonic (b, d, f) regimes.(a, b) Multiple vortices after 24.7 rotation periods for Q = 3.00 cm s−1, f = 3.3 s−1. (c, d) Singlevortex after 17.2 rotation periods for Q = 3.00 cm s−1, f = 0.60 s−1. (e, f) Transition regime (i) after21.1 rotation periods for Q = 3.00 cm s−1, f = 0.80 s−1. (g) Transition regime (ii) after 81.7 rotationperiods for Q = 0.50 cm s−1, f = 2.00 s−1. The sink/source is positioned on the right of the pictureand the vortices are moving westward. The isobaths are represented by continuous lines and aredrawn every cm.
208
C.
Cen
edese
and
P.
F.
Lin
den
(c) (d )
(a)(b)
6
8
10
12
14
16
18
(cm)
Figure 5. For caption see facing page.
Cyclone and anticyclone formation in a stratified fluid 209
analogous fashion to the anticyclonic vortices, cyclonic rotation was establishedthroughout the top layer and the shear across the density interface lead to anupward doming of the interface beneath the vortex. This initially appeared as acusp, as shown in figure 2 (b). The doming of the interface stretches the lower-layer fluid underneath it and, as a result, a cyclonic motion is also establishedin the lower layer. There is a similar coupling across the interface of any non-axisymmetric motion in either layer through advection of vorticity as describedin § 3.1.1, and a westward drift of the whole structure is induced by the slop-ing bottom. In this case four different forms of behaviour were observed as fol-lows.
Single vortex. At small values of the Coriolis parameter a single vortex formedslightly to the north of the sink. After cyclostrophic adjustment the vortex was notsymmetric but extended to the west (figure 4 c) in a similar manner to the anticyclonicvortex described in § 3.1.1. Within the elongated vortex ‘tube’ the flow was nearlyzonal, towards the east in the southern side and to the west in the northern side.
Multiple vortices. When the Coriolis parameter and the flow rate were increaseda behaviour similar to that described in § 3.1.1. was observed. A single vortex formedin the centre of the tank north of the sink and was then observed to break free fromthe sink and move to the west followed by a sequence of essentially identical vortices(figures 2 b and 4 a). However, in these experiments the vortices were more coherentand axisymmetric than in the anticyclonic case.
Transition from single to multiple. The transition from single to multiple vorticeswas characterized by two different behaviours.
(i) A different structure developed for small values of the Coriolis parameter andfor high flow rates (figure 4 e). As in the multiple regime a single vortex formed northof the sink and extended to the west, later breaking free from the sink and movingwest. Then a second single vortex developed but did not break free from the sink.This second vortex was not symmetric but extended to the west, as in the singleregime, and within this vortex the flow was nearly zonal, except near the sink and atthe leading edge of the vortex where there was a meridional motion.
(ii) For small values of the flow rate and for medium to large values of the Coriolisparameter a single vortex formed slightly north of the sink and extended to the westforming a tube-like structure with a zonal flow similar to that in the single regime.The single tube vortex then became distorted and acquired the structure of twomore-circular vortices which were not completely separated from each other and withcommon circulation around their outer boundary, as shown in figure 4(g). These twovortices started moving to the west, as observed in the multiple vortex regime and,at a later stage, merged together to form a single vortex again. This re-formed singlevortex had the same tube-like structure as at the beginning of the experiment and
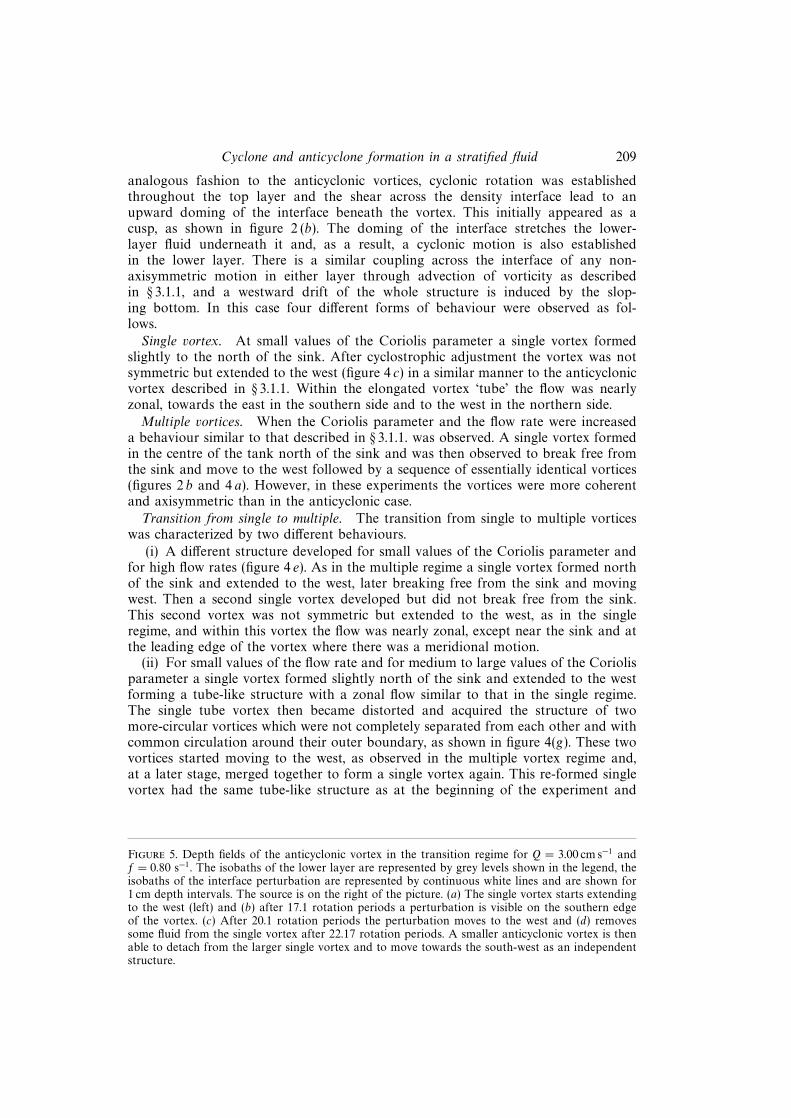
Figure 5. Depth fields of the anticyclonic vortex in the transition regime for Q = 3.00 cm s−1 andf = 0.80 s−1. The isobaths of the lower layer are represented by grey levels shown in the legend, theisobaths of the interface perturbation are represented by continuous white lines and are shown for1 cm depth intervals. The source is on the right of the picture. (a) The single vortex starts extendingto the west (left) and (b) after 17.1 rotation periods a perturbation is visible on the southern edgeof the vortex. (c) After 20.1 rotation periods the perturbation moves to the west and (d) removessome fluid from the single vortex after 22.17 rotation periods. A smaller anticyclonic vortex is thenable to detach from the larger single vortex and to move towards the south-west as an independentstructure.
210 C. Cenedese and P. F. Linden
5.0
4.0
3.0
2.0
1.0
0 0.50 1.0 1.5 2.0 2.5 3.0 3.5
(a)
5.0
4.0
3.0
2.0
1.0
0 0.50 1.0 1.5 2.0 2.5 3.0 3.5
(b)
f (s–1)
Q (
cm3
s–1)
Q (
cm3
s–1)
Figure 6. Regime diagram showing the transition from single to multiple anticyclonic (a) andcyclonic (b) vortices: ×, multiple vortices; 4, a single vortex; � vortices in transition zone (i); �,the vortices in transition zone (ii).
continued to extend to the west. The same behaviour occurred again at least oncebefore the experiment was stopped.
The observed regimes are summarized in figure 6 (b) in terms of the flow rate andCoriolis parameter.
3.2. Overall eddy properties
3.2.1. Westward velocity
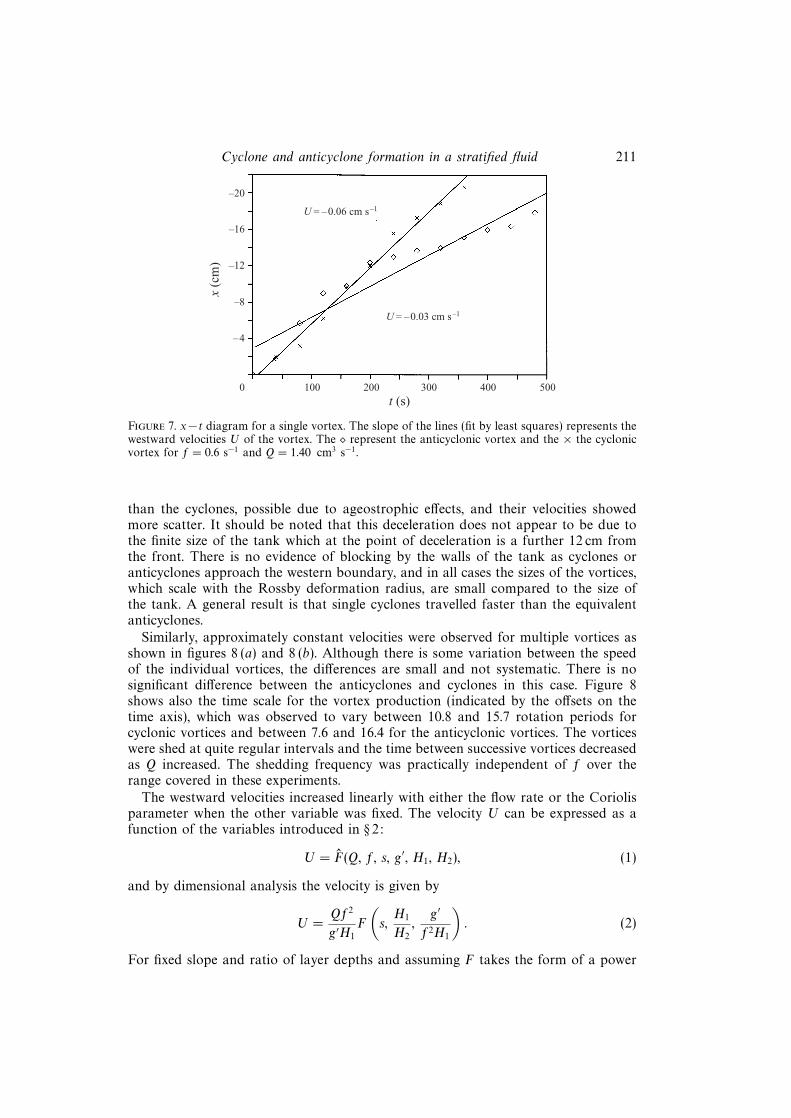
Measurements were made of the extreme western extent of the single vortex asdefined by the position x(t) (measured from the source x = 0) of the ±0.5 cmdepth contour. The results for two experiments, one with a source and the otherwith a sink, are shown in figure 7. For the cyclone the velocity is constant withdistance, but for the anticyclone there is a deceleration when the westward front ofthe advancing vortex is about 12 cm from the source. This reduction in velocity wasnoticed in several experiments and may be due to an initially large speed caused bythe divergent flow near the source. In general, the anticyclones were less coherent
Cyclone and anticyclone formation in a stratified fluid 211
–20
–16
–12
–8
–4
0 100 200 300 400 500t (s)
x (c
m)
U = –0.06 cm s–1
U = –0.03 cm s–1
Figure 7. x− t diagram for a single vortex. The slope of the lines (fit by least squares) represents thewestward velocities U of the vortex. The � represent the anticyclonic vortex and the × the cyclonicvortex for f = 0.6 s−1 and Q = 1.40 cm3 s−1.
than the cyclones, possible due to ageostrophic effects, and their velocities showedmore scatter. It should be noted that this deceleration does not appear to be due tothe finite size of the tank which at the point of deceleration is a further 12 cm fromthe front. There is no evidence of blocking by the walls of the tank as cyclones oranticyclones approach the western boundary, and in all cases the sizes of the vortices,which scale with the Rossby deformation radius, are small compared to the size ofthe tank. A general result is that single cyclones travelled faster than the equivalentanticyclones.
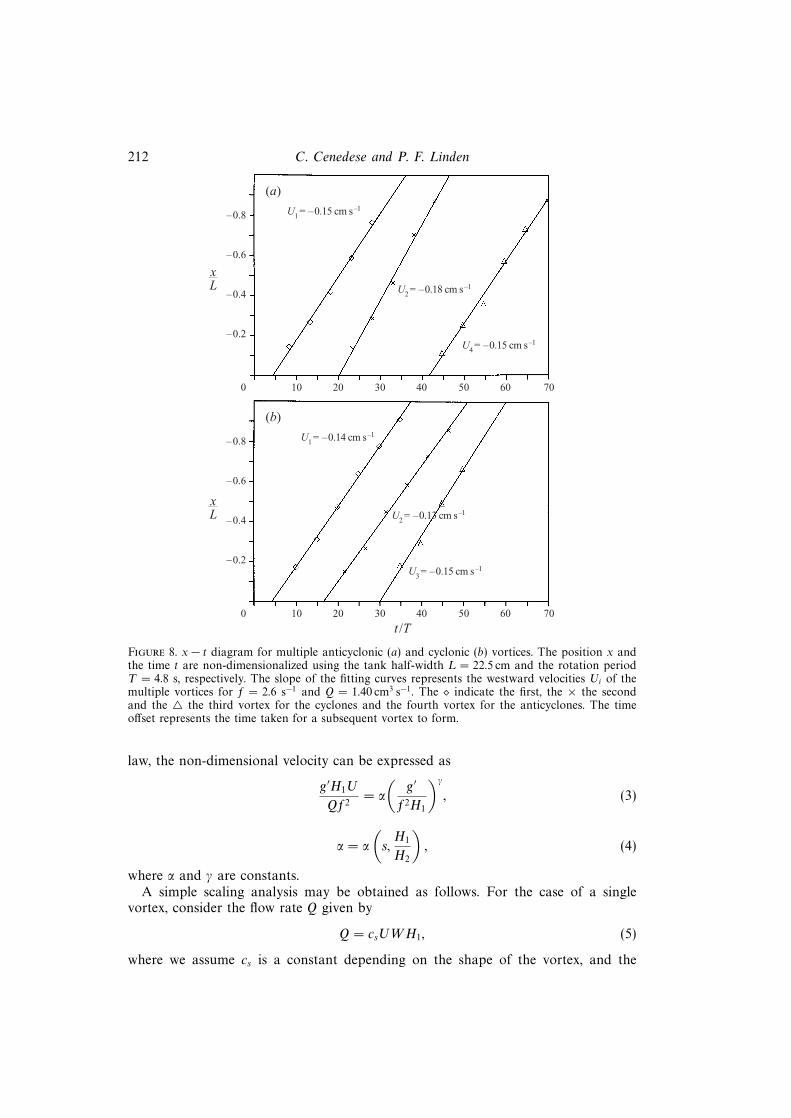
Similarly, approximately constant velocities were observed for multiple vortices asshown in figures 8 (a) and 8 (b). Although there is some variation between the speedof the individual vortices, the differences are small and not systematic. There is nosignificant difference between the anticyclones and cyclones in this case. Figure 8shows also the time scale for the vortex production (indicated by the offsets on thetime axis), which was observed to vary between 10.8 and 15.7 rotation periods forcyclonic vortices and between 7.6 and 16.4 for the anticyclonic vortices. The vorticeswere shed at quite regular intervals and the time between successive vortices decreasedas Q increased. The shedding frequency was practically independent of f over therange covered in these experiments.
The westward velocities increased linearly with either the flow rate or the Coriolisparameter when the other variable was fixed. The velocity U can be expressed as afunction of the variables introduced in § 2:
U = F̂(Q, f, s, g′, H1, H2), (1)
and by dimensional analysis the velocity is given by
U =Qf2
g′H1
F
(s,H1
H2
,g′
f2H1
). (2)
For fixed slope and ratio of layer depths and assuming F takes the form of a power
212 C. Cenedese and P. F. Linden
–0.8
0 10 20 30 40 50
U1 = –0.15 cm s–1
–0.6
–0.4
–0.2
60 70
U2 = –0.18 cm s–1
U4 = –0.15 cm s–1
(a)
–0.8
0 10 20 30 40 50
xL
U1 = –0.14 cm s–1
–0.6
–0.4
–0.2
60 70
U2 = –0.13 cm s–1
U3 = –0.15 cm s–1
(b)
xL
t /T
Figure 8. x− t diagram for multiple anticyclonic (a) and cyclonic (b) vortices. The position x andthe time t are non-dimensionalized using the tank half-width L = 22.5 cm and the rotation periodT = 4.8 s, respectively. The slope of the fitting curves represents the westward velocities Ui of themultiple vortices for f = 2.6 s−1 and Q = 1.40 cm3 s−1. The � indicate the first, the × the secondand the 4 the third vortex for the cyclones and the fourth vortex for the anticyclones. The timeoffset represents the time taken for a subsequent vortex to form.
law, the non-dimensional velocity can be expressed as
g′H1U
Qf2= α
(g′
f2H1
)γ, (3)
α = α
(s,H1
H2
), (4)
where α and γ are constants.A simple scaling analysis may be obtained as follows. For the case of a single
vortex, consider the flow rate Q given by
Q = csUWH1, (5)
where we assume cs is a constant depending on the shape of the vortex, and the
Cyclone and anticyclone formation in a stratified fluid 213
0.5
0.1
0.05
0.01
0.005
0.0010.001 0.005 0.01 0.05 0.1 0.5
Ug «H1/Q f 2 = 0.317(g«/H1 f 2)0.45
Ug «H1/Q f 2 = 0.465(g «/H1 f 2)0.53
g «/H1 f 2
Ug«H
1/Q
f2
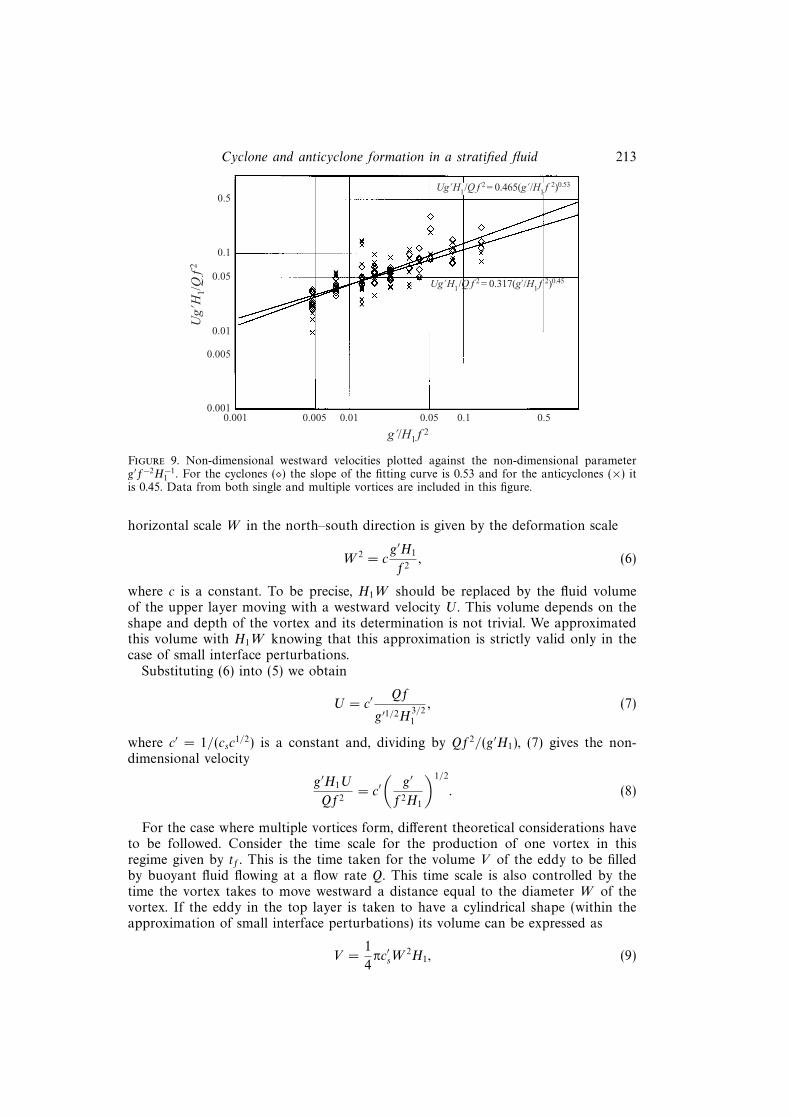
Figure 9. Non-dimensional westward velocities plotted against the non-dimensional parameterg′f−2H−1
1 . For the cyclones (�) the slope of the fitting curve is 0.53 and for the anticyclones (×) itis 0.45. Data from both single and multiple vortices are included in this figure.
horizontal scale W in the north–south direction is given by the deformation scale
W 2 = cg′H1
f2, (6)
where c is a constant. To be precise, H1W should be replaced by the fluid volumeof the upper layer moving with a westward velocity U. This volume depends on theshape and depth of the vortex and its determination is not trivial. We approximatedthis volume with H1W knowing that this approximation is strictly valid only in thecase of small interface perturbations.
Substituting (6) into (5) we obtain
U = c′Qf
g′1/2H3/21
, (7)
where c′ = 1/(csc1/2) is a constant and, dividing by Qf2/(g′H1), (7) gives the non-
dimensional velocity
g′H1U
Qf2= c′
(g′
f2H1
)1/2
. (8)
For the case where multiple vortices form, different theoretical considerations haveto be followed. Consider the time scale for the production of one vortex in thisregime given by tf . This is the time taken for the volume V of the eddy to be filledby buoyant fluid flowing at a flow rate Q. This time scale is also controlled by thetime the vortex takes to move westward a distance equal to the diameter W of thevortex. If the eddy in the top layer is taken to have a cylindrical shape (within theapproximation of small interface perturbations) its volume can be expressed as
V =1
4πc′sW
2H1, (9)
214 C. Cenedese and P. F. Linden
where c′s is a constant depending on the shape of the vortex. Hence the flow rate isgiven by
Q =1
4πc′sUWH1. (10)
Expression (10) is similar to (5) and the value of cs and 14πc′s are of the same
order of magnitude. Therefore, even if different mechanisms are considered, the sameexpression (8) for the non-dimensional westward velocity is found for both single andmultiple vortices.
The expressions found by dimensional analysis (3) and by scaling considerations(8) are equivalent providing γ = 0.5 and c′ = α. The measured value of the westwardvelocity of single vortices and of each of the multiple vortices non-dimensionalizedas in (3) are plotted in figure 9 against the value of the non-dimensional parameterg′/f2H1. The figure shows the experimental values of γ equal to 0.45 and 0.53 foranticyclones and cyclones, respectively, which agree quite well with the theoreticalvalue γ = 0.5. The value of the shape constants cs and c′s introduced in (5) and(9), respectively, are expected to be of order of unity and can be obtained from theexperimental values of α. Assuming the constant c = 4 (i.e. the vortex radius is equalto the deformation scale), the experimental results in figure 9 give values of cs = 1.6and 1.1 for anticyclones and cyclones, respectively, and c′s = 2.0 and 1.5. These resultsagree with the expected values for cs and c′s and support the theoretical scalings.
3.2.2. Vortex morphology
The study of the shape of the vortices highlighted important asymmetries betweenthe anticyclonic and cyclonic vortices. A systematic difference in depth between cy-clones and anticyclones was observed in every regime, with the cyclones being deeper.This difference was examined in detail by measuring the shape and morphology ofboth cyclones and anticyclones. The horizontal cross-sectional area and the volumeare morphological characteristics highly dependent on the forcing. High flow ratesincrease both the area and volume, while high values of the Coriolis parameter de-crease the Rossby radius of deformation and consequently the horizontal scale of theflow. In this section we will compare cyclonic and anticyclonic vortices generated bythe same forcing, i.e. with the same values of the parameters f and Q, so that anydifference observed will be associated with the different sign of vorticity or the effectsof the source/sink.
From the depth fields (figures 4) the vortex edge was located by considering it tobe represented by the depth contour ±0.5 cm. This choice of contour is determinedby the uncertainty in determining any depth contour (< ±0.5 cm), resulting mainlyfrom noise and perturbations present in the flow environment before and during theexperiments. In figure 4 the edge of the vortex is therefore represented by this outerdepth contour. Both cyclonic and anticyclonic multiple vortices edges were fitted byan ellipse and the ellipticity, defined as the ratio of the meridional and the zonal axis,was measured in order to study and classify differences between vortices.
The main differences were noticed in the multiple regime so we will describe thisregime first. The cyclones were quite elliptical in shape with the major axis orientedapproximately east–west and a clear region of separation between each vortex wasobserved when looking at the depth field (figure 4 a). The ellipticity of the vorticeswas approximately 0.6. The anticyclones presented a less regular shape with themajor axis oriented more north–south and the ellipticity varied up to approximately1.3. Furthermore the anticyclonic vortices were connected together at their outer
Cyclone and anticyclone formation in a stratified fluid 215
8
6
4
2
0–8 –4 0 4 8
(a)
y (cm)
h (c
m)
8
6
4
2
0–8 –4 0 4 8
(b)
y (cm)
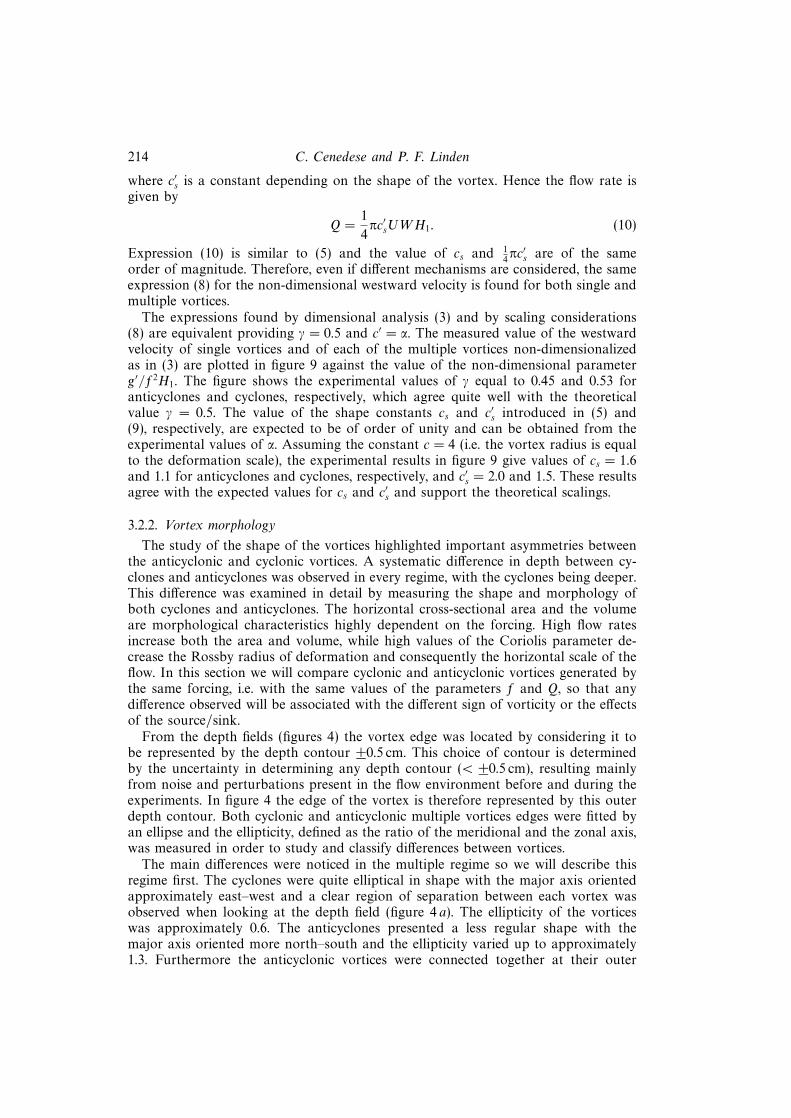
Figure 10. North–south depth sections for multiple cyclones (a) and anticyclones (inverted) (b)along the dashed lines in figures 4 (a) and 4 (b), respectively. The cyclones were observed to bedeeper and less spread out than the anticyclones.
boundary, as shown in figure 4 (b), giving a less compact and coherent structurethan the cyclones. The size of the vortices, measured in the north–south direction,decreased with increasing Coriolis parameter and, in keeping with the scaling analysis,was observed to be approximately equal to the Rossby radius of deformation. Forcyclones, the size increased from 5.3 cm to 14.4 cm from the multiple to the singleregime while the anticyclone size increased from 10.1 cm to 14.6 cm.
The other major difference between cyclones and anticyclones is their vertical profile.Figure 10 shows an example of this difference; the cyclone is deeper and narrowerthan the anticyclone. This is a general result. The volumes of the vortices producedat the same Q and f, on the other hand, are very similar. Those shown in figures 4 (a)and 4 (b), respectively, were calculated by integrating the depth fields and gave valuesof 98 cm3 for the cyclone and 103 cm3 for the anticyclone. It is interesting to note thatfor these vortices the volume obtained by multiplying the source/sink flow rate andtime between successive vortices gave values of 144 cm3 and 130 cm3 for the cycloneand anticyclone, respectively. These values are comparable with, but larger than, thevolume of the vortices and are consistent with the scaling arguments given in § 3.2.
Similar qualitative differences in the orientation and the shape of the vortex wereobserved in the single-vortex regime. Again the cyclonic vortex was deeper andnarrower than the anticyclone for the same external parameters. In both regimesthe major difference in the shape is associated with the interface profile rather thanhorizontal area at the level of the interface. While cyclones present a somewhat smallersurface area (sometimes as small as one-half the size of the equivalent anticyclone) atthe level of the interface, the major difference is in the depth. In fact, cyclones are wellrepresented by cones while anticyclones are better represented by paraboloids. Forthe vortices shown in figure 10, a conical fit for the cyclone gives a maximum depth of6.9 cm compared with the observed maximum of 7.2 cm, and a paraboloidal fit to theanticyclone gives a maximum depth of 3.6 cm compared to the observed value 3.4 cm.
The importance of this difference in interface profile results from the fact that atlow Rossby number, the thermal wind balance holds and so the azimuthal velocityshear across the interface is different in the two cases, and in general larger for thecyclones. The reasons for the difference are not entirely clear but we suspect they aredue to nonlinear behaviour associated with flow close to the source/sink. This pointis discussed further in § 5.
216 C. Cenedese and P. F. Linden
(e)30
20
10
0 10 20 30 40
(a)
x (cm)
y (c
m)
(b)30
20
10
0 10 20 30 40
(c)30
20
10
0 10 20 30 40
y (c
m)
y (c
m)
20
10
10 20 30
–0.3
–0.2
–0.1
0
0.1
0.2
20
10
10 20 30
–0.3
–0.2
–0.1
0
0.1
0.2
20
10
10 20 30
–0.1
0
0.2
0.3
0.1
( f )
(d )
x (cm)
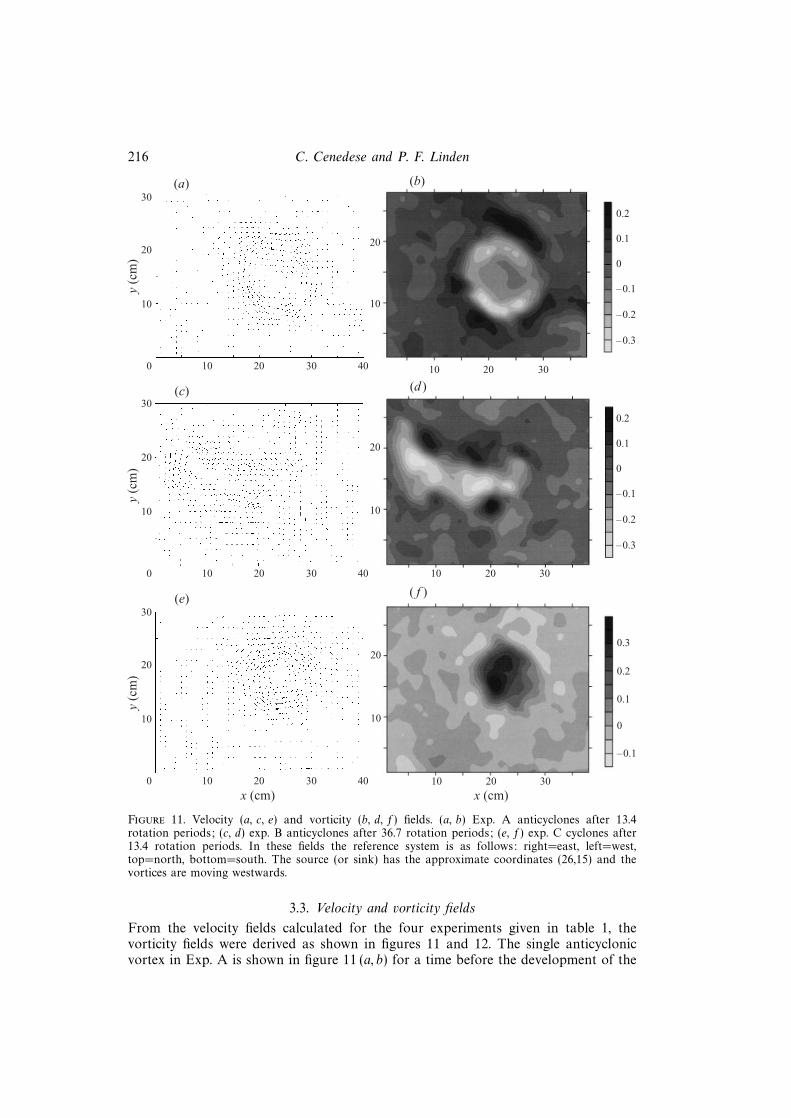
Figure 11. Velocity (a, c, e) and vorticity (b, d, f) fields. (a, b) Exp. A anticyclones after 13.4rotation periods; (c, d) exp. B anticyclones after 36.7 rotation periods; (e, f) exp. C cyclones after13.4 rotation periods. In these fields the reference system is as follows: right=east, left=west,top=north, bottom=south. The source (or sink) has the approximate coordinates (26,15) and thevortices are moving westwards.
3.3. Velocity and vorticity fields
From the velocity fields calculated for the four experiments given in table 1, thevorticity fields were derived as shown in figures 11 and 12. The single anticyclonicvortex in Exp. A is shown in figure 11 (a, b) for a time before the development of the
Cyclone and anticyclone formation in a stratified fluid 217
wave-like structure. The vorticity field shows a non-uniform anticyclonic vorticity inthe interior, with the strongest vorticity associated with streaming motion near theedge (associated with the interface slope – see figure 10), and at the edge of the vortexthere are smaller patches of cyclonic vorticity. The maximum relative vorticity ζ was0.30 s−1 and the Rossby number Ro of the vortex, defined as the absolute value of theratio of the relative vorticity and the Coriolis parameter, was 0.25. The anticyclonicmultiple state was observed during Exp. B (figure 11 c, d) and the two light greyregions in the vorticity field represent the two vortices moving westward. In thiscase the maximum anticyclonic vorticity occurred at the centre of each vortex. Weakcyclonic vorticity is also present along the boundary of the vortices. In this regime themaximum value of the vorticity was ζ = 0.30 s−1 and Ro = 0.09. Figure 11(e,f ) showsthe characteristic cyclonic motion that develops in the transition regime (i) (describedin § 3.1.2). Here the vorticity is maximum at the centre and decreases outwards. Themaximum vorticity ζ = 0.35 s−1 gives a Rossby number 0.30.
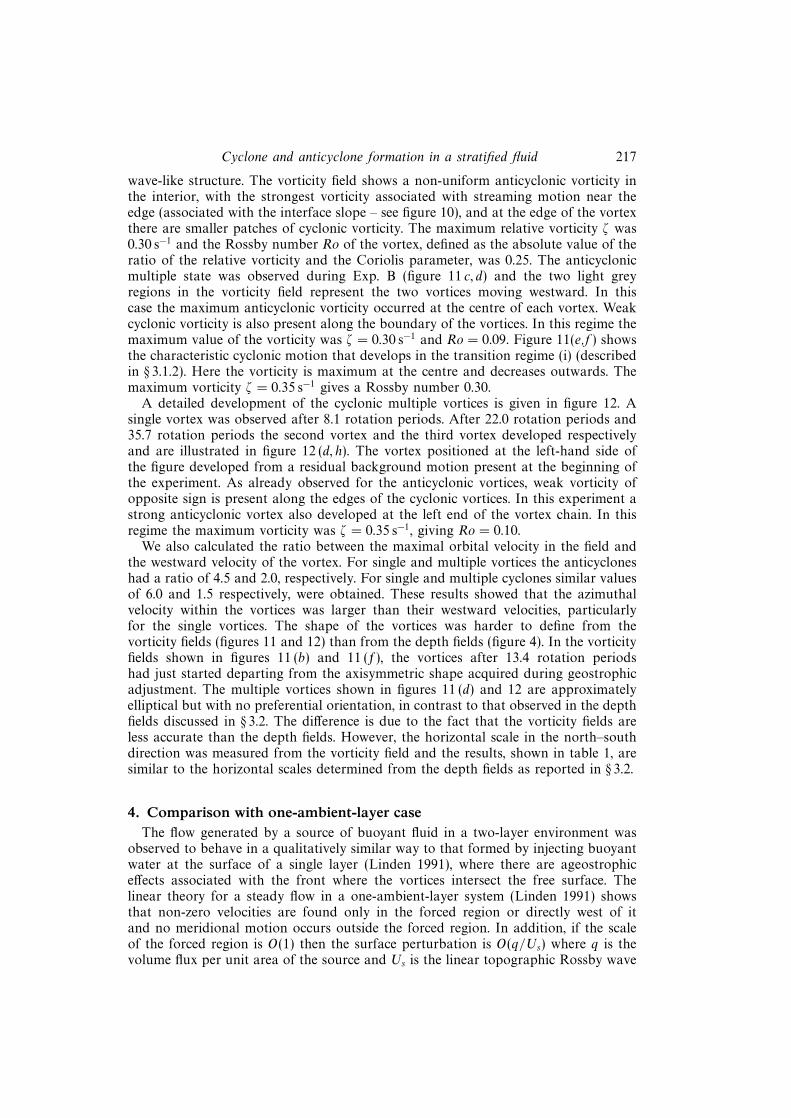
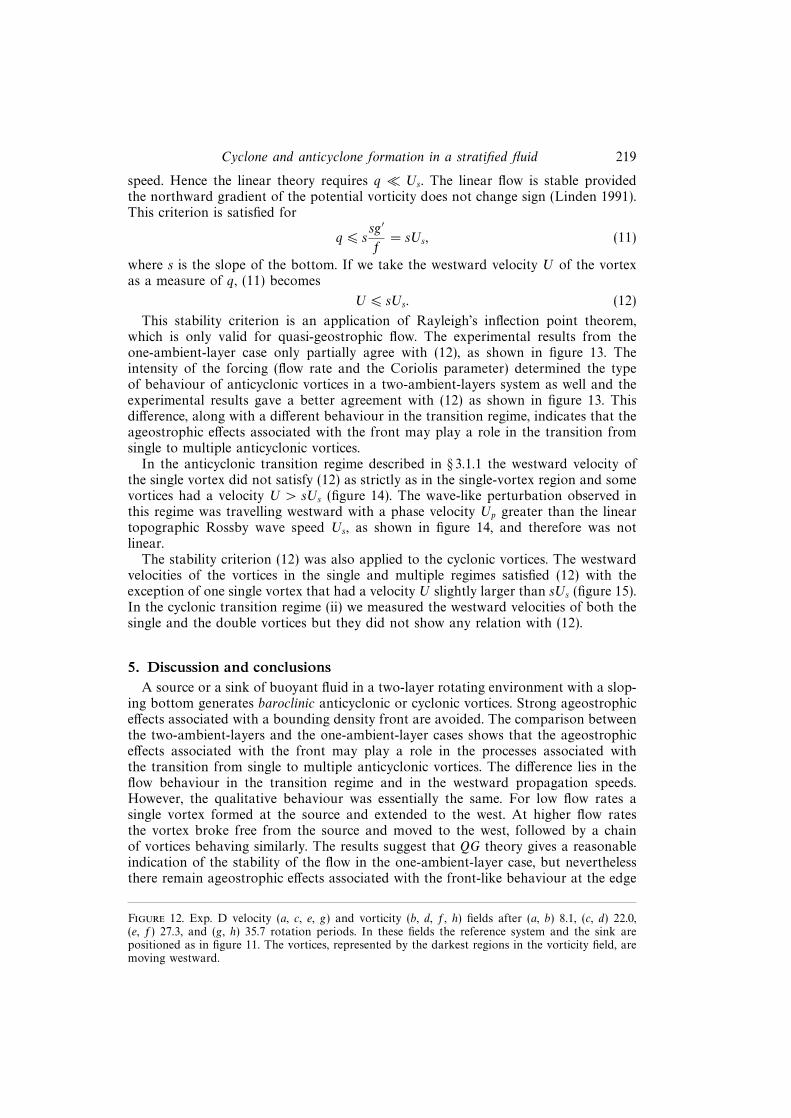
A detailed development of the cyclonic multiple vortices is given in figure 12. Asingle vortex was observed after 8.1 rotation periods. After 22.0 rotation periods and35.7 rotation periods the second vortex and the third vortex developed respectivelyand are illustrated in figure 12 (d, h). The vortex positioned at the left-hand side ofthe figure developed from a residual background motion present at the beginning ofthe experiment. As already observed for the anticyclonic vortices, weak vorticity ofopposite sign is present along the edges of the cyclonic vortices. In this experiment astrong anticyclonic vortex also developed at the left end of the vortex chain. In thisregime the maximum vorticity was ζ = 0.35 s−1, giving Ro = 0.10.
We also calculated the ratio between the maximal orbital velocity in the field andthe westward velocity of the vortex. For single and multiple vortices the anticycloneshad a ratio of 4.5 and 2.0, respectively. For single and multiple cyclones similar valuesof 6.0 and 1.5 respectively, were obtained. These results showed that the azimuthalvelocity within the vortices was larger than their westward velocities, particularlyfor the single vortices. The shape of the vortices was harder to define from thevorticity fields (figures 11 and 12) than from the depth fields (figure 4). In the vorticityfields shown in figures 11 (b) and 11 (f), the vortices after 13.4 rotation periodshad just started departing from the axisymmetric shape acquired during geostrophicadjustment. The multiple vortices shown in figures 11 (d) and 12 are approximatelyelliptical but with no preferential orientation, in contrast to that observed in the depthfields discussed in § 3.2. The difference is due to the fact that the vorticity fields areless accurate than the depth fields. However, the horizontal scale in the north–southdirection was measured from the vorticity field and the results, shown in table 1, aresimilar to the horizontal scales determined from the depth fields as reported in § 3.2.
4. Comparison with one-ambient-layer caseThe flow generated by a source of buoyant fluid in a two-layer environment was
observed to behave in a qualitatively similar way to that formed by injecting buoyantwater at the surface of a single layer (Linden 1991), where there are ageostrophiceffects associated with the front where the vortices intersect the free surface. Thelinear theory for a steady flow in a one-ambient-layer system (Linden 1991) showsthat non-zero velocities are found only in the forced region or directly west of itand no meridional motion occurs outside the forced region. In addition, if the scaleof the forced region is O(1) then the surface perturbation is O(q/Us) where q is thevolume flux per unit area of the source and Us is the linear topographic Rossby wave
218 C. Cenedese and P. F. Linden
(a)
y (c
m)
(b)
30
20
10
0 10 20 30
–0.1
0.3
0
0.1
0.2
40
20
10
10 20 30
(c)
y (c
m)
30
20
10
0 10 20 30–0.2
0
0.1
0.2
40
20
10
10 20 30
(e)
y (c
m)
( f )
30
20
10
0 10 20 30
–0.3
0.3
0
0.1
0.2
40
20
10
10 20 30
(g)
y (c
m)
(h)
30
20
10
0 10 20 30
–0.3
0.3
0
0.1
0.2
40
20
10
10 20 30
(d )
–0.2
–0.1
–0.1
–0.2
–0.1
x (cm) x (cm)
Figure 12. For caption see facing page.
Cyclone and anticyclone formation in a stratified fluid 219
speed. Hence the linear theory requires q � Us. The linear flow is stable providedthe northward gradient of the potential vorticity does not change sign (Linden 1991).This criterion is satisfied for
q 6 ssg′
f= sUs, (11)
where s is the slope of the bottom. If we take the westward velocity U of the vortexas a measure of q, (11) becomes
U 6 sUs. (12)
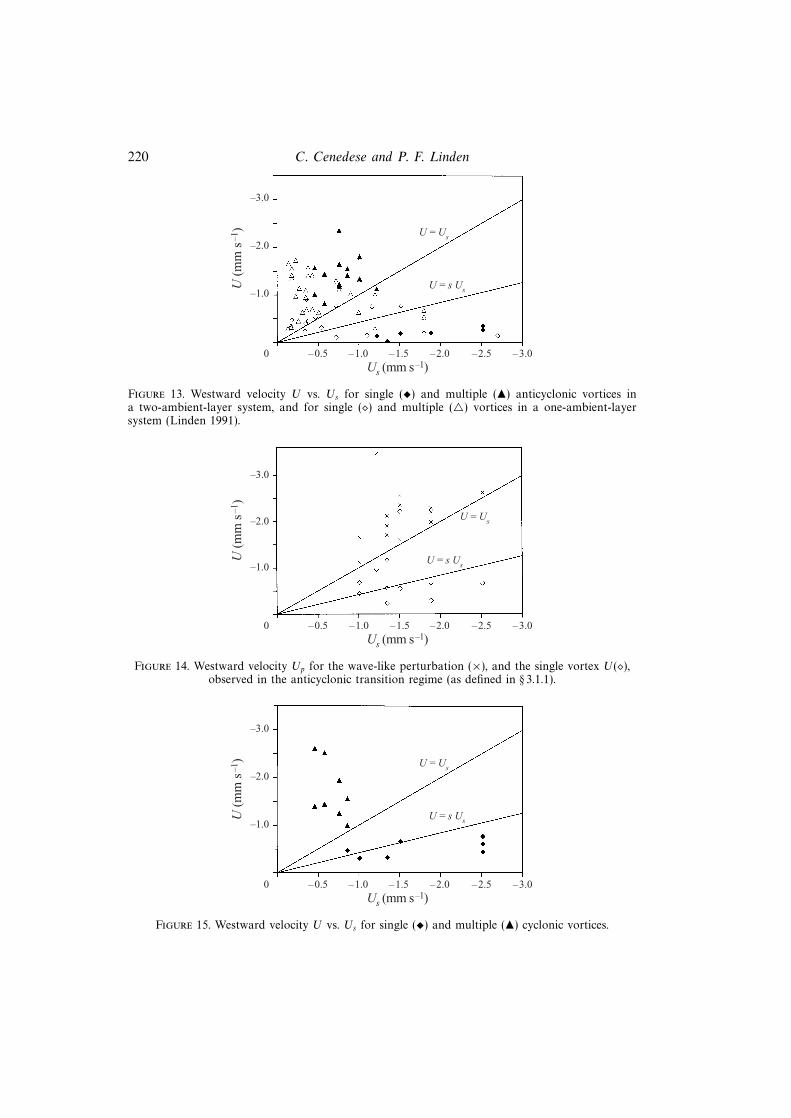
This stability criterion is an application of Rayleigh’s inflection point theorem,which is only valid for quasi-geostrophic flow. The experimental results from theone-ambient-layer case only partially agree with (12), as shown in figure 13. Theintensity of the forcing (flow rate and the Coriolis parameter) determined the typeof behaviour of anticyclonic vortices in a two-ambient-layers system as well and theexperimental results gave a better agreement with (12) as shown in figure 13. Thisdifference, along with a different behaviour in the transition regime, indicates that theageostrophic effects associated with the front may play a role in the transition fromsingle to multiple anticyclonic vortices.
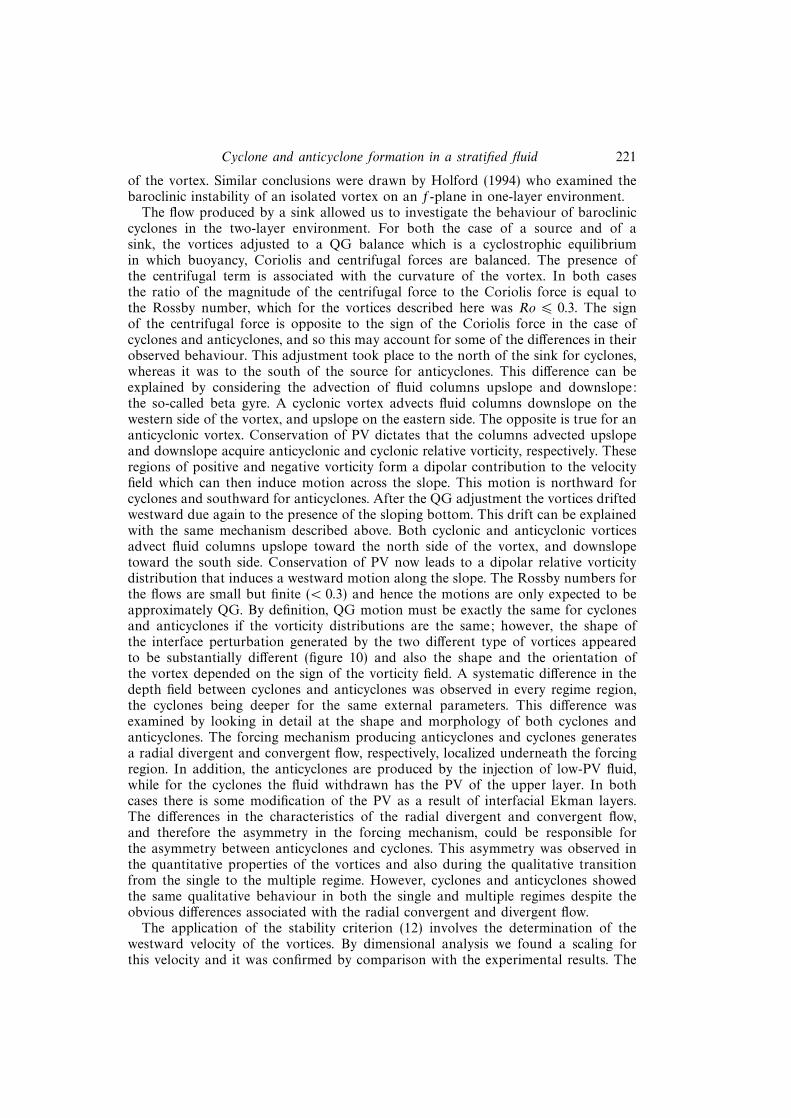
In the anticyclonic transition regime described in § 3.1.1 the westward velocity ofthe single vortex did not satisfy (12) as strictly as in the single-vortex region and somevortices had a velocity U > sUs (figure 14). The wave-like perturbation observed inthis regime was travelling westward with a phase velocity Up greater than the lineartopographic Rossby wave speed Us, as shown in figure 14, and therefore was notlinear.
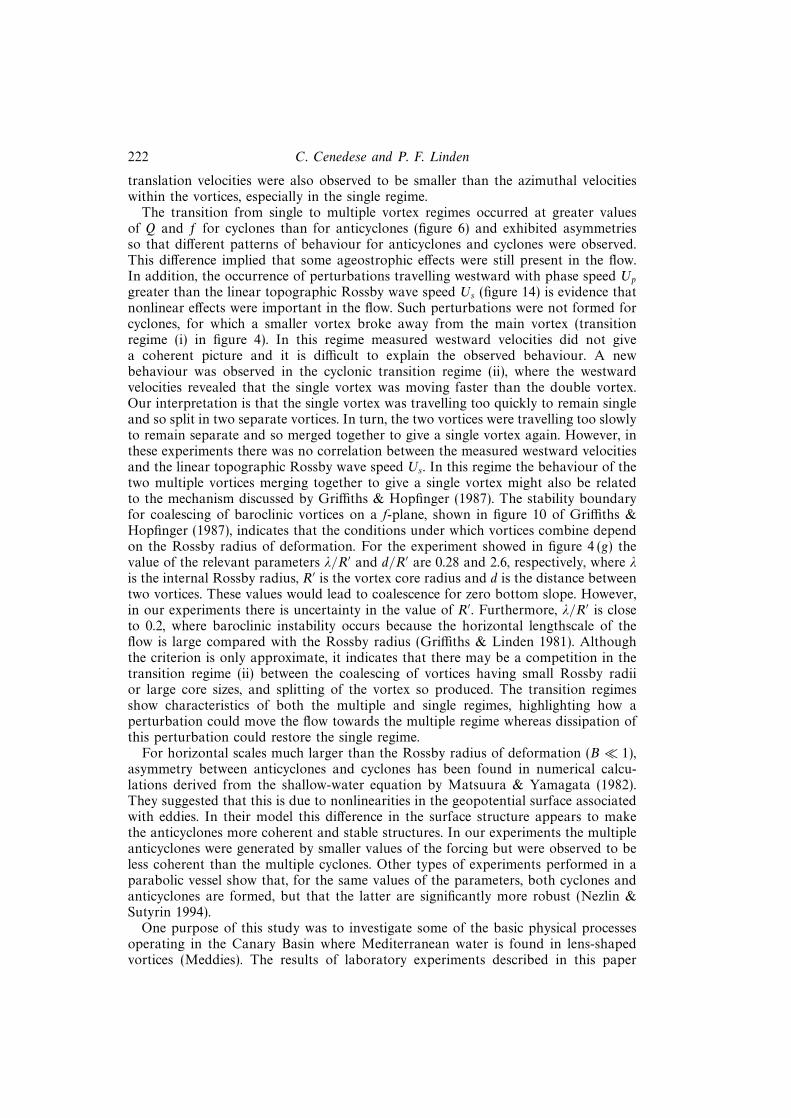
The stability criterion (12) was also applied to the cyclonic vortices. The westwardvelocities of the vortices in the single and multiple regimes satisfied (12) with theexception of one single vortex that had a velocity U slightly larger than sUs (figure 15).In the cyclonic transition regime (ii) we measured the westward velocities of both thesingle and the double vortices but they did not show any relation with (12).
5. Discussion and conclusionsA source or a sink of buoyant fluid in a two-layer rotating environment with a slop-
ing bottom generates baroclinic anticyclonic or cyclonic vortices. Strong ageostrophiceffects associated with a bounding density front are avoided. The comparison betweenthe two-ambient-layers and the one-ambient-layer cases shows that the ageostrophiceffects associated with the front may play a role in the processes associated withthe transition from single to multiple anticyclonic vortices. The difference lies in theflow behaviour in the transition regime and in the westward propagation speeds.However, the qualitative behaviour was essentially the same. For low flow rates asingle vortex formed at the source and extended to the west. At higher flow ratesthe vortex broke free from the source and moved to the west, followed by a chainof vortices behaving similarly. The results suggest that QG theory gives a reasonableindication of the stability of the flow in the one-ambient-layer case, but neverthelessthere remain ageostrophic effects associated with the front-like behaviour at the edge
Figure 12. Exp. D velocity (a, c, e, g) and vorticity (b, d, f, h) fields after (a, b) 8.1, (c, d) 22.0,(e, f) 27.3, and (g, h) 35.7 rotation periods. In these fields the reference system and the sink arepositioned as in figure 11. The vortices, represented by the darkest regions in the vorticity field, aremoving westward.
220 C. Cenedese and P. F. Linden
–3.0
–2.0
–1.0
0 –0.5 –1.0 –1.5 –2.0 –3.0–2.5
U (
mm
s–1
)
Us (mm s–1)
U = Us
U = s Us
Figure 13. Westward velocity U vs. Us for single (�) and multiple (N) anticyclonic vortices ina two-ambient-layer system, and for single (�) and multiple (4) vortices in a one-ambient-layersystem (Linden 1991).
–3.0
–2.0
–1.0
0 –0.5 –1.0 –1.5 –2.0 –3.0–2.5
U (
mm
s–1
)
Us (mm s–1)
U = Us
U = s Us
Figure 14. Westward velocity Up for the wave-like perturbation (×), and the single vortex U(�),observed in the anticyclonic transition regime (as defined in § 3.1.1).
–3.0
–2.0
–1.0
0 –0.5 –1.0 –1.5 –2.0 –3.0–2.5
U (
mm
s–1
)
Us (mm s–1)
U = Us
U = s Us
Figure 15. Westward velocity U vs. Us for single (�) and multiple (N) cyclonic vortices.
Cyclone and anticyclone formation in a stratified fluid 221
of the vortex. Similar conclusions were drawn by Holford (1994) who examined thebaroclinic instability of an isolated vortex on an f-plane in one-layer environment.
The flow produced by a sink allowed us to investigate the behaviour of barocliniccyclones in the two-layer environment. For both the case of a source and of asink, the vortices adjusted to a QG balance which is a cyclostrophic equilibriumin which buoyancy, Coriolis and centrifugal forces are balanced. The presence ofthe centrifugal term is associated with the curvature of the vortex. In both casesthe ratio of the magnitude of the centrifugal force to the Coriolis force is equal tothe Rossby number, which for the vortices described here was Ro 6 0.3. The signof the centrifugal force is opposite to the sign of the Coriolis force in the case ofcyclones and anticyclones, and so this may account for some of the differences in theirobserved behaviour. This adjustment took place to the north of the sink for cyclones,whereas it was to the south of the source for anticyclones. This difference can beexplained by considering the advection of fluid columns upslope and downslope:the so-called beta gyre. A cyclonic vortex advects fluid columns downslope on thewestern side of the vortex, and upslope on the eastern side. The opposite is true for ananticyclonic vortex. Conservation of PV dictates that the columns advected upslopeand downslope acquire anticyclonic and cyclonic relative vorticity, respectively. Theseregions of positive and negative vorticity form a dipolar contribution to the velocityfield which can then induce motion across the slope. This motion is northward forcyclones and southward for anticyclones. After the QG adjustment the vortices driftedwestward due again to the presence of the sloping bottom. This drift can be explainedwith the same mechanism described above. Both cyclonic and anticyclonic vorticesadvect fluid columns upslope toward the north side of the vortex, and downslopetoward the south side. Conservation of PV now leads to a dipolar relative vorticitydistribution that induces a westward motion along the slope. The Rossby numbers forthe flows are small but finite (< 0.3) and hence the motions are only expected to beapproximately QG. By definition, QG motion must be exactly the same for cyclonesand anticyclones if the vorticity distributions are the same; however, the shape ofthe interface perturbation generated by the two different type of vortices appearedto be substantially different (figure 10) and also the shape and the orientation ofthe vortex depended on the sign of the vorticity field. A systematic difference in thedepth field between cyclones and anticyclones was observed in every regime region,the cyclones being deeper for the same external parameters. This difference wasexamined by looking in detail at the shape and morphology of both cyclones andanticyclones. The forcing mechanism producing anticyclones and cyclones generatesa radial divergent and convergent flow, respectively, localized underneath the forcingregion. In addition, the anticyclones are produced by the injection of low-PV fluid,while for the cyclones the fluid withdrawn has the PV of the upper layer. In bothcases there is some modification of the PV as a result of interfacial Ekman layers.The differences in the characteristics of the radial divergent and convergent flow,and therefore the asymmetry in the forcing mechanism, could be responsible forthe asymmetry between anticyclones and cyclones. This asymmetry was observed inthe quantitative properties of the vortices and also during the qualitative transitionfrom the single to the multiple regime. However, cyclones and anticyclones showedthe same qualitative behaviour in both the single and multiple regimes despite theobvious differences associated with the radial convergent and divergent flow.
The application of the stability criterion (12) involves the determination of thewestward velocity of the vortices. By dimensional analysis we found a scaling forthis velocity and it was confirmed by comparison with the experimental results. The
222 C. Cenedese and P. F. Linden
translation velocities were also observed to be smaller than the azimuthal velocitieswithin the vortices, especially in the single regime.
The transition from single to multiple vortex regimes occurred at greater valuesof Q and f for cyclones than for anticyclones (figure 6) and exhibited asymmetriesso that different patterns of behaviour for anticyclones and cyclones were observed.This difference implied that some ageostrophic effects were still present in the flow.In addition, the occurrence of perturbations travelling westward with phase speed Up
greater than the linear topographic Rossby wave speed Us (figure 14) is evidence thatnonlinear effects were important in the flow. Such perturbations were not formed forcyclones, for which a smaller vortex broke away from the main vortex (transitionregime (i) in figure 4). In this regime measured westward velocities did not givea coherent picture and it is difficult to explain the observed behaviour. A newbehaviour was observed in the cyclonic transition regime (ii), where the westwardvelocities revealed that the single vortex was moving faster than the double vortex.Our interpretation is that the single vortex was travelling too quickly to remain singleand so split in two separate vortices. In turn, the two vortices were travelling too slowlyto remain separate and so merged together to give a single vortex again. However, inthese experiments there was no correlation between the measured westward velocitiesand the linear topographic Rossby wave speed Us. In this regime the behaviour of thetwo multiple vortices merging together to give a single vortex might also be relatedto the mechanism discussed by Griffiths & Hopfinger (1987). The stability boundaryfor coalescing of baroclinic vortices on a f-plane, shown in figure 10 of Griffiths &Hopfinger (1987), indicates that the conditions under which vortices combine dependon the Rossby radius of deformation. For the experiment showed in figure 4 (g) thevalue of the relevant parameters λ/R′ and d/R′ are 0.28 and 2.6, respectively, where λis the internal Rossby radius, R′ is the vortex core radius and d is the distance betweentwo vortices. These values would lead to coalescence for zero bottom slope. However,in our experiments there is uncertainty in the value of R′. Furthermore, λ/R′ is closeto 0.2, where baroclinic instability occurs because the horizontal lengthscale of theflow is large compared with the Rossby radius (Griffiths & Linden 1981). Althoughthe criterion is only approximate, it indicates that there may be a competition in thetransition regime (ii) between the coalescing of vortices having small Rossby radiior large core sizes, and splitting of the vortex so produced. The transition regimesshow characteristics of both the multiple and single regimes, highlighting how aperturbation could move the flow towards the multiple regime whereas dissipation ofthis perturbation could restore the single regime.
For horizontal scales much larger than the Rossby radius of deformation (B � 1),asymmetry between anticyclones and cyclones has been found in numerical calcu-lations derived from the shallow-water equation by Matsuura & Yamagata (1982).They suggested that this is due to nonlinearities in the geopotential surface associatedwith eddies. In their model this difference in the surface structure appears to makethe anticyclones more coherent and stable structures. In our experiments the multipleanticyclones were generated by smaller values of the forcing but were observed to beless coherent than the multiple cyclones. Other types of experiments performed in aparabolic vessel show that, for the same values of the parameters, both cyclones andanticyclones are formed, but that the latter are significantly more robust (Nezlin &Sutyrin 1994).
One purpose of this study was to investigate some of the basic physical processesoperating in the Canary Basin where Mediterranean water is found in lens-shapedvortices (Meddies). The results of laboratory experiments described in this paper
Cyclone and anticyclone formation in a stratified fluid 223
sugggest that a constant source of high flow rate of fluid can generate discretevortices. Therefore, Meddies could be generated by a similar mechanism when theMediterranean outflow through the Strait of Gibraltar has a sufficiently large flowrate. Typical values for the Mediterranean outflow upstream of Cape St. Vincentare g′ ≈ 10−3 m s−2, f ≈ 10−4 s−1 and s ≈ 0.06, where s includes both the effect ofthe β-plane and the effect of the bottom topography. These correspond to a lineartopographic Rossby wave speed Us ≈ 60 cm s−1. The observed drift speeds of Meddiesare 5 cm s−1, which are small compared with Us but are comparable with sUs. Theseexperiments suggest therefore, that it may be possible for the continuous outflowto break into isolated structures. The ocean, though, is further complicated by windstress, complex topography and tide-controlled flow rates, all of which may influencethe flow and affect the comparison with the laboratory experiments.
Partial support for C. C. was provided by a TMR fellowship, MAS3-CT96-5017.
REFERENCES
Armi, L., Hebert, D., Oakey, N., Price, J., Richardson, P. L., Rossby, T. & Ruddick, B. 1988 Thehistory and decay of a Mediterranean salt lens. Nature 333, 649–651.
Armi, L. & Zenk, W. 1984 Large lenses of highly saline Mediterranean water. J. Phys. Oceanogr.14, 1560–1576.
Bower, A. S., Armi, L. & Ambar, I. 1997 Lagrangian observation of Meddy formation during aMediterranean undercurrent seeding experiment. J. Phys. Oceanogr. 27, 2545–2575.
Cenedese, C. & Dalziel, S. B. 1998 Concentration and depth fields determined by the lighttransmitted through a dyed solution. Exp. Fluids. (Submitted).
Davey, M. K. & Killworth, P. D. 1989 Flow produced by discrete sources of buoyancy. J. Phys.Oceanogr. 19, 1279–1290.
Dalziel, S. B. 1992 DigImage: System Overview. Cambridge Environmental Research Consultants,Ltd. 43 pp.
Griffiths, R. W. & Hopfinger, E. J. 1986 Experiments with baroclinic vortex pairs in a rotatingfluid. J. Fluid Mech. 173, 501–518.
Griffiths, R. W. & Hopfinger, E. J. 1987 Coalescing of geostrophic vortices. J. Fluid Mech. 178,73–97.
Griffiths, R. W. & Linden, P. F. 1981 The stability of vortices in a rotating, stratified fluid.J. Fluid Mech. 105, 283–316.
Holford, J. M. 1994 The evolution of a front. PhD thesis, DAMTP, Cambridge University.
Linden, P. F. 1991 Dynamics of Fronts and Eddies. Proc. Enrico Fermi Summer School, pp. 313–351.
Matsuura, T. & Yamagata, T. 1982 On the evolution of nonlinear planetary eddies larger than theradius of deformation. J. Phys. Oceanogr. 12, 440–456.
Nezlin, M. V. & Sutyrin, G. C. 1994 Problems of simulation of large, long-lived vortices in theatmospheres of the giant planets (Jupiter, Saturn, Neptune). Surveys in Geophys. 15, 63–99.
Pingree, R. D. & Le Cann, B. 1993 Structure of a meddy (Bobby 92) Southeast of the Azores.Deep-Sea Res. 40, 2077–2103.