Embed Size (px)
Citation preview

1
Cyclotron Production of
68Ga using a 68Zn-based
liquid target
Hugo Manuel Ramos Moreira
Integrated Masters in Biomedical Engineering
Physics Department
Faculty of Sciences and Technology of University of Coimbra
2013


To my parents,


Cyclotron Production of
68Ga using a 68Zn-based
liquid target
Hugo Manuel Ramos Moreira
Supervisor: Francisco José Cerqueira Alves
Co-supervisor: Antero José Pena Afonso de Abrunhosa
Dissertation presented to the Faculty of Sciences
and Technology of the University of Coimbra to
obtain a Master’s degree in Biomedical Engineering
Physics Department
Faculty of Sciences and Technology of University of Coimbra
2013

This copy of the thesis has been supplied on condition that anyone who consults it is
understood to recognize that its copyright rests with its author and that no quotation from
the thesis and no information derived from it may be published without proper
acknowledgement.

i
Acknowledgments
To my supervisor Francisco Alves, for all his support, motivation, advice and
confidence in me. The most smiling science experienced person I ever met.
To professor Antero Abrunhosa, for his help and guidance through all my work. I am
grateful for the indescribable opportunity he gave me.
To professor Artur Valente, from the Chemistry Department, for all the moments of
discussion, supervision and assistance during the year. Without him I would never
accomplish this work goals.
To all the ICNAS team, especially Vítor Alves, Sérgio Carmo and Nuno Ferreira, for
all the brainstorms, suggestions and help provided during the project. Their interest and
contribution were indispensable.
To professor Miguel Morgado, coordinator of the Biomedical Engineering course, for
his work, assistance and important advices for the students.
To all my friends and colleagues in Coimbra, especially Daniel, Gonçalo, Elizabete,
Cláudia, Pedro, João, António, Laura, Diana and Samuel, for their support, smiles and
motivation during these 5 years, but mostly for their unquestionable friendship.
To my hometown friends, Miguel, Gonçalo, Leandro, Ana, Helena, Ricardo, João and
Pedro, they helped me become who I am during the many years I grew up with them. Our
friendship becomes more strengthened each year.
To Ana Luísa, for all the moments of affection, encouragement and motivation to
never give up.
To my goddaughter wedding Sofia and her husband Pedro, for their trust, laughs, and
pride in me. More than friends, they are family.
To my family, especially my grandparents Emília and Armando, my uncles Manuel and
Nadir, as well as my cousins Ana, Áurea, Nando and Zé. I owe them too much.
Finally, and more importantly, to my parents Áurea and Manuel. Without their love,
support, wisdom and trust in me, I would never reach this goal. Thank you for everything.

ii

iii
Abstract
Recent research developments have demonstrated significant advantages of Gallium-68
labeled radiopharmaceuticals in PET cancer imaging, namely on neuroendocrine tumours.
The suitable half-life (68 minutes), high positron emission yield and low radiation exposure
for the patient are some of the main advantages that increasingly awake the interest in the
use of 68Ga. The research for simpler and efficient methods of 68Ga production with high
yields is constant.
In this work, the feasibility of a new pathway for 68Ga cyclotron production, based on
a liquid target through a 68Zn(p,n)68Ga nuclear reaction, was studied.
A salt solution of natural zinc chloride is chosen as liquid target, having suitable
chemical properties for cyclotron irradiation. The 18.75 % abundance of 68Zn in natZn is
suitable for cost effective high 68Ga production yields.
Niobium, widely used in cyclotron applications, is considered as target chamber
material to hold the target solution. The physicochemical effect of zinc chloride solutions
in the metal is studied and analyzed, in order to ensure its resistance to the irradiation
conditions. This analysis is performed with scanning electron microscopy and energy
dispersive X-ray spectroscopy, after exposing niobium samples to ZnCl2 solutions. The
effect of zinc chloride is also studied in teflon, intended to be used to transport the target
solution from the cyclotron to hot-cells. For that purpose, a thermogravimetric analysis is
done.
Irradiation tests are performed, with identification of the produced gallium isotopes, as
well as their production yields. Different separation methods for gallium extraction are
studied, by using ion exchange columns. The method with the best results is applied to a
final 68Ga production, having obtained excellent gallium column absorption levels.
Keywords: PET, Gallium-68, neuroendocrine tumours, cyclotron, liquid target, ion
exchange columns.

iv
Resumo
Desenvolvimentos recentes no estudo científico têm demonstrado vantagens
significativas de radiofármacos marcados com Gálio-68 em imagem PET de cancros,
nomeadamente para tumores neuroendócrinos. O conveniente período de semi-
desintegração (68 minutos), a alta probabilidade de emissão de positrões e a baixa
exposição à radiação para o doente são algumas das principais vantagens que têm vindo a
despertar cada vez mais o interesse para o uso de 68Ga. A procura por métodos mais
simples e eficientes para a produção de 68Ga com elevados rendimentos é constante.
Neste trabalho foi estudada a viabilidade de um novo método de produção em
ciclotrão de 68Ga, baseado num alvo líquido através da reação nuclear 68Zn(p,n)68Ga.
Uma solução salina de cloreto de zinco natural é escolhida como alvo líquido, tendo
propriedades químicas adequadas para uma irradiação em ciclotrão. A presença de 18.75 %
de 68Zn em natZn é apropriada para rendimentos de produção elevados de 68Ga.
O nióbio, bastante usado em aplicações em ciclotrão, é considerado como material
para suporte do alvo, de forma a conter a solução-alvo. O efeito fisicoquímico de soluções
de cloreto de zinco no metal é estudado e analisado, de forma a assegurar a resistência às
condições de irradiação. A análise é feita através de microscopia eletrónica de varrimento e
espetroscopia de raios-X por energia dispersiva, após exposição de amostras de nióbio a
soluções de ZnCl2. O efeito de cloreto de zinco é também estudado em teflon, pretendido
para ser usado no transporte da solução-alvo do ciclotrão para células quentes. Com esse
intuito, é feita uma análise termogravimétrica.
Testes de irradiação são realizados, com a identificação dos isótopos de gálio
produzidos, assim como os seus rendimentos de produção. Diferentes métodos de
separação para extração de gálio são estudados, através do uso de colunas de troca iónica.
O método com os melhores resultados é aplicado a uma produção final de 68Ga, tendo-se
obtido excelentes níveis de absorção de gálio na coluna.
Palavras chave: PET, Gálio-68, tumores neuroendócrinos, ciclotrão, alvo líquido,
colunas de troca iónica.

v
Index
Acknowledgments .............................................................................................................................................. i
Abstract .............................................................................................................................................................. iii
Resumo............................................................................................................................................................... iv
Index .................................................................................................................................................................... v
List of Figures .................................................................................................................................................. vii
List of Tables ..................................................................................................................................................... ix
Acronyms ........................................................................................................................................................... xi
Isotopes and Chemical Elements .................................................................................................................. xv
1. Introduction ................................................................................................. 1
Part I: Final Project ..................................................................................................... 1
1.1. Objectives .................................................................................................................................. 1
Part II: Theoretical Introduction ................................................................................ 3
1.2. Neuroendocrine Tumours ...................................................................................................... 3
1.2.1. Epidemology ................................................................................................................... 3
1.3. In vivo Imaging ......................................................................................................................... 4
1.3.1. CT and MRI in NETs Imaging .................................................................................... 4
1.3.1.1. Computed Tomography (CT) ................................................................................. 5
1.3.1.2. Magnetic Resonance Imaging (MRI) ..................................................................... 5
1.3.2. Positron Emission Tomography .................................................................................. 6
1.3.2.1. Positron Emission Tomography Principles .......................................................... 6
1.3.2.2. Crystal Detectors Types ........................................................................................... 8
1.3.3. Radiopharmaceuticals .................................................................................................. 10
1.3.3.1. Radiopharmaceuticals in PET ............................................................................... 10
1.3.3.2. The Gallium-68 isotope ......................................................................................... 11
1.3.4. Nuclear Imaging in NETs ........................................................................................... 13
1.3.4.1. The importance of Somatostatin Analogues ...................................................... 13
1.3.4.2. Indium-111 labeled peptides in NETs ................................................................ 14
1.3.4.3. Gallium-68 labeled peptides in NETs ................................................................. 14
1.4. The Cyclotron ......................................................................................................................... 16
1.4.1. Principles ........................................................................................................................ 16
1.4.2. Targets ............................................................................................................................ 20

vi
1.4.3. The Traditional 68Ga Production ............................................................................... 21
1.4.4. A different Cyclotron 68Ga production approach ................................................... 22
2. Materials and Methods .............................................................................. 23
2.1. Target ........................................................................................................................................ 23
2.2. Target Chamber and Foil Window evaluation ................................................................... 24
2.2.1. Physical study: Effect of Zinc Chloride solution to Niobium .............................. 26
2.2.2. Scanning Electron Microscopy (SEM) ...................................................................... 27
2.2.3. Energy dispersive X-ray Spectroscopy (EDS) ......................................................... 28
2.3. Target Solution Transfer ....................................................................................................... 29
2.3.1. Thermogravimetric Analysis (TGA) .......................................................................... 30
2.4. Gallium extraction from the target solution ...................................................................... 30
2.4.1. Gallium extraction ........................................................................................................ 31
2.4.2. Retention and Elution Activity tests ......................................................................... 31
2.5. Cyclotron Irradiation of ZnCl2 solutions............................................................................ 32
2.5.1. Target Chamber and Foil Window ............................................................................ 32
2.5.2. Irradiation Conditions ................................................................................................. 33
2.5.3. 68Ga production evaluation ......................................................................................... 33
2.5.4. Spectroscopy ................................................................................................................. 34
3. Results and Discussion .............................................................................. 37
3.1. Zinc Chloride as target solution ........................................................................................... 37
3.2. Corrosion Analysis on Niobium surfaces ........................................................................... 37
3.2.1. SEM on Niobium samples .......................................................................................... 38
3.2.2. EDS on Niobium samples .......................................................................................... 42
3.3. Degradation analysis on teflon - TGA ................................................................................ 49
3.4. 68Ga preliminary column tests .............................................................................................. 51
3.5. Cyclotron irradiation of a ZnCl2 solution ........................................................................... 52
3.5.1. Radionuclide identification and quantification ........................................................ 53
3.5.2. Gallium retention evaluation ...................................................................................... 56
4. Conclusion ................................................................................................. 59
5. Future Perspectives ..................................................................................... 61
References ................................................................................................................. 63
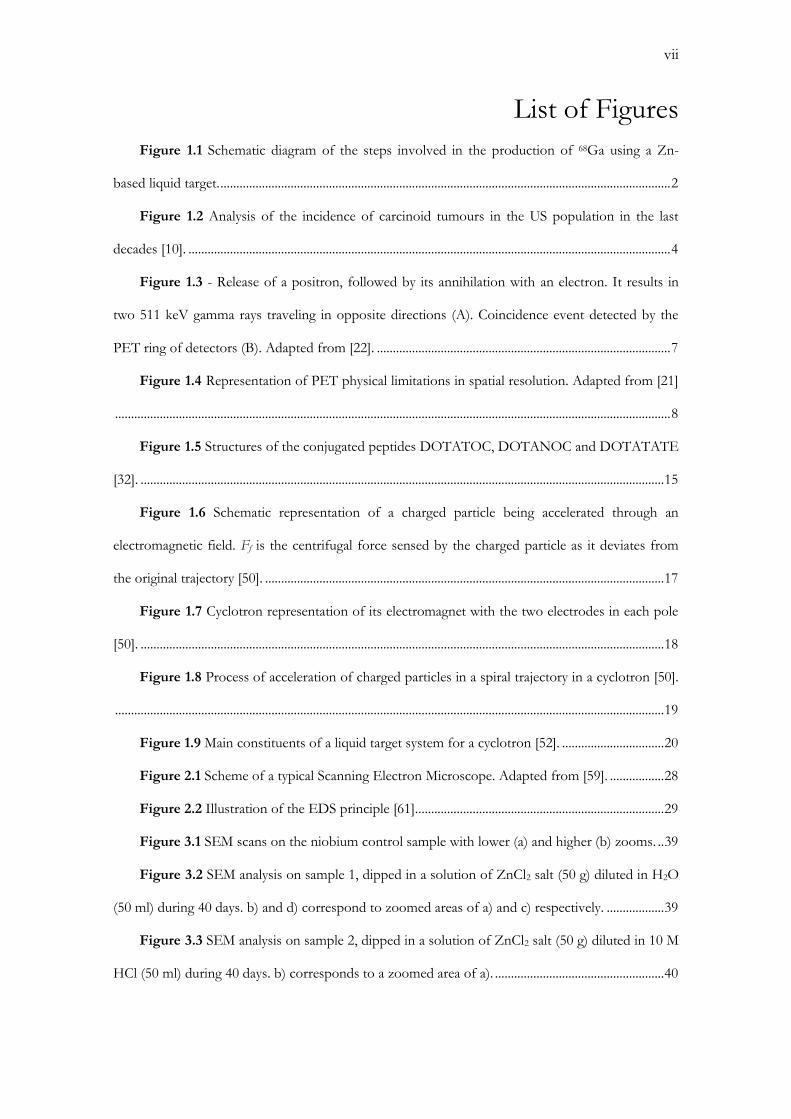
vii
List of Figures
Figure 1.1 Schematic diagram of the steps involved in the production of 68Ga using a Zn-
based liquid target. ............................................................................................................................................. 2
Figure 1.2 Analysis of the incidence of carcinoid tumours in the US population in the last
decades [10]. ....................................................................................................................................................... 4
Figure 1.3 - Release of a positron, followed by its annihilation with an electron. It results in
two 511 keV gamma rays traveling in opposite directions (A). Coincidence event detected by the
PET ring of detectors (B). Adapted from [22]. ............................................................................................ 7
Figure 1.4 Representation of PET physical limitations in spatial resolution. Adapted from [21]
.............................................................................................................................................................................. 8
Figure 1.5 Structures of the conjugated peptides DOTATOC, DOTANOC and DOTATATE
[32]. .................................................................................................................................................................... 15
Figure 1.6 Schematic representation of a charged particle being accelerated through an
electromagnetic field. Ff is the centrifugal force sensed by the charged particle as it deviates from
the original trajectory [50]. ............................................................................................................................. 17
Figure 1.7 Cyclotron representation of its electromagnet with the two electrodes in each pole
[50]. .................................................................................................................................................................... 18
Figure 1.8 Process of acceleration of charged particles in a spiral trajectory in a cyclotron [50].
............................................................................................................................................................................ 19
Figure 1.9 Main constituents of a liquid target system for a cyclotron [52]. ................................ 20
Figure 2.1 Scheme of a typical Scanning Electron Microscope. Adapted from [59]. ................. 28
Figure 2.2 Illustration of the EDS principle [61]. ............................................................................. 29
Figure 3.1 SEM scans on the niobium control sample with lower (a) and higher (b) zooms. .. 39
Figure 3.2 SEM analysis on sample 1, dipped in a solution of ZnCl2 salt (50 g) diluted in H2O
(50 ml) during 40 days. b) and d) correspond to zoomed areas of a) and c) respectively. .................. 39
Figure 3.3 SEM analysis on sample 2, dipped in a solution of ZnCl2 salt (50 g) diluted in 10 M
HCl (50 ml) during 40 days. b) corresponds to a zoomed area of a). ..................................................... 40

viii
Figure 3.4 Potential-pH equilibrium diagram for the niobium-water system at 25 0C. Adapted
from [77]. .......................................................................................................................................................... 41
Figure 3.5 SEM scan to the niobium foil sample 1 (a) and EDS element spectrum of aggregate
(b) and a clean (c) spots. ................................................................................................................................. 43
Figure 3.6 SEM scan to the niobium foil sample 2 (a) and EDS element spectrum of clean (b)
and an aggregate (c) spots. ............................................................................................................................. 44
Figure 3.7 Element map of an EDS scanned area of niobium sample 1. Niobium (a), chloride
(b), oxygen (c), calcium (d) and zinc (e) maps are shown. The sum of the 5 element maps forms the
reconstructed map (f). ..................................................................................................................................... 45
Figure 3.8 SEM scan on a surface area of the niobium sample 1 (a) compared to the
correspondent EDS reconstructed element map (b). ................................................................................ 46
Figure 3.9 SEM scan on a surface area of the niobium sample 1 (a) compared to the
correspondent EDS reconstructed element map (b). ................................................................................ 47
Figure 3.10 Thermogravimetric graphic of the three teflon samples, one used as control. ...... 49
Figure 3.11 First derivative of the TGA sample curves. .................................................................. 50
Figure 3.12 68Ga adsorption in the ion exchange resin types Strata-XC and Dowex 50W-X8. 51
Figure 3.13 Dowex 50W-X8 68Ga absorption depending on the resin mass used. ..................... 52
Figure 3.14 Recorded count rates (logarithmic scale) of the third cyclotron production using a
ZnCl2 solution. ................................................................................................................................................. 53
Figure 3.15 Non-linear regression curves, with the considered data of the produced isotopes
66Ga (a), 68Ga (b) and 13N (c). Representation of the three time-activity curves of the identified
isotopes (d). ...................................................................................................................................................... 54
Figure 3.16 Non-linear regression curves, with the considered data of the produced isotopes
66Ga (a), 68Ga (b) and 13N (c). ........................................................................................................................ 56
Figure 3.17 Well counter spectra of the Dowex resin used to retain gallium (a) and its waste
solution, 1 ml sample (b). ............................................................................................................................... 58

ix
List of Tables
Table 1.1 Physical properties of the most common PET Scintillator materials. Adapted from
[21] ....................................................................................................................................................................... 9
Table 1.2 Physical properties of some radionuclides used in PET. Adapted from [21, 24] ...... 11
Table 1.3 Energies and probabilities of the main 68Ga γ-ray emissions. Adapted from [28]. ... 11
Table 2.1 Isotopic composition of natZn. Adapted from [53]. ........................................................ 23
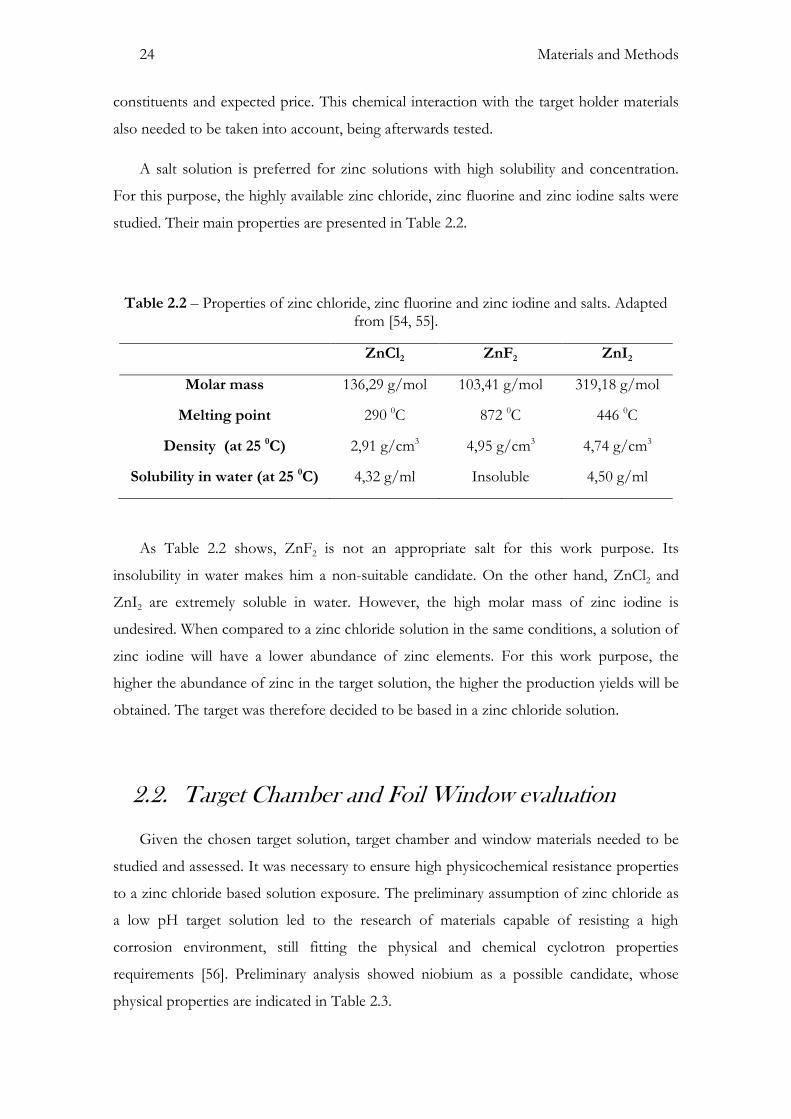
Table 2.2 – Properties of zinc chloride, zinc fluorine and zinc iodine and salts. Adapted from
[54, 55]. .............................................................................................................................................................. 24
Table 2.3 Niobium physical properties. Adapted from [57] ........................................................... 25
Table 2.4 Niobium foils properties from Goodfellow Cambridge. ............................................... 26
Table 2.5 Niobium window foil properties from Goodfellow Cambridge. ................................. 32
Table 2.6 Emission energies and probabilities of the 67Ga γ-ray decay. Adapted from [75] ..... 34
Table 3.1 Niobium foil samples mass analysis after exposure to zinc chloride solutions. ......... 38
Table 3.2 Total mass lost and maximum mass lost rate correspondent temperature of the
TGA samples. .................................................................................................................................................. 50
Table 3.3 Experimental and theoretical half-life values of the produced isotopes 66Ga, 68Ga
and 13N. ............................................................................................................................................................. 55

x

xi
Acronyms
B Magnetic Field induction
BGO Bismuth Germanate
cpm counts per minute
CT Computed Tomography
d deuterium
DOTA 1,4,7,10-tetraazacyclododecane-1,4,7,10-tetraacetic acid
DTG First derivative curve of the TGA
DTPA Diethylenetriaminepentaaceticacid
e.g exempli gratia ("for example")
EC Electron Capture
EDS Energy Dispersive X-ray Spectroscopy
EOB End of Bombardment
Frequency
FDG 2-[18F]-fluoro-2-deoxy-D-glucose
Ff Centrifugal Force
FL Lorentz Force
Fp Centripetal Force
FWHM Full width at half maximum
GEP-NETs Gastroenteropancreatic neuroendocrine tumours
GSO Cerium-doped Gadolinium Oxyorthosilicate
HRCT High Resolution Computed Tomography
ICNAS Instituto de Ciências Nucleares Aplicadas à Saúde
ICR Ion Cylotron Resonance
IPN Instituto Pedro Nunes
LSO Cerium-doped Lutetium Oxyorthosilicate
M Molar
m Mass
MRI Magnetic Resonance Imaging

xii
n Neutron
NET Neuroendocrine Tumour
NaI(Tl) Thallium-doped Sodium Iodide
p Proton
PET Positron Emission Tomography
Q Charge of the particle
r Radius of Orbit
SEER Surveillance Epidemiology and End Results database
SEM Scanning Electron Microscopy
SPECT Single Photon Emission Computed Tomography
SST Somatostatin
SSTR Somatostatin Receptor
T Kinetic Energy
t1/2 Half-life
TGA Thermogravimetric Analysis
U Potential difference
US United States of America
v Velocity
WHO World Health Organization
wt weight percent
Zeff Effective atomic number
β+ Positron
β- Electron
γ Gamma photon
ω Angular velocity of the accelerated particle
ωE Angular velocity of the alternating current source
µ Linear attenuation coefficient
τ PET coincidence timing window

xiii
Isotopes and Chemical Elements 37Ar Argon-37
11C Carbon-11
37Cl Chloride-37
18F Fluorine-18
66Ga Gallium-66
67Ga Gallium-67
68Ga Gallium-68
68Ge Germanium-68
111In Indium-111
13N Nitrogen-13
14N Nitrogen-14
15O Oxygen-15
16O Oxygen-16
18O Oxygen-18
82Rb Rubidium-82
82Sr Strontium-82
99mTc Metastable form of Technetium-99
64Zn Zinc-64
66Zn Zinc-66
67Zn Zinc-67
68Zn Zinc-68
70Zn Zinc-70
natZn Natural form of Zinc
Nb Niobium


Chapter 1 1
1. Introduction
Part I: Final Project
The final year project in M.Sc. Biomedical Engineering is done during one year, having
started on September 2012.
During the first academic semester, a familiarization with the theoretical background
on the significant topics related to the proposed project was conducted. It was additionally
made a literature research for the possible methods, techniques and suitable materials to be
used in the fulfillment of the intended objectives.
In the second semester, the implementation of the necessary and studied analysis
techniques was performed. The M.Sc. thesis was also written during that time, as the results
were obtained.
1.1. Objectives
The aim of this work is to evaluate and test the hypothesis of producing 68Ga with a
Zn based liquid target solution, by a cyclotron proton irradiation. For that purpose, it is
necessary to accomplish the given objectives:
Access and study zinc based solutions with suitable physicochemical properties for
cyclotron production
Select the target chamber and window material, testing the chemical effect of the
target solution on it
Ensure the resistance of the transfer line tubes, used to transport the final product

2 Introduction
Research and test methods to separate and extract 68Ga from the chosen zinc
solution
Produce 68Ga through cyclotron proton bombardment of the target solution,
identifying its presence and production yields
Separate and retain the produced gallium isotopes
Figure 1.1 shows the schematic plan of the objectives and steps during the project timeline.
Figure 1.1 Schematic diagram of the steps involved in the production of 68Ga using a Zn-based liquid target.
The final M.Sc. project was done in ICNAS (Instituto de Ciências Nucleares Aplicadas
à Saúde), with the collaboration of the Chemistry Department of the University of
Coimbra.

Chapter 1 3
Part II: Theoretical Introduction
1.2. Neuroendocrine Tumours
Well differentiated neoplasms of the disseminated neuroendocrine cells are classified
by the WHO (World Health Organization) as neuroendocrine tumours (NETs). In the last
three decades there have been considerable advances in the research of these tumours,
more specifically in the most common gastroenteropancreatic neuroendocrine tumours
(GEP-NETs). Our understanding of the underlying pathophysiology has considerably
increased, allowing for better diagnosis and more effective treatments for the patients [1, 2].
Even if some diagnosed NETs appear to have a benign behavior, all of them are
potentially malignant, which makes this specific type of tumours particularly dangerous [3].
Although all NETs share an endocrine origin, their location in the body can considerably
vary, appearing in organs such as stomach, duodenum, pancreas, small intestine, appendix,
colon or rectum [4-7].
Neuroendocrine tumours are known to overexpress somatostatin (SST) receptors in
most of their cells [8]. SST is a neuropeptide, mainly secreted in the stomach and intestine,
capable of inhibiting the release and the action of all known gastrointestinal tract hormones
[9].
1.2.1. Epidemology
In the past few decades, developments in image diagnosis techniques have rapidly
expanded. This also translated the evidence of an increasing detection of neuroendocrine
tumours, particularly GEP-NETs. According to data from the database of the Surveillance
Epidemiology and End Results database (SEER) of the US National Center Institute,
GEP-NETs have shown a surprising increase in 30 years, for instance of 460 % in the
small intestine and 720% in the digestive system [10]. An extensive analysis of the incidence
in the past decades of carcinoid tumours, related to NETs, can be found in Figure 1.2.

4 Introduction
Figure 1.2 Analysis of the incidence of carcinoid tumours in the US population in the last decades [10].
The need of improvement, expansion and research of radiological imaging techniques
that allow an earlier and better diagnosis was, and still is, essential as a prevention response
to the NETs consequences.
1.3. In vivo Imaging
Neuroendocrine tumours can be diagnosed by conventional imaging techniques, such
as computed tomography (CT) and magnetic resonance imaging (MRI) or evaluated using
nuclear medicine approaches.
1.3.1. CT and MRI in NETs Imaging
CT and MRI have been widely used to detect different tumours, also having an
important role in the case of NETs [11]. A short description of the techniques and their
use in NETs diagnosis is described.

Chapter 1 5
1.3.1.1. Computed Tomography (CT)
CT produces digital and anatomic cross-sectional images of a patient by the
reconstruction of the transmitted x-rays detected in the system. The main principle is based
on the transmission of an x-ray beam, with a given intensity I0, through the targeted patient
area. This beam is attenuated when passing through matter, with different attenuation
coefficients µ for different mediums. The transmitted beam, with an intensity I, is detected
and processed, being later analyzed though the reconstructed image. Image reconstruction
is done based on the x-ray attenuation principle. Accordingly to the tissue thickness and
attenuation coefficient, the transmitted beam intensity I can be related to the described
parameters by the Lambert-Beer’s law [12]:
Eq. 1.1
CT sensitivity for NETs varies with the tumour location and size. In the case of
pancreatic NETs, when using non-spiral CT, tumours with smaller sizes than 1 cm have
not been detected. Sensitivity for tumours with sizes between 1 and 3 cm can go up to 30%,
reaching to higher values of 95% for sizes superior to 3 cm. The full sensitivity range for
these tumours, reported between 29 to 78%, is consequently not very reliable [11]. In NET
studies using high resolution computed tomography (HRCT), the results were also not
satisfactory [13].
1.3.1.2. Magnetic Resonance Imaging (MRI)
Magnetic resonance imaging is a multidisciplinary image modality that does not use
ionizing radiation to detect NETs [11, 14]
This technique is based on the interaction of a strong applied magnetic field to a
patient with its tissue protons. A human tissue can be composed by 70 to 90 % of water,
rich in hydrogen nuclei and consequently protons. These protons have different spins. A
magnetic field excites the hydrogen nuclei. When submitted to a magnetic field, protons
line up in the direction of the field. Radio frequency signals are emitted, inducing
transitions between spin states. When the radio frequency signal is turned off, a relaxation
of the spins occurs, back to their original state. During this relaxation, protons emit low
radio frequency signals that can be detected and later used to form tissue cross-section
images.

6 Introduction
This interaction allows the MRI to be very sensitive to the water densities changes
between tissues, consequently related to diseases and injuries. The amount of water in an
injured tissue can be significantly altered. Hence, this image modality can study the tissue
function [14].
In the case of NETs, MRI detection sensitivities are comparable and most of the times
similar to the ones reported with CT. Although magnetic resonance imaging can detect
slightly smaller tumours than the ones reported with computed tomography, it still presents
many difficulties and poor results [11, 15].
Despite the results for detecting NETs by using CT or MRI systems, it is essential to
identify and diagnose such tumour pathologies in the earlier stages, when the tumours still
present small sizes. Diagnosis and consequent treatment risks are highly dependent on the
tumour stage. These techniques can be combined instead with stronger NET image
modalities, such as PET, as a support [11, 16].
1.3.2. Positron Emission Tomography
Positron Emission Tomography (PET) is a non-invasive nuclear technique that allows
us to map, in vivo, molecular pathways and interactions in order to detect and analyze a
variety of pathologies [17, 18].
In PET, positron emission radioisotopes are used to label compounds as molecular
probes or radiotracers for biological and biochemical analysis in vivo. These labeled
molecules, called radiopharmaceuticals, are injected, most of the times intravenously. PET
image scans will provide the information of the concentration and location of the
radiopharmaceutical in the organism, during the time the exam is being performed [19].
1.3.2.1. Positron Emission Tomography Principles
The principle of PET starts with a positron (β+ particle) release by the nuclei of a
specific radiopharmaceutical. When ejected, the positron loses energy in the travelled
distance by interacting with matter, up to the point it collides with its antiparticle, an
electron (β- particle) [20]. This positron-electron pair collision leads to an annihilation

Chapter 1 7
process. Consequently, the annihilated pair is physically converted into two collinear
gamma rays with energies of 511 keV, travelling in opposite directions, as Figure 1.3 (A)
illustrates. These two gamma rays can be detected in a PET detector ring, like
demonstrated in Figure 1.3 (B) [21, 22].
Figure 1.3 - Release of a positron, followed by its annihilation with an electron. It
results in two 511 keV gamma rays traveling in opposite directions (A). Coincidence event detected by the PET ring of detectors (B). Adapted from [22].
One of the biggest advantages of PET is related to the known energy window of the
two detected gamma rays. Because of the conserve energy and momentum principles, the
total energy of the two annihilation gamma rays must correspond to the sum of the rest
mass energies of the two collided β particles, i.e. 1.22 MeV. This annihilation coincidence
detection allows the system not to require an absorptive collimator, resulting in a better
sensitivity for PET, when compared with other techniques. Each detected single photon is
counted and a true coincidence event is identified when the annihilation pair of photons is
counted by coincidence detectors within a timing window τ. This coincidence timing
window defines the maximum time interval where two 511 keV photons are counted as a
true event. The τ value can usually vary around 6 to 12 ns [21, 23].
Multiple counts of true events in the system, together with the applied reconstruction
algorithms, allow the output and reconstruction of a 3D image that maps the different
concentrations and distribution of the radiopharmaceutical in the organism [23].
There are still some limitations in PET, regarding its spatial resolution. First, the
annihilation event does not occur at the same time and location as the positron release.
Before annihilated, the positron first travels a finite distance from the decaying nucleus. It

8 Introduction
interacts with other nuclei and particles present in the matter until it collides with an
electron. Only then can the annihilation event occur. Secondly, the two resulting gamma
photons are not exactly collinear. In the moment of annihilation, the positron still has
residual momentum and kinetic energy. Due to the conserve of momentum principle, the
two photons are emitted 180 ± 0.25 0 apart from each other. Figure 1.4 demonstrates the
described physical aspects of PET positron annihilation and their effects on spatial
resolution. Despite these limitations, there are spatial correction algorithms that can be
applied in the image reconstruction process [21].
Figure 1.4 Representation of PET physical limitations in spatial resolution. Adapted from [21]
1.3.2.2. Crystal Detectors Types
Detector materials in PET are one of the most important factors that allow a correct
output signal and diagnosis obtained. In order to do that, the detector material, based on
scintillation, needs to have a good detection probability as well as an excellent energy
resolution.
The most important properties of a scintillation detector material to obtain the best
signal outputs are its mass density (ρ), effective atomic number (Zeff), light output and
scintillation decay time. A high mass density and effective atomic number allow a higher
crystal stopping power and linear attenuation coefficient (µ). These properties are
responsible for a better probability of radiation interaction and detection. A high light

Chapter 1 9
output reduces the statistical noise in the scintillation, allowing better energy resolutions. A
crystal with a fast scintillation decay time gives the chance of using a narrow coincidence
timing window, which leads to a reduction of random count rates [21].
Most common inorganic scintillator crystals used for PET detectors are made of
bismuth germanate (BGO), cerium-doped lutetium oxyorthosilicate (LSO) or cerium-
doped gadolinium oxyorthosilicate (GSO). Table 1.1 shows some of their main properties
comparing with the ones of thallium-doped sodium iodide (NaI(Tl)), a historic standard
crystal for photon detection.
Table 1.1 Physical properties of the most common PET Scintillator materials. Adapted
from [21]
BGO GSO LSO NaI(TI)
Density ρ (g/cm3) 7,1 6,7 7,4 3,7
Effective Atomic Number Zeff 75 59 66 51
Linear Attenuation Coefficient
µ, for 511 keV photons (cm-1)
0,95 0.70 0.88 0.34
Relative Probability of
Photoelectric Interaction (%)
40 25 32 17
Light Output (photons per
MeV)
9000 8000 30000 41000
Scintillation Decay Time (ns) 300 60 40 230
Energy Resolution at 511 keV
(% FWHM1)
12 9 10 8
As Table 1.1 shows, LSO crystal materials have emerged as one of the best PET
detectors. Its high attenuation coefficient and light output, together with its fast
scintillation decay and low energy resolution make it an excellent PET crystal detector.
1 Full width at half maximum

10 Introduction
1.3.3. Radiopharmaceuticals
A radiopharmaceutical is a radiolabelled molecule produced for in vivo applications. It is
composed of two main parts. The first is a biomolecule structure responsible for the
binding location of the radiopharmaceutical in the organism, since its structure determines
the pathways and interactions of the molecule in the living organism. In the case of
neuroendocrine tumours, the ligand is usually an SST analogue. The second part is a
radioactive nuclide responsible for the signal detection [24, 25].
1.3.3.1. Radiopharmaceuticals in PET
In the case of PET, the radioactive nuclide used is a β+ emitter. The positron decay
leads to the emission and detection of the two opposite gamma rays. In some cases, to
establish a stable connection between the ligand and the radionuclide, it may be necessary
to use a chemical linker [24].
Radionuclides can be produced or obtained by different methods. One of them is
using a particle accelerator (as a cyclotron), where a nuclear reaction occurs and leads to the
formation of the radionuclide. This type of radionuclide production has become easier and
simpler during the years with the evolution of compact medical cyclotrons [26]. Another
method is related to the use of a generator, where a long life parent isotope decays into a
short life daughter isotope. The daughter isotope is extracted as the radioisotope to be used.
Some of the most common used radioactive nuclides used in PET are shown in Table
1.2, together with some of their properties.

Chapter 1 11
Table 1.2 Physical properties of some radionuclides used in PET. Adapted from [21, 24]
Radionuclide Physical
half-life t1/2
Maximum β+
energy
(MeV)
β+ range in
water (mm)
Main Production type
Carbon-11 20.4 min 0.96 3.9 14N(p,α)11C
Nitrongen-13 9.96 min 1.2 5.1 16O(p,α)13N
Oxygen-15 2.05 min 1.7 8.0 14N(d,n)15O
Fluorine-18 1.83 h 0.64 2.3 18O(p,n)18F
Gallium-68 1.14 h 1.9 9.0 68Ge/68Ga-Generator
Rubbidium-82 1.3 min 3.4 18 82Sr/82Rb-Generator
1.3.3.2. The Gallium-68 isotope
68Ga is a positron emitter with a half-life of 68 minutes. It emits a 1.92 MeV positron
with a probability of 89%. The remaining 11% correspond to the electron capture process
(EC) [27]. Due to the disintegration by electron capture, 68Ga emits gamma photons. The
main single photon energies and emission probabilities are presented in Table 1.3.
Table 1.3 Energies and probabilities of the main 68Ga γ-ray emissions. Adapted from [28].
Energy (keV) Emission
Probability (%)
γ -EC 578,5 0,03
γ-EC 805,8 0,09
γ-EC 1077,3 3,22
γ-EC 1261,1 0,09
γ-EC 1883,2 0,14
This isotope has properties that turn it into an excellent candidate to be used in PET.
It has a good half-life, short enough to allow low radiation exposure of the patient (during

12 Introduction
and after exam), enabling short and efficient exams, and long enough to permit efficient
biodistribution in the target tissue. Its high positron emission rate also allows for a high
detection efficiency.
Gallium-68 can be obtained by two different methods. The first one, being the
standard method, is the Germanium-68 – Gallium-68 generator system, mentioned in
Table 1.2. 68Ge is the parent isotope of 68Ga, with a half-life of 270.8 days (nearly 9 months)
[27]. This generator system is used to easily elute and extract 68Ga for the later
radiopharmaceutical labeling [29, 30]. The second method, less used due to its complexity
and non-rentable costs, is the cyclotron production of 68Ga by a proton bombardment of a
solid Zinc-68 target. The resulting nuclear reaction occurs when a proton enters and
interacts with the 68Zn nucleus. This interaction leads to the formation of a 68Ga nucleus
and the release of a neutron. The correspondent nuclear reaction can be represented as
68Zn(p,n)68Ga [31].
68Ga interest has increased on the past years for different reasons. One of them is
related to the evolution and acceptance of PET as a strong and indispensable technique for
image diagnosis, with easier clinical applications. Secondarily, the previously mentioned
68Ge/68Ga-generators have been more available, with simpler and faster methods for the
68Ga elution and later labeling into suitable PET radiopharmaceuticals. The possibility of
labeling various peptide compounds with Gallium-68 has also helped for this interest
growth. Subsequently, the feasible formation of stable complexes of 68Ga3+ with different
chelator types led to less complex radiolabeling methods of biomolecules. Finally, due to
the simplified methods for 68Ga availability and labeling methods, Gallium-68
radiopharmaceuticals have been more and more considered as viable alternatives to other
isotope based radiopharmaceuticals, such as 18F and 11C [30, 32].
Recent studies of 68Ga have been continuously showing its potential, leading to the
increasing research and development of PET imaging approaches for the detection and
analysis of neuroendocrine tumours [33].

Chapter 1 13
1.3.4. Nuclear Imaging in NETs
Neuroendocrine tumours usually overexpress a specific peptide kind of cell receptors,
the SST. Radiotracers based on somatostatin analogues can therefore be used for tumour
visualization, by using scintigraphy and positron emission tomography techniques. These
approaches offer a different alternative to x-ray and magnetic resonance imaging diagnosis
[34-36].
In conventional nuclear medicine, most common SST analogues used in imaging
techniques for the detection and analysis of neuroendocrine tumours were usually labeled
with 111In and 99mTc [8, 16, 37]. More recently, 68Ga proved to be an excellent peptide
labeled isotope for NETs imaging with PET [38] .
1.3.4.1. The importance of Somatostatin Analogues
As it was previously mentioned, somatostatin is a peptide responsible for inhibiting the
secretion of all known gastrointestinal tract hormones.[9]. It is mediated by the membrane-
bound receptor SSTR, a G protein-coupled receptor, which normally exists in tissues such
as the thyroid, brain, gastrointestinal tract, kidney, spleen and pancreas. However, they are
abundantly overexpressed in neuroendocrine tumours, which can be taken into advantage
for the neuroendocrine tumour image studies [38].
Somatostatin receptors have five different subtypes (sst1 – sst5). Only three of them,
str2, sst3 and sst5, have sufficiently high affinity with most of the in-hand synthetic
analogues that are commercially available [37, 39]. These synthetic analogues still differ in
their affinity to each somatostatin receptor, being used to detect abnormal presences of the
SSTR in the different tissue cells and consequently neuroendocrine tumours [38]. However,
most of them only bind with high affinity levels to the SSTR subtype 2. This affinity is
sometimes not enough for an acceptable tumour detection, since the distribution and
densities of the sst2 in NETs varies [39].
The use of SST analogues has been significant relevant for the study of NETs. It
allows the possibility NETs therapy, improving as well the image diagnosis [40-42].

14 Introduction
1.3.4.2. Indium-111 labeled peptides in NETs
The radioisotope 111In has a half-life of 2.8 days. It is a gamma ray emitter commonly
used to perform scintigraphy or single photon emission computed tomography (SPECT)
exams [8].
In these image modalities, synthetic somatostatin analogues are used, as octreotide.
Octreotide based radiopharmaceuticals, such as 111In-diethylenetriaminepentaaceticacid
(DTPA)-octreotide, can bind to NETs cells. This radiopharmaceitucal has an affinity for
the somatostatin receptor subtype 2 (sst2), with more than 80 % sensitivities reported [8,
34]. It also has affinity, although lower, to the somatostatin receptors 3 and 5 [43].
However, the radiopharmaceutical physical properties are not good enough for the
detection of small tumours. Therefore, there was a need for the research of other isotopes
and approaches to take, such as the use of 68Ga in PET [8, 27].
1.3.4.3. Gallium-68 labeled peptides in NETs
Recently it has been shown that PET is a more successful technique to diagnose
neuroendocrine tumours [44]. The widely used radiopharmaceutical 18F-FDG is currently
used for the detection of a variety of tumours. FDG is a glucose analogue, allowing the
detection of tumours by mapping areas in the organism where the metabolic activity of the
cells is abnormally high. Despite the wide variety of options, 18F-FDG has low sensitivity
for the detection of tumours with low metabolic activity and slow growth rate, as in the
case of most NETs [8].
The introduction of 68Ga labeled peptides had a positive response in the research of
new NETs detection approaches, improving imaging analysis of NETs with PET and
PET/CT techniques [38]. The labeled peptides to be used in PET are based on a DOTA
chelator (1,4,7,10-tetraazacyclododecane-1,4,7,10-tetraacetic acid), forming the Gallium-68-
DOTA [38]. 68Ga incorporation can be substantial, with strong bindings, even into a few
nanograms of the somatostatin analogues DOTA peptides [45]. Consequently, this binding
process results into high stable complexes for in vitro and in vivo studies [46].
DOTA is a universal chelator that allows the formation of stable complexes with
metallic radiotracers, which includes 64Cu, 67Ga, 68Ga, 90Y, 111In and 177Lu [38]. Different
DOTA based peptides can be used as somatostatin receptors PET tracers, such as 68Ga-

Chapter 1 15
DOTANOC ([DOTA0,1-NaI3]-octreotide), 68Ga-DOTATATE ([DOTA0,Tyr3,Thr8]-
octreotide) and 68Ga-DOTATOC ([DOTA0,Tyr3]-octreotide) [39]. The three different
DOTA based peptides have good uptake kinetics, also due to their small size, enabling
rapid binding to the SSTRs and organism clearance [32]. Both DOTATOC and
DOTATATE 68Ga radiopharmaceuticals have only higher affinities to the sst2, while 68Ga-
DOTANOC can be highly specific to the SSTR subtypes sst2 sst3 and sst5. The last is
therefore reported to significantly detect more GEP-NET lesions in PET than the others
[39].
Figure 1.5 shows the structures of the different labeled 68Ga somatostatin analogues
most used in nuclear medicine radiopharmaceuticals [32].
Figure 1.5 Structures of the conjugated peptides DOTATOC, DOTANOC and DOTATATE [32].

16 Introduction
When compared to 111In scintigraphy and SPECT approaches, Gallium-68-DOTA
radiopharmaceuticals have been considered and proved to provide higher detection rate
yields in PET, with a better tumour identification. It also has higher tumour to non-tumour
radiopharmaceutical uptakes [27].
1.4. The Cyclotron
Particle accelerators allow the production of intense beams of high energy particles
that are accelerated towards a nucleus target. The resulting nuclear reactions can lead to a
better comprehension of the atomic nucleus in matter, together with the study of particle
penetration and artificial synthesis of matter.
A cyclotron is a cyclic particle accelerator. The accelerated particles travel in a close
circular trajectory through an electric and magnetic fields, until they achieve the desired
energies for target irradiation [47].
Nowadays, cyclotrons are used in facilities to produce isotopes by a charged particle
bombardment into a target. The produced isotopes are later used for labeling of PET
radiopharmaceuticals.
1.4.1. Principles
In a cyclotron, an electric field must be applied in order to accelerate charged particles,
in this case protons or deuterons. An electric potential difference U is applied between two
electrodes, submitting the particle charge Q to an electric field force, allowing it to
accelerate. Due to the electric potential, the particle kinetic energy T is given by
Eq. 1.2
The particle charge Q travels with a velocity v, being submitted to a perpendicular
magnetic field induction B. The sensed Lorentz force FL is given by
Eq. 1.3
This force is perpendicular to both the magnetic field B and velocity v. If the magnetic
field is uniform, the path experienced by the particle will be circular. The Lorentz force

Chapter 1 17
provides the centripetal acceleration that keeps the particle in a circular orbit [48, 49].
Hence, FL is equal to the centripetal force Fp, given by
Eq. 1.4
where r is the radius of the circular orbit and m is the mass of the charged particle.
The representation of the charged particle moving in a magnetic field can be seen in
Figure 1.6.
Figure 1.6 Schematic representation of a charged particle being accelerated through an electromagnetic field. Ff is the centrifugal force sensed by the charged particle as it deviates
from the original trajectory [50].
The kinetic energy T of the accelerated particle can be deduced from Eq. 1.3 and Eq.
1.4, as
Eq. 1.5
where the kinetic energy is directly related to the ion properties (Q, m), the magnetic field
induction B and the radius of the circular orbit r.
The present magnetic field is applied by an electromagnet. Two electrodes are placed
between each electromagnet pole, divided into two separated cylindrical halves, as it is
shown in Figure 1.7. Each semicircular part of the electrode is called “dee”, given the
similarity to the capital letter “D”.

18 Introduction
Figure 1.7 Cyclotron representation of its electromagnet with the two electrodes in each pole [50].
By relating Eq. 1.4, it is also possible to obtain the expression for the accelerated
particle angular velocity,
consequently related to particle properties (Q, m) and the applied magnetic field
induction B [50].
When a charged particle is released from the center of the cyclotron, it is accelerated
towards a charged dee due to the electric field sensed between the dee gap. The magnetic
field is taking effect in the whole trajectory of the accelerated particle. As it enters the dee,
the magnetic field forces the particle to experience a semi-circular trajectory. Once the
particle finishes its path, it leaves the dee returning to the gap. It will again be accelerated,
towards the other dee, where the electric field polarity must be reversed. When it enters the
opposite dee, the particle experiences the same effect, traveling through a semi-circular
trajectory, although the orbit radius is bigger given the higher velocity gained by the
charged particle. The whole process is repeated until the particle beam has the required
energy for a successful bombardment [50]. Figure 1.8 demonstrates the described process.
Eq. 1.6

Chapter 1 19
Figure 1.8 Process of acceleration of charged particles in a spiral trajectory in a cyclotron [50].
According to the theory of the ion cyclotron resonance (ICR), a particle can only be
accelerated through the described process if a time-varying electric field is applied to the
charged particles with the same angular velocity ω [51]. A particle can only be accelerated
during its path if the polarity of the dees is changed every time the particle reaches the gap
between them (i.e. the dees). For that reason, the cyclotron resonance principle is applied.
As demonstrated by Eq. 1.6, the angular velocity ω only depends on the particle mass,
charge and induced magnetic field. In order to satisfy this principle, the particle angular
velocity ω must be somehow synched with the electric field [50, 51].
An alternating current source is therefore applied to the dees, with an angular velocity
Eq. 1.7
where is the electric field frequency. To ensure the resonance condition, must be
equal to . This will allow the synchronization and possibility of the particle to be
accelerated every time it reaches the gap.

20 Introduction
1.4.2. Targets
The material intended to irradiate, together with its support holder, is called target.
This target material can be in solid, liquid or gas physical state, with the highest purity level
possible in order to prevent undesired impurities in the final product. The target material is
contained in a cyclotron target chamber, whose materials must be appropriate to resist high
temperatures and pressures, also having good thermal conductivity properties.
High temperatures are sensed in the target material and in its chamber due to the beam
irradiation. It is thereby necessary to implement a cooling system with a continuously water
and helium flux right around the target chamber, preventing the overheating and material
degradation.
In the case of liquid targets, as the most common targets for 18F production, they
should be composed of three main parts, also illustrated in Figure 1.9:
1. A target chamber which holds the liquid target
2. A foil window that closes the chamber in the beam direction.
3. A target body holding the chamber and window. It binds the target to the beam
line, also allowing the water cooling system to be effective [52].
Figure 1.9 Main constituents of a liquid target system for a cyclotron [52].

Chapter 1 21
1.4.3. The Traditional 68Ga Production
68Ga can be produced in cyclotrons by a 68Zn(p,n)68Ga nuclear reaction. Usually, the
target chamber, made of copper backings or other materials, is electroplated with Zinc-68
in order to reach the desired thickness. Depending on the irradiation conditions and target
chamber materials, a different electroplated target thickness is used. A proton beam energy
of 15 MeV is reported to be more suitable to minimize radionuclide impurities, also to take
the best advantage of the excitation function associated. In this case, the produced 68Ga
yields at the end of bombardment (EOB) can be higher than 5 GBq/µA h [31].
After irradiation, the target should be passed through a series of separation and
purification steps. There are different methods for the separation of 68Ga. Most common
approaches follow a process which consists in:
target dissolution in an HCl based solution;
passing the previous solution through a retention column or cation exchange resin;
removal of zinc and other metallic ions by a first elution step;
68Ga extraction by a secondary elution.
These methods allow chemical separation yields of 90 %, even considering a two-step
elution process.
Another important step in 68Ga cyclotron production is the recovery and reutilization
of the original 68Zn target. The bulk solution that was eluted from the resin can be heated
by an evaporation step until only salt residues remain. Secondly, the salt residues are
dissolved in an HCl based solution and placed into an anion exchange chromatography
column. Zinc and other metallic remains can be afterwards eluted and again used for future
productions [31].
Although this methodology allows high production yields, it is a slow, complex and
expensive process. Simpler and more profitable approaches should be studied.

22 Introduction
1.4.4. A different Cyclotron 68Ga production approach
Both Gallium-68 production/extraction methods have advantages, such as an easy
extraction and separation of 68Ga from the Germanium-68 generator, or the high yield
levels obtained by the proton irradiation of a 68Zn based solid zinc target in Cyclotron [29-
31]. However, they also have their disadvantages. The traditional 68Ga production by
proton bombardment encounters important implementation drawbacks in cyclotron
facilities, mainly because of 68Ga target extraction difficulties and related costs. On the
other hand, 68Ge generators often raise problems due to limited lifetime, decrease of
activity outputs and high purchasing prices. The purchasing cots associated are most of the
times higher than 20.000 € per year of utilization. In order to respond to the current and
future increase of 68Ga use and demand, different approaches for the production of
Gallium-68 should be studied and implemented.
As it was previous mentioned, 68Ga cyclotron production is traditionally based on a
proton irradiation of a 68Zn based solid target. The fact that a solid state element is used as
target implies physicochemical strategies in facilities that are difficult and complex to
implement, together with the high costs associated. For an in-site simple cyclotron facility,
such method is not recommended to follow. The possibility of using a based liquid element
instead, as a target, could facilitate the irradiation process. In this case, the target would not
need to be electroplated, having a much simpler preparation. The method would also allow
easier and faster chemical processes applied in the purification and later isotope labeling.
The different approach that is studied in this work is therefore related to the possibility
of producing 68Ga, even in small cyclotron facilities, by a proton bombardment on aqueous
solution target based on a 68Zn(p,n)68Ga nuclear reaction.

Chapter 2 23
2. Materials and Methods
2.1. Target
This work is based in an innovative method for 68Ga production in cyclotron. Selecting
the target is the first fundamental step for the desired production to be successful.
The idea of using a target solution directly based on the isotope element Zinc-68 is still
too premature. The costs associated with a 68Zn enriched target would be too high
considering that there have not been presented any test studies and results for this new
approach Instead, the conducted tests were done by using natural zinc, having higher
availability, lower costs and same chemistry base of 68Zn. natZn has an isotopic composition
of 18.75 % of 68Zn, as Table 2.1 shows, being high enough for this work tests purposes.
Table 2.1 Isotopic composition of natZn. Adapted from [53].
Zinc isotope Isotopic
abundance (%)
64Zn 48,63
66Zn 27,90
67Zn 4,10
68Zn 18,75
70Zn 0,62
Different zinc-based liquid solutions approaches were considered, based on zinc salts
or even solid zinc dissolved solutions. The selection was focused on desirable
physicochemical proprieties, behavior under irradiation conditions, activation of
24 Materials and Methods
constituents and expected price. This chemical interaction with the target holder materials
also needed to be taken into account, being afterwards tested.
A salt solution is preferred for zinc solutions with high solubility and concentration.
For this purpose, the highly available zinc chloride, zinc fluorine and zinc iodine salts were
studied. Their main properties are presented in Table 2.2.
Table 2.2 – Properties of zinc chloride, zinc fluorine and zinc iodine and salts. Adapted from [54, 55].
ZnCl2 ZnF2 ZnI2
Molar mass 136,29 g/mol 103,41 g/mol 319,18 g/mol
Melting point 290 0C 872 0C 446 0C
Density (at 25 0C) 2,91 g/cm3 4,95 g/cm3 4,74 g/cm3
Solubility in water (at 25 0C) 4,32 g/ml Insoluble 4,50 g/ml
As Table 2.2 shows, ZnF2 is not an appropriate salt for this work purpose. Its
insolubility in water makes him a non-suitable candidate. On the other hand, ZnCl2 and
ZnI2 are extremely soluble in water. However, the high molar mass of zinc iodine is
undesired. When compared to a zinc chloride solution in the same conditions, a solution of
zinc iodine will have a lower abundance of zinc elements. For this work purpose, the
higher the abundance of zinc in the target solution, the higher the production yields will be
obtained. The target was therefore decided to be based in a zinc chloride solution.
2.2. Target Chamber and Foil Window evaluation
Given the chosen target solution, target chamber and window materials needed to be
studied and assessed. It was necessary to ensure high physicochemical resistance properties
to a zinc chloride based solution exposure. The preliminary assumption of zinc chloride as
a low pH target solution led to the research of materials capable of resisting a high
corrosion environment, still fitting the physical and chemical cyclotron properties
requirements [56]. Preliminary analysis showed niobium as a possible candidate, whose
physical properties are indicated in Table 2.3.

Chapter 2 25
Table 2.3 Niobium physical properties. Adapted from [57]
Niobium Properties
Atomic Weight 92,9064
Density 8,57 g/cm3
Melting Point 2468 0C
Boiling Point 4927 0C
Electrical Resistivity (20 0C) 15 µΩ m
Specific Heat (20 0C) 265 J Kg-1 K-1
Thermal Conductivity 52 W m-1 K-1
Niobium is used in a variety of applications and industries, such as cathodic protection
anodes, superconductivity applications, rocket nozzles, aircrafts, sodium vapor lamps,
jewelry, including as well chemical processing applications given its high corrosion
resistance to different mediums [57]. More importantly, it is commonly considered as a
target chamber material in cyclotron applications, widely used in 18O-enriched water target
chambers for 18F productions [58]. Its properties are therefore highly appropriate to
tolerate and fit the cyclotron conditions.
Niobium is also considered to be an excellent candidate, supporting ZnCl2 solution
conditions. Even with boiling temperatures and concentrations up to 70% wt (weight
percent) there are unreported results of corrosion rates [57].
Despite the optimistic initial research results, corrosion resistance tests needed to be
performed in the chosen target window and chamber material before cyclotron irradiations.
In order to evaluate and ensure the chemical resistance of niobium to a ZnCl2 acidic
environment, niobium foils were obtained from Goodfellow Cambridge in England, with
the properties presented in Table 2.4.

26 Materials and Methods
Table 2.4 Niobium foils properties from Goodfellow Cambridge.
Niobium foil properties
Thickness 0,25 mm
Purity 99,9 %
Coil width 300 mm
Size 25x25 mm
Temper Annealed
2.2.1. Physical study: Effect of Zinc Chloride solution to
Niobium
Niobium foils were intended to be exposed to a ZnCl2 environment. For that purpose,
two different zinc chloride based solutions were prepared.
The first solution was prepared with a mass/solvent volume proportion of 50 g of
ZnCl2 salt (98% purity, supplied by Panreac) to 50 ml millipore-Q H2O. A second solution
was prepared with a similar mass/solvent volume proportion of 50 g, of the same ZnCl2
salt, to 50 ml of a previously prepared 10 M HCl solution. The measured pH value of this
solution in a digital meter was below the sensitivity range of the apparatus. The use of such
acidic conditions had the purpose to expose a niobium foil to an extreme acidic
environment, and so to evaluate the chemical resistance limitations of niobium.
A niobium foil, with an initial measured mass of 1.3825 g was dipped in the first ZnCl2
solution. Another foil, with 1.3815 g mass, was dipped in the second solution (i.e., the most
acidic one). Both foils were weighed in an ADA 120LE analytical balance, with a resolution
of 0.1 mg. After that, they were dipped in a closed environment, deprived from oxygen,
with constant agitation and temperature of 25.0 (± 0.1) 0C. In order to do so, a Grant
thermostatic bath was prepared. A third niobium foil was kept aside in a closed space,
without any solution exposure, to serve as a control sample.
After 40 days, both niobium foils were retrieved from the two solutions and placed in
petri dishes. They were afterwards dried with a Labconco Freezone 4.5 lyophilizer, during

Chapter 2 27
18 hours with a 0.024 millibar pressure and a -54 0C temperature. This helped to sublime
the retained solvent in the foils. After this, the foils were again weighted before analyzed
through a scanning electron microscope. They were also studied by an energy dispersive X-
ray spectroscopy.
2.2.2. Scanning Electron Microscopy (SEM)
The three niobium foil samples were analyzed though a scanning electron microscopy
in order to evaluate the physical differences of their surfaces.
SEM is a technique capable of nanoscale measurements and structural characterization
of material surface morphology [59]. It consists on a scanning beam of electrons, with
energies around 40 keV, focused on a material surface area. These electrons interact with
matter, leading to the production of characteristic X-rays and consequent release of
secondary electrons. These secondary electrons, only having energies of some tens of eV,
are detected and used to generate an output signal of an image [60]. The equipment
consists of:
an electron gun followed by a lens system to produce and focus the electron beam
deflection coils that determine the scanning area, depending on their current or
voltage
a detector used to collect the emitted secondary electrons from the analyzed sample
Figure 2.1 shows a common schematic structure of a SEM equipment.

28 Materials and Methods
Figure 2.1 Scheme of a typical Scanning Electron Microscope. Adapted from [59].
Due to the excellent resolution and surface characterization possibilities of the
technique, SEM demonstrated to efficiently evaluate the surface of the three niobium foil
samples, including the control. SEM was done in Instituto Pedro Nunes (IPN), in Coimbra,
with a scanning microscope Joel JSM 5310.
2.2.3. Energy dispersive X-ray Spectroscopy (EDS)
Given the possibility of element identification and characterization of the niobium
samples, an Energy dispersive X-ray spectroscopy showed to be a good follow-up study
after SEM.
EDS is a complementary technique to SEM that allows elemental identification,
analysis and characterization of a sample surface. The SEM primary electron beam leads to
a release of characteristic X-rays by interacting with the analyzed sample. The EDS system
detects and processes these characteristic X-ray energies, which are unique for each
element [61]. Figure 2.2 illustrates the principle of EDS.

Chapter 2 29
Figure 2.2 Illustration of the EDS principle [61].
An energy dispersive X-ray spectroscopy was therefore performed to the same
niobium foil samples that were submerged into the zinc chloride solutions. Due to logistic
reasons the EDS could only be performed one month later to the prior SEM analysis. The
samples were kept in a dry place during that time, without any surface treatment. This
analysis was performed in Instituto Pedro Nunes (IPN), in Coimbra, with the Oxford X-
Max 60908-X020 EDS equipment.
2.3. Target Solution Transfer
In cyclotron facilities, it is necessary to use transfer lines between the cyclotron room
and hot cells, for practical and radioprotection reasons. These transfer lines usually consist
on polytetrafluoroethylene (teflon) tubes [62]. Teflon is a semi-crystalline polymer used in a
variety of applications because of its excellent physicochemical properties, such as high
resistance to corrosion and very low friction coefficient [63]. Such properties make teflon
an excellent line transfer material to be used in cyclotron facilities.
Since the target solution, foreseen to be used for this work purpose, is expected to be
acidic and corrosive, it is necessary to evaluate the solution effect on the line transfer
materials used [56]. For that reason, two teflon tube samples were dipped, each in one of
the ZnCl2 solutions prepared for the previous niobium foil tests. They were submerged in 5
ml volumes for 30 days at room temperature. A control teflon sample was dipped in
millipore-Q H2O, in the same conditions. After that period, the three samples were
submitted to a thermogravimetric analysis.

30 Materials and Methods
2.3.1. Thermogravimetric Analysis (TGA)
Thermogravimetric analysis is a thermal technique that allows the characterization of
polymeric materials by studying their thermal stability conditions. It is most of the times
used to evaluate a polymer material fit to a desired application, analyzing its mass
degradation within a temperature range [64].
The TGA system records the sample weight loss as a function of time and temperature,
within temperature ranges that can go up to 1500 0C, with low or high heating rates at a
given pressure [65, 66].
The three teflon samples were first weighed and dried in a moisture analyzer scale
(AND MS-70). The samples had a similar mass, approximately 10 mg each. Afterwards
they were individually submitted to a thermogravimetric analyzer2. The system was set to
have a heating rate of 20 0C/min and an end temperature of 850 0C, under a N2
atmosphere. Data processing was performed with Proteus® software for thermal analysis
and GraphPad Prism (version 6.02).
2.4. Gallium extraction from the target solution
Having the solution target selected, as well as the materials used in the target window,
chamber and transfer lines, it is still necessary to evaluate the purification and separation of
the cyclotron produced 68Ga.
After a cyclotron production, the final state of the target solution cannot be readily
used in the labeling process into the final radiopharmaceutical. In the end of bombardment
(EOB), the target solution is still a mixture of element impurities to the labeling process.
These impurities derive from the original zinc chloride solution and also from other
isotope elements produced during irradiation. For this purpose, it is necessary to isolate
and recover the gallium ions from the rest of the solution.
2 Netzsch TA-System Controller TG 209 F3, located at the Chemistry Department of the University of
Coimbra

Chapter 2 31
2.4.1. Gallium extraction
Gallium, like other substances, can be retained and extracted by using resins based on
ion exchange processes. Ion exchange resins are insoluble substances filled with positive or
negative ions, being capable of exchanging them with the surrounding ions of a solution. A
cation exchange resin swaps positively charged ions, whereas an anion exchange resin
swaps negatively charged ions. The principle is therefore based on a resin R filled with ions
of type A capable of exchanging them with the ions B contained in a passing solution, as
shown:
Eq. 2.1
This happens for a resin with a higher affinity for the ion type B than for the ion type
A. The B ion is later eluted with a resin specific solution. The affinity (i.e., the selectivity) of
a resin to a substance is different depending on the ions size and charge, solution
concentration or resin activation method [67].
Gallium ions are in a 3+ state (Ga3+). In this case, the cation exchange resin Strata-XC
has been successfully used in Ga retention, with positive results [67, 68]. Therefore, we
tested it, with a mass of 200 mg. Another cation exchanger resin looked promising to
strongly retain gallium - the Dowex 50W-X8 [69-71]. It was tested as well. Both resins
were activated with a 1 ml HCl 4M solution, followed by 10 ml of ultra-pure water.
2.4.2. Retention and Elution Activity tests
To initially evaluate the best methods for gallium extraction, prior to the irradiation
tests, an experiment to study the different ion exchange resins and column methods was
conducted. A ZnCl2 solution with a concentration of 5 M was prepared with Sigma-Aldrich
zinc chloride reagent grade (purity ≥ 98%) and ultra-pure water. Nearly 1.5 ml portions of
this solution were mixed with small volumes of 0.6 M HCl eluate solutions from a 68Ge-
68Ga generator (iThemba LABS). The goal was to simulate the conditions of an irradiated
ZnCl2 target solution to trap and recover the produced gallium isotopes, although with
some limitations. The physicochemical differences of an irradiated solution, such as its
concentration and present impurities, will be taken into account.

32 Materials and Methods
Additionally, the solutions of ZnCl2, containing 68Ga from the iThemba generator,
were diluted in different volumes of ultra-pure water. Afterwards, they were passed
through the resins. During the process, both initial, retained and eluted activities were
measured in a COMECER® PET-dose calibrator, integrated in a COMECER® MIP1-P1
hot-cell. The statistical analysis for the resulting data was done using the GraphPad Prism
software.
The methods with the best results were later applied and consequently tested for the
irradiated ZnCl2 target solutions.
2.5. Cyclotron Irradiation of ZnCl2 solutions
The final steps of this work involved the irradiation of a zinc chloride solution for the
production of 68Ga. It was first necessary to prepare the cyclotron target system. After
irradiation, 68Ga production was analyzed.
All irradiations were performed with the IBA cyclone 18/9 cyclotron (IBA, Louvain-
la-neuve, Belgium), using 18 MeV protons, at ICNAS.
2.5.1. Target Chamber and Foil Window
The target chamber used was one of the IBA 18/9 cyclotron available target chambers
designed for the production of 18F, with a niobium body. A target foil window was
obtained from Goodfellow Cambridge, with 0.125 mm thickness and appropriate size to
the available target chamber. The niobium window foil properties are described in Table
2.5.
Table 2.5 Niobium window foil properties from Goodfellow Cambridge.
Niobium window foil properties
Thickness 0,125 mm
Purity 99,9 %
Diameter 30 mm
Temper Annealed

Chapter 2 33
The window foil is sufficiently thick to ensure pressure resistance inside the target
chamber and sufficiently thin to allow target cooling by the surrounding water flow system.
Before reaching the target, the beam energy is degraded when passing through matter,
which includes the water that is cooling the chamber and its target window. For a niobium
foil thickness of 0.125 mm, still considering the water surroundings, the attenuated beam
will have proton energies of 16.28 MeV when reaching the target solution, according to a
SRIM3 simulation. The correspondent cross section value, directly related to the probability
for the nuclear reaction 68Zn(p,n)68Ga to occur, is approximately 0.4 barns4 [72].
2.5.2. Irradiation Conditions
natZnCl2 target solutions were prepared using a Sigma-Aldrich zinc chloride reagent
grade (purity ≥ 98%) diluted in ultra-pure water. The solute/solvent ratio used was 1 g of
zinc chloride to 1 ml of H2O. The target solution was injected in the IBA 18/9 cyclotron
niobium target chamber with a 0.125 mm thickness niobium foil window, from
Goodfellow Cambridge.
During the irradiations, the beam current was controlled and the target pressure
measured. Target cooling system temperatures oscillated between 18 and 20 0C.
2.5.3. 68Ga production evaluation
This work is based on the hypothesis of producing 68Ga with a 68Zn based target
solution. It is therefore necessary to initially study and test the feasibility of the process,
production yields and 68Ga extraction. In an initially study such as this, it is more suitable to
first study the similar aspects using a natZn solution target instead. The consequent results
can be evaluated as well as the possibility of a follow-up study using an enriched 68Zn salt
target solution.
As previously mentioned, the isotopic concentration of 68Zn in natural zinc is about
18.75 % [53]. In theory, that turns 68Ga production yield by a natZnCl2 target solution
3 Stopping and Range of Ions in Matter (SRIM) – software to calculate the stopping and range of ions in
matter through statistical algorithms. 4 (1 barn = 10-24 cm2)

34 Materials and Methods
irradiation 81.25 % less effective than it could become if a 68Zn enriched target were to be
used. It is still sufficient to study the feasibility of the foreseen production method.
Production yields were calculated from the analysis of the measured time-activity curve
in the final target solution. After bombardment, the target solution was transferred from
the cyclotron to a shielded hot-cell through teflon tubes. The solution activity was
measured in a dose calibrator detector and recorded during time. The extrapolation of the
Gallium-68 activity curve was achieved by identification of the produced isotopes within
the original activity curve. The longest half-life pattern would be identified and its
correspondent isotope activity curve subtracted. This process was repeated until every
isotope half-life pattern was identified and consequently subtracted to the original activity
curve, with no more considerable count rates results for the analysis. Non-linear regression
methods were used for each subtracted curve. They allowed the identification of the
correspondent isotope half-life and initial activity. This analysis was performed by using the
GraphPad Prism software.
2.5.4. Spectroscopy
The irradiation of natural zinc will lead to the production of 68Ga, together with other
produced gallium isotopes such as 66Ga or 67Ga [73]. This is possible due to the different
isotopic composition of natZn, as shown in Table 2.1. It is expected that the nuclear
reactions 66Zn(p,n)66Ga and 67Zn(p,n)67Ga will occur with high production yields.
Gallium-67 (t1/2 = 3.26 days) has characteristic gamma-ray emission energies, as
showed in Table 2.6, originated by an electron capture conversion process [74]. The use of
an appropriate crystal detector system can easily identify and measure the gamma emission
energies [75].
Table 2.6 Emission energies and probabilities of the 67Ga γ-ray decay. Adapted from [75]
Energy (keV) Emission
Probability (%)
γ-EC 93,3 39
γ-EC 184,8 21
γ-EC 300,2 17
γ-EC 393,5 5

Chapter 2 35
In this work, the use of a crystal detector well allowed a semi-quantification analysis of
the 67Ga production, taking into account the detected characteristic γ-ray counts given by
the spectroscopy system. The identification of the specific γ-rays of 67Ga will prove 67Ga
and consequently 68Ga productions, by a natZn target irradiation. For this purpose, the
CRC®-55tW Well Counter, with a NaI crystal detector, was used.


Chapter 3 37
3. Results and Discussion
3.1. Zinc Chloride as target solution
The purpose of this work was to assess the possibility of producing 68Ga via a
cyclotron irradiation of a zinc liquid based target. Different zinc base solutions were taken
into account, and the feasibility of a zinc chloride salt solution looked promising for the
given goals. The highly available zinc fluorine and zinc iodine salts were considered, but the
low solubility in water of the first, and the high molar mass of the second were not suitable.
However, zinc chloride had optimal physicochemical properties for our goal. The high
solubility in water (4.32 g/ml), together with its cost and availability, allow the preparation
of a high concentrated zinc solution at low cost.
In terms of the irradiation process and solution impurities, the cyclotron proton
bombardment of chloride does not represent a potential contaminant disadvantage or
concern. According to EXFOR5 , the only chloride nuclear reaction significant on this
process is 37Cl(p,n)37Ar. Argon-37 is an isotope with an half-life of 35 days, that decays by
an electron capture process [76]. Additionally, the chlorine present in the target solution is
also not an important concern. In the 68Ga purification and labeling process, performed
with the 68Ge generator method, the use of hydrochloric acid, which contains chloride, is
needed.
3.2. Corrosion Analysis on Niobium surfaces
An analysis on niobium foils that were exposed for 40 days to the zinc chloride
solutions was conducted. Sample 1 was dipped in a solution composed of ZnCl2 salt (50 g)
diluted in H2O (50 ml). The second niobium foil sample was exposed to a solution of
5 Experimental Nuclear Reaction Data (EXFOR)

38 Results and Discussion
ZnCl2 salt (50 g) dissolved in 10 M HCl (50 ml). After the mentioned interval of time,
samples were dried and both foils were again weighed for a mass difference analysis,
showed in Table 3.1.
Table 3.1 Niobium foil samples mass analysis after exposure to zinc chloride solutions.
Sample 1 Sample 2
Initial mass (g) 1,3825 1,3815
Final mass (g) 1,3881 1,3827
Mass increase (%) 0,40 0,08
This mass analysis is in agreement with the occurrence of possible oxides formation in
the substratum of the samples. The solution where the niobium sample 1 was dipped had a
considerable volume of water. Within a water medium, there could be a formation of oxide
complexes based on ZnCl2 that remain in the substratum. Although it is low, the 0.40 %
mass increase in the sample 1 is therefore suspected to be highly related to that fact. In the
other hand, within a stronger acidic medium, with a low presence of water molecules as in
the solution where the niobium sample 2 was dipped, the corrosion process seems to be
much more passive or even nonexistent. The mass increase of 0.08 % of the second sample
was considerably lower than the first. There is a probability that this sample had a slower
corrosion process, with less formation of oxides complexes that could remain in the sample
surface. Nevertheless, both samples presented very low differences between their final and
initial masses, possibly revealing slow corrosion processes.
These initial findings needed to be further confirmed. The scanning electron
microscopy performed was foreseen to be an important analysis to corroborate these initial
results.
3.2.1. SEM on Niobium samples
The scanning electron microscopy analysis revealed the reason for the mass increase in
samples 1 and 2. A control sample was first scanned and studied for comparison.

Chapter 3 39
In Figure 3.1 it is possible to see a clean and smooth niobium foil surface, having a
common straight scratch behavior.
Figure 3.1 SEM scans on the niobium control sample with lower (a) and higher (b) zooms.
The SEM analysis on the niobium samples 1 and 2 showed a different surface behavior
than the one seen in the control sample, as it can be seen in Figure 3.2 and Figure 3.3.
Figure 3.2 SEM analysis on sample 1, dipped in a solution of ZnCl2 salt (50 g) diluted in H2O (50 ml) during 40 days. b) and d) correspond to zoomed areas of a) and c) respectively.

40 Results and Discussion
Figure 3.3 SEM analysis on sample 2, dipped in a solution of ZnCl2 salt (50 g) diluted in
10 M HCl (50 ml) during 40 days. b) corresponds to a zoomed area of a).
Both samples 1 and 2 showed the same behavior pattern, apparently with a deposition
of molecular aggregates around the niobium foil surfaces. The mass increase in both
samples previously mentioned, is therefore related to the deposits formed during the
exposure of the niobium foils to zinc chloride solutions. These aggregates are mostly
related to the solution salt depositions as well with the probable formation of niobium
oxides.
During SEM, it was also possible to see fewer and more structured aggregates in the
foil surface of sample 2 than in sample 1. In the second sample, the phase separation seems
to be spread by larger areas with different exfoliation-like patterns. This supports the
information given by the mass difference analysis in the samples, where the mass increase
in sample 1 was higher than the mass increase in sample 2. It also confirms the theory of a
slower and less probable oxide formation in stronger acidic environments as the solution
where sample 2 was dipped. This solution had a lower pH than the solution where sample
1 was exposed.

Chapter 3 41
Although other studies shall be performed to better explain the corrosion mechanism
in both samples, the mass analysis coupled with SEM helped to justify that most probably
the acid media has an important role on the formation of a passive region. Another support
for this hypothesis is the pourbaix diagram of a niobium-water system at 25 0C, represented
in Figure 3.4.
Figure 3.4 Potential-pH equilibrium diagram for the niobium-water system at 25 0C. Adapted from [77].
A pourbaix diagram is a representation of the Nersnst equation, relating a material
electrochemical potential with the medium pH dependence. In these diagrams, different
regions of stability can be seen [78]. The first and most stable region is called immunity,
where the metal is considered to be thermodynamically stable without any corrosion
occurrence. The second region, called corrosion, happens when dissolution and corrosion
of the metal in the medium occurs. The passivity region, being the third, happens when the
metal reacts with the medium compounds, within a corrosion process, up to a point the
metal surface is covered with produced passive layer, preventing further corrosion to occur
[77]. The presented pourbaix diagram, although not clearly showing the different stability
regions, demonstrates that with a lower pH value the electrochemical potential needed for

42 Results and Discussion
oxides to occur in niobium is superior that with higher pH values. Therefore, in this system,
a more acidic medium prevents the formation of oxide complexes in the metal surface with
better results, slowing the corrosion process. This fact supports the reported mass increase
differences in the niobium sample 1 and 2, as well as the fewer aggregate structures
observed during the SEM analysis in the second niobium sample, when compared to the
first. Despite the solution medium systems being different from the one considered in the
pourbaix diagram, the approximate inductions are viable.
Nevertheless, it is still important to explain that both samples had very few aggregates,
only seen with SEM. Furthermore, the selected SEM scans represent the less clean surface
areas of the niobium samples. Although oxidation is related to the chemical corrosion
process, none of the niobium foil samples showed a significant destructive corrosion in
their surfaces. It is an important feedback to support a high physicochemical resistance of
niobium to the corrosion influence and induction of zinc chloride solutions, even with a
long period exposure.
Given the SEM results, an elemental analysis on the samples was indicated. An energy
dispersive X-ray spectroscopy was made as a follow-up study.
3.2.2. EDS on Niobium samples
The energy dispersive X-ray spectroscopy on niobium foil samples 1 and 2 was made a
month later to the prior SEM. EDS analysis helped to identify the elemental composition
of the aggregates seen in SEM.
Figure 3.5 shows a SEM scan of an area surface of the niobium sample 1 (a), together
with the EDS element spectrum of two different spots (b and c). The element
characteristic x-ray spectrum shown in (b) indicates a high presence of zinc and chloride
elements from the salt solution that reacted with the niobium foil surface, forming
structural complexes seen in (a).
The same complex formation behavior can be seen in the niobium sample 2, as SEM
and EDS analysis on Figure 3.6 shows. These complexes have clearly evolved rapidly
during the time between the previous SEM and the later EDS analysis. It showed the
acceleration of the corrosion process in the niobium samples after exposure to zinc
chloride solutions, when the foils were put in a normal environment with air contact. At air,

Chapter 3 43
the formation of electrochemical cells is much faster and easier in the surface of the
niobium samples. On the other hand, the solubility of oxygen in the solution is lower,
leading to a slower corrosion process compared to when the metal samples contact with air.
Figure 3.5 SEM scan to the niobium foil sample 1 (a) and EDS element spectrum of aggregate (b) and a clean (c) spots.

44 Results and Discussion
Figure 3.6 SEM scan to the niobium foil sample 2 (a) and EDS element spectrum of clean (b) and an aggregate (c) spots.
EDS also allows a mapping elemental characterization. The sum of every pixel
spectrum, which gives the element most present, gives the possibility of an element map of
an image scan, as Figure 3.7 demonstrates. The niobium sample 1 element maps of
niobium (a), chloride (b), oxygen (c), calcium (d) and zinc (e) were found, and summed into

Chapter 3 45
a reconstructed element map (f). It clearly shows the prevalence of niobium and chloride
elements present in the surface of a scanned area of sample 1. When compared to the SEM
image, the presence of chloride coincides with the presence of surface aggregates. On the
other hand, the presence of niobium coincides with the clean surface areas. Figure 3.8
demonstrates this comparison.
Figure 3.7 Element map of an EDS scanned area of niobium sample 1. Niobium (a), chloride (b), oxygen (c), calcium (d) and zinc (e) maps are shown. The sum of the 5
element maps forms the reconstructed map (f).

46 Results and Discussion
Figure 3.8 SEM scan on a surface area of the niobium sample 1 (a) compared to the correspondent EDS reconstructed element map (b).
Another evidence of the prevalence of chloride elements in the chemical complexes
seen in the surfaces of both niobium samples is evident in Figure 3.9. In this case, blue
pixels correspond to the presence of a higher chloride spectrum and the red pixels to the
presence of a higher niobium spectrum. Less evident are the zinc, oxygen and calcium
elements represented by the colors green, purple and yellow, respectively.

Chapter 3 47
Figure 3.9 SEM scan on a surface area of the niobium sample 1 (a) compared to the correspondent EDS reconstructed element map (b).
Although they are less concentrated, the presence of oxygen elements within both
samples supports the existence of oxide elements. The acceleration of the corrosion
process observed in both samples, during the time passed between the SEM and EDS
analyses, can be related to the exposure of the niobium samples to air. The oxygen
presence in air, within a considerable humid environment, allows the formation of thin
water layers in the surface of the metallic samples, where the air oxygen is fixated. The
oxygen is consumed, leading to the formation of weaker thermodynamic stability points in
the sample, prospective to corrosion occurrence.

48 Results and Discussion
The identification of calcium elements in the EDS spectrum analyses was not expected.
Nevertheless, its presence can be related to different reasons. The flask materials used
during the thermostatic bath of the niobium samples could still have impurities that were
not completely washed during the initial cleaning process. It could also be due to sweat,
since human glands still secrete small concentrations of calcium [79]. When hold, the
niobium foil samples could have been in contact with the sweat present in the hands palm.
Yet, the most suspected cause is water. The millipore water used to prepare the zinc
chloride solutions could have calcium impurities due to the ion exchange columns in the
water purification system, probably needed to be replaced.
EDS analysis revealed an important element characterization of the niobium samples.
Although the chemical species of the aggregates observed were not identified, the presence
of chloride and zinc is clearly related. The identification of oxygen elements in both
samples spectra, together with the information of the previous analysis, indicates the
formation of oxides. Consequently, it shows the existence of corrosion during the time
until EDS was performed. Moreover, the air exposition consequences on the corrosion
acceleration of the samples revealed that the niobium target holder, foreseen to be used in
the cyclotron irradiations, should be thoroughly washed and cleaned after each irradiation,
preventing oxide formations.
Ultimately, the mass, SEM and EDS analysis revealed a high physicochemical
resistance of niobium to zinc chloride solutions. The niobium samples were submitted to
extreme conditions, being exposed to acidic environments during 40 days. They were not
even washed and cleaned during that time. Yet, the followed mass and SEM analysis only
showed low mass increases, with little formation of aggregates in the samples surfaces.
When exposed to air, the corrosion process was significantly accelerated, as demonstrated
by the EDS. Within cyclotron conditions, niobium is expected to even better resist target
solution conditions. The zinc chloride exposure will be much smaller and the target
chamber thoroughly cleaned after each irradiation. The contact with oxygen will also be
minimal. Hence, niobium is highly suitable to be used as target chamber and window
materials to support a zinc chloride target solution.

Chapter 3 49
3.3. Degradation analysis on teflon - TGA
The thermogravimetric analysis on the chosen material for the transfer lines of the
target solution showed positive results.
Three teflon samples were considered in this analysis, as described in section 2.3.1. The
control sample was the one dipped in millipore-Q water. The teflon sample 1 was exposed
to a 5 ml of a ZnCl2 solution with 50 g of ZnCl2 dissolved in 50 ml of millipore-Q H2O.
The teflon sample 2 was dipped in 5 ml of a solution composed on 50 g of ZnCl2 dissolved
in 50 ml of 10 M HCl. The resulting TGA graphic of the three samples is shown in Figure
3.10, where the mass lost ratio is given in function of temperature.
Figure 3.10 Thermogravimetric graphic of the three teflon samples, one used as control.
An analysis of the first derivative curve of the TGA (DTG) was later performed,
represented by Figure 3.11. The DTG curve describes the mass loss rate with the
degradation temperature (dm/dT), allowing the determination of the temperature in each
transition segment of the TGA curve. It relates the inflection of the transition profile of the
sample, easily showing weight loss rate changes that cannot be readily seen in the TGA
curve [80, 81]. The DTG minimum gives the maximum mass lost rate at a given
temperature.

50 Results and Discussion
Figure 3.11 First derivative of the TGA sample curves.
The analysis revealed similar behaviors of samples 1 and 2 compared with the control,
in the TGA and DTG results. The total mass loss of the three samples was registered as
well as the temperature of maximum mass lost rate (corresponding to the first derivative
minimum of the TGA graphic curve). The results are presented in Table 3.2.
Table 3.2 Total mass lost and maximum mass lost rate correspondent temperature of the TGA samples.
Total mass lost
(%)
Temperature of maximum
mass lost rate (0C)
Control sample 101,85 605,8
Teflon sample 1 102,55 609,1
Teflon sample 2 102,41 611,9
The obtained results presented in Table 3.2 show the consistency of the similar results
of the TGA study on the three samples. The total mass lost, although liable to a small error,
showed no presence of residues at the end of TGA. This proves the purity of the teflon
material used. Furthermore, the proximity of the registered temperatures for maximum
mass lost rate evidences the same material degradation pattern with temperature observed
in the TGA and DTA curves, within all samples.

Chapter 3 51
Teflon was therefore found to safely resist the zinc chloride solution conditions, in
order to be used in the path between the cyclotron and the hot-cells, as the transfer line
material of the target solution.
3.4. 68Ga preliminary column tests
The elution solution from the 68Ge-68Ga generator of 0.6 M HCl was diluted in water.
Different portions were afterwards mixed with small volumes of a 5 M ZnCl2 solution.
The resulting solutions were used to test the columns adsorption for 68Ga ions. The results
are presented in the graphic of Figure 3.12. Different dilution concentrations of the
solution that passed through the columns were used in the different tests. The best results
were obtained with the cation exchanger Dowex 50W-X8 resin, prepared with a resin mass
superior to 400 mg in each trial, with a positive 68Ga adsorption of 92.83 ± 1.86 %. The
second best result was obtained with Strata-XC, with 200 mg resin mass, with a 68Ga
adsorption of 85.01 ± 9.23 %.
Figure 3.12 68Ga adsorption in the ion exchange resin types Strata-XC and Dowex 50W-
X8.
The solution that passed through the Dowex resin columns consisted on 1.5 ml of a
0.025 M HCl dilution solution containing the 68Ga mixed with 1.5 ml of a 5 M ZnCl2
solution dissolved in 16 ml of ultra-pure water.
In order to better evaluate the use of the Dowex resin for 68Ga retention, additional
studies were performed. Besides from the diluted solution, the resin mass should also

52 Results and Discussion
influence the gallium retention. To study this influence, different prepared resin masses
were tested to retain 68Ga, having obtained the results summarized in Figure 3.13.
Figure 3.13 Dowex 50W-X8 68Ga absorption depending on the resin mass used.
Mass retention tests revealed positive results for resin masses superior to at least 200
mg, with a 68Ga retention superior to 87 %. From there, an increase of the resin amount in
the column resulted in higher adsorptions, although with smaller differences in the results,
as shown in Figure 3.13.
Given that the best results were obtained with the Dowex 50W-X8 resin, gallium
extraction tests were performed with it, using a 3.5 M HCl elution solution, with a volume
of 3 ml passing through the column. The study outcome was found to be very positive,
with a reported 68Ga deabsorption of 94.25 ± 5.06 % (n=8).
3.5. Cyclotron irradiation of a ZnCl2 solution
In total, seven irradiation tests of zinc chloride solutions were done. During each trial,
several parameters were changed in order to achieve the best conditions and results. Some
of the improvements were a higher target stability inside the cyclotron, the assessment of
fast and appropriate transfer of the irradiated solution to a hot-cell and higher production
yields.
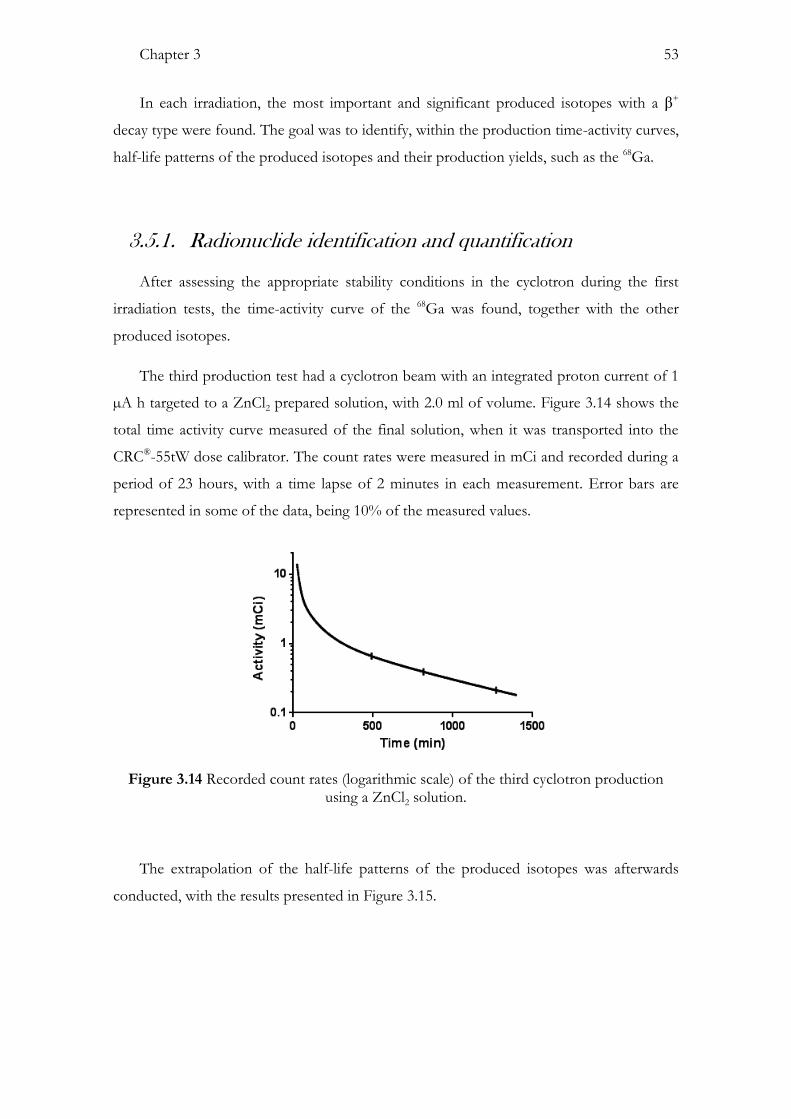
Chapter 3 53
In each irradiation, the most important and significant produced isotopes with a β+
decay type were found. The goal was to identify, within the production time-activity curves,
half-life patterns of the produced isotopes and their production yields, such as the 68Ga.
3.5.1. Radionuclide identification and quantification
After assessing the appropriate stability conditions in the cyclotron during the first
irradiation tests, the time-activity curve of the 68Ga was found, together with the other
produced isotopes.
The third production test had a cyclotron beam with an integrated proton current of 1
µA h targeted to a ZnCl2 prepared solution, with 2.0 ml of volume. Figure 3.14 shows the
total time activity curve measured of the final solution, when it was transported into the
CRC®-55tW dose calibrator. The count rates were measured in mCi and recorded during a
period of 23 hours, with a time lapse of 2 minutes in each measurement. Error bars are
represented in some of the data, being 10% of the measured values.
Figure 3.14 Recorded count rates (logarithmic scale) of the third cyclotron production using a ZnCl2 solution.
The extrapolation of the half-life patterns of the produced isotopes was afterwards
conducted, with the results presented in Figure 3.15.

54 Results and Discussion
Figure 3.15 Non-linear regression curves, with the considered data of the produced isotopes 66Ga (a), 68Ga (b) and 13N (c). Representation of the three time-activity curves of
the identified isotopes (d).
The identified gallium isotopes are mainly produced by the nuclear reactions
66Zn(p,n)66Ga and 68Zn(p,n)68Ga. The used liquid target has also a high concentration of
water, rich in oxygen. Since the main oxygen isotope present is 16O, 13N can be highly
produced through the nuclear reaction 16O(p,α)13N. The high presence of 13N in the final
solution is therefore explained. All the identified isotopes decay by positron emission. Their
theoretical half-life periods are summarized in Table 3.3, compared to the experimentally
found.

Chapter 3 55
Table 3.3 Experimental and theoretical half-life values of the produced isotopes 66Ga, 68Ga and 13N.
Experimental t1/2 Theoretical t1/2
66Ga 8,28 ± 1,03 h 9,3 h [82]
68Ga 68,09 ± 0.28 mins 68 mins [31, 82]
13N 10,58 ± 0.03 mins 9,9 mins [21]
As observed in Table 3.3, the experimental and theoretical half-life values of the
identified isotopes are clearly proximate, although there is a considerable error when
analyzing multiple phase decays. The range of the standard deviation for the 66Ga half-life
period found is due to insufficient data recorded and considered for the analysis. Since this
isotope has a longer half-life, the data acquisition should be done for a longer period, in
order to reduce the standard deviation error. 68Ga production yield was calculated to be
163.73 ± 16.40 MBq (4.425 ± 0.44 mCi) at EOB.
The followed irradiation test had the purpose to target higher beam currents to the
zinc chloride solution, in order to achieve higher production yields. A solution volume of
1.6 ml was injected in the target chamber. The stability of the target pressure in cyclotron,
achieved by the smaller solution volume injected, allowed the irradiation with a proton
beam integrated current of 6 µA h. As before, the decay rate of the final solution was
recorded, in this case during a 25 hour period with the CRC®-55tW dose calibrator. The
extrapolation of the time-activity curves of the produced isotopes was later performed. The
analysis results are presented in Figure 3.16.

56 Results and Discussion
Figure 3.16 Non-linear regression curves, with the considered data of the produced isotopes 66Ga (a), 68Ga (b) and 13N (c).
The experimentally half-life values found are still very proximate to the theoretical
ones, mentioned in Table 3.3. 68Ga production yield was found to be 461.76 ± 46.62 MBq
(12.48 ± 1.26 mCi), for a t1/2 exp = 67.82 ± 0.50 min.
3.5.2. Gallium retention evaluation
After identification of the produced isotopes and 68Ga yields assessment, the
purification process needed to be tested. The final solution needs to pass through a
purification step, in order to separate the gallium ions. For this purpose, the final solution
was passed through an ion change resin, the Dowex 50W-X8, since it showed the best
retention results. Another reason for this resin to be considered for this final step is its
capacity to individually separate and extract zinc and gallium ions with different elution
steps [83]. It makes the Dowex 50W-X8 an excellent candidate for follow-up studies.
Chapter 3 57
Therefore, a final irradiation was conducted with similar conditions as the one before,
with an integrated current of 6 µA h during 30 minutes. The same concentration and
volume conditions for the zinc chloride target solutions were kept. The irradiated target
solution, diluted in 43 ml of ultrapure H2O, was afterwards passed through the resin
column (mass = 460 mg), with an approximate flow of 2 ml/min. Thereafter, the column
was placed in the CRC®-55tW dose calibrator. The decay rate was recorded during 40
hours, started 68 minutes after EOB.
Focusing on the gallium isotopes 66Ga and 68Ga, a half-life extrapolation analysis was
conducted. The non-linear regression results showed half-life values of 9.5 ± 0.2 hours and
67.4 ± 2.9 mins, with an initial production yield of 0.97 ± 0.10 mCi for 66Ga and 2.59 ±
0.28 mCi for 68Ga.
The resulting waste from the column retention step was also analyzed, in the same way
as before, with the COMECER® PET-dose calibrator, integrated in COMECER® MIP1-P1
hot-cell. The data recording started 92 minutes after EOB. In the analysis, no gallium half-
life patterns were identified. This corroborates the high absorption properties of the
Dowex resin to gallium.
Additionally, the Dowex resin and waste were submitted to a spectroscopy analysis, 4
days after irradiation. The goal was to evaluate the presence of 67Ga within both samples,
since its half-life is still suitable (t1/2 = 3.26 days) [75]. Its characteristic γ emission energies
and probabilities were shown in Table 2.6.
The Dowex resin and a 1 ml sample of the waste solution were separately analyzed in
the CRC®-55tW Well Counter, during 60 seconds of counting. The resulting spectra are
presented in Figure 3.17.

58 Results and Discussion
Figure 3.17 Well counter spectra of the Dowex resin used to retain gallium (a) and its waste solution, 1 ml sample (b).
The characteristic 67Ga γ-ray energies of 93, 185, 300 and 393 keV are easily identified
in the spectrum (a), where the registered net counts was 14728901 cpm (counts per minute).
When comparing it to the waste specter (b), the presence of the same energy level gammas
is uncertain, given the low net counts (18689 cpm). Even if considering that only 1 ml of
the total 45 ml waste solution was analyzed, the conclusion would be the same. If assuming
a rough estimation of 45 times more count events detected in the complete waste solution,
its total net counts would only represent 5.7 % of the net counts registered with the Dowex
resin.
If no significant levels of 67Ga were identified in the waste, it is possible to corroborate
the assumption that no significant levels of other gallium isotopes, such as 68Ga, were lost
in the resin absorption process.

Chapter 4 59
4. Conclusion
Since the past years, the use of 68Ga in PET radiopharmaceuticals has been showing
very positive results for the image detection of neuroendocrine tumours. Seeking easier and
less expensive methods for a high yield production of 68Ga is continuously desirable.
The present work had the goal to study the feasibility of a cyclotron production of
68Ga using a Zn-based liquid target. The target solution chosen was based on natural zinc
chloride salt.
A material study of niobium was performed in order to evaluate its resistance
conditions to zinc chloride solutions. The material is widely used in target chambers and
windows for different target productions due to its optimal physicochemical properties.
The results showed the corrosion effect of zinc chloride solutions, with the consequent
formation of oxide structures in the material surface. Nevertheless, the extreme conditions
of the exposure tests did not led to a destructive corrosion process on the samples surface,
as proved by the mass, SEM and EDS analyses. Besides, the target chamber should only be
exposed to the zinc chloride target solution for one hour per day, being thoroughly cleaned
between irradiations. Thus, niobium was considered suitable to sufficiently resist the
extreme conditions of the desired cyclotron target.
A degradation analysis of teflon, used to transport the irradiated solutions into hot-
cells, was conducted as well. Two teflon samples were dipped in zinc chloride solutions and
another in water for one month. The thermogravimetric analysis showed similar
temperature-degradation behaviors for both control and test samples. Consequently, this
proved the safety and resistance of the material for the transfer of the zinc chloride
solutions.
60 Conclusion
In order to ensure the purification of the gallium isotopes produced within the
irradiated target, different retention columns were studied. Initially, the columns were
tested with dilutions of 0.025 M HCl (from the 68Ge-68Ga generator elution) and 5 M ZnCl2
solutions with water. The results showed high gallium absorption levels for the Dowex
50W-X8 and Strata-XC ion exchange resins.
Initial irradiation test productions were conducted, ensuring the stability of the target
inside the cyclotron, target transportation procedure and isotope production yields,
specifically focusing on 68Ga. Its half-life pattern and correspondent production yields were
obtained by a non-linear regression method. The experiment achieved a result of 461.76 ±
46.62 MBq (12.48 ± 1.26 mCi) yield with a t1/2 exp = 67.82 ± 0.50 min. The target irradiation
was conducted with a proton beam integrated current of 6 µA h and a 1.6 ml target with a
solute/solvent ratio of 1 g of zinc chloride to 1 ml of H2O.
Ultimately, a final test procedure was done in order to evaluate the absorption of the
Dowex 50W-X8 ion exchange resin for gallium elements, this time for the irradiated target
solution. After the retention process, the resin analysis of the time-activity curves revealed
the gallium half-life periods of 9.5 ± 0.2 hours and 67.4 ± 2.9 mins. Furthermore, the
obtained production yields corresponded to 0.97 ± 0.10 mCi for 66Ga and 2.59 ± 0.28 mCi
for 68Ga. No gallium isotopes were identified in the waste. These findings were supported
from the spectroscopy analysis, four days after the final irradiation. 67Ga characteristic γ-ray
energies were highly detected in the resin, with no significant levels of the isotope present
in the waste solution.
The conducted tests and analysis proved the feasibility of 68Ga production in cyclotron,
using a zinc chloride target based solution, further ensuring high absorption levels of
gallium by a purification step using an ion exchange resin.

Chapter 5 61
5. Future Perspectives
Although the production of 68Ga with a zinc chloride liquid base target through a
proton irradiation was proved to be possible, there are still many aspects to study and
follow-up.
Additional studies should be performed in niobium to further evaluate the corrosion
process based on the effect of zinc chloride. It is important to understand this effect with
irradiation conditions (high pressure, temperature, agitation, etc.) on the niobium target
window used. A comparison to the analysis results presented in this work should be
performed.
Improving and optimizing the methods for 68Ga production is necessary for the
present approach to compete and surpass the traditional 68Ge-68Ga generator method. For
that purpose, higher concentrations of zinc chloride target solutions should be prepared,
taking advantage of the high solubility of ZnCl2 in water. Although the proton energies
used allow positive production yields, the beam conditions can still be improved. A study
on the reaction cross sections should be conducted to further evaluate the proton beam
energy range to achieve optimal 68Ga production yields. But more importantly, 68Ga
production should be done with a highly pure and enriched 68ZnCl2 solution target instead.
In addition to increasing the irradiation yields, fewer impurities are formed, facilitating the
later 68Ga purification and radiolabeling processes, as expected. Besides, the basis of this
work is to assess the possibility of producing and extract 68Ga for an optimal 68Zn(p,n)68Ga
reaction, initially evaluated with natZn.
One of the necessary goals to achieve in order to progress into a Zinc-68 enriched salt
solution is to separate and reuse the post-production zinc elements waste for other
irradiations. Otherwise, the elevated costs of the enriched solution would not be
compensated. To that end, zinc purification methods need to be investigated and fully
tested during several irradiations trials, using the same recovered zinc solution.

62 Future Perspectives
Despite the good results for the gallium absorption by using the Dowex 50W-X8 ion
exchange resin, different methods should also be studied and tested. The Dowex elution
with a 3.5 M HCl solution may not be suitable for the radiolabeling with DOTA peptides.
Adding a second purification step, or assessing other useful approaches to retain and
extract the produced 68Ga, such as testing the Strata-XC resin, can be more helpful.
It is also impetuous to label the produced 68Ga with DOTA peptides, since it is the
main goal of this cyclotron production. The procedure should be similar to the one used
with the 68Ge-68Ga generator. However, the quality control exams, such as high-
performance liquid chromatography (HPLC), will be important to clarify the purity and
label capacity of the final 68Ga product into radiopharmaceutical peptides.

63
References 1. Klöppel, G., Classification and pathology of gastroenteropancreatic neuroendocrine
neoplasms. Endocr Relat Cancer, 2011. 18 Suppl 1: p. S1-16.
2. Klöppel, G., A. Perren, and P.U. Heitz, The Gastroenteropancreatic Neuroendocrine Cell System and Its Tumors: The WHO Classification. Annals of the New York Academy of Sciences, 2004. 1014(1): p. 13-27.
3. Fraenkel, M., M.K. Kim, A. Faggiano, and G.D. Valk, Epidemiology of gastroenteropancreatic neuroendocrine tumours. Best Pract Res Clin Gastroenterol, 2012. 26(6): p. 691-703.
4. Kim, J., et al., Clinical features of 20 patients with curatively resected biliary neuroendocrine tumours. Dig Liver Dis, 2011. 43(12): p. 965-70.
5. Niederle, M.B. and B. Niederle, Diagnosis and treatment of gastroenteropancreatic neuroendocrine tumors: current data on a prospectively collected, retrospectively analyzed clinical multicenter investigation. Oncologist, 2011. 16(5): p. 602-13.
6. Tonnhofer, U., C. Balassy, C.A. Reck, A. Koller, and E. Horcher, Neuroendocrine tumor of the common hepatic duct, mimicking a choledochal cyst in a 6-year-old child. J Pediatr Surg, 2009. 44(6): p. E23-5.
7. Fernández-Cruz, L., J. Romero, R. Zelaya, C. Olvera, and L. Maglio, Surgical strategies for nonfunctioning neuroendocrine pancreatic tumors and for other pancreatic neoplasms associated with multiple endocrine neoplasia type 1. The American Journal of Surgery, 2007. 194(4): p. S143-S147.
8. Gabriel, M., et al., 68Ga-DOTA-Tyr3-Octreotide PET in Neuroendocrine Tumors: Comparison with Somatostatin Receptor Scintigraphy and CT. Journal of Nuclear Medicine, 2007. 48(4): p. 508-518.
9. Modlin, I.M., M. Pavel, M. Kidd, and B.I. Gustafsson, Review article: somatostatin analogues in the treatment of gastroenteropancreatic neuroendocrine (carcinoid) tumours. Aliment Pharmacol Ther, 2010. 31(2): p. 169-88.
10. Modlin, I.M., et al., Gastroenteropancreatic neuroendocrine tumours. The Lancet Oncology, 2008. 9(1): p. 61-72.
11. Rockall, A.G. and R.H. Reznek, Imaging of neuroendocrine tumours (CT/MR/US). Best Pract Res Clin Endocrinol Metab, 2007. 21(1): p. 43-68.
12. Seeram, E., Computed Tomography: Physical Principles and Recent Technical Advances. Journal of Medical Imaging and Radiation Sciences, 2010. 41(2): p. 87-109.
64 References
13. Akata, S., et al., Computed tomographic findings of large cell neuroendocrine carcinoma of the lung. Clin Imaging, 2007. 31(6): p. 379-84.
14. MacDonald-Jankowski, D.S., Magnetic Resonance Imaging. Part 1: the Basic Principles. Asian Journal of Oral and Maxillofacial Surgery, 2006. 18(3): p. 165-171.
15. Metz, D.C. and R.T. Jensen, Gastrointestinal neuroendocrine tumors: pancreatic endocrine tumors. Gastroenterology, 2008. 135(5): p. 1469-92.
16. Sundin, A., Radiological and nuclear medicine imaging of gastroenteropancreatic neuroendocrine tumours. Best Pract Res Clin Gastroenterol, 2012. 26(6): p. 803-18.
17. Pantaleo, M.A., et al., Conventional and novel PET tracers for imaging in oncology in the era of molecular therapy. Cancer Treat Rev, 2008. 34(2): p. 103-21.
18. van Loon, J., et al., Therapeutic implications of molecular imaging with PET in the combined modality treatment of lung cancer. Cancer Treat Rev, 2011. 37(5): p. 331-43.
19. Phelps, M.E., Positron emission tomography provides molecular imaging of biological processes.pdf. Inaugural Articles of the National Academy of Sciences, 2000.
20. Valk, P.E., D.L. Baily, D.W. Townsend, and M.N. Maisey, Positron Emission Tomography: Basic Sciences. 2003: Springer.
21. Zanzonico, P., Positron emission tomography: a review of basic principles, scanner design and performance, and current systems. Seminars in Nuclear Medicine, 2004. 34(2): p. 87-111.
22. Li, Z. and P.S. Conti, Radiopharmaceutical chemistry for positron emission tomography. Adv Drug Deliv Rev, 2010. 62(11): p. 1031-51.
23. E. Phelps, M., Positron emission tomography provides molecular imaging of biological processes. Inaugural Articles of the National Academy of Sciences, 2000.
24. Wadsak, W. and M. Mitterhauser, Basics and principles of radiopharmaceuticals for PET/CT. Eur J Radiol, 2010. 73(3): p. 461-9.
25. Tewson, T.J. and K.A. Krohn, PET radiopharmaceuticals state-of-the-art and future prospects. Seminars in Nuclear Medicine, 1998. 28(3): p. 221-234.
26. Unak, T., Recent advances in medical radionuclide production and future perspective of compact medical cyclotrons. Progres in Nuclear Energy, 1970. 37(1): p. 333-337.
27. Khan, M.U., et al., Clinical indications for Gallium-68 positron emission tomography imaging. Eur J Surg Oncol, 2009. 35(6): p. 561-7.
28. Sanchez-Crespo, A., Comparison of Gallium-68 and Fluorine-18 imaging characteristics in positron emission tomography. Appl Radiat Isot, 2013. 76: p. 55-62.
29. de Blois, E., et al., Characteristics of SnO2-based 68Ge/68Ga generator and aspects of radiolabelling DOTA-peptides. Appl Radiat Isot, 2011. 69(2): p. 308-15.

65
30. Prata, M.I., Gallium-68: A New Trend in PET Radiopharmacy. Current Radiopharmaceuticals, 2012. 5(3).
31. Sadeghi, M., T. Kakavand, S. Rajabifar, L. Mokhtari, and A. Rahimi-Nezhad, Cyclotron production of 68Ga via proton-induced reaction on 68Zn target. NUKLEONIKA, 2009. 54(1): p. 25-28.
32. Breeman, W.A., et al., (68)Ga-labeled DOTA-peptides and (68)Ga-labeled radiopharmaceuticals for positron emission tomography: current status of research, clinical applications, and future perspectives. Semin Nucl Med, 2011. 41(4): p. 314-21.
33. Al-Nahhas, A., et al., What can gallium-68 PET add to receptor and molecular imaging? Eur J Nucl Med Mol Imaging, 2007. 34(12): p. 1897-901.
34. Schreiter, N.F., et al., Cost comparison of 111In-DTPA-octreotide scintigraphy and 68Ga-DOTATOC PET/CT for staging enteropancreatic neuroendocrine tumours. Eur J Nucl Med Mol Imaging, 2012. 39(1): p. 72-82.
35. Modlin, I.M., M. Kidd, I. Latich, M.N. Zikusoka, and M.D. Shapiro, Current Status of Gastrointestinal Carcinoids. Gastroenterology, 2005. 128(6): p. 1717-1751.
36. Warner, R.R.P., Enteroendocrine Tumors Other Than Carcinoid: A Review of Clinically Significant Advances. Gastroenterology, 2005. 128(6): p. 1668-1684.
37. Rufini, V., M.L. Calcagni, and R.P. Baum, Imaging of neuroendocrine tumors. Semin Nucl Med, 2006. 36(3): p. 228-47.
38. Al-Nahhas, A., et al., Gallium-68 PET: A New Frontier in Receptor Cancer Imaging. ANTICANCER RESEARCH, 2007. 27: p. 4087-4094.
39. Wild, D., et al., Comparison of 68Ga-DOTANOC and 68Ga-DOTATATE PET/CT within patients with gastroenteropancreatic neuroendocrine tumors. J Nucl Med, 2013. 54(3): p. 364-72.
40. de Araujo, E.B., et al., A comparative study of 131I and 177Lu labeled somatostatin analogues for therapy of neuroendocrine tumours. Appl Radiat Isot, 2009. 67(2): p. 227-33.
41. Grozinsky-Glasberg, S., A.B. Grossman, and M. Korbonits, The role of somatostatin analogues in the treatment of neuroendocrine tumours. Mol Cell Endocrinol, 2008. 286(1-2): p. 238-50.
42. Theodoropoulou, M. and G.K. Stalla, Somatostatin receptors: From signaling to clinical practice. Front Neuroendocrinol, 2013. 34(3): p. 228-52.
43. Capello, A., E.P. Krenning, W.A. Breeman, B.F. Bernard, and M. de Jong, Peptide Receptor Radionuclide Therapy In Vitro Using [111In-DTPA0]Octreotide. J Nucl Med, 2003. 44: p. 98-104.
44. Fanti, S., et al., Evaluation of unusual neuroendocrine tumours by means of 68Ga-DOTA-NOC PET. Biomed Pharmacother, 2008. 62(10): p. 667-71.

66 References
45. Banerjee, S.R. and M.G. Pomper, Clinical applications of Gallium-68. Appl Radiat Isot, 2013. 76: p. 2-13.
46. Decristoforo, C., R.D. Pickett, and A. Verbruggen, Feasibility and availability of (6)(8)Ga-labelled peptides. Eur J Nucl Med Mol Imaging, 2012. 39 Suppl 1: p. S31-40.
47. Veksler, V.A., Principles of acceleration of charged particles. The Soviet Journal of Atomic Energy, 1996. 1(1): p. 77-83.
48. Ibrahim, M.M., Control and characterization of a Cyclotron proton beam, 2010, University of Missouri-Columbria.
49. King, B.T., A Preliminary design for a small permanent magnet Cyclotron, in Department of Physics2003, Houghton College.
50. Strickmans, K., The isochronous cyclotron: principles and recent developments. Computerized Medical Imaging and Graphics, 2000. 25: p. 69-78.
51. Halgamunge, M.N., Effect of Cyclotron Resonance Frequencies in Particles Due to AC and DC Electromagnetic Fields. International Journal of Electrical and Computer Engineering, 2010. 5(3).
52. Doster, J.M., Deployment, Testing and Analysis of Advanced Thermosyphon Target Systems for Production of Aqueous [18F]Fluoride via 18O(p,n)18F, 2008: North Carolina State University.
53. Cloquet, C., J. Carignan, M.F. Lehmann, and F. Vanhaecke, Variation in the isotopic composition of zinc in the natural environment and the use of zinc isotopes in biogeosciences: a review. Anal Bioanal Chem, 2008. 390(2): p. 451-63.
54. Lide, D.R., ed., CRC Handbook of Chemistry and Physics. 2005.
55. Jakubke , H.-D., ed, Concise Encyclopedia Chemistry. 1994.
56. Holeman, A.F., Inorganic chemistry, ed. E. Wiberg and N. Wiberg. 2001, San Diego: Academic Press.
57. Graham, R.A. and R.C. Sutherlin, Niobium and Niobium alloys in corrosive applications, Wah Chang, An Allegheny Technologies Company.
58. Zeisler, S.K., D.W. Becker, R.A. Pavan, R. Moschel, and H. Rühle, A water-cooled spherical niobium target for the production of [18F]fluoride. Applied Radiation and Isotopes, 2000. 53(3): p. 449-453.
59. Kim, D.H., S.J. Kim, and S.K. Oh, Image improvement with modified scanning waves and noise reduction in a scanning electron microscope. Nuclear Instruments and Methods in Physics Research, 2010. 620: p. 112-120.
60. Bogner, A., P.H. Jouneau, G. Thollet, D. Basset, and C. Gauthier, A history of scanning electron microscopy developments: towards "wet-STEM" imaging. Micron, 2007. 38(4): p. 390-401.

67
61. Hollerith, C., et al., Energy dispersive X-ray spectroscopy with microcalorimeters. Nuclear Instruments and Methods in Physics Research Section A: Accelerators, Spectrometers, Detectors and Associated Equipment, 2004. 520(1-3): p. 606-609.
62. Saito, F., et al., Electrochemical transfer of (18)F from (18)O water to aprotic polar solvent. Appl Radiat Isot, 2007. 65(5): p. 524-7.
63. Brown, E.N. and D.M. Dattelbaum, The role of crystalline phase on fracture and microstructure evolution of polytetrafluoroethylene (PTFE). Polymer, 2005. 46(9): p. 3056-3068.
64. Stawski, D., The effect of sample weight in thermogravimetric analysis of low viscosity polypropylene in air atmosphere. Polymer Testing, 2009. 28(2): p. 223-225.
65. Anandhan, S., Thermal Analysis, 2012, Dept. of Met. and Mat. Engg., NITK.
66. Damartzis, T., D. Vamvuka, S. Sfakiotakis, and A. Zabaniotou, Thermal degradation studies and kinetic modeling of cardoon (Cynara cardunculus) pyrolysis using thermogravimetric analysis (TGA). Bioresour Technol, 2011. 102(10): p. 6230-8.
67. Alchin, D., Ion exchange resins. New Zeland Institue of Chemistry, 2008.
68. Persson, M., J. Madsen, S. Ostergaard, M. Ploug, and A. Kjaer, 68Ga-labeling and in vivo evaluation of a uPAR binding DOTA- and NODAGA-conjugated peptide for PET imaging of invasive cancers. Nucl Med Biol, 2012. 39(4): p. 560-9.
69. Das, M.K., S. Chattopadhayay, B.R. Sarkar, and N. Ramamoorthy, A Cation Exchange Method for Separation of llln from Inactive Silver, Copper, Traces of Iron and Radioactive Gallium and Zinc Isotopes. Applied Radiation and Isotopes, 1996. 48(1): p. 11-14.
70. Massoud, A., F. Abou El-Nour, H. Killa, and U. Seddik, Chromatographic separation of In(III) from Cd(II) in aqueous solutions using commercial resin (Dowex 50W-X8). Central European Journal of Chemistry, 2010. 8(3): p. 696-701.
71. Chattopadhayay, S., M.K. Das, B.R. Sarkar, and N. Ramamoorthy, Simple procedure for the preparation of iron-free 67Ga from an irradiated copper target—Use of ascorbic acid. Appl. Radiat. Isot., 1997. 48(2): p. 211-212.
72. Levkovskij, V.N., Activation cross section nuclides of average masses (A=40-100)by protons and alpha-particles with average energies (E=10-50 MeV). 1991, Moscow: Levkovskij.
73. Al-Saleh, F.S., K.S. Al Mugren, and A. Azzam, Excitation function measurements and integral yields estimation for natZnp,x reactions at low energies. Appl Radiat Isot, 2007. 65(10): p. 1101-7.
74. Simpson, B.R.S. and T.P. Ntsoane, Decay scheme of 67Ga. Applied Radiation and Isotopes, 2000. 52(2000): p. 551-556.
75. Yalcin, P. and Y. Kurucu, Emission probabilities of K X- and gamma-rays following 51Cr and 67Ga decay. Appl Radiat Isot, 2005. 62(1): p. 63-7.

68 References
76. Bieber, R., C. Wagemans, and G. Goemine, Thermal neutron induced (n,p) and (n,a) reactions on 37Ar. Nuclear Physics A, 1999. 647: p. 3-11.
77. Matsumoto, J., Electrochemistry of intermetallic phases of Ni-Cr-Fe alloys in aqueous environment, in Department of Nuclear Engineering1982, Waseda University: Tokyo, Japan.
78. Vasiliovych, C., Attempts for the electrodeposition of niobium from ionic liquids, 2010, Università Degli Studi di Padova: Istituto Nazionale di Fisica Nucleare.
79. Palacios, C., K. Wigertz, B. Martin, and C.M. Weaver, Sweat mineral loss from whole body, patch and arm bag in white and black girls. Nutrition Research, 2003. 23(3): p. 401-411.
80. Jeske, H., A. Schirp, and F. Cornelius, Development of a thermogravimetric analysis (TGA) method for quantitative analysis of wood flour and polypropylene in wood plastic composites (WPC). Thermochimica Acta, 2012. 543: p. 165-171.
81. Chipara, M., K. Lozano, A. Hernandez, and M. Chipara, TGA analysis of polypropylene–carbon nanofibers composites. Polymer Degradation and Stability, 2008. 93(4): p. 871-876.
82. Engle, J.W., et al., Very high specific activity (6)(6)/(6)(8)Ga from zinc targets for PET. Appl Radiat Isot, 2012. 70(8): p. 1792-6.
83. Martins, P., Desenvolvimento de método para separação química de Gálio-67 pela técnica de difusão térmica, in Instituto de Pesquisas Energéticas e Nucleares2012, Universidade de São Paulo.


![Review The Search for an Alternative to [ Ga]Ga-DOTA-TATE ...thno.org/v09p1336.pdf · [68Ga]Ga-DOTA-TATE, [68Ga]Ga-DOTA-TOC, and [68Ga]Ga-DOTA-NOC allows for NET staging with high](https://img.pdfslide.net/doc/110x75/5e2a1b5b2104573c786ad22c/review-the-search-for-an-alternative-to-gaga-dota-tate-thnoorg-68gaga-dota-tate.jpg)


![GMP-compliant production of [68Ga]Ga-NeoB for positron](https://img.pdfslide.net/doc/110x75/61b2306e3e680e78ed311d79/gmp-compliant-production-of-68gaga-neob-for-positron-.jpg)