Embed Size (px)
Citation preview

Cyfrowy Polsat S.A. Capital Group
Cyfrowy Polsat Group Investor Presentation
July 2016

1. Polsat Group: unique composition of media and telco assets
3
tv production
mobile operator
satelite pay-TV
cross-selling opportunities
online video
Multiplay product
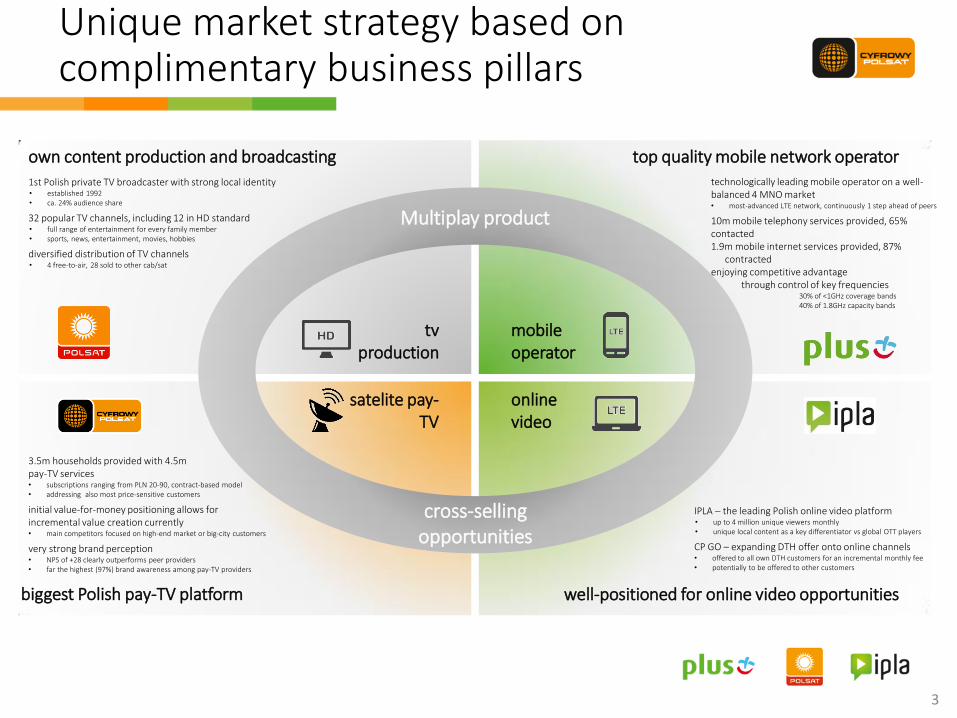
own content production and broadcasting top quality mobile network operator
biggest Polish pay-TV platform well-positioned for online video opportunities
technologically leading mobile operator on a well-balanced 4 MNO market • most-advanced LTE network, continuously 1 step ahead of peers
10m mobile telephony services provided, 65% contacted 1.9m mobile internet services provided, 87% contracted enjoying competitive advantage through control of key frequencies
30% of <1GHz coverage bands 40% of 1.8GHz capacity bands
3.5m households provided with 4.5m pay-TV services • subscriptions ranging from PLN 20-90, contract-based model • addressing also most price-sensitive customers
initial value-for-money positioning allows for incremental value creation currently • main competitors focused on high-end market or big-city customers
very strong brand perception • NPS of +28 clearly outperforms peer providers • far the highest (97%) brand awareness among pay-TV providers
1st Polish private TV broadcaster with strong local identity • established 1992 • ca. 24% audience share
32 popular TV channels, including 12 in HD standard • full range of entertainment for every family member • sports, news, entertainment, movies, hobbies
diversified distribution of TV channels • 4 free-to-air, 28 sold to other cab/sat
IPLA – the leading Polish online video platform • up to 4 million unique viewers monthly • unique local content as a key differentiator vs global OTT players
CP GO – expanding DTH offer onto online channels • offered to all own DTH customers for an incremental monthly fee • potentially to be offered to other customers
Unique market strategy based on complimentary business pillars
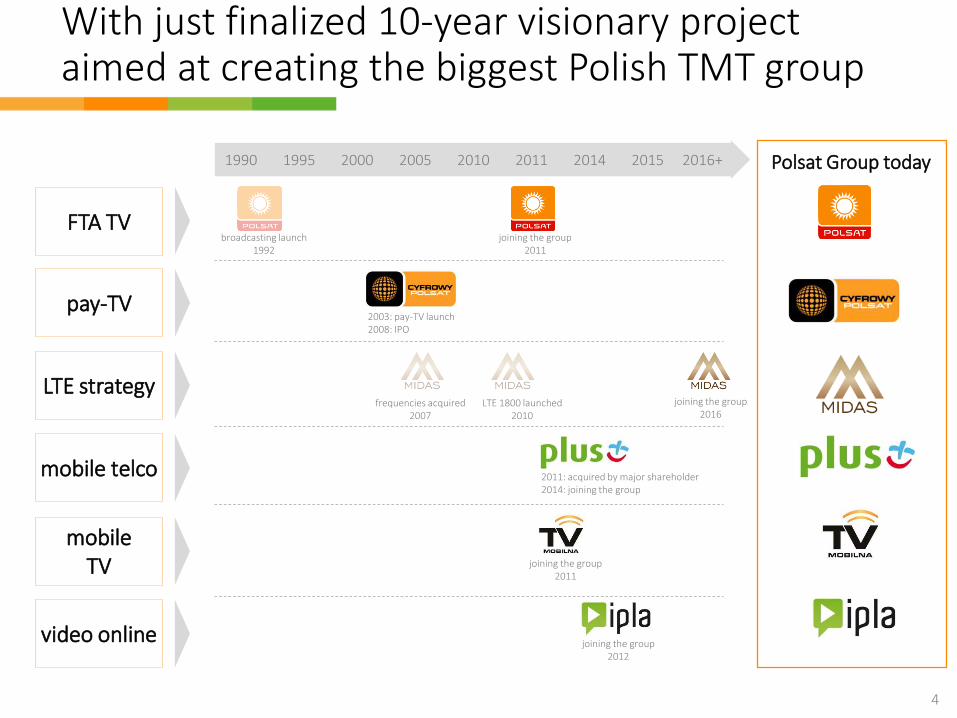
With just finalized 10-year visionary project aimed at creating the biggest Polish TMT group
4
pay-TV
FTA TV
LTE strategy
mobile telco
1990 1995 2000 2005 2010 2011 2014 2015 2016+
broadcasting launch 1992
joining the group 2011
2003: pay-TV launch 2008: IPO
2011: acquired by major shareholder 2014: joining the group
mobile TV
LTE 1800 launched 2010
frequencies acquired 2007
joining the group 2016
joining the group 2011
video online joining the group 2012
Polsat Group today
With just finalized 10-year visionary project aimed at creating the biggest Polish TMT group
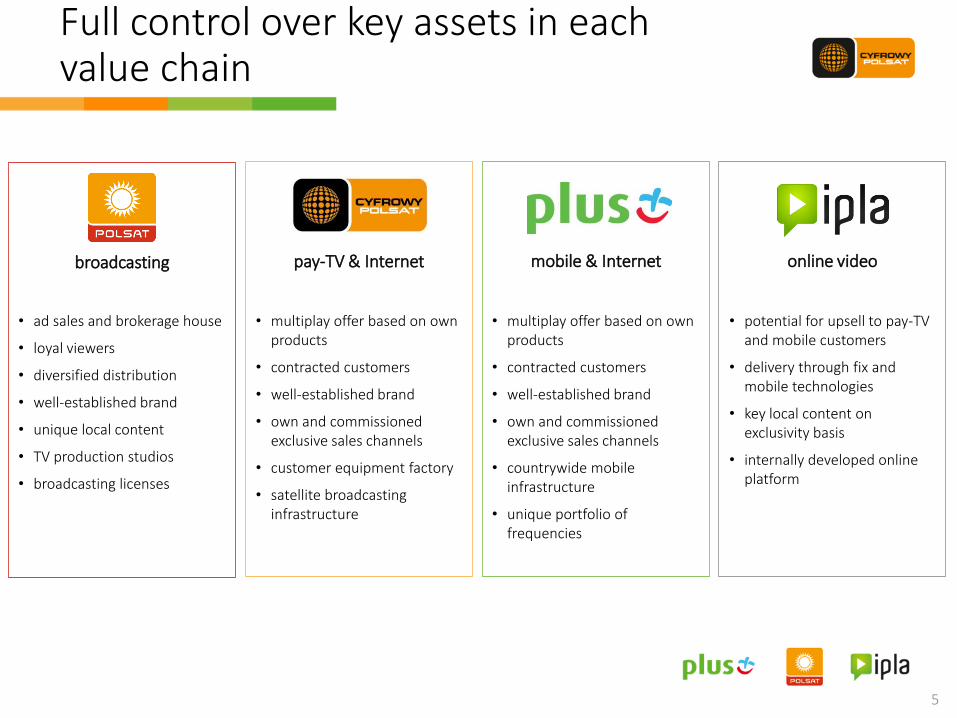
Full control over key assets in each value chain
5
pay-TV & Internet
online video
mobile & Internet
broadcasting
• ad sales and brokerage house
• loyal viewers
• diversified distribution
• well-established brand
• unique local content
• TV production studios
• broadcasting licenses
• multiplay offer based on own products
• contracted customers
• well-established brand
• own and commissioned exclusive sales channels
• customer equipment factory
• satellite broadcasting infrastructure
• multiplay offer based on own products
• contracted customers
• well-established brand
• own and commissioned exclusive sales channels
• countrywide mobile infrastructure
• unique portfolio of frequencies
• potential for upsell to pay-TV and mobile customers
• delivery through fix and mobile technologies
• key local content on exclusivity basis
• internally developed online platform

Successfully addressing market segments with a growth potential
6
underdeveloped Polish multiplay market LTE successfully competes with fixed access
focus on rural customers was a bull’s-eye hit
37%
50% 45%
50% 51% 51%
63% 69%
87%
Poland EU Germany Sweden Spain UK France Belgium TheNetherlands
geolocalization of the Polish society…
…and our multiplay customers
28% 46%
52% 72%
54%
48% 9,0
10,1 11,3
12,2 13,3 13,8 14,4 15,0 15,6 16,1 16,6
2010 2011 2012 2013 2014 2015 2016 2017 2018 2019 2020
mobile access fixed access
2010: LTE pioneered by Polsat Group
53% of society in rural & suburban areas
73%: our offer effectively targets this segment
multiplay almost non-existent in rural areas
rural
cities <20k
cities 20-49k
cities 50-99k
cities 100-199k
cities >200k
Poland: a largely scattered country
2003: CP launches DTH offer
Source: PMR, company’s data, operator’s reports, UKE based on E-Communications and the Digital Single Market, Special Eurobarometr 438, European Commission, May 2016
6% 31% 33%
84%
48%
46% 6,7 6,8 7,2 8,1
8,8
10,2 11,0 11,5 11,7
11,0 11,0 11,1
2004 2005 2006 2007 2008 2009 2010 2011 2012 2013 2014 2015
Cyfrowy Polsat other DTH providers cable and IPTV
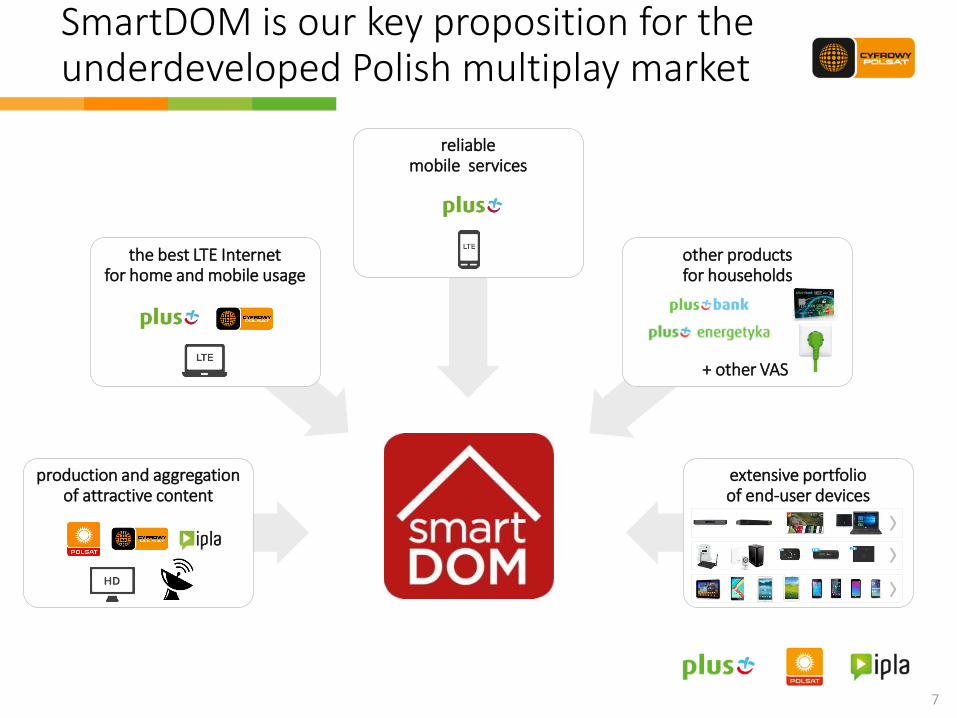
production and aggregation of attractive content
the best LTE Internet for home and mobile usage
reliable mobile services
other products for households
extensive portfolio of end-user devices
7
› › ›
SmartDOM is our key proposition for the underdeveloped Polish multiplay market
+ other VAS
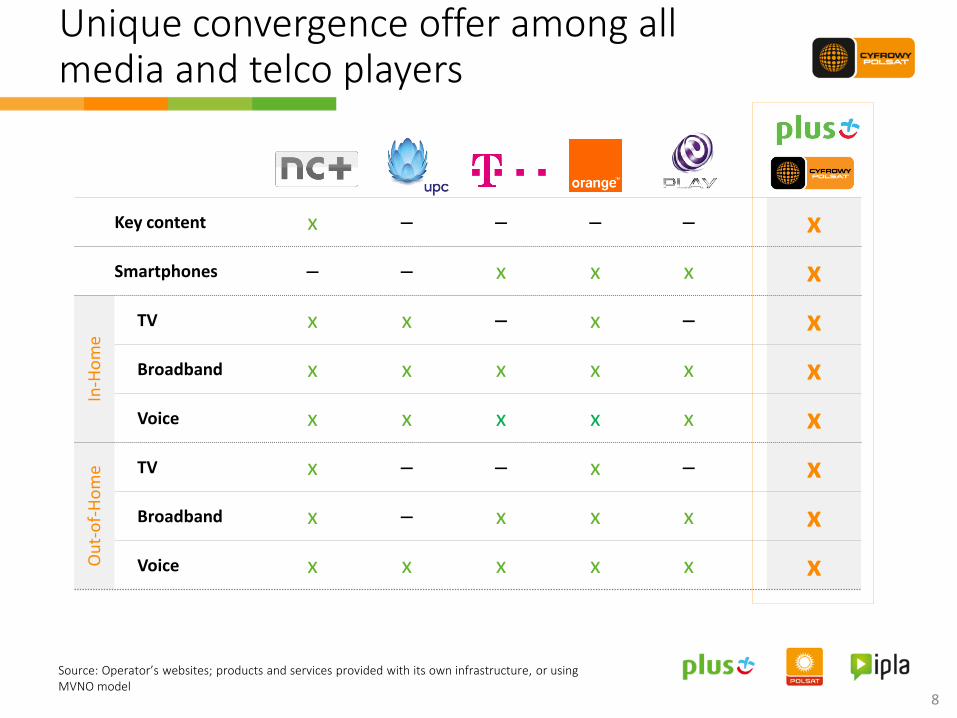
Unique convergence offer among all media and telco players
8
Key content x – – – – x
Smartphones – – x x x x
In-H
om
e
TV x x – x – x
Broadband x x x x x x
Voice x x x x x x
Ou
t-o
f-H
om
e TV x – – x – x
Broadband x – x x x x
Voice x x x x x x
Source: Operator’s websites; products and services provided with its own infrastructure, or using MVNO model

2. Merging two customer bases provides our opportunity
10
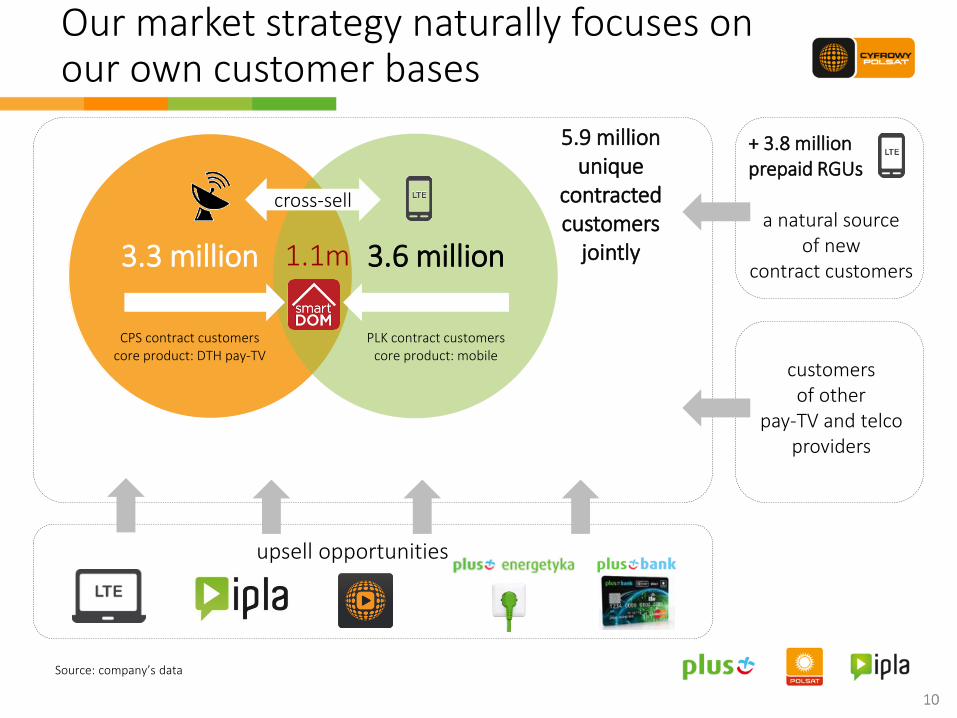
Our market strategy naturally focuses on our own customer bases
10
3.3 million
CPS contract customers core product: DTH pay-TV
3.6 million
PLK contract customers core product: mobile
1.1m
+ 3.8 million prepaid RGUs
a natural source
of new contract customers
5.9 million unique
contracted customers
jointly
upsell opportunities
cross-sell
Source: company’s data
customers of other
pay-TV and telco providers
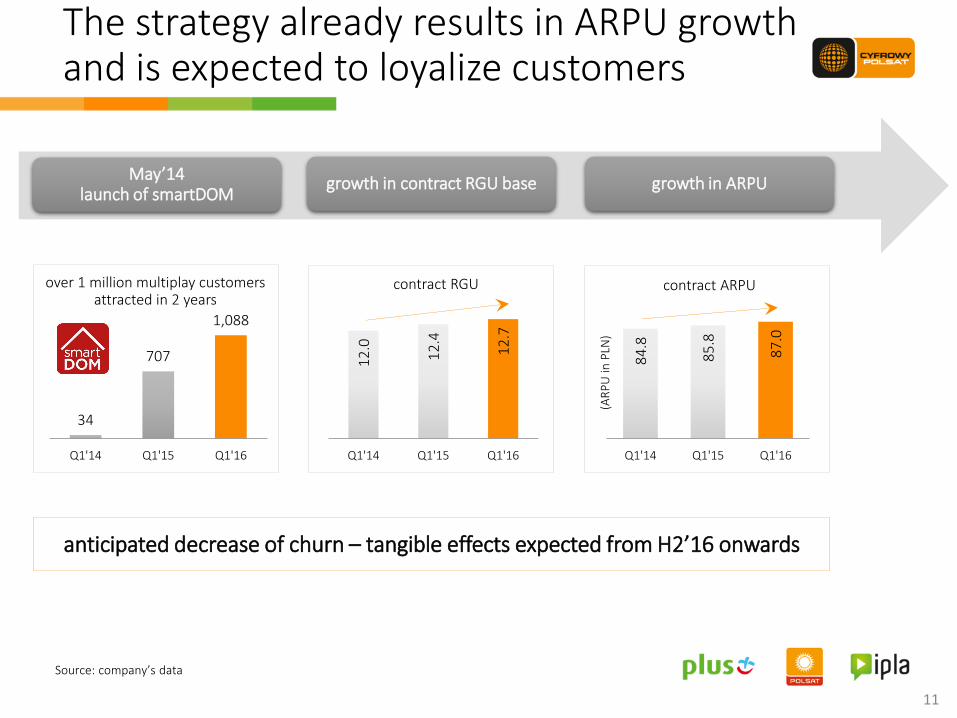
84
.8
85
.8
87
.0
Q1'14 Q1'15 Q1'16
11
34
707
1,088
Q1'14 Q1'15 Q1'16
12
.0
12
.4
12
.7
Q1'14 Q1'15 Q1'16
(AR
PU
in P
LN)
The strategy already results in ARPU growth and is expected to loyalize customers
over 1 million multiplay customers attracted in 2 years
contract RGU contract ARPU
May’14 launch of smartDOM
growth in contract RGU base growth in ARPU
anticipated decrease of churn – tangible effects expected from H2’16 onwards
Source: company’s data
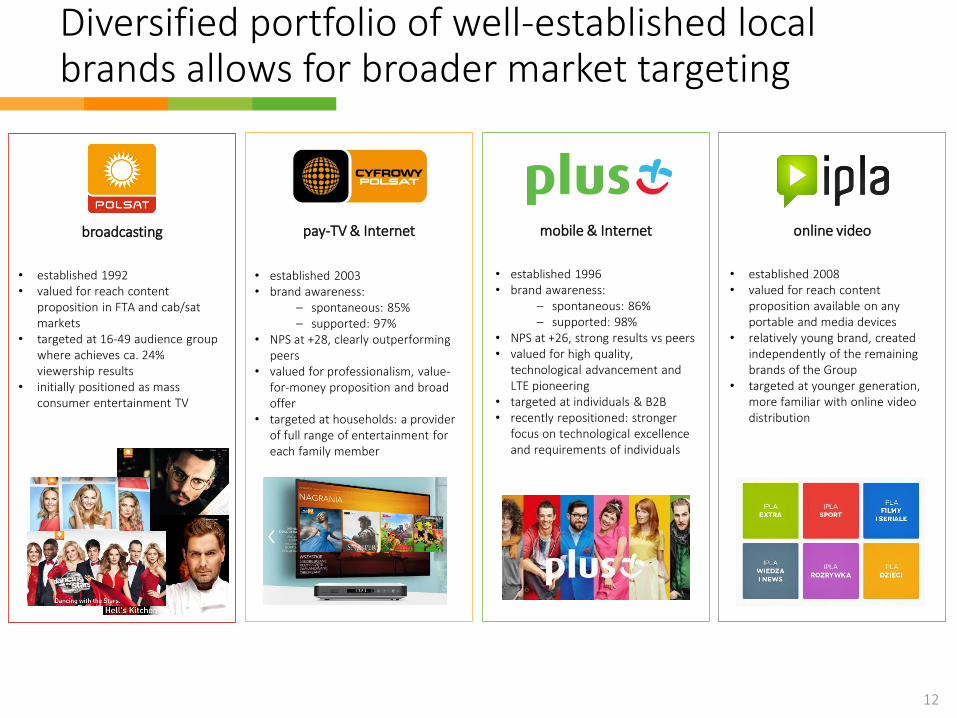
pay-TV & Internet
online video
mobile & Internet
broadcasting
Diversified portfolio of well-established local brands allows for broader market targeting
12
• established 1992 • valued for reach content
proposition in FTA and cab/sat markets
• targeted at 16-49 audience group where achieves ca. 24% viewership results
• initially positioned as mass consumer entertainment TV
• established 2003 • brand awareness:
– spontaneous: 85% – supported: 97%
• NPS at +28, clearly outperforming peers
• valued for professionalism, value-for-money proposition and broad offer
• targeted at households: a provider of full range of entertainment for each family member
• established 1996 • brand awareness:
– spontaneous: 86% – supported: 98%
• NPS at +26, strong results vs peers • valued for high quality,
technological advancement and LTE pioneering
• targeted at individuals & B2B • recently repositioned: stronger
focus on technological excellence and requirements of individuals
• established 2008 • valued for reach content
proposition available on any portable and media devices
• relatively young brand, created independently of the remaining brands of the Group
• targeted at younger generation, more familiar with online video distribution

3. Resilient business model with strong cash generation
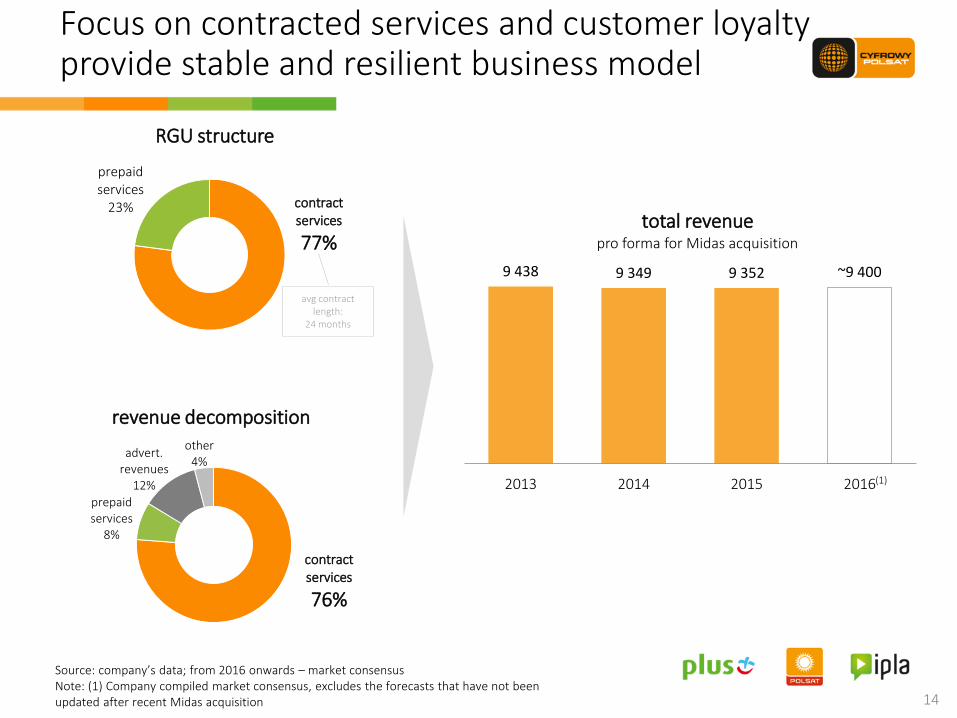
Focus on contracted services and customer loyalty provide stable and resilient business model
14
RGU structure
revenue decomposition
contract services
77%
prepaid services
23%
contract services
76%
prepaid services
8%
advert. revenues
12%
other 4%
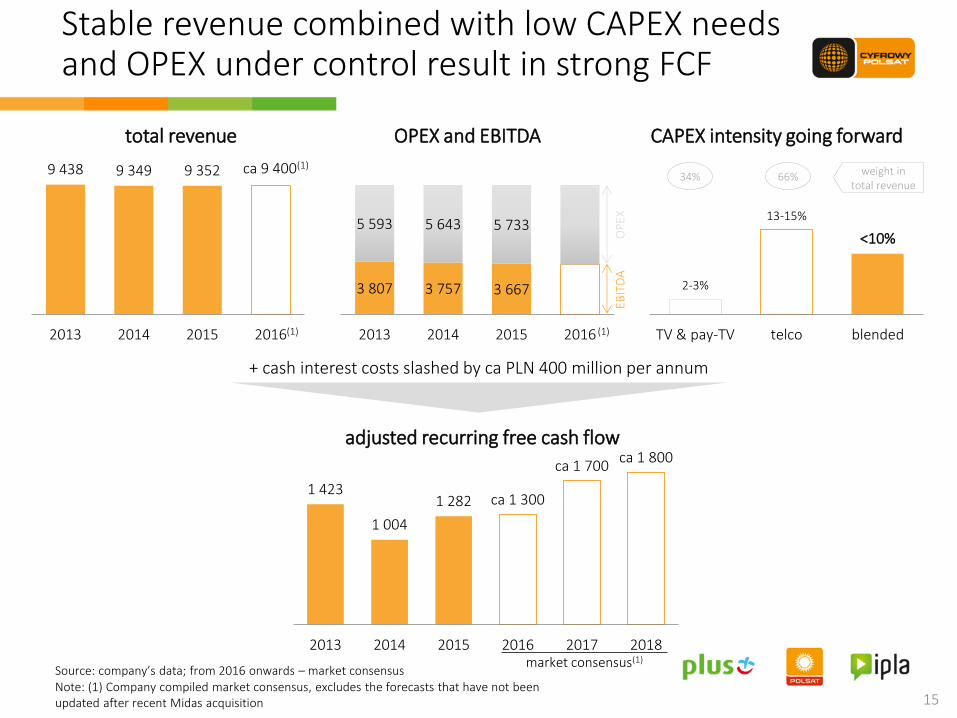
9 438 9 349 9 352 ~9 400
2013 2014 2015 2016
total revenue pro forma for Midas acquisition
avg contract length:
24 months
Source: company’s data; from 2016 onwards – market consensus Note: (1) Company compiled market consensus, excludes the forecasts that have not been updated after recent Midas acquisition
(1)
15
Source: company’s data; from 2016 onwards – market consensus
2-3%
13-15%
<10%
TV & pay-TV telco blended
Stable revenue combined with low CAPEX needs and OPEX under control result in strong FCF
9 438 9 349 9 352
2013 2014 2015 2016
total revenue
3 807 3 757 3 667
5 593 5 643 5 733
2013 2014 2015 2016
OPEX and EBITDA CAPEX intensity going forward
+ cash interest costs slashed by ca PLN 400 million per annum
34% weight in total revenue
1 423
1 004
1 282 ca 1 300
ca 1 700 ca 1 800
2013 2014 2015 2016 2017 2018
adjusted recurring free cash flow
66%
market consensus(1)
Note: (1) Company compiled market consensus, excludes the forecasts that have not been updated after recent Midas acquisition
ca 9 400(1)
OP
EX
EBIT
DA
(1) (1)
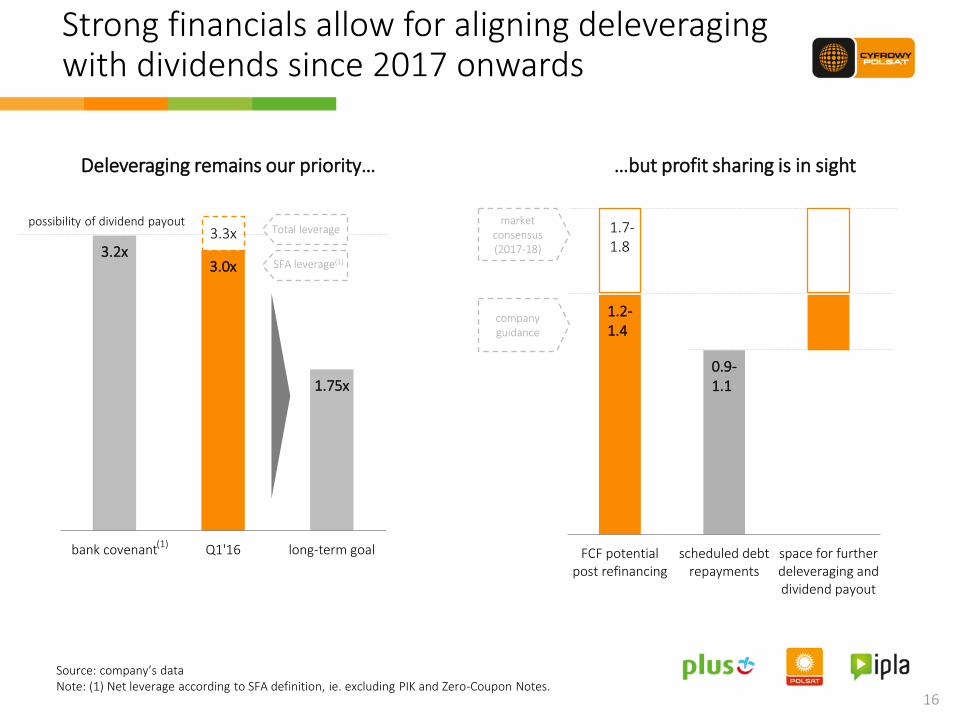
3.2x 3.0x
1.75x
bank covenant Q1'16 long-term goal
1.2- 1.4-
0.9- 1.1-
FCF potentialpost refinancing
scheduled debtrepayments
space for furtherdeleveraging anddividend payout
Strong financials allow for aligning deleveraging with dividends since 2017 onwards
16
Deleveraging remains our priority…
possibility of dividend payout
…but profit sharing is in sight
1.7-1.8-
market consensus (2017-18)
company guidance
(1)
Source: company’s data Note: (1) Net leverage according to SFA definition, ie. excluding PIK and Zero-Coupon Notes.
3.3x Total leverage
SFA leverage(1)

4. Strong track record

CPS stock performance since IPO compared to WSE indexes
0%
50%
100%
150%
200%
250%
May-08
Jul-08
Sep-08
Nov-08
Jan-09
Mar-09
May-09
Jul-09
Sep-09
Nov-09
Jan-10
Mar-10
May-10
Jul-10
Sep-10
Nov-10
Jan-11
Mar-11
May-11
Jul-11
Sep-11
Nov-11
Jan-12
Mar-12
May-12
Jul-12
Sep-12
Nov-12
Jan-13
Mar-13
May-13
Jul-13
Sep-13
Nov-13
Jan-14
Mar-14
May-14
Jul-14
Sep-14
Nov-14
Jan-15
Mar-15
May-15
Jul-15
Sep-15
Nov-15
Jan-16
Mar-16
May-16
CPS WIG WIG-Media Orange WIG-Telkom
Our strategic investments impacted positively value of Polsat Group
Note: (1) Growth between May 6, 2008 and June 20, 2016
18
0%(1)
5%(1)
62%(1)
76%(1)
44%(1)
joining the group 2011
joining the group 2014
joining the group 2016
IPO 2008
Indexed: May 6, 2008 = 100
joining the group 2012

2011 2012 2013 2014 2015 2016 2017
S&P Moody's
Interests of our debtholders is equally important for us
19
joining the group 2014
joining the group 2016
ratings assigned
2011
BB+
BB
BB-
BBB-
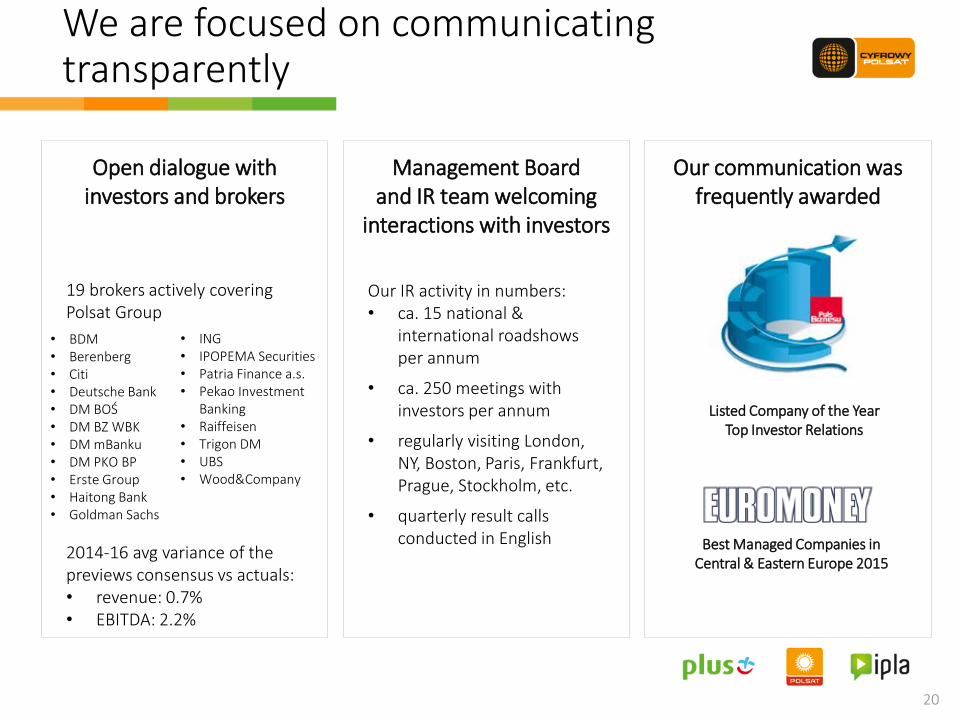
19 brokers actively covering Polsat Group
2014-16 avg variance of the previews consensus vs actuals: • revenue: 0.7% • EBITDA: 2.2%
20
We are focused on communicating transparently
Our communication was frequently awarded
Open dialogue with investors and brokers
Management Board and IR team welcoming
interactions with investors
Our IR activity in numbers: • ca. 15 national &
international roadshows per annum
• ca. 250 meetings with investors per annum
• regularly visiting London, NY, Boston, Paris, Frankfurt, Prague, Stockholm, etc.
• quarterly result calls conducted in English Best Managed Companies in
Central & Eastern Europe 2015
Listed Company of the Year Top Investor Relations
• BDM • Berenberg • Citi • Deutsche Bank • DM BOŚ • DM BZ WBK • DM mBanku • DM PKO BP • Erste Group • Haitong Bank • Goldman Sachs
• ING • IPOPEMA Securities • Patria Finance a.s. • Pekao Investment
Banking • Raiffeisen • Trigon DM • UBS • Wood&Company
5. Appendix

Current market position on individual markets
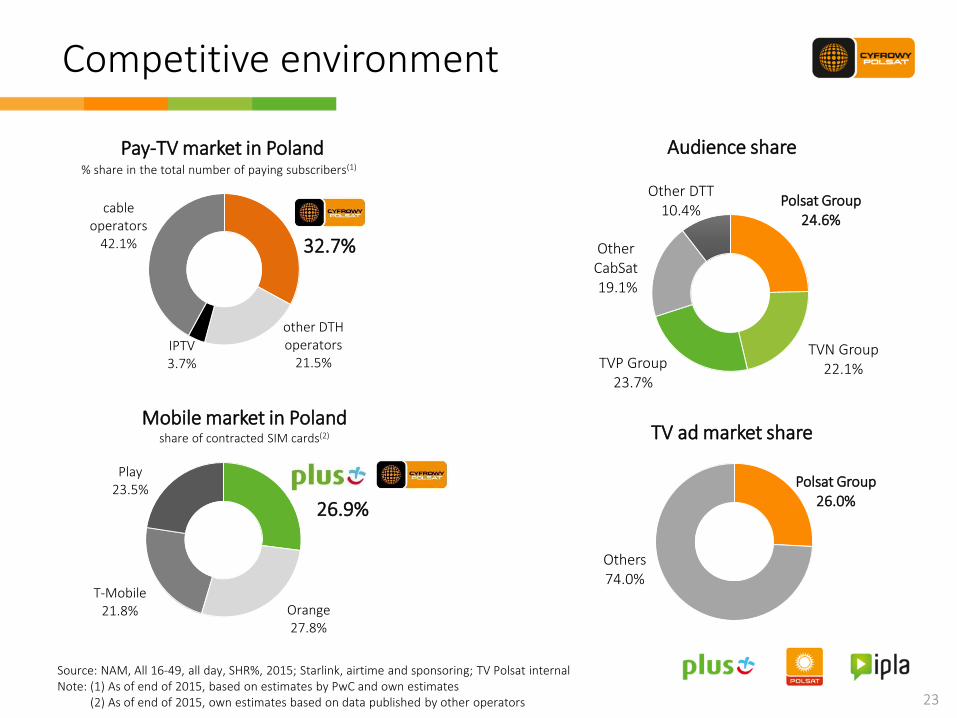
26.9%
Orange 27.8%
T-Mobile 21.8%
Play 23.5%
Competitive environment
23
Pay-TV market in Poland
Mobile market in Poland
share of contracted SIM cards(2)
32.7%
other DTH operators
21.5%
IPTV 3.7%
cable operators
42.1%
Source: NAM, All 16‐49, all day, SHR%, 2015; Starlink, airtime and sponsoring; TV Polsat internal Note: (1) As of end of 2015, based on estimates by PwC and own estimates (2) As of end of 2015, own estimates based on data published by other operators
% share in the total number of paying subscribers(1)
Audience share
TV ad market share
Polsat Group 26.0%
Others 74.0%
Polsat Group 24.6%
TVN Group 22.1% TVP Group
23.7%
Other CabSat 19.1%
Other DTT 10.4%
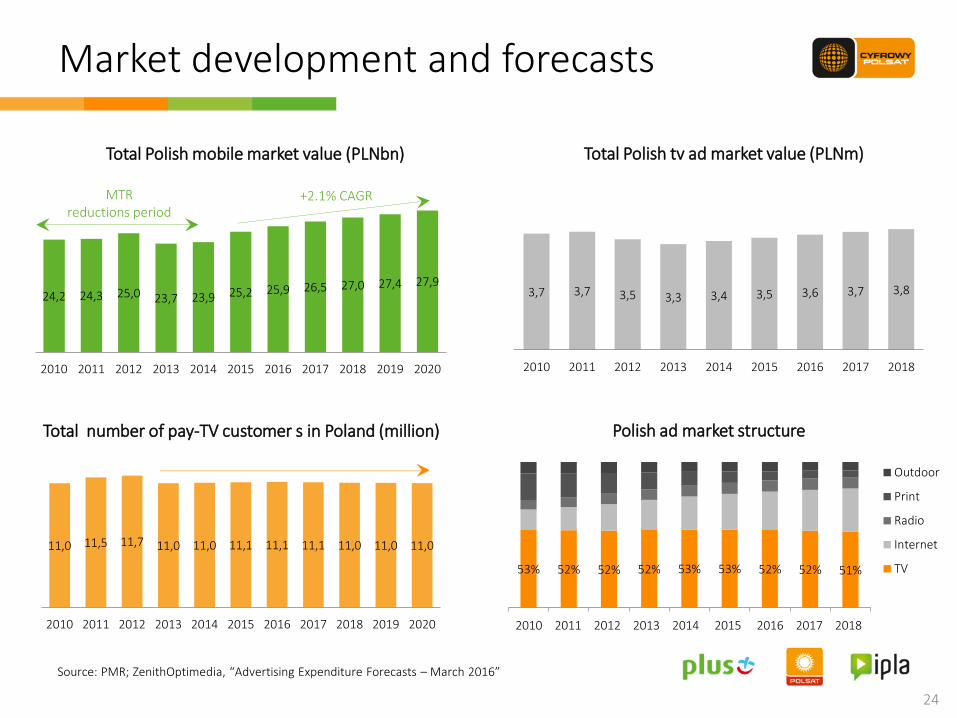
11,0 11,5 11,7 11,0 11,0 11,1 11,1 11,1 11,0 11,0 11,0
2010 2011 2012 2013 2014 2015 2016 2017 2018 2019 2020
3,7 3,7 3,5 3,3 3,4 3,5 3,6 3,7 3,8
2010 2011 2012 2013 2014 2015 2016 2017 2018
24
Source: PMR; ZenithOptimedia, “Advertising Expenditure Forecasts – March 2016”
Market development and forecasts
24,2 24,3 25,0 23,7 23,9 25,2 25,9 26,5 27,0 27,4 27,9
2010 2011 2012 2013 2014 2015 2016 2017 2018 2019 2020
Total Polish mobile market value (PLNbn)
+2.1% CAGR
Total number of pay-TV customer s in Poland (million)
MTR reductions period
Total Polish tv ad market value (PLNm)
Polish ad market structure
53% 52% 52% 52% 53% 53% 52% 52% 51%
1 2 3 4 5 6 7 8 9
Outdoor
Radio
Internet
TV
2010 2011 2012 2013 2014 2015 2016 2017 2018

Long-term business performance trends
26
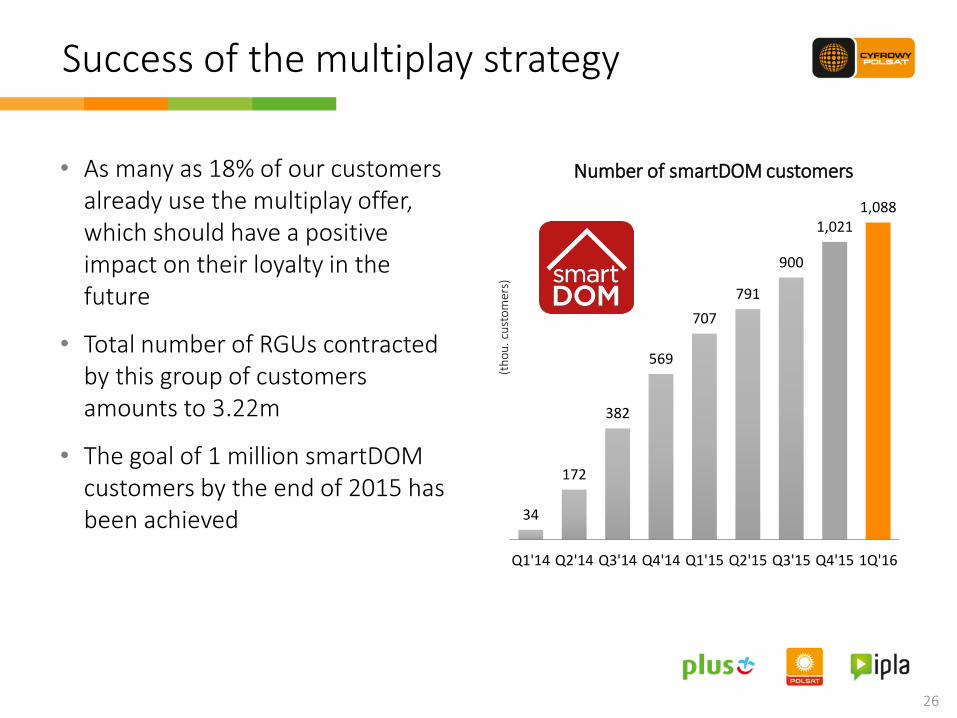
Success of the multiplay strategy
34
172
382
569
707
791
900
1,021 1,088
Q1'14 Q2'14 Q3'14 Q4'14 Q1'15 Q2'15 Q3'15 Q4'15 1Q'16
(th
ou
. cu
sto
mer
s)
Number of smartDOM customers • As many as 18% of our customers already use the multiplay offer, which should have a positive impact on their loyalty in the future
• Total number of RGUs contracted by this group of customers amounts to 3.22m
• The goal of 1 million smartDOM customers by the end of 2015 has been achieved
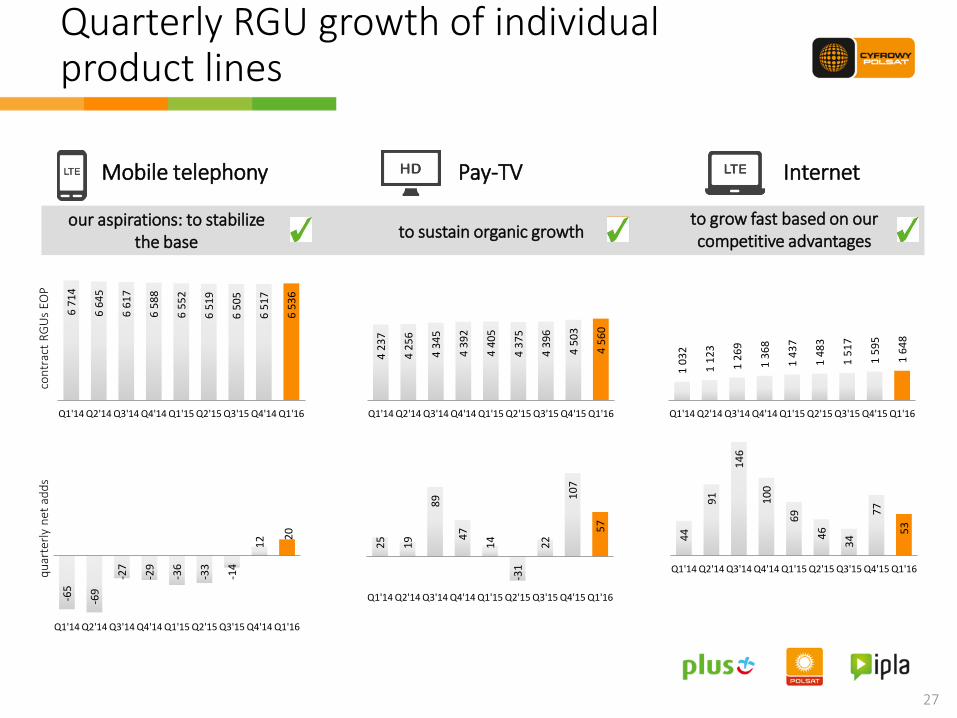
4 2
37
4 2
56
4 3
45
4 3
92
4 4
05
4 3
75
4 3
96
4 5
03
4 5
60
Q1'14 Q2'14 Q3'14 Q4'14 Q1'15 Q2'15 Q3'15 Q4'15 Q1'16
6 7
14
6 6
45
6 6
17
6 5
88
6 5
52
6 5
19
6 5
05
6 5
17
6 5
36
Q1'14 Q2'14 Q3'14 Q4'14 Q1'15 Q2'15 Q3'15 Q4'14 Q1'16
27
-65
-69
-27
-29
-36
-33
-14
12
20
Q1'14 Q2'14 Q3'14 Q4'14 Q1'15 Q2'15 Q3'15 Q4'14 Q1'16
25
19
89
47
14
-31
22
10
7
57
Q1'14 Q2'14 Q3'14 Q4'14 Q1'15 Q2'15 Q3'15 Q4'15 Q1'16
44
91
14
6
10
0
69
46
34
77
53
Q1'14 Q2'14 Q3'14 Q4'14 Q1'15 Q2'15 Q3'15 Q4'15 Q1'16
Quarterly RGU growth of individual product lines
Mobile telephony
our aspirations: to stabilize the base
Pay-TV Internet
to grow fast based on our competitive advantages
to sustain organic growth
qu
arte
rly
net
ad
ds
c
on
trac
t R
GU
s EO
P
1 0
32
1 1
23
1 2
69
1 3
68
1 4
37
1 4
83
1 5
17
1 5
95
1 6
48
Q1'14 Q2'14 Q3'14 Q4'14 Q1'15 Q2'15 Q3'15 Q4'15 Q1'16
28
+ +
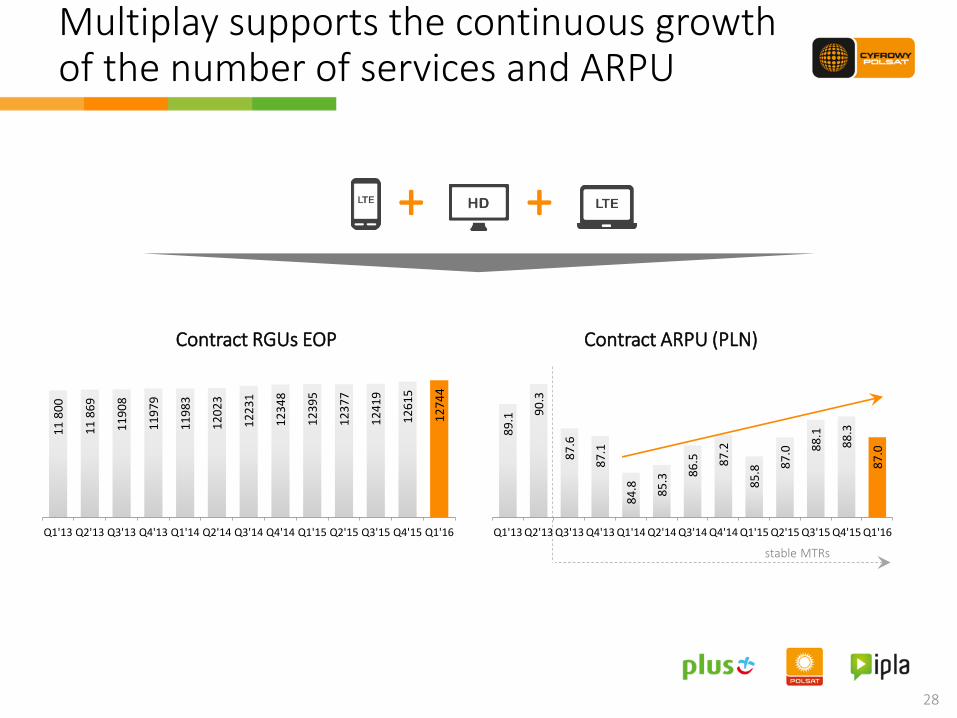
Multiplay supports the continuous growth of the number of services and ARPU
89
.1 90
.3
87
.6
87
.1
84
.8
85
.3 86
.5
87
.2
85
.8 87
.0 88
.1
88
.3
87
.0
Q1'13 Q2'13 Q3'13 Q4'13 Q1'14 Q2'14 Q3'14 Q4'14 Q1'15 Q2'15 Q3'15 Q4'15 Q1'16
11
80
0
11
86
9
11
90
8
11
97
9
11
98
3
12
02
3
12
23
1
12
34
8
12
39
5
12
37
7
12
41
9
12
61
5
12
74
4
Q1'13 Q2'13 Q3'13 Q4'13 Q1'14 Q2'14 Q3'14 Q4'14 Q1'15 Q2'15 Q3'15 Q4'15 Q1'16
Contract RGUs EOP Contract ARPU (PLN)
stable MTRs
29
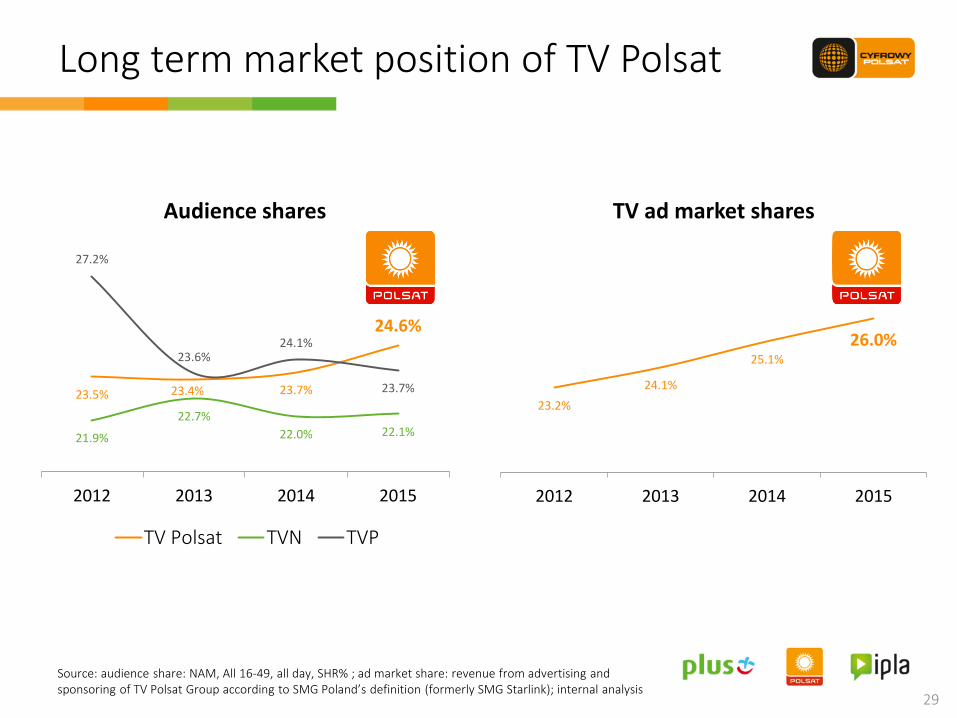
Long term market position of TV Polsat
23.5% 23.4% 23.7%
24.6%
21.9%
22.7%
22.0% 22.1%
27.2%
23.6% 24.1%
23.7%
2012 2013 2014 2015
Audience shares
TV Polsat TVN TVP
23.2%
24.1%
25.1%
26.0%
2012 2013 2014 2015
TV ad market shares
Source: audience share: NAM, All 16‐49, all day, SHR% ; ad market share: revenue from advertising and sponsoring of TV Polsat Group according to SMG Poland’s definition (formerly SMG Starlink); internal analysis
Current operational performance a. Broadcasting and TV production
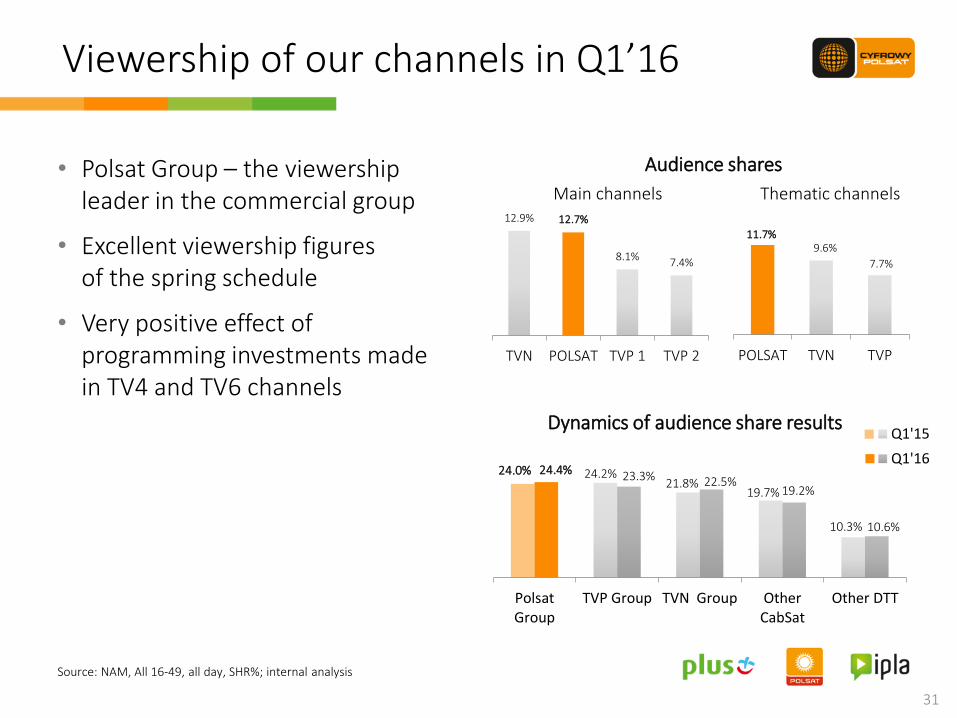
11.7% 9.6%
7.7%
POLSAT TVN TVP
• Polsat Group – the viewership leader in the commercial group
• Excellent viewership figures of the spring schedule
• Very positive effect of programming investments made in TV4 and TV6 channels
24.0% 24.2% 21.8%
19.7%
10.3%
24.4% 23.3% 22.5% 19.2%
10.6%
PolsatGroup
TVP Group TVN Group OtherCabSat
Other DTT
Q1'15
Q1'16
31
12.9% 12.7%
8.1% 7.4%
TVN POLSAT TVP 1 TVP 2
Viewership of our channels in Q1’16
Source: NAM, All 16‐49, all day, SHR%; internal analysis
Thematic channels
Audience shares
Main channels
Dynamics of audience share results

Position on the advertising market in Q1’16
• TV advertising and sponsorship market in Q1’16 increased YoY by 2.7%
• Revenue from TV advertising and sponsorship of TV Polsat Group grew faster than the market
• Our share in the TV advertising and sponsoring market increased to 25.5%
32
mP
LN
mP
LN
Source: SMG Poland (formerly SMG Starlink), airtime and sponsorship; TV Polsat; internal analysis Note: (1) Revenue from advertising and sponsorship of TV Polsat Group according to SMG Poland’s definition
Market expenditures on TV advertising and sponsorship
Revenue from advertising and sponsorship of TV Polsat Group(1)
842 877 901
Q1'14 Q1'15 Q1'16
+4.1% +2.7%
207 220 229
Q1'14 Q1'15 Q1'16
+4.2% +6.4%
Current operational performance b. Services to individual and
business customers

34
Dynamic growth of multiplay customers
Number of smartDOM customers • As many as 18% of our contract customers already use the multiplay offer, which should have a positive impact on their loyalty in the future
• Total number of RGUs contracted by this group of customers amounts to 3.22m (t
ho
u.
cust
om
ers)
707
1,021 1,088
12% 17% 18%
0%
10%
20%
30%
40%
50%
60%
70%
80%
90%
100%
0
200
400
600
800
1 000
Q1'15 Q4'15 Q1'16
# of smartDOM customers
saturation of customer base with smartDOM customers (%)
+54%
6.6m 6.5m 6.5m
4.4m 4.5m 4.6m
1.4m 1.6m 1.6m
Q1'15 Q4'15 Q1'16
Telefonia komórkowa
Płatna telewizja
Internet
12.74m 12.39m 12.61m
35
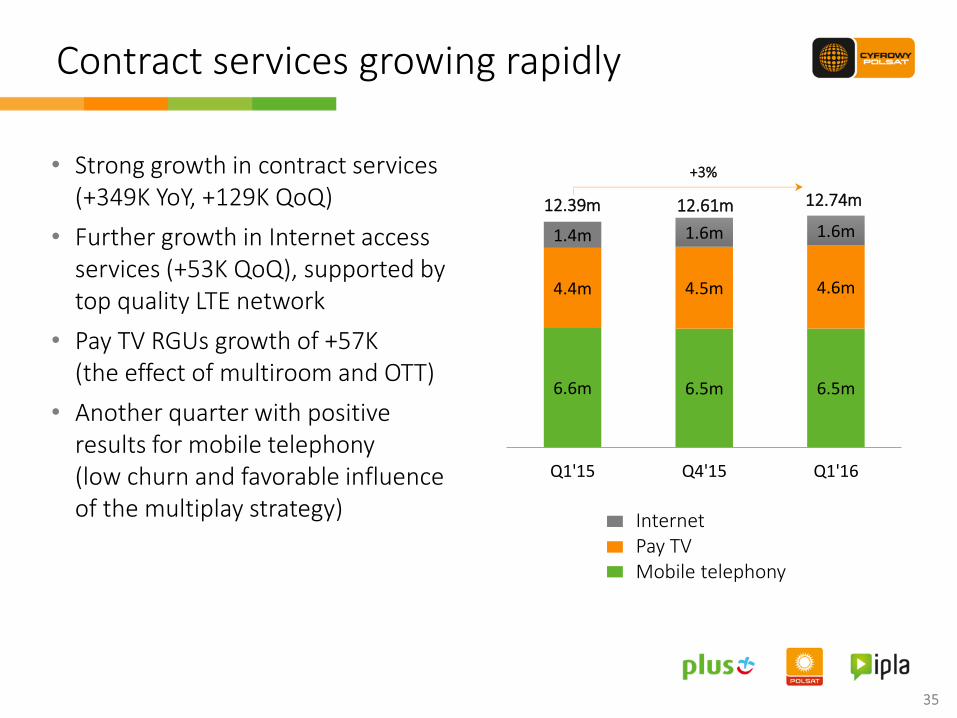
Contract services growing rapidly
35
Internet Pay TV Mobile telephony
• Strong growth in contract services (+349K YoY, +129K QoQ)
• Further growth in Internet access services (+53K QoQ), supported by top quality LTE network
• Pay TV RGUs growth of +57K (the effect of multiroom and OTT)
• Another quarter with positive results for mobile telephony (low churn and favorable influence of the multiplay strategy)
+3%
36
(AR
PU
in P
LN)
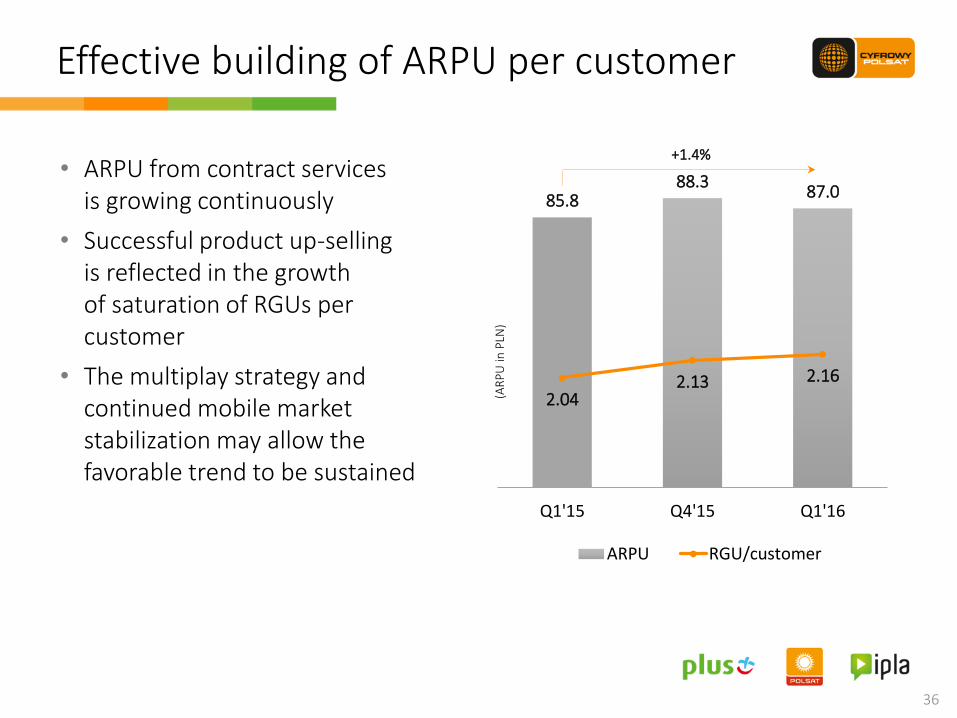
Effective building of ARPU per customer
• ARPU from contract services is growing continuously
• Successful product up-selling is reflected in the growth of saturation of RGUs per customer
• The multiplay strategy and continued mobile market stabilization may allow the favorable trend to be sustained
85.8 88.3
87.0
2.04 2.13 2.16
150%
250%
50
55
60
65
70
75
80
85
90
Q1'15 Q4'15 Q1'16
ARPU RGU/customer
+1.4%
17.3 18.5 17.7
Q1'15 Q4'15 Q1'16
Q1'15 Q4'15 Q1'16
Telefonia komórkowa
Internet
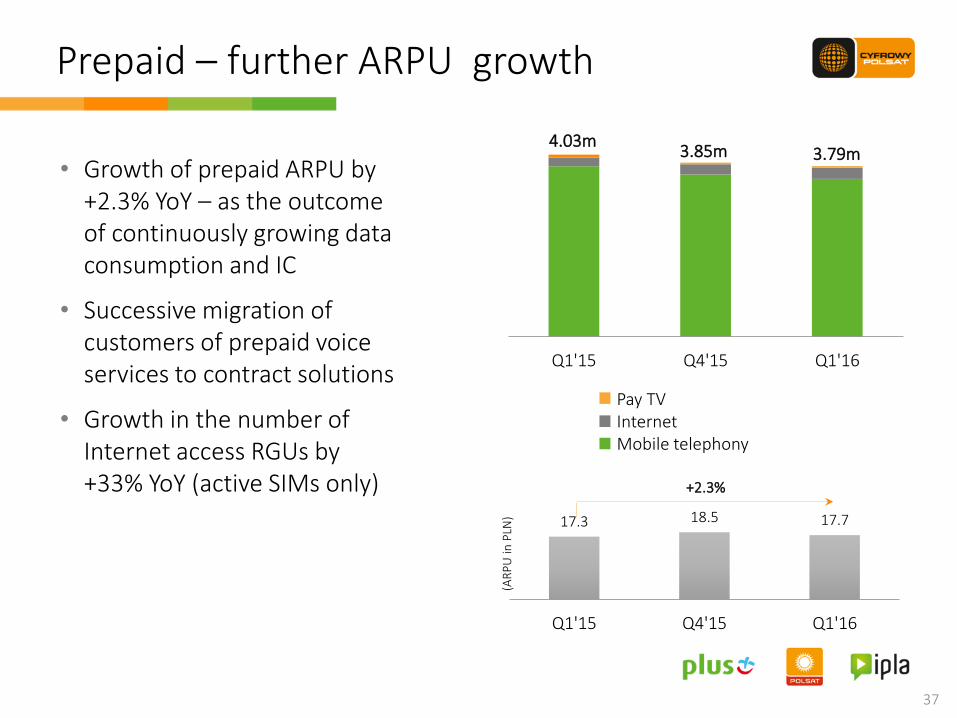
Prepaid – further ARPU growth
37
(AR
PU
in P
LN)
Pay TV Internet Mobile telephony
• Growth of prepaid ARPU by +2.3% YoY – as the outcome of continuously growing data consumption and IC
• Successive migration of customers of prepaid voice services to contract solutions
• Growth in the number of Internet access RGUs by +33% YoY (active SIMs only)
4.03m 3.79m 3.85m
+2.3%

Historical pro-forma financial performance
Full year consolidation of Midas Group results
39
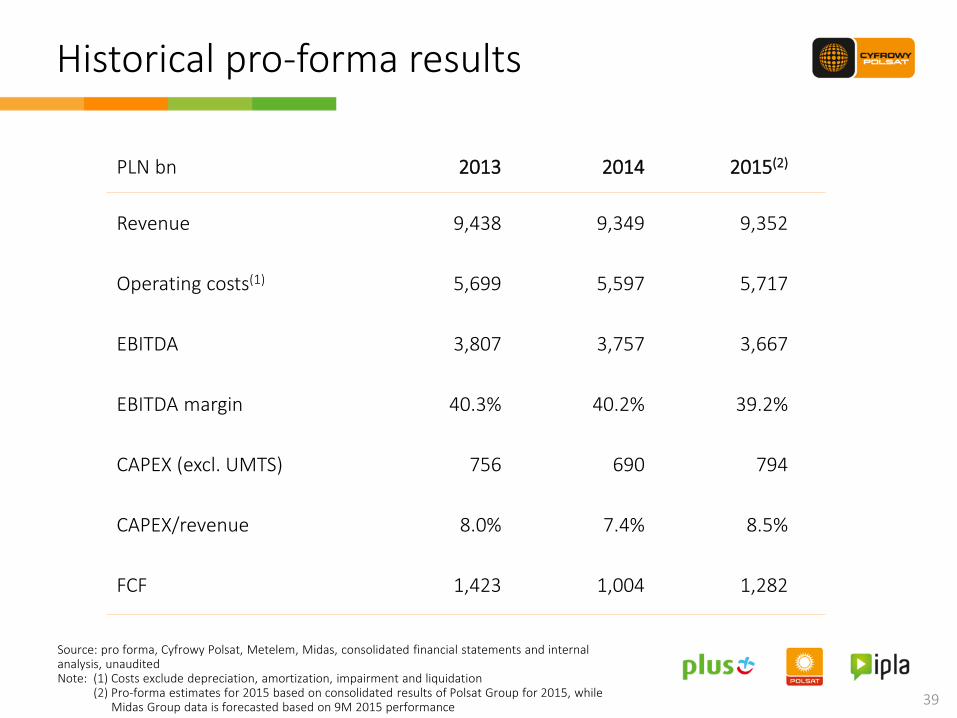
Historical pro-forma results
PLN bn 2013 2014 2015(2)
Revenue 9,438 9,349 9,352
Operating costs(1) 5,699 5,597 5,717
EBITDA 3,807 3,757 3,667
EBITDA margin 40.3% 40.2% 39.2%
CAPEX (excl. UMTS) 756 690 794
CAPEX/revenue 8.0% 7.4% 8.5%
FCF 1,423 1,004 1,282
Source: pro forma, Cyfrowy Polsat, Metelem, Midas, consolidated financial statements and internal analysis, unaudited Note: (1) Costs exclude depreciation, amortization, impairment and liquidation (2) Pro-forma estimates for 2015 based on consolidated results of Polsat Group for 2015, while Midas Group data is forecasted based on 9M 2015 performance
1Q’16 Pro-forma financial results Full quarterly consolidation of Midas Group results
41
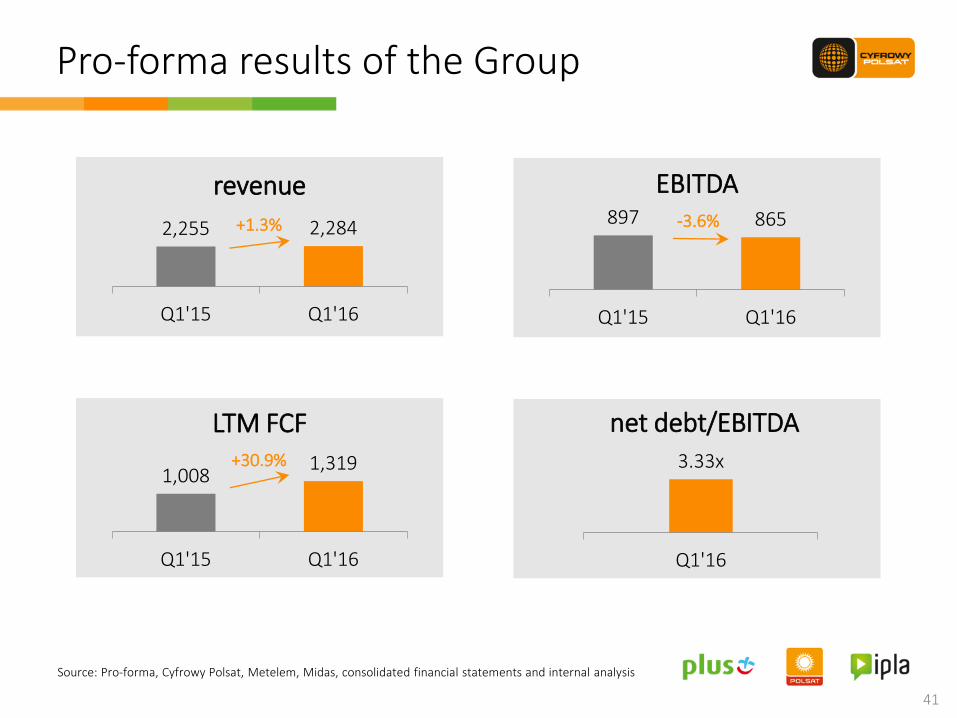
2,255 2,284
Q1'15 Q1'16
revenue
+1.3% 897 865
Q1'15 Q1'16
EBITDA -3.6%
Pro-forma results of the Group
Source: Pro-forma, Cyfrowy Polsat, Metelem, Midas, consolidated financial statements and internal analysis
3.33x
Q1'16
net debt/EBITDA
1,008 1,319
Q1'15 Q1'16
LTM FCF +30.9%
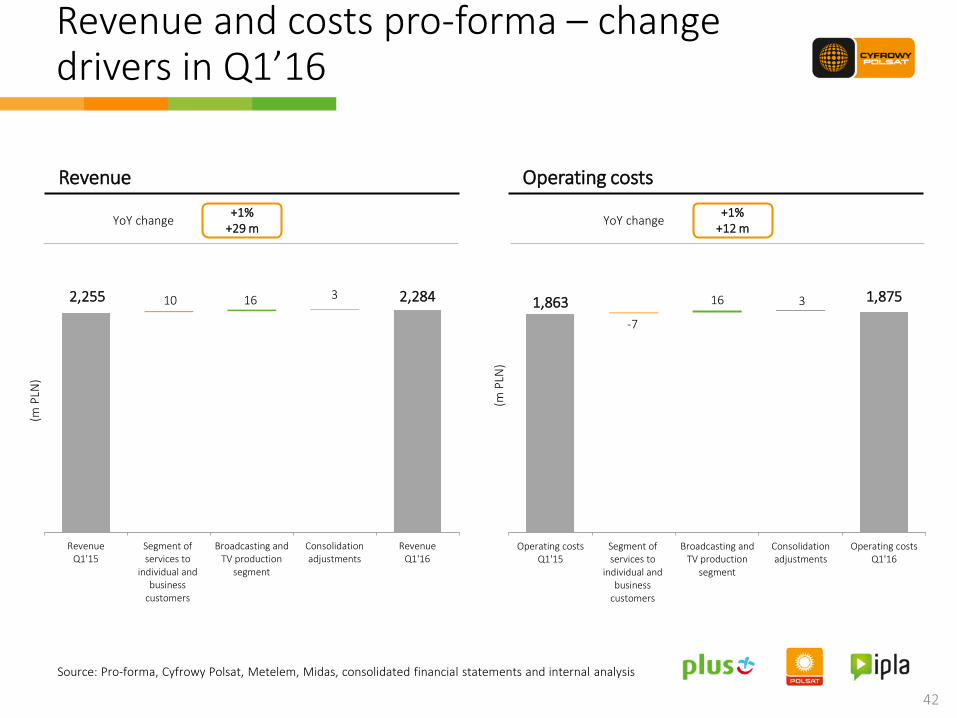
Revenue and costs pro-forma – change drivers in Q1’16
42
+1% +12 m
2,255 2,284 10 16 3
RevenueQ1'15
Segment ofservices to
individual andbusiness
customers
Broadcasting andTV production
segment
Consolidationadjustments
RevenueQ1'16
(m P
LN)
+1% +29 m
1,863 1,875
-7
16 3
Operating costsQ1'15
Segment ofservices to
individual andbusiness
customers
Broadcasting andTV production
segment
Consolidationadjustments
Operating costsQ1'16
(m P
LN)
YoY change
Operating costs
YoY change
Revenue
Source: Pro-forma, Cyfrowy Polsat, Metelem, Midas, consolidated financial statements and internal analysis

EBITDA pro-forma – change drivers in Q1’16
43
897 865
-33
1
EBITDAQ1'15
Segment of services toindividual and business
customers
Broadcasting and TVproduction segment
EBITDAQ1'16
(m P
LN)
-4% -32 m
EBITDA
40% 38%
EBITDA Margin
YoY change
Source: Pro-forma, Cyfrowy Polsat, Metelem, Midas, consolidated financial statements and internal analysis
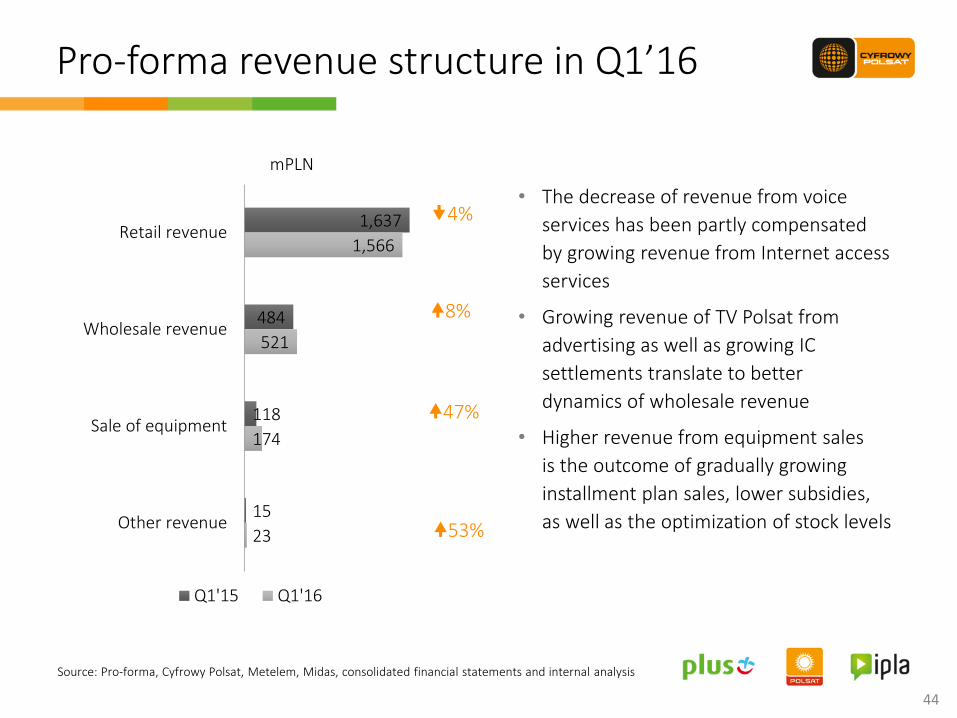
1,637
484
118
15
1,566
521
174
23
Retail revenue
Wholesale revenue
Sale of equipment
Other revenue
Q1'15 Q1'16
4%
8%
47%
mPLN
44
Pro-forma revenue structure in Q1’16
• The decrease of revenue from voice
services has been partly compensated
by growing revenue from Internet access
services
• Growing revenue of TV Polsat from
advertising as well as growing IC
settlements translate to better
dynamics of wholesale revenue
• Higher revenue from equipment sales
is the outcome of gradually growing
installment plan sales, lower subsidies,
as well as the optimization of stock levels 53%
Source: Pro-forma, Cyfrowy Polsat, Metelem, Midas, consolidated financial statements and internal analysis

495
397
333
235
189
131
19
63
449
447
328
248
201
140
10
52
Depreciation, amortization, impairmentand liquidation
Technical costs and cost of settlementswith telecommunication operators
Cost of equipment sold
Content cost
Distribution, marketing, customerrelation management and retention
Salaries and employee-related costs
Cost of debt collection services and baddebt allowance
Other costs
Q1'15 Q1'16
12%
9%
6%
mPLN
6%
7%
49%
45
• Lower cost of depreciation of telecommunication infrastructure
• Technical costs influenced by growing IC costs
• Content costs have been affected by higher costs of sport events and higher cost of amortization of film licenses
• Higher recognized accounting (non-cash) sales commission costs affect the dynamics of distribution, marketing, customer relation management and retention costs
1%
18%
Pro-forma operating costs structure in Q1’16
and receivables written off
Source: Pro-forma, Cyfrowy Polsat, Metelem, Midas, consolidated financial statements and internal analysis
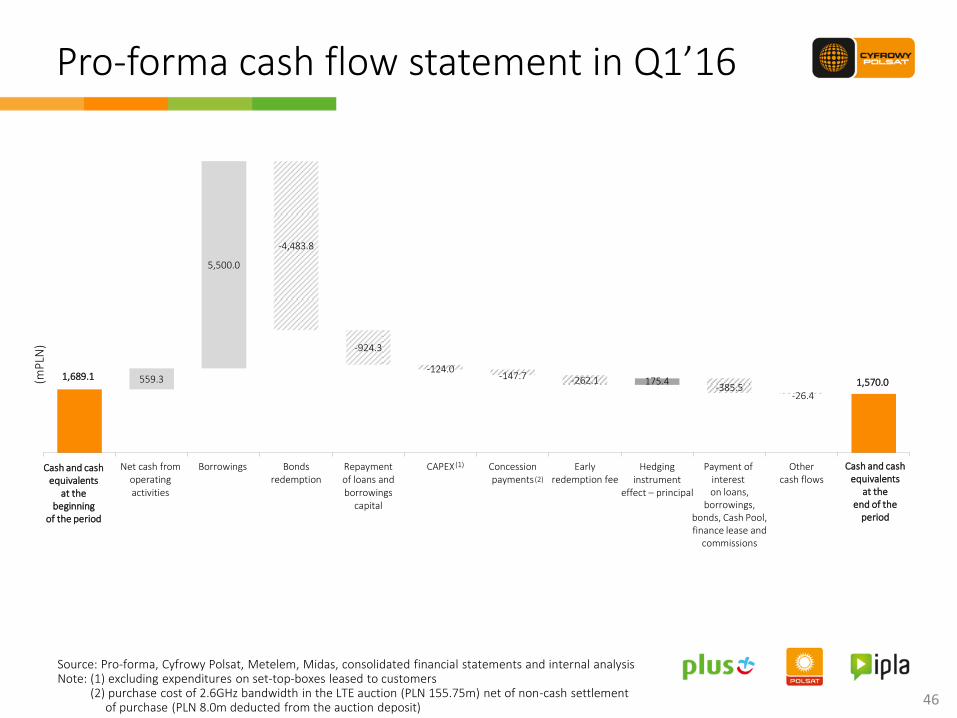
1,689.1 559.3
5,500.0
-4,483.8
-924.3
-124.0 -147.7 -262.1 175.4
-385.5 -26.4
1,570.0
Net cash fromoperatingactivities
Borrowings Bondsredemption
Repaymentof loans andborrowings
capital
CAPEX Concessionpayments
Earlyredemption fee
Hedging instrument
effect – principal
Payment ofinterest
Othercash flows
(2)
(1)
Source: Pro-forma, Cyfrowy Polsat, Metelem, Midas, consolidated financial statements and internal analysis Note: (1) excluding expenditures on set‐top‐boxes leased to customers (2) purchase cost of 2.6GHz bandwidth in the LTE auction (PLN 155.75m) net of non-cash settlement of purchase (PLN 8.0m deducted from the auction deposit)
46
Pro-forma cash flow statement in Q1’16
Cash and cash equivalents
at the beginning
of the period
Cash and cash equivalents
at the end of the
period
(mP
LN)
on loans, borrowings,
bonds, Cash Pool, finance lease and
commissions
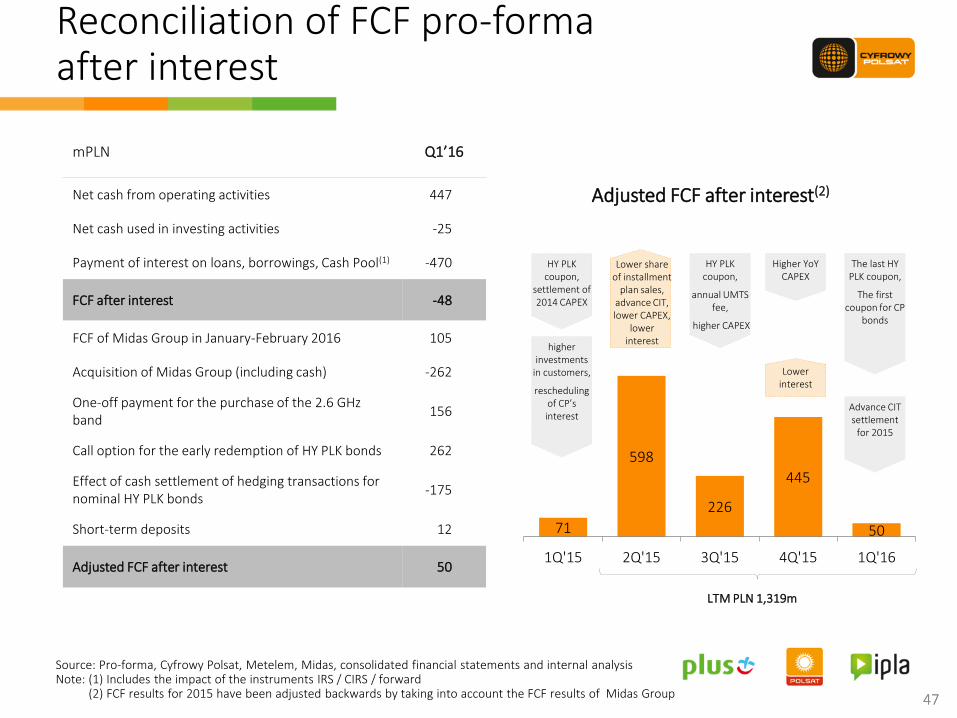
47 47
mPLN Q1’16
Net cash from operating activities 447
Net cash used in investing activities -25
Payment of interest on loans, borrowings, Cash Pool(1) -470
FCF after interest -48
FCF of Midas Group in January-February 2016 105
Acquisition of Midas Group (including cash) -262
One-off payment for the purchase of the 2.6 GHz band
156
Call option for the early redemption of HY PLK bonds 262
Effect of cash settlement of hedging transactions for nominal HY PLK bonds
-175
Short-term deposits 12
Adjusted FCF after interest 50
71
598
226
445
50
1Q'15 2Q'15 3Q'15 4Q'15 1Q'16
Lower share of installment
plan sales, advance CIT, lower CAPEX,
lower interest
Adjusted FCF after interest(2)
Advance CIT settlement
for 2015
higher investments
in customers,
rescheduling of CP’s interest
HY PLK coupon,
annual UMTS fee,
higher CAPEX
LTM PLN 1,319m
Higher YoY CAPEX
Lower interest
The last HY PLK coupon,
The first coupon for CP
bonds
HY PLK coupon,
settlement of 2014 CAPEX
Source: Pro-forma, Cyfrowy Polsat, Metelem, Midas, consolidated financial statements and internal analysis Note: (1) Includes the impact of the instruments IRS / CIRS / forward (2) FCF results for 2015 have been adjusted backwards by taking into account the FCF results of Midas Group
Reconciliation of FCF pro-forma after interest
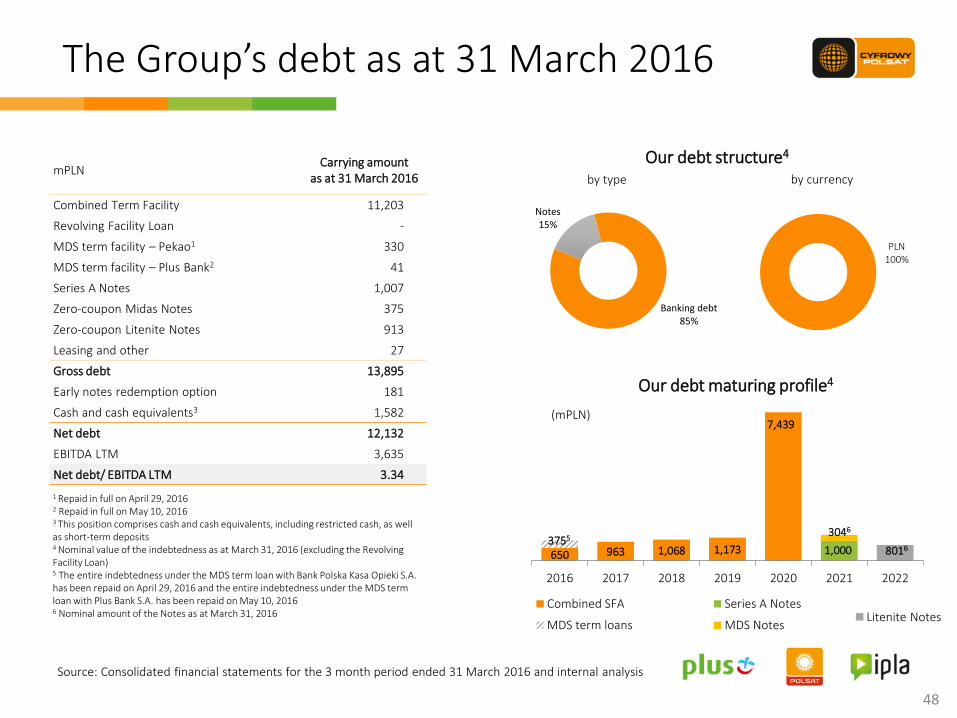
Banking debt 85%
Notes 15%
Our debt structure4
Source: Consolidated financial statements for the 3 month period ended 31 March 2016 and internal analysis
48
650 963 1,068 1,173
7,439
3046
1,000 8016
2016 2017 2018 2019 2020 2021 2022
Our debt maturing profile4
Combined SFA Series A Notes
MDS term loans MDS Notes
(mPLN)
1 Repaid in full on April 29, 2016 2 Repaid in full on May 10, 2016 3 This position comprises cash and cash equivalents, including restricted cash, as well as short-term deposits 4 Nominal value of the indebtedness as at March 31, 2016 (excluding the Revolving Facility Loan) 5 The entire indebtedness under the MDS term loan with Bank Polska Kasa Opieki S.A. has been repaid on April 29, 2016 and the entire indebtedness under the MDS term loan with Plus Bank S.A. has been repaid on May 10, 2016 6 Nominal amount of the Notes as at March 31, 2016
mPLN Carrying amount
as at 31 March 2016
Combined Term Facility 11,203
Revolving Facility Loan -
MDS term facility – Pekao1 330
MDS term facility – Plus Bank2 41
Series A Notes 1,007
Zero-coupon Midas Notes 375
Zero-coupon Litenite Notes 913
Leasing and other 27
Gross debt 13,895
Early notes redemption option 181
Cash and cash equivalents3 1,582
Net debt 12,132
EBITDA LTM 3,635
Net debt/ EBITDA LTM 3.34
by type by currency
3755
The Group’s debt as at 31 March 2016
Litenite Notes
PLN 100%

Network roll-out – strategic directions
50
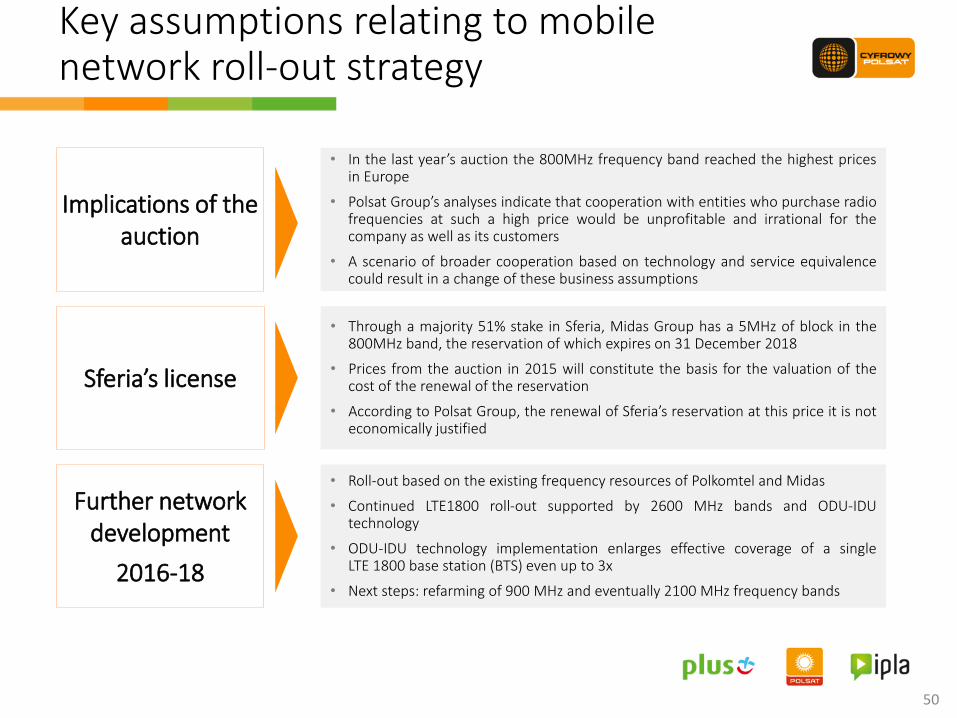
Sferia’s license
Implications of the auction
Further network development
2016-18
• In the last year’s auction the 800MHz frequency band reached the highest prices in Europe
• Polsat Group’s analyses indicate that cooperation with entities who purchase radio frequencies at such a high price would be unprofitable and irrational for the company as well as its customers
• A scenario of broader cooperation based on technology and service equivalence could result in a change of these business assumptions
• Roll-out based on the existing frequency resources of Polkomtel and Midas
• Continued LTE1800 roll-out supported by 2600 MHz bands and ODU-IDU technology
• ODU-IDU technology implementation enlarges effective coverage of a single LTE 1800 base station (BTS) even up to 3x
• Next steps: refarming of 900 MHz and eventually 2100 MHz frequency bands
• Through a majority 51% stake in Sferia, Midas Group has a 5MHz of block in the 800MHz band, the reservation of which expires on 31 December 2018
• Prices from the auction in 2015 will constitute the basis for the valuation of the cost of the renewal of the reservation
• According to Polsat Group, the renewal of Sferia’s reservation at this price it is not economically justified
Key assumptions relating to mobile network roll-out strategy
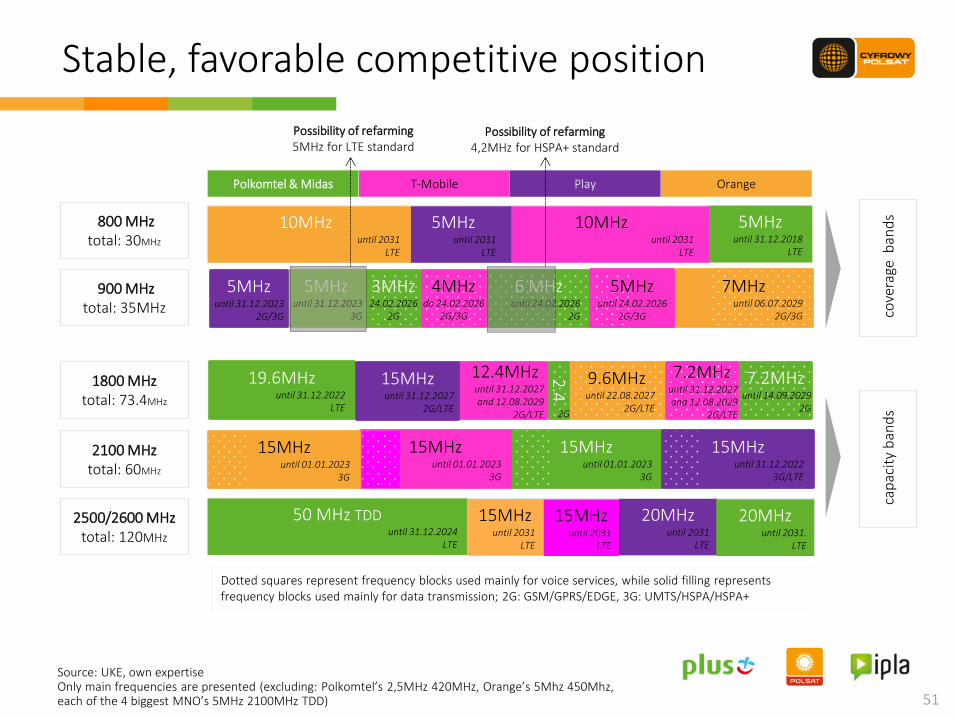
Stable, favorable competitive position
51
Source: UKE, own expertise Only main frequencies are presented (excluding: Polkomtel’s 2,5MHz 420MHz, Orange’s 5Mhz 450Mhz, each of the 4 biggest MNO’s 5MHz 2100MHz TDD)
25 MHz
Orange Play T-Mobile Polkomtel & Midas
15MHz until 01.01.2023
3G
15MHz until 01.01.2023
3G
15MHz until 31.12.2022
3G/LTE
15MHz until 01.01.2023
3G
2100 MHz total: 60MHz
900 MHz total: 35MHz
6 MHz until 24.02.2026
2G
5MHz until 31.12.2023
3G
5MHz until 31.12.2023
2G/3G
7MHz until 06.07.2029
2G/3G
70 MHz FDD Oczekiwana dostępność: 2016
LTE
2500/2600 MHz total: 120MHz
50 MHz TDD until 31.12.2024
LTE
7.2MHz until 14.09.2029
2G
19.6MHz until 31.12.2022
LTE
9.6MHz until 22.08.2027
2G/LTE
1800 MHz total: 73.4MHz
7.2MHz until 31.12.2027 and 12.08.2029
2G/LTE
800 MHz total: 30MHz
4MHz do 24.02.2026
2G/3G
3MHz
24.02.2026 2G
12.4MHz until 31.12.2027 and 12.08.2029
2G/LTE
2.4
15MHz until 31.12.2027
2G/LTE
5MHz until 31.12.2018
LTE
10MHz until 2031
LTE
10MHz until 2031
LTE
5MHz until 2031
LTE
15MHz until 2031
LTE
15MHz until 2031
LTE
20MHz until 2031
LTE
20MHz until 2031.
LTE
Possibility of refarming 4,2MHz for HSPA+ standard
5MHz until 24.02.2026
2G/3G
2G
cap
acit
y b
and
s c
ove
rage
ban
ds
Possibility of refarming 5MHz for LTE standard
Dotted squares represent frequency blocks used mainly for voice services, while solid filling represents frequency blocks used mainly for data transmission; 2G: GSM/GPRS/EDGE, 3G: UMTS/HSPA/HSPA+
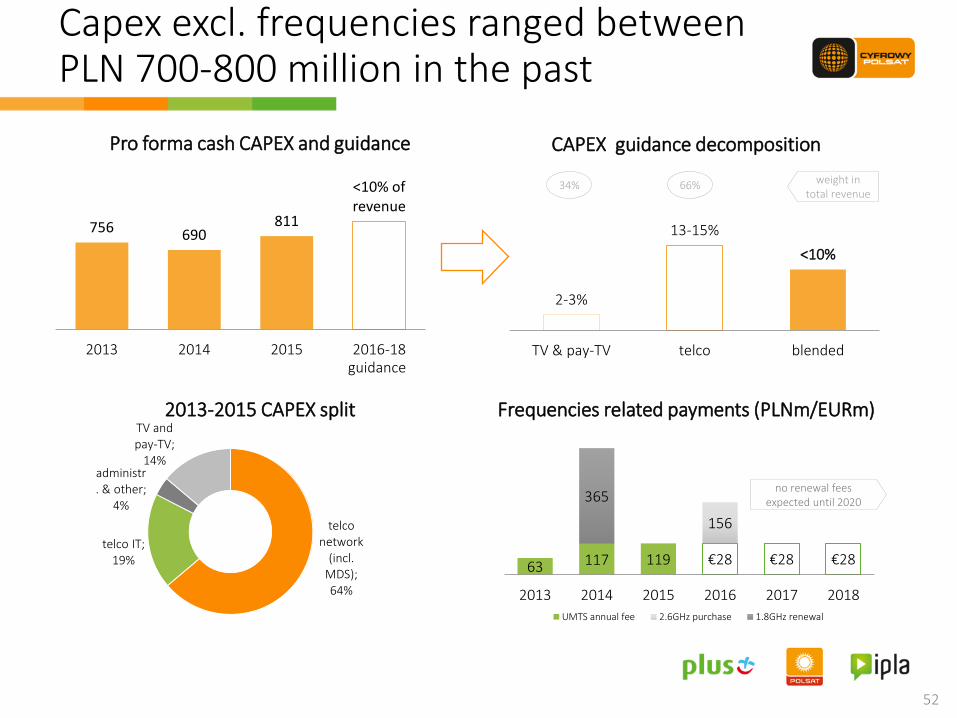
756 690 811
<10% of revenue
2013 2014 2015 2016-18
2-3%
13-15%
<10%
TV & pay-TV telco blended
Capex excl. frequencies ranged between PLN 700-800 million in the past
52
63 117 119 €28 €28 €28
156
365
2013 2014 2015 2016 2017 2018
UMTS annual fee 2.6GHz purchase 1.8GHz renewal
Pro forma cash CAPEX and guidance CAPEX guidance decomposition
34% weight in total revenue
66%
guidance
telco network
(incl. MDS); 64%
telco IT; 19%
administr. & other;
4%
TV and pay-TV;
14%
2013-2015 CAPEX split Frequencies related payments (PLNm/EURm)
no renewal fees expected until 2020
Acquisition of Midas Group a. Technical and financial aspects of the transaction

Key parameters of the transaction
54
• Polkomtel, a 100% subsidiary of Cyfrowy Polsat, has entered into agreement to acquire Litenite, a company controlling 66% shares in Midas Group
• The transaction involves the acquisition of Litenite’s net liabilities of ca. PLN 788 million(2) and 1 EUR payment to Ortholuck for equity
• Implied equity value of Midas Group at PLN 0.81/ share
• Financing of the transaction from own resources
• Tender offer for the remaining 34% shares
Acquisition of 100% stake in Midas S.A.
Other shareholders
Litenite Limited
Ortholuck Ltd(1)
1st stage agreement to acquire 100% shares in Litenite
2nd stage tender offer
66%
34%
100%
Note: (1) company controlled by Zygmunt Solorz-Żak (2) value of net liabilities as at 31 January 2016

Valuation approach
55
• Valuation based on ANBV (adjusted net book value) and DCF (discounted cash flow) approach
• Valuation based on „fair value” standard based on applied cost and income approach
• Purchase price in the transaction confirmed by fairness opinion issued by EY
• Valuation does not include synergies
0.63 0.66
0.81
6M 3M valuation by CP
Midas S.A. share price
PLN
/sh
are
(1) (2)
Premium for shareholders
Note: (1) 3.08.2015 – 28.02.2016 (2) 2.11.2015 – 28.02.2016

b. Business rationale of the transaction
Acquisition of Midas Group
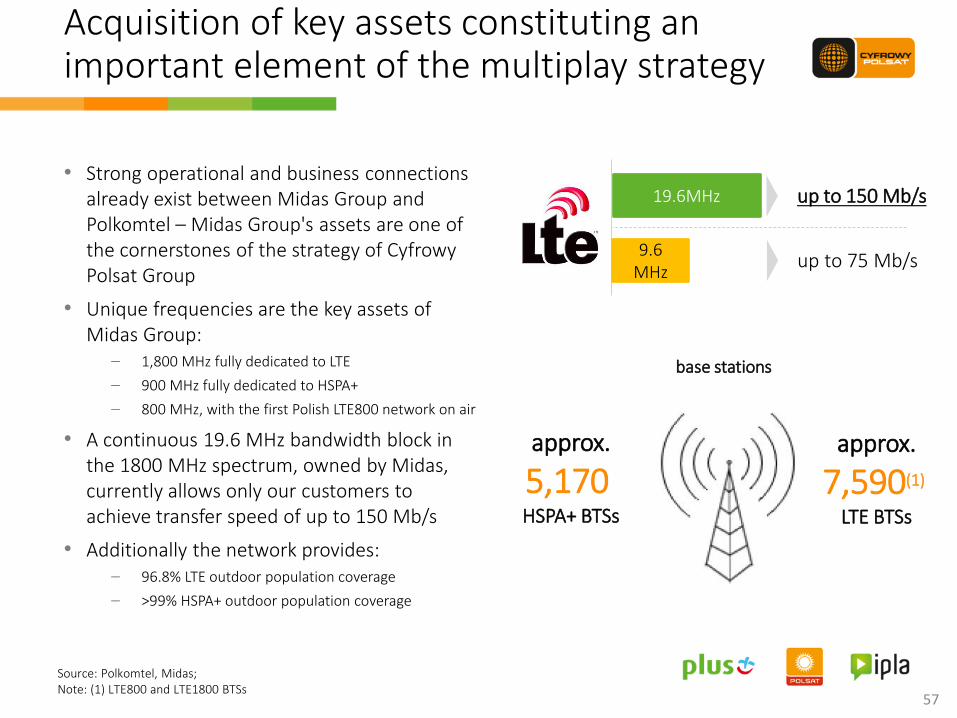
Acquisition of key assets constituting an important element of the multiplay strategy
• Strong operational and business connections already exist between Midas Group and Polkomtel – Midas Group's assets are one of the cornerstones of the strategy of Cyfrowy Polsat Group
• Unique frequencies are the key assets of Midas Group:
– 1,800 MHz fully dedicated to LTE
– 900 MHz fully dedicated to HSPA+
– 800 MHz, with the first Polish LTE800 network on air
• A continuous 19.6 MHz bandwidth block in the 1800 MHz spectrum, owned by Midas, currently allows only our customers to achieve transfer speed of up to 150 Mb/s
• Additionally the network provides: – 96.8% LTE outdoor population coverage
– >99% HSPA+ outdoor population coverage
57
19.6MHz up to 150 Mb/s
9.6 MHz
up to 75 Mb/s
base stations
approx.
5,170 HSPA+ BTSs
approx.
7,590(1) LTE BTSs
Source: Polkomtel, Midas; Note: (1) LTE800 and LTE1800 BTSs
58
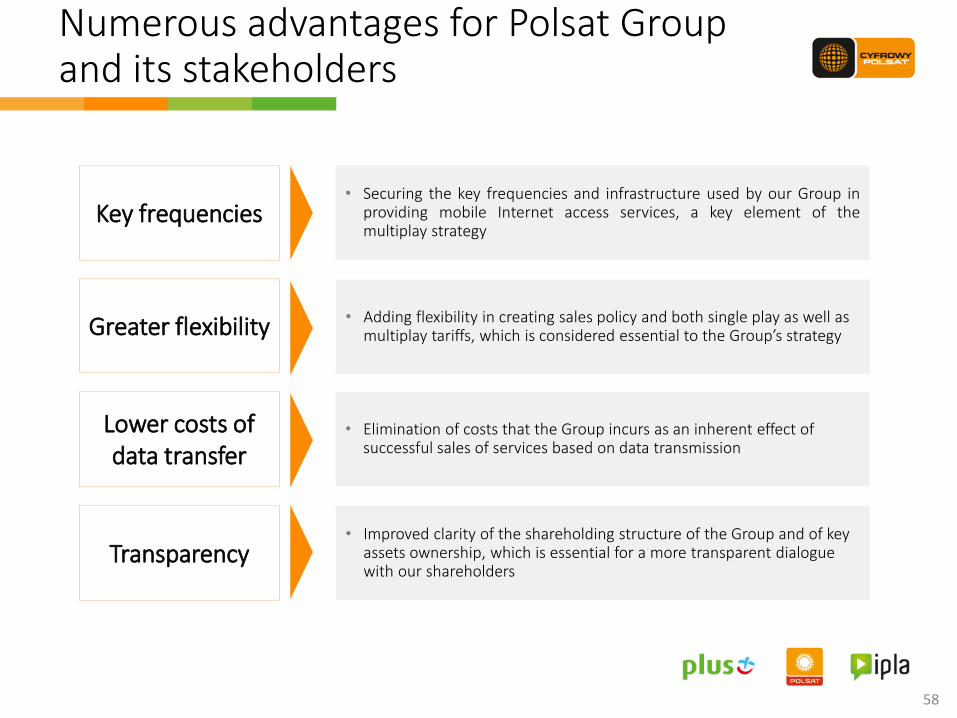
Greater flexibility
Key frequencies
Lower costs of data transfer
Numerous advantages for Polsat Group and its stakeholders
• Securing the key frequencies and infrastructure used by our Group in providing mobile Internet access services, a key element of the multiplay strategy
• Elimination of costs that the Group incurs as an inherent effect of successful sales of services based on data transmission
Transparency • Improved clarity of the shareholding structure of the Group and of key
assets ownership, which is essential for a more transparent dialogue with our shareholders
• Adding flexibility in creating sales policy and both single play as well as multiplay tariffs, which is considered essential to the Group’s strategy
Additional information
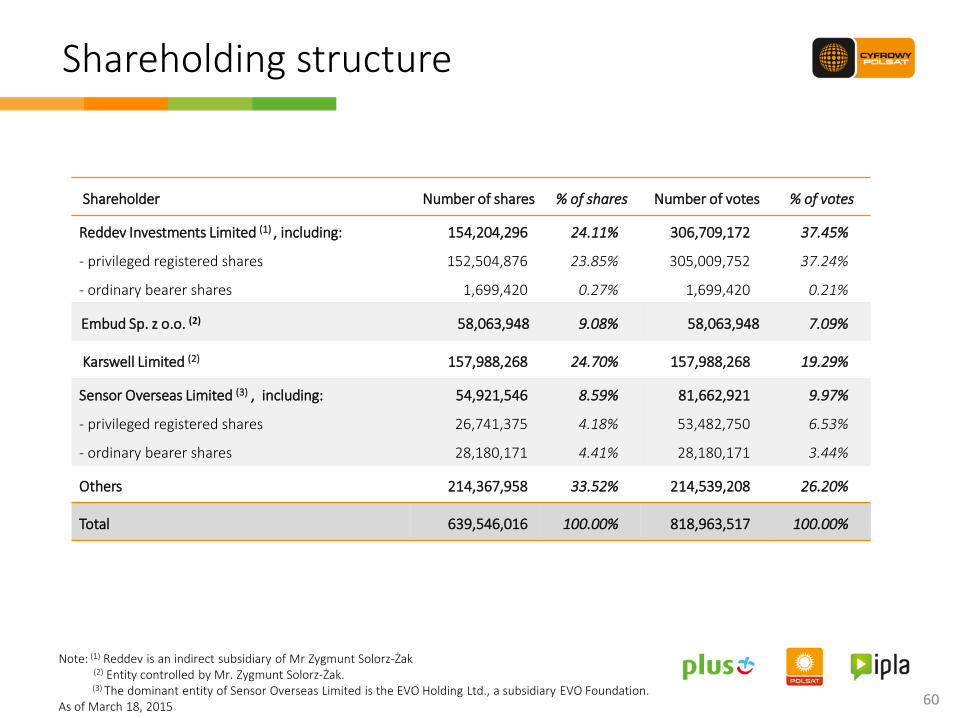
Shareholding structure
60
Shareholder Number of shares % of shares Number of votes % of votes
Reddev Investments Limited (1) , including:
- privileged registered shares
- ordinary bearer shares
154,204,296
152,504,876
1,699,420
24.11%
23.85%
0.27%
306,709,172
305,009,752
1,699,420
37.45%
37.24%
0.21%
Embud Sp. z o.o. (2) 58,063,948 9.08% 58,063,948 7.09%
Karswell Limited (2) 157,988,268 24.70% 157,988,268 19.29%
Sensor Overseas Limited (3) , including:
- privileged registered shares
- ordinary bearer shares
54,921,546
26,741,375
28,180,171
8.59%
4.18%
4.41%
81,662,921
53,482,750
28,180,171
9.97%
6.53%
3.44%
Others 214,367,958 33.52% 214,539,208 26.20%
Total 639,546,016 100.00% 818,963,517 100.00%
Note: (1) Reddev is an indirect subsidiary of Mr Zygmunt Solorz-Żak (2) Entity controlled by Mr. Zygmunt Solorz-Żak. (3) The dominant entity of Sensor Overseas Limited is the EVO Holding Ltd., a subsidiary EVO Foundation. As of March 18, 2015
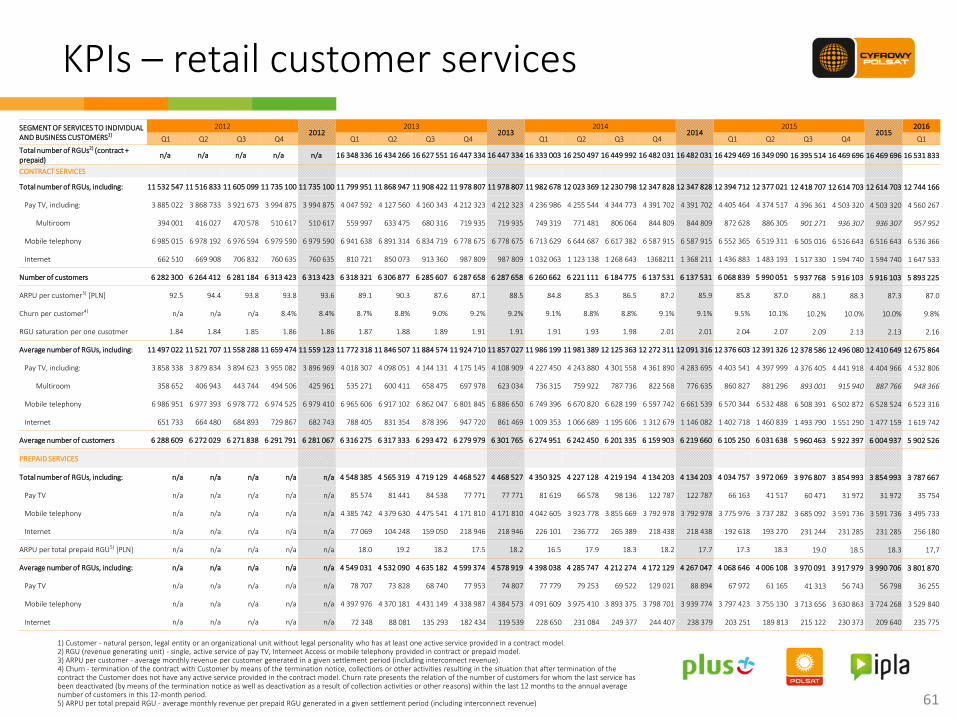
1) Customer - natural person, legal entity or an organizational unit without legal personality who has at least one active service provided in a contract model. 2) RGU (revenue generating unit) - single, active service of pay TV, Interneet Access or mobile telephony provided in contract or prepaid model. 3) ARPU per customer - average monthly revenue per customer generated in a given settlement period (including interconnect revenue). 4) Churn - termination of the contract with Customer by means of the termination notice, collections or other activities resulting in the situation that after termination of the contract the Customer does not have any active service provided in the contract model. Churn rate presents the relation of the number of customers for whom the last service has been deactivated (by means of the termination notice as well as deactivation as a result of collection activities or other reasons) within the last 12 months to the annual average number of customers in this 12-month period. 5) ARPU per total prepaid RGU - average monthly revenue per prepaid RGU generated in a given settlement period (including interconnect revenue)
61
SEGMENT OF SERVICES TO INDIVIDUAL AND BUSINESS CUSTOMERS1)
2012 2012
2013 2013
2014 2014
2015 2015
2016
Q1 Q2 Q3 Q4 Q1 Q2 Q3 Q4 Q1 Q2 Q3 Q4 Q1 Q2 Q3 Q4 Q1
Total number of RGUs2) (contract + prepaid)
n/a n/a n/a n/a n/a 16 348 336 16 434 266 16 627 551 16 447 334 16 447 334 16 333 003 16 250 497 16 449 992 16 482 031 16 482 031 16 429 469 16 349 090 16 395 514 16 469 696 16 469 696 16 531 833
CONTRACT SERVICES
Total number of RGUs, including: 11 532 547 11 516 833 11 605 099 11 735 100 11 735 100 11 799 951 11 868 947 11 908 422 11 978 807 11 978 807 11 982 678 12 023 369 12 230 798 12 347 828 12 347 828 12 394 712 12 377 021 12 418 707 12 614 703 12 614 703 12 744 166
Pay TV, including: 3 885 022 3 868 733 3 921 673 3 994 875 3 994 875 4 047 592 4 127 560 4 160 343 4 212 323 4 212 323 4 236 986 4 255 544 4 344 773 4 391 702 4 391 702 4 405 464 4 374 517 4 396 361 4 503 320 4 503 320 4 560 267
Multiroom 394 001 416 027 470 578 510 617 510 617 559 997 633 475 680 316 719 935 719 935 749 319 771 481 806 064 844 809 844 809 872 628 886 305 901 271 936 307 936 307 957 952
Mobile telephony 6 985 015 6 978 192 6 976 594 6 979 590 6 979 590 6 941 638 6 891 314 6 834 719 6 778 675 6 778 675 6 713 629 6 644 687 6 617 382 6 587 915 6 587 915 6 552 365 6 519 311 6 505 016 6 516 643 6 516 643 6 536 366
Internet 662 510 669 908 706 832 760 635 760 635 810 721 850 073 913 360 987 809 987 809 1 032 063 1 123 138 1 268 643 1368211 1 368 211 1 436 883 1 483 193 1 517 330 1 594 740 1 594 740 1 647 533
Number of customers 6 282 300 6 264 412 6 281 184 6 313 423 6 313 423 6 318 321 6 306 877 6 285 607 6 287 658 6 287 658 6 260 662 6 221 111 6 184 775 6 137 531 6 137 531 6 068 839 5 990 051 5 937 768 5 916 103 5 916 103 5 893 225
ARPU per customer3) [PLN] 92.5 94.4 93.8 93.8 93.6 89.1 90.3 87.6 87.1 88.5 84.8 85.3 86.5 87.2 85.9 85.8 87.0 88.1 88.3 87.3 87.0
Churn per customer4) n/a n/a n/a 8.4% 8.4% 8.7% 8.8% 9.0% 9.2% 9.2% 9.1% 8.8% 8.8% 9.1% 9.1% 9.5% 10.1% 10.2% 10.0% 10.0% 9.8%
RGU saturation per one cusotmer 1.84 1.84 1.85 1.86 1.86 1.87 1.88 1.89 1.91 1.91 1.91 1.93 1.98 2.01 2.01 2.04 2.07 2.09 2.13 2.13 2.16
Average number of RGUs, including: 11 497 022 11 521 707 11 558 288 11 659 474 11 559 123 11 772 318 11 846 507 11 884 574 11 924 710 11 857 027 11 986 199 11 981 389 12 125 363 12 272 311 12 091 316 12 376 603 12 391 326 12 378 586 12 496 080 12 410 649 12 675 864
Pay TV, including: 3 858 338 3 879 834 3 894 623 3 955 082 3 896 969 4 018 307 4 098 051 4 144 131 4 175 145 4 108 909 4 227 450 4 243 880 4 301 558 4 361 890 4 283 695 4 403 541 4 397 999 4 376 405 4 441 918 4 404 966 4 532 806
Multiroom 358 652 406 943 443 744 494 506 425 961 535 271 600 411 658 475 697 978 623 034 736 315 759 922 787 736 822 568 776 635 860 827 881 296 893 001 915 940 887 766 948 366
Mobile telephony 6 986 951 6 977 393 6 978 772 6 974 525 6 979 410 6 965 606 6 917 102 6 862 047 6 801 845 6 886 650 6 749 396 6 670 820 6 628 199 6 597 742 6 661 539 6 570 344 6 532 488 6 508 391 6 502 872 6 528 524 6 523 316
Internet 651 733 664 480 684 893 729 867 682 743 788 405 831 354 878 396 947 720 861 469 1 009 353 1 066 689 1 195 606 1 312 679 1 146 082 1 402 718 1 460 839 1 493 790 1 551 290 1 477 159 1 619 742
Average number of customers 6 288 609 6 272 029 6 271 838 6 291 791 6 281 067 6 316 275 6 317 333 6 293 472 6 279 979 6 301 765 6 274 951 6 242 450 6 201 335 6 159 903 6 219 660 6 105 250 6 031 638 5 960 463 5 922 397 6 004 937 5 902 526
PREPAID SERVICES
Total number of RGUs, including: n/a n/a n/a n/a n/a 4 548 385 4 565 319 4 719 129 4 468 527 4 468 527 4 350 325 4 227 128 4 219 194 4 134 203 4 134 203 4 034 757 3 972 069 3 976 807 3 854 993 3 854 993 3 787 667
Pay TV n/a n/a n/a n/a n/a 85 574 81 441 84 538 77 771 77 771 81 619 66 578 98 136 122 787 122 787 66 163 41 517 60 471 31 972 31 972 35 754
Mobile telephony n/a n/a n/a n/a n/a 4 385 742 4 379 630 4 475 541 4 171 810 4 171 810 4 042 605 3 923 778 3 855 669 3 792 978 3 792 978 3 775 976 3 737 282 3 685 092 3 591 736 3 591 736 3 495 733
Internet n/a n/a n/a n/a n/a 77 069 104 248 159 050 218 946 218 946 226 101 236 772 265 389 218 438 218 438 192 618 193 270 231 244 231 285 231 285 256 180
ARPU per total prepaid RGU5) [PLN] n/a n/a n/a n/a n/a 18.0 19.2 18.2 17.5 18.2 16.5 17.9 18.3 18.2 17.7 17.3 18.3 19.0 18.5 18.3 17,7
Average number of RGUs, including: n/a n/a n/a n/a n/a 4 549 031 4 532 090 4 635 182 4 599 374 4 578 919 4 398 038 4 285 747 4 212 274 4 172 129 4 267 047 4 068 646 4 006 108 3 970 091 3 917 979 3 990 706 3 801 870
Pay TV n/a n/a n/a n/a n/a 78 707 73 828 68 740 77 953 74 807 77 779 79 253 69 522 129 021 88 894 67 972 61 165 41 313 56 743 56 798 36 255
Mobile telephony n/a n/a n/a n/a n/a 4 397 976 4 370 181 4 431 149 4 338 987 4 384 573 4 091 609 3 975 410 3 893 375 3 798 701 3 939 774 3 797 423 3 755 130 3 713 656 3 630 863 3 724 268 3 529 840
Internet n/a n/a n/a n/a n/a 72 348 88 081 135 293 182 434 119 539 228 650 231 084 249 377 244 407 238 379 203 251 189 813 215 122 230 373 209 640 235 775
KPIs – retail customer services
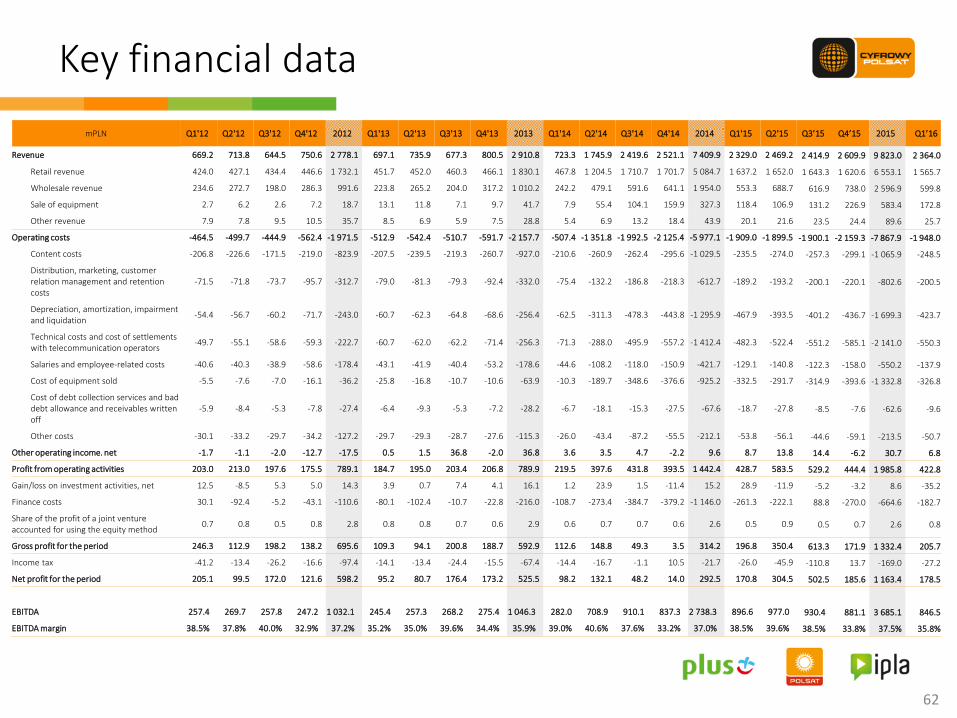
Key financial data
62
mPLN Q1'12 Q2'12 Q3'12 Q4'12 2012 Q1'13 Q2'13 Q3'13 Q4'13 2013 Q1'14 Q2'14 Q3'14 Q4'14 2014 Q1'15 Q2'15 Q3’15 Q4’15 2015 Q1’16
Revenue 669.2 713.8 644.5 750.6 2 778.1 697.1 735.9 677.3 800.5 2 910.8 723.3 1 745.9 2 419.6 2 521.1 7 409.9 2 329.0 2 469.2 2 414.9 2 609.9 9 823.0 2 364.0
Retail revenue 424.0 427.1 434.4 446.6 1 732.1 451.7 452.0 460.3 466.1 1 830.1 467.8 1 204.5 1 710.7 1 701.7 5 084.7 1 637.2 1 652.0 1 643.3 1 620.6 6 553.1 1 565.7
Wholesale revenue 234.6 272.7 198.0 286.3 991.6 223.8 265.2 204.0 317.2 1 010.2 242.2 479.1 591.6 641.1 1 954.0 553.3 688.7 616.9 738.0 2 596.9 599.8
Sale of equipment 2.7 6.2 2.6 7.2 18.7 13.1 11.8 7.1 9.7 41.7 7.9 55.4 104.1 159.9 327.3 118.4 106.9 131.2 226.9 583.4 172.8
Other revenue 7.9 7.8 9.5 10.5 35.7 8.5 6.9 5.9 7.5 28.8 5.4 6.9 13.2 18.4 43.9 20.1 21.6 23.5 24.4 89.6 25.7
Operating costs -464.5 -499.7 -444.9 -562.4 -1 971.5 -512.9 -542.4 -510.7 -591.7 -2 157.7 -507.4 -1 351.8 -1 992.5 -2 125.4 -5 977.1 -1 909.0 -1 899.5 -1 900.1 -2 159.3 -7 867.9 -1 948.0
Content costs -206.8 -226.6 -171.5 -219.0 -823.9 -207.5 -239.5 -219.3 -260.7 -927.0 -210.6 -260.9 -262.4 -295.6 -1 029.5 -235.5 -274.0 -257.3 -299.1 -1 065.9 -248.5
Distribution, marketing, customer relation management and retention costs
-71.5 -71.8 -73.7 -95.7 -312.7 -79.0 -81.3 -79.3 -92.4 -332.0 -75.4 -132.2 -186.8 -218.3 -612.7 -189.2 -193.2 -200.1 -220.1 -802.6 -200.5
Depreciation, amortization, impairment and liquidation
-54.4 -56.7 -60.2 -71.7 -243.0 -60.7 -62.3 -64.8 -68.6 -256.4 -62.5 -311.3 -478.3 -443.8 -1 295.9 -467.9 -393.5 -401.2 -436.7 -1 699.3 -423.7
Technical costs and cost of settlements with telecommunication operators
-49.7 -55.1 -58.6 -59.3 -222.7 -60.7 -62.0 -62.2 -71.4 -256.3 -71.3 -288.0 -495.9 -557.2 -1 412.4 -482.3 -522.4 -551.2 -585.1 -2 141.0 -550.3
Salaries and employee-related costs -40.6 -40.3 -38.9 -58.6 -178.4 -43.1 -41.9 -40.4 -53.2 -178.6 -44.6 -108.2 -118.0 -150.9 -421.7 -129.1 -140.8 -122.3 -158.0 -550.2 -137.9
Cost of equipment sold -5.5 -7.6 -7.0 -16.1 -36.2 -25.8 -16.8 -10.7 -10.6 -63.9 -10.3 -189.7 -348.6 -376.6 -925.2 -332.5 -291.7 -314.9 -393.6 -1 332.8 -326.8
Cost of debt collection services and bad debt allowance and receivables written off
-5.9 -8.4 -5.3 -7.8 -27.4 -6.4 -9.3 -5.3 -7.2 -28.2 -6.7 -18.1 -15.3 -27.5 -67.6 -18.7 -27.8 -8.5 -7.6 -62.6 -9.6
Other costs -30.1 -33.2 -29.7 -34.2 -127.2 -29.7 -29.3 -28.7 -27.6 -115.3 -26.0 -43.4 -87.2 -55.5 -212.1 -53.8 -56.1 -44.6 -59.1 -213.5 -50.7
Other operating income. net -1.7 -1.1 -2.0 -12.7 -17.5 0.5 1.5 36.8 -2.0 36.8 3.6 3.5 4.7 -2.2 9.6 8.7 13.8 14.4 -6.2 30.7 6.8
Profit from operating activities 203.0 213.0 197.6 175.5 789.1 184.7 195.0 203.4 206.8 789.9 219.5 397.6 431.8 393.5 1 442.4 428.7 583.5 529.2 444.4 1 985.8 422.8
Gain/loss on investment activities, net 12.5 -8.5 5.3 5.0 14.3 3.9 0.7 7.4 4.1 16.1 1.2 23.9 1.5 -11.4 15.2 28.9 -11.9 -5.2 -3.2 8.6 -35.2
Finance costs 30.1 -92.4 -5.2 -43.1 -110.6 -80.1 -102.4 -10.7 -22.8 -216.0 -108.7 -273.4 -384.7 -379.2 -1 146.0 -261.3 -222.1 88.8 -270.0 -664.6 -182.7
Share of the profit of a joint venture accounted for using the equity method
0.7 0.8 0.5 0.8 2.8 0.8 0.8 0.7 0.6 2.9 0.6 0.7 0.7 0.6 2.6 0.5 0.9 0.5 0.7 2.6 0.8
Gross profit for the period 246.3 112.9 198.2 138.2 695.6 109.3 94.1 200.8 188.7 592.9 112.6 148.8 49.3 3.5 314.2 196.8 350.4 613.3 171.9 1 332.4 205.7
Income tax -41.2 -13.4 -26.2 -16.6 -97.4 -14.1 -13.4 -24.4 -15.5 -67.4 -14.4 -16.7 -1.1 10.5 -21.7 -26.0 -45.9 -110.8 13.7 -169.0 -27.2
Net profit for the period 205.1 99.5 172.0 121.6 598.2 95.2 80.7 176.4 173.2 525.5 98.2 132.1 48.2 14.0 292.5 170.8 304.5 502.5 185.6 1 163.4 178.5
EBITDA 257.4 269.7 257.8 247.2 1 032.1 245.4 257.3 268.2 275.4 1 046.3 282.0 708.9 910.1 837.3 2 738.3 896.6 977.0 930.4 881.1 3 685.1 846.5
EBITDA margin 38.5% 37.8% 40.0% 32.9% 37.2% 35.2% 35.0% 39.6% 34.4% 35.9% 39.0% 40.6% 37.6% 33.2% 37.0% 38.5% 39.6% 38.5% 33.8% 37.5% 35.8%

Glossary
63
RGU (Revenue Generating Unit)
Single, active service of pay TV, Internet Access or mobile telephony provided in contract or prepaid model.
Customer Natural person, legal entity or an organizational unit without legal personality who has at least one active service provided in a contract model.
Contract ARPU Average monthly revenue per Customer generated in a given settlement period (including interconnect revenue).
Prepaid ARPU Average monthly revenue per prepaid RGU generated in a given settlement period (including interconnect revenue).
Churn Termination of the contract with Customer by means of the termination notice, collections or other activities resulting in the situation that after termination of the contract the Customer does not have any active service provided in the contract model.
Churn rate presents the relation of the number of customers for whom the last service has been deactivated (by means of the termination notice as well as deactivation as a result of collection activities or other reasons) within the last 12 months to the annual average number of customers in this 12-month period.
Usage definition (90-day for prepaid RGU)
Number of reported RGUs of prepaid services of mobile telephony and Internet access refers to the number of SIM cards which received or answered calls, sent or received SMS/MMS or used data transmission services within the last 90 days. In the case of free of charge Internet access services provided by Aero 2, the Internet prepaid RGUs were calculated based on only those SIM cards, which used data transmission services under paid packages within the last 90 days.
Contact Investor Relations Łubinowa 4A 03-878 Warsaw Phone: +48 (22) 356 6004 / +48 (22) 426 85 62 / +48 (22) 356 65 20 Email: [email protected]
www.grupapolsat.pl