Embed Size (px)
Citation preview

Cypress College• 9200 Valley View Street, Cypress, CA 90630• (714) 484-7000
www.cypresscollege.edu
Student Equity Plan December 2015

2
3
CYPRESS COLLEGE STUDENT EQUITY PLAN
Table of Contents
Signature Page
Executive Summary
Target Groups
Goals
Activities
Student Equity Funding and Other Resources
Contact Person/Student Equity Coordinator
Planning Committee and Collaboration
Access
Campus-Based Research
Overview
Indicator Definitions and Data
Conclusions: Disproportionately Impacted Student Groups
Goals, Activities, Funding, and Evaluation
Access Baseline Data and Goals
Activities to Improve Access for Target Student Groups
Expected Outcomes for Target Student Groups
Course Completion
Campus-Based Research
Overview
Indicator Definitions and Data
Conclusions: Disproportionately Impacted Student Groups
Goals, Activities, Funding, and Evaluation
Course Completion Baseline Data and Goals
Activities to Improve Course Completion for Target Student Groups
Expected Outcomes for Target Student Groups
ESL and Basic Skills Completion
Campus-Based Research
Overview
Indicator Definitions and Data
Conclusions: Disproportionately Impacted Student Groups
Goals, Activities, Funding, and Evaluation
ESL and Basic Skills Completion Baseline Data and Goals

4
Activities to Improve ESL and Basic Skills Completion for Target Student Groups
Expected Outcomes for Target Student Groups
Degree and Certificate Completion
Campus-Based Research
Overview
Indicator Definitions and Data
Conclusions: Disproportionately Impacted Student Groups
Goals, Activities, Funding, and Evaluation
Degree and Certificate Completion Baseline Data and Goals
Activities to Improve Degree and Certificate Completion for Target Student Groups
Expected Outcomes for Target Student Groups
Transfer
Campus-Based Research
Overview
Indicator Definitions and Data
Conclusions: Disproportionately Impacted Student Groups
Goals, Activities, Funding, and Evaluation
Transfer Baseline Data and Goals
Activities to Improve Transfer for Target Student Groups
Expected Outcomes for Target Student Groups
Other College- or District-wide Initiatives Affecting Several Indicators
Goals, Activities, Funding and Evaluation
Goals Addressed by Activities
Activities, Funding, and Evaluation to Improve Outcomes for Target Student Groups
Summary Budget
Summary Budget spreadsheet
Summary Evaluation Plan

5
Cypress College
Student Equity Plan Signature Page
District: North Orange County Community College District Board of Trustees Approval
Date:
I certify that this plan was reviewed and approved by the District Board of Trustees on the date
shown above. I also certify that student equity categorical funding allocated to my college or
district will be expended in accordance with the Student Equity Expenditure Guidelines
published by the California Community College Chancellor's Office (CCCCO).
College President: Dr. Robert Simpson Email
I certify that student equity categorical funding allocated to my college will be expended in
accordance with the Student Equity Expenditure Guidelines published by the CCCCO.
[email protected] Vice President of Administrative Services: Karen Cant Email
District Director of Fiscal Affairs: Rodrigo Garcia Email
I certify that I was involved in the development of the plan and support the research goals,
activities, budget, and evaluation it contains.
Executive Vice President of
Educational Programs and Student Services:
Dr. Santanu Bandyopadhyay
I certify that Cypress College Academic Senate representatives were involved in the
development of the plan, and the Senate supports the research goals, activities, budget, and
evaluation it contains.
Academic Senate President: Jolena Grande Email
I certify that Classified representatives were involved in the development of the plan, and the
Senate supports the research goals, activities, budget and evaluation it contains.

6
EOP&S/CARE Coordinator: Liliann Perez Email
I certify that Associated Students Representatives were involved in the development of the plan
and supports the research goals, activities, budget, and evaluation it contains.
[email protected] Associated Students President: Angelyn Garcia Email
[email protected] (714) 484-7425 Special Project Director, Student Equity:
Ashley Griffith Email Phone

7
Executive Summary
Introduction
The Cypress College motto, Minds. Motivated., embodies the mission of the college, which
reads:
Cypress College enriches students’ lives by providing high quality education for transfer
to four-year institutions, associate degrees, career technical education, and certificate
coursework, as well as basic skills and opportunities for lifelong learning. The college is
committed to promoting student learning and success, embracing diversity, and
contributing to both the economic and social development of the surrounding community.
Expanding on the promise to our educational stakeholders, including students, staff, faculty,
administration, and the community, the Student Equity (SE) Committee’s mission asserts the
College’s dedication to “Identify, address, and reduce disparities in students’ access and
achievement, opening pathways to more equal opportunities for student success.”
The Cypress College Student Equity Plan (SEP) is designed to locate and address
disproportionate impact and identify the appropriate goals, objectives, and activities needed to
counter inequities.
The Cypress College Student Equity Committee has grown to include more faculty and student
support/staff representation per the requirements of the Chancellor’s Office, and to ensure
inclusiveness and representation from Student Equity stakeholders. The committee now consists
of deans from Mathematics, Language Arts, and Counseling and Student Support Services,
several faculty members, the Office of Institutional Research, several counselors, several student
representatives, including the Student Trustee, who serves on the Board of Trustees, and several
program directors and managers.
Target Groups & Goals The Office of Institutional Research assessed student equity as required by student success
legislation SB 1456 and Title 5 regulations. Following the SEP instructions for identifying target
groups, the SE Committee identified several student groups who achieve success at significantly
lower rates than those who are in the highest performing groups. Utilizing both proportionality
indices and 80-percent indices, the team identified equity gaps in more than one measure among
students who identify as African American/Black, Latino, foster youth, and veterans, and
identified an equity gap in one measure among students who are men, Filipino, and students with
a documented disability. In addition, the College has identified resources and strategies to
address and monitor equity issues within the population groups (identified in the bullet points
below) by utilizing the five SE success indicators. The following bulleted list identifies each
indicator as well as the goals for each population group targeted for intervention in those
categories:

8
Access o Identify barriers to enrollment for male students who are underrepresented on
campus when compared to the overall population.
o Identify barriers to enrollment for Asian American/Pacific Islander (AAPI)
students who are not adequately represented at Cypress College in comparison to
the service area.
o Increase support services to students between the ages of 25-49 to ensure access
for non-traditional students (i.e. a student not transitioning from high school).
Course Completion o Identify barriers to course completion for African American, Pacific Island, and
American Indian/Alaskan Native students.
ESL and Basic Skills Completion o ESL: Identify strategies and solutions to increase proportional completion rates
for students not receiving financial aid, male students, and students between the
ages of 25-49.
o Basic Skills Mathematics: Identify strategies and solutions to increase
proportionality in completion for African American students, students with
disabilities, and students between the ages of 25-49.
o Basic Skills English: Identify strategies and solutions to increase proportionality
in completion for students between the ages of 20-24, 25-49, and Hispanic/Latino
students.
Degree and Certificate Completion o Determine how to increase degree and certificate completion rates for all students,
with special attention given to AAPI students, male students, and students
between the ages of 20 - 24.
Transfer o Identify barriers affecting the transfer rate of all students, specifically students
with disabilities, and students between the age groups of 20-24 and 25-49.
Commonly Used Acronyms
The following is a list of commonly used acronyms for departments and programs throughout the
remainder of the SEP:
Associated Students – AS
California Work Opportunity and Responsibility to Kids – CalWORKs
Cooperative Agencies Resources for Education Programs and Services – CARE
Disability Support Services – DSS
Extended Opportunity, Programs and Services – EOP&S
Science Institute for Underrepresented Students – SIfUS
Strengthening Transfer Education and Matriculation in Science, Technology, Engineering
and Mathematics – STEM2
Veteran’s Resource Center – VRC

9
Activities of the 2015 - 2016 SEP Revisiting the activities of the prior Equity Plan, the SEP Committee explored ways to increase
research and inquiry to address disproportionate impact on specific student populations, increase
collaboration with faculty and staff to support professional development opportunities that will
foster student success, and increase support to programs that directly support students.
The following activities display Equity funded initiatives for the 2015-2016 budgeted year:
Access
Target Population(s) Methodology Current gap*, year Goal Goal Year
25-49 year olds Proportionality -6.6%, 2015 Gap no > than -2% 2017
Asian American/Pacific
Islander
Proportionality -5.9%, 2015 Gap no > than -2% 2017
Males Proportionality -5.1%, 2015 Gap no > than -2% 2017 *Note. All three target populations displayed disproportionate impact utilizing the proportionality ratios for access.
Activities
A.1 Increase Outreach services to target populations utilizing multi-lingual, multi-racial,
gender, and age diverse Student Ambassadors during key programs and promotional
events, such as: Senior Day, high school visits, and community outreach activities.
A.2 Increase funding to Summer Boost program, which offers first-time students assessed
into Basic Skills math and/or English a Summer refresher workshop that could lead to
placement in the next level English or math class, 12 units guaranteed for Fall
registration, priority registration, and guaranteed counselor contacts throughout the
academic year.
A.3 Continue outreach to non-English speaking families and students by translation of
key campus materials, collaboration with ESL department and Campus Communications
on marketing through the Cypress College website and community outlets, and language
specific breakout sessions during campus family nights/welcome back events.

10
Course Completion
Target Population(s) Methodology Current gap*, year Goal Goal Year
Pacific Islander students 80-percent -8.2%, Fall 2014 Gap no > than -4% 2017
African American students 80-percent -7.3%, Fall 2014 Gap no > than -4% 2020
American Indian/Alaskan
Native students
80-percent -5.5%, Fall 2014 Gap no > than -4% 2017
*Note. There was no disproportionate impact utilizing the 80-percent index for course completion
Activities:
B.1 & B.2 Increase funding to culturally-themed programs that support students of color
including Puente and Legacy, which has now joined the Umoja community.
B.3 Increase funding to the Library and Learning Resource Center to increase the number
of Supplemental Instructors in various classes and specialized programs. The Veteran’s
Resource Center will offer Supplemental Instruction and tutoring services directly in their
center as many veteran students view this area as a “safe space.” Per the Chancellor’s
Office feedback, attention to the support offered to veterans is now clearly stated in this
plan.
B.4 Provide Lending Libraries through several programs and divisions to relieve the
financial burden that prevent students from completing their degree/certificate goals.
Collaboration with the Financial Aid office will assist in identifying students with a
financial need, and low-income students. Per the Chancellor’s Office feedback, low-
income students were a required target population that was not addressed in the 14-15
plan.

11
ESL and Basic Skills Completion
ESL Completion
Target Population(s) Methodology Current gap*, year Goal Goal Year
Male Students 80-percent -7.3%, 2008-2009 cohort Gap no > than -3% 2017
Financial aid non-recipients 80-percent -7.2%, 2008-2009 cohort Gap no > than -3% 2017
25-29 year old students 80-percent -4.5%, 2008-2009 cohort Gap no > than -3% 2017 *Note. All three of the target populations displayed disproportionate impact, utilizing the 80-percent index for ESL
completion.
English Basic Skills Completion
Target Population(s) Methodology Current gap*, year Goal Goal Year
25-49 year old students 80-percent -14.1%, 2008-2009 cohort Gap no > than -7% 2020
Hispanic students 80-percent -3.4%, 2008-2009 cohort Gap no > than -2% 2017
20-24 year old students 80-percent -3.3%, 2008-2009 cohort Gap no > than -2% 2017 *Note. Only 25-49 year old students had disproportionate impact on English basic skills completion utilizing the 80-
percent index.
Mathematics Basic Skills Completion
Target Population(s) Methodology Current gap*, year Goal Goal Year
African-American students 80-percent -8.7%, 2008-2009 cohort Gap no > than -6% 2018
Students with disabilities 80-percent -6.1%, 2008-2009 cohort Gap no > than -3% 2018
25-49 year old students 80-percent -5.4%. 2008-2009 cohort Gap no > than -3% 2018 *Note. All target populations had disproportionate impact for mathematics basic skills completion utilizing the 80-
percent index.
Activities:
C.1 Hire a new, full-time Learning Disability Specialist in the DSS Department to
operate its Learning Disability program. Student Equity will supplement funding to the
program allowing the LD Specialist to facilitate interactive workshops that engage
students and assist with their academic progress.
C.2 Hire a new Student Services Specialist to schedule and implement testing services
and accommodations for students with disabilities. DSS testing services is one of the
most frequently used accommodations, and the number of students requiring this
accommodation is increasing. Each year, DSS proctors over 2,500 exams; of these
exams, over 650 are math exams.
C.3 Expand the English Department’s ACCESS program that allows faculty to educate
students in their Basic Skills English 60 class on resources around campus. Students
participate in campus tours, workshops, and exploration opportunities with their faculty
to support relationship building, campus engagement and persistence.

12
C.4 Fund the College Success Factors Index (CSFI) instrument which measures the
extent to which an individual has acquired and routinely demonstrates key skills
associated with academic success in a college environment.
Degree/Certificate Completion
Target Population(s) Methodology Current gap*, year Goal Goal Year
20-24 year old students 80-percent -4.8%, 2008-2009 cohort Gap no > than -2% 2018
Male students 80-percent -3.8%, 2008-2009 cohort Gap no > than -2% 2018
Asian students 80-percent -2.1%, 2008-2009 cohort No gap 2020 *Note. All three target populations had disproportionate impact for degree and certificate completion utilizing the
80-percent index.
Activities
D.1 Continue participation in the M2C3 Consortium. In June 2015, Cypress College
became a part of the M2C3 consortium co-directed by Dr. Frank Harris III and Dr. J.
Luke Wood of San Diego State University. As a member of the consortium, Cypress
College will have access to a vast clearinghouse of resources provided by M2C3. The
collaborative frequently facilitates webinars on male students of color and creates virtual
discussion boards to encourage dialogue on best practices. Cypress’ collaboration with
M2C3 will enhance professional development for faculty and staff, enable informed
interventions for our current programs serving men of color, and inspire new initiatives
addressing challenges facing these men. During the 2015 – 2016 academic year, M2C3
will host several professional development workshops, and a student panel to assist in our
student equity efforts.
D.2 Expand Professional Development offerings. Professional Development Student
Equity Series will focus on helping new faculty, continuing faculty, and staff with
strategies to work effectively towards equity. Faculty and staff will participate in
workshops geared toward creating cultural competency within an institutional setting.
Sessions include: Working effectively with men/women of color, working with LGBTQ
students, creating an equity-minded syllabus, and closing the achievement gap within
your classroom.
Transfer
Transfer Completion
Target Population(s) Methodology Current gap*, year Goal Goal Year
25-49 year old students 80-percent -27.0%, 2008-2009 cohort -20% 2020
Students with disabilities 80-percent -17.0%, 2008-2009 cohort -10% 2020
20-24 year old students 80-percent -10.0%, 2008-2009 cohort -5% 2020
*Note. All three target populations had disproportionate impact for transfer completion utilizing
the 80-percent index.

13
Activities:
E.1 Introduce an educational pathway for entering-students majoring in one of the
sciences. The Science Institute will be tailored for historically underrepresented and
underserved students and work in tandem with the STEM2 program which offers
counseling, Supplemental Instruction, transfer support to any 4-year university, and
networking opportunities for participating students.
E.2 Provide funding to EOP&S support of low-income students to increase awareness of
four-year university/colleges transfer options for students, and increase workshops
tailored toward transfer preparation.
E.3 Provide funding for the STEM2, which is designed to help students reach their
potential by creating unique career, educational, scholarship, and transfer opportunities
that will aid in their future successes in the vital fields of science, technology,
engineering, and mathematics.
Other College or District-Wide Initiatives Affecting Several Indicators
The goal for college-wide initiatives is to provide the capacity for student equity research,
coordination, planning, implementation, and evaluation efforts.
Activities:
F.1 Continue funding of a full-time Special Project Director of Student Equity to plan,
develop, direct, and manage the Cypress College Equity initiative; continue funding of a
full-time Senior Research Analyst to support Student Equity research and inquiry; and
fund a new, full-time position for a Student Equity Administrative Assistant to facilitate
the day-to-day operations of the Equity Office.
F.2 Utilize Equity funding to support a new, full-time position of Special Project
Coordinator for the Veteran’s Resource Center (VRC). In the previous plan, the
Chancellor’s Office feedback identified a lack of attention given to the required target
population.
F.3 Provide funding to the ASO to support their student groups tailored for the Equity
plan’s target populations such as the Black Student Union (BSU), Cypress College
Veterans Organization (CCVO), the Gay-Straight Alliance (GSA) club and the Puente
Club. An AAPI student club is also planned to roll out during the 2015-2016 academic
year.
F.4 The Office of Student Equity will roll out its plans for a new project titled the Equity
Ally Project. Cypress will begin this project with a Student Equity retreat to educate
faculty, staff, and student leaders on the Equity initiative. Several workshops will be led
by Equity leaders and educators such as Drs. Frank Harris and J. Luke Wood, Co-
Directors of M2C3, Dr. Veronica Neal, Director of Equity and Inclusion at DeAnza
College, and James Gray, Community College of Aurora, Math Faculty and renowned
speaker on the topic of equity in the classroom.

14
Expenditures Classification Totals
1000 Academic Salaries $43,406
2000 Non-Academic Salaries $450,816
3000 Employee Benefits $114,753
4000 Supplies and Materials $273,207
5000 Other Operating Expenditures $264,005
6000 Capital Outlay 16,020
7000 Other Outgo
Total $1,162,207
Planning Committee and Collaboration
The Student Equity Committee at Cypress College has grown as the initiative is coordinated with
institution-wide planning. The purpose of the committee is to development, implement, and
evaluate the Equity plan on an ongoing basis. Additionally, the Equity committee informs the
projects, programs, and activities that receive Equity funding. The spirit of cooperativeness and
collaboration at Cypress College provided for a committee with representation from various
departments and divisions on campus.
The campus plans to engage Dr. Veronica Neal, Director of the Office of Equity, Social Justice
and Multicultural Education at DeAnza College in Cupertino, CA, with restructuring the Student
Equity committee to ensure that the equity initiative is practiced through each academic division
and student services department. Dr. Neal will provide tools and strategies to assist us in creating
an Equity Council with a task force in each division and department, and Equity facilitators for
that area. The facilitator will report at each division meeting with any pertinent information
regarding Equity updates for their division/department. The goal is to cultivate a campus climate
and culture of equitable opportunities leading to equal outcomes for all students.
Additionally, ongoing collaboration with our sister college, Fullerton College, as well as the
School of Continuing Education provides for continued communication regarding best practices
for expending Equity funding. Four percent of the North Orange County Community College
District’s SE allocation will be used for district-wide activities representing $46,000 of Cypress’
allotment.
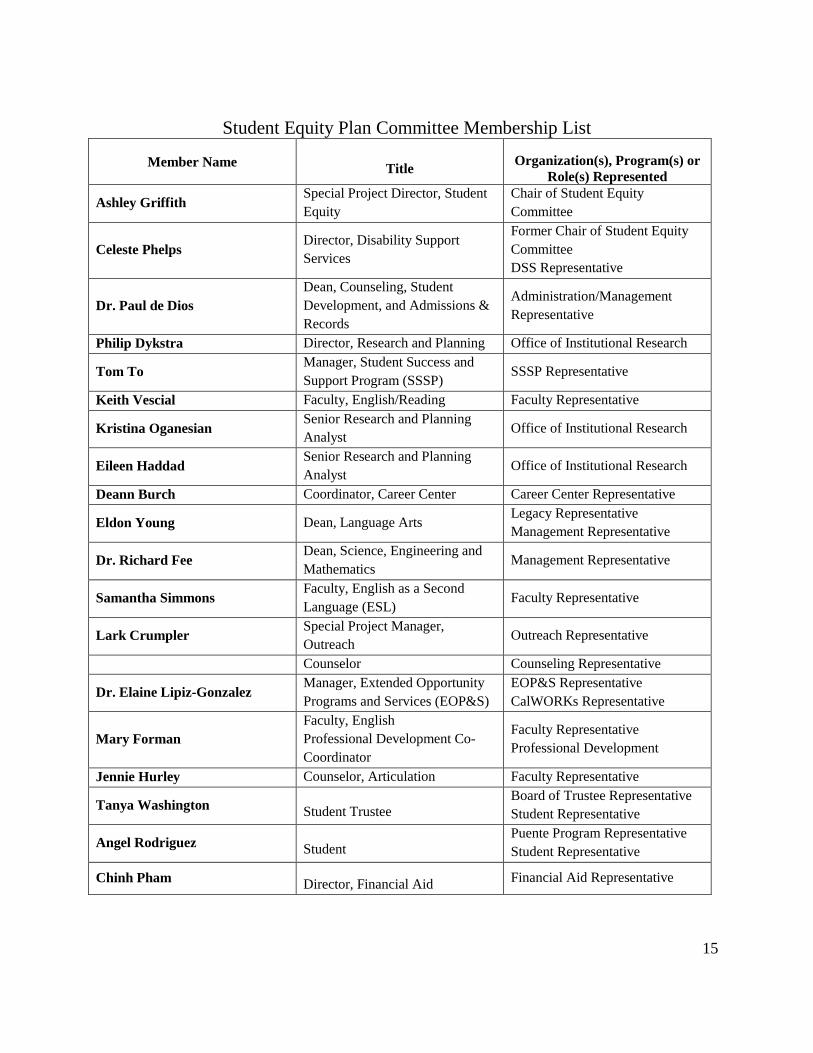
The following table details the current Cypress College Student Equity Committee membership
and their areas of service:
15
Student Equity Plan Committee Membership List
Member Name Title
Organization(s), Program(s) or
Role(s) Represented
Ashley Griffith Special Project Director, Student
Equity
Chair of Student Equity
Committee
Celeste Phelps Director, Disability Support
Services
Former Chair of Student Equity
Committee
DSS Representative
Dr. Paul de Dios
Dean, Counseling, Student
Development, and Admissions &
Records
Administration/Management
Representative
Philip Dykstra Director, Research and Planning Office of Institutional Research
Tom To Manager, Student Success and
Support Program (SSSP) SSSP Representative
Keith Vescial Faculty, English/Reading Faculty Representative
Kristina Oganesian Senior Research and Planning
Analyst Office of Institutional Research
Eileen Haddad Senior Research and Planning
Analyst Office of Institutional Research
Deann Burch Coordinator, Career Center Career Center Representative
Eldon Young Dean, Language Arts Legacy Representative
Management Representative
Dr. Richard Fee Dean, Science, Engineering and
Mathematics Management Representative
Samantha Simmons Faculty, English as a Second
Language (ESL) Faculty Representative
Lark Crumpler Special Project Manager,
Outreach Outreach Representative
Counselor Counseling Representative
Dr. Elaine Lipiz-Gonzalez Manager, Extended Opportunity
Programs and Services (EOP&S)
EOP&S Representative
CalWORKs Representative
Mary Forman
Faculty, English
Professional Development Co-
Coordinator
Faculty Representative
Professional Development
Jennie Hurley Counselor, Articulation Faculty Representative
Tanya Washington Student Trustee
Board of Trustee Representative
Student Representative
Angel Rodriguez Student
Puente Program Representative
Student Representative
Chinh Pham Director, Financial Aid
Financial Aid Representative
16
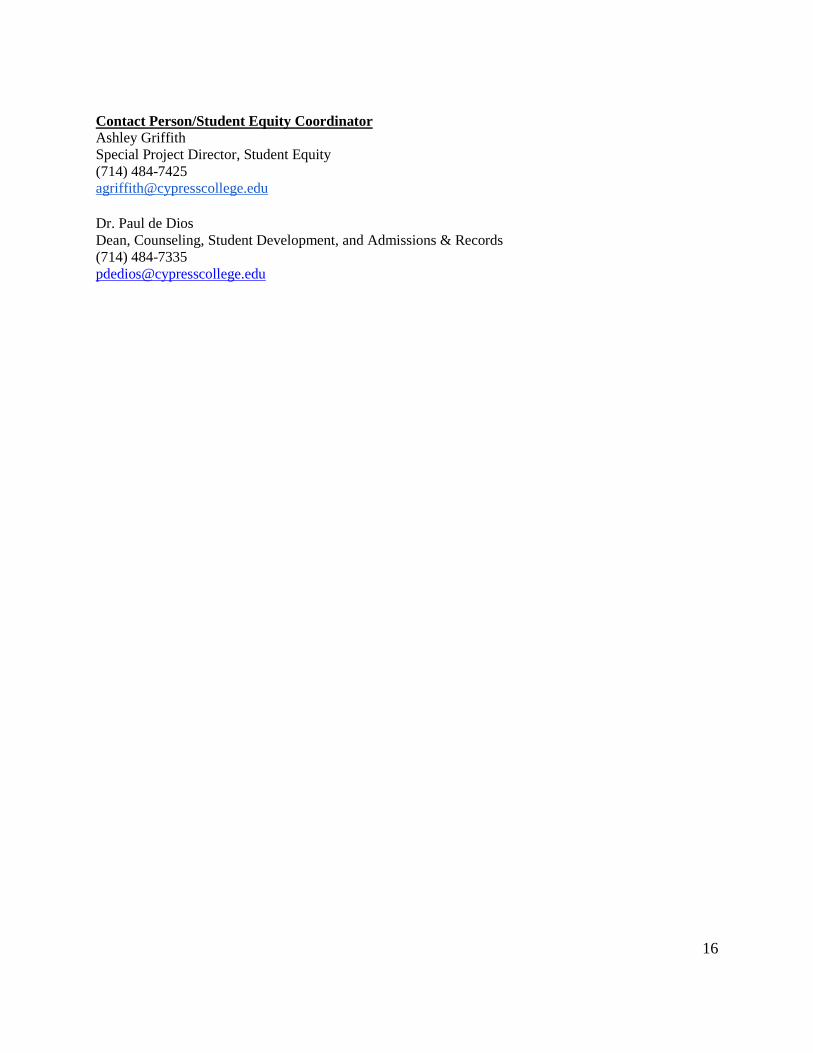
Contact Person/Student Equity Coordinator Ashley Griffith Special Project Director, Student Equity (714) 484-7425 [email protected] Dr. Paul de Dios
Dean, Counseling, Student Development, and Admissions & Records (714) 484-7335 [email protected]
17
Access
Campus Based Research
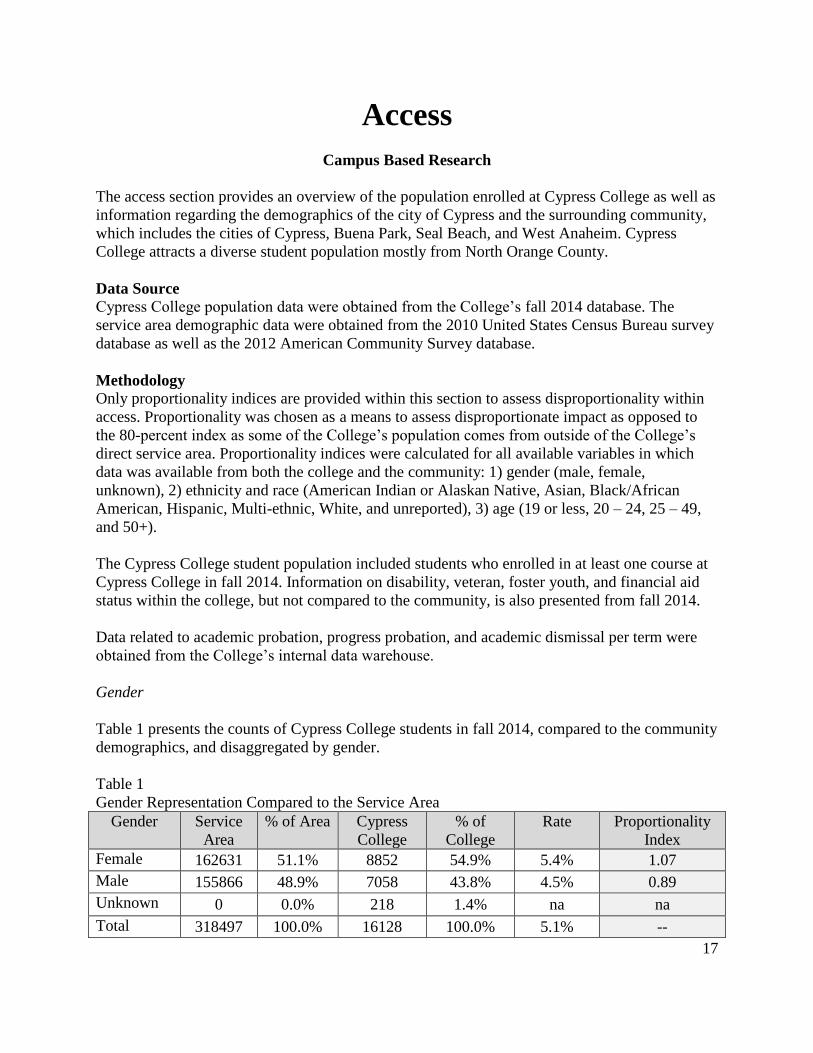
The access section provides an overview of the population enrolled at Cypress College as well as
information regarding the demographics of the city of Cypress and the surrounding community,
which includes the cities of Cypress, Buena Park, Seal Beach, and West Anaheim. Cypress
College attracts a diverse student population mostly from North Orange County.
Data Source
Cypress College population data were obtained from the College’s fall 2014 database. The
service area demographic data were obtained from the 2010 United States Census Bureau survey
database as well as the 2012 American Community Survey database.
Methodology
Only proportionality indices are provided within this section to assess disproportionality within
access. Proportionality was chosen as a means to assess disproportionate impact as opposed to
the 80-percent index as some of the College’s population comes from outside of the College’s
direct service area. Proportionality indices were calculated for all available variables in which
data was available from both the college and the community: 1) gender (male, female,
unknown), 2) ethnicity and race (American Indian or Alaskan Native, Asian, Black/African
American, Hispanic, Multi-ethnic, White, and unreported), 3) age (19 or less, 20 – 24, 25 – 49,
and 50+).
The Cypress College student population included students who enrolled in at least one course at
Cypress College in fall 2014. Information on disability, veteran, foster youth, and financial aid
status within the college, but not compared to the community, is also presented from fall 2014.
Data related to academic probation, progress probation, and academic dismissal per term were
obtained from the College’s internal data warehouse.
Gender
Table 1 presents the counts of Cypress College students in fall 2014, compared to the community
demographics, and disaggregated by gender.
Table 1
Gender Representation Compared to the Service Area
Gender Service
Area
% of Area Cypress
College
% of
College
Rate Proportionality
Index
Female 162631 51.1% 8852 54.9% 5.4% 1.07
Male 155866 48.9% 7058 43.8% 4.5% 0.89
Unknown 0 0.0% 218 1.4% na na
Total 318497 100.0% 16128 100.0% 5.1% --

18
Source: Data Ferret, 2012 American Community Survey data (community geography consists of
Cypress, Buena Park, Seal Beach, and West Anaheim).
Male students were underrepresented in the Cypress College population, when compared to the
overall population. Within the college, males had disproportionate impact of access compared to
females.
Ethnicity/Race
Table 2 presents the counts of Cypress College students in fall 2014, compared to the community
demographics, and disaggregated by ethnicity/race.
Table 2
Ethnic and Racial Representation Compared to the Service Area
Ethnicity /
Race
Service
Area
% of
Area
Cypress
College
% of
College
Rate Proportionality
Index
Am. Indian 142 0.3% 102 0.6% 71.8% 2.13
Asian/ PI 15054 31.5% 4131 25.6% 27.4% 0.81
Black 1376 2.9% 850 5.3% 61.8% 1.83
Hispanic 8779 18.4% 7429 46.1% 84.6% 2.51
M. Ethnic 1499 3.1% na na na na
White 20865 43.6% 3391 21.0% 16.3% 0.48
Unreported 87 0.2% 225 1.4% 258.6% 7.67
Total 47802 100.0% 16128 100.0% 33.7% --
Source: American Fact Finder; 2010 Decennial Census (community geography consists only of
Cypress, CA).
Considering the proportionality index, American Indian, Black/African American, and Hispanic
students, along with students who did not report their ethnicity, had the most overrepresentation
in the Cypress College population when compared to the service area. However, white and Asian
American/Pacific Islander students did not have adequate representation in the college
population when compared to the service area.
Age
Table 3 presents the counts of Cypress College students in fall 2014, compared to the community
demographics, disaggregated by age.

19
Table 3
Age Representation Compared to the Service Area
Age Service
Area
% of
Area
Cypress
College
% of
College
Rate Proportionality
Index
19 or less 78772 25.1% 3885 24.1% 4.9% 0.96
20-24 23740 7.6% 7249 44.9% 30.5% 5.94
25-49 107983 34.4% 4491 27.8% 4.2% 0.81
50+ 103295 32.9% 503 3.1% 0.5% 0.09
Total 313790 100.0% 16128 100.0% 5.1% --
Source: Data Ferret, 2012 American Community Survey data (community geography consists of
Cypress, Buena Park, Seal Beach, and West Anaheim).
Students aged 20-24 only represented 7.6% of the service area’s population, while representing
44.9% of the population in the college. Thus, students aged 25-49 and 50+ all had
disproportionately less representation at the College when compared to the service area.
Disability Status
Table 4 presents the counts of Cypress College students in fall 2014, disaggregated by disability
status.
Table 4
Cypress College Students’ Disability Status
Disability
Status
Fall
2014
% of
Students
Yes 687 4.3%
No 15444 95.7%
Total 16131 100.0%
Information regarding representation of the disabled population within the community was not
available. However, data from fall 2014 indicated that students with disabilities represented 4.3%
of the population within the College.
Veteran Status
Table 5 presents the counts of Cypress College students in fall 2014, disaggregated by veteran
status.
Table 5
Cypress College Students’ Veteran Status
Veteran
Status
Fall
2014
% of
Students
Veteran 587 3.6%
Non-Vet. 15544 96.4%
Total 16131 100.0%

20
Information regarding representation of the veteran population within the community was not
available. However, data from fall 2014 indicated that veteran students comprised 3.6% of the
population within the College.
Financial Aid Status
Table 6 presents the counts of Cypress College students in fall 2014, disaggregated by financial
aid status.
Table 6
Cypress College Students’ Financial Aid Status
Financial Aid
Status
Fall
2014
% of
Students
Received 10723 66.5%
Did not receive 5408 33.5%
Total 16131 100.0%
Data indicates that for fall 2014, most Cypress College students did receive some form of
financial aid.
Foster Youth Status
Table 7 presents the counts of Cypress College students in fall 2014, disaggregated by foster
youth status.
Table 7
Cypress College Students’ Foster Youth Status
Foster Youth
Status
Fall
2014
% of
Students
Yes 58 0.36%
No 16073 99.64%
Total 16131 100.0%
Data indicates that for fall 2014, less than one percent of students identified as foster youth.
Academic/Progress Probation and Disqualification
Probation and Dismissal
Table 8 presents the counts for students, beginning in 2008-2009 and spanning until 2014-2015,
placed on probation and dismissed.
Table 8
Academic/Progress Probation and Dismissal by term

21
Term Progress
Probation Count
Academic
Probation Count
Progress &
Academic
Probation Count
Dismissal
Count
Fall 2008 751 1602 122 0
Spring 2009 458 1100 23 1192
Fall 2009 699 1712 119 0
Spring 2010 388 1098 14 1152
Fall 2010 526 1363 68 0
Spring 2011 339 1091 17 831
Fall 2011 445 1231 50 0
Spring 2012 284 900 7 598
Fall 2012 371 1130 40 0
Spring 2013 321 1014 12 617
Fall 2013 387 1317 37 0
Spring 2014 286 1077 9 675
Fall 2014 418 1425 34 0
Spring 2015 353 1124 12 712
At Cypress College, students can be placed on probation during any term; however, students are
only dismissed in the spring semesters. The data indicate that the number of students being
placed on any type of probation or dismissal has decreased from fall 2008. In spring 2012, the
College had its lowest number of students being placed on all types of probation and pending
dismissal. From that point on, the number of students being placed on probation and dismissed
has slightly increased; however, when compared to Fall 2008, the College still has fewer students
facing probation or dismissal overall.
GOALS, ACTIVITIES, FUNDING AND EVALUATION: ACCESS
GOAL A.
The goal is to improve access for the following target populations identified in the college
research as experiencing a disproportionate impact:
Target Population(s) Methodology Current gap*, year Goal Goal Year
25-49 year olds Proportionality -6.6%, 2015 Gap no > than -2% 2017
Asian American/Pacific
Islander
Proportionality -5.9%, 2015 Gap no > than -2% 2017
Males Proportionality -5.1%, 2015 Gap no > than -2% 2017
*Note. All three target populations displayed disproportionate impact utilizing the
proportionality ratios for access.

22
ACTIVITIES: A. ACCESS
A.1 – Outreach Program
Activity Type(s)
X Outreach Student Equity
Coordination/Planning
Instructional Support
Activities
Student Services or
other Categorical
Program
Curriculum/Course
Development or
Adaptation
X Direct Student Support
Research and Evaluation Professional Development
Target Student Group(s) & # of Each Affected:
ID Target Group Affected
A.1 Students ages 25-49 4,491
AAPI/Pacific Islander 4,131
Males 7,058
Activity Implementation Plan
The Outreach Manager facilitates the Student Ambassador Program, manages the campus
Welcome Center, coordinates campus tours, and acts as the liaison between the K-12 local
school community and Cypress College. On campus, this manager leads Outreach Advisory
meetings while maintaining the campus outreach calendar, which centralizes all campus outreach
activities and informs campus staff and faculty of all outreach events.
The Student Ambassador Program consists of 16 Cypress College students who provide a
credible resource for the prospective, new, and continuing students at Cypress College. Sharing
their experiences and tips, they support all students while staffing the Welcome Center, visiting
33 high schools on a monthly basis, participating in high school college fairs, conducting campus
tours, and regularly delivering presentations to continuing education students through the SCE
locations, all within the NOCCCD boundaries.
In addition to direct communication with prospective students, Ambassadors share marketing
material (flyers, brochures, booklets) to educate these high school seniors throughout the year
about Cypress College and its matriculation process. This program occurs throughout the
academic year, from January through December.
ID Planned Start and End
Date(s)
Student Equity Funds Other Funds**
23
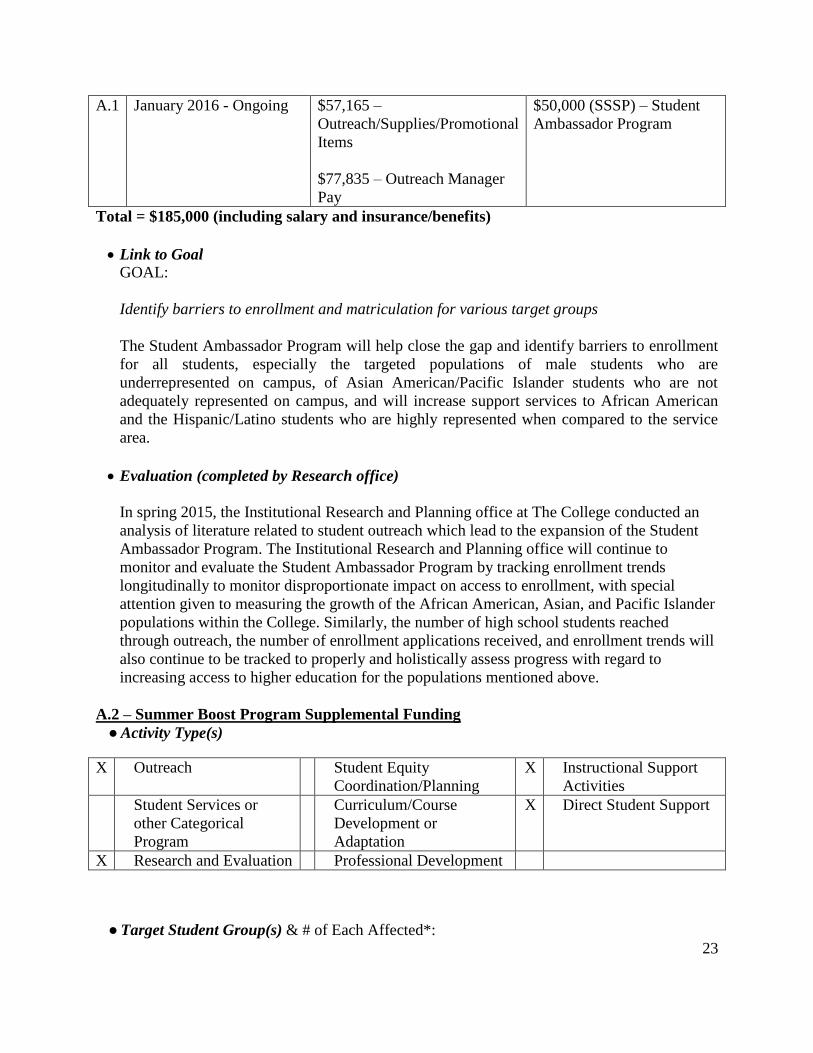
A.1 January 2016 - Ongoing $57,165 –
Outreach/Supplies/Promotional
Items
$77,835 – Outreach Manager
Pay
$50,000 (SSSP) – Student
Ambassador Program
Total = $185,000 (including salary and insurance/benefits)
Link to Goal GOAL:
Identify barriers to enrollment and matriculation for various target groups
The Student Ambassador Program will help close the gap and identify barriers to enrollment
for all students, especially the targeted populations of male students who are
underrepresented on campus, of Asian American/Pacific Islander students who are not
adequately represented on campus, and will increase support services to African American
and the Hispanic/Latino students who are highly represented when compared to the service
area.
Evaluation (completed by Research office)
In spring 2015, the Institutional Research and Planning office at The College conducted an
analysis of literature related to student outreach which lead to the expansion of the Student
Ambassador Program. The Institutional Research and Planning office will continue to
monitor and evaluate the Student Ambassador Program by tracking enrollment trends
longitudinally to monitor disproportionate impact on access to enrollment, with special
attention given to measuring the growth of the African American, Asian, and Pacific Islander
populations within the College. Similarly, the number of high school students reached
through outreach, the number of enrollment applications received, and enrollment trends will
also continue to be tracked to properly and holistically assess progress with regard to
increasing access to higher education for the populations mentioned above.
A.2 – Summer Boost Program Supplemental Funding
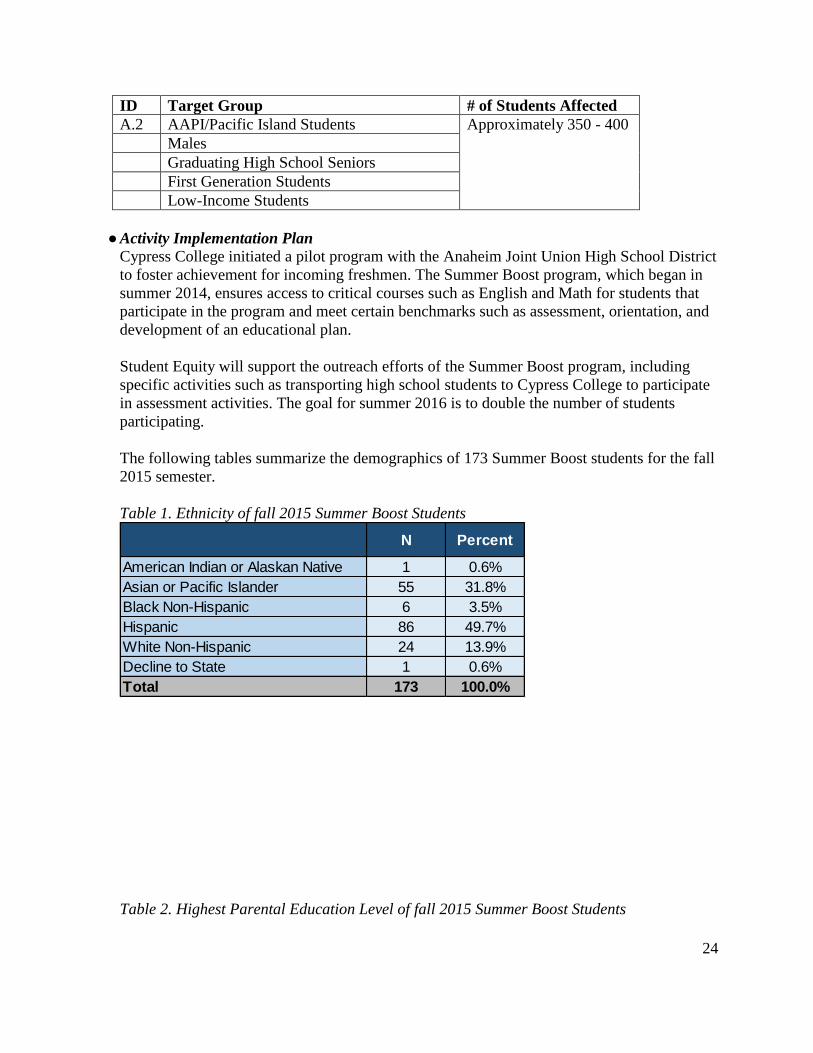
● Activity Type(s)
X Outreach Student Equity
Coordination/Planning
X Instructional Support
Activities
Student Services or
other Categorical
Program
Curriculum/Course
Development or
Adaptation
X Direct Student Support
X Research and Evaluation Professional Development
● Target Student Group(s) & # of Each Affected*:
24
ID Target Group # of Students Affected
A.2 AAPI/Pacific Island Students Approximately 350 - 400
Males
Graduating High School Seniors
First Generation Students
Low-Income Students
● Activity Implementation Plan Cypress College initiated a pilot program with the Anaheim Joint Union High School District
to foster achievement for incoming freshmen. The Summer Boost program, which began in
summer 2014, ensures access to critical courses such as English and Math for students that
participate in the program and meet certain benchmarks such as assessment, orientation, and
development of an educational plan.
Student Equity will support the outreach efforts of the Summer Boost program, including
specific activities such as transporting high school students to Cypress College to participate
in assessment activities. The goal for summer 2016 is to double the number of students
participating.
The following tables summarize the demographics of 173 Summer Boost students for the fall
2015 semester.
Table 1. Ethnicity of fall 2015 Summer Boost Students
Table 2. Highest Parental Education Level of fall 2015 Summer Boost Students
N Percent
American Indian or Alaskan Native 1 0.6%
Asian or Pacific Islander 55 31.8%
Black Non-Hispanic 6 3.5%
Hispanic 86 49.7%
White Non-Hispanic 24 13.9%
Decline to State 1 0.6%
Total 173 100.0%

25
Table 3. Gender of fall 2015 Summer Boost Students
Table 4. Educational Goals of fall 2015 Summer Boost Students
Table 5. Financial Aid Status of fall 2015 Summer Boost Students
N Percent
Graduate Degree 10 5.8%
Bachelors Degree 24 13.9%
Associate Degree 12 6.9%
Some College/No Degree 35 20.2%
High School Diploma 51 29.5%
No High School Diploma 40 23.1%
No Response 1 0.6%
Total 173 100.0%
N Percent
Female 114 65.9%
Male 56 32.4%
Not Reported 3 1.7%
Total 173 100.0%
N Percent
Assoc Degree & Trnsfr to Univ 124 71.7%
Transfer to University Only 21 12.1%
Associate Degree Only 3 1.7%
Vocational Certificate Only 4 2.3%
Discover Career Plans & Goals 2 1.2%
Complete HS Diploma or GED 1 0.6%
Improve English Reading & Mat 1 0.6%
Maintain Certificate/License 1 0.6%
4-yr taking courses for 4-yr 1 0.6%
Undecided on Goal 15 8.7%
Total 173 100.0%
N Percent
Yes 132 76.3%
No 41 23.7%
Total 173 100.0%

26
Expanded offerings of the program, made possible by equity funding include:
o Funding for transportation to transport high school seniors to Cypress College on
Saturday to complete assessment test and orientation for the program.
o Additional outreach and promotional materials to increase awareness of the program.
o Support personnel to assist with the day-to-day function of the program.
ID Timeline(s) Student Equity Funds Other Funds**
A.2 Summer 2016 (Cohort 2) $15,000 $20,000 (Approximate) -
SSSP
Total = $35,000
● Link to Goal GOAL:
Identify barriers to access for AAPI students and male students
The Summer Boost program allows students the opportunity to place in a higher level
English and/or math courses after they complete the summer prep course. This placement
will encourage students to persist towards a degree/certificate. Various ethnic groups will
benefit from the offerings of the Summer Boost program.
● Evaluation
The Institutional Research and Planning office will track cohorts of Summer Boost students
with regard to their course enrollments, success and retention rates, and their persistence. As
the program continues to expand, summer boost students will also be compared with a
matched-sample of students based demographic characteristics with regard to unit
completion, success, retention, and persistence. The current evaluation survey instrument will
also be heavily expanded and modified due to projected program growth. Additionally, the
survey will measure areas which include, but are not limited to, student satisfaction with the
program, recommendations for expansion as well as improvement, and the lasting impact on
students. The cumulative number of semesters students saved from placing at a higher level
as opposed to their original placement will also be tracked.
A.3 – Translation of Campus Materials
Activity Type(s)

27
X Outreach Student Equity
Coordination/Planning
Instructional Support
Activities
Student Services or
other Categorical
Program
Curriculum/Course
Development or
Adaptation
X Direct Student Support
Research and Evaluation Professional Development
Target Student Group(s) & # of Each Affected:
ID Target Group # of Students
Affected
A.3 AAPI Students 5,000
Hispanic/Latino Students 8,000
Activity Implementation Plan
Cypress College provides services to students from diverse backgrounds and cultures. To ensure
that we are engaging families of students, as well as non-English speaking students, we will
continue the translation of pertinent campus materials – such as financial aid pamphlets and
brochures – to streamline the enrollment and matriculation process. Collaboration with the
Language Arts department is needed to produce translated materials.
ID Planned Start and End
Date(s)
Student Equity Funds Other Funds**
A.3 January, 2016 - ongoing $6,000 – Translated Materials
$9,000 – Faculty Professional
Expert Pay
$0
Total = $15,000 (including salary and insurance/benefits)
Link to Goal Access GOAL:
Identify barriers to enrollment for Asian American/Pacific Islander students
Asian American/Pacific Islander students represent a large demographic at Cypress College,
with various dialects spoken within this group. Outreach and student support materials
reflective of students’, and their families, primary language will be created. Additionally, as
Cypress is recognized as a Hispanic Serving Institution (HSI), materials will also be
translated in Spanish to assist those students and their families.
Evaluation
28
Outreach activities, including dissemination of translated campus materials, will continue to
be tracked. As this activity has the potential to positively impact access indicators, the
Institutional Research and Planning office will continue to track enrollment patterns for
Hispanic, Asian, and Pacific Islander students to attempt to measure the impact of the
translation of outreach and support materials. Enrollment patterns for these specific ethnic
sub-groups will be examined prior to translation of materials as well as after the translation
of materials to both obtain a stable baseline of enrollment trends and to compare future
enrollment trends to this established baseline.
Success Indicator: Course Completion

29
The course completion section refers to the ratio of the number of for credit course enrollments,
by population sub-groups, completed with grades of A, B, C, or credit compared to the number
of course enrollments in specific population sub-groups on the census day of the Fall 2014 term.
Data Source
Data were obtained from the CCCCO Data Mart. More specifically, information on gender, age
group, ethnicity, DSS, Veterans, CalWORKs, CARE, EOPS, and foster youth were obtained
from the Data Mart.
Methodology
Equity ratios assessing course completion were calculated by dividing the percentage of
successful course grades earned from a subgroup by the percentage of enrollments for the same
sub-groups. Similarly, 80-percent indices were also calculated by choosing the group with the
highest success rate (as well as adequate group size) as the reference group, and all other success
rates were compared to their respective reference groups to obtain the 80-percent indices. This
allows the College to have two comprehensive measures for disproportionate impact.
The successful enrollment outcome numerator included grades of A, B, C, P, IA, IB, IC, and IPP.
The enrollment count denominator included all A, B, C, D, F, P, NP, I, IPP, INP, FW, W, and
DR grades.
Data on low income students was not available through the CCCCO Data Mart; thus information
on CalWORKs, CARE, and EOPS students supplemented this lack of information. Similarly,
information on foster youth students also supplemented this section.
Gender
Table 9 presents the course enrollments in fall 2014, disaggregated by gender.
Table 9
Course Completion Rates by Gender
Gender Fall
2014
% of
Cohort
Outcome
Count
% of
Outcome
Completion
Rate
Proportionality
Index
80-
Percent
Index
Female 23787 55.3% 17192 56.2% 72.3% 1.02 1.00
Male 18693 43.5% 13026 42.6% 69.7% 0.98 0.96
Unknown 539 1.3% 384 1.3% 71.2% 1.00 0.99
Total 43019 100.0% 30602 100.0% 71.1% -- --
Male students were slightly underrepresented in the completion rate (proportionality index =
.98), when compared to the overall cohort. However, no disproportionate impact is observed by
gender.
Ethnicity/Race

30
Table 10 presents the course enrollments of students in fall 2014, disaggregated by
ethnicity/race.
Table 10
Course Completion Rates by Ethnicity/Race
Ethnicity /
Race
Fall
2014
% of
Cohort
Outcome
Count
% of
Outcome
Completion
Rate
Proportionality
Index
80-
Percent
Index
Am. Indian 93 0.2% 61 0.2% 65.6% 0.92 0.85
Asian 9999 23.2% 7717 25.2% 77.2% 1.08 1.00
Black 1936 4.5% 1235 4.0% 63.8% 0.90 0.83
Hispanic 19092 44.4% 12873 42.1% 67.4% 0.95 0.87
M. Ethnic 1563 3.6% 1070 3.5% 68.5% 0.96 0.89
P. Islander 194 0.5% 122 0.4% 62.9% 0.88 0.81
White 8861 20.6% 6595 21.6% 74.4% 1.05 0.96
Unreported 1281 3.0% 929 3.0% 72.5% 1.02 0.94
Total 43019 100.0% 30602 100.0% 71.1% -- --
Overall, Asian students displayed the highest completion rates (77.2%, n = 7717). None of the
racial or ethnic groups had disproportionate impact.
Age
Table 11 presents the course enrollments of students in fall 2014, disaggregated by age.
Table 11
Course Completion Rates by Age
Age Fall
2014
% of
Cohort
Outcome
Count
% of
Outcome
Completion
Rate
Proportionality
Index
80-
Percent
Index
19 or less 13730 31.9% 9729 31.8% 70.9% 1.00 0.94
20-24 18495 43.0% 12709 41.5% 68.7% 0.97 0.91
25-49 9753 22.7% 7378 24.1% 75.6% 1.06 1.00
50+ 1041 2.4% 786 2.6% 75.5% 1.06 1.00
Total 43019 100.0% 30602 100.0% 71.1% -- --
Students aged 25-49 had the highest course completion rates (75.6%, n = 7378). None of the
other age groups had disproportionate impact when compared to students aged 25-49.
Disability Status

31
Table 12 presents the course enrollments of students in fall 2014, disaggregated by disability
status.
Table 12
Course Completion Rates by Disability Status
Disability
Status
Fall
2014
% of
Cohort
Outcome
Count
% of
Outcome
Completion
Rate
Proportionality
Index
80-
Percent
Index
Yes 1583 3.7% 1162 3.8% 73.4% 1.03 1.00
No 41436 96.3% 29440 96.2% 71.0% 1.00 0.97
Total 43019 100.0% 30602 100.0% 71.1% -- --
Similarly proportionate amounts of students with disabilities and non-disabled students
successfully completed courses.
Special Populations
Table 13 presents the course enrollments of CalWORKs, CARE, and EOPS students in fall 2014,
disaggregated by special population status.
Table 13
Course Completion Rates by Special Population Status
Special
Population
Status
Fall
2014
% of
Cohort
Outcome
Count
% of
Outcome
Completion
Rate
Proportionality
Index
80-
Percent
Index
Yes 2817 6.5% 2166 7.1% 76.9% 1.08 1.00
No 40202 93.5% 28436 92.9% 70.7% 0.99 0.92
Total 43019 100.0% 30602 100.0% 71.1% -- --
Similarly proportionate amounts of special populations of students successfully completed
courses when compared to the general population.
Veteran Status
Table 14 presents the course enrollments of students in fall 2014, disaggregated by veteran
status.
Table 14
Course Completion Rates by Veteran Status
32
Veteran
Status
Fall
2014
% of
Cohort
Outcome
Count
% of
Outcome
Completion
Rate
Proportionality
Index
80-
Percent
Index
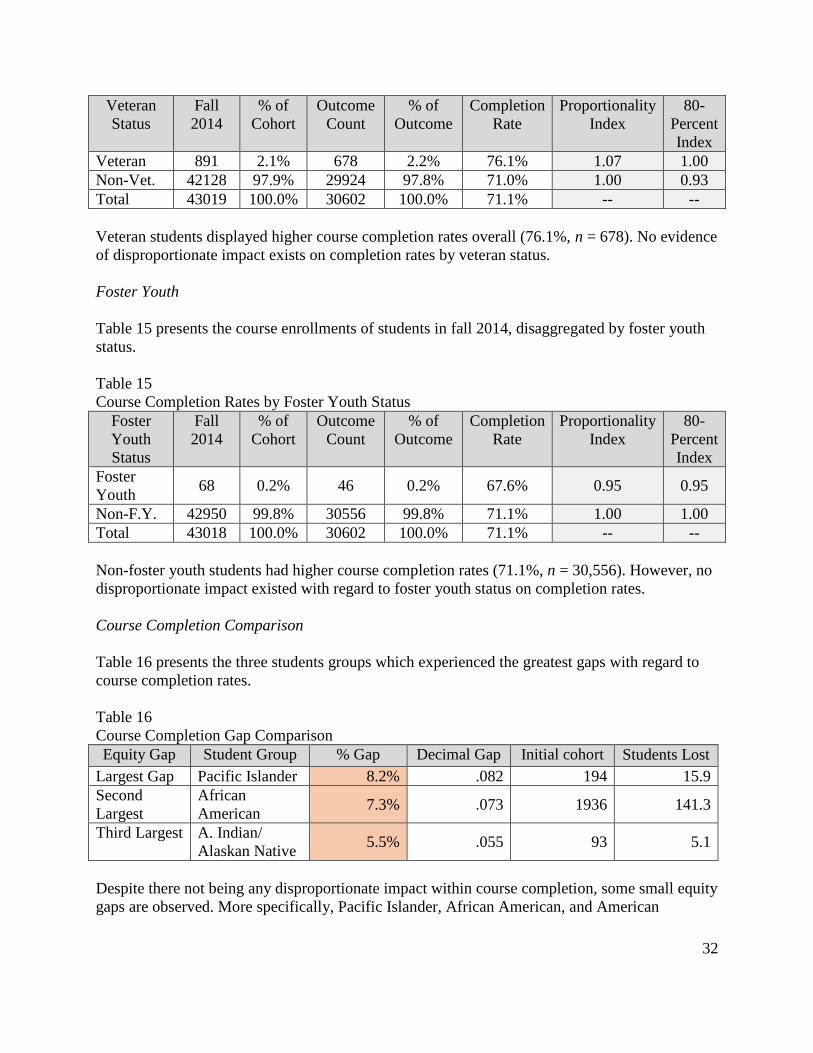
Veteran 891 2.1% 678 2.2% 76.1% 1.07 1.00
Non-Vet. 42128 97.9% 29924 97.8% 71.0% 1.00 0.93
Total 43019 100.0% 30602 100.0% 71.1% -- --
Veteran students displayed higher course completion rates overall (76.1%, n = 678). No evidence
of disproportionate impact exists on completion rates by veteran status.
Foster Youth
Table 15 presents the course enrollments of students in fall 2014, disaggregated by foster youth
status.
Table 15
Course Completion Rates by Foster Youth Status
Foster
Youth
Status
Fall
2014
% of
Cohort
Outcome
Count
% of
Outcome
Completion
Rate
Proportionality
Index
80-
Percent
Index
Foster
Youth 68 0.2% 46 0.2% 67.6% 0.95 0.95
Non-F.Y. 42950 99.8% 30556 99.8% 71.1% 1.00 1.00
Total 43018 100.0% 30602 100.0% 71.1% -- --
Non-foster youth students had higher course completion rates (71.1%, n = 30,556). However, no
disproportionate impact existed with regard to foster youth status on completion rates.
Course Completion Comparison
Table 16 presents the three students groups which experienced the greatest gaps with regard to
course completion rates.
Table 16
Course Completion Gap Comparison
Equity Gap Student Group % Gap Decimal Gap Initial cohort Students Lost
Largest Gap Pacific Islander 8.2% .082 194 15.9
Second
Largest
African
American 7.3% .073 1936 141.3
Third Largest A. Indian/
Alaskan Native 5.5% .055 93 5.1
Despite there not being any disproportionate impact within course completion, some small equity
gaps are observed. More specifically, Pacific Islander, African American, and American

33
Indian/Alaskan Native students all had over a 5% gap when compared to the average course
completion rate of 71.1%.
GOALS, ACTIVITIES, FUNDING AND EVALUATION: COURSE
COMPLETION
GOAL B.
The goal is to improve course completion for the following target populations identified in the
college research as experiencing a disproportionate impact:
Target Population(s) Methodology Current gap*, year Goal Goal Year
Pacific Islander students 80-percent -8.2%, Fall 2014 -4% 2017
African American students 80-percent -7.3%, Fall 2014 -4% 2020
American Indian/Alaskan
Native students
80-percent -5.5%, Fall 2014 -4% 2017
*Note. There was no disproportionate impact utilizing the 80-percent index for course
completion
ACTIVITIES: B. COURSE COMPLETION
B.1 – Puente Program Direct Student Support
● Activity Type(s)
X Outreach Student Equity
Coordination/Planning
Instructional Support
Activities
X Student Services or
other Categorical
Program
Curriculum/Course
Development or
Adaptation
X Direct Student Support
Research and Evaluation Professional Development
● Target Student Group(s) & # of Each Affected*:
ID Target Group # of Students Affected
B.1 Hispanic/Latino 32
● Activity Implementation Plan The Puente Program is a university preparation/transfer program serving California's
educationally underrepresented students (The Puente Project). The Cypress College program
has accepted 32 students (beyond recommended capacity) this year and their funded
activities will help support the transfer goals of the students. Additional funding will enhance
the Puente Program and increase the number of Hispanic/Latino students who complete their
associate degree and transfer to four-year institutions. Three of the proposed activities from
equity funding involve tours to California universities with the goal of inspiring and
promoting transfer. Other activities promote family support of higher education and
incorporation of mentor support.

34
Expanded offerings of the program, made possible by equity funding include:
o A Southern California universities tour of California State University, San Marcos,
University of California, San Diego, and the University of San Diego. Students will see
all three systems of higher education on this tour.
o Funding of a student worker to assist with the daily operations of the Puente Program and
offer support to counselors, faculty and students within the program. The student worker
is a former Puente student entering his second year at Cypress College.
o Textbooks will be provided for students in the Counseling 150 (College Development)
course in the Puente program.
o Participation of Day of the Dead cultural celebration in Downtown Los Angeles; tour of
Olvera Street; and a visit to Homeboy Industries which provides, "hope, training, and
support to formerly gang-involved and previously incarcerated men and women allowing
them to redirect their lives and become contributing members of our community."
ID Timeline(s) Student Equity Funds Other Funds**
B.1 January 2016 - December 2016 $14,480 – Puente
Supplies and
Materials
$5,520 – Puente
Student Worker
$5,000 (General funds)
Total = $25,000 (including salary and benefits for Student Worker)
● Link to Goal Course Completion:
Identify barriers to course completion for Hispanic/Latino students.
Increased funding will support the college's goal of closing the achievement gap and
fulfilling multiple goals, specifically geared towards educationally disadvantaged
Hispanic/Latino students. As the program is limited to the number of students it can serve by
the regulations from Puente headquarters, Cypress will conduct qualitative and quantitative
research into the necessity to expand the program allowing for the admittance of two cohorts
per year; the increase in cohort size will double the number of students affected.
● Evaluation

35
The Institutional Research and Planning Office will continue to evaluate each Puente
Program cohort based on course-based success and retention rates, as well as by measuring
semester to semester persistence rates within the students’ first year in the program.
Similarly, Puente students’ success, retention, and persistence rates will continue to be
compared to demographically matched groups which have similar course taking patterns. For
the field trip portion of the program, a previously created survey will be adapted to assess the
effectiveness of the university tours with regard to promoting transfer, increasing students’
access to four-year California universities as part of their potential educational path, and
increasing students’ knowledge related to transferring to a four-year university. The Program
evaluation may also be expanded to survey mentors regarding their perceptions of students’
experiences within the program.
B.2 – Legacy Program Direct Student Support
● Activity Type(s)
X Outreach Student Equity
Coordination/Planning
Instructional Support
Activities
X Student Services or
other Categorical
Program
Curriculum/Course
Development or
Adaptation
X Direct Student Support
Research and
Evaluation
Professional Development
● Target Student Group(s) & # of Each Affected*:
ID Target Group(s) # of Students
Affected
B.2 African American 20 - 40
● Activity Implementation Plan Legacy Program is to provide students with a strong academic program, instructional
resources, and motivational support that will facilitate their progression toward transferring
to four-year institutions. With its basic skills and transfer level holistic curriculum and
interactive activities that emphasize the African American experience in the United States,
the Legacy Program is geared specifically toward student populations who are
underrepresented in higher academia.
Expanded offerings of the program, made possible by equity funding include:
o Additional research to gain insight on strategies to increase enrollment of underprivileged
students, particularly African Americans.
o Increase in outreach materials to support Legacy enrollment
o Funding of two SI Leaders to provide academic support services for students. Students
will gain knowledge about forming effective study groups, developing essential study
skills and learning strategies to be successful at Cypress College and beyond.

36
o Funding for Legacy faculty and students to participate in the Umoja community's annual
conference.
ID Planned Start and End
Date(s)
Student Equity Funds Other Funds**
B.2 Ongoing $14,480 – Legacy Supplies
and Materials
$5,520 – Legacy Student
Worker
$6,000 (General funds)
Total = $26,000
● Link to Goal GOAL:
Identify barriers to course completion for African American students
Increased funding will support the college's goal of closing the achievement gap and
fulfilling multiple goals through an academic program geared specifically towards African
American students. Cypress will conduct qualitative and quantitative research to determine
strategies for expanding the program, and increasing recruitment efforts.
● Evaluation
The Institutional Research and Planning Office will continue to evaluate each incoming
Legacy Program cohort with regard to course-based success and retention rates, as well as by
measuring students’ persistence rates within the students’ first year in the program. Similarly,
Legacy students’ success, retention, and persistence rates will continue to be compared to
demographically matched groups with similar course taking patterns. The evaluation will
also include focus groups with current students as a holistic measure of students’ perceived
strengths of the program as well as extended longitudinal cohort tracking to assess students’
degree completion and transfer rates over time. The success of the SI program will be
assessed by comparing course-based success and retention rates before and after SI
implementation.
B.3 – LLRC Supplemental Instruction & Tutoring Direct Student Support
Activity Type(s)

37
Outreach Student Equity
Coordination/Planning
X Instructional Support
Activities
Student Services or
other Categorical
Program
Curriculum/Course
Development or Adaptation
X Direct Student Support
Research and Evaluation Professional Development
Target Student Group(s) & # of Each Affected*:
ID Target Group(s) # of Students
Affected
B.3 African American Students 1,936
American Indian/Alaskan
Native
93
Pacific Islander 194
All Students Enrolled in
Math & English Courses
Offering SI and All Students
Seeking Tutoring
10,000 +
Activity Implementation Plan Funding for Instructional Support Services, including tutoring within the Learning
Resources Area. Last year a study was done through the Institutional Research Office.
This study found that 44% of the tutoring appointments in the Learning Resource Center
were English support. Specifically students are seeking help in English 100 (College
Writing) and English 060 (College Writing Preparation). This shows a gap in the
knowledge and skills for Cypress College students. The populations utilizing the tutoring
services show that the LRC serves a very diverse set of students; 42% were Hispanic,
34% Asian and 5% black. Therefore, the activities of the tutorial services have a direct
correlation to improving the completion rates for these students in their courses.
The LLRC is not a line item on the Institution’s budget and must request funding each
year to support the programs and services they offer. The now defunct Title V grant
previously funded many of the SI and tutoring services offered.
Expanded offerings to the program made possible by equity funding include:
o Provision of Supplemental Instruction during the summer term.
o Increase number of courses offering Supplemental Instruction.
o Tutoring for Basic Skills English and Basic Skills math students, which was
previously funded by the now terminated Title V grant.
ID Planned Start and End
Date(s)
Student Equity Funds Other Funds**
B.3 January 2016–December $5,000 – Promotional Material $50,000 (SSSP)

38
2016 to Promote Services
$73, 250 – Supplemental
Instructors and Tutor
Pay
Total: $128,250 (including salary and benefits for Supplemental Instructors and Tutors)
Link to Goal
Identify barriers to course completion for AAPI, African American, and American
Indian/Alaskan Native students
The additional funding provided to the LLRC will increase the number of hours that
tutors can be employed to support English and math tutoring sessions. Additionally, the
LLRC will offer SI to courses that previously did not benefit from the services. Equity
funding allowed for SI services to be offered during the summer 15 semester, an
opportunity not previously afforded to students during summer. SI during the winter
intercession is also possibility with the assistance in funding for the program.
Evaluation The money allocated through Equity will help the LRC to offer tutorial appointments for
students. In order to evaluate the effectiveness of the tutorial services department, there
will be surveys of students (this will also be in the next cycle of SLO assessment).
B.4 – Books and Supplies Voucher Program
● Activity Type(s)
Outreach Student Equity
Coordination/Planning
X Instructional Support
Activities
Student Services or
other Categorical
Program
Curriculum/Course
Development or Adaptation
X Direct Student Support
Research and Evaluation Professional Development
● Target Student Group(s) & # of Each Affected*:

39
ID Target Group(s) # of Students
Affected
B.4 AAPI 20 – 100 (Legacy,
STEM2, Health
Science Students)
African American
20 – 100 (Legacy,
STEM2, Health
Sciences
Students)
American Indian/Alaskan
Native
1 – 60 (Health
Science, STEM2
Students)
Hispanic/Latino 30 – 150 (Legacy,
Puente, Health
Science Students)
● Activity Implementation Plan The Lending Library is a direct student support service for Cypress College students who
need assistance with textbooks. Students apply to the Lending Library program within
each department/divisions offering the program, such as the Health Sciences division and
STEM2. Students interested in participating must complete a demographic questionnaire
and application with their department/division representative.
ID Planned Start and End
Date(s)
Student Equity Funds Other Funds**
B.4 Spring, Summer, Fall 2016 $50,000 0
Total = $50,000
● Link to Goal GOAL:
Identify barriers to course completion for AAPI, African American, and American
Indian/Alaskan Native students
Students with an identified need are eligible to participate in the lending library through the
Health Sciences Access for Success book loan program created through Student Equity
funding, as well as the STEM2 program. Additional lending libraries exist within our
culturally-themed programs, Legacy and Puente. Collaboration with the Financial Aid
department will be used to determine financial-need for students applying for the program.
● Evaluation
The demographics of students who use the lending library will be assessed and analyzed to
determine how to better serve specific disproportionately impacted sub-groups of students
who utilize the service. Similarly, course based success rates for these students will also be
40
tracked for the courses in which they receive textbook support. Course taking patterns of
students who utilize the voucher program will be analyzed to further support and provide
materials for students in frequently enrolled divisions and departments. Further analyses may
be adapted from evaluations of existing lending libraries.
Success Indicator: ESL and Basic Skills
Completion
ESL and basic skills completion refers to the ratios of the numbers of students who complete a
degree applicable course, disaggregated by population group, and compared to the number of
students who completed a final ESL or basic skills course.
Data Source
The ESL and basic skills completion data were obtained from the California Community College
Chancellor’s Office Data-on Demand database.
Methodology
Both ESL and basic skills completion proportionality indices were calculated by dividing the
percentage of for credit basic skills students who completed a degree applicable course either in
ESL, English, or math by the percentage of those students who began their course sequence in
basic skills. Moreover, 80-percent indices are also provided by using the group with the highest
completion rate as the reference group to compare all other sub-groups to, in order to assess
disproportionate impact. Data for ESL, English basic skills, and math basic skills are presented
separately within this report.
The denominator, or the percentage of the cohort/population subgroup, includes students who
began the sequence of ESL, English, or math courses in basic skills in the 2008-2009 school
year.
The numerator, or the percentage of the cohort/population subgroup, includes students who
earned a successful grade (A, B, C, or P) in a degree-applicable ESL, English, or math course at
a California Community College within six years of the initial basic skills course.
Both proportionality indices as well as 80-percent indices were calculated for the following
variables in this section: 1) gender (male, female, unknown), 2) ethnicity and race (American
Indian or Alaskan Native, Asian, Black/African American, Filipino, Hispanic, Pacific Islander,
White, unreported), 3) age (19 or less, 20 – 24, 25 – 49, and 50+), 4) disability status, and 5)
financial aid status.
Data on foster youth and veterans for the 2008-2009 cohort are not applicable due to the small
sample size.

41
ESL Completion
Gender
Table 17 presents the counts and completion rates of students in the 2008-2009 cohort who took
an ESL course, disaggregated by gender.
Table 17
ESL Completion Rates by Gender
Gender Cohort
2008-
2009
% of
Cohort
Outcome
Count
% of
Outcome
Completion
Rate
Proportionality
Index
80-
Percent
Index
Female 87 63.5% 49 70.0% 56.3% 1.10 1.00
Male 48 35.0% 21 30.0% 43.8% 0.86 0.78
Unknown 2 1.5% 0 0.0% 0.0% 0.00 na
Total 137 100.0% 70 100.0% 51.1% -- --
Male students were disproportionally underrepresented in the completion rates (proportionality
index = .86), when compared to the overall cohort. This indicates disproportionate impact of
gender on ESL completion.
Ethnicity/Race
Table 18 presents the counts and completion rates of students in the 2008-2009 cohort who took
an ESL course, disaggregated by ethnicity/race.
Table 18
ESL Completion Rates by Ethnicity/Race
Ethnicity /
Race
Cohort
2008-
2009
% of
Cohort
Outcome
Count
% of
Outcome
Completion
Rate
Proportionality
Index
80-
Percent
Index
Am. Indian 0 0.0% 0 0.0% na na na
Asian 89 65.0% 50 71.4% 56.2% 1.10 na
Black 4 2.9% 0 0.0% 0.0% 0.00 na
Filipino 5 3.6% 4 5.7% 80.0% 1.57 na
Hispanic 20 14.6% 5 7.1% 25.0% 0.49 na
P. Islander 0 0.0% 0 0.0% na na na
White 9 6.6% 4 5.7% 44.4% 0.87 na
Unreported 10 7.3% 7 10.0% 70.0% 1.37 na
Total 137 100.0% 70 100.0% 51.1% -- --

42
Due to small sample sizes for the 2008-2009 cohort, only completion rates and proportionality
indices are presented. Conclusions cannot be drawn regarding disproportionate impact, due to the
small sample sizes.
Age
Table 19 presents the counts and completion rates of students in the 2008-2009 cohort who took
an ESL course, disaggregated by age.
Table 19
ESL Completion Rates by Age
Age Cohort
2008-
2009
% of
Cohort
Outcome
Count
% of
Outcome
Completion
Rate
Proportionality
Index
80-
Percent
Index
19 or less 33 24.1% 22 31.4% 66.7% 1.30 1.00
20-24 25 18.2% 12 17.1% 48.0% 0.94 0.72
25-49 73 53.3% 34 48.6% 46.6% 0.91 0.70
50+ 6 4.4% 2 2.9% 33.3% 0.65 na
Total 137 100.0% 70 100.0% 51.1% -- --
Students aged 19 or less displayed the highest completion rates in ESL courses (66.7%, n = 22).
However, both 20-24 as well as 25-49 year old students had disproportionately lower ESL
completion rates when compared to students 19 or younger (Indices = .72, .70; respectively).
Disability Status
Table 20 presents the counts and completion rates of students in the 2008-2009 cohort who took
an ESL course, disaggregated by disability status.
Table 20
ESL Completion Rates by Disability Status
Disability
Status
Cohort
2008-
2009
% of
Cohort
Outcome
Count
% of
Outcome
Completion
Rate
Proportionality
Index
80-
Percent
Index
Yes 1 0.7% 0 0.0% 0.0% na na
No 136 99.3% 70 100.0% 51.5% 1.01 na
Total 137 100.0% 70 100.0% 51.1% -- --
Because only one student identified as disabled, disproportionate impact analyses cannot be
conducted. Completion rates are presented.
Economic Status
Table 21 presents the counts and completion rates of students in the 2008-2009 cohort who took
an ESL course, disaggregated by economic status.
43
Table 21
ESL Completion Rates by Economic Status
Economic
Status
Cohort
2008-
2009
% of
Cohort
Outcome
Count
% of
Outcome
Completion
Rate
Proportionality
Index
80-
Percent
Index
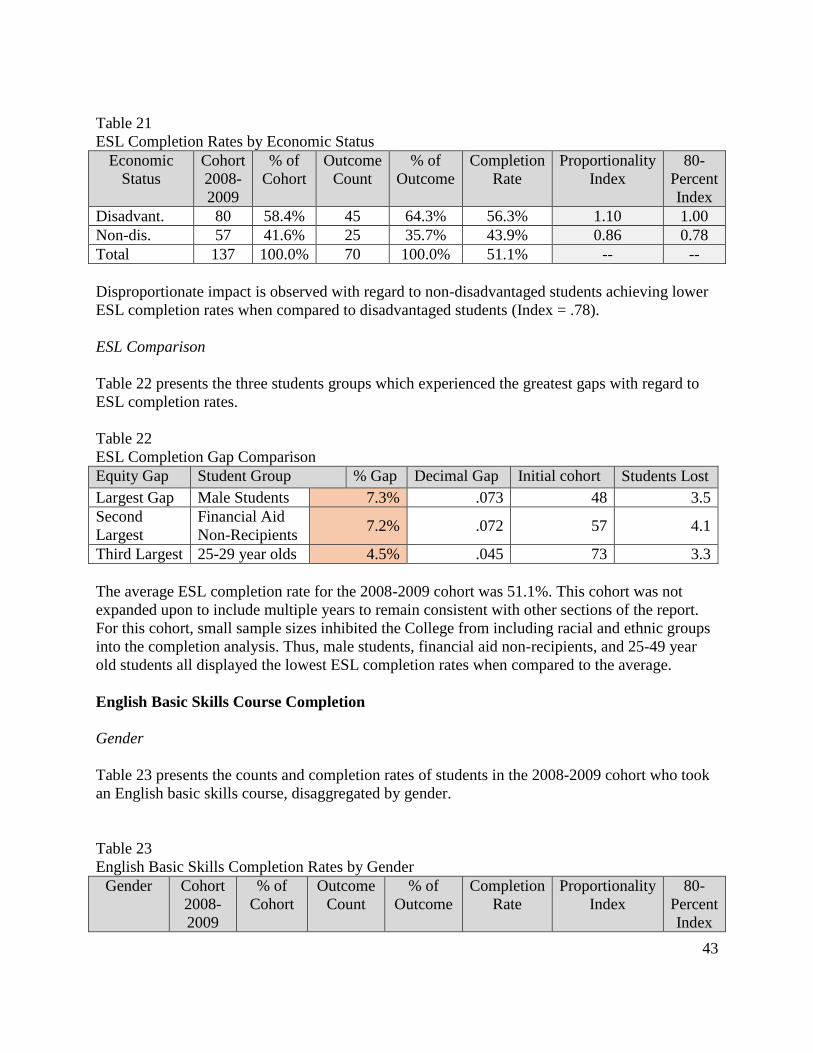
Disadvant. 80 58.4% 45 64.3% 56.3% 1.10 1.00
Non-dis. 57 41.6% 25 35.7% 43.9% 0.86 0.78
Total 137 100.0% 70 100.0% 51.1% -- --
Disproportionate impact is observed with regard to non-disadvantaged students achieving lower
ESL completion rates when compared to disadvantaged students (Index = .78).
ESL Comparison
Table 22 presents the three students groups which experienced the greatest gaps with regard to
ESL completion rates.
Table 22
ESL Completion Gap Comparison
Equity Gap Student Group % Gap Decimal Gap Initial cohort Students Lost
Largest Gap Male Students 7.3% .073 48 3.5
Second
Largest
Financial Aid
Non-Recipients 7.2% .072 57 4.1
Third Largest 25-29 year olds 4.5% .045 73 3.3
The average ESL completion rate for the 2008-2009 cohort was 51.1%. This cohort was not
expanded upon to include multiple years to remain consistent with other sections of the report.
For this cohort, small sample sizes inhibited the College from including racial and ethnic groups
into the completion analysis. Thus, male students, financial aid non-recipients, and 25-49 year
old students all displayed the lowest ESL completion rates when compared to the average.
English Basic Skills Course Completion
Gender
Table 23 presents the counts and completion rates of students in the 2008-2009 cohort who took
an English basic skills course, disaggregated by gender.
Table 23
English Basic Skills Completion Rates by Gender
Gender Cohort
2008-
2009
% of
Cohort
Outcome
Count
% of
Outcome
Completion
Rate
Proportionality
Index
80-
Percent
Index

44
Female 719 53.9% 491 55.3% 68.3% 1.03 1.00
Male 598 44.8% 383 43.1% 64.0% 0.96 0.94
Unknown 18 1.3% 14 1.6% 77.8% 1.17 na
Total 1335 100.0% 888 100.0% 66.5% -- --
Male students were slightly underrepresented in the completion rate (proportionality index =
.96), when compared to the overall cohort. However, no disproportionate impact exists with
regard to gender on English basic skills course completion.
Ethnicity/Race
Table 24 presents the counts and completion rates of students in the 2008-2009 cohort who took
an English basic skills course, disaggregated by ethnicity/race.
Table 24
English Basic Skills Completion Rates by Ethnicity/Race
Ethnicity /
Race
Cohort
2008-
2009
% of
Cohort
Outcome
Count
% of
Outcome
Completion
Rate
Proportionality
Index
80-
Percent
Index
Am. Indian 6 0.4% 6 0.7% 100.0% 1.50 na
Asian 174 13.0% 120 13.5% 69.0% 1.04 0.94
Black 75 5.6% 52 5.9% 69.3% 1.04 0.94
Filipino 99 7.4% 69 7.8% 69.7% 1.05 0.95
Hispanic 452 33.9% 285 32.1% 63.1% 0.95 0.86
P. Islander 19 1.4% 12 1.4% 63.2% 0.95 0.86
White 352 26.4% 228 25.7% 64.8% 0.97 0.88
Unreported 158 11.8% 116 13.1% 73.4% 1.10 1.00
Total 1335 100.0% 888 100.0% 66.5% -- --
Overall, students who did not report their ethnicity/race displayed the highest completion rates
by sample size (73.4%, n = 116), while American Indian or Alaskan Native students displayed
the highest completion rates not taking sample size into account (100.0%, n = 6). None of the
racial or ethnic groups displayed disproportionate impact.
Age
Table 25 presents the counts and completion rates of students in the 2008-2009 cohort who took
an English basic skills course, disaggregated by age.
Table 25
English Basic Skills Completion Rates by Age
Age Cohort
2008-
% of
Cohort
Outcome
Count
% of
Outcome
Completion
Rate
Proportionality
Index
80-
Percent

45
2009 Index
19 or less 867 64.9% 614 69.1% 70.8% 1.06 1.00
20-24 269 20.1% 170 19.1% 63.2% 0.95 0.89
25-49 187 14.0% 98 11.0% 52.4% 0.79 0.74
50+ 12 0.9% 6 0.7% 50.0% 0.75 na
Total 1335 100.0% 888 100.0% 66.5% -- --
Students aged 19 or less displayed the highest completion rates in basic skills courses (70.8%, n
= 614). However, 25-49 year old students had disproportionately lower English basic skills
completion rates when compared to students 19 or younger.
Disability Status
Table 26 presents the counts and completion rates of students in the 2008-2009 cohort who took
an English basic skills course, disaggregated by disability status.
Table 26
English Basic Skills Completion Rates by Disability Status
Disability
Status
Cohort
2008-
2009
% of
Cohort
Outcome
Count
% of
Outcome
Completion
Rate
Proportionality
Index
80-
Percent
Index
Yes 63 4.7% 41 4.6% 65.1% 0.98 0.98
No 1272 95.3% 847 95.4% 66.6% 1.00 1.00
Total 1335 100.0% 888 100.0% 66.5% -- --
Equally proportionate amounts of students with and without disabilities completed basic skills
courses.
Economic Status
Table 27 presents the counts and completion rates of students in the 2008-2009 cohort who took
an English basic skills course, disaggregated by economic status.
Table 27
English Basic Skills Completion Rates by Economic Status
Economic
Status
Cohort
2008-
2009
% of
Cohort
Outcome
Count
% of
Outcome
Completion
Rate
Proportionality
Index
80-
Percent
Index

46
Disadvant. 813 60.9% 544 61.3% 66.9% 1.01 1.00
Non-dis. 522 39.1% 344 38.7% 65.9% 0.99 0.98
Total 1335 100.0% 888 100.0% 66.5% -- --
Equally proportionate amounts students completed basic skills courses, regardless of economic
status.
English Basic Skills Comparison
Table 28 presents the three students groups which experienced the greatest gaps with regard to
English basic skills completion rates.
Table 28
English Basic Skills Gap Comparison
Equity Gap Student Group % Gap Decimal Gap Initial cohort Students Lost
Largest Gap 25-49 year olds 14.1% .141 187 26.4
Second Largest Hispanic 3.4% .034 452 15.4
Third Largest 20-24 year olds 3.3% .033 269 8.9
The average English basic skills completion rate for the 2008-2009 cohort was 66.5%. Only one
group, 25-49 year old students, had disproportionate impact with regard to completion. Hispanic
and 20-24 year old students had much lower percentage gaps when compared to the average and
did not lose as many students.
Math Basic Skills Course Completion
Gender
Table 29 presents the counts and completion rates of students in the 2008-2009 cohort who took
a math basic skills course, disaggregated by gender.
Table 29
Math Basic Skills Completion Rates by Gender
Gender Cohort
2008-
2009
% of
Cohort
Outcome
Count
% of
Outcome
Completion
Rate
Proportionality
Index
80-
Percent
Index

47
Female 1065 55.1% 365 58.1% 34.3% 1.05 1.00
Male 842 43.6% 256 40.8% 30.4% 0.94 0.89
Unknown 26 1.3% 7 1.1% 26.9% 0.83 na
Total 1933 100.0% 628 100.0% 32.5% -- --
Male students were slightly underrepresented in the completion rate (proportionality index =
.94), when compared to the overall cohort. However, no disproportionate impact of gender on
math basic skills course completion exists for the 2008-2009 cohort.
Ethnicity/Race
Table 30 presents the counts and completion rates of students in the 2008-2009 cohort who took
a math basic skills course, disaggregated by ethnicity/race.
Table 30
Math Basic Skills Completion Rates by Ethnicity/Race
Ethnicity /
Race
Cohort
2008-
2009
% of
Cohort
Outcome
Count
% of
Outcome
Completion
Rate
Proportionality
Index
80-
Percent
Index
Am. Indian 10 0.5% 3 0.5% 30.0% 0.92 na
Asian 168 8.7% 64 10.2% 38.1% 1.17 0.92
Black 122 6.3% 29 4.6% 23.8% 0.73 0.58
Filipino 109 5.6% 45 7.2% 41.3% 1.27 1.00
Hispanic 746 38.6% 219 34.9% 29.4% 0.90 0.71
P. Islander 23 1.2% 3 0.5% 13.0% 0.40 na
White 544 28.1% 186 29.6% 34.2% 1.05 0.83
Unreported 211 10.9% 79 12.6% 37.4% 1.15 0.91
Total 1933 100.0% 628 100.0% 32.5% -- --
Overall, Filipino students had the highest completion rates by sample size (41.3%, n = 45).
Compared to Filipino students, Black/African American and Hispanic students all had
disproportionately lower completion rates. Thus, this indicates an equity gap in achievement.
Age
Table 31 presents the counts and completion rates of students in the 2008-2009 cohort who took
a math basic skills course, disaggregated by age.
Table 31
Math Basic Skills Completion Rates by Age
Age Cohort
2008-
2009
% of
Cohort
Outcome
Count
% of
Outcome
Completion
Rate
Proportionality
Index
80-
Percent
Index

48
19 or less 965 49.9% 359 57.2% 37.2% 1.15 1.00
20-24 525 27.2% 150 23.9% 28.6% 0.88 0.77
25-49 424 21.9% 115 18.3% 27.1% 0.83 0.73
50+ 19 1.0% 4 0.6% 21.1% 0.65 na
Total 1933 100.0% 628 100.0% 32.5% -- --
Students aged 19 or less displayed the highest completion rate in basic skills courses (37.2%, n =
359). However, 20-24 and 25-49 students all had disproportionately lower math basic skills
completion rates when compared to students 19 or younger. This indicates an equity gap in
completion rates by age.
Disability Status
Table 32 presents the counts and completion rates of students in the 2008-2009 cohort who took
a math basic skills course, disaggregated by disability status.
Table 32
Math Basic Skills Completion Rates by Disability Status
Disability
Status
Cohort
2008-
2009
% of
Cohort
Outcome
Count
% of
Outcome
Completion
Rate
Proportionality
Index
80-
Percent
Index
Yes 129 6.7% 34 5.4% 26.4% 0.81 0.80
No 1804 93.3% 594 94.6% 32.9% 1.01 1.00
Total 1933 100.0% 628 100.0% 32.5% -- --
Students who identified as having a disability had disproportionally lower completion rates when
compared to students without disabilities (Index = .80). Thus, this indicates an equity gap in
math basic skills completion for students with disabilities.
Economic Status
Table 33 presents the counts and completion rates of students in the 2008-2009 cohort who took
a math basic skills course, disaggregated by economic status.
Table 33
Math Basic Skills Completion Rates by Economic Status
Economic
Status
Cohort
2008-
2009
% of
Cohort
Outcome
Count
% of
Outcome
Completion
Rate
Proportionality
Index
80-
Percent
Index

49
Disadvant. 1258 65.1% 392 62.4% 31.2% 0.96 0.89
Non-dis. 675 34.9% 236 37.6% 35.0% 1.08 1.00
Total 1933 100.0% 628 100.0% 32.5% -- --
Equally proportionate amounts students completed math basic skills courses, regardless of
economic status.
Math Basic Skills Comparison
Table 34 presents the three students groups which experienced the greatest gaps with regard to
math basic skills completion rates.
Table 34
Math Basic Skills Gap Comparison
Equity Gap Student Group % Gap Decimal Gap Initial cohort Students Lost
Largest Gap African-
American 8.7% .087 122 10.6
Second Largest Students with
disabilities 6.1% .061 129 7.9
Third Largest 25-49 year olds 5.4% .054 424 22.9
Overall, all three of these groups in the 2008-2009 cohort had disproportionate impact with
regard to math basic skills completion rates. While other groups had lower completion rates, the
sample sizes for those groups were not large enough to draw conclusions from. Because the
initial cohorts for these groups were smaller than most, retaining slightly more students could
have made large differences in the data with regard to diminishing disproportionate impact.
ACTIVITIES: C. ESL AND BASIC SKILLS COURSE COMPLETION
ESL Completion
Target Population(s) Methodology Current gap*, year Goal Goal Year
Male Students 80-percent -7.3%, 2008-2009 cohort -3% 2017
Financial aid non-recipients 80-percent -7.2%, 2008-2009 cohort -3% 2017
25-29 year old students 80-percent -4.5%, 2008-2009 cohort -3% 2017
*Note. All three of the target populations displayed disproportionate impact, utilizing the 80-
percent index for ESL completion.
English Basic Skills Completion
Target Population(s) Methodology Current gap*, year Goal Goal Year
25-49 year old students 80-percent -14.1%, 2008-2009 cohort -7% 2020
Hispanic students 80-percent -3.4%, 2008-2009 cohort -2% 2017
20-24 year old students 80-percent -3.3%, 2008-2009 cohort -2% 2017

50
*Note. Only 25-49 year old students had disproportionate impact on English basic skills
completion utilizing the 80-percent index.
Mathematics Basic Skills Completion
Target Population(s) Methodology Current gap*, year Goal Goal
Year
African-American
students
80-percent -8.7%, 2008-2009 cohort -6% 2018
Students with disabilities 80-percent -6.1%, 2008-2009 cohort -3% 2018
25-49 year old students 80-percent -5.4%. 2008-2009 cohort -3% 2018
*Note. All target populations had disproportionate impact for mathematics basic skills
completion utilizing the 80-percent index.
ACTIVITIES: C. ESL AND BASIC SKILLS COURSE COMPLETION
C.1 - Disability Support Services – Learning Disabilities Specialist
Activity Type(s)
Outreach Student Equity
Coordination/Planning
X Instructional Support
Activities
X Student Services or
other Categorical
Program
Curriculum/Course
Development or
Adaptation
Direct Student Support
Research and Evaluation Professional Development
Target Student Group(s) & # of Each Affected*:
ID Target Group(s) # of Students
Affected
C.1 Students with disabilities 900
Activity Implementation Plan
Cypress College Disability Support Services will develop and implement a Learning Disabilities
Program which will include:
Employing a full-time Learning Disabilities Specialist.
Administering LD assessments.
Creating, developing, and implementing special courses to address disproportionate
educational success for students with disabilities.
Creating and facilitating workshops (study strategies, etc.).
Compensatory strategy check-in appointments with students.
Collaboration with math and English faculty.
Collaboration with other student service programs (i.e. EOPS, Transfer Center, etc.)

51
Collaboration with ESL faculty to ensure that students whose second language is English
are given opportunities to receive learning disability services including assessment in
their primary language, if appropriate.
A student who understands his/her limitations, strengths, receives instructional support, and is
utilizes compensatory strategies is much better prepared and equipped for college which leads to
college success. DSS currently serves 900+ students and is mandated by state and federal
government to provide assistance to students with verified disabilities. By providing a
comprehensive and much-needed Learning Disabilities program, DSS will offer consistency and
continuity for students with disabilities.
Students with learning disabilities is DSS’ largest population group.
Year LD population
2010-2011 21.14%
2011-2012 19.91%
2012-2013 21.22%
2013-2014 25.74%
2014-2015 23.74%
ID Planned Start and End
Date(s)
Student Equity Funds Other Funds**
C.1 July 2016 $10,000 $100,000 (general college
fund – salary and benefits)
Total = $10,000
Link to Goal ESL and Basic Skills Completion GOAL:
(Math) – Identify strategies and solutions to increase proportionality in completion for
students with disabilities.
Transfer GOAL:
Identify barriers affecting the transfer rate of all students, specifically – students with
disabilities.
The Cypress College Student Equity Plan identifies and addresses the disparities existing for
students with disabilities. Students with disabilities are disproportionately impacted in the
areas of basic skills math completion (24% completion rate) and transfer (25% transfer rate).
Providing a comprehensive LD Program with an emphasis in basic skills math will allow
students with disabilities equal opportunities to complete courses and transfer to 4-year
universities.
Evaluation

52
Student demographics will be analyzed to compare the demographics of DSS students
compared to the overall College population in order to better serve the population of DSS
students. Students who visit the DSS office will have the opportunity to evaluate the
services they received at the close of the visit through an online survey, and results from
that survey will be tracked over time to assess the effectiveness of the DSS office and
testing accommodations. Success and retention rates of DSS students in math courses
will continue to be tracked for trends, with specific emphasis on basic skills math
courses.
C.2 – Disability Support Services – Student Services Specialist
Activity Type(s)
Outreach Student Equity
Coordination/Planning
Instructional Support
Activities
X Student Services or other
Categorical Program
Curriculum/Course
Development or Adaptation
Direct Student Support
Research and Evaluation Professional Development
Target Student Group(s) & # of Each Affected*:
ID Target Group(s) # of Students
Affected
C.2 Students with disabilities 900
Activity Implementation Plan
DSS will hire a new full-time (12 month) Student Services Specialist (SSS) to coordinate,
including scheduling and implementing, testing accommodations for students with disabilities
who are eligible for testing accommodations. DSS testing services is the most frequently used
accommodation at Cypress College and the number of students requiring this accommodation
is increasing at a steady rate. Every year, DSS proctors over 2,500 exams, and of these exams,
over 650 are math exams. Federal and state disability laws require colleges to provide
accommodations, such as testing accommodations, to students with disabilities in order to
guarantee equal opportunities. Students with disabilities rely on testing accommodations to
support course success, specifically in math, leading to successful degree completion and/or
transfer.
Additionally, this position will support the student equity effort for students with disabilities.
DSS will be creating a Learning Disability Program supporting basic skills math students. This
position will assist and support the LD program.
Semester Total Exams
Administered
Math
Exams
Fall 2013 1,199 322

53
Spring
2014
1,412 360
Fall 2014 1,326 307
Spring
2015
1,654 363
This will be a full-time, permanent position supported with categorical funding (Student Equity
and DSS). This position begins October 19, 2015 and will continue indefinitely.
ID Planned Start and End
Date(s)
Student Equity Funds Other Funds**
C.2 October 19, 2015 -Ongoing $34,532 $34,532
Total = $69,064 per year (including salary and insurance/benefits)
Link to Goal ESL and Basic Skills Completion GOAL:
(Math) – Identify strategies and solutions to increase proportionality in completion for
students with disabilities.
Transfer GOAL:
Identify barriers affecting the transfer rate of all students, specifically – students with
disabilities.
The Cypress College Student Equity Plan identifies and addresses the disparities existing for
students with disabilities. Students with disabilities are disproportionately impacted in the
areas of basic skills math completion (26% completion rate) and transfer (25% transfer rate).
Providing comprehensive testing accommodations will allow students with disabilities equal
opportunities to show what they know and understand. Accommodations support basic skills
course completion and transfer.
● Evaluation
As examined on a semester by semester basis, the evaluation of the total number of exams
administered in total as well as the number of mathematics exams will continue to be tracked
to measure trends with regard to increasing capacity within the DSS office. Student
demographics will also be analyzed to compare the demographics of DSS students compared
to the overall College population in order to better serve the population of DSS students.
Students who visit the DSS office will have the opportunity to evaluate the services they
received at the close of the visit through an online survey, and results from that survey will
be tracked over time to assess the effectiveness of the DSS office and testing

54
accommodations. Success and retention rates of DSS students in math courses will continue
to be tracked for trends, with specific emphasis on basic skills math courses.
C. 3 - English 60 ACCESS Program
● Activity Type(s)
Outreach Student Equity
Coordination/Planning
Instructional Support
Activities
X Student Services or
other Categorical
Program
Curriculum/Course
Development or
Adaptation
X Direct Student Support
Research and
Evaluation
Professional Development
● Target Student Group(s) & # of Each Affected*:
ID Target Group # of Students Affected
C.3 Students Ages 25-49 187
Hispanic/Latino 452
Students Ages 20-24 269
All Students Enrolled
Approximately 2,000 Per
Semester
● Activity Implementation Plan Through the Basic Skills English 60 ACCESS program, the English department provides
extended, broad reaching support for student success, including, but not limited to transfer.
The focus is to empower students by incorporating strategies within the classroom
assignments for recognizing and achieving academic and personal goals. The ACCESS
program is designed to educate students with available campus resources crucial for their
progression, as well as engage them with critical thinking about their own ability to succeed.
The program requires early classroom engagement and interaction that supports student
persistence, and fosters relationship building between students and faculty.
Approximately 1,000 student are enrolled in English 60 each semester. The goal is to train
instructors prior to the start of each semester and continue to implement and improve
materials each semester thereafter.
ID Timeline(s) Student Equity Funds Other Funds**
C.3 Ongoing $14,642 –
Supplies/Materials/Stu
dent Planners/Training
Workshop
$4,358 – Faculty Professional
$0

55
Expert Pay
Total = $19,000 (including salary and insurance/benefits for Professional Expert pay)
● Link to Goal English Basic Skills Completion GOAL:
Identify barriers to Basic Skills English course completion for target population students
and all students enrolled in English 60.
The ACCESS program provides students and faculty with the opportunity to explore the
student support services that are crucial to student success. This program links instruction
and student services ensuring student success at the academic, social and personal level.
In addition, this activity will build the rapport between faculty and students as they
explore student services together thus increasing engagement for both groups.
● Evaluation
A pre-survey and post-survey have been designed and expanded to help assess the
effectiveness of the ACCESS program. The pre-survey will assess students’ baseline
familiarity with student support services on campus which include but are not limited to
special programs, tutoring centers, and counseling centers. The post-survey will serve as a
measure for comparison regarding students’ familiarity and use of support services. Thus,
students’ familiarity and use of student support services on campus is expected to increase as
a direct result of the ACCESS program.
C.4 – College Success Factors Index (CSFI)
● Activity Type(s)
Outreach Student Equity
Coordination/Planning
Instructional Support
Activities
Student Services or
other Categorical
Program
Curriculum/Course
Development or Adaptation
X Direct Student Support
X Research and
Evaluation
Professional Development
● Target Student Group(s) & # of Each Affected*:

56
ID Target Group # of Students
Affected
C.4 Various 900
● Activity Implementation Plan
The CSFI is a pilot program designed to help Basic Skills students to become better students.
CSFI is a survey instrument currently being used in developmental math and English courses.
A counselor is designated to provide 1:1 counseling appointment to assist students with the
interpretation of the CSFI as well as to provide intervention strategies to assist students in
those identified areas that can hinder student success. Counselors often refer students to
career counseling, disability services, tutoring resources, financial aid, time management and
study skills workshops. Approximately 900 students in developmental math and English
classes take the CSFI annually.
ID Timeline(s) Student Equity Funds Other Funds**
C.4 Ongoing $16,020 – CSFI Instrument
$38,650 – Counselors Per
Semester (SSSP)
Total = $93,320
Link to Goal GOAL:
Identify strategies and solutions to increase proportionality in completion.
The CSFI instrument will be useful tool to conduct inquiry into the obstacles preventing
students from completing Basic Skills courses.
● Evaluation
In spring 2015, the Institutional Research and Planning office conducted a study regarding
the effectiveness of the CSFI program and found that taking the CSFI has a significant
positive impact on students’ success rates in their English classes. However, when the
intervention is coupled with one or two counseling sessions with a dedicated CSFI counselor,
their chances for success in their basic skills English course significantly increase at a higher
rate. Success rates for students who take the CSFI will continue to be compared to students
who do not to establish the continued effectiveness of the instrument in conjunction with
participating with counseling sessions surrounding students’ success. Achievement gaps
between students of differing ethnicities per course for math, English, English/Reading, and
ESL courses, including basic skills courses, will also be assessed.

57
Success Indicator: Degree and Certificate
Completion
Data on degree and certificate completion were obtained from the California Community College
Chancellor’s Office Data-on-Demand database.
Methodology
Degree and certificate ratios were calculated by dividing the percentage of for credit students
who received a degree or certificate by the percentage of all students in the 2008-2009 cohort.
The denominator, or percentage of the cohort, included population subgroups who attempted a
for credit course for the first time during the 2008-2009 school year. The numerator, or
percentage of the outcome, included cohort members who either earned a degree or certificate at
any California Community College during the 6 year period.
Both proportionality and 80-percent indices were calculated for the available database variables:
1) gender (male, female, unknown), 2) ethnicity and race (American Indian or Alaskan Native,
Asian American, Black/African American, Filipino, Hispanic, Pacific Islander, White, and
unreported), 3) age (19 or less, 20 – 24, 25 – 49, and 50+), 4) Disability status (yes or no), and 5)
financial aid status (yes or no).
Data on foster youth and veterans for the 2008-2009 cohort are not applicable due to the small
sample size.
Gender
Table 35 presents the counts and percentages of students in the 2008-2009 cohort as well as
those students in the cohort who either obtained a degree or certificate, disaggregated by gender.
Table 35
Degree and Certificate Completion by Gender
Gender Cohort
2008-
2009
% of
Cohort
Outcome
Count
% of
Outcome
Degree
Rate
Proportionality
Index
80-
Percent
Index
Female 1078 52.3% 234 61.9% 21.7% 1.18 1.00

58
Male 963 46.7% 140 37.0% 14.5% 0.79 0.67
Unknown 22 1.1% 4 1.1% 18.2% 0.99 na
Total 2063 100.0% 378 100.0% 18.3% -- --
Male students were underrepresented in the degree outcome (Index = 0.67), when compared to
the overall cohort. Moreover, male students had disproportionately lower degree and certificate
completion rates, indicating an equity gap.
Ethnicity/Race
Table 36 presents the counts and percentages of students in the 2008-2009 cohort as well as
those students in the cohort who either obtained a degree or certificate, disaggregated by
ethnicity/race.
Table 36
Degree and Certificate Completion by Ethnicity/Race
Ethnicity /
Race
Cohort
2008-
2009
% of
Cohort
Outcome
Count
% of
Outcome
Degree
Rate
Proportionality
Index
80-
Percent
Index
Am. Indian 8 0.4% 0 0.0% 0.0% 0.00 na
Asian 345 16.7% 56 14.8% 16.2% 0.89 0.76
Black 89 4.3% 15 4.0% 16.9% 0.92 0.79
Filipino 151 7.3% 30 7.9% 19.9% 1.08 0.93
Hispanic 613 29.7% 99 26.2% 16.2% 0.88 0.75
P. Islander 24 1.2% 2 0.5% 8.3% 0.45 na
White 570 27.6% 122 32.3% 21.4% 1.17 1.00
Unreported 263 12.7% 54 14.3% 20.5% 1.12 0.96
Total 2063 100.0% 378 100.0% 18.3% -- --
Almost all racial and ethnic groups displayed disproportionate impact when compared to White
students which served as the group with the highest degree or certificate attainment rate (21.4%,
n = 122). Thus, this indicates an equity gap in the degree attainment ratio for all ethnicities and
races aside from White, Filipino, and students of unknown ethnicities.
Age
Table 37 presents the counts and percentages of students in the 2008-2009 cohort as well as
those students in the cohort who either obtained a degree or certificate, disaggregated by age.
Table 37
Degree and Certificate Completion by Age
Age Cohort
2008-
% of
Cohort
Outcome
Count
% of
Outcome
Degree
Rate
Proportionality
Index
80-
Percent
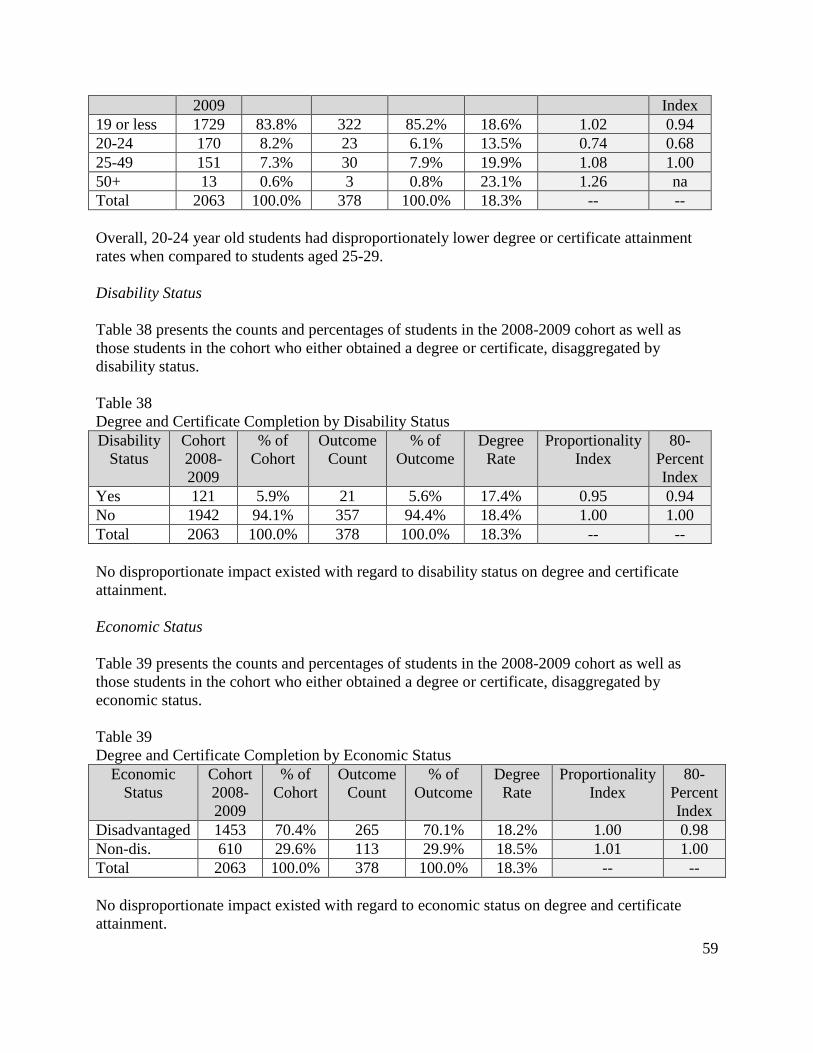
59
2009 Index
19 or less 1729 83.8% 322 85.2% 18.6% 1.02 0.94
20-24 170 8.2% 23 6.1% 13.5% 0.74 0.68
25-49 151 7.3% 30 7.9% 19.9% 1.08 1.00
50+ 13 0.6% 3 0.8% 23.1% 1.26 na
Total 2063 100.0% 378 100.0% 18.3% -- --
Overall, 20-24 year old students had disproportionately lower degree or certificate attainment
rates when compared to students aged 25-29.
Disability Status
Table 38 presents the counts and percentages of students in the 2008-2009 cohort as well as
those students in the cohort who either obtained a degree or certificate, disaggregated by
disability status.
Table 38
Degree and Certificate Completion by Disability Status
Disability
Status
Cohort
2008-
2009
% of
Cohort
Outcome
Count
% of
Outcome
Degree
Rate
Proportionality
Index
80-
Percent
Index
Yes 121 5.9% 21 5.6% 17.4% 0.95 0.94
No 1942 94.1% 357 94.4% 18.4% 1.00 1.00
Total 2063 100.0% 378 100.0% 18.3% -- --
No disproportionate impact existed with regard to disability status on degree and certificate
attainment.
Economic Status
Table 39 presents the counts and percentages of students in the 2008-2009 cohort as well as
those students in the cohort who either obtained a degree or certificate, disaggregated by
economic status.
Table 39
Degree and Certificate Completion by Economic Status
Economic
Status
Cohort
2008-
2009
% of
Cohort
Outcome
Count
% of
Outcome
Degree
Rate
Proportionality
Index
80-
Percent
Index
Disadvantaged 1453 70.4% 265 70.1% 18.2% 1.00 0.98
Non-dis. 610 29.6% 113 29.9% 18.5% 1.01 1.00
Total 2063 100.0% 378 100.0% 18.3% -- --
No disproportionate impact existed with regard to economic status on degree and certificate
attainment.

60
Degree and Certificate Completion Comparison
Table 40 presents the three students groups which experienced the greatest gaps with regard to
degree and certificate completion rates.
Table 40
Degree and Certificate Gap Comparison
Equity Gap Student Group % Gap Decimal Gap Initial cohort Students Lost
Largest Gap 20-24 year olds 4.8% .048 170 8.16
Second Largest Male students 3.8% .038 963 36.59
Third Largest Asian students 2.1% .021 345 7.25
Overall, the average degree and certificate completion rate for the 2008-2009 cohort was 18.3%.
All three groups noted above displayed disproportionate impact with regard to degree and
certificate completion. Moreover, 20-24 year old students displayed the lowest relative award
rate per sample size.
GOALS, ACTIVITIES, FUNDING AND EVALUATION: DEGREE AND
CERTIFICATE COMPLETION
GOAL D.
The goal is to improve degree and certificate completion for the following target populations
identified in the college research as experiencing a disproportionate impact:
Target Population(s) Methodology Current gap*, year Goal Goal Year
20-24 year old students 80-percent -4.8%, 2008-2009 cohort -2% 2018
Male students 80-percent -3.8%, 2008-2009 cohort -2% 2018
Asian students 80-percent -2.1%, 2008-2009 cohort No gap 2020
*Note. All three target populations had disproportionate impact for degree and certificate
completion utilizing the 80-percent index.
ACTIVITIES: D. DEGREE AND CERTIFICATE COMPLETION
D.1 – Minority Male Community College Collaborative (M2C3) Workshops
● Activity Type(s)
Outreach Student Equity
Coordination/Planning
X Instructional Support
Activities
Student Services or
other Categorical
Program
X Curriculum/Course
Development or
Adaptation
X Direct Student Support
X Research and X Professional Development

61
Evaluation
● Target Student Group(s) & # of Each Affected*:
ID Target Group(s) # of Students Affected
D.1 Male Students 963
● Activity Implementation Plan As a member of the consortium, Cypress College will have access to a vast clearinghouse of
resources provided by M2C3. The collaborative frequently facilitates webinars on male students
of color and creates virtual discussion boards to encourage dialogue on best practices. Cypress’
collaboration with M2C3 will enhance professional development for faculty and staff, enable
informed interventions for our current programs serving men of color, and inspire new initiatives
addressing challenges facing these men. During the 2015 – 2016 academic year, M2C3 will host
several professional development workshops, and a student panel to assist in our student equity
efforts.
The Collaborative will provide three workshops during the 2015-2016 year, which consist
of:
o Faculty Strand – Teaching and Engaging Minority Male Students
o Staff Strand – Creating Conditions that Foster Engagement Among College Men of Color
o Student Strand – The Effects of Racial Microaggressions on the Success of College Men
of Color
ID Planned Start and End Date(s) Student Equity
Funds
Other Funds**
D.1 November 2015 – February 2016 $10,000 $0
Total - $10,000
● Link to Goal GOAL:
Increase degree and certificate completion for all students, especially those identified as
target populations
Collaboration with M2C3 will support Cypress College in maintaining a culturally-
responsive climate at all levels of service, while promoting diversity and inclusion between
faculty, staff and students.
● Evaluation

62
The effectiveness and usefulness of the three workshops provided by M2C3 will be evaluated
utilizing a survey that will be created by the Institutional Research office. The number of
faculty and staff that attend the three workshops will also be tracked. The number of new
interventions and initiatives inspired from this collaboration will also be tracked and each
new intervention and/or initiative will also be evaluated. The College is scheduled to send
out a climate survey to all employees which will provide a baseline regarding cultural
responsiveness and diversity within the classrooms, and the climate survey will be repeated
in the following years to measure improvement with regard to these areas.
D.2 – Professional Development Funding
● Activity Type(s)
Outreach X Student Equity
Coordination/Planning
X Instructional Support
Activities
Student Services or
other Categorical
Program
X Curriculum/Course
Development or Adaptation
Direct Student Support
Research and
Evaluation
X Professional Development
● Target Student Group(s) & # of Each Affected*:
ID Target Group # of Students Affected
D.2 AAPI Students 520
African American Students 89
American Indian/Alaskan Native 8
Hispanic/Latino 613
Female Students 1078
Male Students 963
Students with Disabilities 121
Veterans 587
White Students 570
● Activity Implementation Plan
Professional Development within Student Equity is needed in order to implement Student
Equity goals of increasing student retention, persistence, transfer, and success of underserved
students. By increasing the number of activities, speakers, and conferences offered,
Professional Development will be able to educate a greater number of faculty and staff on
these issues. Their enhanced knowledge and skill set in the classroom and across the counter
will filter down to impact student success across the campus. Professional Development is
targeting full time faculty, adjunct, and classified staff for these activities with the estimated
number of participants served to be about 100-150 individuals.

63
Student Equity Workshops Include:
o Student Support Services
o Mental Health Resources- Utilizing Kognito Software
o Supporting Students with Disabilities
o Working Effectively with Male Minority Students
o The Green Zone: Working with Veterans
o Active Learning Strategies for Diverse Learners
o Working Effectively with LBGTQ Students
o Working Effectively with Female Minority Students
o Working with Students with Autism
o Designing an Effective Syllabus
o Closing the Achievement Gap
ID Timeline(s) Student Equity Funds Other Funds**
D.2 January 2016 - Ongoing $70,000 $35,000
Total - $105,000
● Link to Goal GOAL:
Determine how to increase degree and certificate completion rates for all students, with
special attention given to AAPI students, male students
Professional Development activities will be focused on helping staff and faculty to
understand the needs and practices that work to support specific target populations identified
in Cypress College Student Equity Plan. Students will be served by having faculty and staff
who are more aware of the challenges they face and the tools needed to help them address
their particular needs.
● Evaluation
Each Student Equity workshop will be briefly evaluated through the use of surveys that will
be created. The workshops will be evaluated by attendees, and they will be evaluated based
on the applicability, usefulness, and meaningfulness of the topics for each attendee.
Moreover, the number of attendees for all workshops over time will be tracked to identify
trends with regard to workshop attendance. The number of one time funding requests related
to professional development activities and student equity workshops will also be tracked to
measure cultural change across the campus.

64
Transfer
Data Source
Data on transfer rates were obtained from the California Community College Chancellor’s Office
Data Mart.
Methodology
Transfer ratios were calculated by dividing the percentage of first-time students in 2008-2009
who transferred to a four-year institution by the percentage of those cohort students who could
have transferred.
The denominator, or percentage of the cohort, refers to the percentage of a population sub-group
who were first-time freshmen in the 2008-2009 school year, who completed 12 or more credit
units at any California Community College, and attempted a transfer level course either in math
or English.
The numerator, or percentage of the outcome, refers to the percentage of the population subgroup
who transferred to a four-year institution within six years.
Both proportionality and 80-percent indices were calculated for all available variables: 1) gender
(male, female, unknown), 2) ethnicity and race (American Indian or Alaskan Native, Asian,
Black/African American, Filipino, Hispanic, Pacific Islander, White, and unreported), 3) age (19
or less, 20 – 24, 25 – 49, and 50+), 4) Disability status (yes or no), and 5) financial aid status
(yes or no).
Data on foster youth and veterans for the 2008-2009 cohort are not applicable due to the small
sample size.
Gender
Table 41 presents the counts and percentages of students in the 2008-2009 cohort as well as
those students in the cohort who transferred to a four-year institution, disaggregated by gender.
Table 41
Transfer Ratio by Gender
Gender Cohort
2008-
2009
% of
Cohort
Outcome
Count
% of
Outcome
Transfer
Rate
Proportionality
Index
80-
Percent
Index
Female 770 54.0% 310 52.2% 40.3% 0.97 0.94
Male 643 45.1% 276 46.5% 42.9% 1.03 1.00
Unknown 14 1.0% 8 1.3% 57.1% 1.37 na
Total 1427 100.0% 594 100.0% 41.6% -- --

65
Female students were slightly underrepresented in the transfer outcome (proportionality index =
.97), when compared to the overall cohort. However, no disproportionate impact exists with
regard to gender within the transfer ratio.
Ethnicity/Race
Table 42 presents the counts and percentages of students in the 2008-2009 cohort as well as
those students in the cohort who transferred to a four-year institution, disaggregated by
ethnicity/race.
Table 42
Transfer Ratio by Ethnicity/Race
Ethnicity /
Race
Cohort
2008-
2009
% of
Cohort
Outcome
Count
% of
Outcome
Transfer
Rate
Proportionality
Index
80-
Percent
Index
Am. Indian 3 0.2% 1 0.2% 33.3% 0.80 na
Asian 252 17.7% 155 26.1% 61.5% 1.48 1.00
Black 48 3.4% 19 3.2% 39.6% 0.95 0.64
Filipino 119 8.3% 44 7.4% 37.0% 0.89 0.60
Hispanic 375 26.3% 129 21.7% 34.4% 0.83 0.56
P. Islander 20 1.4% 5 0.8% 25.0% 0.60 na
White 421 29.5% 163 27.4% 38.7% 0.93 0.63
Unreported 189 13.2% 78 13.1% 41.3% 0.99 0.67
Total 1427 100.0% 594 100.0% 41.6% -- --
White students represented the largest proportion of students in the cohort (29.5%, n = 421). All
racial and ethnic groups displayed disproportionate impact when compared to Asian students
which served as the group with the highest transfer rate. Thus, this indicates an equity gap in
transfer ratio for all ethnicities and races aside from Asian students.
Age
Table 43 presents the counts and percentages of students in the 2008-2009 cohort as well as
those students in the cohort who transferred to a four-year institution, disaggregated by age.

66
Table 43
Transfer Ratio by Age
Age Cohort
2008-
2009
% of
Cohort
Outcome
Count
% of
Outcome
Transfer
Rate
Proportionality
Index
80-
Percent
Index
19 or less 1232 86.3% 550 92.6% 44.6% 1.07 1.00
20-24 95 6.7% 30 5.1% 31.6% 0.76 0.71
25-49 89 6.2% 13 2.2% 14.6% 0.35 0.33
50+ 11 0.8% 1 0.2% 9.1% 0.22 na
Total 1427 100.0% 594 100.0% 41.6% -- --
Both 20-24 as well as 25-49 year old students had disproportionately lower transfer rates when
compared to students aged 19 or younger.
Disability Status
Table 44 presents the counts and percentages of students in the 2008-2009 cohort as well as
those students in the cohort who transferred to a four-year institution, disaggregated by disability
status.
Table 44
Transfer Ratio by Disability Status
Disability
Status
Cohort
2008-
2009
% of
Cohort
Outcome
Count
% of
Outcome
Transfer
Rate
Proportionality
Index
80-
Percent
Index
Yes 69 4.8% 17 2.9% 24.6% 0.59 0.58
No 1358 95.2% 577 97.1% 42.5% 1.02 1.00
Total 1427 100.0% 594 100.0% 41.6% -- --
Students with disabilities represented a disproportionately small number of students (2.9%, n =
17) when compared to their representation within the transfer cohort (4.8%, n = 69). Moreover,
students with disabilities display disproportionate impact within the transfer metric. This
indicates that an equity gap exists for students with disabilities when examining transfer status.
Financial Aid Status
Table 45 presents the counts and percentages of students in the 2008-2009 cohort as well as
those students in the cohort who transferred to a four-year institution, disaggregated by financial
aid status.

67
Table 45
Transfer Ratio by Financial Aid Status
Financial
Aid Status
Cohort
2008-
2009
% of
Cohort
Outcome
Count
% of
Outcome
Transfer
Rate
Proportionality
Index
80-
Percent
Index
Recipient 854 59.8% 343 57.7% 40.2% 0.96 0.92
Non-
recipient 573 40.2% 251 42.3% 43.8% 1.05 1.00
Total 1427 100.0% 594 100.0% 41.6% -- --
Financial aid recipients were slightly underrepresented in the transfer outcome (proportionality
index = .96), when compared to the overall cohort.
Transfer Ratio Comparison
Table 46 presents the three students groups which experienced the greatest gaps with regard to
transfer rates.
Table 46
Transfer Gap Comparison
Equity Gap Student Group % Gap Decimal Gap Initial cohort Students Lost
Largest Gap 25-49 year olds 27.0% .27 89 24.03
Second Largest Students with
disabilities 17.0% .17 69 11.73
Third Largest 20-24 year olds 10.0% .10 95 9.50
Overall, the average transfer rate for the 2008-2009 cohort was 41.6%. All three groups noted
above displayed disproportionate impact with regard to transfer rates. Moreover, a large 27% gap
in transfer was noted when examining 25-49 year old students.
GOALS, ACTIVITIES, FUNDING AND EVALUATION: TRANSFER
GOAL E.
The goal is to improve transfer for the following target populations identified in the college
research as experiencing a disproportionate impact:
Transfer Completion
Target Population(s) Methodology Current gap*, year Goal Goal Year
25-49 year old students 80-percent -27.0%, 2008-2009 cohort -20% 2020
Students with disabilities 80-percent -17.0%, 2008-2009 cohort -10% 2020
20-24 year old students 80-percent -10.0%, 2008-2009 cohort -5% 2020
*Note. All three target populations had disproportionate impact for transfer completion utilizing
the 80-percent index.

68
ACTIVITIES: E. TRANSFER
E.1 – Science Institute for Underrepresented Students
● Activity Type(s)
X Outreach Student Equity
Coordination/Planning
X Instructional Support
Activities
Student Services or
other Categorical
Program
X Curriculum/Course
Development or
Adaptation
X Direct Student Support
X Research and
Evaluation
Professional Development
● Target Student Group(s) & # of Each Affected*:
ID Target Group(s) # of Students Affected
E.1 AAPI Students 391
African American Students 48
Hispanic/Latino Students 375
Low Income Students 854
***Various (Depending on applicant
response. Not exclusive to top three target
groups)
GOAL 90-100 (Pilot
Year Cohort)
● Activity Implementation Plan The objective of the Science Institute is to address the disproportionately low numbers of
African American (and Latino) students declaring STEM majors at Cypress College with the
goal of transferring to a four-year university to major in STEM. According to the National
Center for Educational Statistics (NCES, 2010), the percentages of bachelor’s degrees
conferred in STEM fields varied across racial/ethnic groups. The percentage of African
American and Latino students graduating with STEM degrees is approximately 16% below
the populations receiving the highest number of degrees (NCES, 2010). As a result of these
statistics, the idea of SIfUS was constructed/framed with African American students in mind.
According to the most current data received from the Cypress College Institutional Research
department, many African American students test into courses that are two semesters below
college level Math and English. Therefore, it is critical to design a program that attempts to
reach African American students where they are and provide the necessary resources (i.e.
counseling, tutoring, etc.) for them to be successful. Hence, attached one will find two,
sample, STEM-oriented Student Educational Plans (SEPs) with commencement and
completion dates.
ID Planned Start and End Date(s) Student Equity
Funds
Other Funds**
E.1 Initial Cohort Beginning Fall 2016
Initial Cohort Culminating Spring 2019
$103,250/Per Year $0
Total = $103,250

69
● Link to Goal GOAL:
Identify barriers to course completion for target groups
Through participation in the Science Institute, a learning community for science majors,
students will have the opportunity to complete rigorous science courses together to increase
their potential for success.
● Evaluation
Upon the implementation of the Science Institute in Fall 2016, the yearly student cohorts will
be tracked to measure unit completion, abbreviated and comprehensive educational plan
completion, and eventually, to track the number of Science Institute students transferring to
4-year colleges and universities for both STEM related and non-STEM related majors and
career paths. The percentage of African American STEM course enrollments at the College
before and after the implementation of the Science Institute will be tracked. Similarly,
Science Institute students will be compared to a matched sample of students, based on
demographic trends, and STEM course enrollment to assess the Science Institute’s impact on
students’ success, retention, and persistence rates. Effectiveness of counseling and tutoring
resources will also be assessed by a survey which will be created by the Institutional
Research and Planning office.
E.2 EOP&S/CARE/Guardian Scholars – Supplemental Support
● Activity Type(s)
X Outreach Student Equity
Coordination/Planning
Instructional Support
Activities
X Student Services or
other Categorical
Program
Curriculum/Course
Development or Adaptation
X Direct Student
Support
Research and
Evaluation
Professional Development
● Target Student Group(s) & # of Each Affected*:
ID Target Group(s) # of Students Affected
E.2 Various 200-300
● Activity Implementation Plan EOPS is a state and college funded program designed to assist students with economic,
linguistic, and educational challenges (as defined by Title V) enroll and succeed in higher
education. Comprehensive support services are provided to promote access to college and
once the student is enrolled, to increase retention and/or transfer to four-year universities and
colleges.

70
Expanded offerings to the program made possible by equity funding include:
o Book purchases for the EOPS Book Loan Library, which will provide students with a
selection of books to check out for studying.
o Calculators to be housed in the EOPS department which students can check out to use for
their academics.
o A Northern University Trip which will enable students to visit UCLA, UCSB, UCD, and
UCB over the course of three days, allowing students an experience that they would
otherwise not have the means to do on their own due to the financial hardships they face.
The purpose of the trip is to expose EOPS students to university life and transfer options
so that they may increase the knowledge and motivation necessary to transfer
successfully.
o The EOPS Region 8 committee will be implementing a staff development conference
focused on best practices in serving foster youth in April 2016. Now that EOPS will be
charged with serving foster youth through the Chancellor’s Office Cooperating Agencies
Foster Youth Educational Support (CAFYES) initiative, EOPS faculty and staff must be
well trained in identifying and meeting the unique needs of foster youth. This regional
training will be facilitated by Theresa Reed of Pasadena City College who has extensive
background with foster youth and mental health services. Her training will focus on
addressing the mental health needs of foster youth so that they may be successful college
students. The $150 one-day conference registration cost covers materials and meals for
each attendee. EOPS will send all faculty and staff available to attend the foster youth
training.
ID Planned Start and End
Date(s)
Student Equity Funds Other Funds**
E.2 Ongoing $45,000 $894,570 – State Allocation
$162, 345 – District Match
$0 Allocated to Guardian
Scholars Program
Total = $1,101,915
● Link to Goal GOAL:
Increase transfer rates of target populations, and all students identifying transfer as their
goal during enrollment.
EOPS serves a variety of students from various ethnic backgrounds. The goals of the EOPS
program are perfectly aligned with the goals of the Student Equity initiative.

71
● Evaluation Currently, EOPS students are tracked with regard to their course success and retention rates,
as well as their use of tutoring and SI services. However, this tracking will expand to track
the amount of EOPS students who have successfully transferred to 4-year colleges and
universities as well as to graduate level programs. Students will have opportunities to attend
field trips to various 4-year public universities, and the effectiveness of these field trips will
continue to be evaluated using surveys. More specifically, these surveys will measure
students’ intent to transfer, participation in various transfer directed activities, and their
knowledge gained regarding transfer. Students will also be asked about specific universities
that they may have intent to transfer to as a direct result of participation in the field trips.
E.3 – STEM2 Direct Student Support
● Activity Type(s)
X Outreach Student Equity
Coordination/Planning
Instructional Support
Activities
Student Services or
other Categorical
Program
Curriculum/Course
Development or
Adaptation
X Direct Student Support
Research and
Evaluation
Professional Development
● Target Student Group(s) & # of Each Affected*:
ID Target Group # of Students Affected
E.3 Various 130-150
● Activity Implementation Plan A public four-year university has teamed up with three community colleges to collaborate
toward transfer readiness, transition, and academic success for science, engineering, and
math students. Unlike many STEM collaborations between two- and four-year institutions,
this project involves a coordinated team approach including administrators, faculty, and staff
at each of the campuses involved. The program aims to provide both academic and social
interventions supported by a robust IT system, refined to increase support for articulation and
transfer. The overall project grant began in fall 2011 and will be in effect through fall 2016.
The program was implemented at Cypress College in spring 2012 and welcomed their first
STEM2 Program students in fall 2012. This project is in alignment with the purpose of SB
1440.
ID Timeline(s) Student Other Funds**

72
Equity
Funds
E.3 January 2016 – Tentative (Decision
TBD as HIS STEM Grant
Concludes at the End of
Summer 2016)
$22,000 $125,875.00 – Hispanic Serving
Institutions - Science,
Technology,
Engineering, or
Mathematics (HSI
STEM)
● Link to Goal GOAL:
Increase transfer rates for all students and special target groups.
The STEM2 program provides increased student support to historically underserved and
underrepresented populations. Student Equity funding will expand on the services offered to
these students pursuing majors in Science, Math, or Engineering.
● Evaluation
The STEM2 Program will be holistically evaluated by examining various indicators of
success including students’ course based success rates, fall to fall persistence rates, amount
of associates degrees obtained, and transfer rates to four-year universities. These statistics
will be compared to students not in the STEM2 program with similar demographics. The
cohort that will be the focus of the evaluation began in the program in fall 2012, and course
based success rates and fall to fall persistence rates from the 2010-2011 school year as well
as the 2011-2012 school year will be compared to the baseline rates as a means for
comparison of progress. Moreover, the amount of students who have declared a STEM major
will also be compared to data prior to the implementation of the Program.

73
Other College- or District-wide Initiatives
Affecting Several Indicator
GOALS, ACTIVITIES, FUNDING AND EVALUATION: AFFECTING SEVERAL
INDICATORS
ACTIVITIES: F. ACTIVITIES AFFECTING SEVERAL GOALS
F.1 – Student Equity Personnel
● Indicators/Goals to be affected by the activity
X Access X Degrees and Certificate Completion
X Course Completion X Transfer
X ESL and Basic Skills Course Completion
● Activity Type(s)
X Outreach X Student Equity
Coordination/Planning
Instructional Support
Activities
X Student Services or other
Categorical Program
Curriculum/Course
Development or
Adaptation
Direct Student Support
X Research and Evaluation Professional Development
● Target Student Group(s) & # of Each Affected*:
ID Target Group # of Students Affected
F.1 Various 15,000 +
● Activity Implementation Plan
Continued funding of a full-time Special Project Director of Student Equity to plan,
develop, direct and manage the Cypress College Equity initiative.
Continued funding of a full-time Senior Research Analyst to support Student Equity
research and inquiry.
Funding of a new, full-time position for a Student Equity Administrative Assistant to
facilitate the day-to-day operations of the Equity Office.
ID Planned Start and
End Date(s)
Student Equity Funds Other Funds**

74
F.1 Ongoing $94,543 – Student Equity Director/
Salary & Benefits
$107,071 – Senior Research Analyst/
Salary & Benefits
$58,103 – Student Equity
Administrative Assistant
$0
Total - $ 259,717 (including salary and insurance benefits)
● Link to Goal
Identify barriers for students in several indicators through collaboration with Cypress
College faculty and staff
The Office of Equity will collaborate with each department/division on campus to ensure that
Equity is a campus-wide initiative.
● Evaluation
The amount of one-time funding requests and strategic plan funding requests related to
student equity related projects and programs will be tracked to assess the campus-wide
understanding of issues related to student equity.
F.2 – Special Project Manager, Veteran’s Resource Center
X Access X Degrees and Certificate Completion
X Course Completion X Transfer
X ESL and Basic Skills Course Completion
Activity Type(s)
X Outreach Student Equity
Coordination/Planning
Instructional Support
Activities
X Student Services or other
Categorical Program
Curriculum/Course
Development or Adaptation
X Direct Student Support
X Research and Evaluation Professional Development
Target Student Group(s) & # of Each Affected*:
ID Target Group # of Students
Affected
F.2 Veterans 657
Activity Implementation Plan
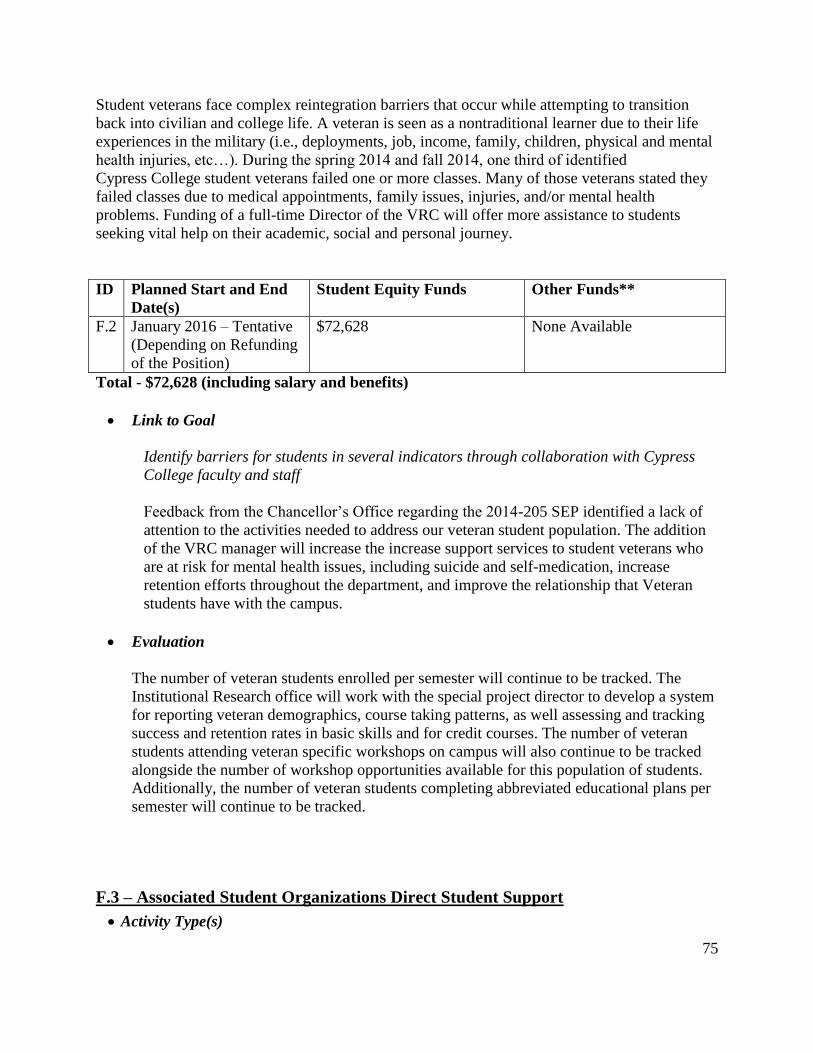
75
Student veterans face complex reintegration barriers that occur while attempting to transition
back into civilian and college life. A veteran is seen as a nontraditional learner due to their life
experiences in the military (i.e., deployments, job, income, family, children, physical and mental
health injuries, etc…). During the spring 2014 and fall 2014, one third of identified
Cypress College student veterans failed one or more classes. Many of those veterans stated they
failed classes due to medical appointments, family issues, injuries, and/or mental health
problems. Funding of a full-time Director of the VRC will offer more assistance to students
seeking vital help on their academic, social and personal journey.
ID Planned Start and End
Date(s)
Student Equity Funds Other Funds**
F.2 January 2016 – Tentative
(Depending on Refunding
of the Position)
$72,628 None Available
Total - $72,628 (including salary and benefits)
Link to Goal
Identify barriers for students in several indicators through collaboration with Cypress
College faculty and staff
Feedback from the Chancellor’s Office regarding the 2014-205 SEP identified a lack of
attention to the activities needed to address our veteran student population. The addition
of the VRC manager will increase the increase support services to student veterans who
are at risk for mental health issues, including suicide and self-medication, increase
retention efforts throughout the department, and improve the relationship that Veteran
students have with the campus.
Evaluation
The number of veteran students enrolled per semester will continue to be tracked. The
Institutional Research office will work with the special project director to develop a system
for reporting veteran demographics, course taking patterns, as well assessing and tracking
success and retention rates in basic skills and for credit courses. The number of veteran
students attending veteran specific workshops on campus will also continue to be tracked
alongside the number of workshop opportunities available for this population of students.
Additionally, the number of veteran students completing abbreviated educational plans per
semester will continue to be tracked.
F.3 – Associated Student Organizations Direct Student Support
Activity Type(s)

76
X Outreach Student Equity
Coordination/Planning
Instructional Support
Activities
Student Services or
other Categorical
Program
Curriculum/Course
Development or
Adaptation
X Direct Student Support
Research and Evaluation Professional Development
Target Student Group(s) & # of Each Affected:
ID Target Group # of Students
Affected
F.3 AAPI Students
African American Students
Students Ages 25-49
Hispanic/Latino Students
Male, Female, Gender Fluid
Veterans
15,000 +
Activity Implementation Plan
The Associated Students (AS) provide students with learning, leadership, and service
opportunities outside the classroom The organization’s activities are closely related to the regular
instructional program that addresses the persona, academic, and social needs of students. AS is
housed in the Student Activities Center which provides an element of students’ lives that co-
exists with their academic endeavors. The recently renovated Student Activities building offers
students small computer lab, student lounge, conference room, Associated Students executive
office areas, and a general work area for student club projects. Additionally, The Student
Activities office facilitates student participation in shared governance for the college, coordinates
a variety of events/activities for the student population of the campus, provides a focus point for
approximately 15-20 clubs on campus, and serves all of the day time students of Cypress
College.
ID Planned Start and End
Date(s)
Student Equity Funds Other Funds**

77
F.3 January, 2016 - ongoing $16,655 ***These totals are
approximate figures. The
amount is contingent on AS
benefits raised each year.
$82,000 (AS Benefits) ticket
sales and representative fee
$17,000
Total = $115,655
Link to Goal Access GOAL:
Identify barriers for students in several indicators through collaboration with Cypress
College faculty and staff
The AS organization collaborates with various student services departments and instructional
divisions to ensure that students receive a comprehensive college experience. The clubs
reflect the target populations identified by the Chancellor’s Office, including LGBTIQ
students, veterans, and a multitude of ethnic-identified groups, such as the Black Student
Union and Movimiento Estudiantil Chicano de Aztlán (MEChA). Equity funding to these
student groups will support peer-to-peer connection, student outreach efforts, and increase
student leadership.
Evaluation
Outreach activities will be tracked for AS groups. As this activity has the potential to
positively impact several indicators, the Institutional Research and Planning office will
continue to track course completion, degree/certificate complete, and transfer patterns for
students in particular AS groups to attempt to measure the impact of their participation.
F.4. – Equity Ally Project
Activity Type(s)
X Outreach X Student Equity
Coordination/Planning
X Instructional Support
Activities
X Student Services or
other Categorical
Program
X Curriculum/Course
Development or
Adaptation
X Direct Student Support
X Research and
Evaluation
X Professional Development
Target Student Group(s) & # of Each Affected:
ID Target Group # of Students

78
Affected
F.4 AAPI Students
African American Students
Students Ages 25-49
Hispanic/Latino Students
Male, Female, Gender Fluid
Veterans
15,000 +
Activity Implementation Plan
Like many campuses, Cypress College will facilitate a Student Equity retreat that introduces
engages all levels of the campus: administration, faculty, staff and students. The retreat, hosted in
early spring, will be a day-long, conference-style event with several strands to engage the
aforementioned levels of campus personnel and students. The College will solicit Dr. Veronica
Neal to keynote the retreat, and offer several workshops tailored to the needs of each level.
Additionally, the retreat will host workshops led by Drs. Harris and Wood of the Minority Male
Community College Collaborative, and possibly renowned Community College of Aurora math
faculty, James Gray. The goal of the retreat is to prepare participants for the Equity Ally Project,
the College’s campus-wide initiative to promote equity-mindedness (Bensimon, Dowd, Harris,
2007) and equitable spaces throughout campus.
ID Planned Start and End
Date(s)
Student Equity Funds Other Funds**
F.4 January5 2016 - ongoing $80,000 $0
Total = $80,000
Link to Goal Identify barriers for students in several indicators through collaboration with Cypress
College faculty and staff
The Equity Ally Project will expand on the best practices received and discussed during the
Student Equity retreat. The project will roll-out during the fall 2016 semester, with identified
equity leaders for each department and division. Additionally, the project will identify equity
allies for target populations identified by the Chancellor’s Office, such as veterans, LGBTIQ
identified, African Americans, Hispanic/Latino, etc. These individuals will be recognized by
a decal posted on their office door, or window that alerts students of the allies’ presence.
Students will be made aware of this program through student leaders that participate in the
equity retreat.

79
Evaluation
Each Student Equity workshop will be briefly evaluated through the use of surveys that will
be created. The workshops will be evaluated by attendees, and they will be evaluated based
on the applicability, usefulness, and meaningfulness of the topics for each attendee.
Moreover, the number of attendees for all workshops over time will be tracked to identify
trends with regard to workshop attendance. The number of one time funding requests related
to professional development activities and student equity workshops will also be tracked to
measure cultural change across the campus.
Summary Budget
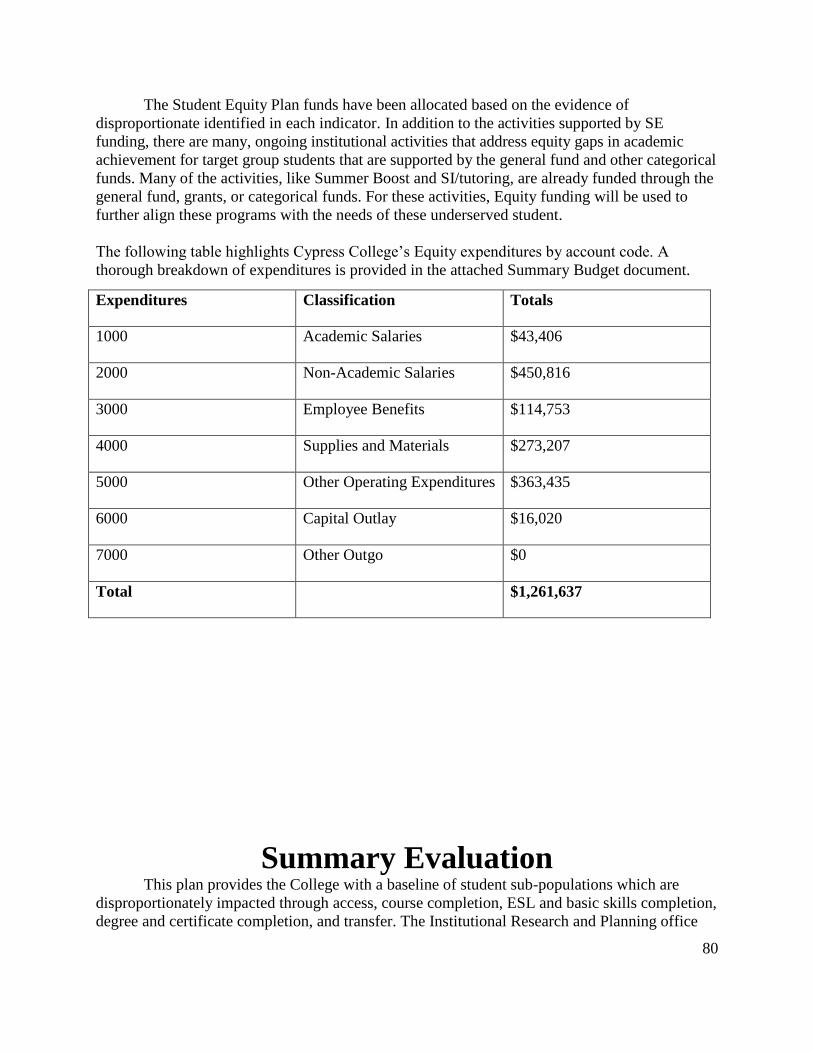
80
The Student Equity Plan funds have been allocated based on the evidence of
disproportionate identified in each indicator. In addition to the activities supported by SE
funding, there are many, ongoing institutional activities that address equity gaps in academic
achievement for target group students that are supported by the general fund and other categorical
funds. Many of the activities, like Summer Boost and SI/tutoring, are already funded through the
general fund, grants, or categorical funds. For these activities, Equity funding will be used to
further align these programs with the needs of these underserved student.
The following table highlights Cypress College’s Equity expenditures by account code. A
thorough breakdown of expenditures is provided in the attached Summary Budget document.
Expenditures Classification Totals
1000 Academic Salaries $43,406
2000 Non-Academic Salaries $450,816
3000 Employee Benefits $114,753
4000 Supplies and Materials $273,207
5000 Other Operating Expenditures $363,435
6000 Capital Outlay $16,020
7000 Other Outgo $0
Total $1,261,637
Summary Evaluation
This plan provides the College with a baseline of student sub-populations which are
disproportionately impacted through access, course completion, ESL and basic skills completion,
degree and certificate completion, and transfer. The Institutional Research and Planning office

81
will continue to use Data on Demand and Data Mart reports to help evaluate the target goals for
areas with disproportionate impact. The evaluation plans for each activity will help to inform and
foster positive outcome measures for the core metrics noted above. Progress on mitigating
disproportionate impact and increasing completion rates will be continually evaluated and
reported annually, as recommended by the California Chancellor’s Office.
Each individual program noted in the goals and activities section for each of the core
metrics will be evaluated continuously on a yearly basis by the Institutional Research and
Planning office. The research office will meet with directors and coordinators of each of the
programs noted above to review the evaluation plans currently in place as well as to measure
each program’s goals and objectives in relation to student equity.
Program evaluations will mainly be quantitative, with some qualitative data collection to occur at
an as needed basis to provide a holistic view of each program through the evaluations. Initial
baseline data has already been collected for a majority of the programs and activities, and
formative evaluation data will be collected mainly at the close of the fall 2015 and spring 2016
semesters to help inform progress on student equity goals and activities on a yearly basis.
Similarly, data will be reviewed upon completion of each evaluation on a yearly, or as needed (if
needed prior to the yearly evaluation), basis. The main methods for evaluation include analysis
of student success, retention, and persistence rates. This process will continue for the duration of
the current plan, and it will also be adapted for use within future student equity planning
attempts.
Program outcomes, including equity related outcomes, will continue to be reported to the
directors and coordinators for each specific program. The data will be used to further refine
program goals and objectives as well as to set target outcomes for future students that the
programs will serve. Results will also be disseminated to the Student Equity Committee on
campus which consists of representatives from Disabled Student Services (DSS), faculty,
research, outreach, admissions and records, EOPS, the professional development committee,
counselors, a student trustee, and a student. From the Student Equity Committee meetings,
evaluations results may also be provided for the College’s Planning and Budget Committee
(PBC) and President’s Advisory Cabinet (PAC). As a result of evaluations, successful programs
may be expanded and/or institutionalized.
The research-based evaluation results will help to inform current practices to help
establish best practices for serving students at Cypress College. The Institutional Research and
Planning office will disseminate evaluation related information for student equity related
outcomes for each specific program as well as to the Committee. Currently, equity evaluation
processes coincide with program review processes for specific equity related courses that occur
as part of the curriculum for some of the programs and activities; thus, equity related outcomes
could be reported for program review for the specific courses. Cypress College is currently
developing the 2017-2026 educational master plan, and the committee will develop the plan with
student equity, access, and success to help inform the planning process.

82

83
References
Bensimon, E. M., & Harris III, F. (2012). The mediational means of enacting equity-mindedness
among community college practitioners. In E. M. Bensimon & L. E. Malcolm (Eds.),
Confronting equity issues on campus: Implementing the Equity Scorecard in theory and
practice. Sterling, VA: Stylus Publishing.
Linton, C.W. (2011). The equity framework. Thousand Oaks, California: SAGE Publishing.
Kuh, G. D. (2008). High-impact educational practices: What they are, who has access to them,
and why they matter. Washington, DC: Association of American Colleges and
Universities.
Kuh, G. D. & Zhao, C. (2004). Adding value: Learning communities and student engagement.
Research in Higher Education, 45(2): 115-138.
National Survey of Student Engagement. (2007). Experiences that matter: Enhancing student
learning and success [Annual Report 2007]. Bloomington, IN: Indiana University Center
for Postsecondary Research.
The Puente Project. (n.d). Community College Programs. Retrieved from
http://puente.berkeley.edu/community-college-programs.