Embed Size (px)
Citation preview
€3. €3. Mehnert, D. J. Van Roosendaal, R. A. Bauer, D. Barkley, and E. Gefell
cooperating agencies
ILLINOIS STATE GEOLOGICAL SURVEY Illinois Department of Energy and Natural Resources
BUREAU OF MINES United States Department of the Interior
B. B. Mehnert, D. J. Van Roosendaal, R. A. Bauer, D. Barkley, and E. Gefell
ILLINOIS STATE GEOLOGICAL SURVEY Morris W. Leighton, Chief
Natural Resources Building 615 East Peabody Drive Champaign, IL 61 820-6964

The Illinois Mine Subsi (IMSRP) was estab- lished in 1985 to investigate methods and develop guidelines for under- ground mining operations that aim to maximize coal extraction yet pre- serve the productivity of prime farmland. The research program was initiated by the lllinois Coal Association and the lllinois Farm Bureau.
The lllinois State Geological Survey, a division of the lllinois Department of Energy and Natural Resources, directed the IMSRP. Participating research institutions included Southern lllinois University at Carbondale, the University of lllinois at Urbana-Champaign, Northern lllinois Univer- sity, and the lllinois State Geological Survey. A 5-year Memorandum of Agreement, signed by the State of lllinois and the Bureau of Mines, U. S. Department of the Interior, ensured collaboration, cooperation, and financial support through 1991. Major funding was also provided by the lllinois Coal Development Board.
This publication is one in a series printed and distributed by the Illinois State Geological Survey as a service to the IMSRP.
Printed by authority of the State of Illinois/l994/800

ABSTRACT
INTRODUCTION
Scope and Purpose
Background and Previous Studies Natural resources affected by mine subsidence Methods of mining Overburden fracturing Hydrogeologic effects Surface subsidence characteristics
Physical Setting Site selection Physiography Surficial geology Bedrock stratigraphy and structure Hydrogeology
Mine Description
GEOTECHNICAL MONITORING PROGRAM
Introduction Instrument layout Mine operations
Surface Subsidence and Deformation Monitoring Surveying Tiltplates
Overburden Characterization Exploratory drilling Laboratory testing for intact rock properties
Overburden Deformation Monitoring Multiple-position borehole extensometer Time-domain reflectometry
Hydrogeologic Investigations Drift piezometers Bedrock observation wells
MONITORING PROGRAM RESULTS
East Cluster Surveying and subsidence characteristics Overburden deformation monitoring Hydrogeologic investigations
West Cluster Surveying and subsidence characteristics Hydrogeologic investigations
CONCLUSIONS
RECOMMENDATIONS
ACKNOWLEDGMENTS
REFERENCES
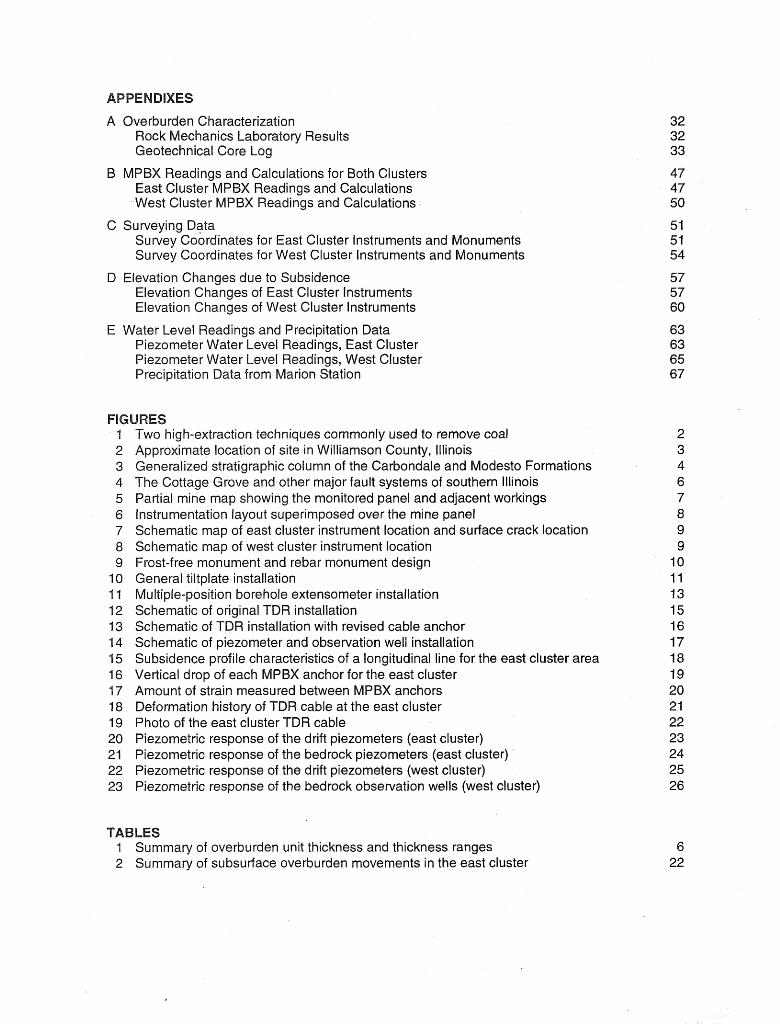
A Overburden Characterization Rock Mechanics Laboratory Results Geotechnical Core Log
PBX Readings and Calculations for Both Clusters East Cluster MPBX Readings and Calculations West Cluster MPBX Readings and Calculations
C Surveying Data Survey Coordinates for East Cluster lnstruments and Monuments Survey Coordinates for West Cluster lnstruments and Monuments
D Elevation Changes due to Subsidence Elevation Changes of East Cluster lnstruments Elevation Changes of West Cluster lnstruments
E Water Level Readings and Precipitation Data Piezometer Water Level Readings, East Cluster Piezometer Water Level Readings, West Cluster Precipitation Data from Marion Station
Two high-extraction techniques commonly used to remove coal Approximate location of site in Williamson County, Illinois Generalized stratigraphic column of the Carbondale and Modesto Formations The Cottage Grove and other major fault systems of southern Illinois Partial mine map showing the monitored panel and adjacent workings Instrumentation layout superimposed over the mine panel Schematic map of east cluster instrument location and surface crack location Schematic map of west cluster instrument location Frost-free monument and rebar monument design General tiltplate installation Multiple-position borehole extensometer installation Schematic of original TDR installation Schematic of TDR installation with revised cable anchor Schematic of piezometer and observation well installation Subsidence profile characteristics of a longitudinal line for the east cluster area Vertical drop of each MPBX anchor for the east cluster Amount of strain measured between MPBX anchors Deformation history of TDR cable at the east cluster Photo of the east cluster TDR cable Piezometric response of the drift piezometers (east cluster) Piezometric response of the bedrock piezometers (east cluster) Piezometric response of the drift piezometers (west cluster) Piezometric response of the bedrock observation wells (west cluster)
I Summary of overburden unit thickness and thickness ranges 2 Summary of subsurface overburden movements in the east cluster

The effects of high-extraction retreat (HER) mining on the overburden were investigated using two instrument clusters placed over one HER panel in Williamson County, Illinois. The amount, extent, and location of fracturing in the bedrock were measured, and the effects of the fracturing on the local hydrogeology were examined. Instruments used included surface monuments, piezom- eters, extensometers, and two time-domain reflectometry cables. The lllinois State Geological Survey (ISGS) monitored the panel before, during, and after subsidence. This was the first time such infor- mation was collected over an HER operation in Illinois. This site is one of three investigated under the Illinois Mine Subsidence Research Program to study the effects of mining on the overburden.
High-extraction mining techniques are being used more frequently in lllinois to maximize coal- mining productivity and to decrease the cost of the delivered product. Underground coal extraction by these techniques causes immediate collapse of the overburden and subsidence of the ground surface. Farmland and water resources may be affected by surface subsidence. The lllinois Mine Subsidence Research Program (IMSRP) was created to address these concerns. This study is one of several projects performed under the IMSRP with funding from the U.S. Bureau of Mines, lllinois Department of Energy and Natural Resources Coal Development Board, and the Office of Surface Mining.
The purpose of this investigation was to study the effects of high-extraction retreat (HER) mining on the overburden. Two instrument clusters were installed over an HER panel to investigate the following: subsidence of the ground surface; amount, extent, and location of fracturing in the bed- rock overburden; and hydrogeologic changes caused by bedrock deformations. Surface monuments, piezometers, extensometers, and two time-domain reflectometry cables were used to monitor overburden and ground surface response. The Illinois State Geological Survey (ISGS) monitored the panel before, during, and after subsidence. This was the first time such information was collected over an HER operation in Illinois.
This report summarizes the geotechnical monitoring program and the results of monitoring through- out a 3-year period. Unfortunately, the mining company did not complete the panel and only one- half of the instrumentation was undermined. The undermined instruments were located near the start of the panel.
ies lllinois is the second largest producer of agri-
cultural commodities and the fifth largest producer of coal in the United States. Problems some- times occur in ensuring that both the farmland and the coal resources are used to their maximum potential. Subsidence-induced ground movements modify surface drainage, which may affect crop yields of the gently rolling farmland. Clearly, coal and farmland are valuable resources and impor- tant to the state's economy. Mine operators are required to manage the impacts of underground mining on near-surface hydrology and surface-drainage patterns.
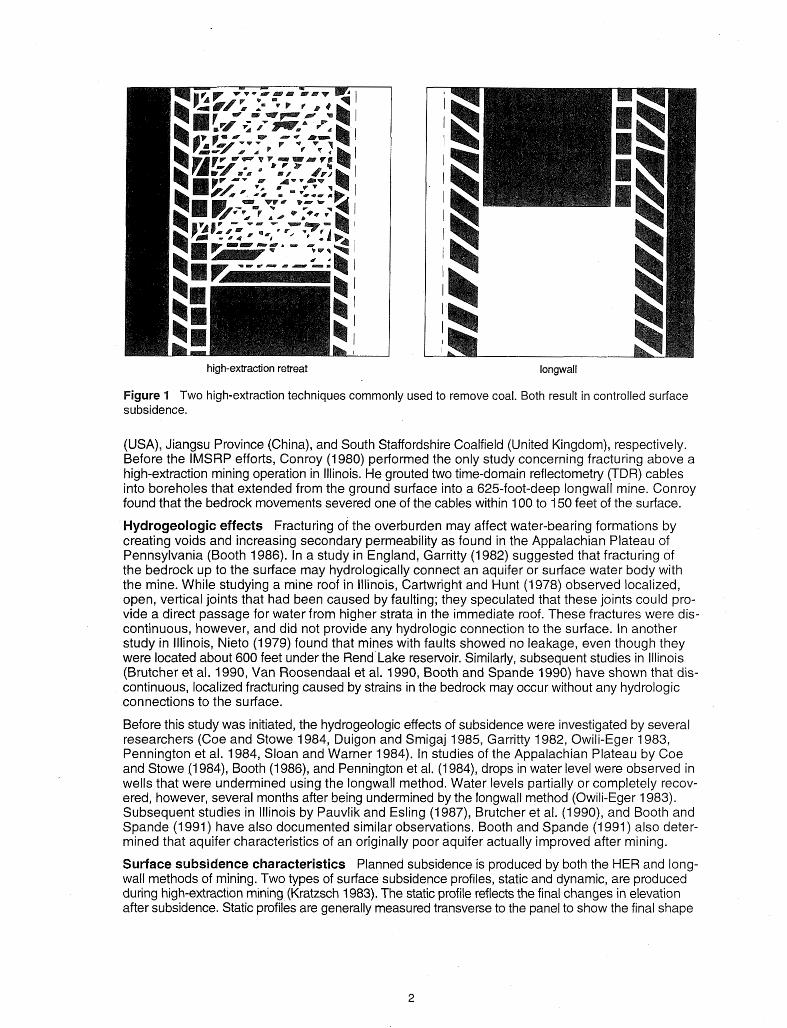
Two high-extraction mining methods, HER and longwall, are used in Illinois; each produces immediate, planned subsidence. Figure 1 shows the configuration of the two high- extraction mining methods commonly used. These two methods differ in the amount of fracturing and hydrologic changes caused in the overburden and the amount of damage produced in surface structures.
High-extraction retreat methods are similar to room and pillar mining techniques except that pillars are removed on retreat. In this type of operation, small sections of the panel collapse and subside as they are extracted.The roof may stay up until several hundred feet have been mined out and then collapse. In contrast, the longwall method removes all the coal across a wide working face, which is temporarily supported by hydraulic shields. A double row of pillars separates the panels. The entryways of the pillars are used for ventilation and transportation. As the mine face advances, the overburden behind the shields is left unsupported and collapses into the void. Surface subsi- dence immediately follows this collapse.
Coe and Stowe (1 984), Ming-Gao (1 982), and Whitworth (1 982) investi- gated the location and amount of fracturing in subsided bedrock over longwall operations in Ohio
high-extraction retreat
Figure 4 Two high-extraction techniques commonly used to remove coal. Both result in controlled surface subsidence.
(USA), Jiangsu Province (China), and South Staffordshire Coalfield (United Kingdom), respectively. Before the IMSRP efforts, Conroy (1 980) performed the only study concerning fracturing above a high-extraction mining operation in Illinois. He grouted two time-domain reflectometry (TDR) cables into boreholes that extended from the ground surface into a 625-foot-deep longwall mine. Conroy found that the bedrock movements severed one of the cables within 100 to 150 feet of the surface.
s Fracturing of the overburden may affect water-bearing formations by creating voids and increasing secondary permeability as found in the Appalachian Plateau of Pennsylvania (Booth 1986). In a study in England, Garritty (1 982) suggested that fracturing of the bedrock up to the surface may hydrologically connect an aquifer or surface water body with the mine. While studying a mine roof in Illinois, Cartwright and Hunt (1978) observed localized, open, vertical joints that had been caused by faulting; they speculated that these joints could pro- vide a direct passage for water from higher strata in the immediate roof. These fractures were dis- continuous, however, and did not provide any hydrologic connection to the surface. In another study in Illinois, Nieto (1979) found that mines with faults showed no leakage, even though they were located about 600 feet under the Rend Lake reservoir. Similarly, subsequent studies in lllinois (Brutcher et al. 1990, Van Roosendaal et al. 1990, Booth and Spande 1990) have shown that dis- continuous, localized fracturing caused by strains in the bedrock may occur without any hydrologic connections to the surface.
Before this study was initiated, the hydrogeologic effects of subsidence were investigated by several researchers (Coe and Stowe 1984, Duigon and Smigaj 1985, Garritty 1982, Owili-Eger 1983, Pennington et al. 1 984, Sloan and Warner 1984). In studies of the Appalachian Plateau by Coe and Stowe (1 984), Booth (1 986), and Pennington et al. (1 984), drops in water level were observed in wells that were undermined using the longwall method. Water levels partially or completely recov- ered, however, several months after being undermined by the longwall method (Owili-Eger 1983). Subsequent studies in Illinois by Pauvlik and Esling (1 987), Brutcher et al. (1 990), and Booth and Spande (1 991) have also documented similar observations. Booth and Spande (1 991) also deter- mined that aquifer characteristics of an originally poor aquifer actually improved after mining.
Surface subsidence characteristics Planned subsidence is produced by both the HER and long- wall methods of mining. Two types of surface subsidence profiles, static and dynamic, are produced during high-extraction mining (Kratzsch 1983). The static profile reflects the final changes in elevation after subsidence. Static profiles are generally measured transverse to the panel to show the final shape

Alexander Pulaski w
Site Location
Figure 2 Approximate location of site in Williamson County, Illinois.
of the subsidence trough. Dynamic profiles are documented as surface subsidence occurs. For instance, longitudinal survey lines are used to document the dynamic traveling subsidence wave that develops on the ground surface behind the advancing mine face. Near the sides of the panels, the progression from dynamic to static subsidence is complex (Van Roosendaal et al. 1991).
Strain and slope characteristics of the two different profiles are unique and depend on the over- burden properties and the rate of mining. Kratzsch (1 983) states that a fast rate of advance in visco- elastic strata produces a flatter dynamic profile; strain and slope values are greatly reduced, as compared with those of the static profile. If the strata are fractured and loose, however, the dynamic pro- file becomes much more severe as mining-advance rates increase.
hysical Setting Site selection Several factors were considered during the site selection process. First, an HER mine had to be available for study within a reasonable time frame. It was essential that instruments be installed well before the site was undermined so that site characterization and base-line data col- lection could take place. Next, the full cooperation of the mine operators and surface owners was required. Formal agreements with these parties were negotiated prior to initiation of work. Finally, the site had to be accessible and well suited for both instrument installation and long-term monitoring.
The above criteria were used to select an HER panel in northeastern Williamson County, Illinois. Fig- ure 2 shows the approximate location of the mine panel about 2 miles east-southeast of the town of Pittsburg in the southwest quarter of Section 6, T9S, R4E, of the 3rd Principal Meridian (Pittsburg Quadrangle).
raphy The study site is located in the Mount Vernon Hill Country physiographic division of Illinois (Leighton et al. 1948). The geomorphology of the area is characteristic of a maturely dissected, sandstone-shale plain of low relief mantled by thin ( ~ 4 0 feet) lllinoian drift. Restricted uplands and broad alluviated valleys occur along the larger streams.
Surface topography above the panel is gently rolling. The maximum relief is about 40 feet. Surface elevations range from about 480 to about 520 feet above mean sea level (msl) and slopes vary from less than 3% to more than 18%. The topography in the area is primarily bedrock controlled (Horberg 1950). Bedrock features are modified, however, by glacial action and somewhat subdued by a thin mantle of deeply eroded drift that covers the region (Leighton et al. 1948).
drift
shale
coal
shale
sandstone
coal Piasa Limestone
siltstone
sandstone
Ban kston Fork Ls
Anvil Rock Ss
Lawson Shale
Brereton Ls
Anna Shale
Energy Shale
Herrin Coal
claystone
limestone
depth (ft)
- 0
-50
- 100
- 150
-200
- 250
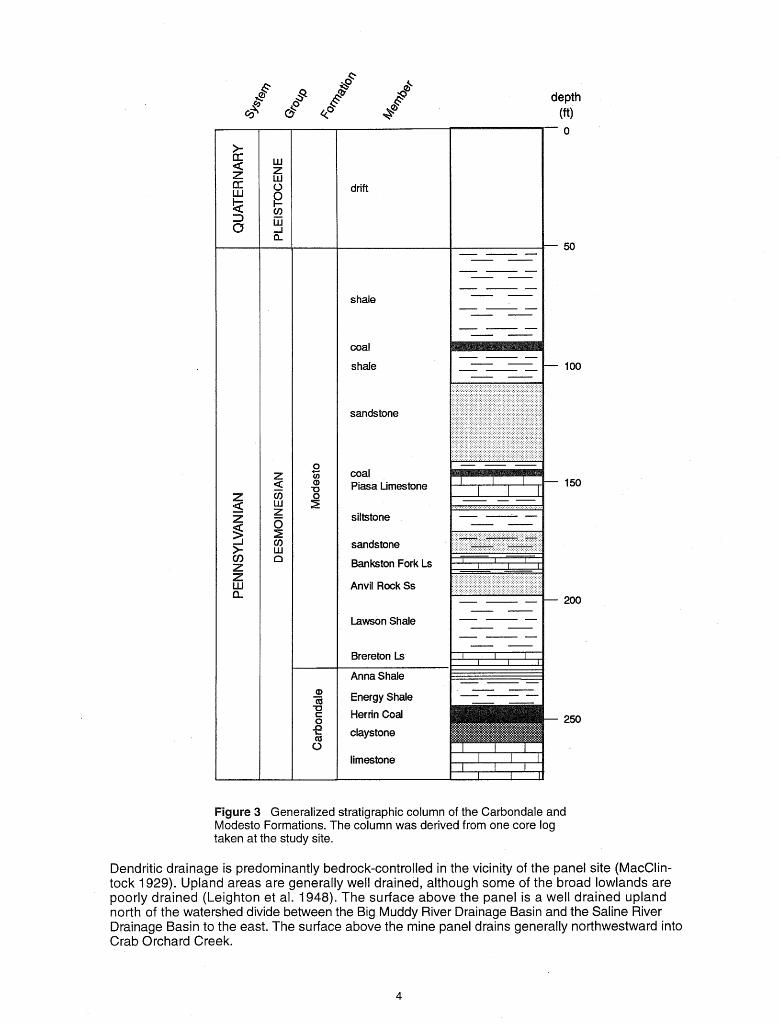
Figure 3 Generalized stratigraphic column of the Carbondale and Modesto Formations. The column was derived from one core log taken at the study site.
Dendritic drainage is predominantly bedrock-controlled in the vicinity of the panel site (MacClin- tock 1929). Upland areas are generally well drained, although some of the broad lowlands are poorly drained (Leighton et al. 1948). The surface above the panel is a well drained upland north of the watershed divide between the Big Muddy River Drainage Basin and the Saline River Drainage Basin to the east. The surface above the mine panel drains generally northwestward into Crab Orchard Creek.
y The surficial geology at the study site consists of deeply eroded lllinoian till overlain by 3.3 to 4.6 feet of loess. Alluvial sand, silt, gravel, and clay are found in the bottomlands. Some lacustrine deposits are located downstream from the study area along Crab Orchard Creek. Outcrops of bedrock are rare and of limited extent; they are predominantly located low on the valley wails (MacClintock 1929). Glacial drift thickness may have substantial local variations, but as available borehole data indicate, it generally ranges from about 14 to 60 feet.
Soils found in the area include the Belknap silt loam, the Hickory-silt-loam-Ava-silt-loam complex, and the Ava silt loam (Feherenbacher and Odell 1959). The light-colored, acidic Belknap silt loam developed in the alluvium bottomlands where slopes are less than 1.5%. Belknap soils are char- acterized by poor drainage. The Hickory-silt-loam-Ava-silt-loam complex is found on slopes of 10% to 18% in loess and lllinoian till. It is developed under forest vegetation. The light-colored Hickory silt loam developed in lllinoian till on the lower, steeper parts of the slopes. Ava silt loam generally developed in 40 to 60 inches of loess over leached lllinoian till on gently sloping areas of the uplands and on relatively level, uneroded ridgetops. The Ava silt loam has a well developed fragipan (cemented layer) from 2 to 7 feet deep, which inhibits root penetration.
The bedrock units at the study site are the Carbondale and the Modesto Formations, which belong to the Pennsylvanian System of Illinois. Both formations are composed primarily of shales and siltstones (70-80%) along with fewer units of sandstone and limestone. A generalized regional stratigraphic column of parts of the Carbondale and Modesto Formations of the Pennsylvanian System in southern Illinois is shown in figure 3. In addition, table 1 summarizes the average thickness of overburden units and their ranges as derived from eight core logs of boreholes drilled within 1 mile of the study site.
The Cottage Grove Fault System is located 1.5 miles north of the site. The fault system consists of a right-lateral, strike-slip master fault and subsidiary, en echelon, high-angle normal faults (fig. 4). The Cottage Grove Fault is oriented northwest-southeast as a result of the orientation of the prin- cipal horizontal compressive stresses during the late Pennsylvanian to Early Permian Periods. The Cottage Grove Fault System is thought to have developed along a zone of weakness in the basement rocks at the time of general east-west compression that formed the Appalachian Moun- tains (Nelson and Krausse 1981). Contemporary stress measurements indicate the maximum horizontal stresses may be as much as three times the minimum horizontal and vertical stresses; the major stress field direction is east-northeast to west-southwest (Ingram and Molinda 1 988, Nelson and Bauer 1987). The bedrock dips gently to the north at 25 to 100 feet per mile (Nieto 1979). Local dips of more than 15" were observed, however, in a coal mine operating in the Herrin Coal just north of the study site (Krausse et al. 1979). Mine workings affected by the Cottage Grove Fault System are oriented according to the pattern of faults encountered.
The immediate mine roof strata sequence contains Energy Shale distributed as an overbank deposit associated with the Walshville paleochannel, which is a clastic-filled channel that trends roughly north to south through southern Illinois about 20 miles to the west of the study site. The Walshville channel was, in part, contemporaneous with the deposition of the Herrin Coal and provided the Energy Shale, the youngest roof unit present here. Further details of the geology of the Walshville channel are found in Nelson (I 979).
Drill-hole data and mine information indicate that the Energy Shale is typically 10 to 20 feet thick in the study area, placing the Anna Shale and Brereton Limestone out of bolting range. An unusual aspect of the roof sequence is the thick sandstone-rich, Anvil Rock Sandstone-Lawson Shale interval, which averages 37 feet in the area and includes a sandstone 7.3 feet thick in the west part of the panel.
The Herrin Coal Member is the seam mined at the site. It lies between 250 to 350 feet msl. Core logs indicate, however, that coal elevations vary from less than 240 feet to more than 390 feet msl within I mile sf the site. The variation is due to the northward dip in strata and offsets of the coal seam caused by faulting. The thickness of the Herrin Coal varies between 5.5 to 6.5 feet, as meas- ured in mines in the area, and probably averages around 6 feet near the study area (table 1 ).
y Local groundwater resources are limited and primarily used for domestic and household needs (Feherenbacher and Odell1959). Surface water reservoirs, such as Crab Orchard Lake and other smaller manmade impoundments, supply water to the larger communities. Water for livestock, minor irrigation, and other farming purposes is usually obtained from small, natural or manmade ponds such as the one located at this site.

Table 1 Summary of overburden unit thickness and thickness ranges
Unitlinterval Thickness range (ft) Average thickness* (ft)
Pleistocene (soil/till/drift)
Bedrock above Bankston Fork Ls
Bankston Fork Limestone
Anvil Rock Ss / Lawson Shale
Jamestown Coal / Conant Ls**
Brereton Limestone**
Anna Shale
Energy Shale**
Herrin Coal
* Where present; zero thickness is not averaged. ** Missing in either one or two drill holes.
Cottage Grove Fault System
Rend Lake Fault System
fault > 1000 ft(305 rn), 0 10 20 30 40mi I I
ticks on downthrown side
fault < 1000 ft (305 rn), 20 40 60krn I
ticks on downthrown side
monocline
syndine @ Williamson County site location
Figure 4 The Cottage Grove and other major fault systems of southern Illinois (after Nelson and Krausse 1981 ).
Groundwater is pumped from large diameter (2-5 feet) dug wells, which provide water for private and domestic purposes. These wells penetrate sand and gravel lenses that are in the glacial drift and usually directly overlie the bedrock surface at depths of as much as 60 feet (Pryor 1953). These lenses are as much as 12 feet thick. Sasman (1 953) reported static water levels in the dug wells from about 5 to 35 feet below the surface and at pumping rates that varied from about 5 to 15 gallons per minute. This information concurs with water well data obtained from the lSGS and the Illinois State Water Survey (ISWS). Smaller diameter wells have also obtained groundwater from the glacial drift; however, yields were much lower than they were from the dug wells.
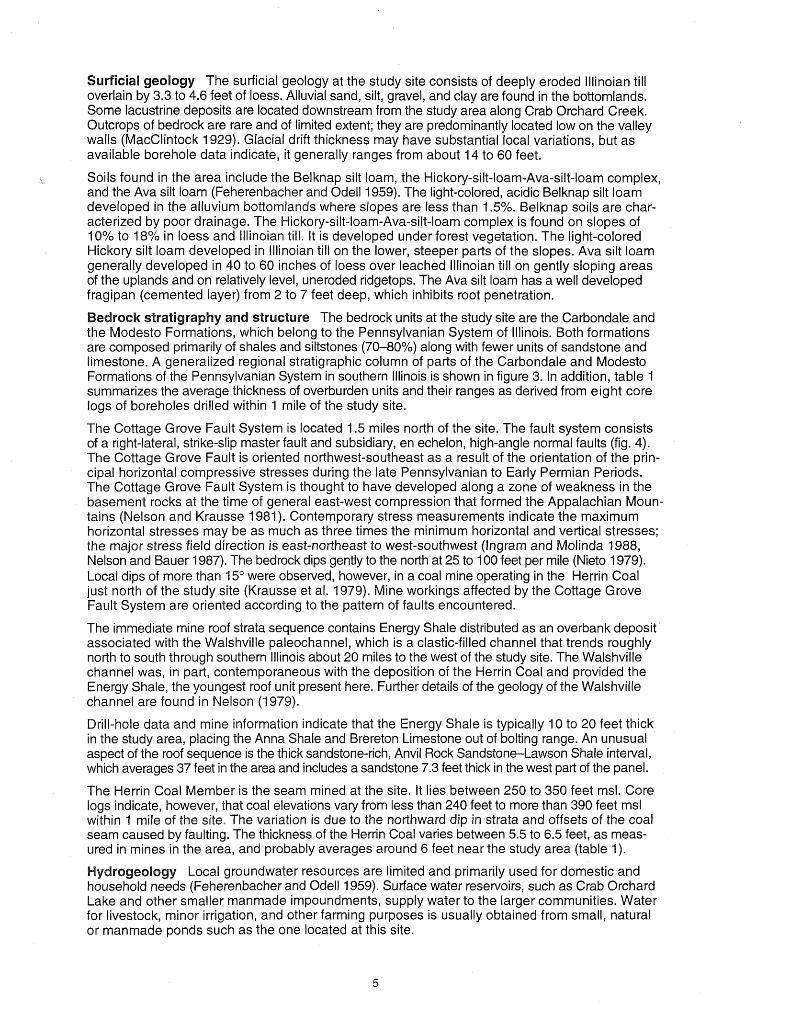
Figure 5 Partial mine map showing the monitored panel and adjacent workings.
Bedrock aquifers of the Pennsylvanian System in the study area are limited primarily to sandstone units; however, some fractured limestone aquifers were also reported (Pryor 1 953). Static water levels in these wells ranged from about 10 feet to as much as 80 feet below ground surface.
The study site was situated over Panel 23 East of the Orient No. 4 Mine, which is operated by the Freeman United Coal Mining Company. Figure 5 shows the location of 23 East and adjacent work- ings. Mine plans called for a panel that is 2,300 feet long and 210 feet wide and has a seam 250 feet deep. The panel width was increased to 385 feet and the south edge of the panel was relo- cated northward during mining because of roof conditions. The operations at the mine were sus- pended on May 18, 1987, after the panel had progressed only 900 feet. Only the east cluster of instrumentation was undermined by the HER method. The west cluster was undermined by the room-and-pillar method only, but it is adjacent to the solid, unmined portion of the panel.
The instrumentation for this study was selected to measure the geotechnical and hydrological effects of subsidence on the overburden. Engineers lnternational (El) of Westmont, Illinois, proposed an instru- mentation plan that was reviewed and accepted by the U.S. Bureau of Mines, Twin Cities Research Center (USBM), and the ISGS. Representatives of the USBM let the contract to Engineers lnternational to implement the instrumentation program and to conduct base-line surveys. Engineers lnternational was responsible for installing most of the instruments including four bedrock and 11 drift piezometers, two multiple-position borehole extensometers (MPBXs), and 30 surface monuments (El 1988). The ISGS, with assistance from Northwestern University, installed two time-domain reflectometry (TDR) cables, five tiltplates, four control monuments, survey turning points, and 14 additional rebar monu- ments to determine the static subsidence profile transverse to the panel.
The drilling program was conducted by the Soil and Rock Drilling Corporation of Bartlett, Illinois, under separate contracts. Engineers lnternational installed the instruments in June 1986. The ISGS installed the tiltplates and additional survey monuments in March 1987.
ent layout Wyant Surveying Company of West Frankfort, Illinois, used mine coodinales to stake out the panel center line on the surface. The instrumentation layout shown in figure 6 was designed to measure two different responses of the overburden to mining of the panel by placing one instrument cluster near the beginning of the panel (east cluster) and one near the
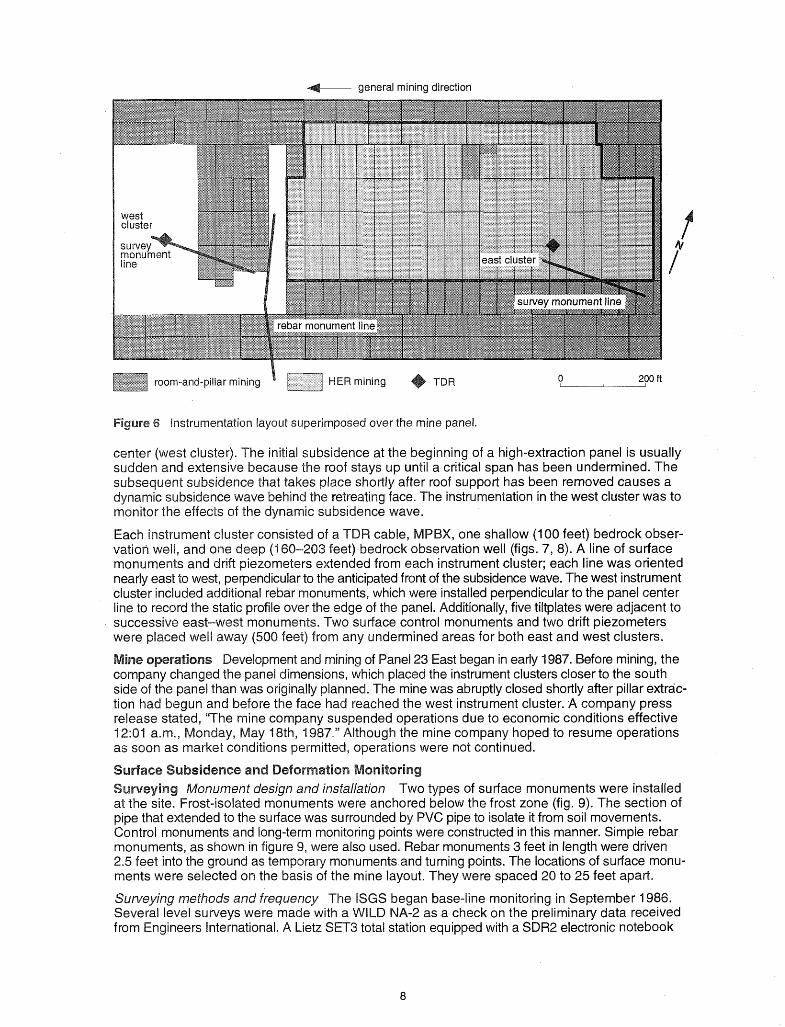
general mining direction
room-and-pillar mining /] HER mining TDR 0 200 ft
!nstrumentation layout superimposed over the mine panel.
center (west cluster). The initial subsidence at the beginning of a high-extraction panel is usually sudden and extensive because h e roof stays up until a critical span has been undermined. The
sequent subsidence that takes place shortly after roof support has been removed causes a dynamic subsidence wave behind the retreating face. The instrumentation in the west cluster was to monitor the effects of the dynamic subsidence wave.
Each instrument cluster cable, MPBX, one shallow (1 00 feet) bedrock obser- vation well, and one dee drock observation well (figs. 7, 8). A line of surface monuments and drift pie nded from each instrument cluster; each line was oriented nearly east to west, perpendicular to the anticipated front of the subsidence wave. The west instrument cluster included additional rebar monuments, which were installed perpendicular to the panel center line to record the static profile over the edge of the panel. Additionally, five tiltplates were adjacent to successive east-west monuments. Two surface control monuments and two drift piezometers were placed well away (500 feet) from any undermined areas for both east and west clusters.
23 East began in early 1987. Before mining, the ed the instrument clusters closer to the south ne was abruptly closed shortly after pillar extrac- e west instrument cluster. A company press
uspended operations due to economic conditions effective " Although the mine company hoped to resume operations d, operations were not continued.
wo types of surface monuments were installed at the site. Frost-isolated monuments were anchored below the frost zone (fig. 9). The section of pipe that extended to the surface was surrounded by PVC pipe to isolate it from soil movements. Control monuments and long-term monitoring points were constructed in this manner. Simple rebar monuments, as shown in figure 9, were also used. Webar monuments 3 feet in length were driven 2.5 feet into the ground as temporary monuments and turning points. The locations of surface monu- ments were selected on the basis of the mine layout. They were spaced 20 to 25 feet apart.
Surveying rnefhods and frequency The ISGS began base-line monitoring in September 1986. Several level surveys were made with a WILD NA-2 as a check on the preliminary data received from Engineers International. A hietz SET3 total station equipped with a SDR2 electronic notebook

Figure 7 Schematic map of the east cluster instrument location and surface crack location.
igure 8 Schematic map of the west cluster instrument location.

- cement grout
36 in.
24 in.
frost-isolated monument
Figure 9 Frost-isolated monument and rebar monument design.
- 1 in. rebar
k 3
rebar monument
was used to set new control monuments for each instrument cluster. The west cluster instrument base line was set from ISGS control monuments during the period of April 2-30,1987.
Information provided by mine personnel was used to track the mining progress and to determine the frequency of monitoring. Monitoring surveys to document time-related effects were most fre- quent during the early, most active stage of subsidence. The east cluster survey monuments were monitored frequently for the first 8 days following the initial roof failure and steadily thereafter through the end of May 1987. The frequency of monitoring decreased with the rate of movement. Instruments were monitored about every 3 months through January 1988. Long-term monitoring continued to document residual movement of the overburden through December 1989.
The west cluster was not undermined by the HER method, although it was partially undermined by the room-and-pillar method. Monitoring of the west cluster survey monuments was performed to determine whether any changes were due to the approaching mine face.
Tiltplates Tiltplates installed in the west cluster were to be used to record changes in slope as the subsidence wave passed. Tiltplate installation is illustrated in figure 10. The plates were set into mortar beneath the frost zone (1 2-1 5 in.) and inside of 6-inch PVC casings with caps. The tilt- plates were placed next to five frost-isolated monuments in the west cluster only. Unfortunately, the area did not subside.

PVC cap
6-in. PVC pipe
tiltplate (5.5 in. dia.)
cement grout
Figure 10 General tiltplate installation.
A hole was drilled at a 10.5" angle from vertical, with a dip direction of S18.5"E near the center of the panel (west cluster). The coring was performed off-vertical so as to encounter any vertical joints in the formations. Core description, core recovery, fractures, and rock quality designation (RQD) were logged in the field by Engineers lnternational. A stratigraphic section developed on the basis of the resulting depth-adjusted core log is presented in figure 3. The bedrock here is composed of Pennsylvanian-age siltstones and shales with approximately 49 feet of glacial deposits overlying it. The bedrock overburden is composed of approximately 54% shales, 11 % siltstones, 23% sandstones, and 6% limestones; coals and claystones make up the remaining 6%. The geotechnical core log is presented in appendix A. The GeoTechnical Graphics System software (1 991) was used to combine all the field logging notes into a present- able and legible core log.
Rock quality designation Rock quality designation (RQD) is a standard parameter for evaluating the degree of fracturing of a rock core. Rock quality designation is used as an index property to indicate rock-mass quality. The RQD value, expressed as a percent, is the quotient of the sum of the length of all core segments longer than 4 inches divided by the length of the core run. Frac- tures caused by drilling or handling are not included in the determination.
Fracture frequency Total fracture frequency per core run, in units of fractures per foot, is deter- mined by counting the number of natural fractures per core run and dividing by the length of the core run. All natural discontinuities are counted, including fractures along weak bedding planes and joints. As with RQD, breaks caused by drilling and handling are not included in the determination.
erties Rock characterization was performed in the ISGS laboratory. Core samples were tested for unconfined compressive strength, modulus of elasticity, indirect tensile strength, specific gravity, shore hardness, and point-load index. The standards and suggested methods of the American Standard and Testing Materials (1 988) and International Society for Rock Mechanics (1 985) were followed. Results of all tests performed on the rock core are given in appendix A.
Unconfined strength and elastic modulus Samples were cut with a saw to near the allowable toler- ance before they were lapped. Additional preparation of the sample consisted of lapping to a height-to-diameter ratio of 2 to 2.5 with a tolerance for nonparallelism of 0.001 inch (according to ASTM D 4543-85 1988). The 2:l height-to-diameter ratio requirement was not always main- tained, especially within a section of core that was quite fractured. Sample loading was under constant strain conditions, as allowed by ASTM D 2938-86 (1 988). As recommended in Brown (1 981), the sample ends were not capped.
The elastic modulus was obtained directly from the plot of "load versus deformation." The elastic modulus represents the slope of the line tangent to the elastic portion of the stresslstrain graph
and at 50% of the ultimate compressive strength. The ultimate compressive strength was found by dividing the ultimate axial force by the area of core perpendicular to its axis, as suggested by the ISRM.
Indirect tensile strength Discs 1 inch thick were compressed diametrically between high modu- lus (steel) platens. The values of indirect tensile strength, crt , were calculated by the following equation (Brown 1981):
2P of=-
7~ Dt
where P = axial load (lbs)
D = diameter (in.)
t = thickness (in.)
axial point-load index The method suggested for the axial point-load index by the ISRM Com- mission on Testing Methods (1 985) was used. Samples with a height-to-diameter ratio of 0.3 to 1 .O were tested. The samples were placed between two spherically truncated, conical platens of the standard geometry (60" cone). The load was steadily increased such that failure occurred within 10 to 60 seconds, and the failure load, P, was recorded. The point-load index was calcu- lated using the following equation suggested by Broch and Franklin (1 972):
where I, = uncorrected point-load strength
P = axial load (lbs)
f = thickness
This equation does not take into account varying sample thicknesses, therefore a size correction is required. The size correction for the axial point-load index T500 of a rock specimen or sample is defined as the value that would have been measured by a diametral test with D = 50 mm (Brook 1980). The corrected axial point-load index is calculated by the following equation:
where Tioo = corrected point-load index (MPa)
P = load (kN)
A = diameter x thickness (mm2)
Moisture content A center portion of each of the samples tested for unconfined strength was used for moisture content determination. Moisture content was calculated as a percentage of the dry weight of the sample as specified in ASTM D 2216-80 (I 988).
Specific gravity The specific gravity of all samples was determined in accordance with ASTM D- 1188-83 (1 988). Samples were oven dried and coated with a polyurethane spray. The specific gravity for each sample was obtained by comparing its weight submerged in water to that in air.
Shore hardness A model D schleroscope, manufactured by Shore Instrument and Manufactu r- ing Company, was used for hardness determination of compressive strength specimens. Each of the values in the summary tables is an average of the highest ten tests from a total of 20 tests performed on the lapped ends of the uniaxial compressive strength test specimen as described in Brown (1981).
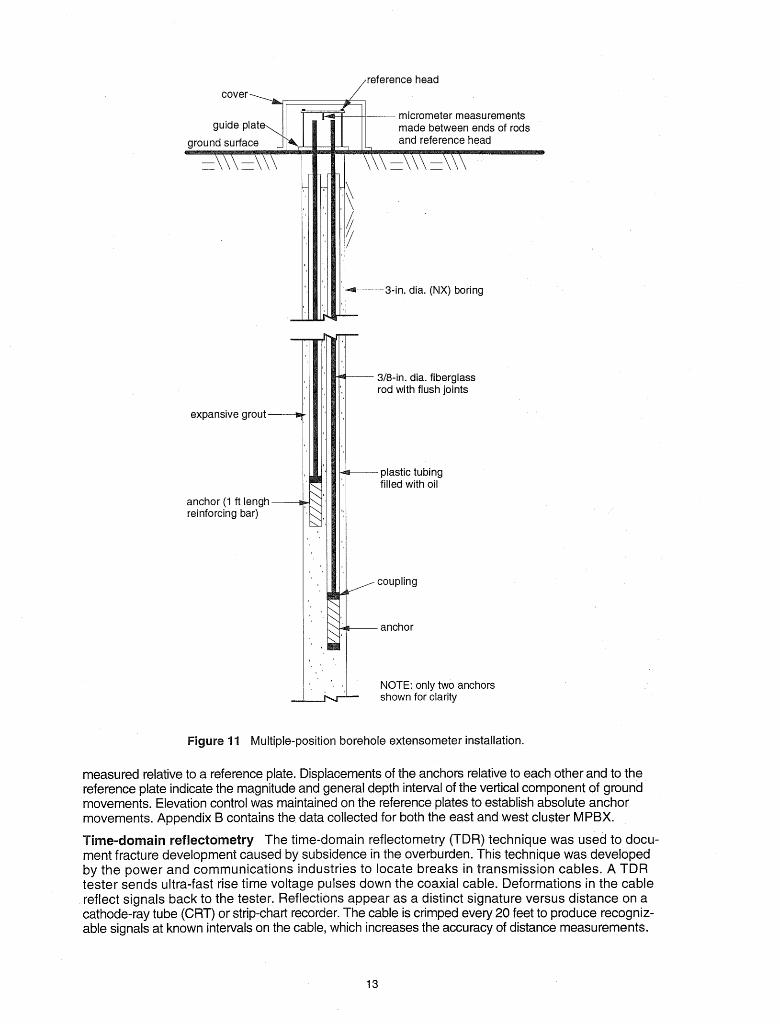
ation Monitoring osition borehole extensometer Two 6-anchor, multiple-position borehole exten-
someters (MPBXs) were installed at the site, as shown in figure 11. The anchors of each MPBX were grouted at depths of 50,75, 100, 125, 150, and 175 feet below the ground surface. The exten- someters mechanically monitor vertical overburden movements at each level. Anchor displace- ments are transmitted by the fiberglass rods to the surface, where movement of the rod tips is
,reference head
expansive grout
anchor (1 ft lengh reinforcing bar)
318-in. dia. fiberglass rod with flush joints
coupling
- anchor
NOTE: only two anchors shown for clarity
ure 11 Multiple-position borehole extensometer installation.
measured relative to a reference plate. Displacements of the anchors relative to each other and to the reference plate indicate the magnitude and general depth interval of the vertical component of ground movements. Elevation control was maintained on the reference plates to establish absolute anchor movements. Appendix B contains the data collected for both the east and west cluster MPBX.
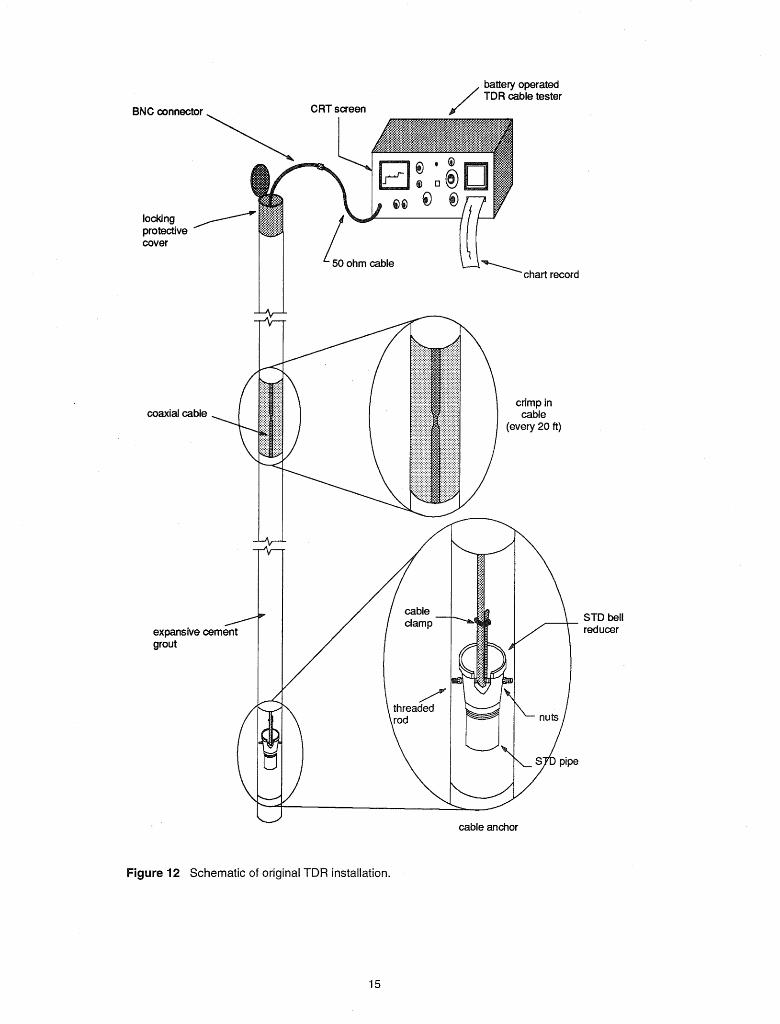
etry The time-domain reflectometry (TDR) technique was used to docu- ment fracture development caused by subsidence in the overburden. This technique was developed by the power and communications industries to locate breaks in transmission cables. A TDR tester sends ultra-fast rise time voltage pulses down the coaxial cable. Deformations in the cable reflect signals back to the tester. Reflections appear as a distinct signature versus distance on a cathode-ray tube (CRT) or strip-chart recorder. The cable is crimped every 20 feet to produce recogniz- able signals at known intervals on the cable, which increases the accuracy of distance measurements.
Researchers at Northwestern University (Dowding et al. 1988, 1989), determined the optimum ca- ble size, bonding strength, and grout composition; they also characterized the signatures caused by different modes of deformation (e.g., tension versus shear).
A generalized TDR installation is shown in figure 12. One 0.5-inch-diameter unjacketed coaxial cable (Cablewave FXA 12-50) was installed at each instrument cluster. In the west cluster, a cable that was 269 feet long and extended through the Herrin Coal was grouted into the inclined bore- hole. The east cluster cable (256 feet long) was installed in a vertical borehole that did not pene- trate the coal.
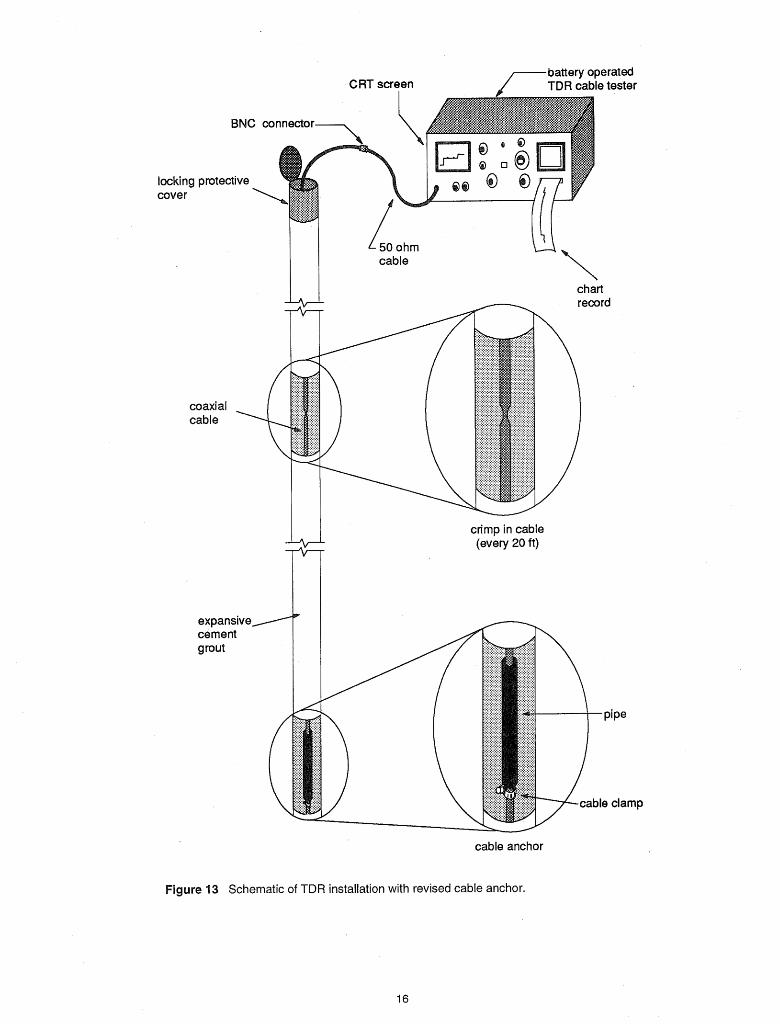
The TDR cable in the east cluster was designed with a weight or anchor of the type shown in fig- ure 12. This anchor design works best with a braided cable and not the solid outer conductor type used on this project because the outer conductor splits when the cable is bent around the bolt. Therefore, a new design was implemented for the second cable in the west cluster. The new design consisted of placing the TDR cable through a 5-foot-long piece of black pipe with a cable clamp placed over the cable below the pipe, as shown in figure 13. Electrician's tape was wrapped around the clamp to smooth its profile and prevent snags during cable installation.
The entire cable was laid out on the ground and reference crimps were placed at intervals of 20 feet. Without reference crimps along the cable, location accuracy is on the order of 2% of the dis- tance from the tester to the cable defect. Crimps at known distances allow for much more accu- rate defect locations. The reflected signal is attenuated as a function of distance along the cable. Therefore, a wider crimp, consisting of adjacent, individual plier crimps, is required at greater depths to produce the desired signal amplitude of 40 mp. The grout had a 65% water-to-cement ratio by weight (7.6 gall94 Ib sack cement). High early strength Type Ill cement and 2% Intrusion- Aid (Intrusion-Prepakt, Inc.) were used, as recommended by Dowding et al. (1 989). The grout was placed in the borehole up to the ground surface through the glacial material. The TDR instal- lation and monitoring was part of an ongoing contract with the Office of Surface Mining to test the application of using TDR to monitor overburden fractures. Results of several studies using the TDR technique over both active and abandoned mines may be found in Bauer et al. (1 991).
ydrogeologic Investigations The groundwater response to subsidence was monitored using two types of wells. Piezometers with 2-foot screens were used to document water levels in the drift material; the bedrock material was monitored using 20-foot screens in what is called here an observation well. Water level changes in the piezometers and observation wells reflect fluctuations in the piezometric head at the various screen depths.
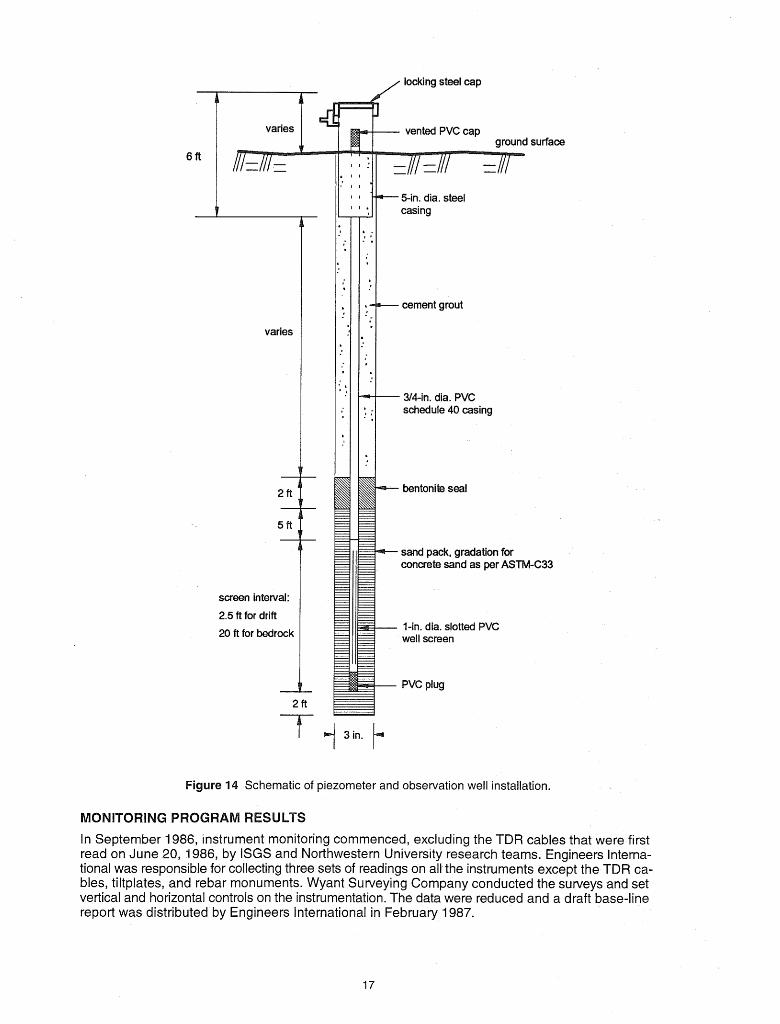
Drift piezometers A total of 11 piezometers were installed. Five were placed in or near each in- strumentation cluster, and one was located outside the area of anticipated subsidence. Alternat- ing shallow and deep piezometers were installed in the drift to record the effect of the subsidence on piezometric levels in the unlithified glacial materials. The general design for both bedrock and drift piezometers is shown in figure 14. Screen depths ranged from about 15 to 50 feet, and the screen interval was 2 feet. The deep drift piezometers were set near the bedrock surface. Design specifications called for 2.5 feet of 1 .O-inch screened PVC tubing surrounded by rounded river sand to a height of 5 feet above the screen. The sand was capped with a bentonite seal 2 feet thick, and the remaining borehole length was backfilled with a cement-bentonite grout. Small 112- inch riser tubing was used to reduce the response time to piezometric fluctuations. Piezometers were developed by pumping out all the fines before monitoring.
Bedrock observation wells Design specifications for the bedrock observation wells were identical to those for the drift piezometers except that the screened section was 20 feet long in order to increase the infiltration area. One shallow observation well and one deep observation well were installed in each instrument cluster. Screen depths of both east and west cluster shallow observation wells were from 80 to about 100 feet below the surface in a low hydraulic conductivity unit. The screen depth of the west cluster deep observation well was from 183 to 203 feet in the Anvil Rock Sand- stone. The east cluster deep observation well screen was from 145 to 165 feet below the surface.
BNC connector
cover
coaxial cable
expansive cem grout
crimp in cable
(every 20 ft)
cable anchor
STD bell reducer
Figure 12 Schematic of original TDR installation.
/- battery operated
CRT screen TDR cable tester
BNC connector
locking protective cover
coaxial cable
expansive
[SO ohm cable
cement grout
cable anchor
crimp in cable (every 20 ft)
Figure 63 Schematic of TDR installation with revised cable anchor
varies
varies
screen interval:
2.5 ft for drift
20 ft for bedrock
surface
I 3 in.
cement grout
314-in. dia. PVC schedule 40 casing
bentonite seal
sand pack, gradation for concrete sand as per ASW-C33
I-in. dia. slotted PVC well screen
PVC plug
Figure 14 Schematic of piezometer and observation well installation.
In September 1986, instrument monitoring commenced, excluding the TDR cables that were first read on June 20, 1986, by ISGS and Northwestern University research teams. Engineers Interna- tional was responsible for collecting three sets of readings on all the instruments except the TDR ca- bles, tiltplates, and rebar monuments. Wyant Surveying Company conducted the surveys and set vertical and horizontal controls on the instrumentation. The data were reduced and a draft base-line report was distributed by Engineers International in February 1987.
-0.1 0.1 0.3 dist. from riblrnine depth
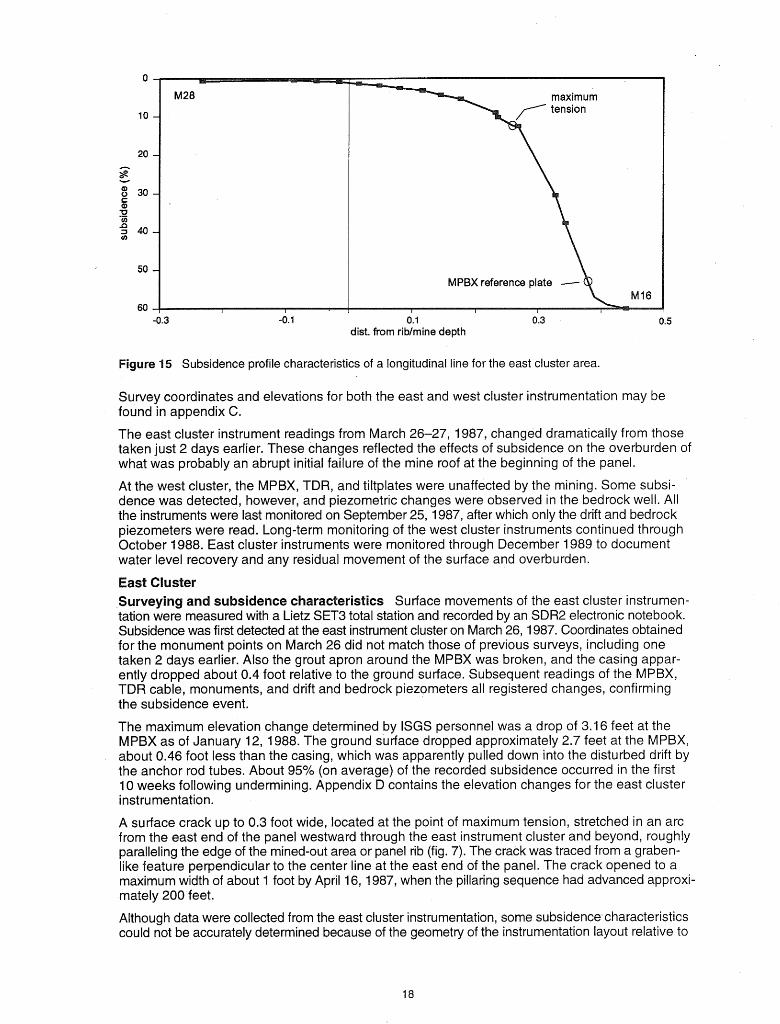
Figure 15 Subsidence profile characteristics of a longitudinal line for the east cluster area.
Survey coordinates and elevations for both the east and west cluster instrumentation may be found in appendix C.
The east cluster instrument readings from March 26-27, 1987, changed dramatically from those taken just 2 days earlier. These changes reflected the effects of subsidence on the overburden of what was probably an abrupt initial failure of the mine roof at the beginning of the panel.
At the west cluster, the MPBX, TDR, and tiltplates were unaffected by the mining. Some subsi- dence was detected, however, and piezometric changes were observed in the bedrock well. All the instruments were last monitored on September 25, 1987, after which only the drift and bedrock piezometers were read. Long-term monitoring of the west cluster instruments continued through October 1988. East cluster instruments were monitored through December 1989 to document water level recovery and any residual movement of the surface and overburden.
East Cluster Surveying and subsidence characteristics Surface movements of the east cluster instrumen- tation were measured with a Lietz SET3 total station and recorded by an SDR2 electronic notebook. Subsidence was first detected at the east instrument cluster on March 26, 1987. Coordinates obtained for the monument points on March 26 did not match those of previous surveys, including one taken 2 days earlier. Also the grout apron around the MPBX was broken, and the casing appar- ently dropped about 0.4 foot relative to the ground surface. Subsequent readings of the MPBX, TDR cable, monuments, and drift and bedrock piezometers all registered changes, confirming the subsidence event.
The maximum elevation change determined by ISGS personnel was a drop of 3.16 feet at the MPBX as of January 12, 1988. The ground surface dropped approximately 2.7 feet at the MPBX, about 0.46 foot less than the casing, which was apparently pulled down into the disturbed drift by the anchor rod tubes. About 95% (on average) of the recorded subsidence occurred in the first 10 weeks following undermining. Appendix D contains the elevation changes for the east cluster instrumentation.
A surface crack up to 0.3 foot wide, located at the point of maximum tension, stretched in an arc from the east end of the panel westward through the east instrument cluster and beyond, roughly paralleling the edge of the mined-out area or panel rib (fig. 7). The crack was traced from a graben- like feature perpendicular to the center line at the east end of the panel. The crack opened to a maximum width of about 1 foot by April 16, 1987, when the pillaring sequence had advanced approxi- mately 200 feet.
Although data were collected from the east cluster instrumentation, some subsidence characteristics could not be accurately determined because of the geometry of the instrumentation layout relative to
1 50 ft (anchor 5)
days after initial subsidence
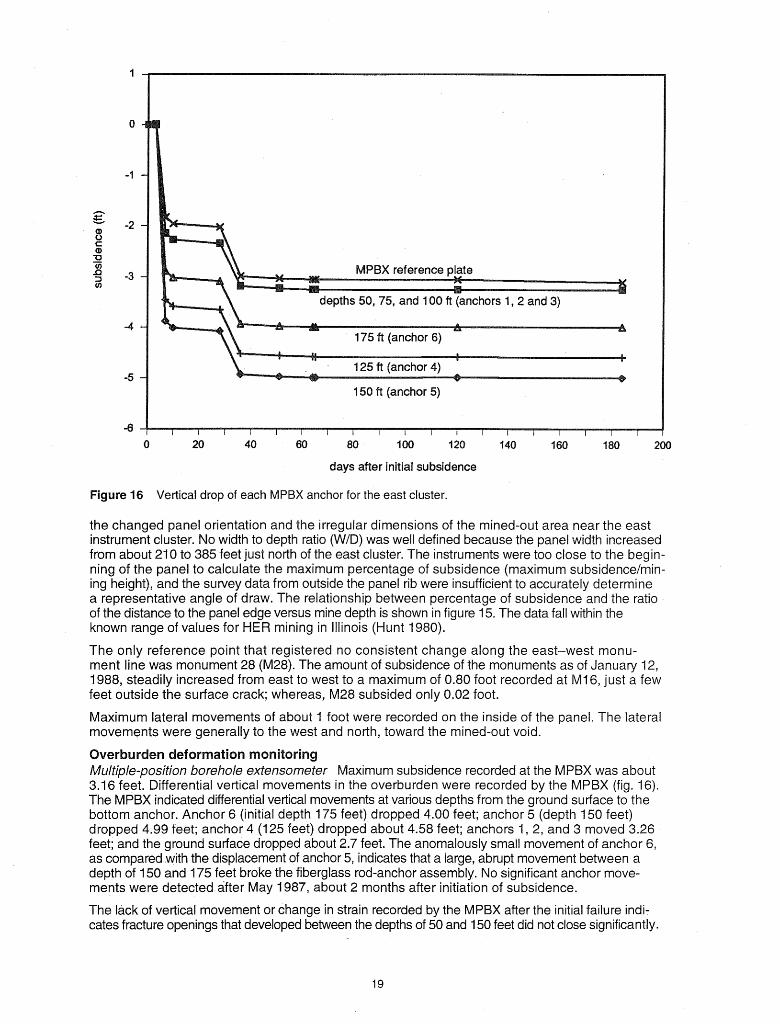
Figure 16 Vertical drop of each MPBX anchor for the east cluster.
the changed panel orientation and the irregular dimensions of the mined-out area near the east instrument cluster. No width to depth ratio (WID) was well defined because the panel width increased from about 210 to 385 feet just north of the east cluster. The instruments were too close to the begin- ning of the panel to calculate the maximum percentage of subsidence (maximum subsidence/min- ing height), and the survey data from outside the panel rib were insufficient to accurately determine a representative angle of draw. The relationship between percentage of subsidence and the ratio of the distance to the panel edge versus mine depth is shown in figure 15. The data fall within the known range of values for HER mining in Illinois (Hunt 1980).
The only reference point that registered no consistent change along the east-west monu- ment line was monument 28 (M28). The amount of subsidence of the monuments as of January 12, 1988, steadily increased from east to west to a maximum of 0.80 foot recorded at M I 6, just a few feet outside the surface crack; whereas, M28 subsided only 0.02 foot.
Maximum lateral movements of about 1 foot were recorded on the inside of the panel. The lateral movements were generally to the west and north, toward the mined-out void.
Multiple-position borehole extensometer Maximum subsidence recorded at the MPBX was about 3.16 feet. Differential vertical movements in the overburden were recorded by the MPBX (fig. 16). The MPBX indicated differential vertical movements at various depths from the ground surface to the bottom anchor. Anchor 6 (initial depth 175 feet) dropped 4.00 feet; anchor 5 (depth 150 feet) dropped 4.99 feet; anchor 4 (1 25 feet) dropped about 4.58 feet; anchors 1, 2, and 3 moved 3.26 feet; and the ground surface dropped about 2.7 feet. The anomalously small movement of anchor 6, as compared with the displacement of anchor 5, indicates that a large, abrupt movement between a depth of 150 and 175 feet broke the fiberglass rod-anchor assembly. No significant anchor move- ments were detected after May 1987, about 2 months after initiation of subsidence.
The lack of vertical movement or change in strain recorded by the MPBX after the initial failure indi- cates fracture openings that developed between the depths of 50 and 150 feet did not close significantly.
lithology
drift
shale
shale
sandstone
shale, coal
Piasa Ls shale, coal siltstone sandstone, shale
Bankston Fork Ls Anvil Rock Ss
Lawson Shale
Brereton Ls Anna Shale Energy Shale
Herrin coal claystone
limestone
depth (fi)
- - 50 - anchor 1
--- - - - anchor 2
anchor 3
anchor 4
anchor 5
percent strain between MPBX anchors
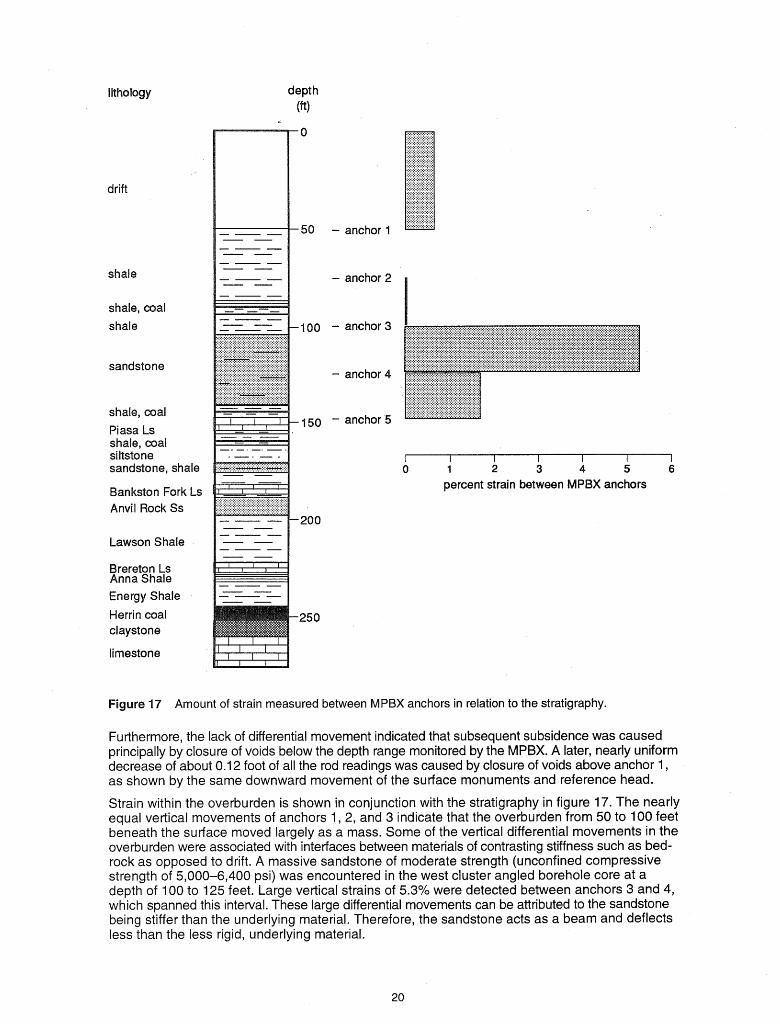
Figure 17 Amount of strain measured between MPBX anchors in relation to the stratigraphy.
Furthermore, the lack of differential movement indicated that subsequent subsidence was caused principally by closure of voids below the depth range monitored by the MPBX. A later, nearly uniform decrease of about 0.12 foot of all the rod readings was caused by closure of voids above anchor 1, as shown by the same downward movement of the surface monuments and reference head.
Strain within the overburden is shown in conjunction with the stratigraphy in figure 17. The nearly equal vertical movements of anchors 1, 2, and 3 indicate that the overburden from 50 to 100 feet beneath the surface moved largely as a mass. Some of the vertical differential movements in the overburden were associated with interfaces between materials of contrasting stiffness such as bed- rock as opposed to drift. A massive sandstone of moderate strength (unconfined compressive strength of 5,000-6,400 psi) was encountered in the west cluster angled borehole core at a depth of I00 to 125 feet. Large vertical strains of 5.3% were detected between anchors 3 and 4, which spanned this interval. These large differential movements can be attributed to the sandstone being stiffer than the underlying material. Therefore, the sandstone acts as a beam and deflects less than the less rigid, underlying material.
lithology
drift
shale
coal
shale
sandstone
coal Piasa Ls
siltstone sandstone Bankston Fork Ls
Anvil Rock Ss
Lawson Shale
Brereton Ls Anna Shale Energy Shale
Herrin Coal claystone
limestone
depth
1. cable crimps
2. shear deformation
3. cable failure in shear
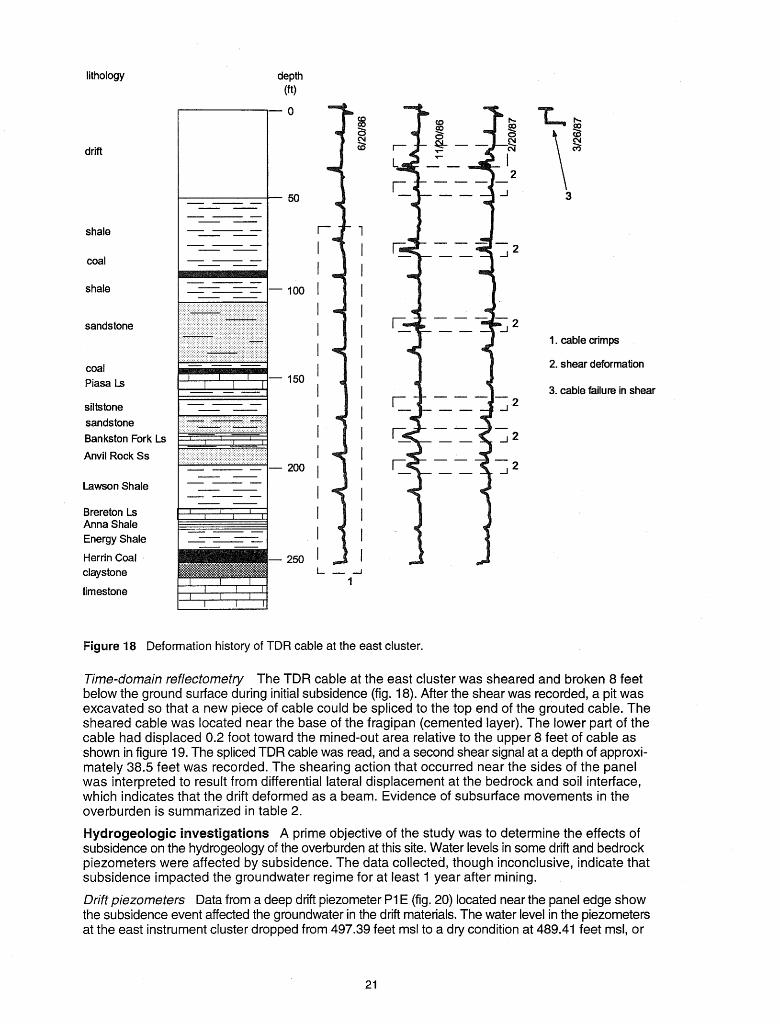
Figure 18 Deformation history of TDR cable at the east cluster.
Time-domain reflectometry The TDR cable at the east cluster was sheared and broken 8 feet below the ground surface during initial subsidence (fig. 18). After the shear was recorded, a pit was excavated so that a new piece of cable could be spliced to the top end of the grouted cable. The sheared cable was located near the base of the fragipan (cemented layer). The lower part of the cable had displaced 0.2 foot toward the mined-out area relative to the upper 8 feet of cable as shown in figure 19. The spliced TDR cable was read, and a second shear signal at a depth of approxi- mately 38.5 feet was recorded. The shearing action that occurred near the sides of the panel was interpreted to result from differential lateral displacement at the bedrock and soil interface, which indicates that the drift deformed as a beam. Evidence of subsurface movements in the overburden is summarized in table 2.
ydrogeologic investigations A prime objective of the study was to determine the effects of subsidence on the hydrogeology of the overburden at this site. Water levels in some drift and bedrock piezometers were affected by subsidence. The data collected, though inconclusive, indicate that subsidence impacted the groundwater regime for at least 1 year after mining.
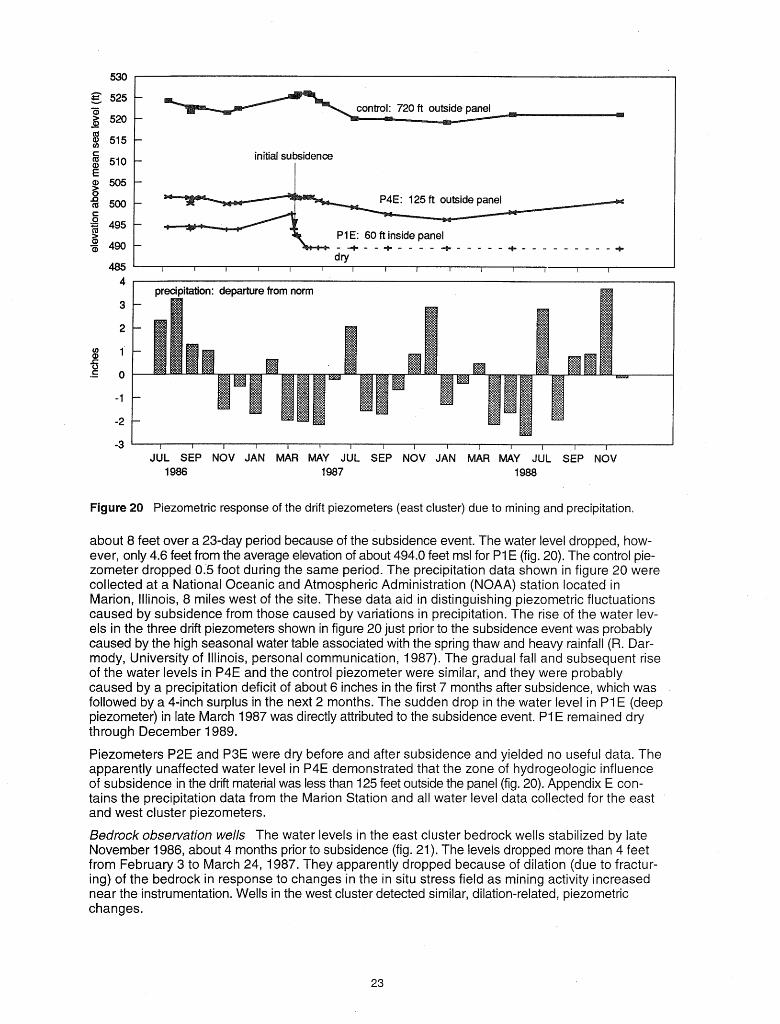
Drift piezometers Data from a deep drift piezometer P I E (fig. 20) located near the panel edge show the subsidence event affected the groundwater in the drift materials. The water level in the piezometers at the east instrument cluster dropped from 497.39 feet msl to a dry condition at 489.41 feet msl, or
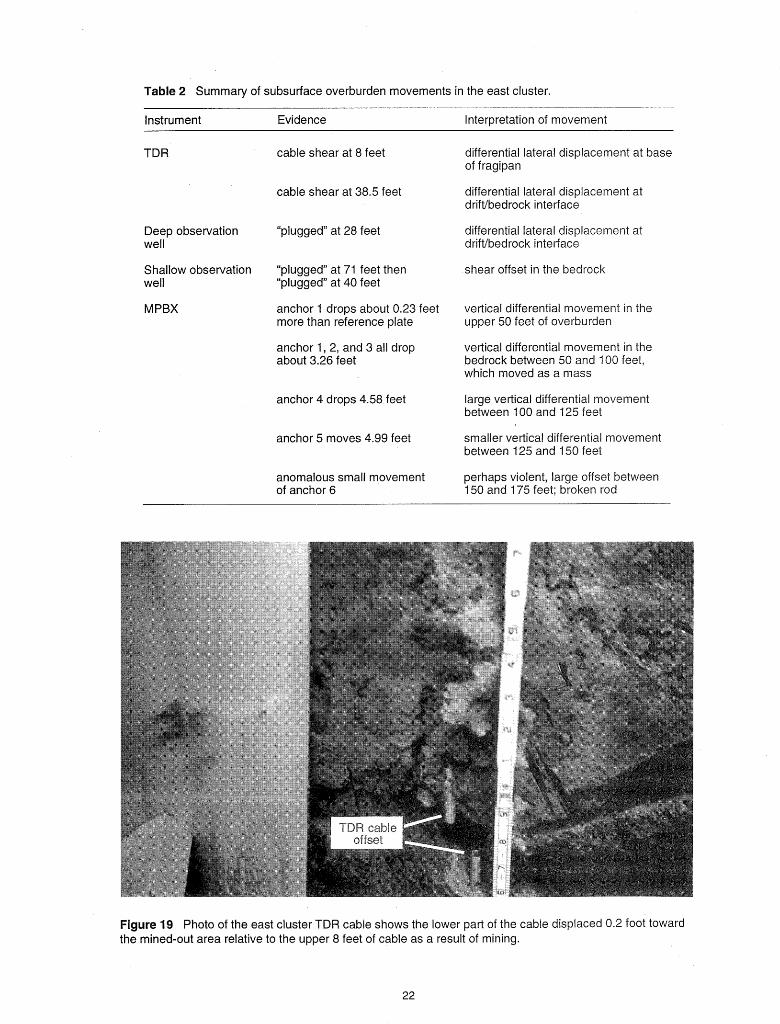
Table 2 Summary of subsurface overburden movements in the east cluster.
Instrument Evidence Interpretation of movement
TDR
Deep observation well
Shallow observation well
MPBX
cable shear at 8 feet
cable shear at 38.5 feet
"plugged" at 28 feet
"plugged" at 71 feet then "plugged" at 40 feet
anchor 1 drops about 0.23 feet more than reference plate
anchor 1, 2, and 3 all drop about 3.26 feet
anchor 4 drops 4.58 feet
anchor 5 moves 4.99 feet
anomalous small movement of anchor 6
differential lateral displacement at base of fragipan
differential lateral displacement at driftlbedrock interface
differential lateral displacement at driftlbedrock interface
shear offset in the bedrock
vertical differential movement in the upper 50 feet of overburden
vertical differential movement in the bedrock between 50 and 100 feet, which moved as a mass
large vertical differential movement between 100 and 125 feet
smaller vertical differential movement between 125 and 150 feet
perhaps violent, large offset between 150 and 175 feet; broken rod
Figure 19 Photo of the east cluster TDR cable shows the lower part of the cable displaced 0.2 foot toward the mined-out area relative to the upper 8 feet of cable as a result of mining.
(d 2 515 C
510 initial subsidence
E
m 500 C .o 3 495
PI E: 60 ft inside panel 5 490 - + - - + - - - - + - - - - - + - - - - - - - - - Q
-3 I I I I I I I I I I I I I I I
JUL SEP NOV JAN MAR MAY JUL SEP NOV JAN MAR MAY JUL SEP NOV 1 986 1987 1988
Figure 20 Piezometric response of the drift piezometers (east cluster) due to mining and precipitation.
about 8 feet over a 23-day period because of the subsidence event. The water level dropped, how- ever, only 4.6 feet from the average elevation of about 494.0 feet msl for P I E (fig. 20). The control pie- zometer dropped 0.5 foot during the same period. The precipitation data shown in figure 20 were collected at a National Oceanic and Atmospheric Administration (NOAA) station located in Marion, Illinois, 8 miles west of the site. These data aid in distinguishing piezometric fluctuations caused by subsidence from those caused by variations in precipitation. The rise of the water lev- els in the three drift piezometers shown in figure 20 just prior to the subsidence event was probably caused by the high seasonal water table associated with the spring thaw and heavy rainfall (R. Dar- mody, University of Illinois, personal communication, 1987). The gradual fall and subsequent rise of the water levels in P4E and the control piezometer were similar, and they were probably caused by a precipitation deficit of about 6 inches in the first 7 months after subsidence, which was followed by a 4-inch surplus in the next 2 months. The sudden drop in the water level in P IE (deep piezometer) in late March 1 987 was directly attributed to the subsidence event. P I E remained dry through December 1989.
Piezometers P2E and P3E were dry before and after subsidence and yielded no useful data. The apparently unaffected water level in P4E demonstrated that the zone of hydrogeologic influence of subsidence in the drift material was less than 1 25 feet outside the panel (fig. 20). Appendix E con- tains the precipitation data from the Marion Station and all water level data collected for the east and west cluster piezometers.
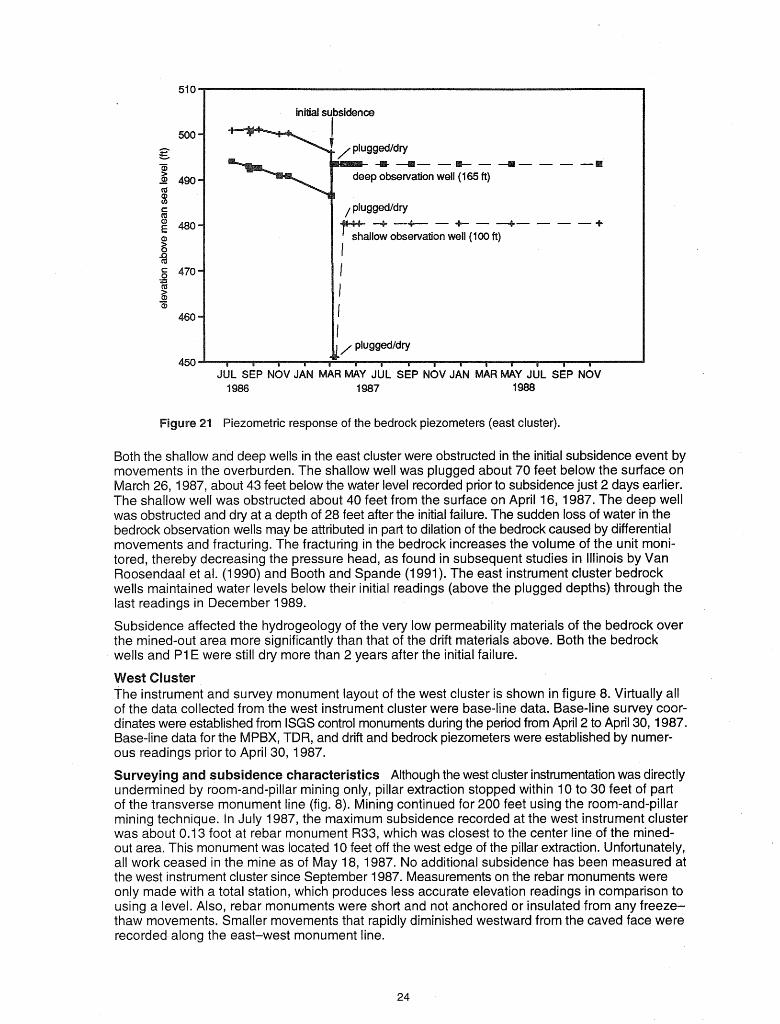
Bedrock observation wells The water levels in the east cluster bedrock wells stabilized by late November 1986, about 4 months prior to subsidence (fig. 21). The levels dropped more than 4 feet from February 3 to March 24, 1987. They apparently dropped because of dilation (due to fractur- ing) of the bedrock in response to changes in the in situ stress field as mining activity increased near the instrumentation. Wells in the west cluster detected similar, dilation-related, piezometric changes.
v .- initial subsidence
--- -. 490 p observation well (1 65 ft)
480 -+ -+ - + - 4- - - -4- low observation well (100 ft)
470
460
450 JUL SEP NOV JAN MAR JUL SEP NOV JAN MAR NlAY JUL SEP NOV
1 986 1987 1 988
Piezometric response of the bedrock piezometers (east cluster).
Both the shallow and deep wells in the east cluster were obstructed in the initial subsidence event by movements in the overburden. The shallow well was plugged about 70 feet below the surface on March 26, 1987, about 43 feet below the water level recorded prior to subsidence just 2 days earlier. The shallow well was obstructed about 40 feet from the surface on April 16, 1987. The deep well was obstructed and dry at a depth of 28 feet after the initial failure. The sudden loss of water in the bedrock observation wells may be attributed in part to dilation of the bedrock caused by differential movements and fracturing. The fracturing in the bedrock increases the volume of the unit moni- tored, thereby decreasing the pressure head, as found in subsequent studies in Illinois by Van Roosendaal et ai. (1 990) and Booth and Spande (1 991). The east instrument cluster bedrock wells maintained water levels below their initial readings (above the plugged depths) through the last readings in December 1989.
Subsidence affected the hydrogeology of the very low permeability materials of the bedrock over the mined-out area more significantly than that of the drift materials above. Both the bedrock wells and P I E were still dry more than 2 years after the initial failure.
The instrument and survey monument layout of the west cluster is shown in figure 8. Virtually all of the data collected from the west instrument cluster were base-line data. Base-line survey coor- dinates were established from ISGS control monuments during the period from April 2 to April 30, 1987. Base-line data for the MPBX, TDR, and drift and bedrock piezometers were established by numer- ous readings prior to April 30, 1987.
and subsidence characteristics Although the west cluster instrumentation was directly undermined by room-and-pillar mining only, pillar extraction stopped within 10 to 30 feet of part of the transverse monument line (fig. 8). Mining continued for 200 feet using the room-and-pillar mining technique. In July 1987, the maximum subsidence recorded at the west instrument cluster was about 0.13 foot at rebar monument W33, which was closest to the center line of the mined- out area. This monument was located 10 feet off the west edge of the pillar extraction. Unfortunately, all work ceased in the mine as of May 18, 1987. No additional subsidence has been measured at the west instrument cluster since September 1987. Measurements on the rebar monuments were only made with a total station, which produces less accurate elevation readings in comparison to using a level. Also, rebar monuments were short and not anchored or insulated from any freeze- thaw movements. Smaller movements that rapidly diminished westward from the caved face were recorded along the east-west monument line.
I I I I I I 1 I I I I I I I
JUL SEP NOV JAN MAR MAY JUL SEP NOV JAN MAR MAY JUL SEP NOW
igure 22 Piezometric response of the drift piezometers (west cluster).
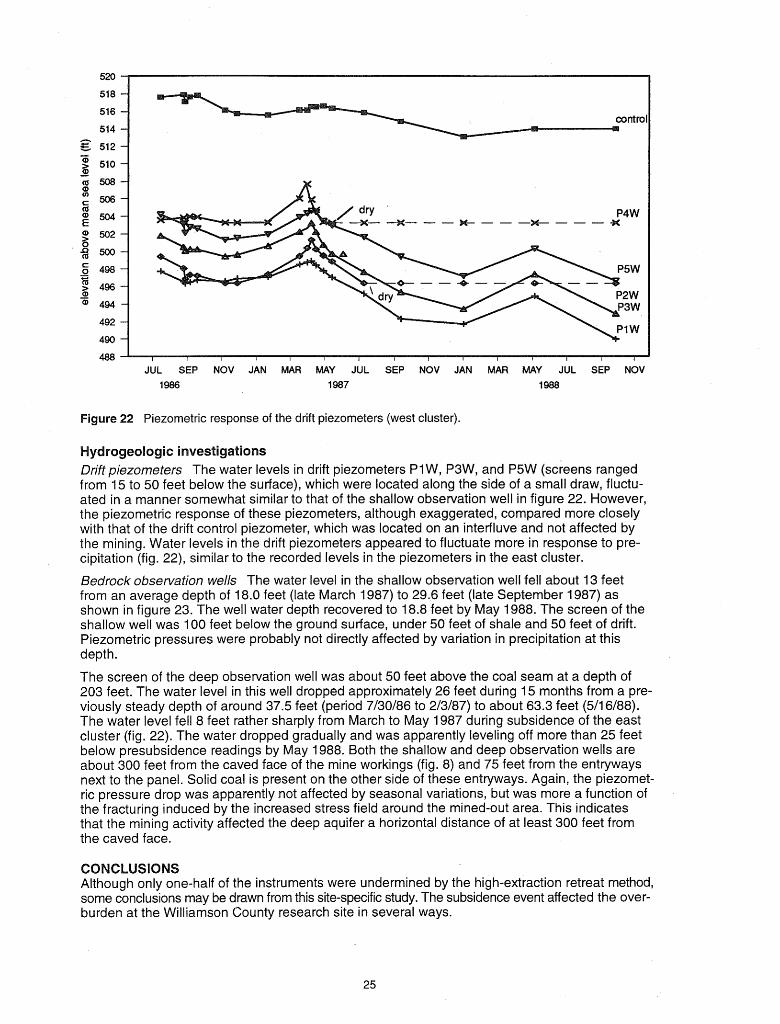
eollogic investigations Drift piezometers The water levels in drift piezometers P I W, P3W, and P5W (screens ranged from 15 to 50 feet below the surface), which were located along the side of a small draw, fluctu- ated in a manner somewhat similar to that of the shallow obseiation well in figure 22. However, the piezometric response of these piezometers, although exaggerated, compared more closely with that of the drift control piezometer, which was located on an interfluve and not affected by the mining. Water levels in the drift piezometers appeared to fluctuate more in response to pre- cipitation (fig. 22), similar to the recorded levels in the piezometers in the east cluster.
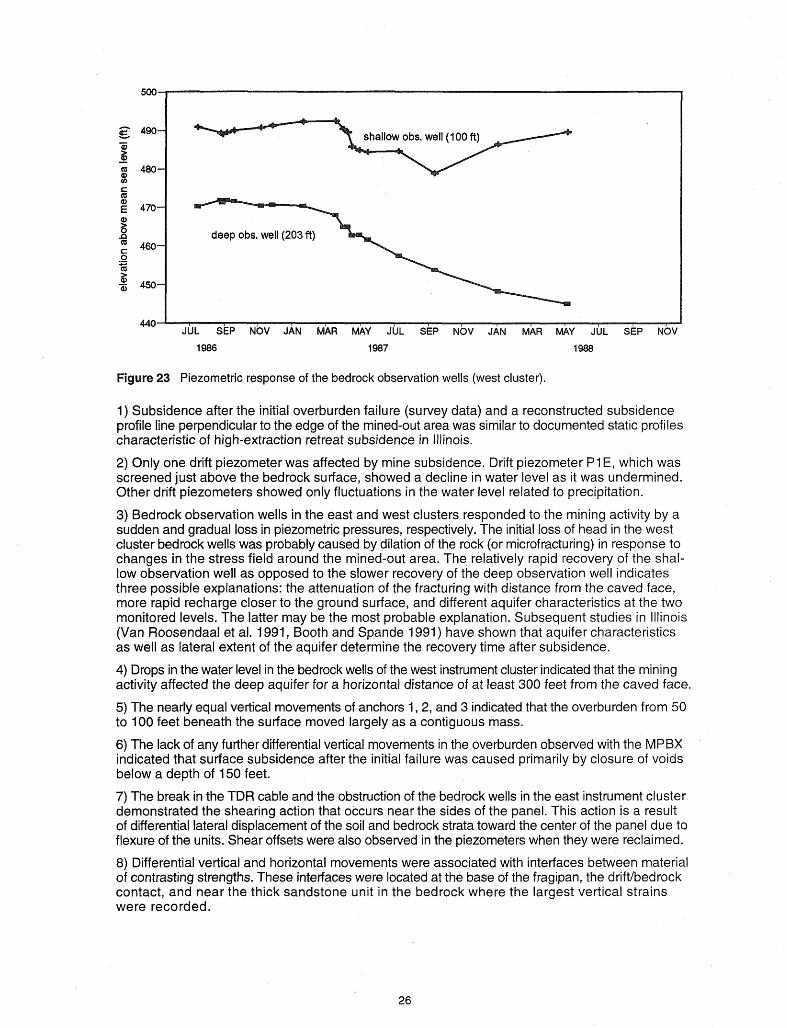
Bedrock observation wells The water level in the shallow observation well fell about 13 feet from an average depth of 18.0 feet (late March 1987) to 29.6 feet (late September 1987) as shown in figure 23. The well water depth recovered to 18.8 feet by May 1988. The screen of the shallow well was 100 feet below the ground surface, under 50 feet of shale and 50 feet of drift. Piezometric pressures were probably not directly affected by variation in precipitation at this depth.
The screen of the deep observation well was about 50 feet above the coal seam at a depth of 203 feet. The water level in this well dropped approximately 26 feet during 15 months from a pre- viously steady depth of around 37.5 feet (period 7130186 to 2/3/87) to about 63.3 feet (511 6/88). The water level fell 8 feet rather sharply from March to May 1987 during subsidence of the east cluster (fig. 22). The water dropped gradually and was apparently leveling off more than 25 feet below presubsidence readings by May 1988. Both the shallow and deep observation wells are about 300 feet from the caved face of the mine workings (fig. 8) and 75 feet from the entryways next to the panel. Solid coal is present on the other side of these entryways. Again, the piezomet- ric pressure drop was apparently not affected by seasonal variations, but was more a function of the fracturing induced by the increased stress field around the mined-out area. This indicates that the mining activity affected the deep aquifer a horizontal distance of at least 300 feet from the caved face.
Although only one-half of the instruments were undermined by the high-extraction retreat method, some conclusions may be drawn from this site-specific study. The subsidence event affected the over- burden at the Williamson County research site in several ways.
I
deep obs. well (203 ft)
440 JUL SEP NOV JAN MAR MAY JUL SEP NOV JAN MAR MAY JUL SEP NOV
1986 1987 1 988
Figure 23 Piezometric response of the bedrock observation wells (west cluster).
1) Subsidence after the initial overburden failure (survey data) and a reconstructed subsidence profile line perpendicular to the edge of the mined-out area was similar to documented static profiles characteristic of high-extraction retreat subsidence in Illinois.
2) Only one drift piezometer was affected by mine subsidence. Drift piezometer P I El which was screened just above the bedrock surface, showed a decline in water level as it was undermined. Other drift piezometers showed only fluctuations in the water level related to precipitation.
3) Bedrock observation wells in the east and west clusters responded to the mining activity by a sudden and gradual loss in piezometric pressures, respectively. The initial loss of head in the west cluster bedrock wells was probably caused by dilation of the rock (or microfracturing) in response to changes in the stress field around the mined-out area. The relatively rapid recovery of the shal- low observation well as opposed to the slower recovery of the deep observation well indicates three possible explanations: the attenuation of the fracturing with distance from the caved face, more rapid recharge closer to the ground surface, and different aquifer characteristics at the two monitored levels. The latter may be the most probable explanation. Subsequent studies in Illinois (Van Roosendaal et al. 1991, Booth and Spande 1991) have shown that aquifer characteristics as well as lateral extent of the aquifer determine the recovery time after subsidence.
4) Drops in the water level in the bedrock wells of the west instrument cluster indicated that the mining activity affected the deep aquifer for a horizontal distance of at least 300 feet from the caved face.
5) The nearly equal vertical movements of anchors 1, 2, and 3 indicated that the overburden from 50 to 100 feet beneath the surface moved largely as a contiguous mass.
6) The lack of any further differential vertical movements in the overburden observed with the MPBX indicated that surface subsidence after the initial failure was caused primarily by closure of voids below a depth of 150 feet.
7) The break in the TDR cable and the obstruction of the bedrock wells in the east instrument cluster demonstrated the shearing action that occurs near the sides of the panel. This action is a result of differential lateral displacement of the soil and bedrock strata toward the center of the panel due to flexure of the units. Shear offsets were also observed in the piezometers when they were reclaimed.
8) Differential vertical and horizontal movements were associated with interfaces between material of contrasting strengths. These interfaces were located at the base of the fragipan, the driftlbedrock contact, and near the thick sandstone unit in the bedrock where the largest vertical strains were recorded.
The following are recommendations for performing a similar monitoring program.
1) The recovery time of the aquifer should be determined by monitoring on a more continuous basis than was done in this study. Groundwater fluctuations might also be correlated to surface strain if monitoring were more continuous.
2) The TDR weightlanchor design developed during this study is recommended. Use of a flexible bentonite fill in the glacial overburden in order to avoid cable shear failure in the glacial overbur- den or at the contact with the bedrock is also highly recommended.
3) An inclinometer installation is recommended to document lateral movements in the bedrock as the subsidence wave approaches and passes through the instrumented site.
4) Pre- and postsubsidence rock core should be compared to determine changes in fracture fre- quency and locations of increased shearing. The location of fractures would be useful in compar- ing any bedrock movements found using the inclinometer, MPBX, and TDR cables.
5) Glacial material should be sampled using standard split-spoon sampling; standard penetration tests (SPT) should be performed before and after subsidence.
6) One cored borehole should be geophysically logged before and after subsidence to measure differences in shear wave velocity as well as other rock mass properties.
7) All survey monuments, including the control or benchmark monuments, should be constructed alike. Ail vertical changes should be determined using a level instrument, which has a higher de- gree of accuracy than a total station instrument.
8) A series of packer tests should be conducted before and after subsidence to compare hydrau- lic conductivity.
The Engineering Geology Section of the Illinois State Geological Survey in Champaign prepared this report under USBM Cooperative Agreement CO 267001, which was initiated under the Illi- nois Mine Subsidence Research Program. It was administered under the technical direction of the U.S. Bureau of Mines Twin Cities Research Center with Larry Powell acting as Technical Pro- ject Officer. Kent Charles and Jose Martinez were the contract administrators for the Bureau of Mines. This report is a summary of the work recently completed as part of the contract during the period from October 1, 1986, to September 30, 1992.
The authors acknowledge the partial funding provided by the Illinois Department of Energy and Natural Resources, the Illinois Coal Development Board, and the Office of Surface Mining. The authors also acknowledge the work of David F. Brutcher, Joseph (Jay) T. Kelleher, Christine E. Ovanic, and students from Northwestern University for their assistance in the field. Billy Anne Trent assisted with manuscript preparation, and Philip J. DeMaris provided several map figures. The authors also thank the land owner Sam Stotlar and the mining company for their assistance and cooperation. Paul B. DuMontelle, former director of the llinois Mine Subsidence Research Pro- gram, assisted in securing the research site.
ASTM, 1988, Annual Book of Standards, Section 4 Construction, v. 04.08, Soil and Rock, Build- ing Stones; Geotextiles, 951 p.
Bauer, R. A., C. H. Dowding, D. J. Van Roosendaal, B. 5. Mehnert, M. B. Su, and K. OIConnor, 1991, Application of time domain reflectometry to subsidence monitoring, Final report to Office of Surface Mining: NTIS No. PB91-228411, 48 p.
Booth, C. J., 1986, Strata-movement concepts and the hydrogeological impact of underground coal mining: Ground Water, v. 24, p. 507-515.
Booth, C. J., and E. D. Spande, 1990, Piezometric and aquifer property changes above subsid- ing longwall panels, Southern Illinois, in EOS (Trans., Am. Geophys. Union), v. 71, no. 17, p. 506 (AGU Spring Meeting, Baltimore, MD, May 30).
Booth, C. J., and E. D. Spande, 1991, Changes in hydraulic properJies of strata over active long- wall mining, Illinois, USA: Proceedings, Fourth lnternational Mine Water Congress, Port- schach, AustriaILubljana, Slovenia, September, 12 p.
Broch, E., and J. A. Franklin, 1972, The point-load strength test: lnternational Journal for Rock Mechanics and Mining Sciences and Geomechanics Abstracts, v. 9, p. 669-697.
Brook, N., 1980, Technical note-size correction for point load testing: lnternational Journal for Rock Mechanics and Mining Sciences and Geomechanics Abstracts, v. 17, p. 231-235.
Brown, E. T., 1981, Rock Characterization Testing and Monitoring, ISRM Suggested Methods, Published for the Commission on Testing Methods: lnternational Society for Rock Mechanics, Pergamon Press, Oxford, 21 1 p.
Brutcher, D. F., B. B. Mehnert, D. J. Van Roosendaal, and R. A. Bauer, 1990, Rock strength and overburden changes due to subsidence over a longwall coal mining operation in Illinois, in W. A. Hustrulid and G. A. Johnson, editors, Rock Mechanics Contributions and Challenges, Pro- ceedings of the 31 st U.S. Symposium, Bal kema, Rotterdam, p. 93-1 00.
Cartwright, K., and C. S. Hunt, 1978, Hydrogeology of underground coal mines in Illinois: lSGS reprint 1978-N, 1978. Reprinted from Proceedings of lnternational Symposium on Water in Mining and Underground Works, Granada, Spain, Sept. 17-22, 20 p.
Coe, C. J., and S. M. Stowe, 1984, Evaluating the impact of longwall coal mining on the hydro- logic balance, in D. H. Graves, editor, Proceedings of 1984 Symposium on Surface Mining, Hydrology, Sedimentology, and Reclamation, Lexington, Kentucky, p. 395-403.
Conroy, P. J., 1980, Longwall coal mining. Dames and Moore, Engineering Bulletin 52, 1980, p. 13-26.
Dowding, C. H., WI. 5. Su, and K. OIConnor, 1988, Principles of time domain reflectometry ap- plied to measurement of rock mass deformation: lnternational Journal for Rock Mechanics and Mining Science and Geomechanics Abstracts, v. 25, p. 287-297.
Dowding, C. H., M. B. Su, and K. OIConnor, 1989, Measurement of rock mass deformation with grouted coaxial antenna cables: Rock Mechanics and Rock Engineering, v. 22, p. 1-23.
Duigon, M. T., and M. J. Smigaj, 1985, First report on the hydrologic effects of underground coal mining in southern Garrett County, Maryland: Maryland Geological Survey, Report of Investi- gations 41, 99 p.
Engineers lnternational, 1988, Instrumentation to monitor subsidence associated with high- extraction mining in the Illinois Coal Basin: Final report to the U.S. Bureau of Mines, Twin Cit- ies Research Center, Contract No. H0256005, 60 p.
Feherenbacher, 4. B., and R. T. Odell, 1959, Williamson County Soils, Report 79: Agricultural Ex- periment Station, University of Illinois at Urbana-Champaign, in cooperation with the Soil Con- servation Service, U.S. Department of Agriculture, 72 p.
Garritty, P., 1982, Water percolation into fully caved longwall faces, Proceedings of the Sympo- sium on Strata Mechanics held in Newcastle-upon-Tyne: Developments in Geotechnical Engi- neering, v. 32, p. 25-29.
GeoTechnical Graphics System, 1991, Software (version 3.1): GeoTechnical Graphics, Berkeley, CA.
Horberg, C. L., 1950, Bedrock Topography of Illinois: lllinois State Geological Suwey, Bulletin 73, 1 1 1 p.
Hunt, S. R., 1980, Surface subsidence due to coal mining in Illinois: Ph.D. thesis, University of Illi- nois at Urbana-Champaign, 129 p.
Ingram, D. K., and G. M. Molinda, 1988, Relationship between horizontal stresses and geologic anomalies in two coal mines in southern Illinois: U.S. Bureau of Mines, RI 9189, p. 17.
lnternational Society for Rock Mechanics, 1985, Commission of Testing Methods (J.A. Franklin coordinator): lnternational Journal of Rock Mechanics and Mining Sciences and Geomechanics Abstracts, v. 22, no. 2, p. 51 -60.
Kratzsch, H., 1983, Mining Subsidence Engineering: Springer-Verlag, New York, 543 p.
Krausse, H. F., H. H. Damberger, W. J. Nelson, S. R. Hunt, C. T. Ledvina, C. G. Treworgy, and W. A. White, 1979, Roof Strata of the Herrin (No. 6) Coal Member in Mines of Illinois: Their Geol- ogy and Stability, Summary Report: Illinois State Geological Survey, lllinois Minerals Note 72, 54 p.
Leighton, M. M., G. E. Ekblaw, and C. L. Horberg, 1948, Physiographic Divisions of Illinois: lllinois State Geological Su rvey, Report of Investigations 129, 1 9 p.
MacClintock, P., 1929, Physiographic Divisions of the Area Covered by the lllinoian Driftsheet in Southern Illinois: lllinois State Geological Survey, Repotlt of lnvestigations 19, 57 p.
Ming-Gao, C., 1982, A study of the behaviour of overlying strata in longwall mining and its appli- cation to strata control, in I. W. Farmer, editor, Proceedings of the Symposium on Strata Mechanics: Elsevier, New York, p. 13-1 7.
Nelson, W. J., 1979, Geologic effects of the Walshville channel on coal mining conditions in southern Illinois, Depositional and structural history of the Pennsylvanian System of the lllinois Basin Part 2: Invited Papers, Field trip 91Ninth lnternational Congress of Carboniferous Strati- graphy and Geology, p. 151 -1 58.
Nelson, W. J., and R. A. Bauer, 1987, Thrust faults in southern lllinois basin-result of contempo- rary stress? Geological Society of America Bulletin, v. 98, p. 302-307.
Nelson, W. J., and H. F. Krausse, 1981, The Cottage Grove Fault System in Southern Illinois: Illi- nois State Geological Survey, Circular 522, 65 p.
Nieto, A. S., 1979, Evaluation of damage potential to earth dam by subsurface coal mining at Rend Lake, Illinois: Ohio River Valley Soils Seminar; Geotechnics of Mining. Lexington, KY, Oct. 5, p. 9-1 8.
Owili-Eger, A. S., 1983, Geohydrologic and hydrogeochemical impacts of longwall coal mining on local aquifers: SME-AIME Fall Meeting, Salt Lake City, UT. Preprint No. 83-376, 16 p.
Pauvlik, C. M., and S. P. Esling, 1987, The effects of longwall mining subsidence on the ground- water conditions of a shallow, unconfined aquitard in Southern Illinois, in Proceedings, 1987 National Symposium on Mining, Hydrology, Sedimentology, and Reclamation, Lexington, Ken- tucky, December 7-1 1, University of Kentucky, Lexington, p. 189-1 95.
Pennington, D., J. G. Hill, G. J. Burgdorf, and D. R. Price, 1984, Effects of longwall mine subsi- dence on overlying aquifers in Western Pennsylvania: U.S. Bureau of Mines OFR 142-84, 129 p.
., 1953, Groundwater possibilities for municipal supply of Pittsburg, Williamson County: lllinois State Geological Survey, Division of Ground Water Geology and Geophysical Exploration, unpublished geologic report.
Sasman, R. T., 1 953, Groundwater resources at Pittsburg, Williamson County: State Water Sur- vey Division, lllinois Department of Registration and Education, unpublished report.
Sloan, P., and R. C. Warner, 1984, A case study of groundwater impact caused by underground mining, in D. H. Graves, editor, Proceedings of 1984 Symposium on Surface Mining, Hydrol- ogy, Sedimentology and Reclamation, Lexington, Kentucky, p. 11 3-1 20.
Van Roosendaal, D. J., D. F. Brutcher, B. B. Mehnert, J. T. Kelleher, and R. A. Bauer, 1990, Overburden deformation and hydrologic changes due to longwall mine subsidence in Illinois, in Y. P. Chugh, editor, Proceedings of 3rd Conference on Ground Control Problems in the Illi- nois Coal Basin: Southern lllinois University at Carbondale, p. 73-82.

daal, D. J., B. B. Mehnert, J. T. Kelleher, and C. E. Ovanic, 1991, Three dimensional ovements associated with longwall mine subsidence in Illinois: Association of Engi-
neering Geologists 34th Annual Meeting, Chicago, IL, p. 81 5-826.
Whitworth, K. R., 1982, Induced changes in permeability of coal measure strata as an indicator of the mechanics of rock deformation above a longwall coal face, in I. W. Farmer, editor, Pro- ceedings of the Symposium on Strata Mechanics, Elsevier, New York, p. 18-24.
A Overburden Characterization Rock Mechanics Laboratory Results Geotechnical Core Log
B MPBX Readings and Calculations for Both Clusters East Cluster MPBX Readings and Calculations West Cluster MPBX Readings and Calculations
C Surveying Data Survey Coordinates for East Cluster lnstruments and Monuments Survey Coordinates for West Cluster lnstruments and Monuments
D Elevation Changes due to Subsidence Elevation Changes of East Cluster lnstruments Elevation Changes of West Cluster lnstruments
E Water Level Readings and Precipitation Data Piezometer Water Level Readings, East Cluster Piezometer Water Level Readings, West Cluster Precipitation Data from Marion Station

SAMPLE ROCK ID TYPE
(DEPTH)
11 163.71 SLTST 164.8 SLTST / 170.6 SS-SLTST 181.9 SLTST 1 190.5 LS
ILLINOIS STATE GEOLOGICAL SURVEY ROCK MECHANICS IABORATORY
WILLIAMSON COUNTY -- HER MINE SITE (PRE-SUBSIDENCE)
AVERAGE AVERAGE
q U MODULUS MOISTURE AXIAL AVERAGE INDIRECT SPECIFIC SHORE (psi) (psi x 10 * 6) CONTENT POINT LOAD T500 TENSILE GRAVITY HARDNESS
0 4 " INDEX STRENGTH
** No sample available.
SH = Shale SS = Sandstone SLTST = Siltstone LS = Limestone

GEOLOGICAL BORING LOG: Pre-sub Core; 10' from vert; West Cluster I Pa-qe 1 of 14
PROJECT: IMSdP Williamson Cnty High-Extrac tion Retreat Site I SURF ELEV: 509.75 FT I LOCATION: NWM, SWY, S6, T9S, R4E, Williamson Cnty, IL I TOTAL DEPTH: 264.3 FT I
Core iecov (%
25 50 75
Fracture per foot 1 2 3 4
Illinois State Geolo Illinois Mine Subsidence R 615 East Peabody Drive, Champaign, I L 61820
Joints
Description
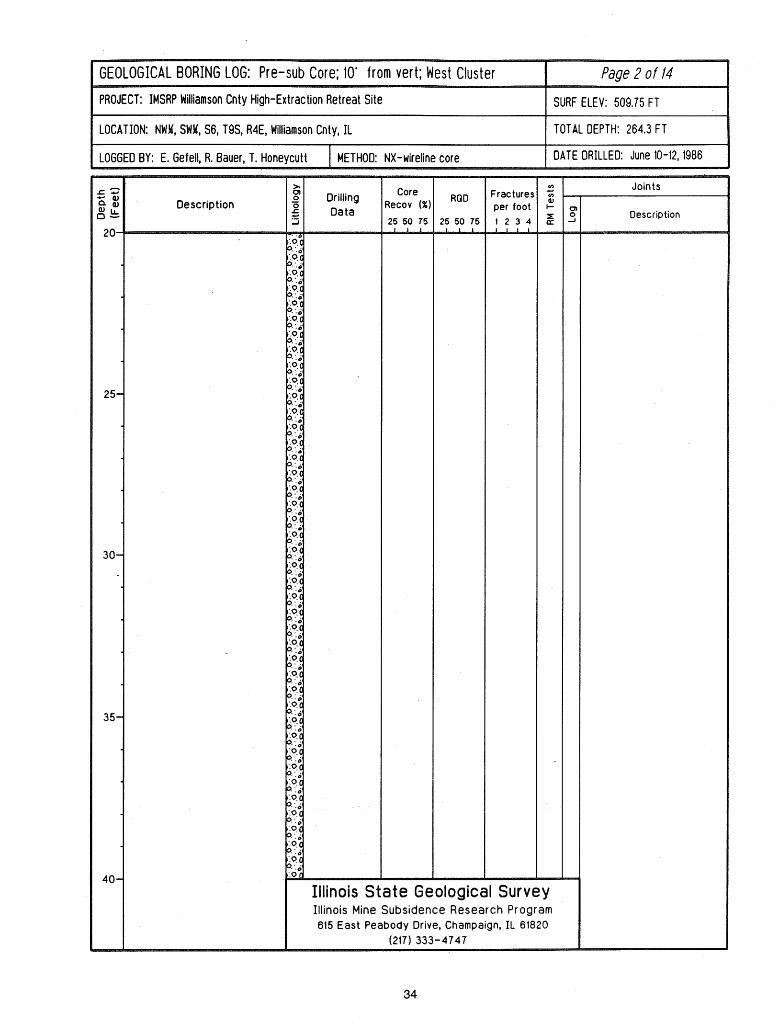
GEOLOGICAL BORING LOG: Pre-sub Core; 10' from vert; West Cluster Page 2 of 14
PROJECT: IMSRP Williamson Cnty High-Extraction Retreat Site I SURF ELEV: 509.75 FT
LOCATION: NWII, SWII. S6, T9S, R4E, Williamson Cnty, I L I TOTAL DEPTH: 264.3 FT
LOGGED BY: E. Gefell, R. Bauer, T. Honeycutt I METHOD: NX-wireline core I DATE DRILLED: June 10-12. 1986 ____I
Core 3ecov ( X
25 50 75
ROD
25 50 75
Fracture5 per foot 1 2 3 4
Illinois State Geological Survey Illinois Mine Subsidence Research Program 615 East Peabody Drive, Champaign, I L 61820
(217) 333-4747
Joints
Description

I LOCATION: NWY, SHY, S6, T9S, R4E, Williamson Cnty, IL I TOTAL DEPTH: 264.3 FT
I LOGGED BY: E. Gefell, R. Bauer, T. Honeycutt I METHOD: NX-wireline core I DATE DRILLED: June 10-12. 1986
Core 3ecov ( X
25 50 75
RQD
25 50 75
Fracture! per foot 1 2 3 4
Joints
Description
--51.25: no filling, brown staining, uneven, slickensides, 35' dip
b 1 . 7 5 : no filling, uneven, slickensides, 55' dip
- 5 3 . 2 5 : no filling, uneven, slickensides, 40' dip
-56 .83: no filling, planar, slickensides, 30' dip
b . 0 : no filling, uneven. slickensides, 40' dip
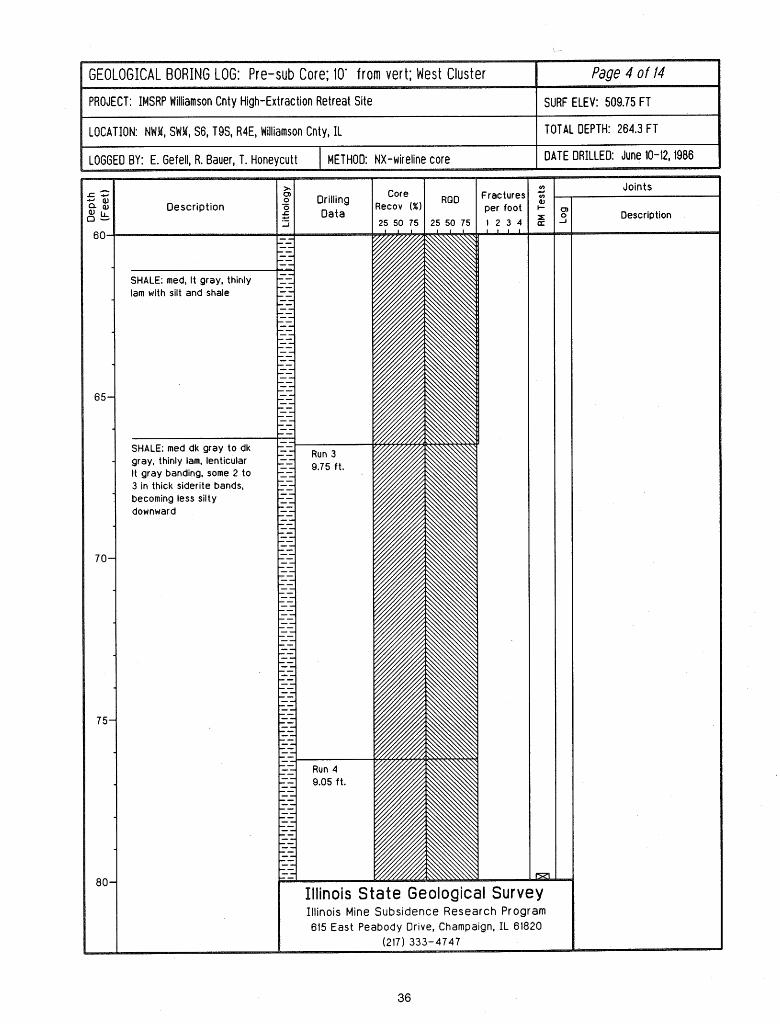
LOCATION: NWX, SWX, S6, TQS, R4E, Williamson Cnty, I L I TOTAL DEPTH: 264.3 F T
> a Drilling 'Ore Fractures
Description I / Data R e c O v '"1 '" 1 per foot
25 50 75 25 50 75 1 2 3 4
Illinois State Geological Survey Illinois Mine Subsidence Research Program 615 East Peabody Drive, Champaign, I L 61820
Joints
Description
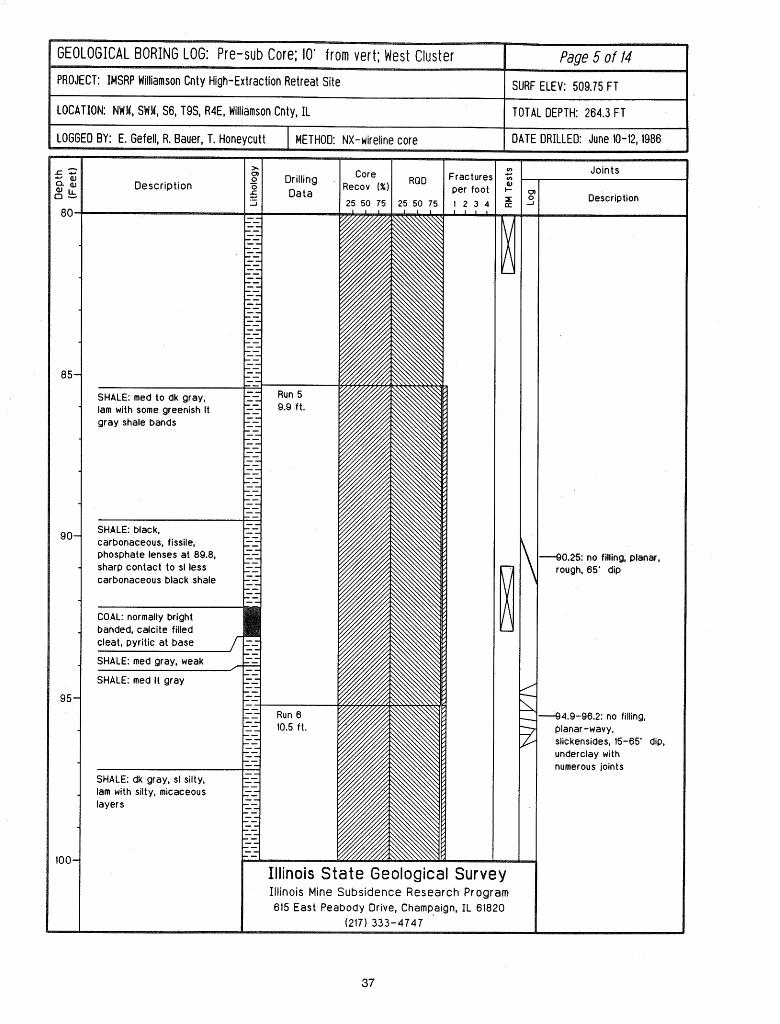
PROJECT: IMSRP Williamson Cnty High-Extraction Retreat Site I SURF ELEV: 509.75 FT
Fracture: Description per foot
LOCATION: NWY, SHY, S6, T9S, R4E, Williamson Cnty, IL
Illinois State eological Survey Illinois Mine Subsidence Research Program 615 East Peabody Drive, Champaign, I L 61820
(217) 333-4747
TOTAL DEPTH: 264.3 FT
Joints
Description
-90.25: no filling, planar, rough, 65' dip
4.9-96.2: no filling, planar-wavy, slickensides, 15-65' dip, underclay with numerous joints
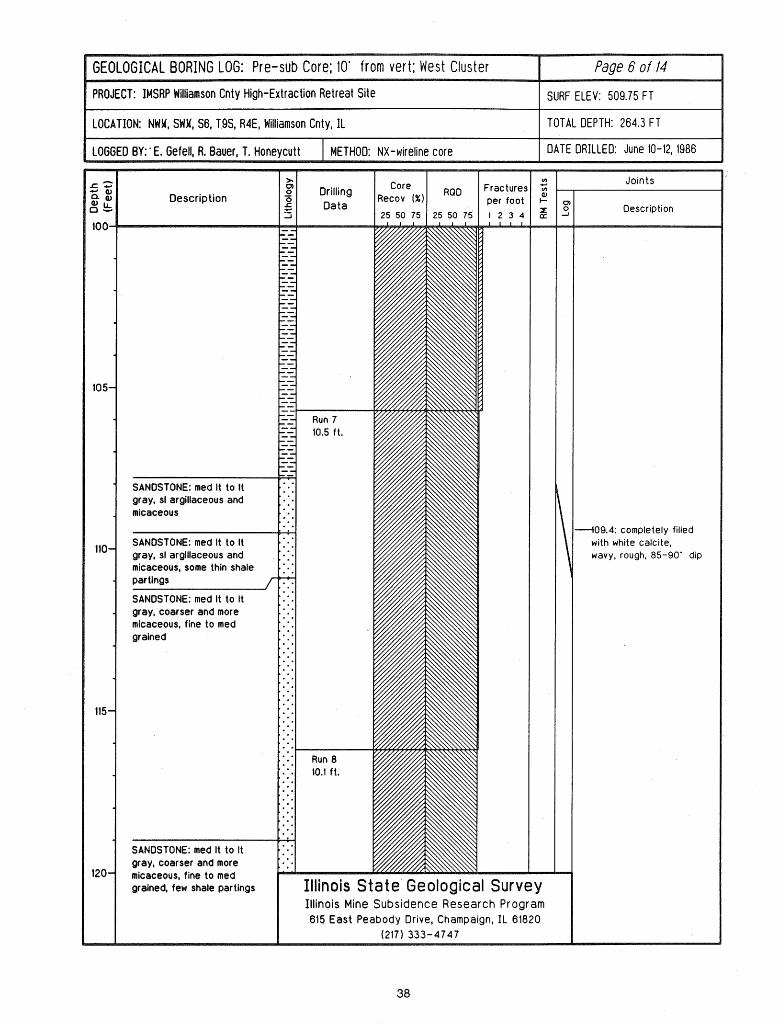
GEOLOGICAL BORING LOG: Pre-sub Core; 10' from vert; West Cluster I Page 6 of 14
OJECT: IMSRP Williamson Cnty High-Extraction Retreat Site I SURF ELEV: 509.75 FT
LOGGED BY:'E. Gefell. R. Bauer. T. Honevcutt I METHOD: NX-wireline core I DATE DRILLED: June 10-12, 1986
LOCATION: NWX, SWX, S6, TQS, R4E, Williamson Cnty, IL
Description
TOTAL DEPTH: 264.3 FT
SANDSTONE: med It to It gray, sl argillaceous and micaceous
SANDSTONE: rned It to It gray, sl argillaceous and
partings
SANDSTONE: rned It to It gray, coarser and more micaceous, fine to rned grained, few shale partings I Illinois State Geological Survey
Ill inois Mine Subsidence Research Program 615 East Peabody Drive, Champaign, I L 61820
(217) 333-4747
Joints
Description
---109.4: completely filled with white calcite, wavy, rough, 85-90' dip
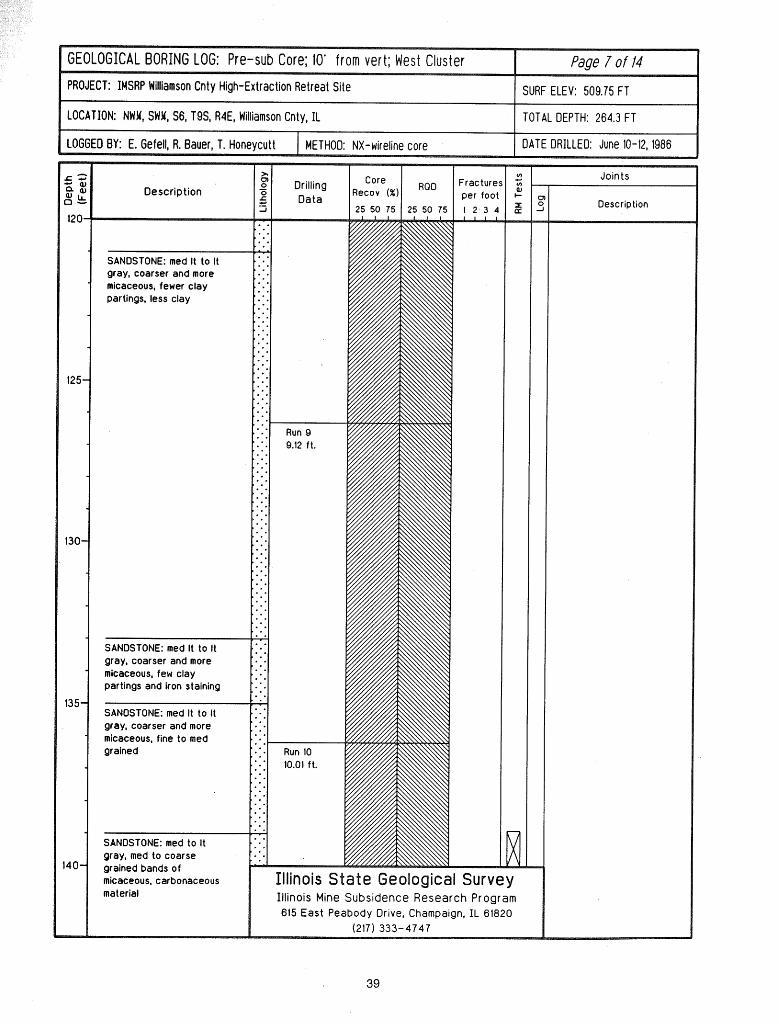
material
Fracture Description per fooi
Illinois Mine Subsidence Research Program 615 East Peabody Drive, Champaign, I L 61820
(217) 333-4747
Joints
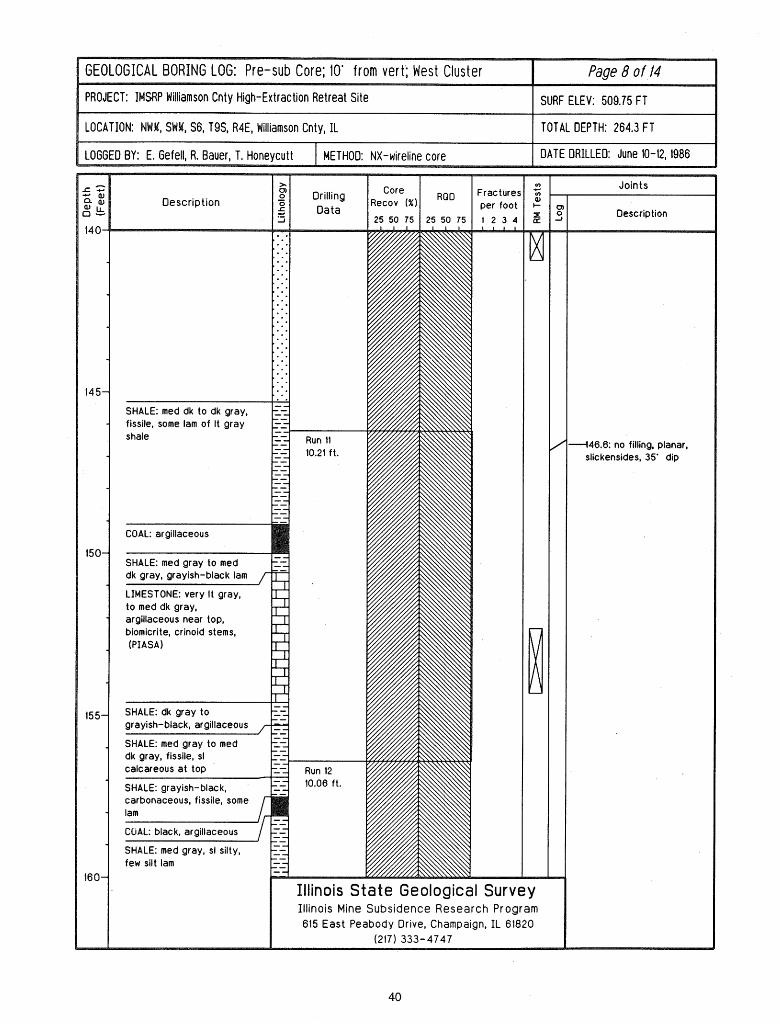
, S6, T9S, R4E, Williamson Cnty, I L 1 TOTAL DEPTH: 264.3 F-
LOGGED BY: E. Gefell. R. Bauer. T. Honevcutt I METHOD: NX-witeline core I DATE DRILLED: June 10-12,1986 1
Description 1 1 Drilling Data 1 Recov (%) I i.7 per foot
25 50 75 25 50 75 1 2 3 4
Illinois S ta te Geological Survey Illinois Mine Subsidence Research Program 615 East Peabody Drive, Champaign, I L 61820
(217) 333-4747
Joints
Description
---146.6: no filling, planar, slickensides, 35' dip
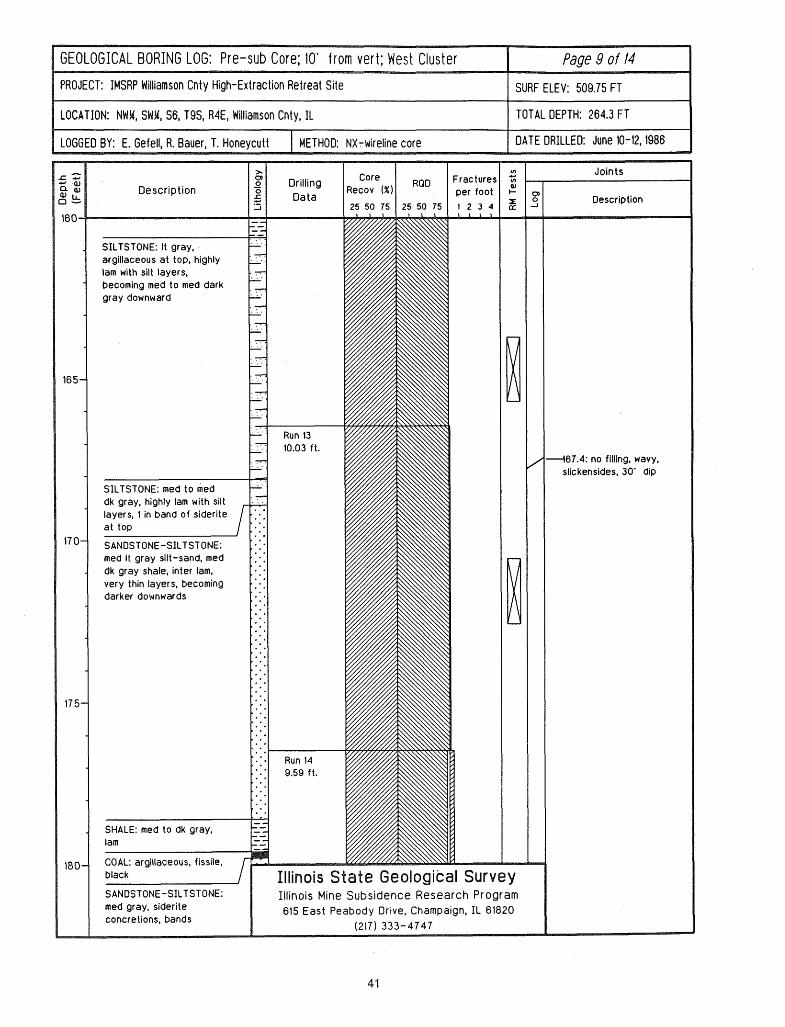
GEOLOGICAL BORING LOG: Pre-sub Core; 10' f r om ve r t ; West C lus ter Page 9 of 14 I PROJECT: IMSRP Williamson Cnty High-Extraction Retreat Site I SURF ELEV: 509.75 FT I
a, Fractures Description per foot
black I SANDSTONE-SILTSTONE: Illinois Mine Subsiden med gray, siderite 615 East Peabody Drive, Champaign, I L 61820 concretions, bands
(217) 333-4747
Joints
Description
+67.4: no filling, wavy, slickensides, 30' dip
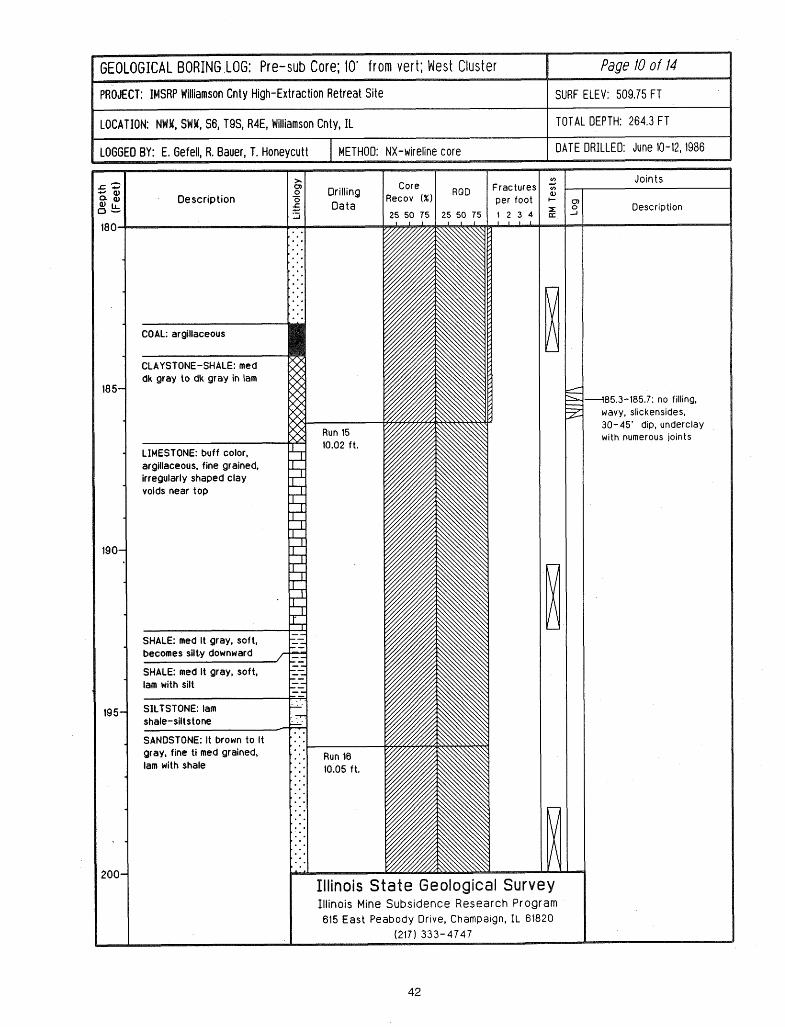
LOCATION: NWY, SHY, S6, T9S, R4E, Williamson Cnty, I L I TOTAL DEPTH: 264.3 FT
Description
COAL: argillaceous
CLAYSTONE-SHALE: med dk gray to dk gray in lam
LIMESTONE: buff color, argillaceous, fine grained, irregularly shaped clay voids near top
SHALE: med It gray, soft, becomes si1t.y downward / SHALE: med It gray, soft, lam with silt
SILTSTONE: lam shale-siltstone
/
SANDSTONE: It brown to It gray, fine ti med grained, lam with shale
~1 Drilling R e e RQD 1 Fractures per foot Data
_J 25 50 75 25 50 75 ! 2 3 4
Illinois S ta te Geolo Illinois Mine Subsidence Research Program 615 East Peabody Drive, Champaign, IL 61820
(217) 333-4747
Joints
Description
---185.3-185.7: no filling, wavy, slickensides, 30-45' dip, underclay with numerous joints
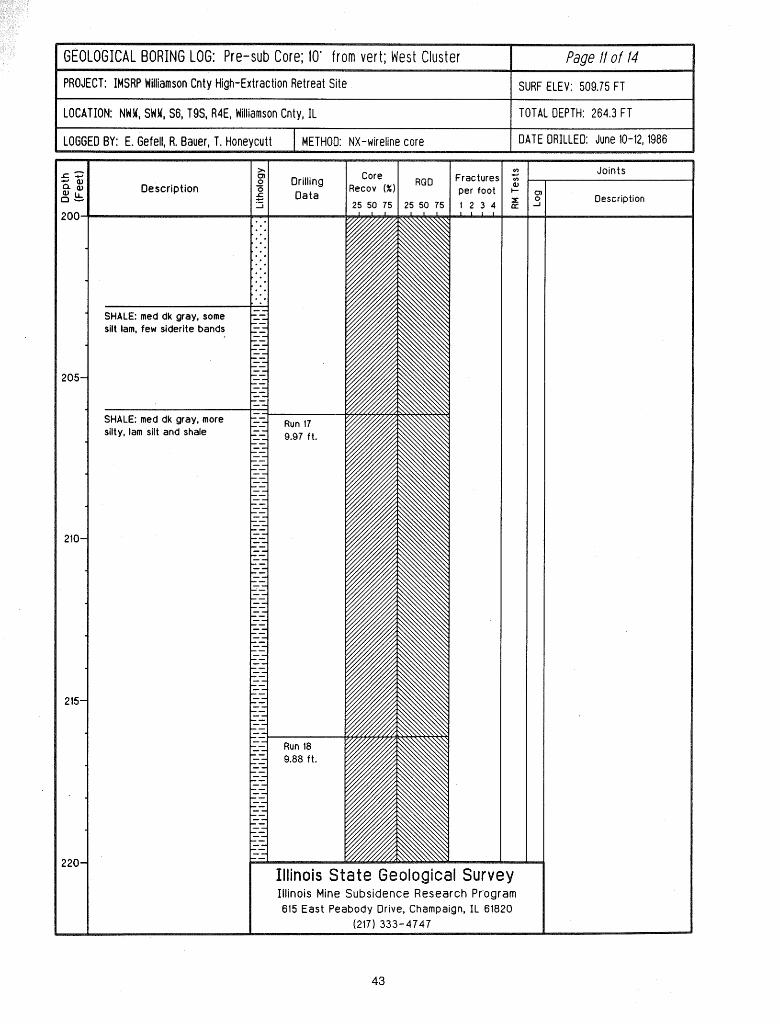
PROJECT: IMSRP Williamson Cnty High-Extraction Retreat Site I SURF ELEV: 509.75 FT
LOCATION: NWY, SWY, S6, T9S, R4E, Williamson Cnty, IL I TOTAL DEPTH: 264.3 FT
I LOGGED BY: E. Gefell, R. Bauer. T. Honeycutt I METHOD: NX-wireline core I DATE DRILLED: June 10-12,1986
Description Drilling lRe:::ell) ROO I Fracturez Data per foot
Illinois Mine Subsidence Research Pr'ogram 615 East Peabody Drive, Champaign, I L 61820
(217) 333-4747
Joints
Description

GEOLOGICAL B O R I N G LOG: Pre-sub Core; 10' from vert; Nest Cluster Page /2 of 14
PROJECT: IMSRP Williamson Cnty High-Extraction Retreat Site I SURF ELEV: 509.75 FT I I TOTAL DEPTH: 264.3 FT I
Description
615 East Peabody Orive, Champaign, I L 61820 (217) 333-4747
Joints
Description
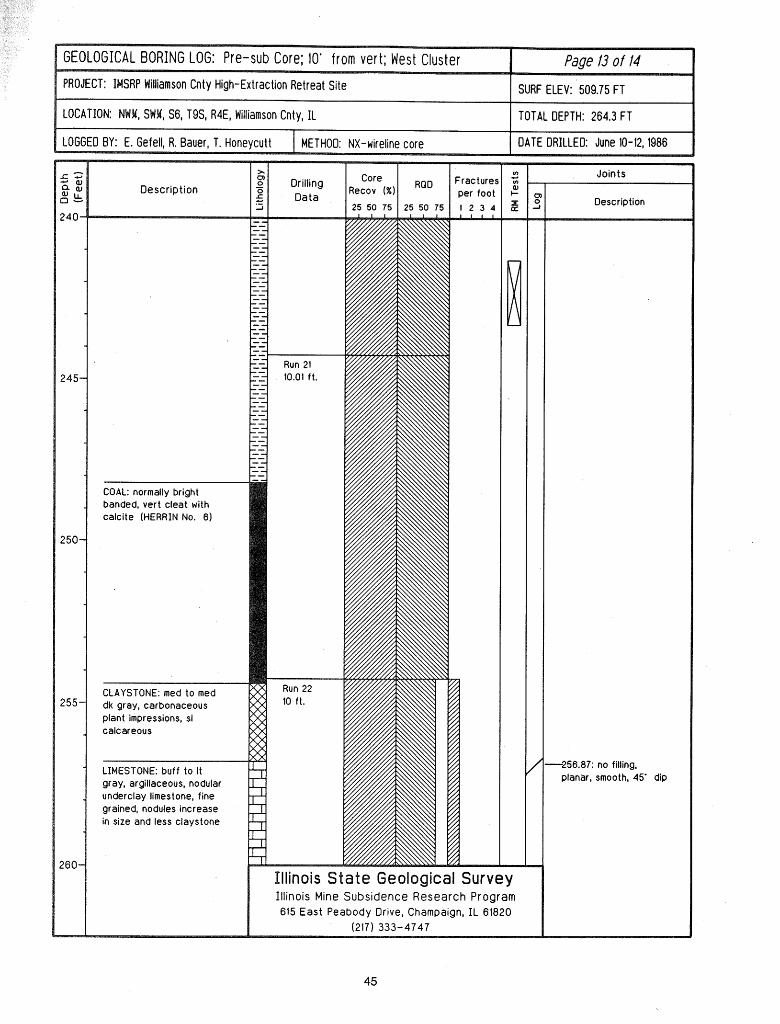
SURF ELEV: 509.75 FT
Fracture: Description per foot
TOTAL DEPTH: 264.3 FT I
tate Geological Survey Illinois Mine Subsidence Research Program 615 East Peabody Drive, Champaign, I L 61820
(217) 333-4747
Joints
Description
-256.87: no filling, planar, smooth, 45' dip
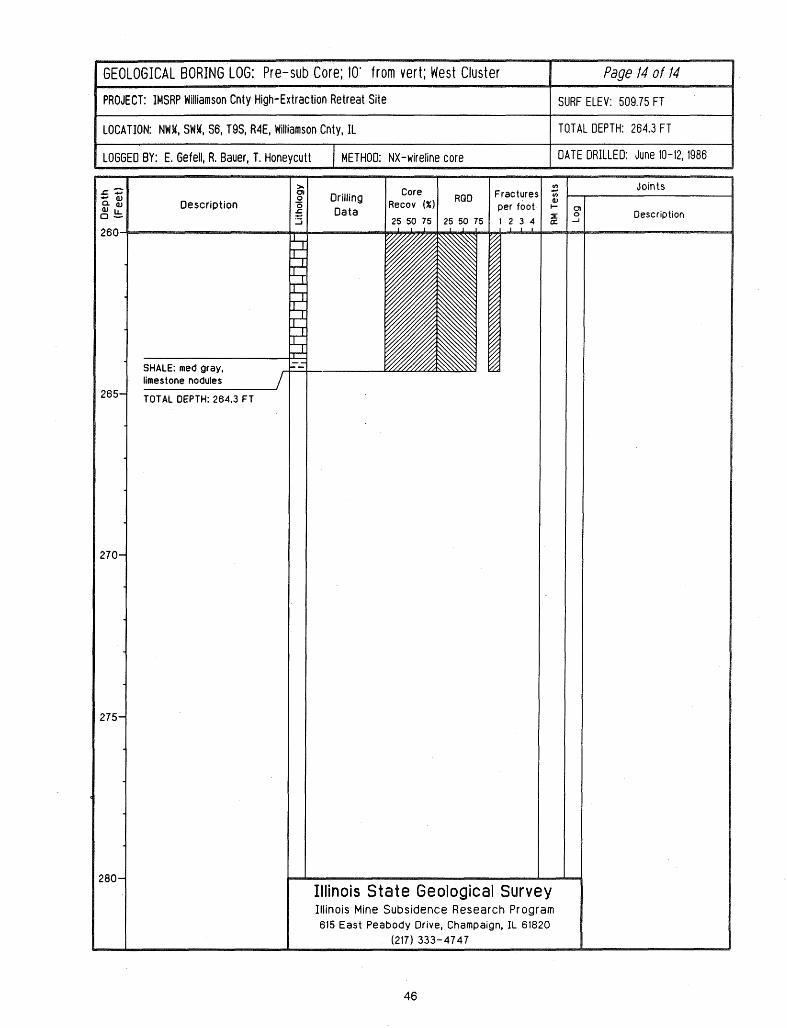
PROJECT: IMSRP Williamson Cnty High-Extraction Retreat Site 1 SURF ELEV: 509.75 FT
LOCATION: NWY, SWM, S6, T9S, R4E, Williamson Cnty, IL I TO-TAL DEPTH: 264.3 FT
LOGGED BY: E. Gefell, R. Bauer, T. Honeycutt I METHOD: NX-wireline core I DATE DRILLED: June 10-12, 1986
Description
SHALE: med gray, limestone nodules
TOTAL DEPTH: 264.3 FT
Core Fracture Drilling /Recov & I / RQQ / per fool Data
Illinois St ate Geological Survey Ill inois Mine Subsidence Research Program 615 East Peabody Drive, Champaign, I L 61820
(217) 333-4747
Joints
Oescrip tion
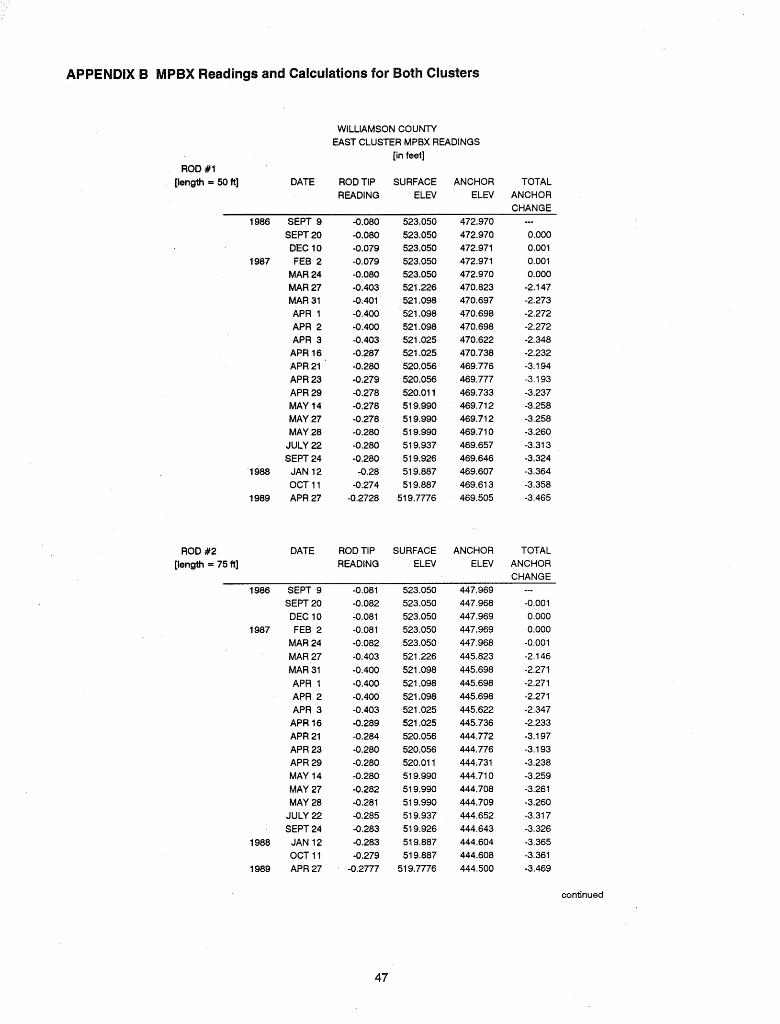
WILLIAMSON COUNTY EAST CLUSTER MPBX READINGS
[in feet]
ROD #1 [length = 50 ft] DATE RODTIP SURFACE ANCHOR TOTAL
READING ELEV ELEV ANCHOR CHANGE
1986 SEPT9 SEPT 20 DEC 10
1987 FEB 2 MAR 24 MAR 27 MAR 31 APR 1 APR 2 APR 3 APR I6 APR 21 APR 23 APR 29 MAY 14 MAY 27 MAY 28
JULY 22 SEPT 24
1988 JAN 12 OCT 1 1
1989 APR 27
ROD #2 DATE [length = 75 ft]
-0.080 -0.080 -0.079 -0.079 -0.080 -0.403 -0.401 -0.400 -0.400 -0.403 -0.287 -0.280 -0.279 -0.278 -0.278 -0.278 -0.280 -0.280 -0.280 -0.28 -0.274 -0.2728
ROD TIP READING
523.050 523.050 523.050 523.050 523.050 521.226 521.098 521.098 521.098 521.025 521.025 520.056 520.056 520.01 1 51 9.990 51 9.990 51 9.990 51 9.937 51 9.926 51 9.887 51 9.887 51 9.7776
SURFACE ELEV
472.970 472.970 472.971 472.971 472.970 470.823 470.697 470.698 470.698 470.622 470.738 469.776 469.777 469.733 469.71 2 469.71 2 469.71 0 469.657 469.646 469.607 469.61 3 469.505
ANCHOR ELEV
--- 0.000 0.001 0.001 0.000 -2.1 47 -2.273 -2.272 -2.272 -2.348 -2.232 -3.1 94 -3.1 93 -3.237 -3.258 -3.258 -3.260 -3.31 3 -3.324 -3.364 -3.358 -3.465
TOTAL ANCHOR CHANGE
1986 SEPT 9 -0.081 523.050 SEPT 20 DEC 10
1987 FEB 2 MAR 24 MAR 27 MAR 31 APR 1 APR 2 APR 3 APR 16 APR 21 APR 23 APR 29 MAY 14 MAY 27 MAY 28
JULY 22 SEPT 24
1988 JAN 12 OCT 1 1
1989 APR 27
continued
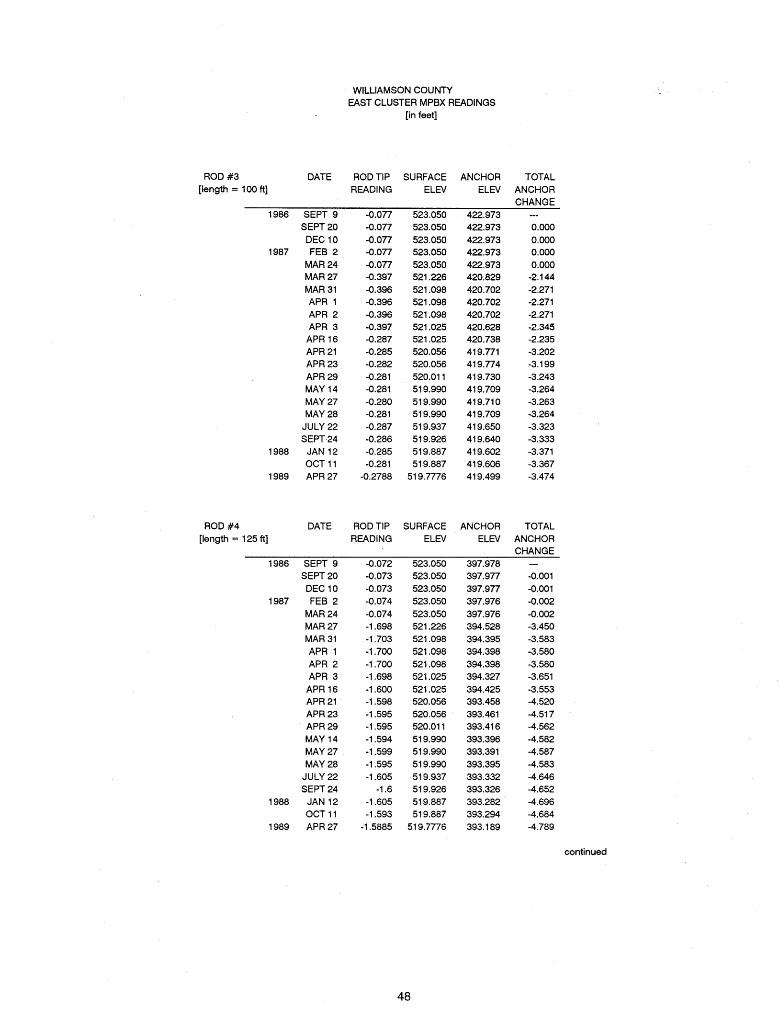
WILLIAMSON COUNTY EAST CLUSTER MPBX READINGS
[in feet]
ROD #3 DATE RODTIP SURFACE ANCHOR TOTAL [length = 100 ft] READING E L N E L N ANCHOR
CHANGE 1986 SEPT 9 -0.077 523.050 422.973
SEPT 20 DEC 10
1987 FEB 2 MAR 24 MAR 27 MAR 31 APR 1 APR 2 APR 3 APR 16 APR 21 APR 23 APR 29 MAY 14 MAY 27 MAY 28
JULY 22 SEPT 24
1988 JAN 12 OCT 11
1989 APR 27
ROD #4 DATE RODTIP SURFACE ANCHOR TOTAL [length = 125 ft] READING E L N ELEV ANCHOR
CHANGE 1986 SEPT 9 -0.072 523.050 397.978
SEPT 20 DEC 10
1987 FEB 2 MAR 24 MAR 27 MAR 31 APR 1 APR 2 APR 3
APR 16 APR 21 APR 23 APR 29 MAY 14 MAY 27 MAY 28
JULY 22 SEPT 24
1988 JAN 12 OCT 11
1989 APR 27
continued
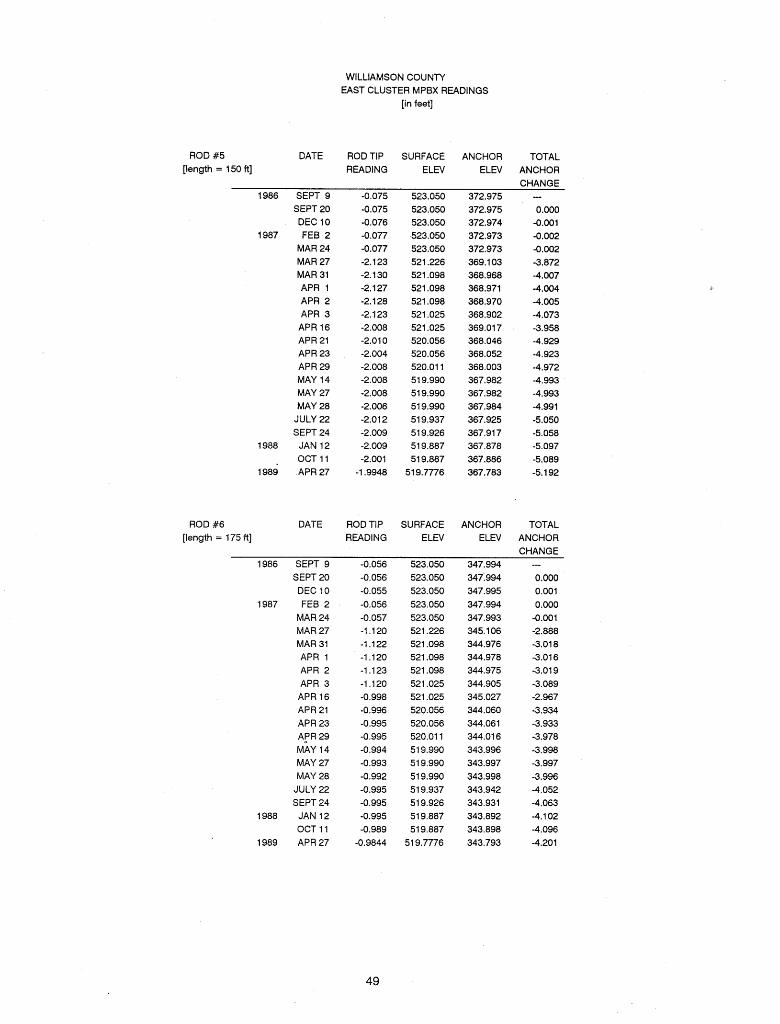
WILLIAMSON COUNTY EAST CLUSTER MPBX READINGS
[in feet]
ROD #5 [length = 150 ft]
ROD #6 [length = 175 ft]
DATE
SEPT 9 SEPT 20 DEC 10 FEB 2
MAR 24 MAR 27 MAR 31 APR 1 APR 2 APR 3 APR 16 APR 21 APR 23 APR 29 MAY 14 MAY 27 MAY 28
JULY 22 SEPT 24
JAN 12 OCT 11 APR 27
DATE
SEPT 9 SEPT 20 DEC 10 FEB 2
MAR 24 MAR 27 MAR 31 APR 1 APR 2 APR 3
APR 16 APR 21 APR 23 APR 29 MAY 14 MAY 27 MAY 28
JULY 22 SEPT 24
JAN 4 2 OCT 11 APR 27
ROD TIP READING
ROD TIP READING
SURFACE ELEV
523.050 523.050 523.050 ,523.050 523.050 521.226 521.098 521.098 521.098 521.025 521.025 520.056 520.056 520.01 1 51 9.990 519.990 51 9.990 51 9.937 51 9.926 51 9.887 51 9.887
51 9.7776
SURFACE ELEV
523.050 523.050 523.050 523.050 523.050 521.226 521.098 521.098 521.098 521.025 521.025 520.056 520.056 520.01 1 51 9.990 51 9.990 51 9.990 51 9.937 51 9.926 51 9.887 51 9.887
51 9.7776
ANCHOR
ELEV
372.975 372.975 372.974 372.973 372.973 369.1 03 368.968 368.971 368.970 368.902 369.01 7 368.046 368.052 368.003 367.982 367.982 367.984 367.925 367.91 7 367.878 367.886 367.783
ANCHOR E L N
TOTAL ANCHOR CHANGE
--- 0.000
-0.001 -0.002 -0.002 -3.872 -4.007 -4.004 -4.005 -4.073 -3.958 -4.929 -4.923 -4.972 -4.993 -4.993 -4.991 -5.050 -5.058 -5.097 -5.089 -5.1 92
TOTAL ANCHOR CHANGE
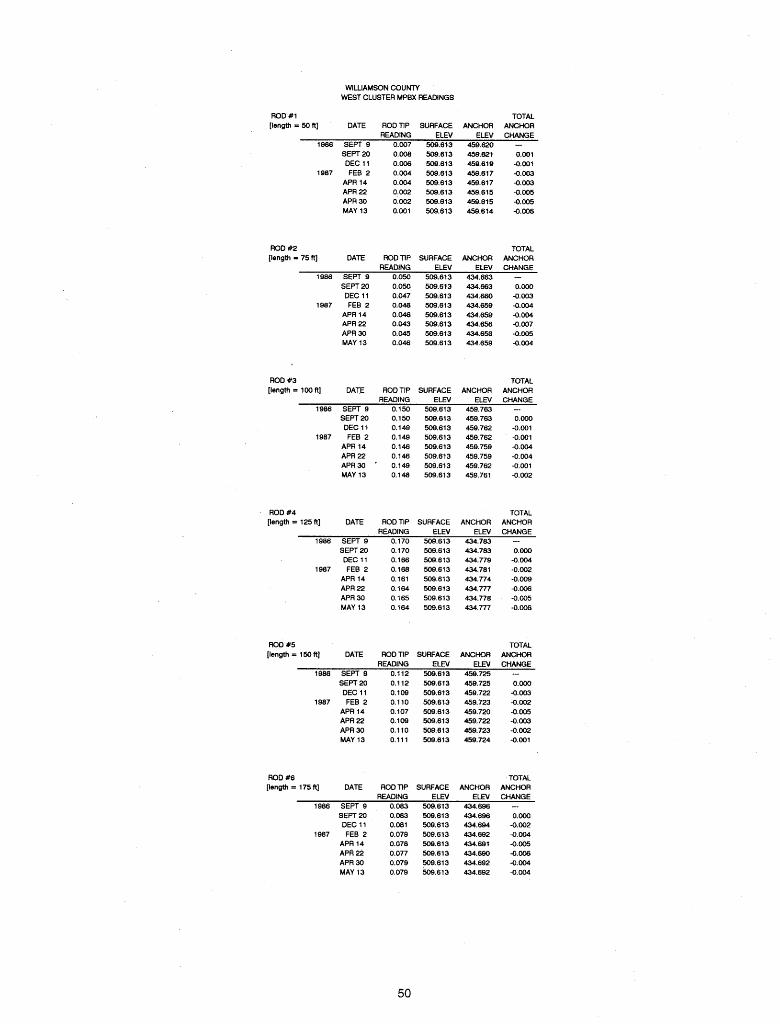
WILLIAMSON COUNTY WEST CLUSTER MPBX READINGS
ROD #I [length = 50 ft] DATE
1088 SEPT 9 SEPT 20 DEC 1 I
1987 FEB 2 APR 14 APR n APR 30 MAY 13
ROD m [length = 75 ft] DATE
1986 SEPT 9 SEPT 20 DEC 1 1
1887 FEB 2 APR 14 APR 22 APR 30 MAY 13
ROD n P READING
0.007 0.008 0.008 0.004 0.004 0.002 0.002 0.001
ROD n P READING
0.050 0.050 0.047 0.048 0.048 0.043 0.045 0.046
SURFACE E L N
509.613 509.613 509.613 509.613 509.613 509.613 509.613 509.613
SURFACE REV
509.613 509.613 509.613 508.613 509.613 506.613 509.6t3 509.613
ROD #3 [length = 100 ft] DATE ROD TIP SURFACE
READING €LEV 1966 SEPT 9 0.150 509.613
SEPT 20 0.150 509.613 DEC11 0.149 509.613
1987 FEB 2 0.149 509.613 APR 14 0.146 509.613 A P R Z 0.146 509.613 APR30 ' 0.149 509.613 MAY 13 0.148 509.613
ROD #4 [length = 125 ft] DATE
1986 SEPT 9 SEPT 20 DEC 1 1
1987 FEB 2 APR 14 APR n APR 30 MAY 13
ROD TIP READING
0. I70 0.170 0.166 0.168 0.161 0.164 0.165 0. I64
ROD #5 [length = 150 ft] DATE
1988 SEPT 9 SEPT 20 DEC 1 1
1987 FEB 2 APR 14 APR 22 APR 30 MAY 13
ROD #6 [length = 175 ft] DATE
1986 SEPT O SEPT 20 DEC 1 1
1967 FEB 2 APR 14 APR 22 APR 30 MAY 13
SURFACE E L N
509.613 509.613 509.613 509.613 509.613 508.613 509.613 509.613
ROD TIP SURFACE READING ELEV
0.112 509.613 0.1 12 509.613 0.109 509.813 0.1 10 508.613 0.107 509.613 0.108 509.613 0.110 508.813 0.111 508.613
ROD n P READING
0.083 0.083 0.081 0.079 0.078 0.077 0.079 0.079
TOTAL ANCHOR ANCHOR
E L N CHANGE 459.820 - 458.621 0.001 459.619 -0.001 459.617 -0.003 458.617 -0.003 459.615 -0.005 459.615 -0.005 459.614 -0.m
ANCHOR RRI
434.663 434.863 434.660 434.659 434.659 434.656 434.658 434.659
ANCHOR E m
459.783 459.763 459.762 459.762 459.759 459.759 459.762 459.761
TOTAL ANCHOR CHANGE - 0.000 -0.003 -0.004 -0.004 -0.007 -0.005 -0.004
TOTAL ANCHOR CHANGE
-- 0.000 -0.001 -0.001 -0.004 -0.004 -0.001 -0.002
TOTAL ANCHOR ANCHOR
E L M CHANGE 434.783 - 434.783 0.000 434.779 -0.004 434.761 -0.002 434.774 -0.009 434.777 -0.006 434.778 -0.005 434.777 -0.006
SURFACE ELEV
509.613 509.613 509.613 509.613 509.613 509.613 509.613 509.613
TOTAL ANCHOR ANCHOR
UN CHANGE 459.725 - 459.725 0.000 458.722 -0.003 459.723 -0.002 459.720 -0.005 459.722 -0.003 459.723 -0.002 459.724 -0.001
ANCHOR €LEV
434.696 434.686 434.694 434.692 434.69 1 434.690 434.692 434.692
TOTAL ANCHOR CHANGE
-- 0.000 -0.002 -0.004 -0.005 -0.006 -0.004 -0.004
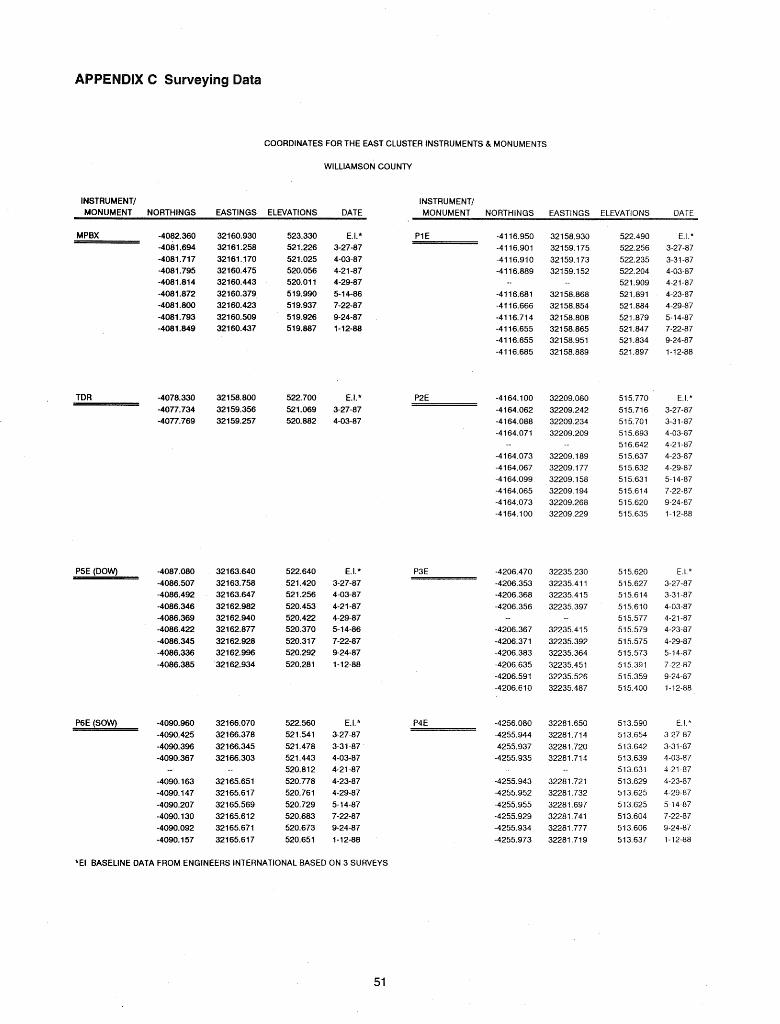
C Surveying Data
COORDINATES FOR THE EAST CLUSTER INSTRUMENTS & MONUMENTS
WILLIAMSON COUNTY
INSTRUMENT/ INSTRUMENT/ MONUMENT NORTHINGS EASTINGS ELEVATIONS DATE MONUMENT NORTHINGS EASTINGS ELNATIONS DATE
MPBX
TDR
P5E (DOW) -4087.080 -4086.507 -4086.492 -4086.346 -4086.369 -4086.422 -4086.345 -4086.336 -4086.385
P6E (SOW) -4090.960 -4090.425 -4090.396 -4090.367
-4090.163 -4090.147 -4090.207 -4090.130 -4090.092 -4090.157
E.Lt P IE 3-27-87 4-03-87 4-21 -87 4-29-87 5-1 4-86 7-22-87 9-24-87 1-12-88
*El BASELINE DATA FROM ENGINEERS INTERNATIONAL BASED ON 3 SURVEYS
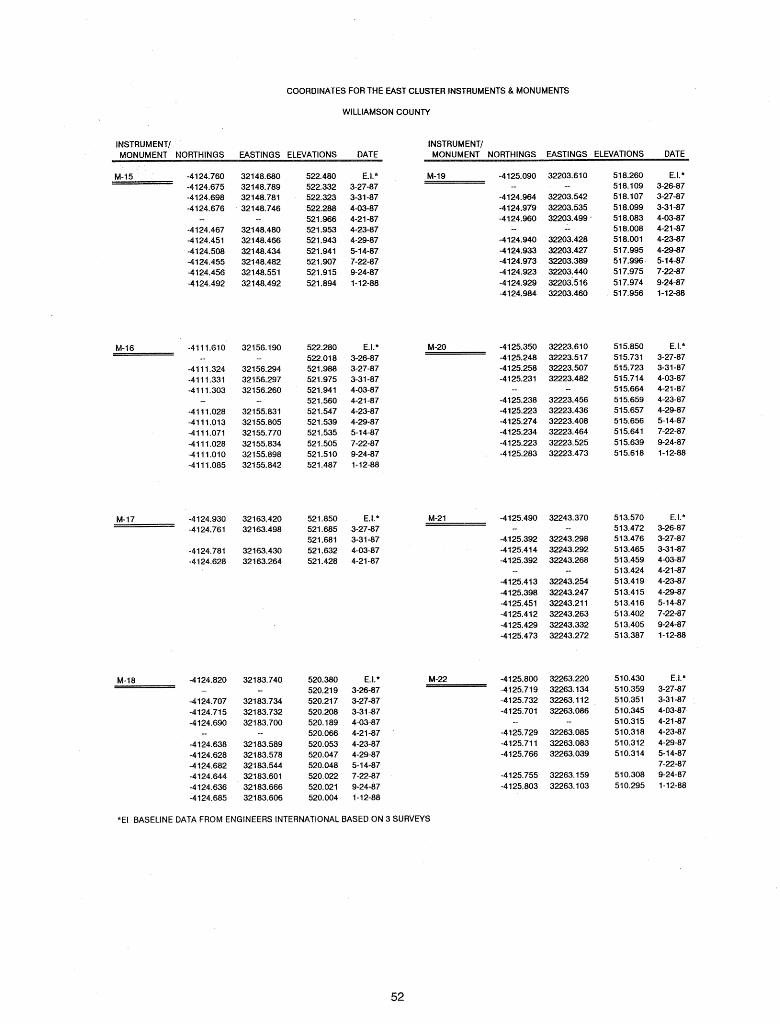
COORDINATES FOR THE EAST CLUSTER INSTRUMENTS & MONUMENTS
WILLIAMSON COUNTY
INSTRUMENT1 INSTRUMENTI MONUMENT NORTHINGS EASTINGS ELEVATIONS DATE MONUMENT NORTHINGS EASTINGS ELEVATIONS DATE
*El BASELINE DATA FROM ENGINEERS INTERNATIONAL BASED ON 3 SURVEYS

COORDINATES FOR THE EAST CLUSTER INSTRUMENTS & MONUMENTS
WILLIAMSON COUNTY
INSTRUMENTI MONUMENT NORTHINGS EASTINGS ELEVATIONS DATE
INSTRUMENTI MONUMENT NORTHINGS EASTINGS ELEVATIONS DATE
*El BASELINE DATA FROM ENGINEERS INTERNATIONAL BASED ON 3 SURVEYS
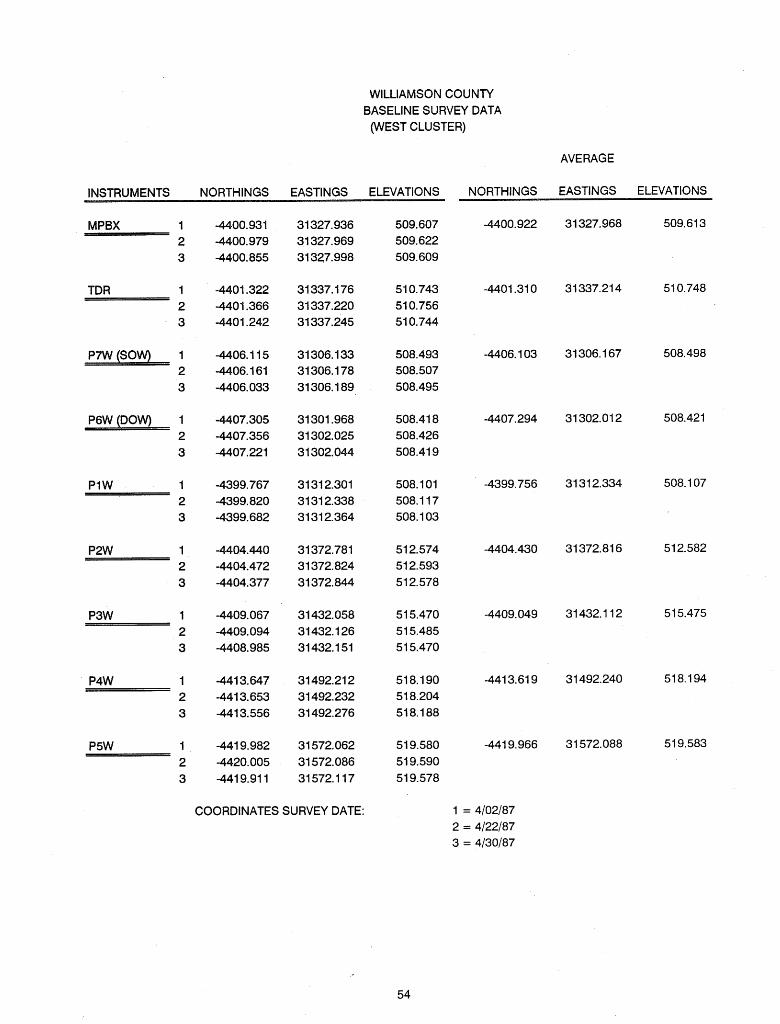
WILLIAMSON COUNTY BASELINE SURVEY DATA (WEST CLUSTER)
INSTRUMENTS NORTHINGS EASTINGS ELEVATIONS
MPBX 1 2 3
TDR I
P7W (SOW) 1 3
P6W (DOW) 1 2 3
COORDINATES SURVEY DATE:
AVERAGE
NORTHINGS EASTINGS ELEVATIONS
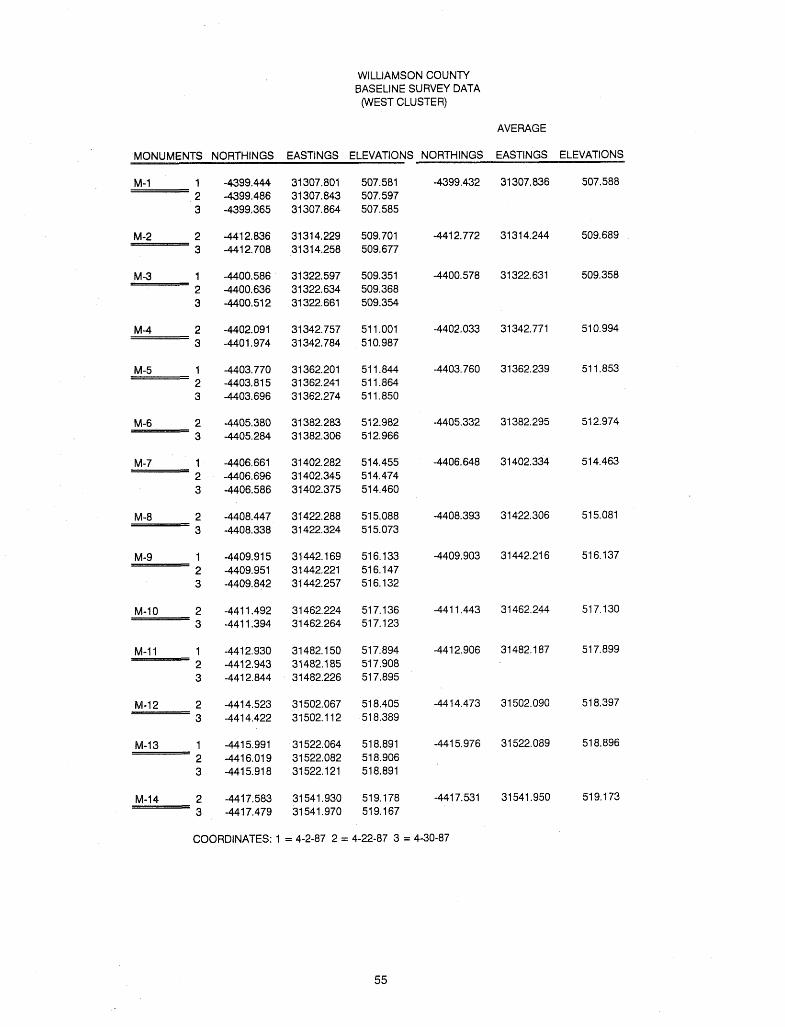
WILLIAMSON COUNTY BASELINE SURVEY DATA (WEST CLUSTER)
AVERAGE
MONUMENTS NORTHINGS EASTINGS ELEVATIONS NORTHINGS EASTINGS ELEVATIONS
COORDINATES: 1 = 4-2-87 2 = 4-22-87 3 = 4-30-87
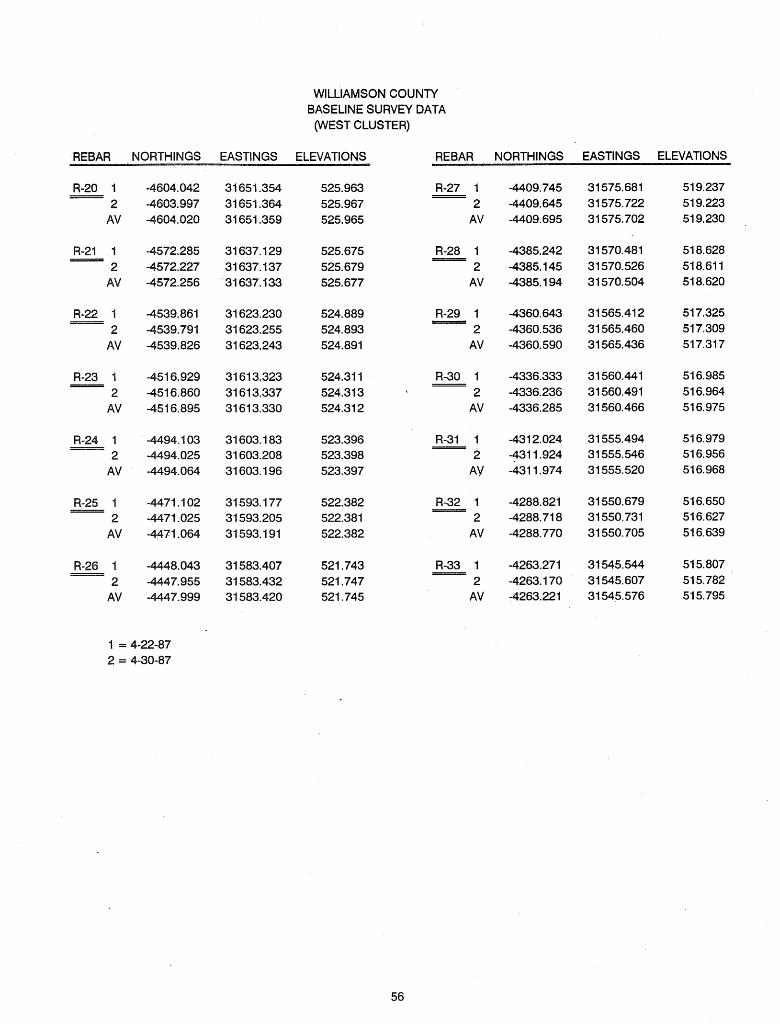
WILLIAMSON COUNTY BASELINE SURVEY DATA (WEST CLUSTER)
REBAR NORTHINGS EASTINGS ELEVATIONS REBAR NORTHINGS EASTINGS ELEVATIONS
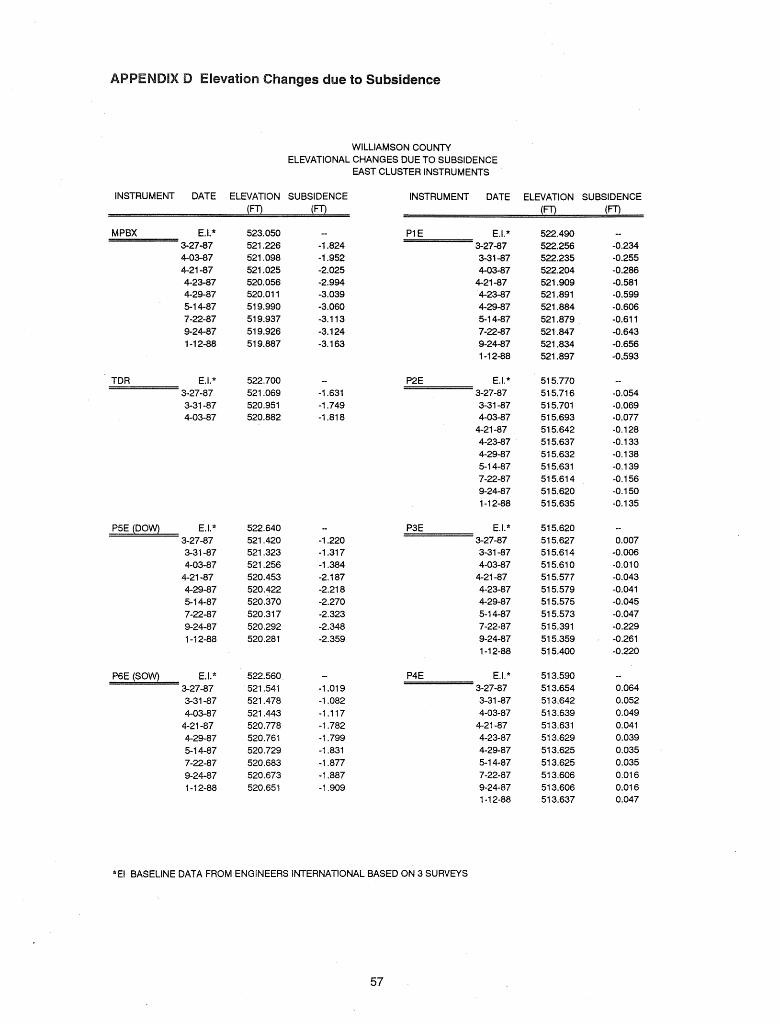
WILLIAMSON COUNTY ELNATIONAL CHANGES DUE TO SUBSIDENCE
EAST CLUSTER INSTRUMENTS
INSTRUMENT DATE ELEVATION SUBSIDENCE INSTRUMENT DATE ELEVATION SUBSIDENCE
MPBX E.La 3-27-87
TDR El .* 3-27-87 3-31 -87 4-03-87
P5E (DOW) E.I.* 3-27-87 3-3 1 -87 4-03-87
4-21 -87 4-29-87 5 1 4-87 7-22-87 9-24-87 1-1 2-88
P6E (SOW) El.* 3-27-87 3-31 -87 4-03-87
4-21 -87 4-29-87 5-1 4-87 7-22-87 9-24-87 1-1 2-88
*El BASELINE DATA FROM ENGINEERS INTERNATIONAL BASED ON 3 SURVEYS
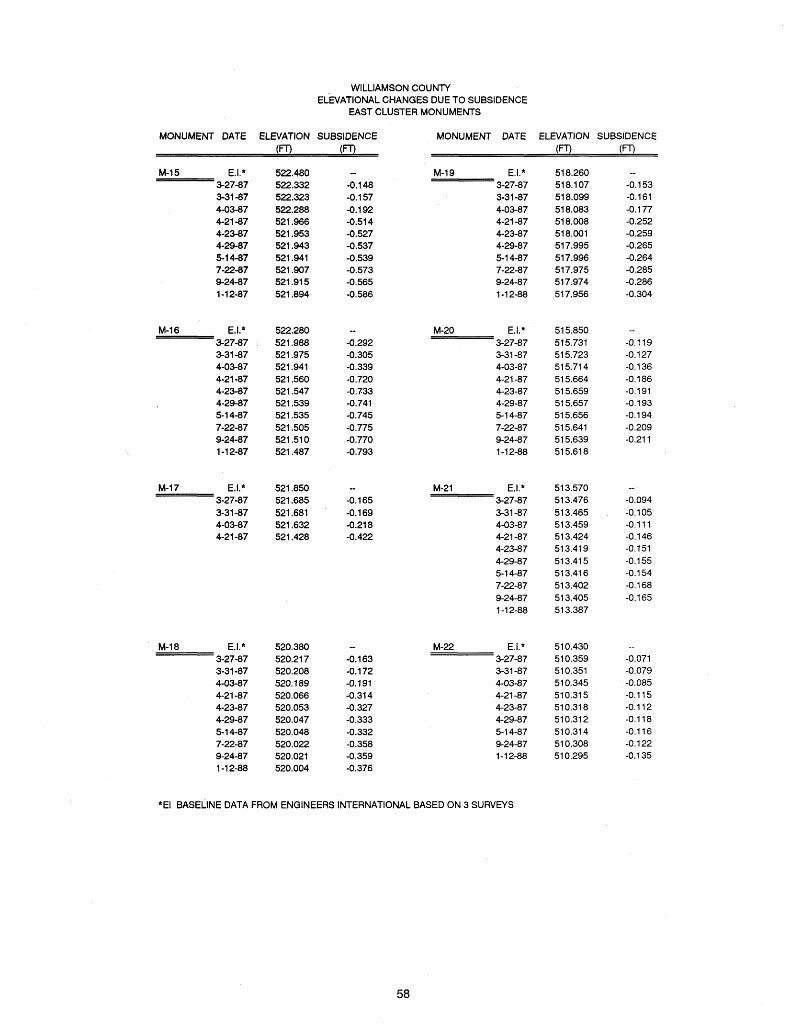
WILLIAMSON COUNTY ELNATIONAL CHANGES DUE TO SUBSIDENCE
EAST CLUSTER MONUMENTS
MONUMENT DATE ELEVATION SUBSIDENCE MONUMENT DATE ELNATION SUBSIDENCE (FT) (FT) (m (m
*El BASELINE DATA FROM ENGINEERS INTERNATIONAL BASED ON 3 SURVEYS
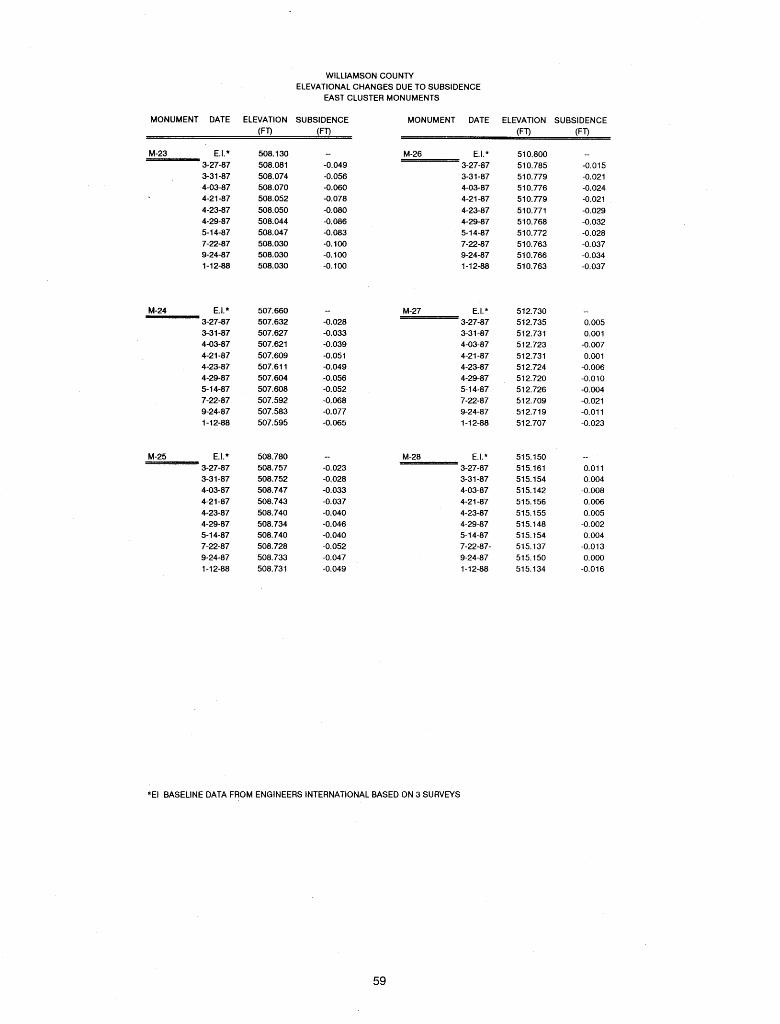
WILLIAMSON COUNTY ELNATIONAL CHANGES DUE TO SUBSIDENCE
EAST CLUSTER MONUMENTS
MONUMENT DATE ELEVATION SUBSIDENCE MONUMENT DATE ELEVATION SUBSIDENCE
M-26 E.I.' 3-27-87 3-31 -87 4-03-87 4-21 -87 4-23-87 4-2487 5-14-87 7-22-87 9-24-87 1-12-68
*El BASELINE DATA FROM ENGINEERS INTERNATIONAL BASED ON 3 SURVEYS
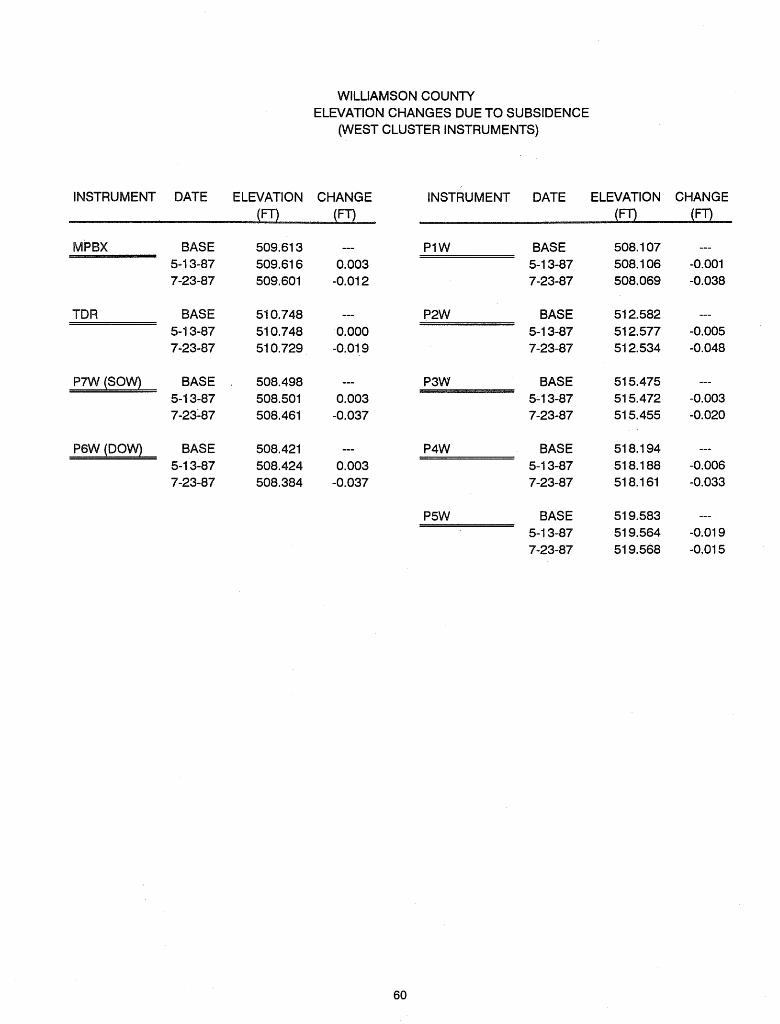
WILLIAMSON COUNTY ELEVATION CHANGES DUE TO SUBSIDENCE
(WEST CLUSTER INSTRUMENTS)
INSTRUMENT DATE ELEVATION CHANGE
MPBX BASE 5-1 3-87 7-23-87
BASE 5-1 3-87 7-23-87
BASE .
BASE
INSTRUMENT DATE ELEVATION CHANGE
P1W BASE 5-1 3-87 7-23-87
P2W BASE 5-1 3-87 7-23-87
P3W BASE 5-1 3-87 7-23-87
P4W BASE 5-1 3-87 7-23-87
P5W BASE 5-1 3-87

WILLIAMSON COUNTY ELEVATION CHANGES DUE TO SUBSIDENCE
EST CLUSTER MONUMENTS)
MONUMENT DATE ELEVATION CHANGE (rn (rn
M-8 BASE 5-1 3-87
M-9 BASE
M-1 0 BASE 5-1 3-87 7-23-87
M-11 BASE 5-1 3-87 7-23-87
M-12 BASE 5-1 3-87 7-23-87
M-13 BASE 5-1 3-87 7-23-87
M-1 BASE 5-1 3-87 7-23-87
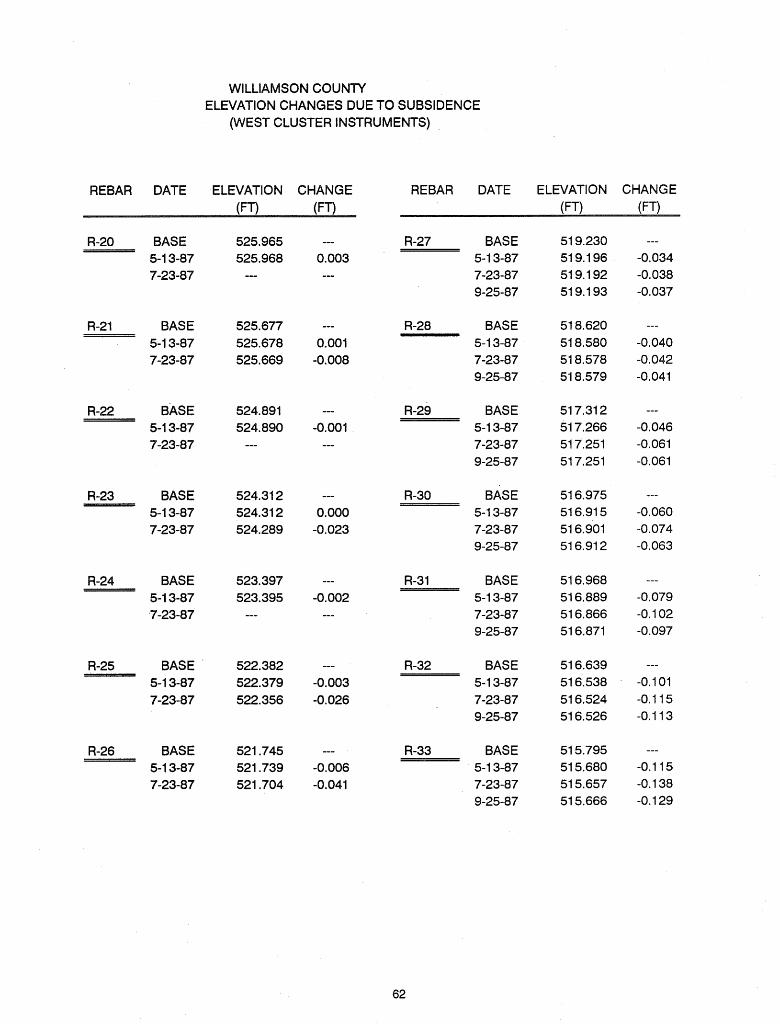
WILLIAMSON COUNTY ELEVATION CHANGES DUE TO SUBSIDENCE
(WEST CLUSTER INSTRUMENTS)
REBAR DATE ELEVATION CHANGE (rn (rn
REBAR DATE ELEVATION CHANGE (FT) (FT)
R-20 - BASE 5-1 3-87 7-23-87
R-21 BASE 5-1 3-87 7-23-87
R-22 BASE 5-1 3-87 7-23-87
R-23 - BASE 5-1 3-87 7-23-87
R-24 BASE 5-1 3-87 7-23-87
R-25 BASE 5-1 3-87 7-23-87
R-26 BASE 5-1 3-87 7-23-87
R-27 BASE
R-28 BASE 5-1 3-87 7-23-87 9-25-87
R-29 BASE
R-30 BASE 5-1 3-87
R-31 BASE 5-1 3-87 7-23-87 9-25-87
R-32 BASE 5-1 3-87 7-23-87
R-33 BASE 5-1 3-87 7-23-87 9-25-87

ILLINOIS MINE SUBSIDENCE RESEARCH PROGRAM WILLIAMSON COUNW SITE
PIEZOMETERS IN THE EAST INSTRUMENT CLUSTER WATER LEVEL READINGS
WELL DESIGNATION TOP OF WELL ELEVATION (FT)
WELL DEPTH (FT)
- -
YEAR 1986
1987
1988
1989
- --
DATE July 31 Sept 9 Sept 12 Sept 20 Oct 3 Nov 20 Dec 11 Feb 2 Mar 23 Mar 24
Mar 26 Mar 27
Mar 30 Apr 1 Apr 2 Apr 3
Apr 16 Apr 21 Apr 23 Apr 29 May 14 May 27 July 22 Sept 24 Jan 12 May 16 Oct 11 Dec 6
Denotes well
GLACIAL DRIFT WELLS
ConE PIE P2E P3E P4E
1 1.40 12.85 14.00 12.95 13.10 14.20
--- 12.20 10.29 ---
10.31 10.44 10.43
--- 10.28 10.39
--- ---
9.78 9.49 9.60 9.90
11.44 12.12 15.57 16.32 76.50 14.55
--- 17
and dry
31.37 28.42 28.54 29.89 29.82 30.1 0 30.15 30.10 DRY DRY DRY DRY DRY DRY DRY DRY DRY DRY DRY DRY
this del
DEPTt DRY
15.80 DRY
15.80 15.85 DRY DRY DRY DRY ---
"SUBSIDI DRY DRY DRY DRY DRY DRY DRY DRY DRY DRY DRY DRY DRY DRY DRY DRY DRY DRY DRY DRY
DRY DRY
16.15 16.15 DRY DRY DRY
16.60
C E EVENT" DRY DRY DRY DRY DRY DRY DRY DRY
16.64 DRY DRY DRY DRY DRY DRY DRY DRY DRY DRY DRY
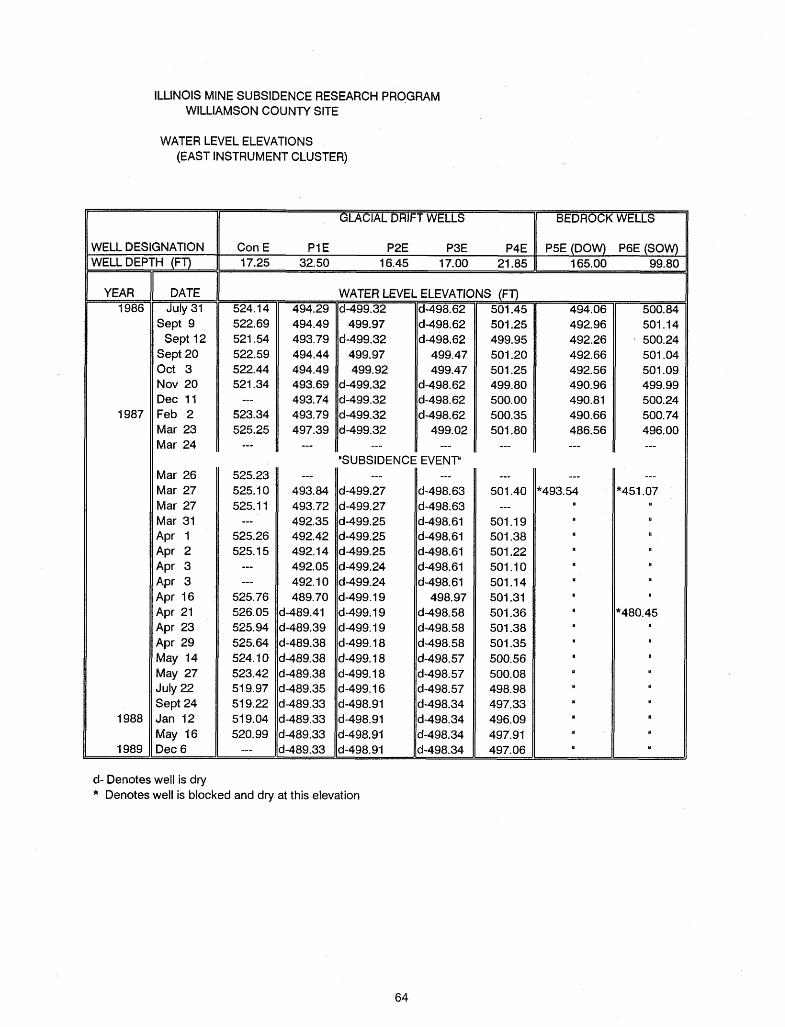
ILLINOIS MINE SUBSIDENCE RESEARCH PROGRAM WILLIAMSON COUNTY SITE
WATER LEVEL ELEVATIONS (EAST INSTRUMENT CLUSTER)
WELL DESIGNATION
YEAR 1986
1987
1988
1989
DATE July 31
Sept 9 Sept 12
Sept 20 Oct 3 Nov 20 Dec 11 Feb 2 Mar 23 Mar 24
Mar 26 Mar 27 Mar 27 Mar 31 Apr 1 Apr 2 Apr 3 Apr 3 Apr 16 Apr 21 Apr 23 Apr 29 May 14 May 27 July 22 Sept 24 Jan 12 May 16 Dec 6
WELL DEPTH (FT)
IL
, ,
1
1
1
1
I I 1
I 1
1
I I - - -
GLACIAL DRIFT WELLS BEDROCK WELLS
Con E PIE P2E P3E P4E P5E (DOW) P6E (SOW) 17.25 32.50 16.45 17.00 21.85 1 65.00 99.80
WATER LEVEL ELEVATIC 494.29 d-499.32 d-498.62 494.49 499.97 d-498.62 493.79 d-499.32 d-498.62 494.44 499.97 499.47 494.49 499.92 499.47 493.69 d-499.32 d-498.62 493.74 d-499.32 d-498.62 493.79 d-499.32 d-498.62 497.39 d-499.32 499.02
--- --- ---
"SUBSIDENCE EVENT"
d- Denotes well is dry * Denotes well is blocked and dry at this elevation
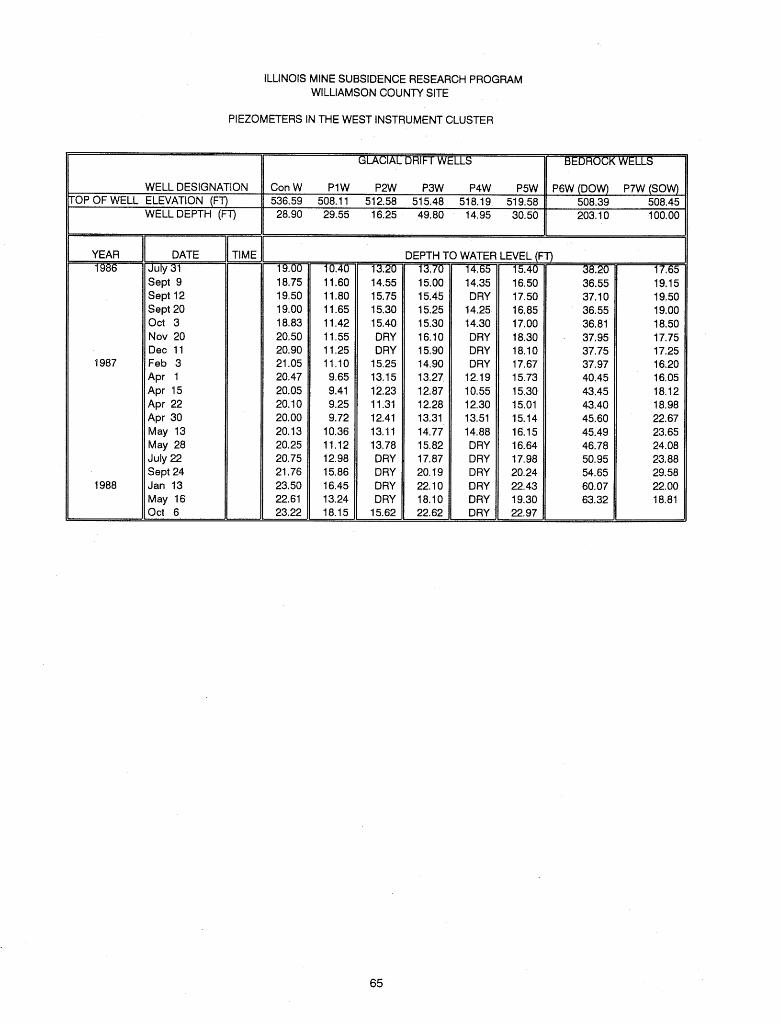
ILLlNOlS MINE SUBSIDENCE RESEARCH PROGRAM WILLIAMSON COUNTY SITE
PIEZOMETERS IN THE WEST INSTRUMENT CLUSTER
WELL DESIGNATION -0P OF WELL ELEVATION (FT)
WELL DEPTH (FT)
YEAR T
1987
1988
DATE July 31 Sept 9 Sept 12 Sept 20 Oct 3 Nov 20 Dec 11 Feb 3 Apr 1 Apr 15 Apr 22 Apr 30 May 13 May 28 July 22 Sept 24 Jan 13 May 16 Oct 6
GLACIAL DHIt i WtLLS I 7 Con W P1W P2W P3W P4W P5W P6W (DOW) P7W (SOW) 536.59 508.1 1 512.58 515.48 51 8.19 519.58 508.39 508.45 28.90 29.55 16.25 49.80 14.95 30.50 203.1 0 1 00.00
IJ120 14.55 15.75 15.30 15.40 DRY DRY
15.25 13.15 12.23 11.31 12.41 13.11 13.78 DRY DRY DRY DRY
15.62
14.65 14.35 DRY
14.25 14.30 DRY DRY DRY
12.19 10.55 12.30 13.51 14.88 DRY DRY DRY DRY DRY DRY
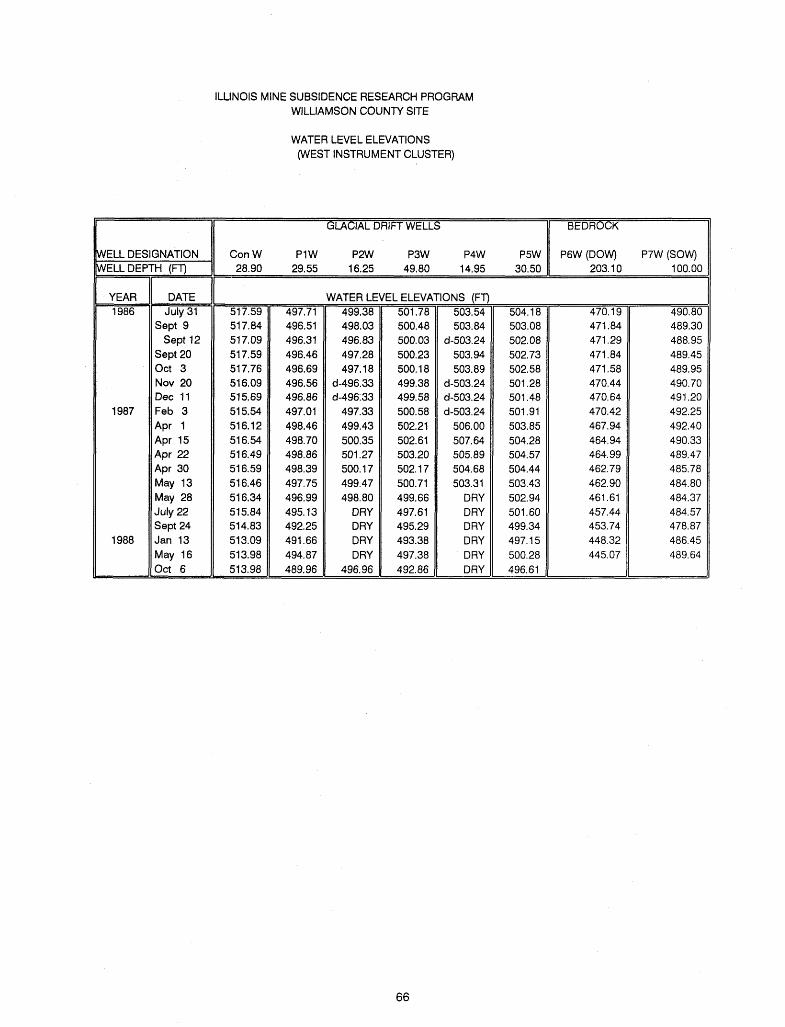
ILLINOIS MINE SUBSIDENCE RESEARCH PROGRAM WILLIAMSON COUNN SITE
VELL DESIGNATION VELL DEPTH cm
YEAR 1986
1987
1988
1 1 DATE July 31
Sept 9 Sept 12
Sept 20 Oct 3 Nov 20 Dec 11 Feb 3 Apr 1 Apr 15 Apr 22 Apr 30 May 13 May 28 July 22 Sept 24 Jan 13 May 16 Oct 6
WATER LEVEL ELEVATIONS (WEST INSTRUMENT CLUSTER)
GLACIAL DRIFT WELLS
NATER LE 499.38 498.03 496.83 497.28 497.1 8
d-496.33 d-49633
497.33 499.43 500.35 501.27 500.17 499.47 498.80
DRY DRY DRY DRY
496.96
BEDROCK
Con W PI W P2W P3W P4W P5W 28.90 29.55 16.25 49.80 14.95 30.50
EL ELEVC 501 -78 500.48 500.03 500.23 500.1 8 499.38 499.58 500.58 502.21 502.61 503.20 502.1 7 500.71 499.66 497.61 495.29 493.38 497.38 492.86
P6W (DOW) P7W (SOW) 203.10 100.00
ONS (FT 503.54 503.84
d-503.24 503.94 503.89
d-503.24 d-503.24 d-503.24
506.00 507.64 505.89 504.68 503.31
DRY DRY DRY DRY DRY DRY =
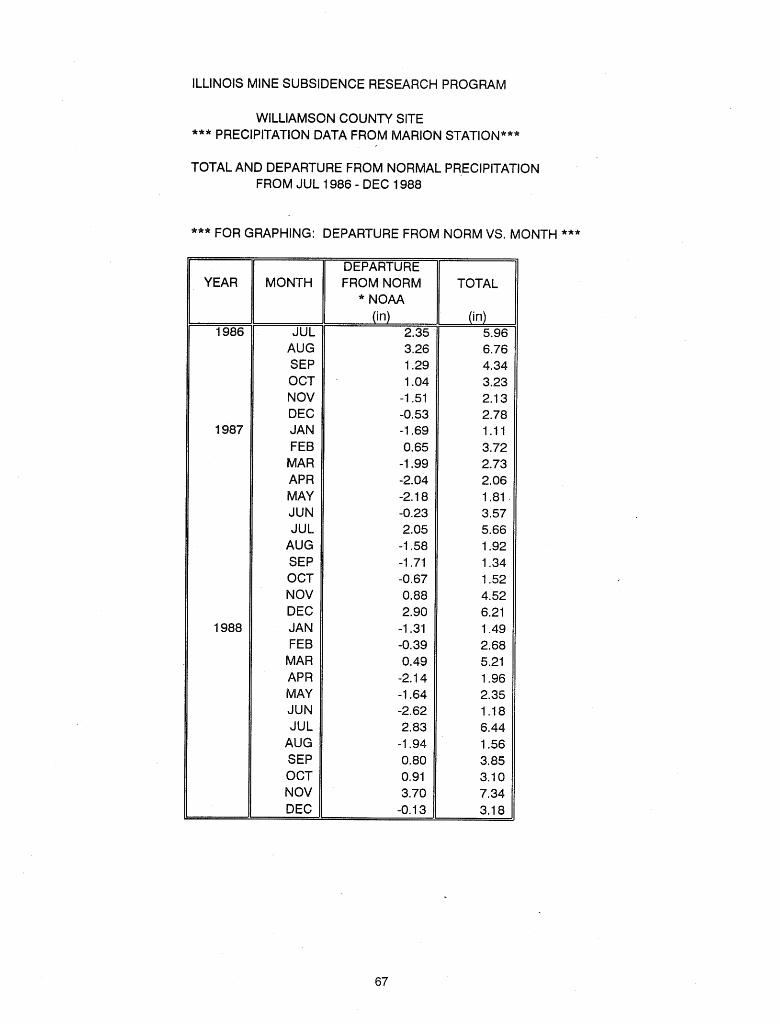
ILLINOIS MINE SUBSIDENCE RESEARCH PROGRAM
WILLIAMSON C O U N T SITE *** PRECIPITATION DATA FROM MARION STATION***
TOTAL AND DEPARTURE FROM NORMAL PR,EClPlTATlON FROM JUL 1986 - DEC 1988
*** FOR GRAPHING: DEPARTURE FROM NORM VS. MONTH ***
MONTH
JUL AUG SEP ocl- NOV DEC JAN FEB
MAR APR MAY JUN JUL
AUG SEP OCT NOV DEC JAN FEB MAR APR MAY JUN JUL
AUG SEP OCT NOV DEC
DEPARTURE FROM NORM
* NOAA (in)
2.35
TOTAL
(in) 5.96 6.76 4.34 3.23 2.1 3 2.78 1 .I 1 3.72 2.73 2.06 1.81 3.57 5.66 1.92 1.34 1.52 4.52 6.21 1.49 2.68 5.21 1.96 2.35 1 .I8 6.44 1.56 3.85 3.1 0 7.34 3.1 8