Embed Size (px)
Citation preview
TD Economics
http://economics.td.com
Quarterly Economic Forecast
SummaryGlobal economy: At a crossroads• TheglobaleconomyhasbeenunfoldinglargelyaswehadanticipatedinMarch.Followinglastyear’ssteepdeceleration,
high-frequencyindicatorssuggestthatglobalgrowthhasstabilized,albeitatabelow-trendrateofjustabove3%.
• Nextyear,however,thegrowthoutlookhasbeendowngradedby0.2percentagepointsto3.3%,inpartreflectingtherecentescalationintradetensions.
• Signsofbottomingingrowthhavereflectedamixof factors.Recenttrade-inducedgyrationsaside,globalfinancialconditionshaveeasedbroadly,driveninpartbyexpectationsoflowerpolicyrates.Thisandotherstimulusmeasures–notablyinChina–havesupportedafirmingineconomicactivity.GreenshootshaveappearedacrossemergingAsiaaswellasanumberofadvancedeconomies,includingcoreEuropeandCanada.
• Theoverallpicturemasksacontinueddivergencebetweenmanufacturingandservicesectors.Globalmanufacturingactivityremainsinthedoldrums,largelyrelatedtotradeuncertaintyandtheknock-oneffectsofdecliningautoproduc-tioninEurope.Incontrast,serviceindustrieshaveremainedcomparativelyresilient,particularlyinadvancedeconomies.
June 17, 2019
Tariffs Impart a Chill Wind on Green Shoots
ChaptersGlobal Outlook ..............................................................3U.S. Outlook ..................................................................6Canadian Outlook .........................................................8
Forecast TablesInterest Rate Outlook ................................................... 11Exchange Rate Outlook ............................................... 11Commodity Price Outlook............................................ 11Canadian Economic Outlook ........................................12U.S. Economic Outlook ................................................13Global Economic Outlook ............................................14Economic Indicators: G-7 & Europe ..............................14
• Tradetensionsrepresentaclearandpresentdangertotheglobal economy.Ouroutlookembeds tariffs thathavealreadybeenimplemented,butthethreatoffur-theractions–andthepotentialforanunexpectedse-vereboutofriskaversion–remainkeydownsideriskstotheforecast.
U.S. economy: Outperformance, but risks loom• U.S.economicgrowthoutperformedexpectationsear-
lyin2019.RealGDPadvancedata3.1%(annualized)paceinthefirstquarter,boostedbytemporaryfactorsincludingasignificantinventorybuild.Withsomere-versal,growthisexpectedtoslowinQ2.Still,thefirsthalfoftheyearistracking2.5%,roughlyahalfaper-centagepointaboveourpriorexpectation.
Contributing Authors■ Leslie Preston, Senior Economist | 416-983-7053■ Brian DePratto, Senior Economist | 416-944-5069■ James Orlando, Senior Economist | 416-413-3180
■ Beata Caranci, Chief Economist | 416-982-8067■ Derek Burleton, Deputy Chief Economist | 416-982-2514■ James Marple, Director | 416-982-2557■ Fotios Raptis, Senior Economist | 416-982-2556

2
http://economics.td.com
• This places the 2019 annual average at 2.6% (previ-ously2.4%).Economicgrowthisexpectedtoslowto1.8%in2020,ascapacityconstraintsbind.
• TheWhiteHousehasraiseditstariffratefrom10%to25%onthesecondtrancheofChineseimportssubjecttotariffs.Takenbyitself,theimpactislikelytoberela-tivelysmall(weestimateadragifalittleover0.1per-centagepoints),butmuchwilldependonhowspend-ingandinvestmentreacttothecontinuedratchetingup of trade conflicts. Manufacturing sentiment hasalreadybeguntoconvergetolowerlevelsseenabroad.Thisraisestheprospectthatanotherroundoftariffac-tioncouldhavea larger impactoneconomicgrowthandsentimentrelativetolastyearwhenbothwereathigherstartingpoints.
• Marketshaverecentlypricedasmanyasfourratecutsbetweennowandtheendof2020.Thisaggressivepo-sitioning reflects worries of further tariff escalationalongsidelowinflationandslowingeconomicgrowth(bothgloballyanddomestic).Webelieve themarkethasover-pricedtheextentofaccommodationtheFedwillultimatelyneedorbewillingtoprovideabsentasignificantdeteriorationintheeconomicdata.How-ever, the persistent elevated risk environment opensthedoor for thecentralbankto takeariskmanage-mentapproachandprovideamodestaccommodation(50basispointsincuts)laterthisyearas“insurance”.
• We expect some semblance of a dealwithChina tooccurthisyear.Criticaltothisoutcomewillbedevel-opments that occur from discussions betweenPresi-dentTrumpandPresidentXiattheG-20meetingattheendofJune.However,evenintheeventofatradedeal, it’sunclearat this stagewhether theweightonthe economy and market sentiment would fully lift.Importantlyfortheformer,adealwouldneedtoun-windthe25%tariffsplacedonChinainMay.Inad-dition,globaltradeconcernsmayquicklyreturntothespotlightwithTrumphavingalreadysignaledadesiretoquicklypivottoEurope(alargerexportmarketfortheU.S.).
Canada economy: Between a rock and a hard place • Canada’seconomyhasbeenmiredinasoftpatch,with
realGDPgrowingjust0.4%(annualized)inthefirstquarter,following0.3%inthefinalquarterof2018.
• Theweaknessinbroadoutputtrendshasconcealedabetter storyunderneath the surface.Notably,domes-ticdemand (spendingbyhouseholdsandbusinesses)rebounded in Q1 and the job market has remainedresilient.However,theexternalbackdropcontinuestodeteriorateinthewakeofongoingtradedisputes.
• WeexpectthegapbetweensoftrealGDPgrowthandrobustjobgrowthtocloseoverthenextfewquarters,as output growth picks up somewhatwhile employ-menteasestoamoresustainablepace.For2019asawhole,weanticipatea1.3%realGDPexpansion,whiletheunemploymentrateremainsbelowthe6%mark.
• It isnotassured that theBankofCanadawill followtheFederalReserveintheeventofratecuts,asmarketssooftenexpect.Absentclearevidenceofdomesticeco-nomicdeterioration, easing inCanada isunlikely.Weholdthisviewforseveralreasons.First,afteranextend-edsoftpath,thedomesticdataiscominginbetterthanexpectedinQ2,tracking2%.ThisisabovetheBankofCanada’sexpectation.Second,housingisshowingsignsofstabilization,andtheBankwillwanttoavoidtheriskofre-fuellingleveragedynamics.Third,thepolicyrateisalreadylowerrelativetosouthoftheborder.
2018 2019F 2020F
Real GDP (annual % change)
Canada 1.9 1.3 1.7
U.S. 2.9 2.6 1.8
Canada (rates, %)
Overnight Target Rate 1.75 1.75 1.75
2-yr Govt. Bond Yield 1.86 1.55 1.75
10-yr Govt. Bond Yield 1.96 1.65 1.95
U.S. (rates, %)
Fed Funds Target Rate 2.50 2.00 2.00
2-yr Govt. Bond Yield 2.48 2.00 2.20
10-yr Govt. Bond Yield 2.69 2.30 2.55
WTI, $US/bbl 59 59 62
Exchange Rate (USD per CAD) 0.73 0.77 0.77F: Forecast by TD Economics, June 2019; Forecasts for oil price, exchange rate and yields
are end-of-period. Source: Bloomberg, Bank of Canada, U.S. Federal Reserve.
Economic & Financial Forecasts
3
@TD_Economicshttp://economics.td.com
Global Outlook• Economic growth around the world has evolved in
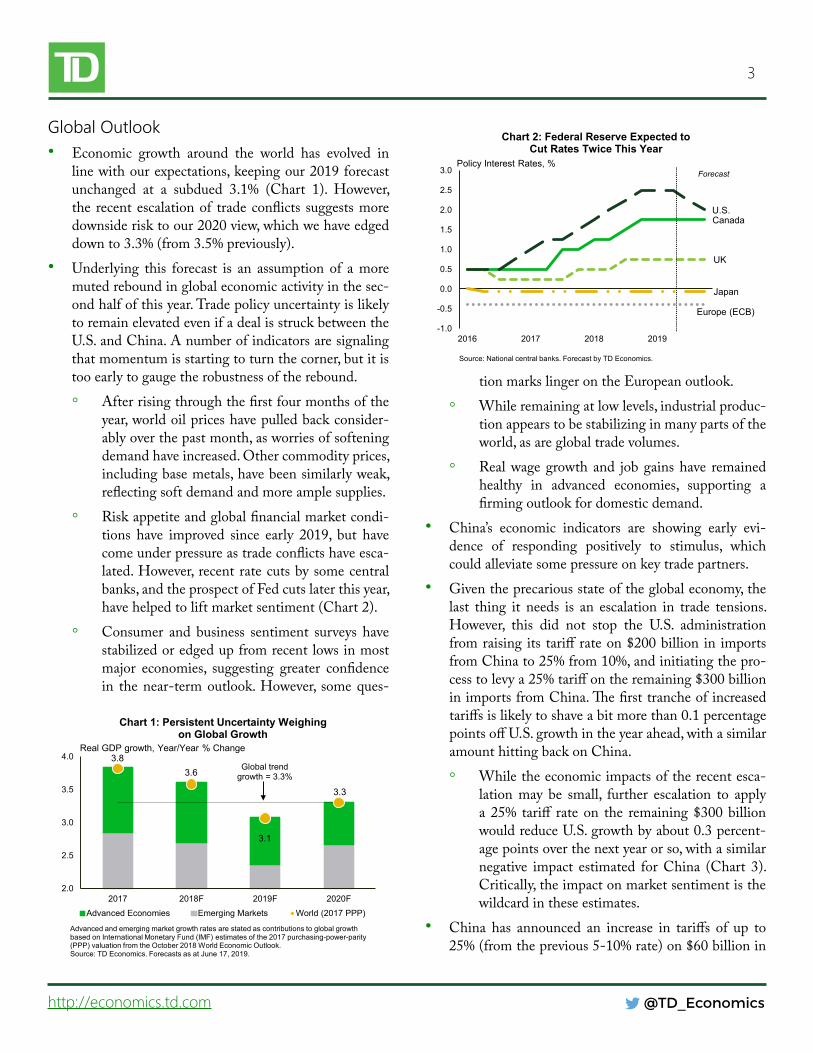
linewithourexpectations,keepingour2019forecastunchanged at a subdued 3.1% (Chart 1). However,the recentescalationof tradeconflicts suggestsmoredownsiderisktoour2020view,whichwehaveedgeddownto3.3%(from3.5%previously).
• Underlying this forecast is an assumption of amoremutedreboundinglobaleconomicactivityinthesec-ondhalfofthisyear.TradepolicyuncertaintyislikelytoremainelevatedevenifadealisstruckbetweentheU.S.andChina.Anumberofindicatorsaresignalingthatmomentumisstartingtoturnthecorner,butitistooearlytogaugetherobustnessoftherebound.◦ Afterrisingthroughthefirstfourmonthsofthe
year,worldoilpriceshavepulledbackconsider-ablyoverthepastmonth,asworriesofsofteningdemandhaveincreased.Othercommodityprices,includingbasemetals,havebeensimilarlyweak,reflectingsoftdemandandmoreamplesupplies.
◦ Riskappetiteandglobalfinancialmarketcondi-tions have improved since early 2019, but havecomeunderpressureastradeconflictshaveesca-lated.However, recentratecutsbysomecentralbanks,andtheprospectofFedcutslaterthisyear,havehelpedtoliftmarketsentiment(Chart2).
◦ Consumer and business sentiment surveys havestabilizedoredgedupfromrecentlowsinmostmajor economies, suggesting greater confidencein thenear-termoutlook.However, someques-
tionmarkslingerontheEuropeanoutlook.◦ Whileremainingatlowlevels,industrialproduc-
tionappearstobestabilizinginmanypartsoftheworld,asareglobaltradevolumes.
◦ Realwagegrowthand jobgainshave remainedhealthy in advanced economies, supporting afirmingoutlookfordomesticdemand.
• China’s economic indicators are showing early evi-dence of responding positively to stimulus, whichcouldalleviatesomepressureonkeytradepartners.
• Giventheprecariousstateoftheglobaleconomy,thelast thing it needs is an escalation in trade tensions.However, this did not stop the U.S. administrationfromraisingitstariffrateon$200billionin importsfromChinato25%from10%,andinitiatingthepro-cesstolevya25%tariffontheremaining$300billioninimportsfromChina.Thefirsttrancheofincreasedtariffsislikelytoshaveabitmorethan0.1percentagepointsoffU.S.growthintheyearahead,withasimilaramounthittingbackonChina.◦ Whiletheeconomicimpactsoftherecentesca-
lationmay be small, further escalation to applya25% tariff rateon the remaining$300billionwouldreduceU.S.growthbyabout0.3percent-agepointsoverthenextyearorso,withasimilarnegative impact estimated forChina (Chart 3).Critically,theimpactonmarketsentimentisthewildcardintheseestimates.
• China has announced an increase in tariffs of up to25%(fromtheprevious5-10%rate)on$60billionin
Canada
UK
U.S.
Japan
Europe (ECB)
-1.0
-0.5
0.0
0.5
1.0
1.5
2.0
2.5
3.0
2016 2017 2018 2019
Chart 2: Federal Reserve Expected to Cut Rates Twice This Year
Source: National central banks. Forecast by TD Economics.
Policy Interest Rates, %Forecast
3.83.6
3.1
3.3
2.0
2.5
3.0
3.5
4.0
2017 2018F 2019F 2020F
Advanced Economies Emerging Markets World (2017 PPP)
Advanced and emerging market growth rates are stated as contributions to global growth based on International Monetary Fund (IMF) estimates of the 2017 purchasing-power-parity (PPP) valuation from the October 2018 World Economic Outlook.Source: TD Economics. Forecasts as at June 17, 2019.
Real GDP growth, Year/Year % Change
Chart 1: Persistent Uncertainty Weighing on Global Growth
Global trend growth = 3.3%

4
@TD_Economicshttp://economics.td.com
U.S.goodseffectiveJune1st.ChineseauthoritieshaverespondedbyallowingtherenminbitodepreciateasameanstooffsetthecostofU.S.tariffs.Authoritiesarealsoincreasingdomesticsubsidiestothemost-affectedsectors, and are continuing to impede the activity ofU.S.businessesoperatinginChina.
• Aswe’veseenpreviously, thedirect impactsoftariffs(Chart4)aredwarfedbytheindirectimpactsthatcanflow through deterioration in market sentiment andheightenedbusinessuncertainty.Thisisthetruewild-card,particularlysinceweareatanearlyphaseofglob-alrecoveryafterhavingbuckledfrompasttradeaction.
• TradenegotiationsbetweentheU.S.andtheEUandJapan are in their early stages.The U.S. administra-tionhasthreatenedtoimposetariffson$11bninEUgoods, and continues to weigh levying auto tariffs.Shouldnegative tradeaction takeplacewithEuropeand/orJapanwhileissuesremainunresolvedwithChi-na,thestabilityoftheglobaleconomybecomesmorethreatenedviathesentimentchannel.Inaddition,bothEuropeandJapanhaveaverythingrowth-cushiontoabsorbadditionalshocks.
• Growth is expected to remaindichotomousbetweenadvanced and emerging market economies. Onceagain, theU.S. is positioned to outperform its peersthisyear.Ataround2.6%,growthwillbeslightlysofterthanlastyear,butstillgapwithotheradvancedecono-mies.ThisshouldkeeptheU.S.dollarwell-bid.
Growth to hold below trend in most of the G7• TheoutlookfortheG7economiesisbroadlysimilarto
ouroutlookinMarch:◦ TheEuroAreaisexpectedtogrowata1.2%pace
thisyear.Firstquartergrowthprovedabitstron-gerthanexpectedasconsumerspendingandnettradefirmedup.However,ongoingweakness inthe manufacturing sector may persist into thesecondhalf of the year, leavinggrowth stuck ataroundits1.3%quarterlyannualizedtrendpace.
◦ The Brexit saga continues, with the exit datepushedtoOctober31st.ThismonthmarksthreeyearsofuncertaintyabouttheUK’sfuturetrad-ingrelationshipwithitsmostimportantpartner.Thisextendedperiodofuncertaintywillcontinuetoweigh on theUK economy for severalmorequarters.Businessandresidentialinvestmentareexpectedtoremainsubdueddespitehealthydo-mesticfundamentals.ThisplacestheUKgrowthoutlookatjust1.2%in2019.Itwillbeimportanttolookthroughthenoiseintheincomingdata.LoomingBrexit deadlinesdrove a surge in im-portsandinventoriesatthestartoftheyearthatisexpectedtounwindinthecomingquarters.
• AdvancedEastAsianeconomieswillcontinuetofaceheadwindsrelatedtothefalloutfromescalatingU.S.-China trade tensions. Exports of technology goodsfromJapan,SouthKorea,andTaiwanhaveallbeenaf-fectedbythetradespat.Witharampingupintradetensions,it’sdifficulttoseegrowthtickupinJapanto
-0.3
-0.2
-0.1
-0.8
-0.6
-0.4
-0.2
0.0U.S. China Global
Chart 3: Escalation in U.S.-China Tariffs Would Further Chill Economic Activity
* Impact on real GDP up to six quarters after tariffs imposed. Source: TD Economics
Tariff-Induced Impact on Level of Real GDP in Percentage Points*
Threatened Escalation
Steel andAluminum25% Tariff on US$50bn in China Imports10% Tariff on US$200bn in China Imports25% Tariff on US$200bn in China Imports25% Tariff on US$300bn in China Imports
-12.8
38.422.1
23.8 13.0 66.6 28.4
-25
-20
-15
-10
-5
0
5
10
China(21.24)
Vietnam(1.94)
Taiwan(1.80)
Cambodia(0.15)
Bangladesh(0.24)
Myanmar(0.02)
Laos (0.01)
Chart 4: U.S.-China Tariffs Shifting Some U.S. Imports from China to Other Asian Trade Partners
Import trade shares (%) in parentheses.Source: U.S. Census Bureau, TD Economics. Year-to-date as of April 2019.
YTD 12-mth Change in Imports ($ billions)
YTD, Y/Y %

5
@TD_Economicshttp://economics.td.com
anabove-trendpace.Assuch,Japanesegrowthisex-pectedtoremainchoppythisyearevenbeforetheVATtaxhikeisintroducedthisfall.
• Oil production curtailments and recent domesticweakness have dampened economic growth inCan-adaforseveralquarters.However,recentdatasupportsomefirmingindomesticdemandintheMarch-Aprilperiod.This is consistentwithour view thatCanadashouldbe able toproduce roughly1.3%growth thisyearonstrengtheningmomentum.
• Softinflationandthegrowth-sappingimpactsofes-calatingtradedisputesensuresthatG7centralbankswillremainonthesidelinesinthecomingmonthsastheymonitorincomingdata.TheoneexceptionistheFederalReserve,whichhasthemostroomtocut.TheFedislikelytoadoptariskmanagementapproachandcutrateslaterthisyear.
Hope for an EM rebound• Economicactivityisslowlyimprovingwithinemerg-
ingmarketeconomies.Althoughhighlyvolatile,capi-talflowshavestabilized,anddomesticfinancialcon-ditionshave loosened.Moreover, the reemergenceofdisinflationary pressures ensures that some countriesmay be able to undertake more stimulus measures,suchaspolicyratecutsand/orfiscalinitiatives.
• EmergingEastAsianeconomieswiththelargestsup-ply chain linkswithChinahave slowed in linewithexpectationsatthestartoftheyear.However,forward-lookingmanufacturingsurveyssignalareboundisbe-ginningtotakeholdonimprovingdomesticdemandandChinesestimulusmeasures.
• TherearesomesignsthatChinesedemandisrebound-ingafterslumpinginthesecondhalfoflastyear.Pasteconomicstimulusmeasuresare likelyplayinga role,as arepromisesbyauthorities toboost infrastructurespendingandhelphouseholdspurchaseconsumerdu-rables.Manufacturingactivityisexpandingonceagain,whileconsumerandbusinesssentimentisrecovering.Asaresult,wemaintainourforecastof6.2%growthforChina’seconomythisyear,roughlythemidpointofthe6-6.5%rangeannouncedbyauthoritiesinMarch.
Downside risks persist• Late cycle dynamics, a build-up in financial vulner-
abilities and heightened economic uncertainty havemade forecasting more difficult than usual over thepast fewquarters.Concerns about growth and tradewarshavedrivendownglobalbondyieldsbackto2017levels(Chart5).Despiteearlyevidenceofapick-upinunderlyingeconomicindicators,thepaceofeconomicgrowthremainslowerthaninrecentyears.Thisleavesmanycountrieswithathinnercushiontoabsorbeco-nomic shocks,be it fromtradeorgeopoliticaldevel-opments.Thisplacesmore focusonthepotential foradditionalmonetaryandfiscalstimulus,andtheabilityofcountriesthatarealreadynearthezerolowerboundandrunningbudgetdeficitstodeliverit(ifneedbe).RatecutsbytheFedshouldhelpcushionsomeofthedownside threat togrowthvia looserglobalfinancialconditions,butarenotexpectedtoextinguishthedragoninvestmentandtradefromtheprolongedperiodofelevateduncertainty.
• Astheunprecedentedandrisingamountofnegativeyieldingdebtattests(morethanUS$11tn),monetarypolicyisstillfarfromnormal.Evenso,afailureofei-ther economic growthor inflation to increasewouldhastenpressureforadditionalstimulusbeforekeyad-vancedeconomieshaveliftedratesoffthezerolowerbound.Europe,withitsailingbanksandlittleroomtolowerinterestrates,ismostatriskoffallingintoreces-sionifdemandweretofalter.Moreover,fiscalspaceintheEuroAreaislimitedtoahandfulofeconomies,in-cludingGermany,butcoalitiongovernmentsarehesi-tanttodeployfiscalstimulus.Anymisstepsbypolicy-makerscouldresultinasuddenrepricingofglobalriskthatcouldderailtheglobalrecovery.
-1.4
-1.2
-1.0
-0.8
-0.6
-0.4
-0.2
0.0
0.2
Chart 5: Global Bond Yields Have Eased on Growth Concerns and Trade Risks
Canada
U.S.
Germany
UK
Source: National Central Banks, TD Economics. Last Obs.: June 12, 2019.
10-Year Government Bond Yield Change from Oct. 5, 2018
6
@TD_Economicshttp://economics.td.com
U.S. Outlook• TheU.S.economyhadastrongerstarttotheyearthan
expected,withrealGDPincreasingby3.1%(annual-ized) in the first quarter.That healthy pacewas dueinlargeparttotemporaryfactorsincludingasizeablebuildupininventories.Thisisexpectedtobereversedin the second quarter, holding headline growth to asofter1.9%.
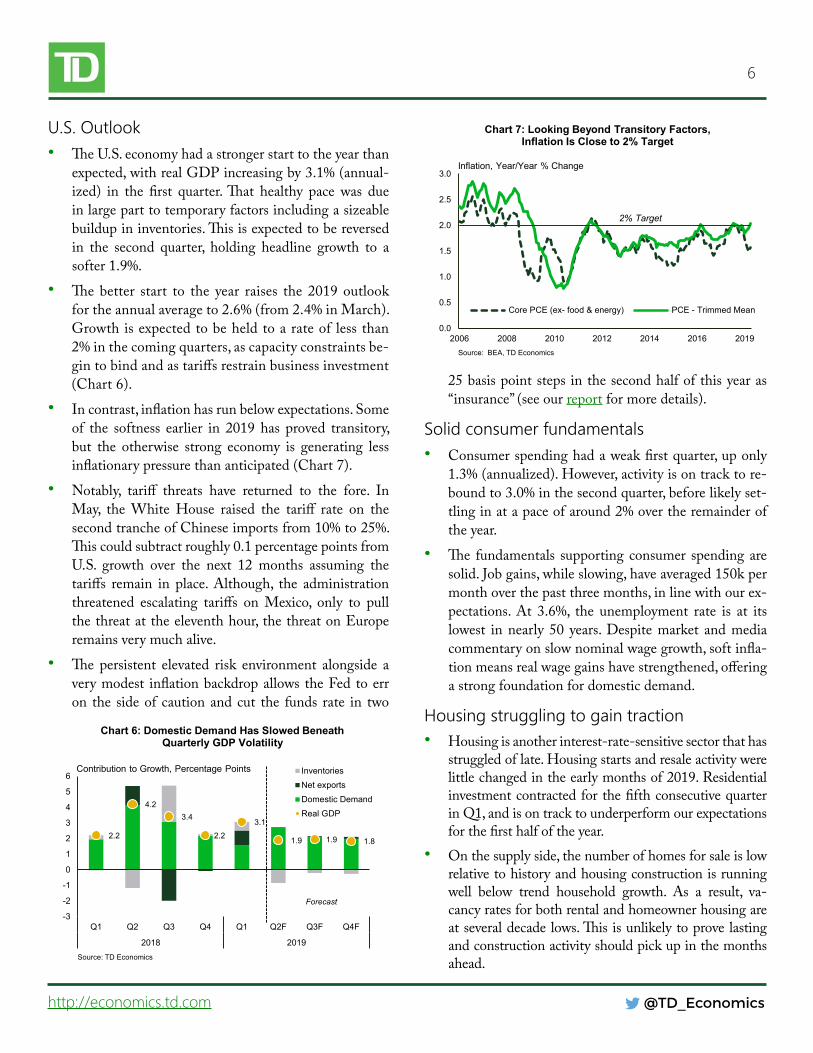
• Thebetter start to the year raises the2019outlookfortheannualaverageto2.6%(from2.4%inMarch).Growthisexpectedtobeheldtoarateoflessthan2%inthecomingquarters,ascapacityconstraintsbe-gintobindandastariffsrestrainbusinessinvestment(Chart6).
• Incontrast,inflationhasrunbelowexpectations.Someof the softness earlier in 2019has proved transitory,but the otherwise strong economy is generating lessinflationarypressurethananticipated(Chart7).
• Notably, tariff threats have returned to the fore. InMay, theWhite House raised the tariff rate on thesecondtrancheofChineseimportsfrom10%to25%.Thiscouldsubtractroughly0.1percentagepointsfromU.S. growth over the next 12 months assuming thetariffs remain in place.Although, the administrationthreatened escalating tariffs on Mexico, only to pullthethreatattheeleventhhour,thethreatonEuroperemainsverymuchalive.
• Thepersistent elevated risk environment alongside averymodest inflationbackdropallowstheFedtoerron the sideof cautionandcut the funds rate in two
25basispointstepsinthesecondhalfofthisyearas“insurance”(seeourreportformoredetails).
Solid consumer fundamentals• Consumerspendinghadaweakfirstquarter,uponly
1.3%(annualized).However,activityisontracktore-boundto3.0%inthesecondquarter,beforelikelyset-tlinginatapaceofaround2%overtheremainderoftheyear.
• The fundamentals supportingconsumer spendingaresolid.Jobgains,whileslowing,haveaveraged150kpermonthoverthepastthreemonths,inlinewithourex-pectations.At 3.6%, the unemployment rate is at itslowest innearly50 years.Despitemarket andmediacommentaryonslownominalwagegrowth,softinfla-tionmeansrealwagegainshavestrengthened,offeringastrongfoundationfordomesticdemand.
Housing struggling to gain traction• Housingisanotherinterest-rate-sensitivesectorthathas
struggledoflate.Housingstartsandresaleactivitywerelittlechangedintheearlymonthsof2019.ResidentialinvestmentcontractedforthefifthconsecutivequarterinQ1,andisontracktounderperformourexpectationsforthefirsthalfoftheyear.
• Onthesupplyside,thenumberofhomesforsaleislowrelativetohistoryandhousingconstructionisrunningwell below trend household growth. As a result, va-cancyratesforbothrentalandhomeownerhousingareatseveraldecadelows.Thisisunlikelytoprovelastingandconstructionactivityshouldpickupinthemonthsahead.
0.0
0.5
1.0
1.5
2.0
2.5
3.0
2006 2008 2010 2012 2014 2016 2019
Chart 7: Looking Beyond Transitory Factors, Inflation Is Close to 2% Target
Core PCE (ex- food & energy) PCE - Trimmed Mean
Source: BEA, TD Economics
Inflation, Year/Year % Change
2% Target
2.2
4.23.4
2.2
3.1
1.9 1.9 1.8
-3
-2
-1
0
1
2
3
4
5
6
Q1 Q2 Q3 Q4 Q1 Q2F Q3F Q4F
2018 2019
Chart 6: Domestic Demand Has Slowed Beneath Quarterly GDP Volatility
InventoriesNet exportsDomestic DemandReal GDP
Contribution to Growth, Percentage Points
Source: TD Economics
Forecast
7
@TD_Economicshttp://economics.td.com
• Onthedemandside,lowermortgageratesshoulden-tice buyers.When combinedwith slower house pricegrowthanddecentwagegains,improvedaffordabilityisexpectedtogivesupporttohousingdemandinto2020.
Tariffs top list of downside risks to investment • Despite solid real GDP growth, business capital
spendinghasalsobeenweakerthanwehadexpected,advancingbyjust2.3%(annualized)inthefirstquarter.Spendinginindustriesreliantonfederalgovernmentcontractswaslikelyheldbackbythegovernmentshut-down,butitisdifficulttoteaseoutthepreciseimpact.
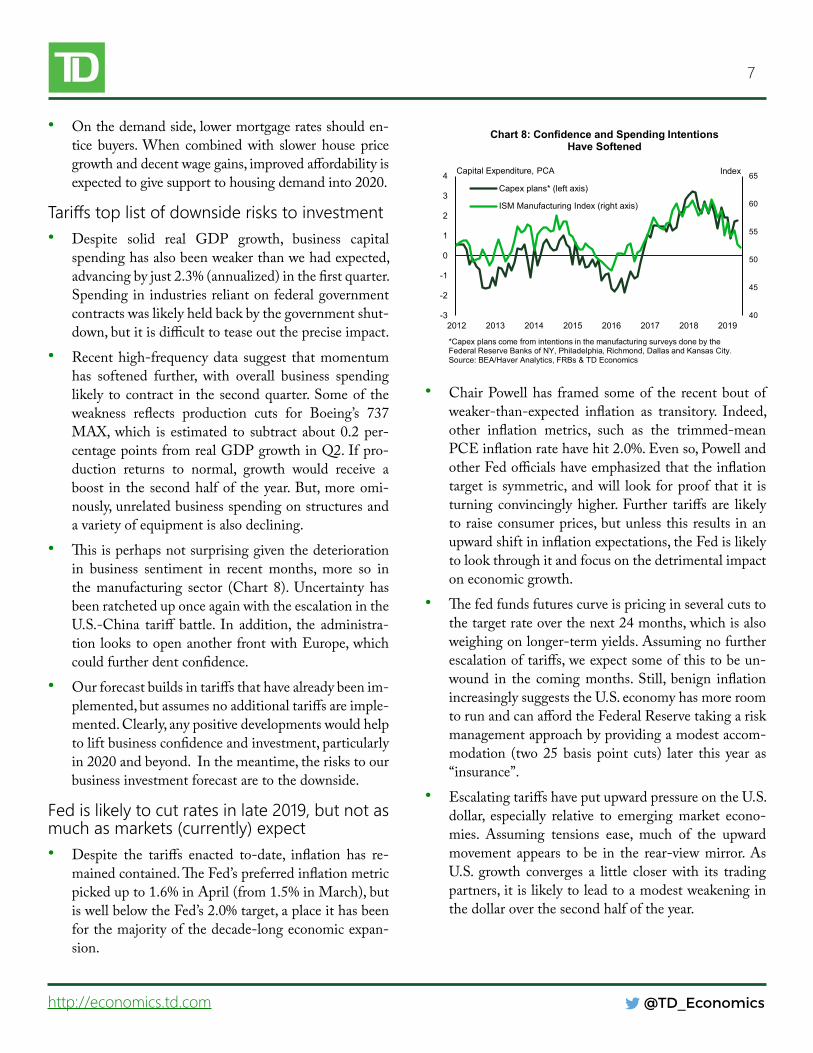
• Recenthigh-frequencydata suggest thatmomentumhas softened further, with overall business spendinglikely tocontract in the secondquarter.Someof theweakness reflects production cuts for Boeing’s 737MAX,which is estimated to subtract about0.2per-centagepointsfromrealGDPgrowthinQ2.Ifpro-duction returns to normal, growth would receive aboost in the secondhalfof theyear.But,moreomi-nously,unrelatedbusinessspendingonstructuresandavarietyofequipmentisalsodeclining.
• Thisisperhapsnotsurprisinggiventhedeteriorationin business sentiment in recent months, more so inthemanufacturing sector (Chart 8).Uncertainty hasbeenratcheteduponceagainwiththeescalationintheU.S.-China tariffbattle. In addition, the administra-tionlookstoopenanotherfrontwithEurope,whichcouldfurtherdentconfidence.
• Ourforecastbuildsintariffsthathavealreadybeenim-plemented,butassumesnoadditionaltariffsareimple-mented.Clearly,anypositivedevelopmentswouldhelptoliftbusinessconfidenceandinvestment,particularlyin2020andbeyond.Inthemeantime,theriskstoourbusinessinvestmentforecastaretothedownside.
Fed is likely to cut rates in late 2019, but not as much as markets (currently) expect• Despite the tariffs enacted to-date, inflation has re-
mainedcontained.TheFed’spreferredinflationmetricpickedupto1.6%inApril(from1.5%inMarch),butiswellbelowtheFed’s2.0%target,aplaceithasbeenforthemajorityofthedecade-longeconomicexpan-sion.
• ChairPowellhas framedsomeof the recentboutofweaker-than-expected inflation as transitory. Indeed,other inflation metrics, such as the trimmed-meanPCEinflationratehavehit2.0%.Evenso,PowellandotherFedofficialshaveemphasizedthattheinflationtarget is symmetric,andwill look forproof that it isturningconvincinglyhigher.Further tariffs are likelytoraiseconsumerprices,butunlessthisresults inanupwardshiftininflationexpectations,theFedislikelytolookthroughitandfocusonthedetrimentalimpactoneconomicgrowth.
• Thefedfundsfuturescurveispricinginseveralcutstothetargetrateoverthenext24months,whichisalsoweighingonlonger-termyields.Assumingnofurtherescalationoftariffs,weexpectsomeofthistobeun-wound in the comingmonths.Still, benign inflationincreasinglysuggeststheU.S.economyhasmoreroomtorunandcanaffordtheFederalReservetakingariskmanagementapproachbyprovidingamodestaccom-modation (two25basispoint cuts) later this year as“insurance”.
• EscalatingtariffshaveputupwardpressureontheU.S.dollar, especially relative to emergingmarket econo-mies. Assuming tensions ease, much of the upwardmovement appears to be in the rear-viewmirror.AsU.S. growth converges a little closerwith its tradingpartners,itislikelytoleadtoamodestweakeninginthedollaroverthesecondhalfoftheyear.
40
45
50
55
60
65
-3
-2
-1
0
1
2
3
4
2012 2013 2014 2015 2016 2017 2018 2019
Chart 8: Confidence and Spending Intentions Have Softened
Capex plans* (left axis)
ISM Manufacturing Index (right axis)
*Capex plans come from intentions in the manufacturing surveys done by the Federal Reserve Banks of NY, Philadelphia, Richmond, Dallas and Kansas City.Source: BEA/Haver Analytics, FRBs & TD Economics
Capital Expenditure, PCA Index
8
@TD_Economicshttp://economics.td.com
Canadian Outlook• ThesoftpatchthatcharacterizedCanada’seconomyin
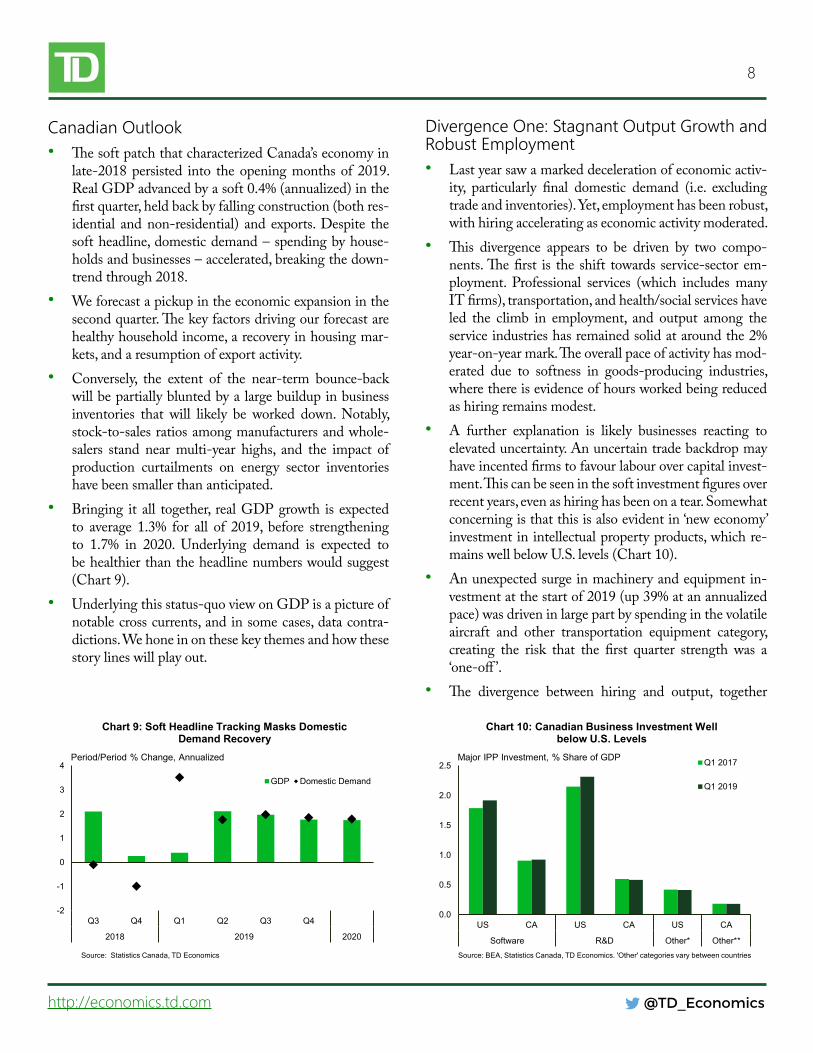
late-2018persisted into theopeningmonthsof2019.RealGDPadvancedbyasoft0.4%(annualized)inthefirstquarter,heldbackbyfallingconstruction(bothres-idential andnon-residential) and exports.Despite thesoftheadline,domesticdemand–spendingbyhouse-holdsandbusinesses–accelerated,breakingthedown-trendthrough2018.
• Weforecastapickupintheeconomicexpansioninthesecondquarter.Thekeyfactorsdrivingourforecastarehealthyhouseholdincome,arecoveryinhousingmar-kets,andaresumptionofexportactivity.
• Conversely, the extent of the near-term bounce-backwillbepartiallybluntedbyalargebuildupinbusinessinventories that will likely be worked down. Notably,stock-to-salesratiosamongmanufacturersandwhole-salers stand nearmulti-year highs, and the impact ofproduction curtailments on energy sector inventorieshavebeensmallerthananticipated.
• Bringing it all together, realGDPgrowth isexpectedto average 1.3% for all of 2019, before strengtheningto 1.7% in 2020. Underlying demand is expected tobehealthierthantheheadlinenumberswouldsuggest(Chart9).
• Underlyingthisstatus-quoviewonGDPisapictureofnotablecrosscurrents,andinsomecases,datacontra-dictions.Wehoneinonthesekeythemesandhowthesestorylineswillplayout.
Divergence One: Stagnant Output Growth and Robust Employment• Lastyearsawamarkeddecelerationofeconomicactiv-
ity, particularly final domestic demand (i.e. excludingtradeandinventories).Yet,employmenthasbeenrobust,withhiringacceleratingaseconomicactivitymoderated.
• This divergence appears to be driven by two compo-nents.Thefirst is the shift towards service-sectorem-ployment. Professional services (which includes manyITfirms),transportation,andhealth/socialserviceshaveled the climb in employment, and output among theserviceindustrieshasremainedsolidataroundthe2%year-on-yearmark.Theoverallpaceofactivityhasmod-erated due to softness in goods-producing industries,wherethereisevidenceofhoursworkedbeingreducedashiringremainsmodest.
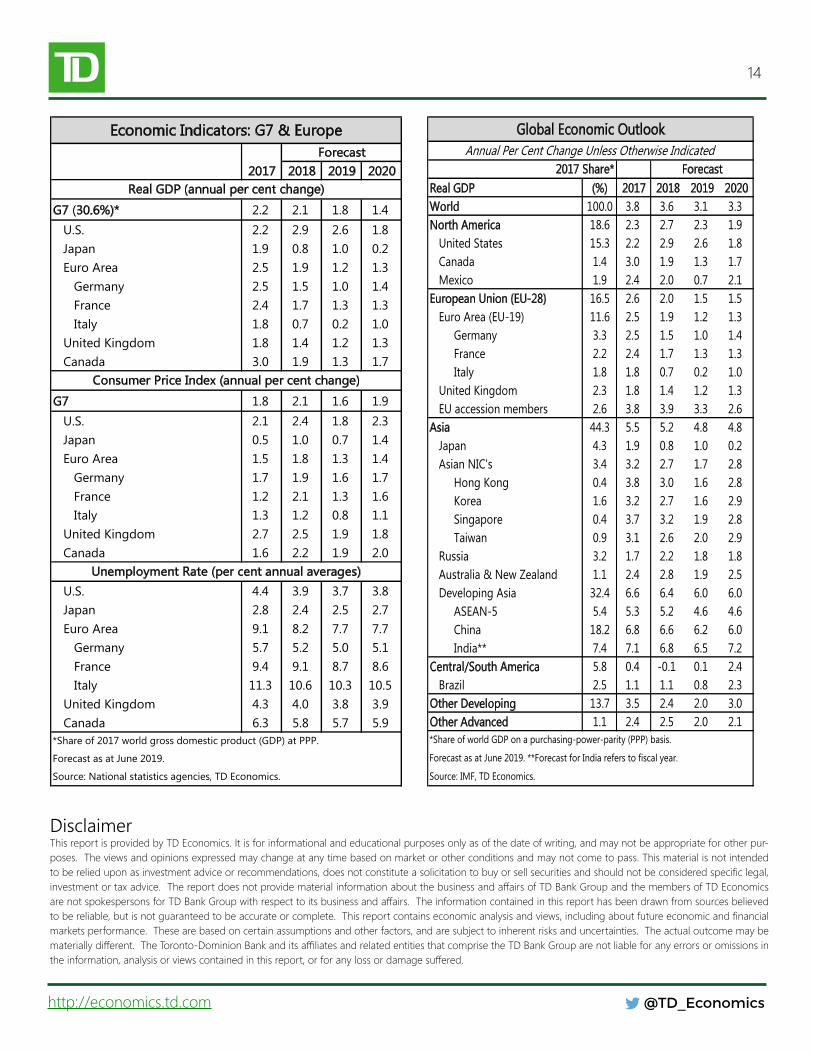
• A further explanation is likely businesses reacting toelevateduncertainty.Anuncertaintradebackdropmayhaveincentedfirmstofavourlabourovercapitalinvest-ment.Thiscanbeseeninthesoftinvestmentfiguresoverrecentyears,evenashiringhasbeenonatear.Somewhatconcerningisthatthisisalsoevidentin‘neweconomy’investmentinintellectualpropertyproducts,whichre-mainswellbelowU.S.levels(Chart10).
• Anunexpectedsurgeinmachineryandequipmentin-vestmentatthestartof2019(up39%atanannualizedpace)wasdriveninlargepartbyspendinginthevolatileaircraft and other transportation equipment category,creating the risk that the first quarter strength was a‘one-off ’.
• The divergence between hiring and output, together
-2
-1
0
1
2
3
4
Q3 Q4 Q1 Q2 Q3 Q4
2018 2019 2020
Chart 9: Soft Headline Tracking Masks Domestic Demand Recovery
GDP Domestic Demand
Source: Statistics Canada, TD Economics
Period/Period % Change, Annualized
0.0
0.5
1.0
1.5
2.0
2.5
US CA US CA US CA
Software R&D Other* Other**
Chart 10: Canadian Business Investment Well below U.S. Levels
Q1 2017
Q1 2019
Source: BEA, Statistics Canada, TD Economics. 'Other' categories vary between countries
Major IPP Investment, % Share of GDP

9
@TD_Economicshttp://economics.td.com
with tepid trend investment, has manifested in veryweakproductivitygrowthoverthelasttwoyears(Chart11).Abriefperiodofstagnationisnotunusual,butisnotsustainable.
• Thisdivergencewillberesolvedbytheexpectedpick-upofactivityas2019progressesandamoderationofthepaceofhiring towards longer-term fundamentals.Ouroutlookenvisionsa‘sweetspot’whereproductivityimproves,helpingdrivewagegainsandholdingtheun-employmentratebelowitslonger-termtrendforsometime.
Divergence Two: Employment and Spending• Whileemploymentgrowthhasdivergedfromoutput,
spendinghasdivergedfromemploymentgains.Cana-dianhouseholdsparedbackexpenditures in the latterpartof2018.And,evenwiththereboundinspendinginQ1,consumptionisuponly1.9%year-on-year,barelyaheadofemploymentgainsanddownfromapeakpaceof3.9%attheendof2017.
• Market turmoil late last year is likely a contributor.However,thebiggerfactorappearstobethelaggedef-fectsofhigherinterestratesandtightermortgagerulesputinplacein2017/2018.Thesehavedrivenamarkeddecelerationofspendingonrate-sensitiveitems(autos,furniture, electronics, etc.) alongside a moderation inhousingactivity.Thishasmanifestedinanunintendedinventorybuildupandslowerhouseholdcreditgrowth.
• Althoughconsumerspendingandnationalhousingac-tivityarefindingafirmerfooting,weremainskepticalthatthefirstquarter’sspendinggrowthwillberepeated.Marketvolatilityhasreturned,albeittoalesserextent,
and thehousehold savings rate is low, at just1.1%ofdisposable income.On topof this, evenasborrowingcostshavecomedownrecently,creditgrowthsuggestshighly-indebtedhouseholdsremaincautious.
• Theresultisanelusive‘softlanding’capturedbyacon-vergencebetweennominalspending,creditgrowth,andhouseholdincomestoamodestbutsustainable3.0%to3.5%rate,or1.0-1.5%inrealterms.Thiswouldsetthestageforcontinuedstabilityinthehouseholddebtbur-den,albeitatelevatedlevels,andforamodestincreaseinthesavingrate.Atthesametime,ourprojectionformodestrealspendinggainswillenablethegradualab-sorptionofexcessinventories.
Divergence Three: Curtailment, Higher Prices, but Still High Inventories• Latelastyear,theAlbertagovernmentannouncedman-
datoryenergyproductioncurtailmentstoaddresssignif-icantpricingdiscounts,asoutputoutstrippedtakeawaycapacityandinventorieshitextremelevels.
• On thefirstgoal, curtailmenthasbeena success.Thespread between heavy Canadian oil prices and theU.S. WTI benchmark averaged an unusually narrow-US$10/bblinthefirstquarter,aftertouchingalowof-$50/bbllastOctober.But,successinthisgoalhascre-atedchallengesinthesecond.
• The lowdiscount onheavy oil hasmade shippingoilby rail uneconomic (effectively the only option formarginalbarrelsgivenpipelinecapacities).ThishasledfirmstomaintaininventoriesrelativelyunchangedfromDecemberlevelsevenasproductionhasbeencurtailed.This is corroboratedby theexportdata,whereenergyproductvolumesfellmorethan6%inthefirstquarter.ThisdynamicmeansthatmoreofthedragonGDPisyettocome.
• Asdiscussedinarecentreport,decreasingcurtailmentstringency,pipelinedelaysandsteadyinventoriesallau-gurforare-wideningofCanadianpricespreadtotheUS$15-$20/bbl range. Some evidence of this has al-ready been seen.U.S. benchmarkWTIprices are ex-pectedtoholdintheUS$50-60rangeovertheforecasthorizon,downmodestlyfromourpriorforecast.
Divergence Four: Investment and Sentiment• Businessesmay have kicked off 2019with an invest-
mentsplurgeinaircrafts(Chart12),butinvestmentin
96
98
100
102
104
106
108
2012 2013 2014 2015 2016 2017 2018 2019
Chart 11: Strong Hiring, Weak Output Leaves Productivity Moving Sideways
Source: Statistics Canada, TD Economics
Labour Productivity, 2012=100

10
@TD_Economicshttp://economics.td.com
structureshasnowcontractedforfivestraightquartersinalikelyreflectionofthechallengesstillfacingtheen-ergysector.
• Withcapacityutilizationoffrecenthighsforseveralcat-egoriesweexpectsomepaybackinthesecondquarter.
• The soft outlays come despite generally decent busi-nesssentiment,adisconnectthatwasparticularlyno-tableover2018.Tradeuncertaintyisthelikelyculprit;firmsmay have remained optimistic that a resolutionwasforthcomingevenasnegotiationsdraggedon.Sen-timenthassoftenedsomewhatoflate,suggestingsomeclosureofthegap,buttheMay10thescalationintheU.S.-Chinatradewarmeansthatsomedisconnectwilllikelypersist.TheimpactonCanadawilldependonthelengthofthedispute,thedegreetowhichCanadaisim-pactedbypotentialtradediversion(i.e.ChinesegoodsshippedviaCanada)and,critically,thereactionofmar-ketandbusinesssentiment.
• ThesameholdstruewiththepotentialforU.S.conflictswiththeEuropeanUnionandJapan.
• Giventhisbackdrop,wecontinuetoexpectonlyamod-eratepaceofinvestmentataround3.5%perquarterinthecomingyears(lessthanhalfitspost-crisisaverage),domestic-focusedandhelpedbyongoingactivityrelat-edtothenaturalgasterminalinKitimatB.C.
Divergence Five: Feds versus Provinces• New governments bring new budgets. In contrast to
thefederalgovernment,wherethemostrecentbudgetsawalmostallthenewfiscalspaceeatenupbyspendingmeasures, theOntario government’s first budget aims
at consolidation (see report). Outright spending cutsarefewandfarbetween,butamarkedlyslowerpaceofspendingisplannedrelativetothepriortrajectory.ThenewlyelectedAlbertangovernmenthasalsoindicatedthatitplanstoeliminatebudgetdeficits.
• Fiscal restraint is warranted, particularly in Ontario,given a significant debt burden.The change in fiscalstance does mean, however, that government spend-ingwill provide less of a growth lift,mostnotably in2020.Wehave reduced the contribution fromoverallgovernmentspendingbyabout0.2p.p.(ThehittoOn-tario’s2020growth,allelseequal,isabout0.4p.p.).Thedowngradetogovernmentspendingisoffsetbyslightlyhigherconsumerspending, resulting inonlya slightlydowngradeofouroverallCanadiangrowthoutlookfornextyear(forprovincialdetails,seetheProvincialEco-nomicForecast).
Steady as she goes for the Bank of Canada• Canadiandata divergences and the uncertainties they
generatehavemoved theBankofCanada to adopt acautious stance.TheBank’s communiqué inMay sig-naledasteady-asshegoesapproach,recognizingthere-centimprovementineconomicconditions,butremain-ingmindfuloftheexternalsectordownsiderisks.
• ThebiggestexternalfactorsarethelatestescalationintheU.S.-Chinatradewarandare-thickeningofNorthAmericantradebarriersdespitetheremovalofsteelandaluminumtariffs.Inarecentpressconference,GovernorPoloznotedthata‘newshock’maybeacompellingfac-tortomotivateapolicyinterestratecut.Canadawillbenegativelyimpactedbytherecentdisputeescalation,butthescaleoftheimpactisunlikelytomateriallyaltertheeconomicforecastunlessfurtherdeteriorationinsenti-menttakeshold.Likewise,weexpecttheloonietotradearound74to77U.S.centsovertheforecasthorizon.
-30
-20
-10
0
10
20
30
40
50
2015 2016 2017 2018 2019
Chart 12: Volatile Aircraft Category Drove First Quarter Investment Surge
M+E Investment
M+E, ex. Aircraft
Source: Statistics Canada, TD Economics
Quarter/Quarter % Change, Annualized

11
@TD_Economicshttp://economics.td.com
Q1 Q2 Q3 Q4 Q1 Q2* Q3F Q4F Q1F Q2F Q3F Q4FCanadaOvernight Target Rate 1.25 1.25 1.50 1.75 1.75 1.75 1.75 1.75 1.75 1.75 1.75 1.753-mth T-Bill Rate 1.10 1.26 1.59 1.64 1.67 1.66 1.65 1.65 1.65 1.65 1.65 1.652-yr Govt. Bond Yield 1.77 1.91 2.21 1.86 1.55 1.38 1.50 1.55 1.60 1.65 1.70 1.755-yr Govt. Bond Yield 1.96 2.06 2.33 1.88 1.52 1.33 1.50 1.55 1.65 1.70 1.75 1.8010-yr Govt. Bond Yield 2.09 2.17 2.42 1.96 1.62 1.44 1.55 1.65 1.75 1.85 1.90 1.9530-yr Govt. Bond Yield 2.23 2.20 2.42 2.18 1.89 1.70 1.80 1.90 2.00 2.10 2.15 2.2010-yr-2-yr Govt Spread 0.32 0.26 0.21 0.10 0.07 0.05 0.05 0.10 0.15 0.20 0.20 0.20U.S. Fed Funds Target Rate 1.75 2.00 2.25 2.50 2.50 2.50 2.25 2.00 2.00 2.00 2.00 2.003-mth T-Bill Rate 1.70 1.89 2.15 2.40 2.35 2.14 1.98 1.85 1.85 1.85 1.85 1.852-yr Govt. Bond Yield 2.27 2.52 2.81 2.48 2.27 1.84 1.95 2.00 2.05 2.10 2.15 2.205-yr Govt. Bond Yield 2.56 2.73 2.94 2.51 2.23 1.83 2.00 2.10 2.20 2.30 2.35 2.4010-yr Govt. Bond Yield 2.74 2.85 3.05 2.69 2.41 2.08 2.20 2.30 2.40 2.45 2.50 2.5530-yr Govt. Bond Yield 2.97 2.98 3.19 3.02 2.81 2.59 2.45 2.55 2.65 2.70 2.75 2.8010-yr-2-yr Govt Spread 0.47 0.33 0.24 0.21 0.14 0.24 0.25 0.30 0.35 0.35 0.35 0.35Canada-U.S. SpreadsCan - U.S. T-Bill Spread -0.60 -0.63 -0.56 -0.76 -0.68 -0.47 -0.33 -0.20 -0.20 -0.20 -0.20 -0.20Can - U.S. 10-Year Bond Spread -0.65 -0.68 -0.63 -0.73 -0.79 -0.65 -0.65 -0.65 -0.65 -0.60 -0.60 -0.60
Interest Rate Outlook2018 2019 2020
F: Forecast by TD Bank Group as at June 2019. All forecasts are end-of-period.
Source: Bloomberg, Bank of Canada, Federal Reserve, TD Economics. * Spot rate as at June 14, 2019 with the exception of policy rates.
Q1 Q2 Q3 Q4 Q1 Q2* Q3F Q4F Q1F Q2F Q3F Q4FExchange rate to U.S. dollar Euro USD per EUR 1.23 1.17 1.16 1.15 1.12 1.12 1.14 1.15 1.16 1.17 1.18 1.19 UK pound USD per GBP 1.40 1.32 1.31 1.28 1.30 1.26 1.29 1.30 1.31 1.32 1.33 1.34 Japanese yen JPY per USD 106 111 113 110 111 109 107 106 105 104 104 103 Chinese renminbi CNY per USD 6.27 6.62 6.87 6.88 6.71 6.93 6.90 6.90 6.90 6.90 6.90 6.90Exchange rate to Canadian dollar U.S. dollar USD per CAD 0.78 0.76 0.77 0.73 0.75 0.75 0.76 0.77 0.77 0.77 0.77 0.77 Euro CAD per EUR 1.59 1.53 1.50 1.56 1.50 1.50 1.49 1.50 1.51 1.52 1.53 1.55 UK pound CAD per GBP 1.81 1.73 1.69 1.74 1.74 1.69 1.69 1.69 1.70 1.72 1.73 1.74 Japanese yen JPY per CAD 82.4 84.3 87.8 80.4 82.8 81.0 81.7 81.5 80.8 80.0 79.6 79.2 Chinese renminbi CNY per CAD 4.87 5.04 5.32 5.04 5.03 5.16 5.26 5.31 5.31 5.31 5.31 5.31F: Forecast by TD Bank Group as at June 2019. All forecasts are end-of-period.
Source: Bloomberg, Bank of Canada, Federal Reserve, TD Economics. * Spot rate as at June 14, 2019.
Foreign Exchange Outlook
Currency Exchange rate2018 2019 2020
Q1 Q2 Q3 Q4 Q1 Q2 Q3F Q4F Q1F Q2F Q3F Q4FCrude Oil (WTI, $US/bbl) 63 68 70 59 55 60 58 59 60 61 62 62Natural Gas ($US/MMBtu) 3.08 2.86 2.93 3.80 2.92 2.60 2.60 2.55 2.50 2.51 2.53 2.54Gold ($US/troy oz.) 1329 1306 1213 1229 1303 1290 1300 1325 1350 1375 1400 1425Silver (US$/troy oz.) 16.74 16.56 15.02 14.58 15.58 14.65 15.25 16.00 16.75 17.25 18.00 18.25Copper (cents/lb) 316 312 277 280 282 284 279 279 297 297 311 311Nickel (US$/lb) 6.01 6.56 6.02 5.21 5.60 5.67 5.47 5.65 5.90 6.12 6.35 6.35Aluminum (cents/lb) 98 102 93 89 84 83 84 86 90 93 98 98Wheat ($US/bu) 7.42 7.46 6.70 6.85 6.80 6.85 6.85 6.90 6.93 6.95 6.98 7.00
2018 2019 2020
Commodity Price Outlook
F: Forecast by TD Bank Group as at June 2019. All forecasts are period averages.
Source: Bloomberg, TD Economics, USDA (Haver).

12
@TD_Economicshttp://economics.td.com
Q1 Q2 Q3 Q4 Q1 Q2F Q3F Q4F Q1F Q2F Q3F Q4F 18 19F 20F 18 19F 20F
Real GDP 1.5 2.5 2.1 0.3 0.4 2.1 2.0 1.8 1.6 1.7 1.6 1.7 1.9 1.3 1.7 1.6 1.6 1.7
Consumer Expenditure 1.3 1.9 1.3 1.0 3.5 1.5 1.7 1.7 1.5 1.6 1.7 1.6 2.1 1.9 1.6 1.4 2.1 1.6
Durable Goods -0.1 -1.8 -0.6 -1.9 4.9 -1.4 0.9 1.1 1.2 1.4 1.4 1.5 1.0 0.6 1.1 -1.1 1.4 1.4
Business Investment 8.8 -0.7 -10.6 -6.4 10.5 -0.5 3.1 3.3 3.5 3.8 3.7 3.7 2.2 0.3 3.3 -2.5 4.0 3.7
Non-Res. Structures -1.3 -4.1 -8.6 -14.2 -2.6 2.0 2.9 2.5 2.5 2.9 3.2 3.4 -0.9 -4.0 2.8 -7.2 1.2 3.0
Equipment & IPP* 20.9 2.9 -12.4 2.2 24.0 -2.9 3.4 4.1 4.4 4.6 4.1 4.0 5.6 4.5 3.7 2.7 6.7 4.3
Residential Investment -8.4 -0.3 -3.2 -10.4 -6.1 8.5 4.4 3.2 2.9 2.8 3.0 2.9 -1.5 -1.8 3.5 -5.7 2.3 2.9
Govt. Expenditure 1.6 2.5 2.5 -0.3 2.8 1.7 1.4 1.2 1.1 0.8 0.8 0.8 3.0 1.7 1.1 1.6 1.8 0.9
Final Domestic Demand 1.4 1.6 -0.1 -1.0 3.4 1.8 2.0 1.9 1.7 1.7 1.8 1.8 2.0 1.4 1.8 0.5 2.2 1.7
Exports 3.6 12.0 0.8 0.3 -4.1 5.8 3.5 2.3 2.1 2.3 2.5 2.7 3.2 1.4 2.6 4.1 1.8 2.4
Imports 4.2 6.2 -8.9 -0.7 7.7 0.2 3.0 2.3 2.2 2.3 2.4 2.4 2.9 1.5 2.2 0.0 3.3 2.3
Change in Non-farm Inventories (2007 $Bn) 16.9 14.6 6.0 13.4 16.1 9.7 9.3 9.1 8.9 8.9 8.1 7.4 12.7 11.0 8.3 -- -- -- Final Sales 1.2 2.4 1.0 -2.3 2.6 3.2 2.1 1.9 1.8 1.8 1.9 1.9 2.3 1.5 2.0 0.6 2.5 1.8
International Current
Account Balance ($Bn) -65.5 -61.5 -40.6 -66.5 -69.4 -51.8 -50.0 -50.4 -50.9 -51.4 -52.0 -52.4 -58.5 -55.4 -51.7 -- -- --
% of GDP -3.0 -2.8 -1.8 -3.0 -3.1 -2.3 -2.2 -2.2 -2.2 -2.2 -2.2 -2.2 -2.6 -2.4 -2.2 -- -- --
Pre-tax Corp. Profits 1.5 10.3 13.9 -37.9 6.9 9.0 4.2 4.9 4.8 4.9 5.0 5.0 0.5 -2.6 5.0 -5.7 6.2 4.9
% of GDP 12.8 13.0 13.3 11.9 11.9 12.0 12.0 12.0 12.0 12.1 12.1 12.2 12.7 12.0 12.1 -- -- --
GDP Deflator (y/y) 1.8 2.2 2.5 0.5 1.1 1.7 1.8 3.2 2.7 2.2 2.1 2.0 1.7 2.0 2.2 0.5 3.2 2.0
Nominal GDP 3.2 3.9 4.3 -3.1 5.0 5.9 4.4 4.1 3.9 3.8 3.6 3.6 3.6 3.3 4.0 2.0 4.9 3.7
Labour Force -0.3 1.3 1.2 1.2 3.3 2.1 1.2 0.9 0.7 0.6 0.6 0.6 0.8 1.9 0.9 0.9 1.9 0.7
Employment 0.3 1.0 1.3 2.2 2.9 3.1 0.4 0.6 0.6 0.6 0.6 0.6 1.3 2.0 0.7 1.2 1.7 0.6
Change in Empl. ('000s) 13 47 62 100 133 145 19 26 29 29 31 31 238 376 139 222 323 119
Unemployment Rate (%) 5.8 5.9 5.9 5.7 5.8 5.6 5.7 5.8 5.9 5.9 5.9 5.8 5.8 5.7 5.9 -- -- --
Personal Disp. Income 1.8 3.8 0.4 5.3 3.5 5.4 4.0 3.9 3.8 3.7 3.6 3.5 3.8 3.9 3.9 2.8 4.2 3.7
Pers. Savings Rate (%) 1.9 1.5 0.9 1.4 1.1 1.4 1.4 1.4 1.4 1.4 1.3 1.3 1.4 1.3 1.3 -- -- --
Cons. Price Index (y/y) 2.0 2.3 2.6 2.1 1.6 2.0 1.8 2.0 2.1 1.9 1.9 2.0 2.2 1.9 2.0 2.1 2.0 2.0
CPIX (y/y)** 1.3 1.4 1.6 1.6 1.5 1.8 1.8 1.8 1.8 1.9 2.0 2.0 1.5 1.7 1.9 1.6 1.8 2.0
BoC Inflation ( y/y)*** 1.9 2.0 2.0 1.9 1.9 1.9 1.9 1.8 1.9 1.9 2.0 2.0 2.0 1.9 1.9 1.9 1.8 2.0
Housing Starts ('000s) 224 218 197 217 187 215 193 195 195 196 196 196 214 198 196 -- -- --
Home Prices (y/y) -4.5 -6.7 0.6 -3.4 -4.0 0.2 -2.9 -1.1 4.6 2.3 3.0 3.0 -3.5 -2.0 3.2 -3.4 -1.1 3.0
Real GDP / worker (y/y) 0.7 0.5 0.8 0.4 -0.5 -1.1 -0.9 -0.2 0.7 1.2 1.1 1.0 0.6 -0.7 1.0 0.4 -0.2 1.0
* Intellectual Property Products. ** CPIX: CPI excluding the 8 most volatile components. *** BoC Inflation: simple average of CPI-trim, CPI-median, and CPI-common.
Source: Statistics Canada, Bank of Canada, Canada Mortgage and Housing Corporation, Haver Analytics, TD Economics.
Canadian Economic OutlookPeriod-Over-Period Annualized Per Cent Change Unless Otherwise Indicated
2018 2019 2020 Annual Average 4th Qtr/4th Qtr
F: Forecast by TD Economics as at June 2019.
Home price measure shown is the CREA Composite Sale Price.

13
@TD_Economicshttp://economics.td.com
Q1 Q2 Q3 Q4 Q1 Q2F Q3F Q4F Q1F Q2F Q3F Q4F 18 19F 20F 18 19F 20F
Real GDP 2.2 4.2 3.4 2.2 3.1 1.9 1.9 1.8 1.7 1.8 1.8 1.9 2.9 2.6 1.8 3.0 2.2 1.8
Consumer Expenditure 0.5 3.8 3.5 2.5 1.3 3.0 2.1 2.0 1.9 2.0 2.2 2.3 2.6 2.4 2.1 2.6 2.1 2.1
Durable Goods -2.0 8.6 3.7 3.6 -4.6 11.5 2.0 3.3 4.2 4.3 4.6 4.6 5.5 3.0 4.3 3.4 2.9 4.4
Business Investment 11.5 8.7 2.5 5.4 2.3 -0.7 2.9 3.2 2.4 2.4 3.4 3.5 6.9 2.8 2.6 7.0 1.9 2.9
Non-Res. Structures 13.9 14.5 -3.4 -3.9 1.7 -4.9 2.4 2.5 2.4 2.5 2.6 2.7 5.0 -0.4 2.0 4.9 0.4 2.5
Equipment & IPP* 10.8 7.1 4.3 8.4 2.4 0.5 3.1 3.4 2.4 2.3 3.6 3.7 7.5 3.8 2.8 7.6 2.3 3.0
Residential Investment -3.4 -1.4 -3.5 -4.7 -3.5 -1.1 -0.4 -0.2 0.0 0.9 1.8 2.3 -0.3 -2.6 0.4 -3.3 -1.3 1.3
Govt. Expenditure 1.5 2.5 2.6 -0.4 2.5 4.9 1.7 1.2 1.2 2.2 -0.1 0.0 1.5 2.2 1.4 1.5 2.6 0.8
Final Domestic Demand 1.9 4.0 2.9 2.1 1.5 2.7 2.0 1.9 1.8 2.0 2.0 2.1 2.9 2.2 2.0 2.7 2.0 2.0
Exports 3.6 9.3 -4.9 1.8 4.8 -3.8 3.8 3.6 3.0 2.9 3.0 3.0 4.0 1.4 2.8 2.3 2.0 3.0
Imports 3.0 -0.6 9.3 2.0 -2.5 -3.3 2.6 2.0 2.5 3.1 3.9 4.0 4.5 0.6 2.4 3.4 -0.3 3.4
Change in Private
Inventories 30.3 -36.8 89.8 96.8 125.5 86.9 77.9 65.5 62.9 54.5 53.7 54.5 45.0 89.0 56.4 -- -- --
Final Sales 1.9 5.4 1.0 2.1 2.5 2.8 2.2 2.1 1.8 2.0 1.8 1.9 2.7 2.4 2.0 2.6 2.4 1.9
International Current
Account Balance ($Bn) -496 -414 -506 -538 -551 -514 -501 -503 -500 -504 -510 -516 -488 -517 -508 -- -- --
% of GDP -2.5 -2.0 -2.5 -2.6 -2.6 -2.4 -2.3 -2.3 -2.3 -2.3 -2.3 -2.3 -2.4 -2.4 -2.3 -- -- --
Pre-tax Corporate Profits
including IVA&CCA 5.0 12.5 14.7 -1.7 -10.8 11.6 4.4 1.2 2.2 1.9 3.8 3.8 7.8 1.9 3.1 7.4 1.2 2.9
% of GDP 10.9 11.0 11.2 11.1 10.7 10.9 10.9 10.8 10.7 10.7 10.7 10.7 11.0 10.8 10.7 -- -- --
GDP Deflator (y/y) 2.0 2.4 2.3 2.1 1.8 1.6 1.8 1.8 2.2 2.2 2.2 2.3 2.2 1.8 2.2 2.1 1.8 2.3
Nominal GDP 4.3 7.6 4.9 4.1 3.6 4.1 4.5 3.7 4.0 4.2 4.2 4.4 5.2 4.3 4.1 5.2 4.0 4.2
Labor Force 2.5 0.6 0.6 2.2 0.5 -0.8 1.1 1.0 1.1 1.7 0.2 0.6 1.1 0.7 0.9 1.5 0.5 0.9
Employment 1.8 1.9 1.8 1.7 1.7 1.2 0.9 0.9 0.9 1.4 0.1 0.4 1.7 1.5 0.9 1.8 1.2 0.7
Change in Empl. ('000s) 641 694 667 649 629 445 328 325 353 542 44 141 2,453 2,202 1,336 2,651 1,727 1,080
Unemployment Rate (%) 4.1 3.9 3.8 3.8 3.9 3.6 3.6 3.7 3.7 3.8 3.9 3.9 3.9 3.7 3.8 -- -- --
Personal Disp. Income 7.0 3.8 4.2 4.7 2.6 3.5 4.0 4.3 4.8 4.7 4.6 4.5 4.9 3.7 4.5 4.9 3.6 4.6
Pers. Savings Rate (%) 7.2 6.7 6.4 6.5 6.7 6.2 6.1 6.2 6.3 6.4 6.4 6.4 6.7 6.3 6.4 -- -- --
Cons. Price Index (y/y) 2.2 2.7 2.6 2.2 1.6 1.9 1.9 2.0 2.4 2.2 2.3 2.4 2.4 1.8 2.3 2.2 2.0 2.4
Core CPI (y/y) 1.9 2.2 2.2 2.2 2.1 2.1 2.2 2.2 2.1 2.3 2.2 2.3 2.1 2.1 2.2 2.2 2.2 2.3
Core PCE Price Index (y/y) 1.7 1.9 2.0 1.9 1.6 1.5 1.7 1.7 1.9 2.0 2.0 2.1 1.9 1.6 2.0 1.9 1.7 2.1
Housing Starts (mns) 1.32 1.26 1.23 1.19 1.20 1.21 1.20 1.19 1.19 1.21 1.23 1.24 1.25 1.20 1.22 -- -- --
Real Output per hour** (y/y) 1.1 1.4 1.3 1.7 2.4 1.9 1.7 1.7 1.1 1.1 1.2 1.3 1.3 1.9 1.1 1.7 1.7 1.3
F: Forecast by TD Economics as at June 2019.
* Intellectual Property Products. ** Non-farm business sector.
Source: Bureau of Labor Statistics, Bureau of Economic Analysis, Census Bureau, TD Economics.
U.S. Economic OutlookPeriod-Over-Period Annualized Per Cent Change Unless Otherwise Indicated
2018 2019 2020 Annual Average 4th Qtr/4th Qtr
14
@TD_Economicshttp://economics.td.com
DisclaimerThis report is provided by TD Economics. It is for informational and educational purposes only as of the date of writing, and may not be appropriate for other pur-poses. The views and opinions expressed may change at any time based on market or other conditions and may not come to pass. This material is not intended to be relied upon as investment advice or recommendations, does not constitute a solicitation to buy or sell securities and should not be considered specific legal, investment or tax advice. The report does not provide material information about the business and affairs of TD Bank Group and the members of TD Economics are not spokespersons for TD Bank Group with respect to its business and affairs. The information contained in this report has been drawn from sources believed to be reliable, but is not guaranteed to be accurate or complete. This report contains economic analysis and views, including about future economic and financial markets performance. These are based on certain assumptions and other factors, and are subject to inherent risks and uncertainties. The actual outcome may be materially different. The Toronto-Dominion Bank and its affiliates and related entities that comprise the TD Bank Group are not liable for any errors or omissions in the information, analysis or views contained in this report, or for any loss or damage suffered.
2017 2018 2019 2020
G7 (30.6%)* 2.2 2.1 1.8 1.4
U.S. 2.2 2.9 2.6 1.8
Japan 1.9 0.8 1.0 0.2
Euro Area 2.5 1.9 1.2 1.3
Germany 2.5 1.5 1.0 1.4
France 2.4 1.7 1.3 1.3
Italy 1.8 0.7 0.2 1.0
United Kingdom 1.8 1.4 1.2 1.3
Canada 3.0 1.9 1.3 1.7
G7 1.8 2.1 1.6 1.9
U.S. 2.1 2.4 1.8 2.3
Japan 0.5 1.0 0.7 1.4
Euro Area 1.5 1.8 1.3 1.4
Germany 1.7 1.9 1.6 1.7
France 1.2 2.1 1.3 1.6
Italy 1.3 1.2 0.8 1.1
United Kingdom 2.7 2.5 1.9 1.8
Canada 1.6 2.2 1.9 2.0
U.S. 4.4 3.9 3.7 3.8
Japan 2.8 2.4 2.5 2.7
Euro Area 9.1 8.2 7.7 7.7
Germany 5.7 5.2 5.0 5.1
France 9.4 9.1 8.7 8.6
Italy 11.3 10.6 10.3 10.5
United Kingdom 4.3 4.0 3.8 3.9
Canada 6.3 5.8 5.7 5.9
Forecast as at June 2019.
Source: National statistics agencies, TD Economics.
Economic Indicators: G7 & EuropeForecast
Real GDP (annual per cent change)
Consumer Price Index (annual per cent change)
Unemployment Rate (per cent annual averages)
*Share of 2017 world gross domestic product (GDP) at PPP.
Real GDP (%) 2017 2018 2019 2020World 100.0 3.8 3.6 3.1 3.3 North America 18.6 2.3 2.7 2.3 1.9 United States 15.3 2.2 2.9 2.6 1.8 Canada 1.4 3.0 1.9 1.3 1.7 Mexico 1.9 2.4 2.0 0.7 2.1 European Union (EU-28) 16.5 2.6 2.0 1.5 1.5 Euro Area (EU-19) 11.6 2.5 1.9 1.2 1.3 Germany 3.3 2.5 1.5 1.0 1.4 France 2.2 2.4 1.7 1.3 1.3 Italy 1.8 1.8 0.7 0.2 1.0 United Kingdom 2.3 1.8 1.4 1.2 1.3 EU accession members 2.6 3.8 3.9 3.3 2.6 Asia 44.3 5.5 5.2 4.8 4.8 Japan 4.3 1.9 0.8 1.0 0.2 Asian NIC's 3.4 3.2 2.7 1.7 2.8 Hong Kong 0.4 3.8 3.0 1.6 2.8 Korea 1.6 3.2 2.7 1.6 2.9 Singapore 0.4 3.7 3.2 1.9 2.8 Taiwan 0.9 3.1 2.6 2.0 2.9 Russia 3.2 1.7 2.2 1.8 1.8 Australia & New Zealand 1.1 2.4 2.8 1.9 2.5 Developing Asia 32.4 6.6 6.4 6.0 6.0 ASEAN-5 5.4 5.3 5.2 4.6 4.6 China 18.2 6.8 6.6 6.2 6.0 India** 7.4 7.1 6.8 6.5 7.2 Central/South America 5.8 0.4 -0.1 0.1 2.4 Brazil 2.5 1.1 1.1 0.8 2.3 Other Developing 13.7 3.5 2.4 2.0 3.0 Other Advanced 1.1 2.4 2.5 2.0 2.1
Source: IMF, TD Economics.
Global Economic OutlookAnnual Per Cent Change Unless Otherwise Indicated
2017 Share* Forecast
*Share of world GDP on a purchasing-power-parity (PPP) basis.
Forecast as at June 2019. **Forecast for India refers to fiscal year.