Embed Size (px)
Citation preview
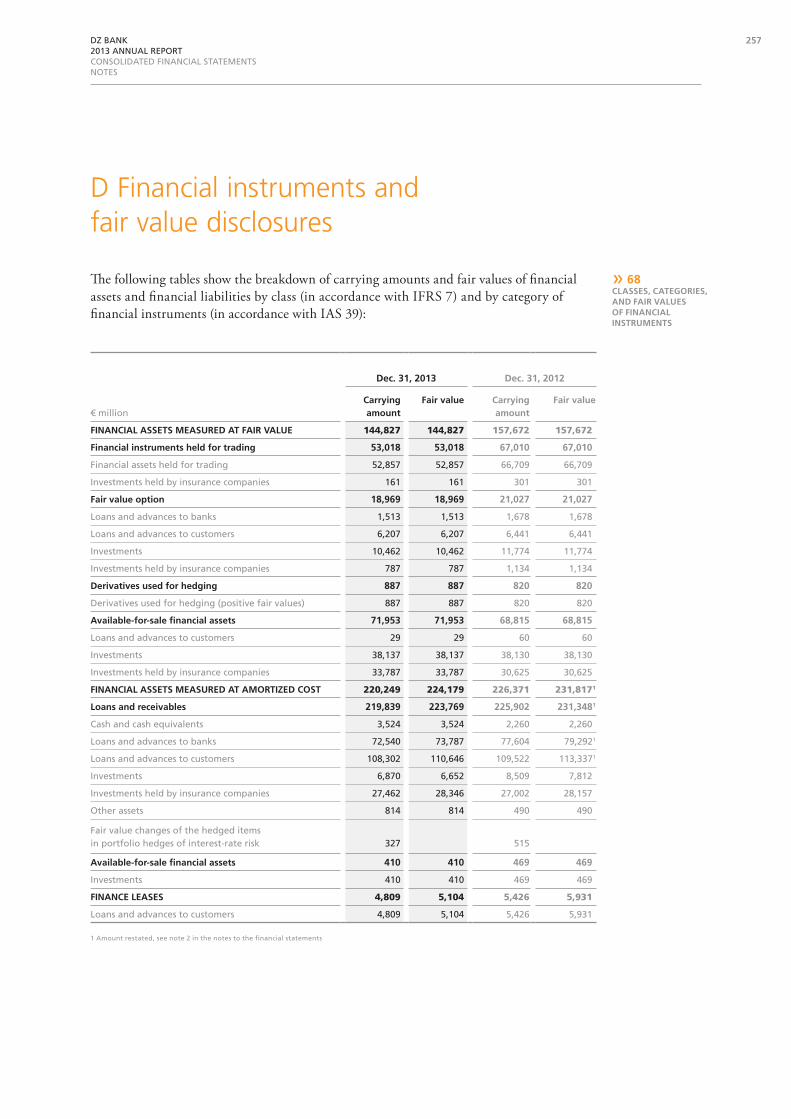
d financial instruments and fair value disclosures
» 68ClassEs, CatEgOriEs, and fair valuEs Of finanCial instrumEnts
The following tables show the breakdown of carrying amounts and fair values of financial assets and financial liabilities by class (in accordance with IFRS 7) and by category of financial instruments (in accordance with IAS 39):
dec. 31, 2013 dec. 31, 2012
€ millionCarrying amount
fair value Carrying amount
fair value
finanCial assEts mEasurEd at fair valuE 144,827 144,827 157,672 157,672
financial instruments held for trading 53,018 53,018 67,010 67,010
Financial assets held for trading 52,857 52,857 66,709 66,709
Investments held by insurance companies 161 161 301 301
fair value option 18,969 18,969 21,027 21,027
Loans and advances to banks 1,513 1,513 1,678 1,678
Loans and advances to customers 6,207 6,207 6,441 6,441
Investments 10,462 10,462 11,774 11,774
Investments held by insurance companies 787 787 1,134 1,134
derivatives used for hedging 887 887 820 820
Derivatives used for hedging (positive fair values) 887 887 820 820
available-for-sale financial assets 71,953 71,953 68,815 68,815
Loans and advances to customers 29 29 60 60
Investments 38,137 38,137 38,130 38,130
Investments held by insurance companies 33,787 33,787 30,625 30,625
finanCial assEts mEasurEd at amOrtizEd COst 220,249 224,179 226,371 231,8171
loans and receivables 219,839 223,769 225,902 231,3481
Cash and cash equivalents 3,524 3,524 2,260 2,260
Loans and advances to banks 72,540 73,787 77,604 79,2921
Loans and advances to customers 108,302 110,646 109,522 113,3371
Investments 6,870 6,652 8,509 7,812
Investments held by insurance companies 27,462 28,346 27,002 28,157
Other assets 814 814 490 490
Fair value changes of the hedged items in portfolio hedges of interest-rate risk 327 515
available-for-sale financial assets 410 410 469 469
Investments 410 410 469 469
finanCE lEasEs 4,809 5,104 5,426 5,931
Loans and advances to customers 4,809 5,104 5,426 5,931
1 Amount restated, see note 2 in the notes to the financial statements
257DZ BANK 2013 ANNUAL REPORTCONSOLIDATED FINANCIAL STATEMENTSNOTES

dec. 31, 2013 dec. 31, 2012
€ millionCarrying amount
fair value Carrying amount
fair value
finanCial liabilitiEs mEasurEd at fair valuE 74,756 74,756 93,035 93,035
financial instruments held for trading 45,805 45,805 58,756 58,756
Financial liabilities held for trading 45,770 45,770 58,715 58,715
Other liabilities 35 35 41 41
fair value option 26,564 26,564 31,266 31,266
Deposits from banks 5,042 5,042 6,572 6,572
Deposits from customers 7,575 7,575 9,476 9,476
Debt certificates issued including bonds 12,612 12,612 13,816 13,816
Subordinated capital 1,335 1,335 1,402 1,402
derivatives used for hedging 2,387 2,387 3,013 3,013
Derivatives used for hedging (negative fair values) 2,387 2,387 3,013 3,013
finanCial liabilitiEs mEasurEd at amOrtizEd COst 223,245 226,538 231,057 235,6881
Deposits from banks 86,319 87,505 94,024 95,3761
Deposits from customers 90,973 92,797 82,693 85,2751
Debt certificates issued including bonds 41,341 41,984 49,474 50,359
Other liabilities 1,472 1,472 1,635 1,635
Subordinated capital 2,891 2,780 2,900 3,043
Fair value changes of the hedged items in portfolio hedges of interest-rate risk 249 331
finanCE lEasEs 30 34 31 35
Other liabilities 30 34 31 35
finanCial guarantEE COntraCts and lOan COmmitmEnts 146 146 145 145
financial guarantee contracts 99 99 87 87
Other liabilities 99 99 87 87
loan commitments 47 47 58 58
Provisions 47 47 58 58
1 Amount restated, see note 2 in the notes to the financial statements
Given the complex structure of home savings contracts and the multitude of scales of rates and charges, there is currently no suitable method for calculating the fair value of an individ-ual contract as at the balance sheet date. Consequently, the fair value cannot be determined using either comparable market prices or suitable option pricing models. The fair values of financial assets and financial liabilities resulting from building society operations are there-fore shown in simplified form at their carrying amounts. On the basis of the models used for building society management, which comprise both collective and non-collective business including deposits, the overall performance of building society operations during the report-ing year was positive.
258 DZ BANK 2013 ANNUAL REPORTCONSOLIDATED FINANCIAL STATEMENTSNOTES

The carrying amounts and fair values reported under investments held by insurance compa-nies relate to receivables and fixed-income securities matched as cover for long-term insurance contract obligations as part of insurance operations. Because these instruments are normally held over their entire maturity, interest-rate-related changes in fair value during the maturity of the financial assets balance each other out in full. The fair value of investments held by insurance companies is only recognized in the proportion attributable to the shareholders of the DZ BANK Group.
financial inStrumentS meaSured at coSt
Investments include shares and other variable-yield securities, investments in subsidiaries, interests in joint ventures, and investments in associates measured at cost with a total carrying amount of €410 million (December 31, 2012: €469 million). There are no active markets for these investments, nor can their fair value be reliably determined by using a valuation technique based on assumptions that do not rely on available observable market data. Furthermore, there are no other markets for these financial instruments. The purpose of these investments is largely to support the business operations of the DZ BANK Group on a permanent basis.
In the year under review, the DZ BANK Group sold a small volume of investments in non-consolidated subsidiaries and other shareholdings in entities in which the group had no significant influence, these investments being measured at cost. This resulted in only negligible losses on disposal.
In 2012, the DZ BANK Group had sold investments in non-consolidated subsidiaries and other shareholdings in companies in which the group had no significant influence with a total carrying amount of €21 million measured at cost. This resulted in gains on disposal of €1 million.
259DZ BANK 2013 ANNUAL REPORTCONSOLIDATED FINANCIAL STATEMENTSNOTES
» 69assEts and liabilitiEs mEasurEd at fair valuE On thE balanCE shEEt
fair value hierarchy
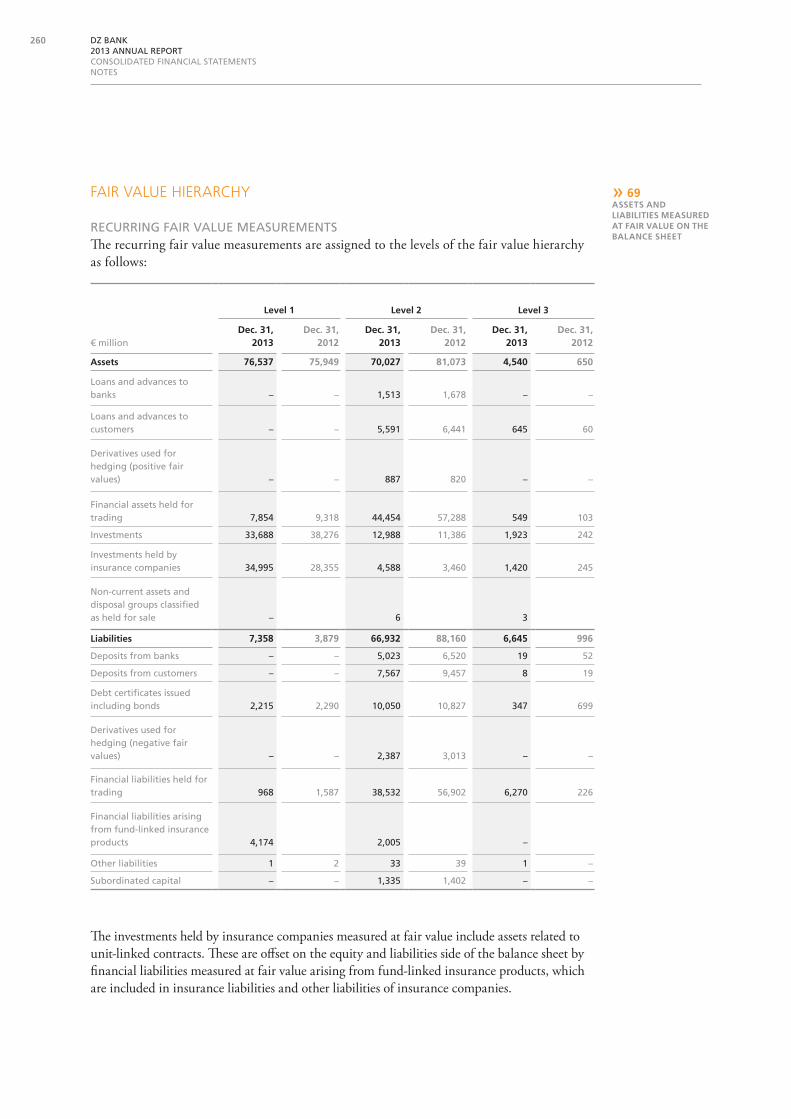
RECuRRING FAIR vALuE mEASuREmENtSThe recurring fair value measurements are assigned to the levels of the fair value hierarchy as follows:
The investments held by insurance companies measured at fair value include assets related to unit-linked contracts. These are offset on the equity and liabilities side of the balance sheet by financial liabilities measured at fair value arising from fund-linked insurance products, which are included in insurance liabilities and other liabilities of insurance companies.
level 1 level 2 level 3
€ milliondec. 31,
2013dec. 31,
2012dec. 31,
2013dec. 31,
2012dec. 31,
2013dec. 31,
2012
assets 76,537 75,949 70,027 81,073 4,540 650
Loans and advances to banks – – 1,513 1,678 – –
Loans and advances to customers – – 5,591 6,441 645 60
Derivatives used for hedging (positive fair values) – – 887 820 – –
Financial assets held for trading 7,854 9,318 44,454 57,288 549 103
Investments 33,688 38,276 12,988 11,386 1,923 242
Investments held by insurance companies 34,995 28,355 4,588 3,460 1,420 245
Non-current assets and disposal groups classified as held for sale – 6 3
liabilities 7,358 3,879 66,932 88,160 6,645 996
Deposits from banks – – 5,023 6,520 19 52
Deposits from customers – – 7,567 9,457 8 19
Debt certificates issued including bonds 2,215 2,290 10,050 10,827 347 699
Derivatives used for hedging (negative fair values) – – 2,387 3,013 – –
Financial liabilities held for trading 968 1,587 38,532 56,902 6,270 226
Financial liabilities arising from fund-linked insurance products 4,174 2,005 –
Other liabilities 1 2 33 39 1 –
Subordinated capital – – 1,335 1,402 – –
260 DZ BANK 2013 ANNUAL REPORTCONSOLIDATED FINANCIAL STATEMENTSNOTES
The rise in recurring fair value measurements assigned to Level 3 is attributable to a revised estimate of the market observability of valuation parameters.
tranSferS
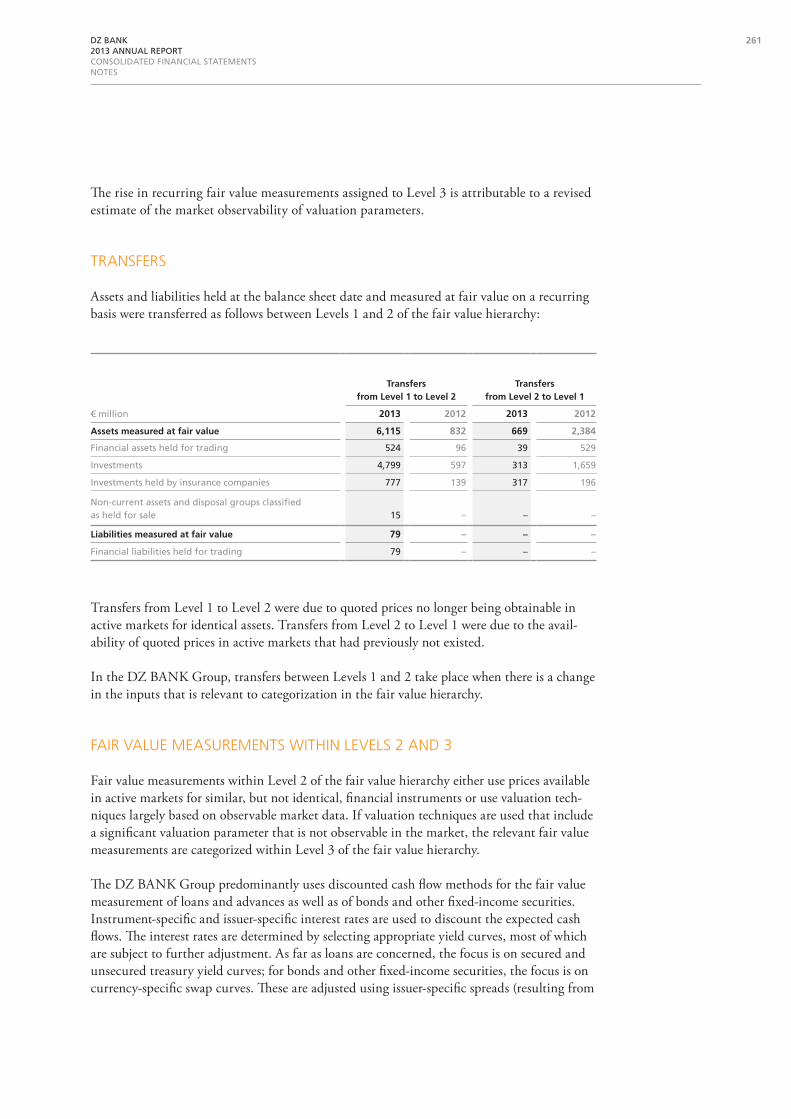
Assets and liabilities held at the balance sheet date and measured at fair value on a recurring basis were transferred as follows between Levels 1 and 2 of the fair value hierarchy:
transfersfrom level 1 to level 2
transfersfrom level 2 to level 1
€ million 2013 2012 2013 2012
assets measured at fair value 6,115 832 669 2,384
Financial assets held for trading 524 96 39 529
Investments 4,799 597 313 1,659
Investments held by insurance companies 777 139 317 196
Non-current assets and disposal groups classified as held for sale 15 – – –
liabilities measured at fair value 79 – – –
Financial liabilities held for trading 79 – – –
Transfers from Level 1 to Level 2 were due to quoted prices no longer being obtainable in active markets for identical assets. Transfers from Level 2 to Level 1 were due to the avail-ability of quoted prices in active markets that had previously not existed.
In the DZ BANK Group, transfers between Levels 1 and 2 take place when there is a change in the inputs that is relevant to categorization in the fair value hierarchy.
fair value meaSurementS within levelS 2 and 3
Fair value measurements within Level 2 of the fair value hierarchy either use prices available in active markets for similar, but not identical, financial instruments or use valuation tech-niques largely based on observable market data. If valuation techniques are used that include a significant valuation parameter that is not observable in the market, the relevant fair value measurements are categorized within Level 3 of the fair value hierarchy.
The DZ BANK Group predominantly uses discounted cash flow methods for the fair value measurement of loans and advances as well as of bonds and other fixed-income securities. Instrument-specific and issuer-specific interest rates are used to discount the expected cash flows. The interest rates are determined by selecting appropriate yield curves, most of which are subject to further adjustment. As far as loans are concerned, the focus is on secured and unsecured treasury yield curves; for bonds and other fixed-income securities, the focus is on currency-specific swap curves. These are adjusted using issuer-specific spreads (resulting from
261DZ BANK 2013 ANNUAL REPORTCONSOLIDATED FINANCIAL STATEMENTSNOTES
the issuer’s internal and external credit rating, sector, and risk category), basis swap spreads, unobservable liquidity spreads, and other spreads. In exceptional cases, the notional amount of the debt instrument in question provides the best evidence of fair value.
The fair value measurements of liabilities attributable to registered creditors, debt certificates issued including bonds, and subordinated capital are determined in the same way as for the debt instruments held by using discounted cash flow methods. The modeling of instrument-specific and issuer-specific interest rates for the discounting is based on secured and unsecured funding caps for liabilities and on the relevant subordinated spreads respectively. Basis swap spreads are also used in some cases.
The fair value measurements of shares and other variable-yield securities and of long-term equity investments accounted for in accordance with IAS 39 are determined by applying income capitalization approaches and observing transaction prices. The best indicator of fair value is deemed to be the transaction prices for recent transactions involving the relevant financial instruments, provided there have been any such transactions. Essentially, the fair value is measured using income capitalization approaches in which future income and dividends – calculated on the basis of forecasts and estimates – are discounted, taking risk parameters into account.
The fair value measurements of investment fund units are determined using the pro rata net asset value. This is adjusted for any outstanding performance-related remuneration entitlements of fund managers; risk adjustments are also taken into account. Some long-term equity invest-ments in real-estate companies are also measured at net asset value. In this case, the liabilities are subtracted from the fair values of the real estate tied up in the company and the result is multiplied by the percentage of shareholding. The prices of units in real-estate funds that are not managed by the DZ BANK Group are provided by the fund management company that manages these funds. These units are measured regularly at net asset value. Fair value measure-ments are also based on valuations, current values, and prices in recent transactions.
The fair value measurement of OTC derivatives applies the option in IFRS 13.48, which enables the total net amount to be measured. In the first step, credit risk is not taken into account. The fair values of OTC option derivatives are measured using generally accepted option pricing models such as the Black-Scholes and Black 76 models or the one-factor and two-factor Hull-White models. Share/index options are measured on the basis of the local volatility model with constant forward skew using a Monte Carlo simulation. Non-option, interest-rate-based OTC derivatives are generally measured in accordance with the multiple-curve approach. Variable cash flows are projected using tenor-specific fixing curves. When future cash flows are discounted, liquidity-related adjustments are made to the relevant yield curves – similarly to the method applied to non-derivative interest-bearing financial instru-ments. In order to determine the fair value of forward forex transactions, the differences between translation at the spot rate and the agreed forward rate are calculated. In the second step, credit risk arising from derivatives is recognized after the total net amount has been determined. Credit valuation adjustments (CVA) are recognized to account for counterparty credit risk and debt valuation adjustments (DVA) are recognized to account for the group’s own credit risk. Their measurement also takes account of collateral and uses market-implied parameters with matching maturities or internal parameters with matching maturities for the probability of default and loss given default.
262 DZ BANK 2013 ANNUAL REPORTCONSOLIDATED FINANCIAL STATEMENTSNOTES
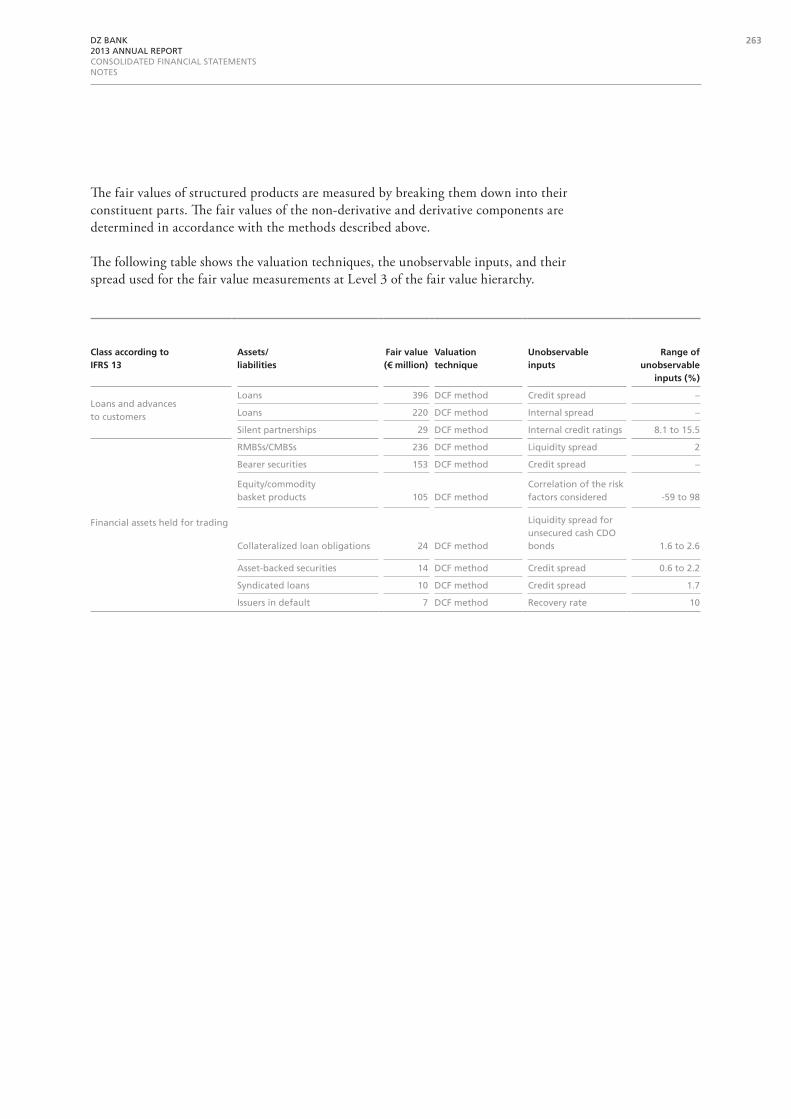
The fair values of structured products are measured by breaking them down into their constituent parts. The fair values of the non-derivative and derivative components are determined in accordance with the methods described above.
The following table shows the valuation techniques, the unobservable inputs, and their spread used for the fair value measurements at Level 3 of the fair value hierarchy.
Class according to ifrs 13
assets/liabilities
fair value (€ million)
valuation technique
unobservable inputs
range of unobservable
inputs (%)
Loans and advances to customers
Loans 396 DCF method Credit spread –
Loans 220 DCF method Internal spread –
Silent partnerships 29 DCF method Internal credit ratings 8.1 to 15.5
Financial assets held for trading
RmBSs/CmBSs 236 DCF method Liquidity spread 2
Bearer securities 153 DCF method Credit spread –
Equity/commodity basket products 105 DCF method
Correlation of the risk factors considered -59 to 98
Collateralized loan obligations 24 DCF method
Liquidity spread for unsecured cash CDO bonds 1.6 to 2.6
Asset-backed securities 14 DCF method Credit spread 0.6 to 2.2
Syndicated loans 10 DCF method Credit spread 1.7
Issuers in default 7 DCF method Recovery rate 10
263DZ BANK 2013 ANNUAL REPORTCONSOLIDATED FINANCIAL STATEMENTSNOTES

Class according to ifrs 13
assets/liabilities
fair value (€ million)
valuation technique
unobservable inputs
range of unobservable
inputs (%)
Investments
Bearer securities 1,296 DCF method Internal spread -2.1 to 1.3
vR Circle 428 DCF methodmultiple-year default probabilities 0 to 100
Bearer securities 80 DCF method Credit spread –
Profit-participation certificates, long-term equity investments 50 DCF method
Assumptions for measurement of risk parameters 9.5 to 10.1
Collateralized loan obligations 14 DCF method
Liquidity spread for unsecured cash CDO bonds 1.6 to 2.6
Investment fund units
44 Net asset value – –
2 DCF method Liquidity spread 25
Investments in subsidiaries 6Income capitaliza-tion approach Future income –
ABSs 3 DCF method Credit spread 0.6 to 2.2
Investments held by insurance companies
Investments in subsidiaries and associates, variable-yield securities, other long-term equity investments, investment fund units
1,136Net asset value method Net asset value –
246Income capitaliza-tion approach Future income –
Registered profit-participation certificates 34 Notional amount – –
variable-yield securities 3Prices offered by issuers – –
Derivatives (positive fair values) 1 Indicative valuationForward exchange rates –
Non-current assets and disposal groups classified as held for sale Real estate 3
Standard valuation methods
Future rent, reference prices –
Deposits from banks and customers
Nth-to-default credit-linked notes 27 DCF method Credit correlation 55 to 80
Debt certificates issued including bonds
Nth-to-default credit-linked notes 200 DCF method Credit correlation 55 to 80
vR Circle 147 DCF methodmultiple-year default probabilities 0 to 100
Financial liabilities held for trading
Equity/commodity basket products 5,762 DCF method
Correlation of the risk factors considered -59 to 98
vR Circle 282 DCF methodmultiple-year default probabilities 0 to 100
Nth-to-default credit-linked notes 226 DCF method Credit correlation 55 to 80
Other liabilities Derivatives (negative fair values) 1
Hull-White, Black 76
Credit spread, volatilities –
264 DZ BANK 2013 ANNUAL REPORTCONSOLIDATED FINANCIAL STATEMENTSNOTES
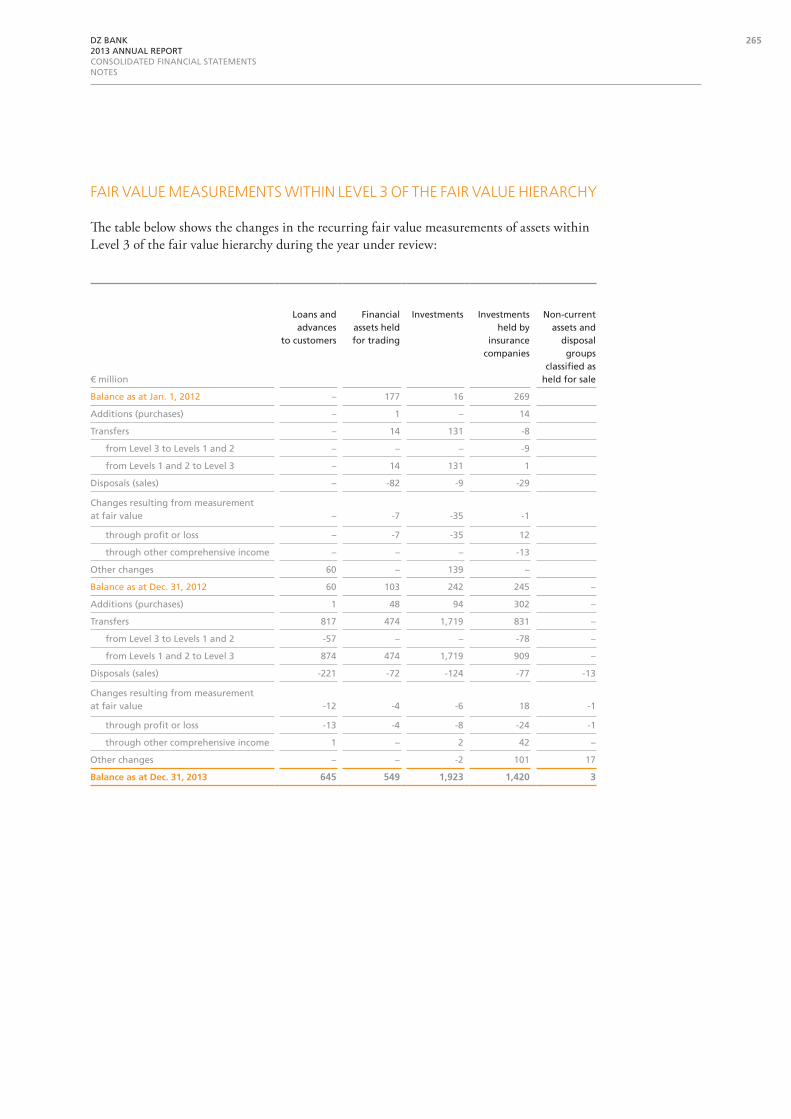
fair value meaSurementS within level 3 of the fair value hierarchy
The table below shows the changes in the recurring fair value measurements of assets within Level 3 of the fair value hierarchy during the year under review:
€ million
Loans and advances
to customers
Financial assets held for trading
Investments Investments held by
insurance companies
Non-current assets and
disposal groups
classified as held for sale
Balance as at Jan. 1, 2012 – 177 16 269
Additions (purchases) – 1 – 14
transfers – 14 131 -8
from Level 3 to Levels 1 and 2 – – – -9
from Levels 1 and 2 to Level 3 – 14 131 1
Disposals (sales) – -82 -9 -29
Changes resulting from measurement at fair value – -7 -35 -1
through profit or loss – -7 -35 12
through other comprehensive income – – – -13
Other changes 60 – 139 –
Balance as at Dec. 31, 2012 60 103 242 245 –
Additions (purchases) 1 48 94 302 –
transfers 817 474 1,719 831 –
from Level 3 to Levels 1 and 2 -57 – – -78 –
from Levels 1 and 2 to Level 3 874 474 1,719 909 –
Disposals (sales) -221 -72 -124 -77 -13
Changes resulting from measurement at fair value -12 -4 -6 18 -1
through profit or loss -13 -4 -8 -24 -1
through other comprehensive income 1 – 2 42 –
Other changes – – -2 101 17
balance as at dec. 31, 2013 645 549 1,923 1,420 3
265DZ BANK 2013 ANNUAL REPORTCONSOLIDATED FINANCIAL STATEMENTSNOTES
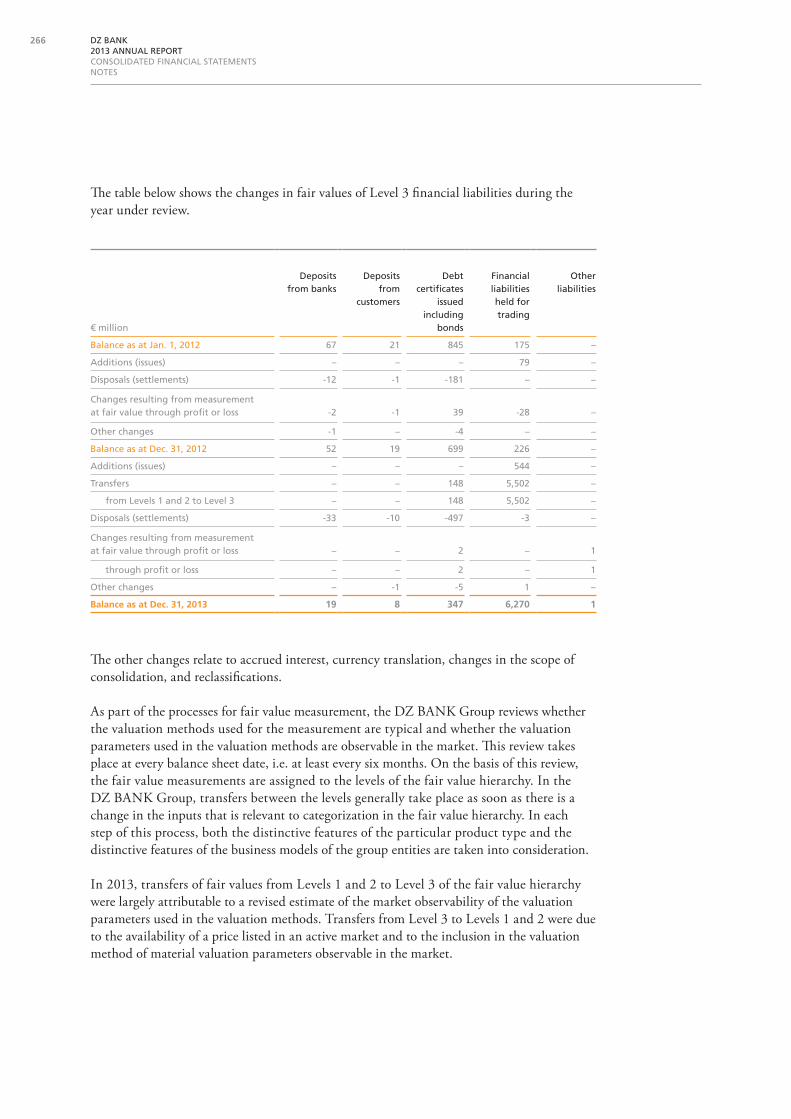
The table below shows the changes in fair values of Level 3 financial liabilities during the year under review.
The other changes relate to accrued interest, currency translation, changes in the scope of consolidation, and reclassifications.
As part of the processes for fair value measurement, the DZ BANK Group reviews whether the valuation methods used for the measurement are typical and whether the valuation parameters used in the valuation methods are observable in the market. This review takes place at every balance sheet date, i.e. at least every six months. On the basis of this review, the fair value measurements are assigned to the levels of the fair value hierarchy. In the DZ BANK Group, transfers between the levels generally take place as soon as there is a change in the inputs that is relevant to categorization in the fair value hierarchy. In each step of this process, both the distinctive features of the particular product type and the distinctive features of the business models of the group entities are taken into consideration.
In 2013, transfers of fair values from Levels 1 and 2 to Level 3 of the fair value hierarchy were largely attributable to a revised estimate of the market observability of the valuation parameters used in the valuation methods. Transfers from Level 3 to Levels 1 and 2 were due to the availability of a price listed in an active market and to the inclusion in the valuation method of material valuation parameters observable in the market.
€ million
Depositsfrom banks
Depositsfrom
customers
Debt certificates
issued including
bonds
Financial liabilities held for trading
Other liabilities
Balance as at Jan. 1, 2012 67 21 845 175 –
Additions (issues) – – – 79 –
Disposals (settlements) -12 -1 -181 – –
Changes resulting from measurement at fair value through profit or loss -2 -1 39 -28 –
Other changes -1 – -4 – –
Balance as at Dec. 31, 2012 52 19 699 226 –
Additions (issues) – – – 544 –
transfers – – 148 5,502 –
from Levels 1 and 2 to Level 3 – – 148 5,502 –
Disposals (settlements) -33 -10 -497 -3 –
Changes resulting from measurement at fair value through profit or loss – – 2 – 1
through profit or loss – – 2 – 1
Other changes – -1 -5 1 –
balance as at dec. 31, 2013 19 8 347 6,270 1
266 DZ BANK 2013 ANNUAL REPORTCONSOLIDATED FINANCIAL STATEMENTSNOTES

The amount recognized in profit or loss resulting from the recurring fair value measure-ments within Level 3 of assets and liabilities held at the balance sheet date constituted a loss of €48 million during the year under review (2012: loss of €1 million). The profit or loss is contained in the line items gains and losses on trading activities, gains and losses on invest-ments, other gains and losses on valuation of financial instruments, and gains and losses on investments held by insurance companies and other insurance company gains and losses.
A worsening in the credit rating of 1 percent would lead to a decrease of €16.4 million in the fair values of the loans and advances to customers reported within Level 3. In the case of investments, the same change would lead to a decrease of €0.1 million in the amount recognized in profit or loss.
Alternative assumptions about the liquidity spreads used could lead to significant changes in respect of unsecured collateralized loan obligations reported under investments and financial assets held for trading. All other things being equal, a rise of 1 percent in liquidity spread assumptions would lead to a decrease recognized in profit or loss in the fair value of these financial assets of €0.5 million and a decrease recognized in other comprehensive income in their fair value of €0.2 million. The credit spread used for a very small proportion of the ABS portfolio is derived from research reports produced by third-party banks. Alternative assumptions about the credit spreads used could lead to significant changes in respect of this portfolio. All other things being equal, a rise of 1 percent in credit spread assumptions would lead to a decrease recognized in profit or loss in the fair value of these financial assets of €0.5 million and a decrease recognized in other comprehensive income in their fair value of €0.2 million.
Alternative assumptions about the correlations used could lead to significant changes in respect of the equity/commodity basket products reported under financial liabilities held for trading. All other things being equal, a rise of 1 percent in correlation assumptions would lead to a decrease recognized in profit or loss in the fair value of these financial liabilities of €2.5 million. Alternative assumptions about the default correlations used could lead to significant changes in the fair values of nth-to-default credit-linked notes reported under financial assets held for trading, financial liabilities held for trading, deposits from banks and customers, and debt certificates issued including bonds. All other things being equal, a rise of 1 percent in correlation assumptions would lead to an increase in the fair value of these financial liabilities of €0.1 million (December 31, 2012: €0.4 million).
Sensitivity analysis is used to calculate the aforementioned changes in the fair value measure-ments. Non-performing exposures and strategically held investments in subsidiaries and other shareholdings whose fair values are calculated using an income capitalization approach are not included in the sensitivity analysis.
267DZ BANK 2013 ANNUAL REPORTCONSOLIDATED FINANCIAL STATEMENTSNOTES

exerciSe of option purSuant to ifrS 13.48
The option offered by IFRS 13.48 of measuring a net risk position for financial assets and financial liabilities is used for portfolios whose components are recognized under the balance sheet items financial assets held for trading, investments, loans and advances to banks, loans and advances to customers, and financial liabilities held for trading.
fair value hierarchy
RECuRRING FAIR vALuE mEASuREmENtSRecurring fair value measurements of assets and liabilities that are not recognized at fair value on the balance sheet, but whose fair value must be disclosed, are assigned to the levels of the fair value hierarchy as follows:
fair value meaSurementS within levelS 2 and 3
The fair value measurements of assets and liabilities that are not recognized at fair value on the balance sheet largely correspond to the fair value measurements of assets and liabilities that are recognized at fair value on the balance sheet.
The following table shows the valuation techniques and the unobservable inputs used in these techniques for the fair value measurements at Level 3 of the fair value hierarchy.
» 70assEts and liabilitiEs nOt mEasurEd at fair valuE On thE balanCE shEEt
as at dECEmbEr 31, 2013
€ million level 1 level 2 level 3
assets 670 128,578 96,916
Cash and cash equivalents – 3,524 –
Loans and advances to banks – 72,148 1,639
Loans and advances to customers – 19,937 90,709
Investments 564 4,768 1,730
Investments held by insurance companies 106 27,855 2,187
Property, plant and equipment, and investment property – 183 –
Other assets – 163 651
liabilities 3,355 175,492 47,790
Deposits from banks – 86,486 1,019
Deposits from customers – 48,272 44,525
Debt certificates issued including bonds 3,327 37,458 1,199
Other liabilities 28 906 637
Subordinated capital – 2,370 410
268 DZ BANK 2013 ANNUAL REPORTCONSOLIDATED FINANCIAL STATEMENTSNOTES
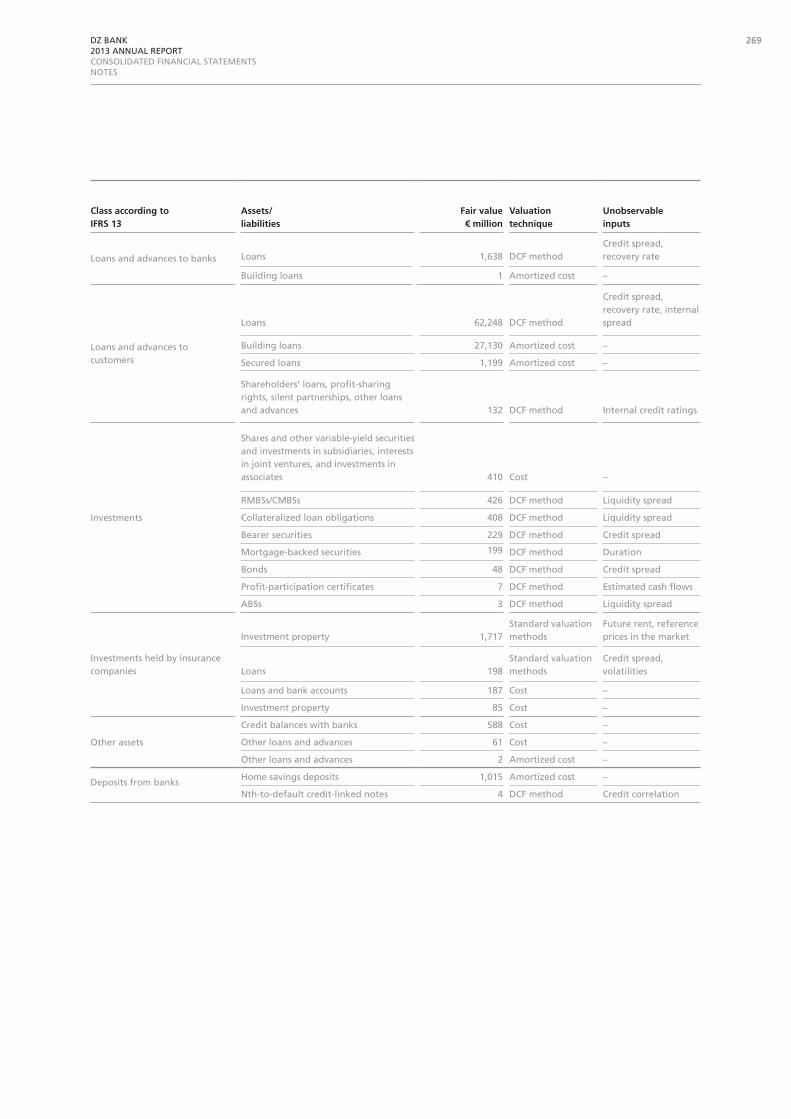
Class according to ifrs 13
assets/liabilities
fair value € million
valuation technique
unobservable inputs
Loans and advances to banks Loans 1,638 DCF methodCredit spread, recovery rate
Building loans 1 Amortized cost –
Loans and advances to customers
Loans 62,248 DCF method
Credit spread, recovery rate, internal spread
Building loans 27,130 Amortized cost –
Secured loans 1,199 Amortized cost –
Shareholders‘ loans, profit-sharing rights, silent partnerships, other loans and advances 132 DCF method Internal credit ratings
Investments
Shares and other variable-yield securities and investments in subsidiaries, interests in joint ventures, and investments in associates 410 Cost –
RmBSs/CmBSs 426 DCF method Liquidity spread
Collateralized loan obligations 408 DCF method Liquidity spread
Bearer securities 229 DCF method Credit spread
mortgage-backed securities 199 DCF method Duration
Bonds 48 DCF method Credit spread
Profit-participation certificates 7 DCF method Estimated cash flows
ABSs 3 DCF method Liquidity spread
Investments held by insurance companies
Investment property 1,717Standard valuation methods
Future rent, reference prices in the market
Loans 198Standard valuation methods
Credit spread, volatilities
Loans and bank accounts 187 Cost –
Investment property 85 Cost –
Other assets
Credit balances with banks 588 Cost –
Other loans and advances 61 Cost –
Other loans and advances 2 Amortized cost –
Deposits from banks Home savings deposits 1,015 Amortized cost –
Nth-to-default credit-linked notes 4 DCF method Credit correlation
269DZ BANK 2013 ANNUAL REPORTCONSOLIDATED FINANCIAL STATEMENTSNOTES

» 71finanCial instrumEnts dEsignatEd as at fair valuE thrOugh prOfit Or lOss
Class according to ifrs 13
assets/liabilities
fair value € million
valuation technique
unobservable inputs
Deposits from customers
Home savings deposits 44,486 Amortized cost –
Loans 23 DCF method Credit spread
Overpayments on consumer finance loans 9 Cost –
Nth-to-default credit-linked notes 7 DCF method Credit correlation
Debt certificates issued including bonds Commercial paper 1,199 Amortized cost –
Other liabilities
Loans 455 Amortized cost –
trade payables, payables from land ownership 74 Cost –
Non-controlling interests in special funds 57 Cost –
Bonds 27 Amortized cost –
Subordinated loans 17 Amortized cost –
Share capital repayable on demand 5 Amount repayable –
Other payables 2 Amortized cost –
Subordinated capital Share capital repayable on demand 410 Amount repayable –
loanS and receivableS deSignated aS at fair value through profit or loSS
The following table shows the maximum exposure to credit risk of loans and receivables designated as at fair value through profit or loss:
€ milliondec. 31,
2013dec. 31,
2012
Loans and advances to banks 1,513 1,678
Loans and advances to customers 6,249 6,492
Investments 479 506
Investments held by insurance companies 376 763
total 8,617 9,439
Financial guarantee contracts with a value of €3,759 million (December 31, 2012: €4,333 mil-lion) furnished by affiliated banks mitigate this credit risk.
270 DZ BANK 2013 ANNUAL REPORTCONSOLIDATED FINANCIAL STATEMENTSNOTES
» 72rEClassifiCatiOns
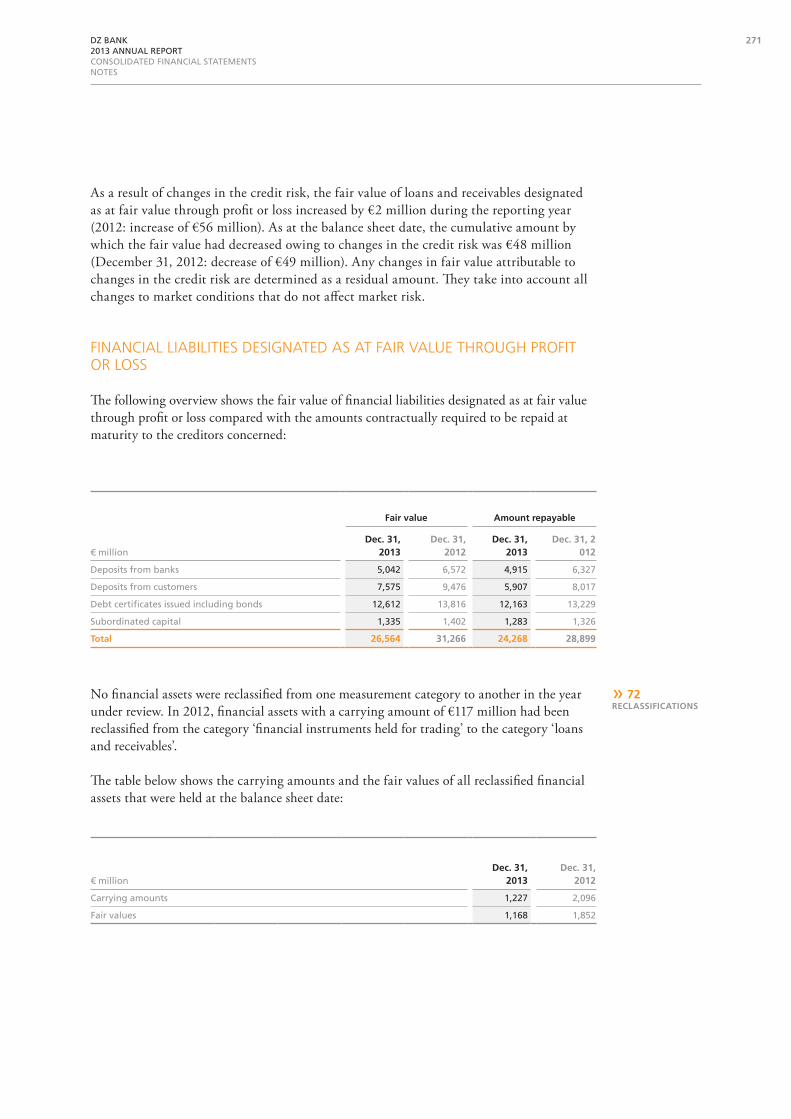
As a result of changes in the credit risk, the fair value of loans and receivables designated as at fair value through profit or loss increased by €2 million during the reporting year (2012: increase of €56 million). As at the balance sheet date, the cumulative amount by which the fair value had decreased owing to changes in the credit risk was €48 million (December 31, 2012: decrease of €49 million). Any changes in fair value attributable to changes in the credit risk are determined as a residual amount. They take into account all changes to market conditions that do not affect market risk.
financial liabilitieS deSignated aS at fair value through profit or loSS
The following overview shows the fair value of financial liabilities designated as at fair value through profit or loss compared with the amounts contractually required to be repaid at maturity to the creditors concerned:
No financial assets were reclassified from one measurement category to another in the year under review. In 2012, financial assets with a carrying amount of €117 million had been reclassified from the category ‘financial instruments held for trading’ to the category ‘loans and receivables’.
The table below shows the carrying amounts and the fair values of all reclassified financial assets that were held at the balance sheet date:
fair value amount repayable
€ milliondec. 31,
2013dec. 31,
2012dec. 31,
2013dec. 31, 2
012
Deposits from banks 5,042 6,572 4,915 6,327
Deposits from customers 7,575 9,476 5,907 8,017
Debt certificates issued including bonds 12,612 13,816 12,163 13,229
Subordinated capital 1,335 1,402 1,283 1,326
total 26,564 31,266 24,268 28,899
€ milliondec. 31,
2013dec. 31,
2012
Carrying amounts 1,227 2,096
Fair values 1,168 1,852
271DZ BANK 2013 ANNUAL REPORTCONSOLIDATED FINANCIAL STATEMENTSNOTES
If all the reclassifications in previous financial years had not taken place, an additional gain of €62 million before taxes would have been recognized in the income statement in 2013 as a result of the fair value measurement (2012: gain of €114 million). In addition, gains before taxes of €18 million in respect of the fair value measurement would have been recognized in other comprehensive income in the reporting year (2012: gains before taxes of €308 million).
In 2013, profit before taxes included a loss of €1 million from gains, losses, income, and expenses in connection with all the reclassified financial assets held (2012: loss of €23 million).
The range of effective interest rates for the financial assets reclassified in 2012 was, at the time of reclassification, 2.2 percent to 5.8 percent. At the date of reclassification, cash flows amounting to €137 million were expected to be recovered for the financial assets reclassified in 2012.
Financial assets and financial liabilities reference standard master agreements, such as ISDA Master Agreements and German Master Agreements for Financial Futures. The standard master agreements contain a global netting agreement that only gives rise to a legally enforceable right to set off the amounts after a future event has occurred (in particular, insolvency).
The following tables show financial assets that were offset as at the balance sheet date, that are subject to a legally enforceable global netting agreement, or that are subject to a similar arrangement:
» 73OffsEtting Of finanCial assEts and finanCial liabilitiEs
272 DZ BANK 2013 ANNUAL REPORTCONSOLIDATED FINANCIAL STATEMENTSNOTES

as at dECEmbEr 31, 2013
€ million
gross amount of
financial assets before
offsetting
gross amount of
offset financial liabilities
net amount of financial
assets(carrying amount)
associated amounts not offset on the
balance sheet
net amount
Financial instru-ments
Cash collateral received
Derivatives 22,225 – 22,225 15,918 2,747 3,560
Reverse repos/securities borrowing 15,748 – 15,748 15,608 – 140
total 37,973 – 37,973 31,526 2,747 3,700
as at dECEmbEr 31, 2012
€ million
gross amount of
financial assets before
offsetting
gross amount of
offset financial liabilities
net amount of financial
assets(carrying amount)
associated amounts not offset on the
balance sheet
net amount
Financial instru-ments
Cash collateral received
Derivatives 35,404 – 35,404 27,404 2,936 5,064
Reverse repos/securities borrowing 14,543 – 14,543 14,489 – 54
Other financial instruments 76 – 76 2 10 64
total 50,023 – 50,023 41,895 2,946 5,182
273DZ BANK 2013 ANNUAL REPORTCONSOLIDATED FINANCIAL STATEMENTSNOTES

as at dECEmbEr 31, 2012
€ million
gross amount of
financial liabilities
before offsetting
gross amount of
offset financial
assets
net amount of financial
liabilities(carrying amount)
associated amounts not offset on the
balance sheet
net amount
Financial instru-ments
Cash collateral received
Derivatives 37,867 – 37,867 27,236 7,659 2,972
Repos/securities lending 5,402 – 5,402 5,384 7 11
Other financial instruments 10 – 10 10 – –
total 43,279 – 43,279 32,630 7,666 2,983
» 74salE and rEpurChasE agrEEmEnts, sECuritiEs lEnding
tranSferS of financial aSSetS
In 2013, the only transfers carried out by the DZ BANK Group in which the transferred assets remained on the balance sheet in their entirety were transfers under sale and repurchase agreements (repos), in which the DZ BANK Group was the original seller, and transfers as part of securities lending transactions.
as at dECEmbEr 31, 2013
€ million
gross amount of
financial liabilities
before offsetting
gross amount of
offset financial
assets
net amount of financial
liabilities(carrying amount)
associated amounts not offset on the
balance sheet
net amount
Financial
instru-ments
Cash collateral received
Derivatives 21,535 – 21,535 15,733 4,556 1,246
Repos/securities lending 9,460 – 9,460 9,348 2 110
total 30,995 – 30,995 25,081 4,558 1,356
The following tables show financial liabilities that were offset as at the balance sheet date, that are subject to a legally enforceable global netting agreement, or that are subject to a similar arrangement:
274 DZ BANK 2013 ANNUAL REPORTCONSOLIDATED FINANCIAL STATEMENTSNOTES
Sale and repurchaSe agreementS
The entities in the DZ BANK Group enter into sale and repurchase agreements using stand-ard banking industry master agreements, notably the Global Master Repurchase Agreement (GMRA) and the master agreement provided by the International Securities Market Associa-tion (ISMA). Under these agreements, the buyer of the securities is permitted to make use of the securities without restriction (with no requirement for a prior counterparty default) and return securities of the same type. If the fair value of the securities received or transferred in such transactions increases or decreases, the entity concerned may be required to furnish additional collateral or may demand additional collateral.
As at the balance sheet date, the sale and repurchase agreements entered into by companies in the DZ BANK Group were exclusively genuine sale and repurchase agreements.
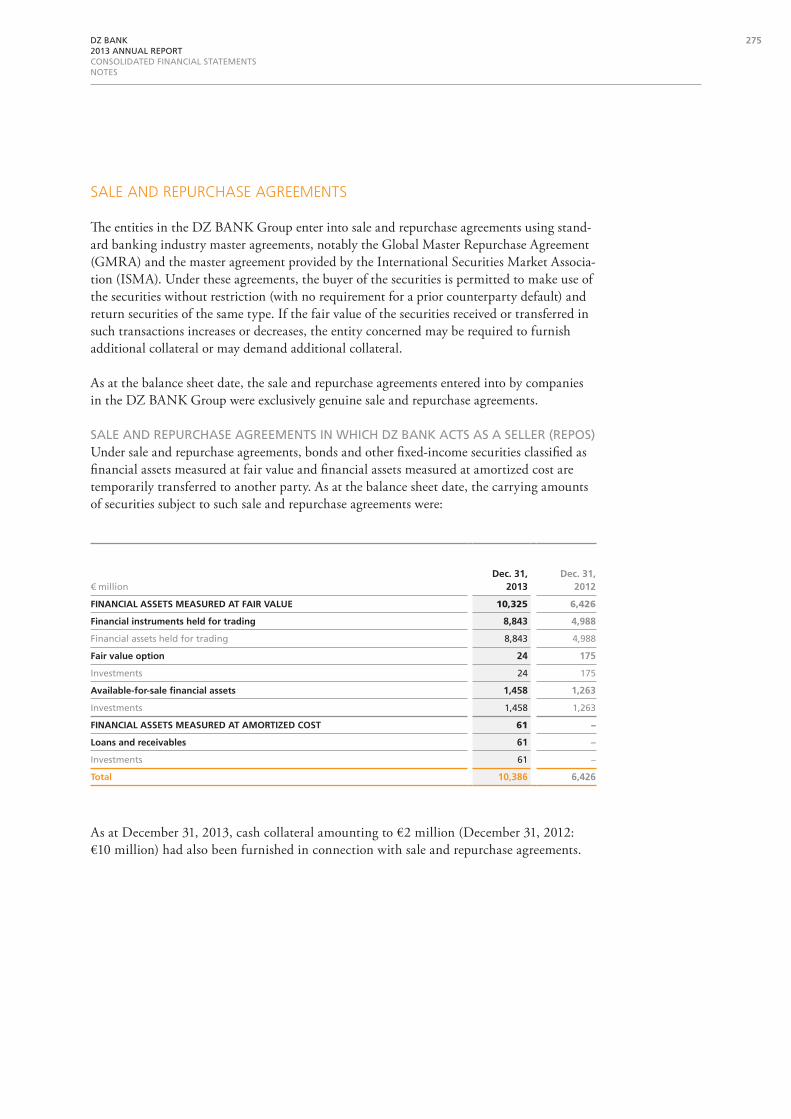
SALE AND REPuRCHASE AGREEmENtS IN WHICH DZ BANK ACtS AS A SELLER (REPOS)Under sale and repurchase agreements, bonds and other fixed-income securities classified as financial assets measured at fair value and financial assets measured at amortized cost are temporarily transferred to another party. As at the balance sheet date, the carrying amounts of securities subject to such sale and repurchase agreements were:
€ milliondec. 31,
2013dec. 31,
2012
finanCial assEts mEasurEd at fair valuE 10,325 6,426
financial instruments held for trading 8,843 4,988
Financial assets held for trading 8,843 4,988
fair value option 24 175
Investments 24 175
available-for-sale financial assets 1,458 1,263
Investments 1,458 1,263
finanCial assEts mEasurEd at amOrtizEd COst 61 –
loans and receivables 61 –
Investments 61 –
total 10,386 6,426
As at December 31, 2013, cash collateral amounting to €2 million (December 31, 2012: €10 million) had also been furnished in connection with sale and repurchase agreements.
275DZ BANK 2013 ANNUAL REPORTCONSOLIDATED FINANCIAL STATEMENTSNOTES
SALE AND REPuRCHASE AGREEmENtS IN WHICH DZ BANK ACtS AS tHE BuyER (REvERSE REPOS)In reverse repo transactions, bonds and other fixed-income securities are bought on a tempo-rary basis. As at December 31, 2013, the fair value of securities involved in such transactions was €15,592 million (December 31, 2012: €14,104 million).
The receivables arising from these reverse repo transactions and reported under financial assets held for trading amounted to €15,715 million as at the balance sheet date (December 31, 2012: €14,117 million). As part of the collateral management requirements, the original seller pro-vides the DZ BANK Group with additional collateral for reverse repo transactions in which the fair value of the securities purchased is less than the amounts receivable from the seller.
SecuritieS lending
Securities lending transactions are undertaken on the basis of the Global Master Securities Lending Agreement (GMSLA) or on the basis of individual contractual arrangements. Under these agreements, the borrower of the securities is permitted to make use of the securities without restriction (with no requirement for a prior counterparty default) and return securities of the same type. If the fair value of the securities received or transferred in such transactions increases or decreases, the entity concerned may be required to furnish additional collateral or may demand additional collateral.
SECuRItIES LENDINGIn securities lending transactions, shares and other variable-yield securities reported under financial assets held for trading are temporarily transferred to another party. All securities lent by the DZ BANK Group are classified as financial assets at fair value. As at the balance sheet date, the carrying amounts of securities lent under securities lending arrangements were as follows:
€ milliondec. 31,
2013dec. 31,
2012
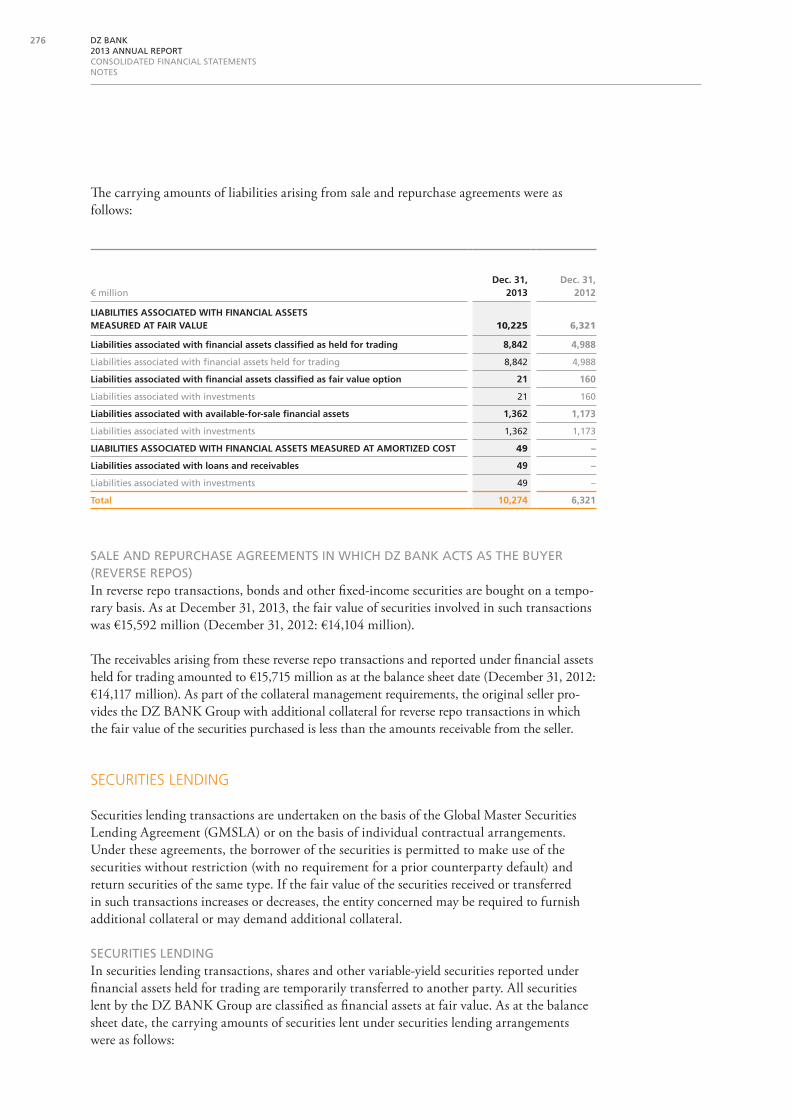
liabilitiEs assOCiatEd with finanCial assEts mEasurEd at fair valuE 10,225 6,321
liabilities associated with financial assets classified as held for trading 8,842 4,988
Liabilities associated with financial assets held for trading 8,842 4,988
liabilities associated with financial assets classified as fair value option 21 160
Liabilities associated with investments 21 160
liabilities associated with available-for-sale financial assets 1,362 1,173
Liabilities associated with investments 1,362 1,173
liabilitiEs assOCiatEd with finanCial assEts mEasurEd at amOrtizEd COst 49 –
liabilities associated with loans and receivables 49 –
Liabilities associated with investments 49 –
total 10,274 6,321
The carrying amounts of liabilities arising from sale and repurchase agreements were as follows:
276 DZ BANK 2013 ANNUAL REPORTCONSOLIDATED FINANCIAL STATEMENTSNOTES

Collateral is provided or received as part of collateral management arrangements in connec-tion with financial assets held for trading that are lent under securities lending agreements. In this process, all positions with the counterparty concerned are netted to determine the collateral to be provided or received.
SECuRItIES BORROWINGThe fair value of borrowed securities as at the balance sheet date was as follows:
€ milliondec. 31,
2013dec. 31,
2012
financial instruments held for trading 16 6
Financial assets held for trading 16 6
available-for-sale financial assets – 578
Investments held by insurance companies – 578
total 16 584
€ milliondec. 31,
2013dec. 31,
2012
Bonds and other fixed-income securities 377 113
Shares and other variable-yield securities 76 211
total 453 324
€ milliondec. 31,
2013dec. 31,
2012
Financial assets held for trading 8,859 4,994
Investments 1,543 1,438
Investments held by insurance companies – 578
total 10,402 7,010
Collateral is furnished for borrowed securities as described in the collateral management arrangements above.
SecuritieS Subject to a Sale and repurchaSe or lending agree-ment that the recipient may Sell or pledge elSewhere aS collat-eral with no requirement for a prior counterparty default
All securities transferred to another party by entities in the DZ BANK Group under sale and repurchase agreements or securities lending agreements may be sold or pledged elsewhere as collateral by the recipient without restriction.
The carrying amounts of the individual balance sheet items concerned are as follows:
277DZ BANK 2013 ANNUAL REPORTCONSOLIDATED FINANCIAL STATEMENTSNOTES

collateral pledged
The breakdown of the carrying amount of financial assets pledged as collateral for liabilities is as follows:
» 75COllatEral
€ milliondec. 31,
2013dec. 31,
2012
Loans and advances to banks 32,704 31,845
Loans and advances to customers 486 498
Financial assets held for trading 7,588 10,800
Investments 2 13
Investments held by insurance companies 391 382
total 41,171 43,538
Loans and advances to banks with a carrying amount of €10 million are pledged as collat-eral for contingent liabilities. No collateral was pledged for contingent liabilities in 2012.
Of the total financial assets pledged as collateral for liabilities, financial assets held for trading and investments with a carrying amount of €1,885 million (2012: €1,320 million) may be sold or pledged elsewhere as collateral by the recipient, even if the relevant entity in the DZ BANK Group is not in default.
Funds received from Germany’s KfW development bank that are to be specifically used for the purposes of development program loans are passed on to affiliated banks. The resulting loans and advances to affiliated banks are lodged with the KfW bank as collateral.
The loans and advances to customers pledged as collateral are building loans issued as part of KfW development program loans. The amounts due to the KfW development bank are secured by assigning to KfW the receivables arising from the forwarding of the development loans together with the collateral furnished by the borrowers.
Securities and money market placements recognized as financial assets held for trading are pledged as collateral for exchange-traded forward transactions, non-exchange-traded deriva-tives and for forward forex transactions. These arrangements are governed by standard industry collateral agreements.
The investments pledged as collateral comprise securities furnished as collateral to cover a facility for short-term drawdown of funding in the event of a financial squeeze.
The investments held by insurance companies are predominantly securities pledged as collateral as part of the reinsurance business; this collateral may only be sold or pledged by the recipient in the event of default by the assignor.
278 DZ BANK 2013 ANNUAL REPORTCONSOLIDATED FINANCIAL STATEMENTSNOTES
» 76itEms Of inCOmE, ExpEnsE, gains, and lOssEs
collateral held
Foreign mortgage rights with a fair value of €37 million (December 31, 2012: €100 million) used as collateral for loans and advances to customers may be repledged as collateral or sold, even in the absence of any payment default by the party providing the collateral. However, there is an obligation to return the collateral to the owner.
net gainS and loSSeS
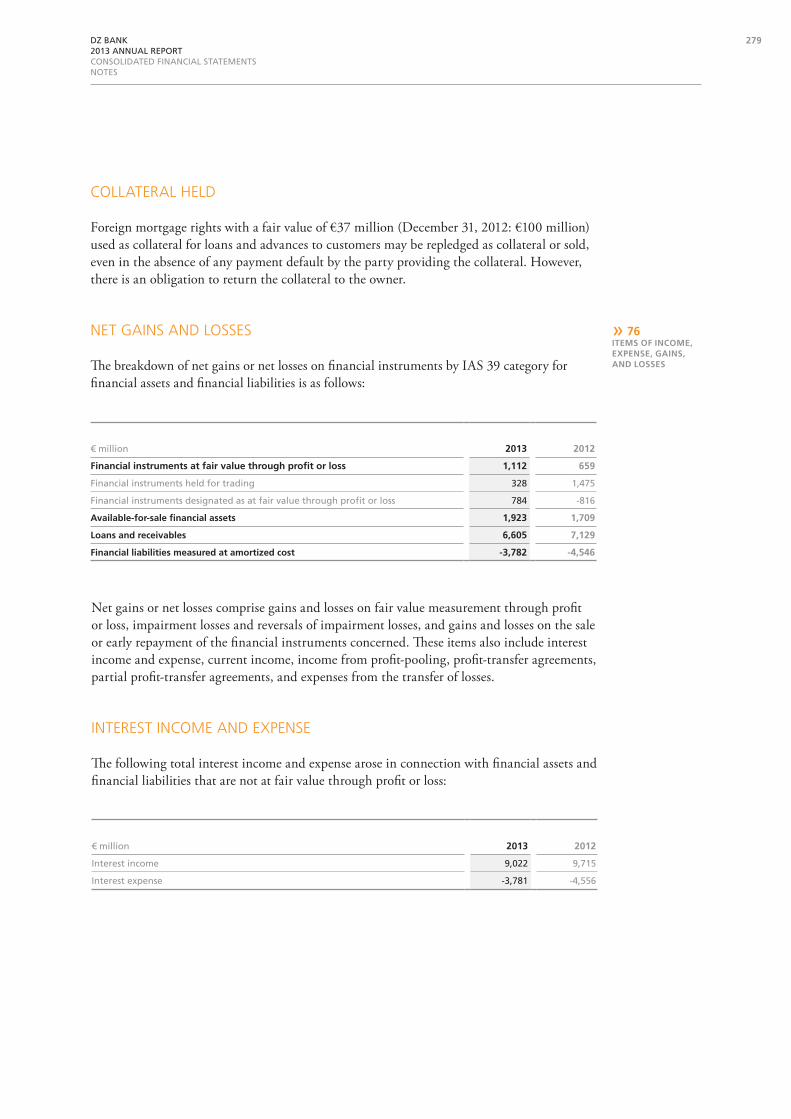
The breakdown of net gains or net losses on financial instruments by IAS 39 category for financial assets and financial liabilities is as follows:
€ million 2013 2012
financial instruments at fair value through profit or loss 1,112 659
Financial instruments held for trading 328 1,475
Financial instruments designated as at fair value through profit or loss 784 -816
available-for-sale financial assets 1,923 1,709
loans and receivables 6,605 7,129
financial liabilities measured at amortized cost -3,782 -4,546
€ million 2013 2012
Interest income 9,022 9,715
Interest expense -3,781 -4,556
Net gains or net losses comprise gains and losses on fair value measurement through profit or loss, impairment losses and reversals of impairment losses, and gains and losses on the sale or early repayment of the financial instruments concerned. These items also include interest income and expense, current income, income from profit-pooling, profit-transfer agreements, partial profit-transfer agreements, and expenses from the transfer of losses.
intereSt income and expenSe
The following total interest income and expense arose in connection with financial assets and financial liabilities that are not at fair value through profit or loss:
279DZ BANK 2013 ANNUAL REPORTCONSOLIDATED FINANCIAL STATEMENTSNOTES

fee and commiSSion income and expenSeS
€ million 2013 2012
finanCial assEts mEasurEd at fair valuE -100 -160
available-for-sale financial assets -100 -160
Loans and advances to customers -13 –
Investments -9 -2
Investments held by insurance companies -78 -158
finanCial assEts mEasurEd at amOrtizEd COst -1,254 -1,200
loans and receivables -1,202 -1,181
Loans and advances to banks -26 -13
Loans and advances to customers -1,141 -1,047
Investments -33 -119
Investments held by insurance companies -2 -2
available-for-sale financial assets -52 -19
Investments -52 -19
finanCE lEasEs -35 -82
Loans and advances to customers -35 -82
€ million 2013 2012
fee and commission income
from financial instruments not at fair value through profit or loss 600 593
from trust and other fiduciary activities 1,869 1,669
fee and commission expenses
for financial instruments not at fair value through profit or loss -808 -734
for trust and other fiduciary activities -665 -571
intereSt income on impaired financial aSSetS
Interest income arising from unwinding the discount on impaired loans and advances recognized at present value as specified in IAS 39.A93 amounted to €39 million (2012: €67 million).
impairment loSSeS on financial aSSetS
The table below shows impairment losses on financial assets broken down by class of financial instrument.
280 DZ BANK 2013 ANNUAL REPORTCONSOLIDATED FINANCIAL STATEMENTSNOTES
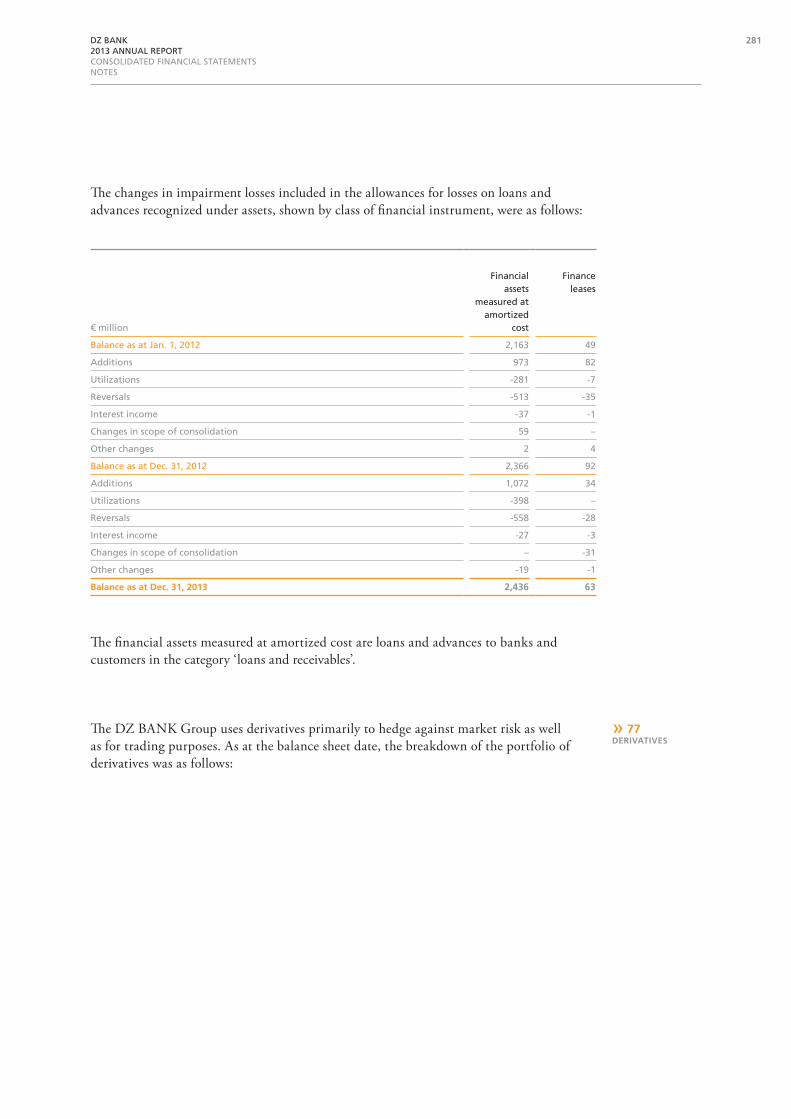
The changes in impairment losses included in the allowances for losses on loans and advances recognized under assets, shown by class of financial instrument, were as follows:
The financial assets measured at amortized cost are loans and advances to banks and customers in the category ‘loans and receivables’.
The DZ BANK Group uses derivatives primarily to hedge against market risk as well as for trading purposes. As at the balance sheet date, the breakdown of the portfolio of derivatives was as follows:
€ million
Financial assets
measured at amortized
cost
Finance leases
Balance as at Jan. 1, 2012 2,163 49
Additions 973 82
utilizations -281 -7
Reversals -513 -35
Interest income -37 -1
Changes in scope of consolidation 59 –
Other changes 2 4
Balance as at Dec. 31, 2012 2,366 92
Additions 1,072 34
utilizations -398 –
Reversals -558 -28
Interest income -27 -3
Changes in scope of consolidation – -31
Other changes -19 -1
balance as at dec. 31, 2013 2,436 63
» 77dErivativEs
281DZ BANK 2013 ANNUAL REPORTCONSOLIDATED FINANCIAL STATEMENTSNOTES
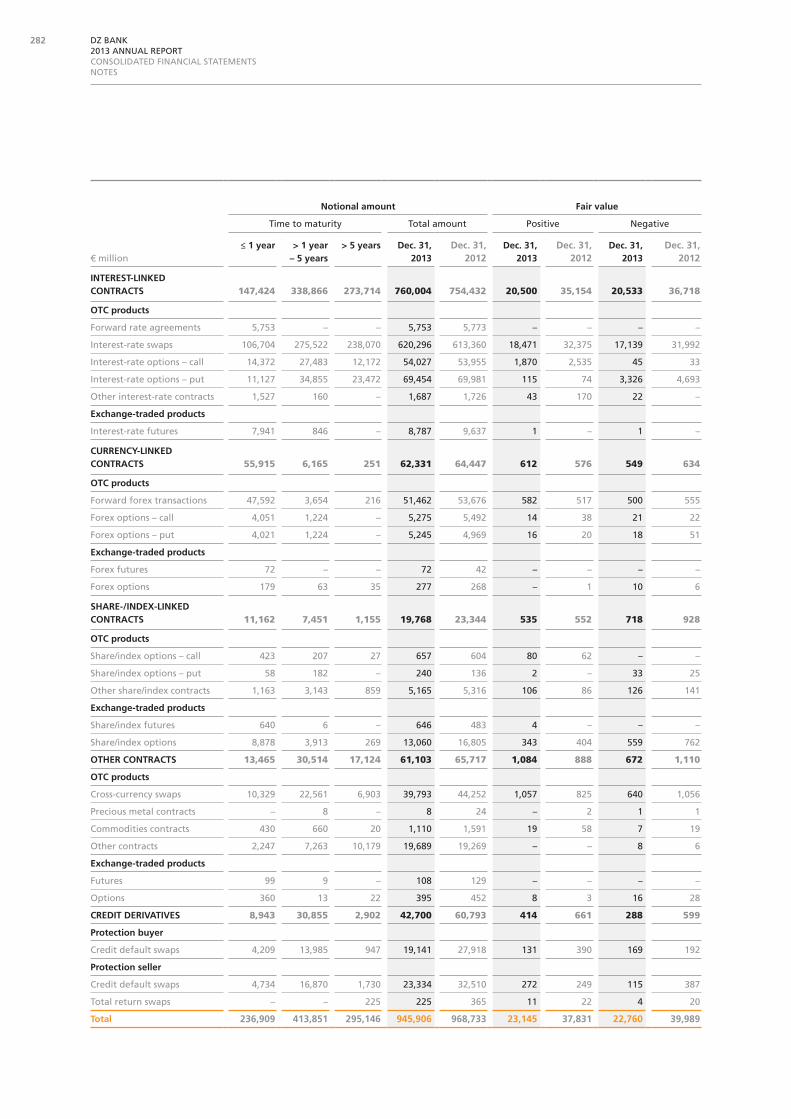
notional amount fair value
time to maturity total amount Positive Negative
€ million≤ 1 year > 1 year
– 5 years> 5 years dec. 31,
2013dec. 31,
2012dec. 31,
2013dec. 31,
2012dec. 31,
2013dec. 31,
2012
intErEst-linkEd COntraCts 147,424 338,866 273,714 760,004 754,432 20,500 35,154 20,533 36,718
OtC products
Forward rate agreements 5,753 – – 5,753 5,773 – – – –
Interest-rate swaps 106,704 275,522 238,070 620,296 613,360 18,471 32,375 17,139 31,992
Interest-rate options – call 14,372 27,483 12,172 54,027 53,955 1,870 2,535 45 33
Interest-rate options – put 11,127 34,855 23,472 69,454 69,981 115 74 3,326 4,693
Other interest-rate contracts 1,527 160 – 1,687 1,726 43 170 22 –
Exchange-traded products
Interest-rate futures 7,941 846 – 8,787 9,637 1 – 1 –
CurrEnCy-linkEd COntraCts 55,915 6,165 251 62,331 64,447 612 576 549 634
OtC products
Forward forex transactions 47,592 3,654 216 51,462 53,676 582 517 500 555
Forex options – call 4,051 1,224 – 5,275 5,492 14 38 21 22
Forex options – put 4,021 1,224 – 5,245 4,969 16 20 18 51
Exchange-traded products
Forex futures 72 – – 72 42 – – – –
Forex options 179 63 35 277 268 – 1 10 6
sharE-/indEx-linkEd COntraCts 11,162 7,451 1,155 19,768 23,344 535 552 718 928
OtC products
Share/index options – call 423 207 27 657 604 80 62 – –
Share/index options – put 58 182 – 240 136 2 – 33 25
Other share/index contracts 1,163 3,143 859 5,165 5,316 106 86 126 141
Exchange-traded products
Share/index futures 640 6 – 646 483 4 – – –
Share/index options 8,878 3,913 269 13,060 16,805 343 404 559 762
OthEr COntraCts 13,465 30,514 17,124 61,103 65,717 1,084 888 672 1,110
OtC products
Cross-currency swaps 10,329 22,561 6,903 39,793 44,252 1,057 825 640 1,056
Precious metal contracts – 8 – 8 24 – 2 1 1
Commodities contracts 430 660 20 1,110 1,591 19 58 7 19
Other contracts 2,247 7,263 10,179 19,689 19,269 – – 8 6
Exchange-traded products
Futures 99 9 – 108 129 – – – –
Options 360 13 22 395 452 8 3 16 28
CrEdit dErivativEs 8,943 30,855 2,902 42,700 60,793 414 661 288 599
protection buyer
Credit default swaps 4,209 13,985 947 19,141 27,918 131 390 169 192
protection seller
Credit default swaps 4,734 16,870 1,730 23,334 32,510 272 249 115 387
total return swaps – – 225 225 365 11 22 4 20
total 236,909 413,851 295,146 945,906 968,733 23,145 37,831 22,760 39,989
282 DZ BANK 2013 ANNUAL REPORTCONSOLIDATED FINANCIAL STATEMENTSNOTES
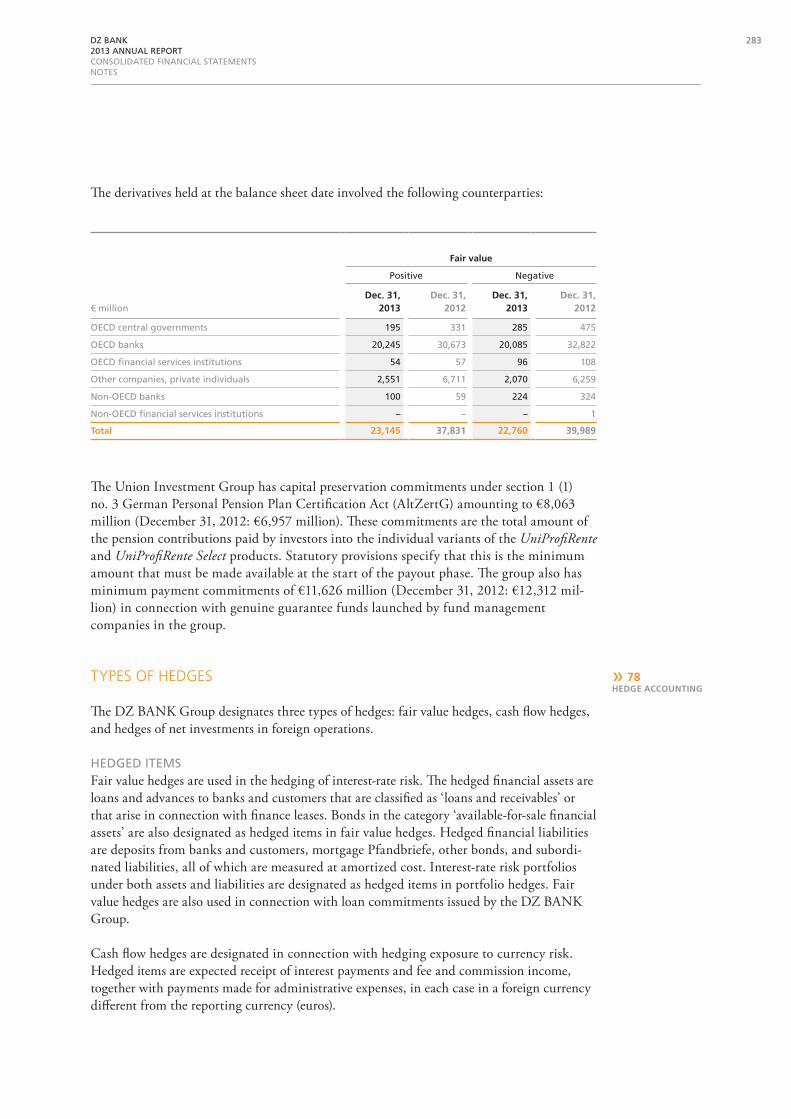
The derivatives held at the balance sheet date involved the following counterparties:
fair value
Positive Negative
€ milliondec. 31,
2013dec. 31,
2012dec. 31,
2013dec. 31,
2012
OECD central governments 195 331 285 475
OECD banks 20,245 30,673 20,085 32,822
OECD financial services institutions 54 57 96 108
Other companies, private individuals 2,551 6,711 2,070 6,259
Non-OECD banks 100 59 224 324
Non-OECD financial services institutions – – – 1
total 23,145 37,831 22,760 39,989
The Union Investment Group has capital preservation commitments under section 1 (1) no. 3 German Personal Pension Plan Certification Act (AltZertG) amounting to €8,063 million (December 31, 2012: €6,957 million). These commitments are the total amount of the pension contributions paid by investors into the individual variants of the UniProfiRente and UniProfiRente Select products. Statutory provisions specify that this is the minimum amount that must be made available at the start of the payout phase. The group also has minimum payment commitments of €11,626 million (December 31, 2012: €12,312 mil-lion) in connection with genuine guarantee funds launched by fund management companies in the group.
typeS of hedgeS
The DZ BANK Group designates three types of hedges: fair value hedges, cash flow hedges, and hedges of net investments in foreign operations.
HEDGED ItEmSFair value hedges are used in the hedging of interest-rate risk. The hedged financial assets are loans and advances to banks and customers that are classified as ‘loans and receivables’ or that arise in connection with finance leases. Bonds in the category ‘available-for-sale financial assets’ are also designated as hedged items in fair value hedges. Hedged financial liabilities are deposits from banks and customers, mortgage Pfandbriefe, other bonds, and subordi-nated liabilities, all of which are measured at amortized cost. Interest-rate risk portfolios under both assets and liabilities are designated as hedged items in portfolio hedges. Fair value hedges are also used in connection with loan commitments issued by the DZ BANK Group.
Cash flow hedges are designated in connection with hedging exposure to currency risk. Hedged items are expected receipt of interest payments and fee and commission income, together with payments made for administrative expenses, in each case in a foreign currency different from the reporting currency (euros).
» 78hEdgE aCCOunting
283DZ BANK 2013 ANNUAL REPORTCONSOLIDATED FINANCIAL STATEMENTSNOTES

Hedges of net investments in foreign operations are designated in connection with hedging exposure to currency risk. The hedged items are interests in joint ventures and investments in associates accounted for using the equity method and denominated in foreign currency.
HEDGING INStRumENtSInterest-rate swaps and swaptions are designated as hedging instruments in fair value hedges of financial assets and financial liabilities.
Forward forex transactions are used as hedging instruments in cash flow hedges and hedges of net investments in foreign operations.
ASSESSmENt OF HEDGE EFFECtIvENESSThe prerequisite for recognizing a hedge under IAS 39 is that the hedge must be highly effective on both a prospective and retrospective basis. Highly effective in this case means that the changes in fair value or expected cash flows for the hedged items must be offset by the changes in fair value or expected cash flows for the hedging instruments within a range of 80 percent to 125 percent specified by IAS 39. Hedge effectiveness must be assessed and documented at every balance sheet date as a minimum. If this assessment identifies that a hedge has not achieved the required effectiveness, the hedge must be reversed retrospectively to the balance sheet date of the last assessment in which the hedge was found to be effective.
In the case of fair value hedges, prospective effectiveness is assessed by using sensitivity analyses (based on the basis point value method), the dollar offset method, a noise threshold value, and linear regression analysis. Retrospective effectiveness is assessed primarily by using the dollar offset method, a noise threshold value, and linear regression analysis. In these methods, the cumulative changes in the fair value of the hedged items attributable to the hedged risk are compared with the changes in the fair value of the hedging instruments.
When assessing the retrospective and prospective effectiveness of cash flow hedges, the changes in the present value of the expected or actual cash flows for the hedged item are compared against the change in the fair value of the hedging instrument.
The prospective effectiveness of hedges of net investments in foreign operations is assessed by means of sensitivity analyses. The dollar offset method is used for the retrospective assessment of effectiveness.
284 DZ BANK 2013 ANNUAL REPORTCONSOLIDATED FINANCIAL STATEMENTSNOTES
caSh flow hedgeS
Cash flows hedged by cash flow hedges comprise cash inflows and cash outflows that will take place in the 2014 financial year and that will be recognized in profit or loss in this period.
In 2013, gains of €10 million in connection with cash flow hedges were recognized in other comprehensive income (2012: gains of €9 million); these were fully offset by reclassifications of minus €10 million to the income statement (2012: reclassification of €33 million). Over-all, no gains or losses were recognized in other comprehensive income in connection with cash flow hedges in 2013 (2012: gains of €42 million).
Of the gains and losses reclassified to the income statement, €9 million was recognized under net interest income, minus €3 million as an increase in administrative expenses, and €4 mil-lion under net fee and commission income. Of the gains and losses reclassified in 2012, minus €35 million was recognized under net interest income and €2 million as a reduction of administrative expenses.
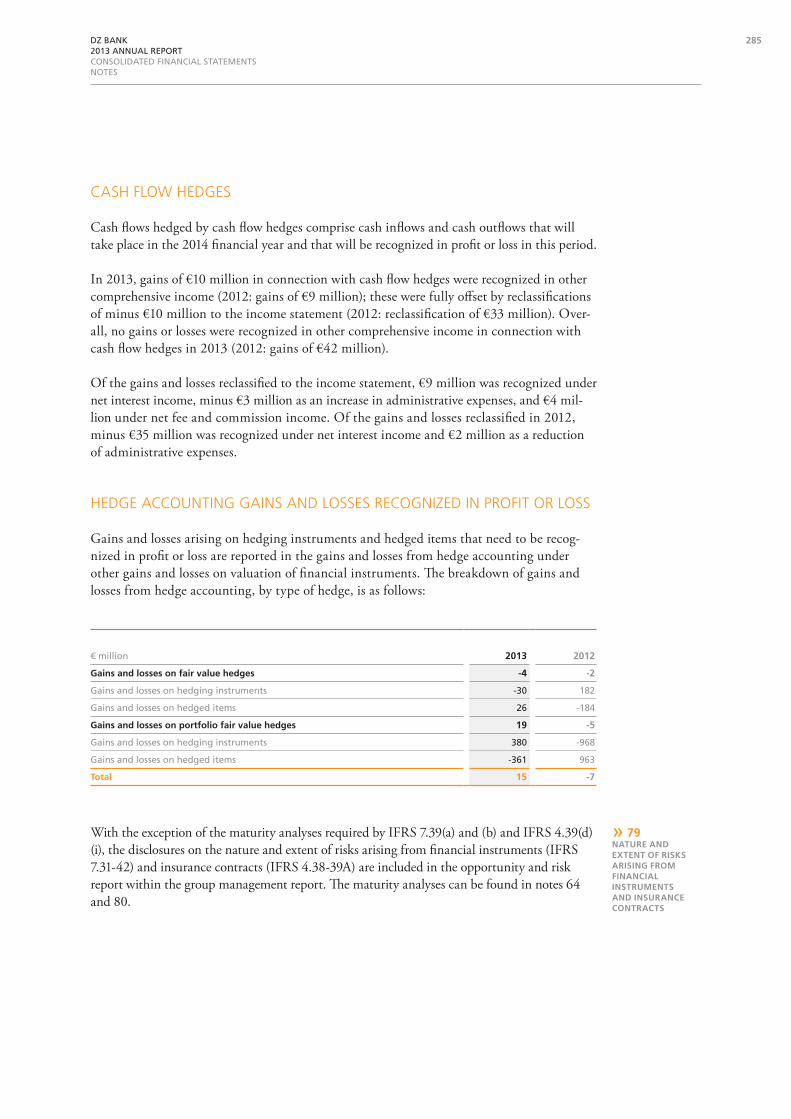
hedge accounting gainS and loSSeS recognized in profit or loSS
Gains and losses arising on hedging instruments and hedged items that need to be recog-nized in profit or loss are reported in the gains and losses from hedge accounting under other gains and losses on valuation of financial instruments. The breakdown of gains and losses from hedge accounting, by type of hedge, is as follows:
€ million 2013 2012
gains and losses on fair value hedges -4 -2
Gains and losses on hedging instruments -30 182
Gains and losses on hedged items 26 -184
gains and losses on portfolio fair value hedges 19 -5
Gains and losses on hedging instruments 380 -968
Gains and losses on hedged items -361 963
total 15 -7
With the exception of the maturity analyses required by IFRS 7.39(a) and (b) and IFRS 4.39(d)(i), the disclosures on the nature and extent of risks arising from financial instruments (IFRS 7.31-42) and insurance contracts (IFRS 4.38-39A) are included in the opportunity and risk report within the group management report. The maturity analyses can be found in notes 64 and 80.
» 79naturE and ExtEnt Of risks arising frOm finanCial instrumEnts and insuranCE COntraCts
285DZ BANK 2013 ANNUAL REPORTCONSOLIDATED FINANCIAL STATEMENTSNOTES

» 80maturity analysis
as at dECEmbEr 31, 2013
€ million
≤ 1 month > 1 month –
3 months
> 3 months –
1 year
> 1 year – 5 years
> 5 years Indefinite
financial assets 39,927 19,888 37,931 152,885 158,831 13,384
Cash and cash equivalents 3,520 4 – – – –
Loans and advances to banks 11,275 2,973 7,717 31,941 27,178 30
Loans and advances to customers 16,250 5,953 15,372 56,953 44,980 47
Derivatives used for hedging (positive fair values) 18 20 116 445 269 –
Financial assets held for trading 5,289 8,561 7,137 15,080 17,776 975
of which: non-derivative financial assets held for trading 4,864 8,009 5,119 4,834 6,928 975
derivatives (positive fair values) 425 552 2,018 10,246 10,848 –
Investments 1,260 1,253 4,586 27,243 25,191 1,518
Investments held by insurance companies 1,150 1,112 2,947 20,618 43,437 10,813
of which: non-derivative investments held by insurance companies 1,136 1,085 2,939 20,539 43,367 10,813
derivatives (positive fair values) 14 27 8 79 70 –
Other assets 1,165 12 56 605 – 1
financial liabilities -67,458 -15,708 -23,196 -87,652 -75,342 -47,603
Deposits from banks -28,576 -6,608 -10,125 -26,473 -22,488 -1,013
Deposits from customers -23,072 -3,167 -2,835 -9,152 -23,571 -45,010
Debt certificates issued including bonds -6,969 -3,404 -4,919 -28,660 -13,427 –
Derivatives used for hedging (negative fair values) -25 -18 -84 -1,262 -943 –
Financial liabilities held for trading -8,264 -2,143 -4,920 -18,357 -11,863 -589
of which: non-derivative financial liabilities held for trading -7,758 -1,521 -2,678 -9,661 -3,240 -586
derivatives (negative fair values) -506 -622 -2,242 -8,696 -8,623 -3
Other liabilities -535 -335 -311 -1,104 -1,152 -580
of which: non-derivative other liabilities -533 -330 -311 -1,090 -1,137 -580
derivatives (negative fair values) -2 -5 – -14 -15 –
Subordinated capital -17 -33 -2 -2,644 -1,898 -411
financial guarantee contracts and loan commitments -23,061 -109 -197 -612 -955 -61
Financial guarantee contracts -4,816 -40 -2 -147 -91 -61
Loan commitments -18,245 -69 -195 -465 -864 –
286 DZ BANK 2013 ANNUAL REPORTCONSOLIDATED FINANCIAL STATEMENTSNOTES
as at dECEmbEr 31, 2012
€ million
≤ 1 month > 1 month –
3 months
> 3 months –
1 year
> 1 year – 5 years
> 5 years Indefinite
financial assets 44,963 17,520 37,757 163,077 165,049 13,457
Cash and cash equivalents 2,219 41 – – – –
Loans and advances to banks 15,758 2,164 7,831 33,890 27,698 4
Loans and advances to customers 17,151 6,388 16,307 59,322 42,505 257
Derivatives used for hedging (positive fair values) 17 22 115 378 188 –
Financial assets held for trading 6,826 6,552 6,300 18,506 28,661 429
of which: non-derivative financial assets held for trading 6,282 5,964 4,141 5,173 8,010 429
derivatives (positive fair values) 544 588 2,159 13,333 20,651 –
Investments 1,385 1,353 4,147 31,326 25,353 1,099
Investments held by insurance companies 847 948 2,958 19,135 40,644 11,668
of which: non-derivative investments held by insurance companies 818 942 2,961 19,093 40,606 11,668
derivatives (positive fair values) 29 6 -3 42 38 –
Other assets 760 52 99 520 – –
financial liabilities -65,039 -17,217 -28,676 -98,294 -93,878 -42,820
Deposits from banks -34,423 -7,379 -10,897 -27,800 -23,944 -900
Deposits from customers -17,593 -3,028 -3,206 -9,655 -26,972 -40,935
Debt certificates issued including bonds -6,593 -4,825 -8,850 -32,412 -15,308 –
Derivatives used for hedging (negative fair values) -35 -21 -82 -1,151 -1,686 –
Financial liabilities held for trading -5,637 -1,611 -5,086 -23,964 -23,062 -1
of which: non-derivative financial liabilities held for trading -5,003 -976 -2,388 -9,723 -3,706 –
derivatives (negative fair values) -634 -635 -2,698 -14,241 -19,356 -1
Other liabilities -723 -293 -332 -796 -1,097 -582
of which: non-derivative other liabilities -707 -292 -330 -785 -1,083 -582
derivatives (negative fair values) -16 -1 -2 -11 -14 –
Subordinated capital -35 -60 -223 -2,516 -1,809 -402
financial guarantee contracts and loan commitments -23,564 -131 -351 -645 -1,074 -77
Financial guarantee contracts -5,026 -28 -31 -85 -133 -77
Loan commitments -18,538 -103 -320 -560 -941 –
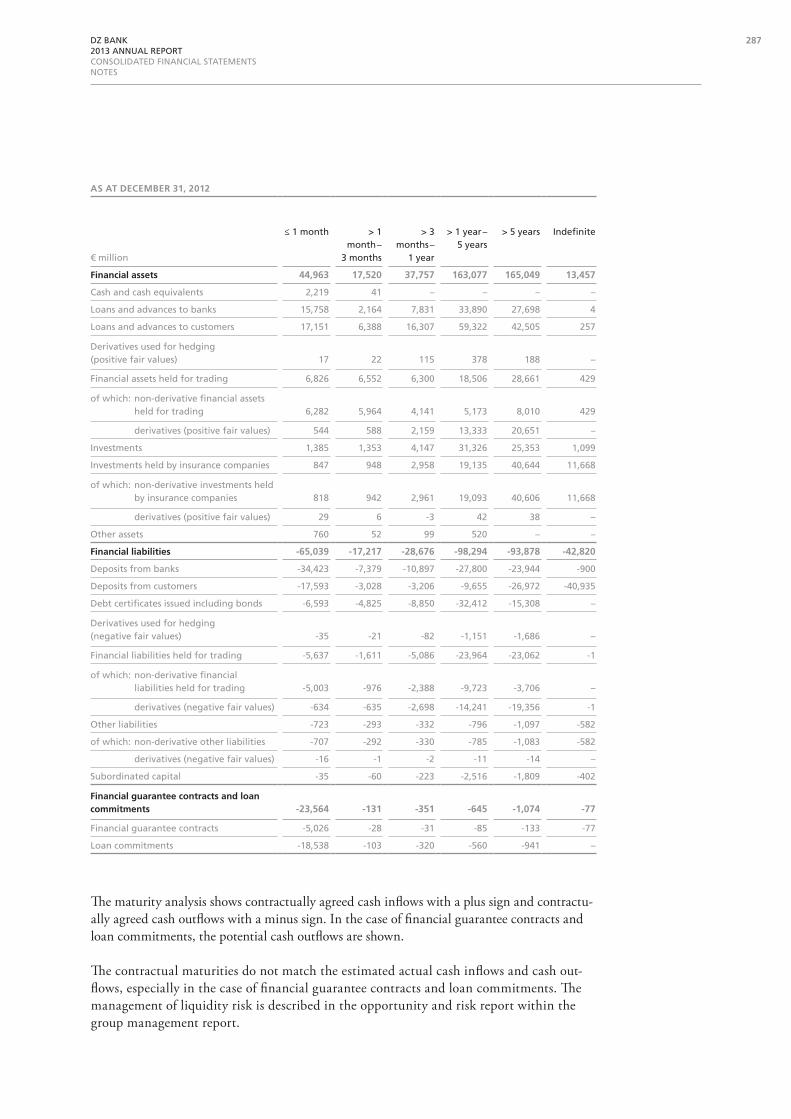
The maturity analysis shows contractually agreed cash inflows with a plus sign and contractu-ally agreed cash outflows with a minus sign. In the case of financial guarantee contracts and loan commitments, the potential cash outflows are shown.
The contractual maturities do not match the estimated actual cash inflows and cash out-flows, especially in the case of financial guarantee contracts and loan commitments. The management of liquidity risk is described in the opportunity and risk report within the group management report.
287DZ BANK 2013 ANNUAL REPORTCONSOLIDATED FINANCIAL STATEMENTSNOTES
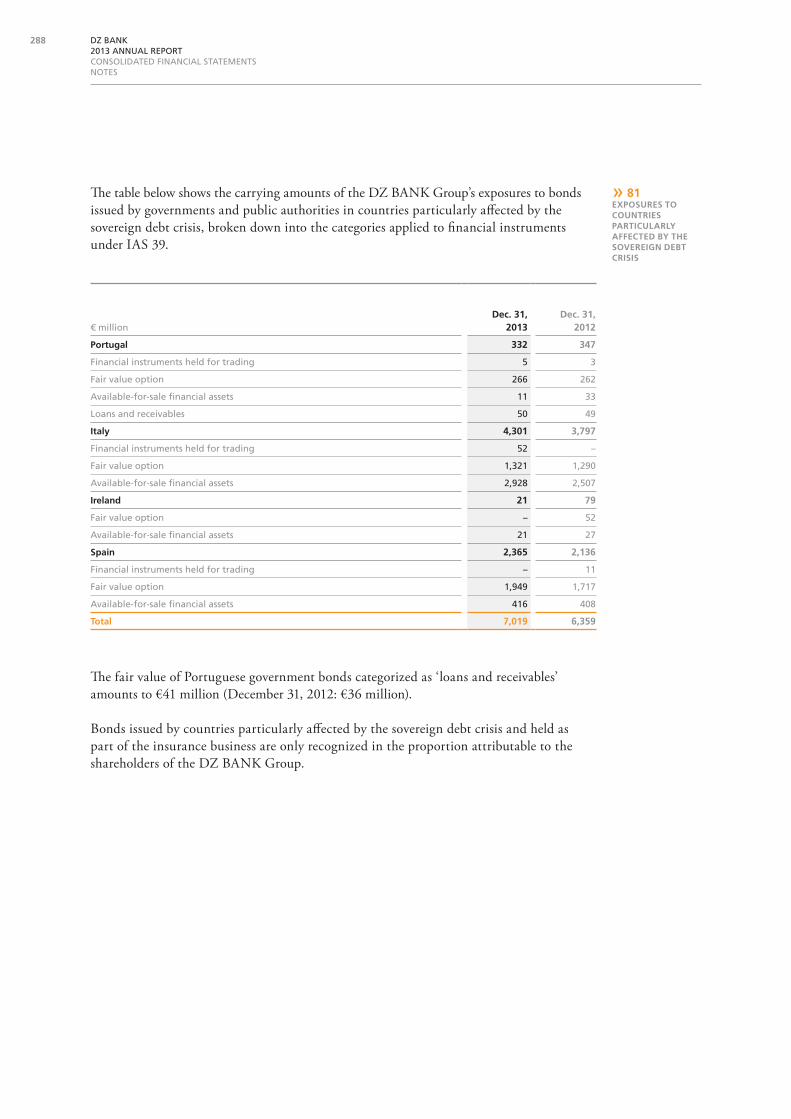
The table below shows the carrying amounts of the DZ BANK Group’s exposures to bonds issued by governments and public authorities in countries particularly affected by the sovereign debt crisis, broken down into the categories applied to financial instruments under IAS 39.
» 81ExpOsurEs tO COuntriEs partiCularly affECtEd by thE sOvErEign dEbt Crisis
The fair value of Portuguese government bonds categorized as ‘loans and receivables’ amounts to €41 million (December 31, 2012: €36 million).
Bonds issued by countries particularly affected by the sovereign debt crisis and held as part of the insurance business are only recognized in the proportion attributable to the shareholders of the DZ BANK Group.
€ milliondec. 31,
2013dec. 31,
2012
portugal 332 347
Financial instruments held for trading 5 3
Fair value option 266 262
Available-for-sale financial assets 11 33
Loans and receivables 50 49
italy 4,301 3,797
Financial instruments held for trading 52 –
Fair value option 1,321 1,290
Available-for-sale financial assets 2,928 2,507
ireland 21 79
Fair value option – 52
Available-for-sale financial assets 21 27
spain 2,365 2,136
Financial instruments held for trading – 11
Fair value option 1,949 1,717
Available-for-sale financial assets 416 408
total 7,019 6,359
288 DZ BANK 2013 ANNUAL REPORTCONSOLIDATED FINANCIAL STATEMENTSNOTES

Fair value hierarchy
The recurring fair value measurements as measured and recognized on the balance sheet are assigned to the levels of the fair value hierarchy as follows:
Level 1 Level 2 Level 3
€ millionDec. 31,
2013Dec. 31,
2012Dec. 31,
2013Dec. 31,
2012Dec. 31,
2013Dec. 31,
2012
Portugal 277 298 5 – – –
Financial instruments held for trading – 3 5 – – –
Fair value option 266 262 – – – –
Available-for-sale financial assets 11 33 – – – –
Italy 3,082 2,970 1,185 827 34 –
Financial instruments held for trading – – 52 – – –
Fair value option 931 897 390 393 – –
Available-for-sale financial assets 2,151 2,073 743 434 34 –
Ireland 21 79 – – – –
Fair value option – 52 – – – –
Available-for-sale financial assets 21 27 – – – –
Spain 806 731 1,520 1,405 39 –
Financial instruments held for trading – – – 11 – –
Fair value option 753 670 1,196 1,047 – –
Available-for-sale financial assets 53 61 324 347 39 –
Total 4,186 4,078 2,710 2,232 73 –
impairment
No impairment losses were recognized to cover exposures in respect of the bonds from other countries particularly affected by the sovereign debt crisis (Portugal, Italy, Ireland, and Spain) because there was insufficient objective evidence of impairment.
289DZ BANK 2013 ANNUAL REPORTCONSOLIDATED FINANCIAL STATEMENTSNOTES
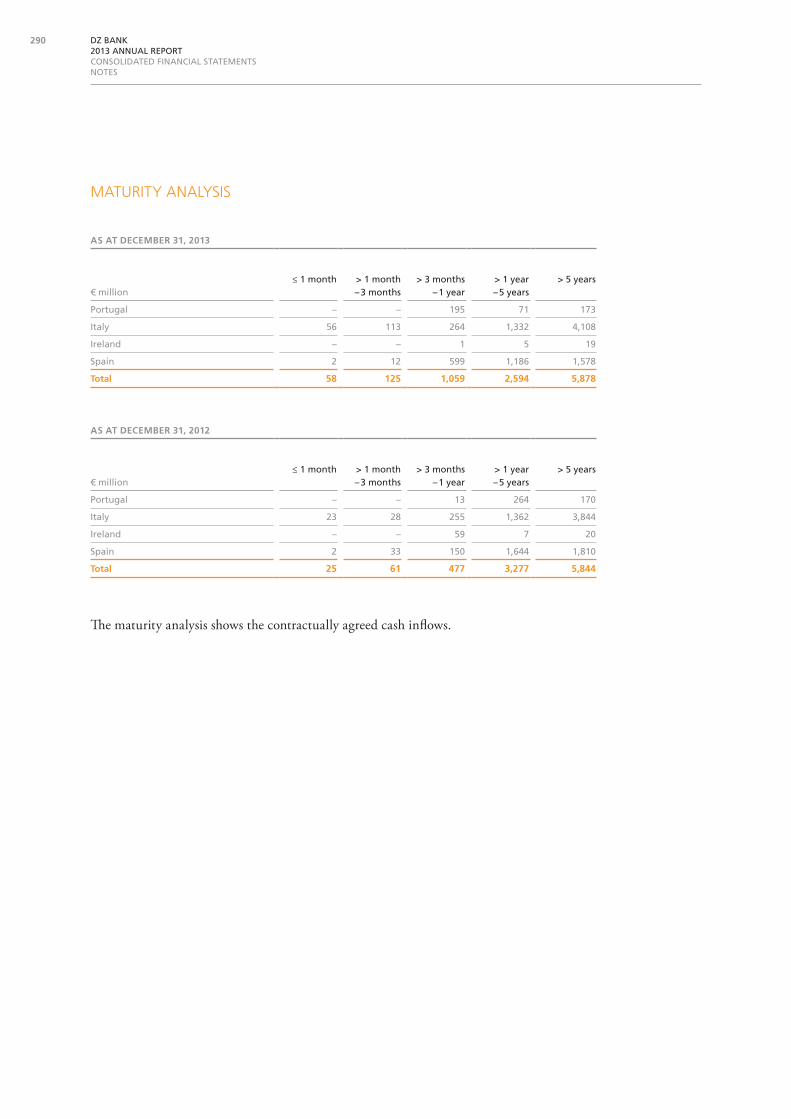
maturity analysis
AS AT December 31, 2013
€ million≤ 1 month > 1 month
– 3 months> 3 months
– 1 year> 1 year – 5 years
> 5 years
Portugal – – 195 71 173
Italy 56 113 264 1,332 4,108
Ireland – – 1 5 19
Spain 2 12 599 1,186 1,578
Total 58 125 1,059 2,594 5,878
AS AT December 31, 2012
€ million≤ 1 month > 1 month
– 3 months> 3 months
– 1 year> 1 year – 5 years
> 5 years
Portugal – – 13 264 170
Italy 23 28 255 1,362 3,844
Ireland – – 59 7 20
Spain 2 33 150 1,644 1,810
Total 25 61 477 3,277 5,844
The maturity analysis shows the contractually agreed cash inflows.
290 DZ BANK 2013 ANNUAL REPORTCONSOLIDATED FINANCIAL STATEMENTSNOTES