Embed Size (px)
Citation preview
RSC Advances
PAPER
Ope
n A
cces
s A
rtic
le. P
ublis
hed
on 0
7 O
ctob
er 2
019.
Dow
nloa
ded
on 3
/14/
2022
7:4
6:21
PM
. T
his
artic
le is
lice
nsed
und
er a
Cre
ativ
e C
omm
ons
Attr
ibut
ion
3.0
Unp
orte
d L
icen
ce.
View Article OnlineView Journal | View Issue
D-Glucose senso
aChemistry Department, Faculty of Science, K
Jeddah 21589, Saudi Arabia. E-mail: mmra
combDepartment of Pharmacy, Faculty of Life a
Dhaka-1100, Bangladesh. E-mail: mmh
† Electronic supplementary informationband-gap energy plot of the NM and S3S1: BGE of the undoped and doped nanoand lattice strain of the prepared NMrepeatability study of the GCE/ZnO10.1039/c9ra06491e
Cite this: RSC Adv., 2019, 9, 31670
Received 19th August 2019Accepted 21st September 2019
DOI: 10.1039/c9ra06491e
rsc.li/rsc-advances
31670 | RSC Adv., 2019, 9, 31670–3168
r based on ZnO$V2O5 NRs by anenzyme-free electrochemical approach†
Mohammed M. Rahman, *a Mohammad Musarraf Hussain *ab
and Abdullah M. Asiri a
A simple wet-chemical technique was used to prepare zinc oxide-doped vanadium pentaoxide nanorods
(ZnO$V2O5 NRs) in an alkaline environment. The synthesized ZnO$V2O5 NRs were characterized using
typical methods, including UV-visible spectroscopy (UV-Vis), Fourier transform infrared spectroscopy
(FTIR), field emission scanning electron microscopy (FESEM), energy dispersive X-ray spectroscopy
(XEDS), X-ray photoelectron spectroscopy (XPS), and X-ray powder diffraction (XRD). The D-glucose (D-
GLC) sensor was fabricated with modification of a slight coating of nanorods (NRs) onto a flat glassy
carbon electrode (GCE). The analytical performances, such as the sensitivity, limit of quantification
(LOQ), limit of detection (LOD), linear dynamic range (LDR), and durability, of the proposed D-GLC
sensor were acquired by a dependable current–voltage (I–V) process. A calibration curve of the GCE/
ZnO$V2O5 NRs/Nf sensor was plotted at +1.0 V over a broad range of D-GLC concentrations (100.0 pM–
100.0 mM) and found to be linear (R2 ¼ 0.6974). The sensitivity (1.27 � 10�3 mA mM�1 cm�2), LOQ (417.5
mM), and LOD (125 250 mM) were calculated from the calibration curve. The LDR (1.0 mM–1000 mM) was
derived from the calibration plot and was also found to be linear (R2 ¼ 0.9492). The preparation of
ZnO$V2O5 NRs by a wet-chemical technique is a good advancement for the expansion of nanomaterial-
based sensors to support enzyme-free sensing of biomolecules in healthcare fields. This fabricated GCE/
ZnO$V2O5 NRs/Nf sensor was used for the recognition of D-glucose in real samples (apple juice, human
serum, and urine) and returned satisfactory and rational outcomes.
1. Introduction
Zinc oxide nanoparticles (ZnO NPs) are a signicant n-typesemi-conductor and have attracted much attention due totheir intriguing characteristics, for example, high electronmobility, high transmittance for visible light, and strongluminescence. Several applications, such as acoustic wavedevices, light-emitting diodes, piezoelectric transducers,solar cell windows, transparent conductors, sensors,biosensors, gas-sensors, and thin lm transistors, of ZnONPs have been investigated.1 A signicant amount ofresearch has been devoted to the development of various ZnOnanostructures, such as belts, combs, bers, particles,
ing Abdulaziz University, P.O. Box 80203,
[email protected]; mmrahmanh@gmail.
nd Earth Sciences, Jagannath University,
[email protected]; m.musarraf.
(ESI) available: Fig. S1 and S2: UV and: Elemental analysis of the NM. Tablematerials, Table S2: Particle diameter, and Table S3: Reproducibility and$V2O5 NRs/Nf sensor. See DOI:
2
ribbons, rods, sheets, spheres, tubes, and wires.2 Meanwhile,various oxides of vanadium occur as VO, VO2, V2O3, and V2O5
depending on the oxidation state of vanadium (V2+ to V5+).Vanadium pentoxide (V2O5) can be considered as a promisingcathode material. A variety of V2O5 nanostructures, such asmicrospheres, nanobelts, nanoowers, nanosheets, nano-wires, and core/shell nanowires, have been reported in earlierstudies. V2O5 possesses excellent chemical and thermalstability, and unique electrochemical and photoelectriccharacteristics, and is used as a gas sensor, catalyst, windowfor solar cells, and in electrochromic devices.3–6
A sensor is a diagnostic tool in which an element can becombined with a physicochemical transducer for the recog-nition of a specic constituent. A transducer transforms theindication arising from the interaction of the analyte with thecomponent into a quantiable signal, such as current orvoltage, which can be determined effortlessly.7 D-Glucose (D-GLC) is a preliminary energy source of the human body, andhelps in the formation of metabolic intermediates. However,an inappropriate concentration of D-GLC in blood leads todiabetes mellitus and can cause various complications, suchas blindness, cardiac, ocular, and peripheral vasculardiseases, stroke, and kidney failure. The human body regu-lates blood D-GLC levels at a concentration of 70–120 mg
This journal is © The Royal Society of Chemistry 2019
Paper RSC Advances
Ope
n A
cces
s A
rtic
le. P
ublis
hed
on 0
7 O
ctob
er 2
019.
Dow
nloa
ded
on 3
/14/
2022
7:4
6:21
PM
. T
his
artic
le is
lice
nsed
und
er a
Cre
ativ
e C
omm
ons
Attr
ibut
ion
3.0
Unp
orte
d L
icen
ce.
View Article Online
dL�1. Diabetic patients demonstrate a markedly high D-GLClevel because they are unable to control their sugar level.8–10
The monitoring of D-GLC in biotechnology, clinical diag-nosis, and the food industry is growing in current daysaccompanied by its stable enhancement using a number ofprocedures. Generally, electrochemical sensors for D-glucosedetection can be classied into two types: enzymatic and non-enzymatic. A lot of research has been performed on non-enzymatic D-glucose sensors (NEDGSs) with the purpose ofovercoming the drawback of the mediators and enzymes usedin such biosensors. NEDGS represent the 4th generation of D-GLC sensor, and are simpler to organize, inexpensive, andhave advanced stability compared with other conventional D-GLC sensors. Usually in biosensors, an enzyme acts asa catalyst, but in NEDGS the character of the modier is ofgreat signicance since atoms at the surface of the electrodeact as electrocatalysts. A diversity of materials, such ascarbon nanotubes, graphene oxide, hybrids, metal oxides orhydroxides, noble metals, and polymers, have been advancedas NEDGSe for their response to the electrocatalytic oxidationof D-glucose. Different metal oxides and bimetallic oxidecomposites have been proposed as NEDGSs due to theirenhanced synergistic catalytic effect. Two aspects can exten-sively affect the electrochemical performances of a sensor:the technique used for the preparation of the metal oxide andits interaction with the support electrode, and the charac-teristics of the support electrode (electron transfer rate,geometry, and surface area).11 Different approaches havebeen developed for the identication of D-glucose, such as: (i)colorimetry, (ii) chromatography, (iii) electrochemistry, (iv)electrochemiluminescence, (v) infrared spectroscopy, (vi)ow injection analysis, (vii) uorimetry, (viii) Raman spec-troscopy, (ix) photo-electrochemistry, (x) quantum dots, (xi)optical polarization rotation measurement, (xii) photo-acoustic probes, (xiii) surface plasmon resonance, (xiv)thermometric, (xv) enzymatic, (xvi) magnetic, (xvii) piezo-electric, (xviii) optical measurement, and (xix) oxygen sensortechniques.12–17 However, these methods tend to be expen-sive, time consuming, and extra care is necessary inhandling. Hence, it remains necessary to design an accurate,simple, highly sensitive, less expensive, non-invasive, user-friendly, responsive, quantitative, specic, and real-timemonitoring system as a D-GLC sensor, in particular, inorder to avoid the micro- and macrovascular complicationsof other typical detection methods of D-glucose.18–20 Thisresearch work demonstrated the design, categorization, anddevelopment of a D-glucose sensor based on ZnO$V2O5 NRsand Naon (Nf) using an I–V method. The proposed GCE/ZnO$V2O5 NRs/Nf sensor was tested by applying it to thedetermination of the D-glucose concentration in spiked bio-logical and food samples, and achieved good results.
2. Experimental2.1 Materials and method
Analytical-grade reagents, including EtOH, Naon (Nf),NaOH, ascorbic acid, L-aspartic acid, cholesterol, D-glucose,
This journal is © The Royal Society of Chemistry 2019
GABA, glycine, L-cysteine, L-tyrosine, tannic acid, and uricacid, were purchased from Sigma-Aldrich Company, KSA, andused as received FTIR and UV-Vis spectra of the off-whiteZnO$V2O5 NRs were recorded on a Thermo Scientic NICO-LET iS50 FTIR spectrometer and Evolution 300 UV-Vis spec-trophotometer, correspondingly. Electrochemical criteria(arrangement, morphology, elemental analysis, and particlesize) of the ZnO$V2O5 NRs were evaluated by means of anFESEM instrument (JEOL, Japan) with XEDS attached. XRDexperiments were also performed under ambient conditionsto determine the crystalline pattern of the ZnO$V2O5 NRs.XPS experimentation was conducted for the determination ofthe binding energies among Zn, V, and O on a K-a1 spec-trometer (K-a1 1066, Thermo Scientic) with an excitationradiation source (A1 Ka1). The I–V procedure was conductedat a particular point using the modied GCE with ZnO$V2O5
NRs on a Keithley electrometer (USA, 6517A) in order todetermine the biomolecules.
2.2 Preparation of the ZnO$V2O5 NRs
The ZnO$V2O5 NRs were synthesized by using an easy weightchemical technique (WCT)21,22 from the reacting precursors ofzinc chloride (ZnCl2), vanadium chloride (VCl3), and NaOH.WCT is an established solid-state procedure and is extensivelyapplied in the preparation of undoped or doped nanomaterials.In this procedure, ZnCl2 (13.79 g) and VCl3 (7.86 g) were dis-solved in distilled water (DW) in two separate round-bottomasks for the preparation of mother solutions of ZnCl2(100.0 mM and 1.0 L) and VCl3 (100.0 mM and 500.0 mL) underconstant stirring. Doping solutions of the NRs of ZnO$V2O5
(100.0 mL) were made from these mother solutions in 1 : 1,1 : 2, 1 : 3, and 1 : 4 ratios and the pH of the consequentialsolutions (Table S1†) was controlled with the addition of NaOHand then the solutions were positioned on a hot plate at 90.0 �Cwith continuous stirring. The asks were cleaned with waterand acetone accordingly aer 6.0 h of continuous stirring andsubsequently kept for solvent evaporation in the open air (24 h)at room temperature. Secondary ZnO$V2O5 NRs were dried inthe oven at 60.0 �C (24 h), ground into powders, and again driedat 60.0 �C in the oven (24 h) consecutively for use in the opticalcharacterization and for application. A feasible mechanism forthe growth of ZnO$V2O5 NRs is as follows (eqn i–v).
ZnCl2 + 2NaOH / Zn(OH)2(aq) + 2NaCl(s)Y (i)
Zn(OH)2(aq) / ZnO(s)Y + H2O (ii)
VCl3 + 3NaOH / V(OH)3(aq)Y + 3NaCl(s)Y (iii)
2V(OH)3(aq) / V2O5(s)Y + H2O + 2H2[ (iv)
ZnO(s) + V2O5(s) / ZnO$V2O5(s)Y (v)
According to the Ostwald-ripening principle, ZnO$V2O5
nucleus development is accomplished primarily by commonaggregation, followed by re-aggregation of the nanocrystals.Nanocrystals are crystallized and re-aggregated with each other
RSC Adv., 2019, 9, 31670–31682 | 31671
Scheme 1 Growth mechanisms of ZnO$V2O5 NRs.
RSC Advances Paper
Ope
n A
cces
s A
rtic
le. P
ublis
hed
on 0
7 O
ctob
er 2
019.
Dow
nloa
ded
on 3
/14/
2022
7:4
6:21
PM
. T
his
artic
le is
lice
nsed
und
er a
Cre
ativ
e C
omm
ons
Attr
ibut
ion
3.0
Unp
orte
d L
icen
ce.
View Article Online
by the counter-part through van der Waals forces andconsequently ZnO$V2O5 NRs morphology was formed inefficiently (Scheme 1). The prepared NRs were examined indetail for their electrochemical properties and then used forthe sensing of biomolecules.
2.3 Preparation and fabrication of a GCE with ZnO$V2O5
NRs
A set of phosphate buffers (PB) (pH ¼ 5.7, 6.5, 7.0, 7.5, and 8.0)were prepared from NaH2PO4 (93.5, 68.5, 39.0, 16.0, and 5.3mL), Na2HPO4 (6.5, 31.5, 61.0, 84.0, and 94.7 mL), and DW(500.0 mL). PB (100.0 mM and 10.0 mL) was kept constantthroughout the whole exercise. At rst, the GCEs were cleanedsystematically with water and acetone, and subsequently placedin open air to dry (1.0 h). NRs were dispersed in EtOH to makea slurry and then the slurry was deposited on the dried surfaceof the GCEs, and kept in open air to dry (1.0 h). A coating binder(Nf) was added drop wise with the deposited NRs and kept againin open air (2 h) till completely dry with uniform development.The customized GCE and Pt wire were used as a working andcounter electrode correspondingly with the purpose of illumi-nating I–V signals in order to determine the testedbiomolecules.
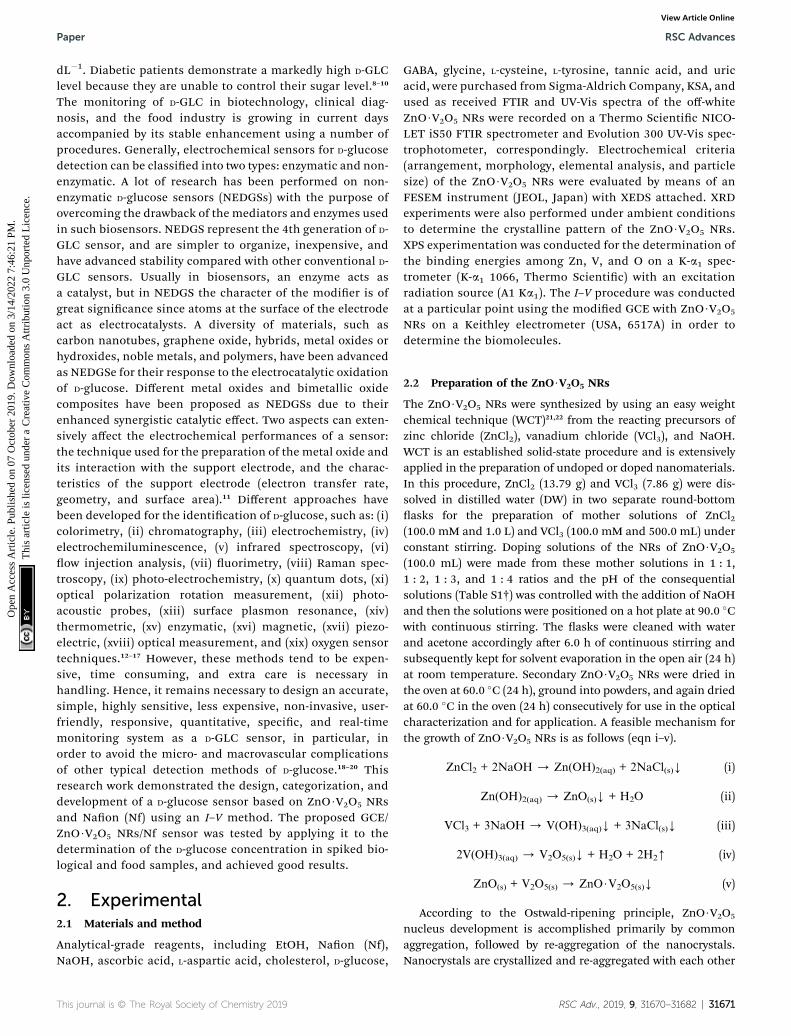
Fig. 1 Optical and structural analyses: (A) FTIR and (B) XRD spectra of Z
31672 | RSC Adv., 2019, 9, 31670–31682
3. Result and discussion3.1 Examination of the optical characteristics
Assessing the optical properties offers a considerable distinc-tiveness for the estimation of the photocatalytic action of theoff-white ZnO$V2O5 NRs. Based on the UV-Vis spectroscopytheory, the band-gap energies of a metal oxide can be acquiredbecause of the adsorption of radiant energy during the shiingof the outer electrons of the atom to a higher energy stage. TheUV-Vis spectra of the ZnO NPs, V2O5 NRs, and ZnO$V2O5 NRswere recorded at 200–800 nm and expansive absorption bandswere found (Table S1†). The theoretical and practical band-gapenergies of the prepared ZnO NPs (3.4 and 3.0 eV), V2O5 NRs (4.8and 2.9 eV), and ZnO$V2O5 NRs (1 : 1 to 1 : 4 ¼ 4.5, 4.4, 4.4, and4.4 eV and 3.0, 2.5, 3.1, and 3.2 eV) were calculated using eqn (vi)and Tauc's equation (vii–ix), respectively (Fig. S1 and S2† andTable S1†).23–28
BGEðeVÞ ¼ 1240
lmax
(vi)
hn ¼ A(ahn)1/r (vii)
hn ¼ A(ahn)2 (viii)
nO NPs, V2O5 NRs, and ZnO$V2O5 NRs.
This journal is © The Royal Society of Chemistry 2019
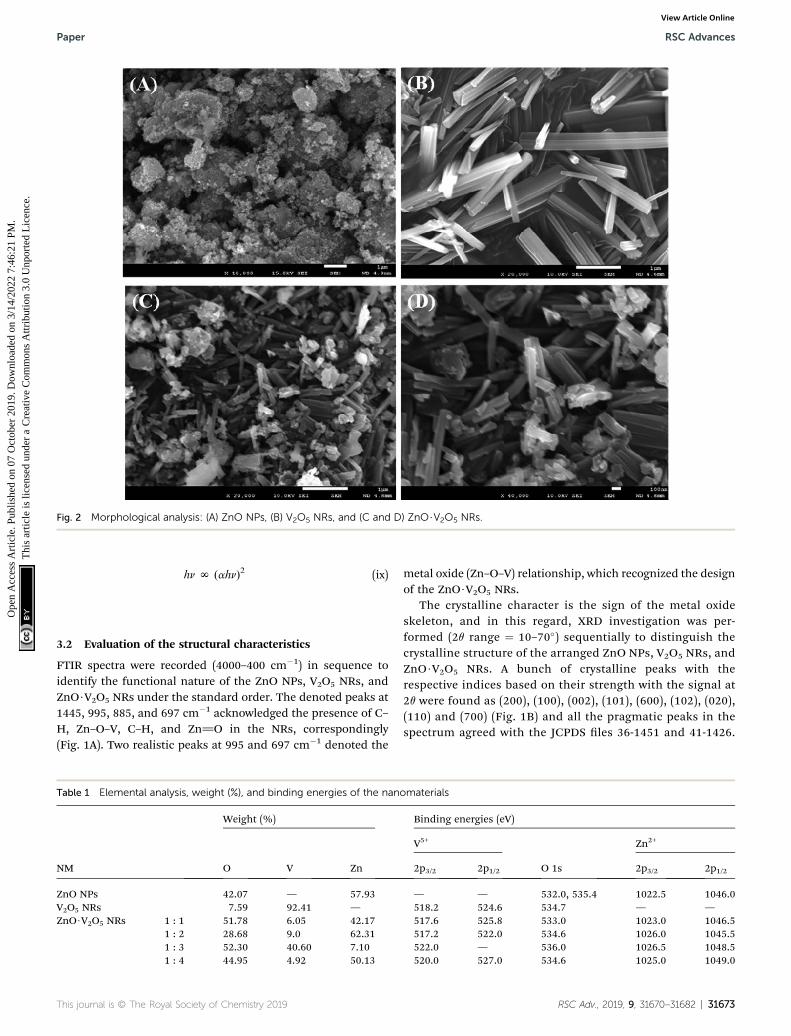
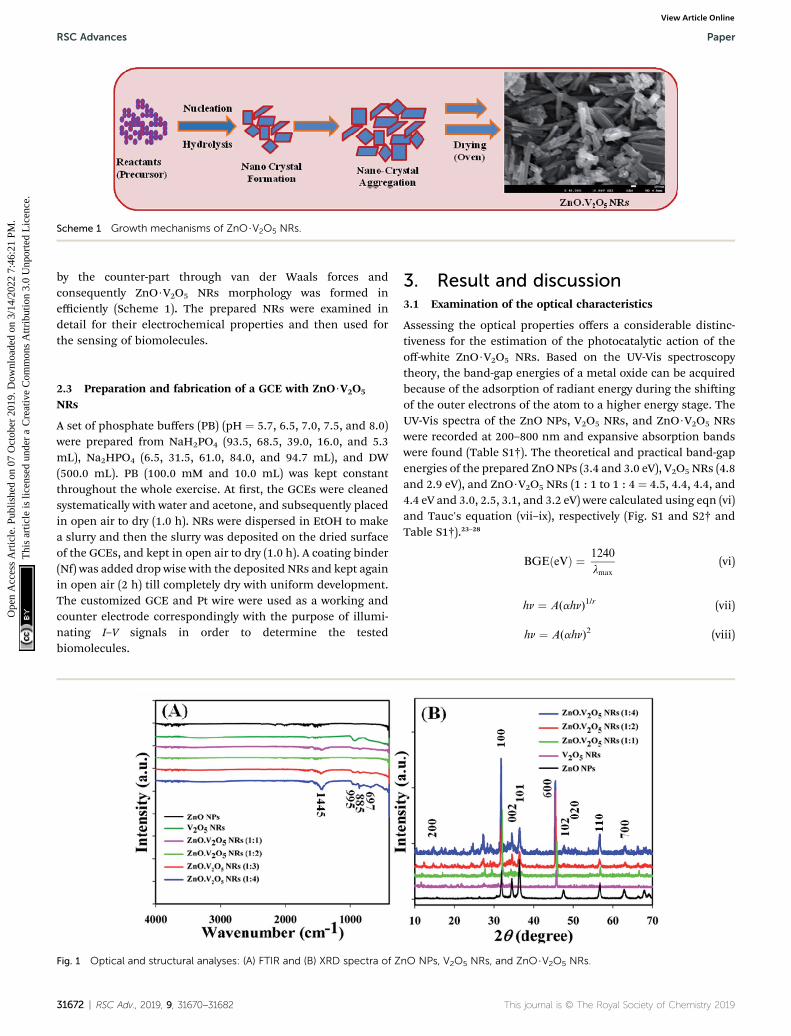
Fig. 2 Morphological analysis: (A) ZnO NPs, (B) V2O5 NRs, and (C and D) ZnO$V2O5 NRs.
Paper RSC Advances
Ope
n A
cces
s A
rtic
le. P
ublis
hed
on 0
7 O
ctob
er 2
019.
Dow
nloa
ded
on 3
/14/
2022
7:4
6:21
PM
. T
his
artic
le is
lice
nsed
und
er a
Cre
ativ
e C
omm
ons
Attr
ibut
ion
3.0
Unp
orte
d L
icen
ce.
View Article Online
hn N (ahn)2 (ix)
3.2 Evaluation of the structural characteristics
FTIR spectra were recorded (4000–400 cm�1) in sequence toidentify the functional nature of the ZnO NPs, V2O5 NRs, andZnO$V2O5 NRs under the standard order. The denoted peaks at1445, 995, 885, and 697 cm�1 acknowledged the presence of C–H, Zn–O–V, C–H, and Zn]O in the NRs, correspondingly(Fig. 1A). Two realistic peaks at 995 and 697 cm�1 denoted the
Table 1 Elemental analysis, weight (%), and binding energies of the nan
NM
Weight (%)
O V Zn
ZnO NPs 42.07 — 57.93V2O5 NRs 7.59 92.41 —ZnO$V2O5 NRs 1 : 1 51.78 6.05 42.17
1 : 2 28.68 9.0 62.311 : 3 52.30 40.60 7.101 : 4 44.95 4.92 50.13
This journal is © The Royal Society of Chemistry 2019
metal oxide (Zn–O–V) relationship, which recognized the designof the ZnO$V2O5 NRs.
The crystalline character is the sign of the metal oxideskeleton, and in this regard, XRD investigation was per-formed (2q range ¼ 10–70�) sequentially to distinguish thecrystalline structure of the arranged ZnO NPs, V2O5 NRs, andZnO$V2O5 NRs. A bunch of crystalline peaks with therespective indices based on their strength with the signal at2q were found as (200), (100), (002), (101), (600), (102), (020),(110) and (700) (Fig. 1B) and all the pragmatic peaks in thespectrum agreed with the JCPDS les 36-1451 and 41-1426.
omaterials
Binding energies (eV)
V5+
O 1s
Zn2+
2p3/2 2p1/2 2p3/2 2p1/2
— — 532.0, 535.4 1022.5 1046.0518.2 524.6 534.7 — —517.6 525.8 533.0 1023.0 1046.5517.2 522.0 534.6 1026.0 1045.5522.0 — 536.0 1026.5 1048.5520.0 527.0 534.6 1025.0 1049.0
RSC Adv., 2019, 9, 31670–31682 | 31673
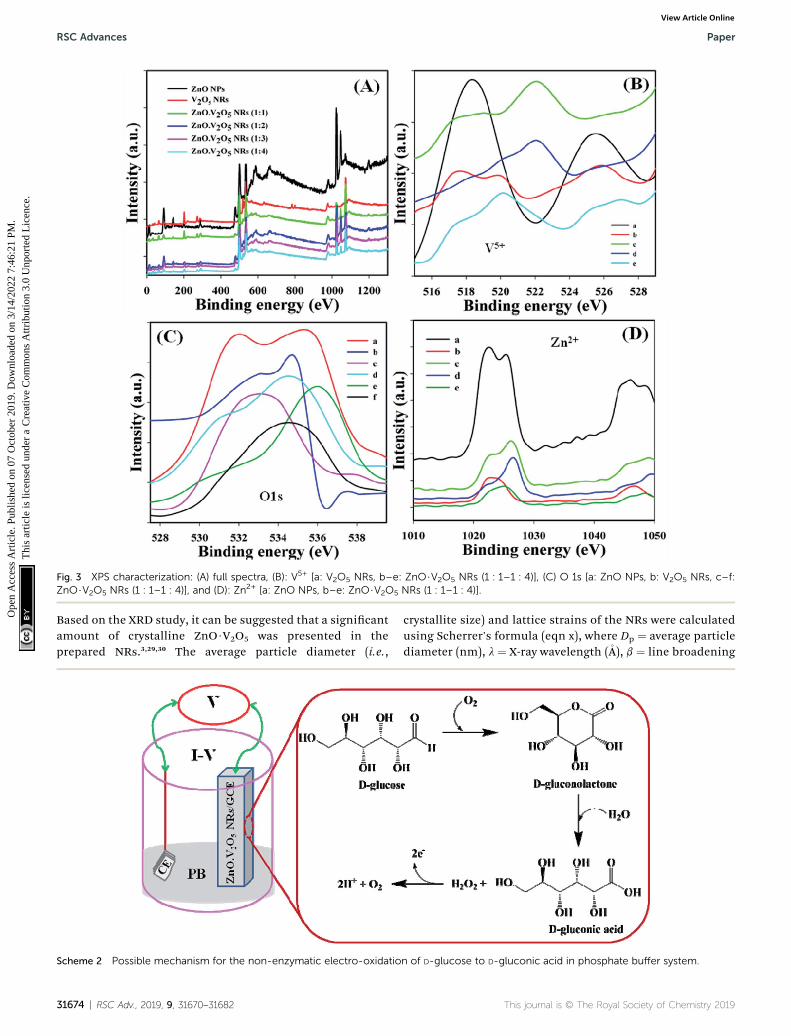
Fig. 3 XPS characterization: (A) full spectra, (B): V5+ [a: V2O5 NRs, b–e: ZnO$V2O5 NRs (1 : 1–1 : 4)], (C) O 1s [a: ZnO NPs, b: V2O5 NRs, c–f:ZnO$V2O5 NRs (1 : 1–1 : 4)], and (D): Zn2+ [a: ZnO NPs, b–e: ZnO$V2O5 NRs (1 : 1–1 : 4)].
RSC Advances Paper
Ope
n A
cces
s A
rtic
le. P
ublis
hed
on 0
7 O
ctob
er 2
019.
Dow
nloa
ded
on 3
/14/
2022
7:4
6:21
PM
. T
his
artic
le is
lice
nsed
und
er a
Cre
ativ
e C
omm
ons
Attr
ibut
ion
3.0
Unp
orte
d L
icen
ce.
View Article Online
Based on the XRD study, it can be suggested that a signicantamount of crystalline ZnO$V2O5 was presented in theprepared NRs.3,29,30 The average particle diameter (i.e.,
Scheme 2 Possible mechanism for the non-enzymatic electro-oxidatio
31674 | RSC Adv., 2019, 9, 31670–31682
crystallite size) and lattice strains of the NRs were calculatedusing Scherrer's formula (eqn x), where Dp ¼ average particlediameter (nm), l ¼ X-ray wavelength (�A), b ¼ line broadening
n of D-glucose to D-gluconic acid in phosphate buffer system.
This journal is © The Royal Society of Chemistry 2019
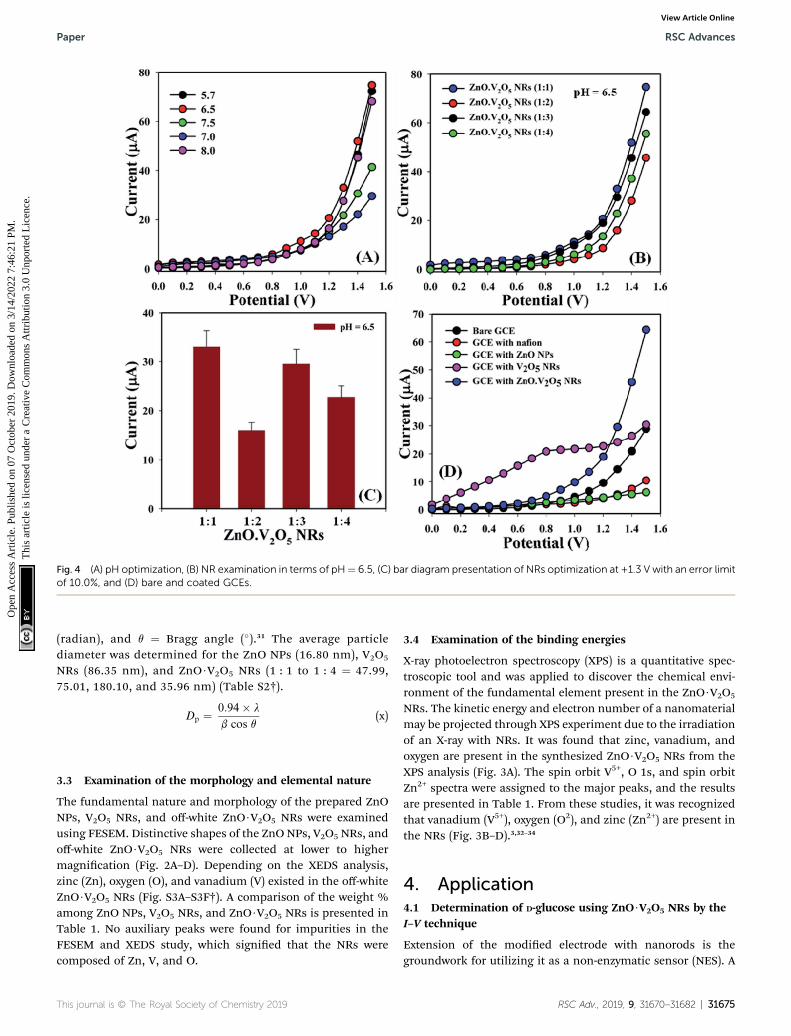
Fig. 4 (A) pH optimization, (B) NR examination in terms of pH¼ 6.5, (C) bar diagram presentation of NRs optimization at +1.3 V with an error limitof 10.0%, and (D) bare and coated GCEs.
Paper RSC Advances
Ope
n A
cces
s A
rtic
le. P
ublis
hed
on 0
7 O
ctob
er 2
019.
Dow
nloa
ded
on 3
/14/
2022
7:4
6:21
PM
. T
his
artic
le is
lice
nsed
und
er a
Cre
ativ
e C
omm
ons
Attr
ibut
ion
3.0
Unp
orte
d L
icen
ce.
View Article Online
(radian), and q ¼ Bragg angle (�).31 The average particlediameter was determined for the ZnO NPs (16.80 nm), V2O5
NRs (86.35 nm), and ZnO$V2O5 NRs (1 : 1 to 1 : 4 ¼ 47.99,75.01, 180.10, and 35.96 nm) (Table S2†).
Dp ¼ 0:94� l
b cos q(x)
3.3 Examination of the morphology and elemental nature
The fundamental nature and morphology of the prepared ZnONPs, V2O5 NRs, and off-white ZnO$V2O5 NRs were examinedusing FESEM. Distinctive shapes of the ZnO NPs, V2O5 NRs, andoff-white ZnO$V2O5 NRs were collected at lower to highermagnication (Fig. 2A–D). Depending on the XEDS analysis,zinc (Zn), oxygen (O), and vanadium (V) existed in the off-whiteZnO$V2O5 NRs (Fig. S3A–S3F†). A comparison of the weight %among ZnO NPs, V2O5 NRs, and ZnO$V2O5 NRs is presented inTable 1. No auxiliary peaks were found for impurities in theFESEM and XEDS study, which signied that the NRs werecomposed of Zn, V, and O.
This journal is © The Royal Society of Chemistry 2019
3.4 Examination of the binding energies
X-ray photoelectron spectroscopy (XPS) is a quantitative spec-troscopic tool and was applied to discover the chemical envi-ronment of the fundamental element present in the ZnO$V2O5
NRs. The kinetic energy and electron number of a nanomaterialmay be projected through XPS experiment due to the irradiationof an X-ray with NRs. It was found that zinc, vanadium, andoxygen are present in the synthesized ZnO$V2O5 NRs from theXPS analysis (Fig. 3A). The spin orbit V5+, O 1s, and spin orbitZn2+ spectra were assigned to the major peaks, and the resultsare presented in Table 1. From these studies, it was recognizedthat vanadium (V5+), oxygen (O2), and zinc (Zn2+) are present inthe NRs (Fig. 3B–D).3,32–34
4. Application4.1 Determination of D-glucose using ZnO$V2O5 NRs by theI–V technique
Extension of the modied electrode with nanorods is thegroundwork for utilizing it as a non-enzymatic sensor (NES). A
RSC Adv., 2019, 9, 31670–31682 | 31675
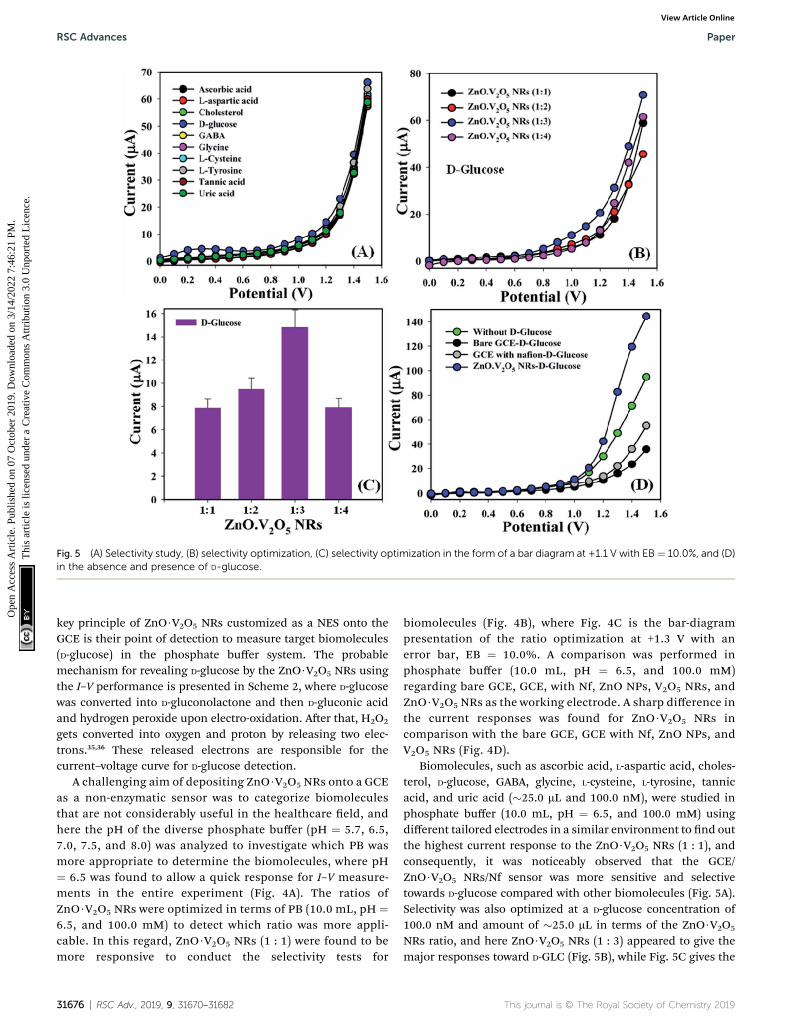
Fig. 5 (A) Selectivity study, (B) selectivity optimization, (C) selectivity optimization in the form of a bar diagram at +1.1 V with EB¼ 10.0%, and (D)in the absence and presence of D-glucose.
RSC Advances Paper
Ope
n A
cces
s A
rtic
le. P
ublis
hed
on 0
7 O
ctob
er 2
019.
Dow
nloa
ded
on 3
/14/
2022
7:4
6:21
PM
. T
his
artic
le is
lice
nsed
und
er a
Cre
ativ
e C
omm
ons
Attr
ibut
ion
3.0
Unp
orte
d L
icen
ce.
View Article Online
key principle of ZnO$V2O5 NRs customized as a NES onto theGCE is their point of detection to measure target biomolecules(D-glucose) in the phosphate buffer system. The probablemechanism for revealing D-glucose by the ZnO$V2O5 NRs usingthe I–V performance is presented in Scheme 2, where D-glucosewas converted into D-gluconolactone and then D-gluconic acidand hydrogen peroxide upon electro-oxidation. Aer that, H2O2
gets converted into oxygen and proton by releasing two elec-trons.35,36 These released electrons are responsible for thecurrent–voltage curve for D-glucose detection.
A challenging aim of depositing ZnO$V2O5 NRs onto a GCEas a non-enzymatic sensor was to categorize biomoleculesthat are not considerably useful in the healthcare eld, andhere the pH of the diverse phosphate buffer (pH ¼ 5.7, 6.5,7.0, 7.5, and 8.0) was analyzed to investigate which PB wasmore appropriate to determine the biomolecules, where pH¼ 6.5 was found to allow a quick response for I–V measure-ments in the entire experiment (Fig. 4A). The ratios ofZnO$V2O5 NRs were optimized in terms of PB (10.0 mL, pH ¼6.5, and 100.0 mM) to detect which ratio was more appli-cable. In this regard, ZnO$V2O5 NRs (1 : 1) were found to bemore responsive to conduct the selectivity tests for
31676 | RSC Adv., 2019, 9, 31670–31682
biomolecules (Fig. 4B), where Fig. 4C is the bar-diagrampresentation of the ratio optimization at +1.3 V with anerror bar, EB ¼ 10.0%. A comparison was performed inphosphate buffer (10.0 mL, pH ¼ 6.5, and 100.0 mM)regarding bare GCE, GCE, with Nf, ZnO NPs, V2O5 NRs, andZnO$V2O5 NRs as the working electrode. A sharp difference inthe current responses was found for ZnO$V2O5 NRs incomparison with the bare GCE, GCE with Nf, ZnO NPs, andV2O5 NRs (Fig. 4D).
Biomolecules, such as ascorbic acid, L-aspartic acid, choles-terol, D-glucose, GABA, glycine, L-cysteine, L-tyrosine, tannicacid, and uric acid (�25.0 mL and 100.0 nM), were studied inphosphate buffer (10.0 mL, pH ¼ 6.5, and 100.0 mM) usingdifferent tailored electrodes in a similar environment to nd outthe highest current response to the ZnO$V2O5 NRs (1 : 1), andconsequently, it was noticeably observed that the GCE/ZnO$V2O5 NRs/Nf sensor was more sensitive and selectivetowards D-glucose compared with other biomolecules (Fig. 5A).Selectivity was also optimized at a D-glucose concentration of100.0 nM and amount of �25.0 mL in terms of the ZnO$V2O5
NRs ratio, and here ZnO$V2O5 NRs (1 : 3) appeared to give themajor responses toward D-GLC (Fig. 5B), while Fig. 5C gives the
This journal is © The Royal Society of Chemistry 2019
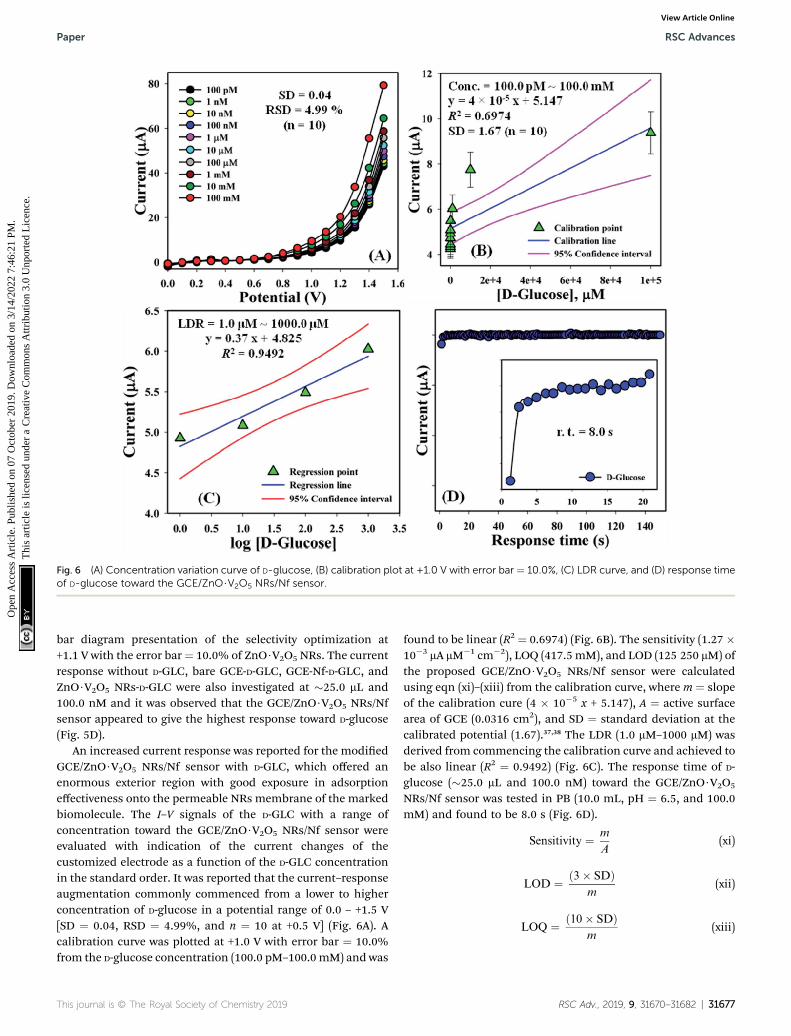
Fig. 6 (A) Concentration variation curve of D-glucose, (B) calibration plot at +1.0 V with error bar ¼ 10.0%, (C) LDR curve, and (D) response timeof D-glucose toward the GCE/ZnO$V2O5 NRs/Nf sensor.
Paper RSC Advances
Ope
n A
cces
s A
rtic
le. P
ublis
hed
on 0
7 O
ctob
er 2
019.
Dow
nloa
ded
on 3
/14/
2022
7:4
6:21
PM
. T
his
artic
le is
lice
nsed
und
er a
Cre
ativ
e C
omm
ons
Attr
ibut
ion
3.0
Unp
orte
d L
icen
ce.
View Article Online
bar diagram presentation of the selectivity optimization at+1.1 V with the error bar¼ 10.0% of ZnO$V2O5 NRs. The currentresponse without D-GLC, bare GCE-D-GLC, GCE-Nf-D-GLC, andZnO$V2O5 NRs-D-GLC were also investigated at �25.0 mL and100.0 nM and it was observed that the GCE/ZnO$V2O5 NRs/Nfsensor appeared to give the highest response toward D-glucose(Fig. 5D).
An increased current response was reported for the modiedGCE/ZnO$V2O5 NRs/Nf sensor with D-GLC, which offered anenormous exterior region with good exposure in adsorptioneffectiveness onto the permeable NRs membrane of the markedbiomolecule. The I–V signals of the D-GLC with a range ofconcentration toward the GCE/ZnO$V2O5 NRs/Nf sensor wereevaluated with indication of the current changes of thecustomized electrode as a function of the D-GLC concentrationin the standard order. It was reported that the current–responseaugmentation commonly commenced from a lower to higherconcentration of D-glucose in a potential range of 0.0 – +1.5 V[SD ¼ 0.04, RSD ¼ 4.99%, and n ¼ 10 at +0.5 V] (Fig. 6A). Acalibration curve was plotted at +1.0 V with error bar ¼ 10.0%from the D-glucose concentration (100.0 pM–100.0 mM) and was
This journal is © The Royal Society of Chemistry 2019
found to be linear (R2 ¼ 0.6974) (Fig. 6B). The sensitivity (1.27�10�3 mA mM�1 cm�2), LOQ (417.5mM), and LOD (125 250 mM) ofthe proposed GCE/ZnO$V2O5 NRs/Nf sensor were calculatedusing eqn (xi)–(xiii) from the calibration curve, where m ¼ slopeof the calibration cure (4 � 10�5 x + 5.147), A ¼ active surfacearea of GCE (0.0316 cm2), and SD ¼ standard deviation at thecalibrated potential (1.67).37,38 The LDR (1.0 mM–1000 mM) wasderived from commencing the calibration curve and achieved tobe also linear (R2 ¼ 0.9492) (Fig. 6C). The response time of D-glucose (�25.0 mL and 100.0 nM) toward the GCE/ZnO$V2O5
NRs/Nf sensor was tested in PB (10.0 mL, pH ¼ 6.5, and 100.0mM) and found to be 8.0 s (Fig. 6D).
Sensitivity ¼ m
A(xi)
LOD ¼ ð3� SDÞm
(xii)
LOQ ¼ ð10� SDÞm
(xiii)
RSC Adv., 2019, 9, 31670–31682 | 31677
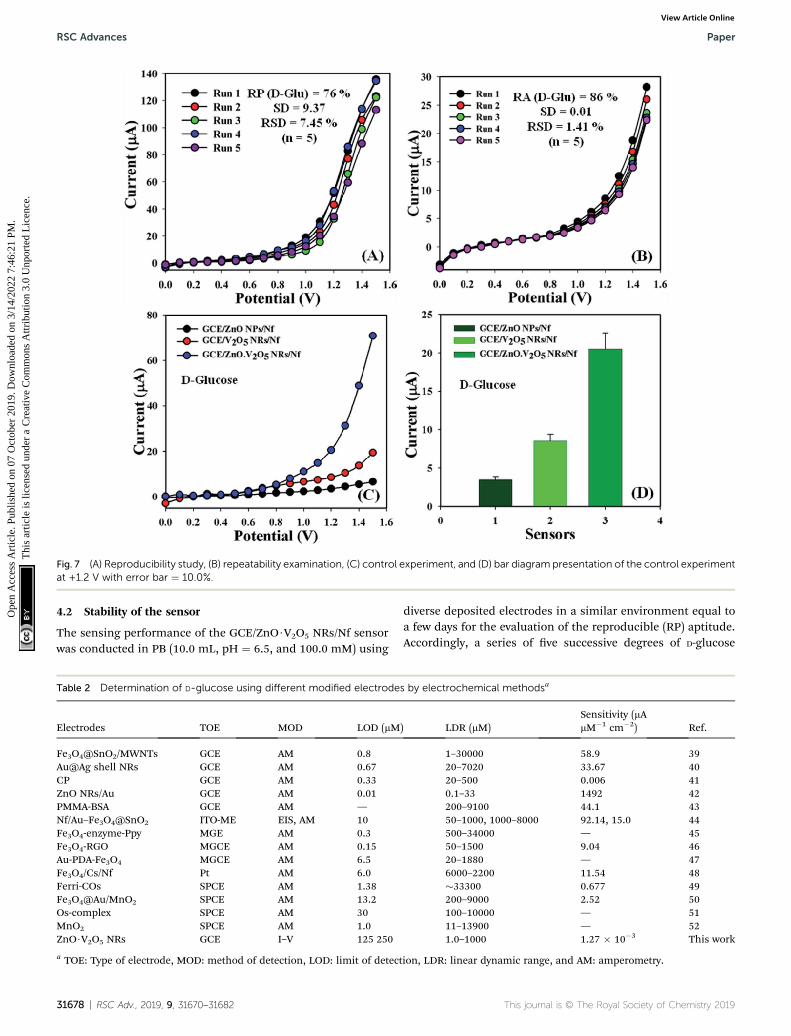
Fig. 7 (A) Reproducibility study, (B) repeatability examination, (C) control experiment, and (D) bar diagram presentation of the control experimentat +1.2 V with error bar ¼ 10.0%.
RSC Advances Paper
Ope
n A
cces
s A
rtic
le. P
ublis
hed
on 0
7 O
ctob
er 2
019.
Dow
nloa
ded
on 3
/14/
2022
7:4
6:21
PM
. T
his
artic
le is
lice
nsed
und
er a
Cre
ativ
e C
omm
ons
Attr
ibut
ion
3.0
Unp
orte
d L
icen
ce.
View Article Online
4.2 Stability of the sensor
The sensing performance of the GCE/ZnO$V2O5 NRs/Nf sensorwas conducted in PB (10.0 mL, pH ¼ 6.5, and 100.0 mM) using
Table 2 Determination of D-glucose using different modified electrode
Electrodes TOE MOD LOD (mM
Fe3O4@SnO2/MWNTs GCE AM 0.8Au@Ag shell NRs GCE AM 0.67CP GCE AM 0.33ZnO NRs/Au GCE AM 0.01PMMA-BSA GCE AM —Nf/Au–Fe3O4@SnO2 ITO-ME EIS, AM 10Fe3O4-enzyme-Ppy MGE AM 0.3Fe3O4-RGO MGCE AM 0.15Au-PDA-Fe3O4 MGCE AM 6.5Fe3O4/Cs/Nf Pt AM 6.0Ferri-COs SPCE AM 1.38Fe3O4@Au/MnO2 SPCE AM 13.2Os-complex SPCE AM 30MnO2 SPCE AM 1.0ZnO$V2O5 NRs GCE I–V 125 250
a TOE: Type of electrode, MOD: method of detection, LOD: limit of detect
31678 | RSC Adv., 2019, 9, 31670–31682
diverse deposited electrodes in a similar environment equal toa few days for the evaluation of the reproducible (RP) aptitude.Accordingly, a series of ve successive degrees of D-glucose
s by electrochemical methodsa
) LDR (mM)Sensitivity (mAmM�1 cm�2) Ref.
1–30000 58.9 3920–7020 33.67 4020–500 0.006 410.1–33 1492 42200–9100 44.1 4350–1000, 1000–8000 92.14, 15.0 44500–34000 — 4550–1500 9.04 4620–1880 — 476000–2200 11.54 48�33300 0.677 49200–9000 2.52 50100–10000 — 5111–13900 — 521.0–1000 1.27 � 10�3 This work
ion, LDR: linear dynamic range, and AM: amperometry.
This journal is © The Royal Society of Chemistry 2019
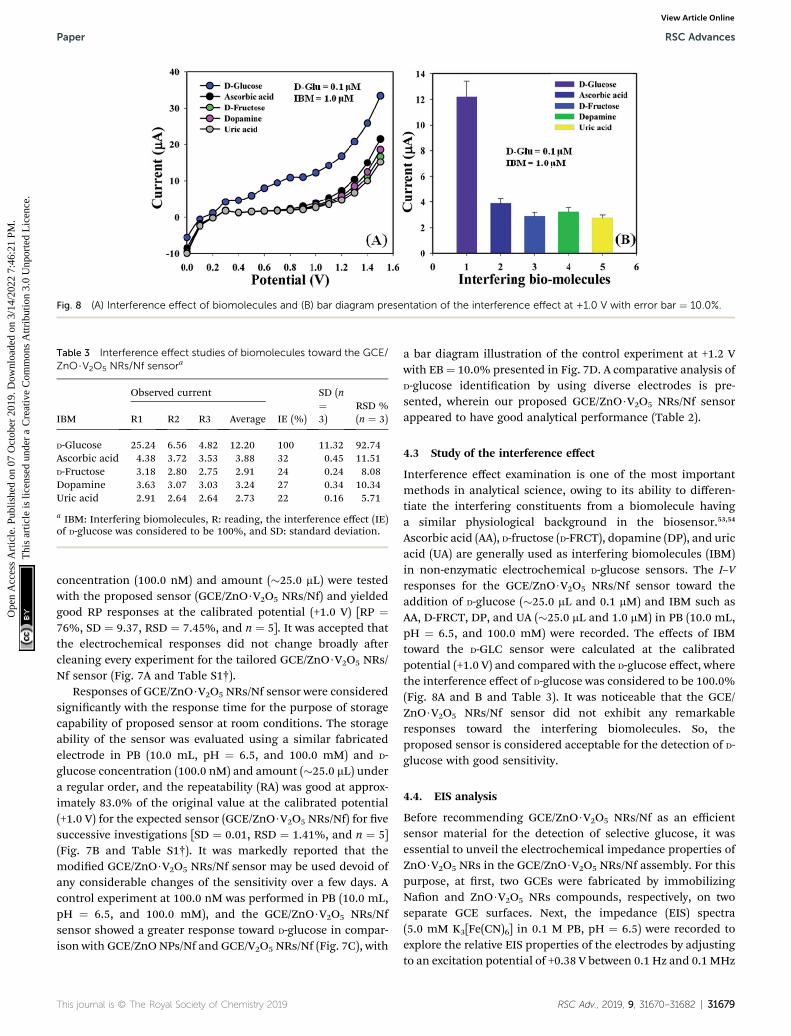
Fig. 8 (A) Interference effect of biomolecules and (B) bar diagram presentation of the interference effect at +1.0 V with error bar ¼ 10.0%.
Table 3 Interference effect studies of biomolecules toward the GCE/ZnO$V2O5 NRs/Nf sensora
IBM
Observed current
IE (%)
SD (n¼3)
RSD %(n ¼ 3)R1 R2 R3 Average
D-Glucose 25.24 6.56 4.82 12.20 100 11.32 92.74Ascorbic acid 4.38 3.72 3.53 3.88 32 0.45 11.51D-Fructose 3.18 2.80 2.75 2.91 24 0.24 8.08Dopamine 3.63 3.07 3.03 3.24 27 0.34 10.34Uric acid 2.91 2.64 2.64 2.73 22 0.16 5.71
a IBM: Interfering biomolecules, R: reading, the interference effect (IE)of D-glucose was considered to be 100%, and SD: standard deviation.
Paper RSC Advances
Ope
n A
cces
s A
rtic
le. P
ublis
hed
on 0
7 O
ctob
er 2
019.
Dow
nloa
ded
on 3
/14/
2022
7:4
6:21
PM
. T
his
artic
le is
lice
nsed
und
er a
Cre
ativ
e C
omm
ons
Attr
ibut
ion
3.0
Unp
orte
d L
icen
ce.
View Article Online
concentration (100.0 nM) and amount (�25.0 mL) were testedwith the proposed sensor (GCE/ZnO$V2O5 NRs/Nf) and yieldedgood RP responses at the calibrated potential (+1.0 V) [RP ¼76%, SD ¼ 9.37, RSD ¼ 7.45%, and n ¼ 5]. It was accepted thatthe electrochemical responses did not change broadly aercleaning every experiment for the tailored GCE/ZnO$V2O5 NRs/Nf sensor (Fig. 7A and Table S1†).
Responses of GCE/ZnO$V2O5 NRs/Nf sensor were consideredsignicantly with the response time for the purpose of storagecapability of proposed sensor at room conditions. The storageability of the sensor was evaluated using a similar fabricatedelectrode in PB (10.0 mL, pH ¼ 6.5, and 100.0 mM) and D-glucose concentration (100.0 nM) and amount (�25.0 mL) undera regular order, and the repeatability (RA) was good at approx-imately 83.0% of the original value at the calibrated potential(+1.0 V) for the expected sensor (GCE/ZnO$V2O5 NRs/Nf) for vesuccessive investigations [SD ¼ 0.01, RSD ¼ 1.41%, and n ¼ 5](Fig. 7B and Table S1†). It was markedly reported that themodied GCE/ZnO$V2O5 NRs/Nf sensor may be used devoid ofany considerable changes of the sensitivity over a few days. Acontrol experiment at 100.0 nM was performed in PB (10.0 mL,pH ¼ 6.5, and 100.0 mM), and the GCE/ZnO$V2O5 NRs/Nfsensor showed a greater response toward D-glucose in compar-ison with GCE/ZnO NPs/Nf and GCE/V2O5 NRs/Nf (Fig. 7C), with
This journal is © The Royal Society of Chemistry 2019
a bar diagram illustration of the control experiment at +1.2 Vwith EB¼ 10.0% presented in Fig. 7D. A comparative analysis ofD-glucose identication by using diverse electrodes is pre-sented, wherein our proposed GCE/ZnO$V2O5 NRs/Nf sensorappeared to have good analytical performance (Table 2).
4.3 Study of the interference effect
Interference effect examination is one of the most importantmethods in analytical science, owing to its ability to differen-tiate the interfering constituents from a biomolecule havinga similar physiological background in the biosensor.53,54
Ascorbic acid (AA), D-fructose (D-FRCT), dopamine (DP), and uricacid (UA) are generally used as interfering biomolecules (IBM)in non-enzymatic electrochemical D-glucose sensors. The I–Vresponses for the GCE/ZnO$V2O5 NRs/Nf sensor toward theaddition of D-glucose (�25.0 mL and 0.1 mM) and IBM such asAA, D-FRCT, DP, and UA (�25.0 mL and 1.0 mM) in PB (10.0 mL,pH ¼ 6.5, and 100.0 mM) were recorded. The effects of IBMtoward the D-GLC sensor were calculated at the calibratedpotential (+1.0 V) and compared with the D-glucose effect, wherethe interference effect of D-glucose was considered to be 100.0%(Fig. 8A and B and Table 3). It was noticeable that the GCE/ZnO$V2O5 NRs/Nf sensor did not exhibit any remarkableresponses toward the interfering biomolecules. So, theproposed sensor is considered acceptable for the detection of D-glucose with good sensitivity.
4.4. EIS analysis
Before recommending GCE/ZnO$V2O5 NRs/Nf as an efficientsensor material for the detection of selective glucose, it wasessential to unveil the electrochemical impedance properties ofZnO$V2O5 NRs in the GCE/ZnO$V2O5 NRs/Nf assembly. For thispurpose, at rst, two GCEs were fabricated by immobilizingNaon and ZnO$V2O5 NRs compounds, respectively, on twoseparate GCE surfaces. Next, the impedance (EIS) spectra(5.0 mM K3[Fe(CN)6] in 0.1 M PB, pH ¼ 6.5) were recorded toexplore the relative EIS properties of the electrodes by adjustingto an excitation potential of +0.38 V between 0.1 Hz and 0.1 MHz
RSC Adv., 2019, 9, 31670–31682 | 31679
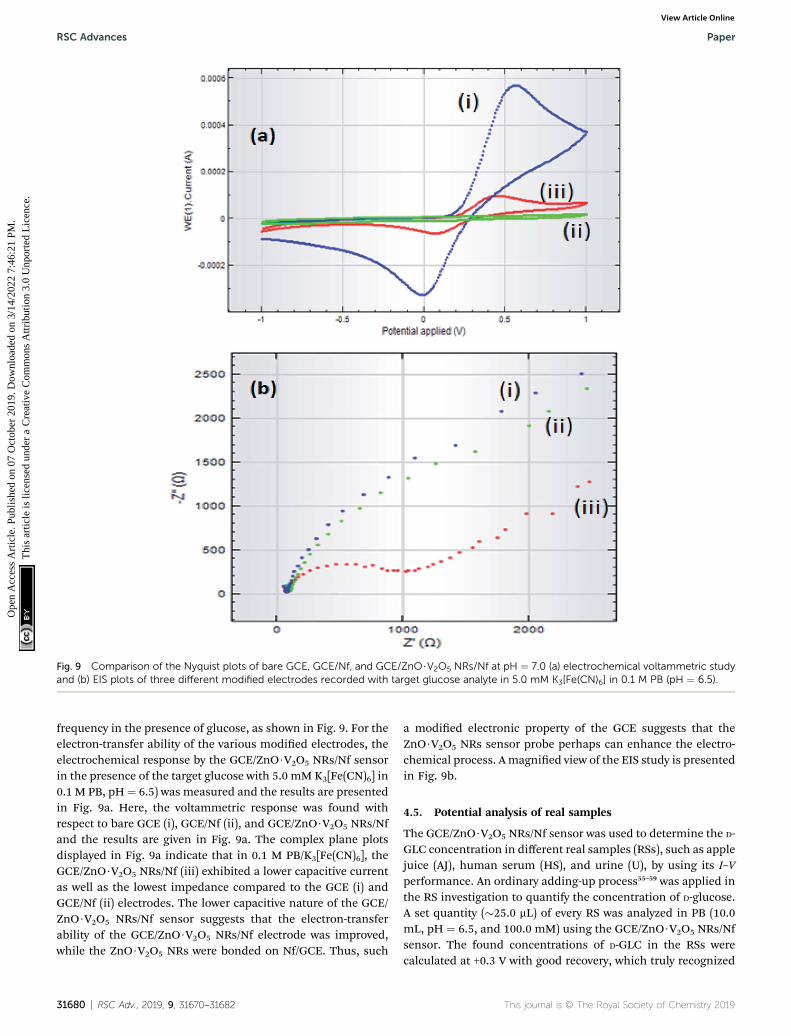
Fig. 9 Comparison of the Nyquist plots of bare GCE, GCE/Nf, and GCE/ZnO$V2O5 NRs/Nf at pH ¼ 7.0 (a) electrochemical voltammetric studyand (b) EIS plots of three different modified electrodes recorded with target glucose analyte in 5.0 mM K3[Fe(CN)6] in 0.1 M PB (pH ¼ 6.5).
RSC Advances Paper
Ope
n A
cces
s A
rtic
le. P
ublis
hed
on 0
7 O
ctob
er 2
019.
Dow
nloa
ded
on 3
/14/
2022
7:4
6:21
PM
. T
his
artic
le is
lice
nsed
und
er a
Cre
ativ
e C
omm
ons
Attr
ibut
ion
3.0
Unp
orte
d L
icen
ce.
View Article Online
frequency in the presence of glucose, as shown in Fig. 9. For theelectron-transfer ability of the various modied electrodes, theelectrochemical response by the GCE/ZnO$V2O5 NRs/Nf sensorin the presence of the target glucose with 5.0 mM K3[Fe(CN)6] in0.1 M PB, pH¼ 6.5) was measured and the results are presentedin Fig. 9a. Here, the voltammetric response was found withrespect to bare GCE (i), GCE/Nf (ii), and GCE/ZnO$V2O5 NRs/Nfand the results are given in Fig. 9a. The complex plane plotsdisplayed in Fig. 9a indicate that in 0.1 M PB/K3[Fe(CN)6], theGCE/ZnO$V2O5 NRs/Nf (iii) exhibited a lower capacitive currentas well as the lowest impedance compared to the GCE (i) andGCE/Nf (ii) electrodes. The lower capacitive nature of the GCE/ZnO$V2O5 NRs/Nf sensor suggests that the electron-transferability of the GCE/ZnO$V2O5 NRs/Nf electrode was improved,while the ZnO$V2O5 NRs were bonded on Nf/GCE. Thus, such
31680 | RSC Adv., 2019, 9, 31670–31682
a modied electronic property of the GCE suggests that theZnO$V2O5 NRs sensor probe perhaps can enhance the electro-chemical process. Amagnied view of the EIS study is presentedin Fig. 9b.
4.5. Potential analysis of real samples
The GCE/ZnO$V2O5 NRs/Nf sensor was used to determine the D-GLC concentration in different real samples (RSs), such as applejuice (AJ), human serum (HS), and urine (U), by using its I–Vperformance. An ordinary adding-up process55–59 was applied inthe RS investigation to quantify the concentration of D-glucose.A set quantity (�25.0 mL) of every RS was analyzed in PB (10.0mL, pH ¼ 6.5, and 100.0 mM) using the GCE/ZnO$V2O5 NRs/Nfsensor. The found concentrations of D-GLC in the RSs werecalculated at +0.3 V with good recovery, which truly recognized
This journal is © The Royal Society of Chemistry 2019
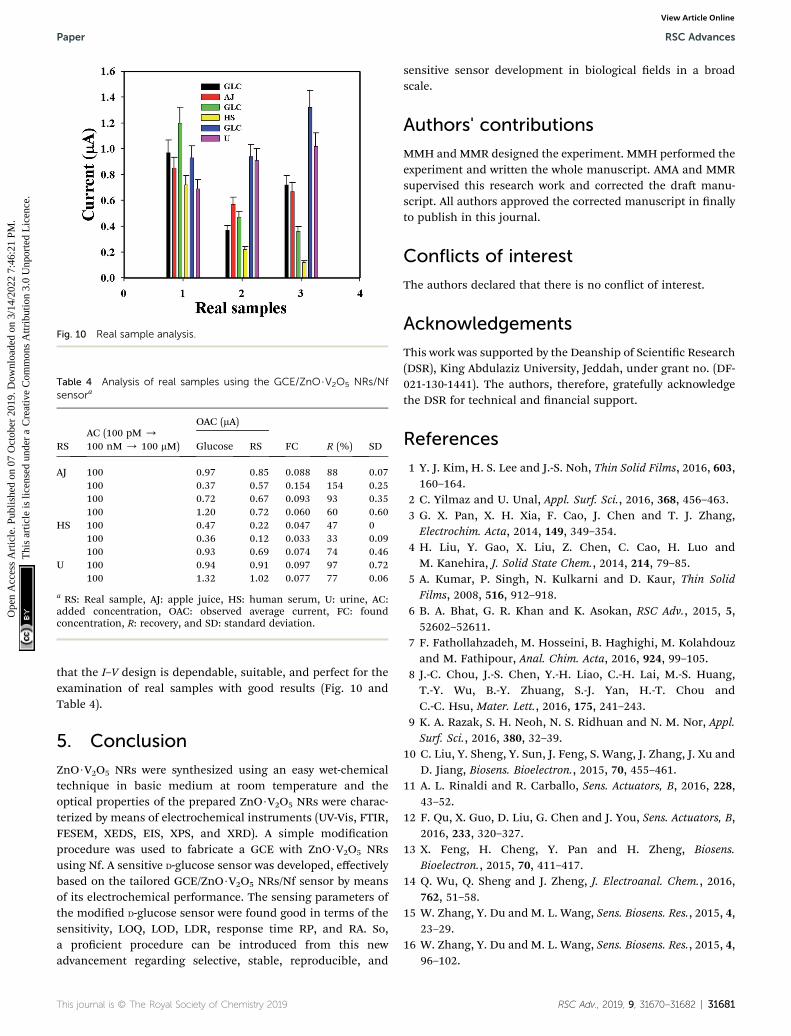
Fig. 10 Real sample analysis.
Table 4 Analysis of real samples using the GCE/ZnO$V2O5 NRs/Nfsensora
RSAC (100 pM /100 nM / 100 mM)
OAC (mA)
FC R (%) SDGlucose RS
AJ 100 0.97 0.85 0.088 88 0.07100 0.37 0.57 0.154 154 0.25100 0.72 0.67 0.093 93 0.35100 1.20 0.72 0.060 60 0.60
HS 100 0.47 0.22 0.047 47 0100 0.36 0.12 0.033 33 0.09100 0.93 0.69 0.074 74 0.46
U 100 0.94 0.91 0.097 97 0.72100 1.32 1.02 0.077 77 0.06
a RS: Real sample, AJ: apple juice, HS: human serum, U: urine, AC:added concentration, OAC: observed average current, FC: foundconcentration, R: recovery, and SD: standard deviation.
Paper RSC Advances
Ope
n A
cces
s A
rtic
le. P
ublis
hed
on 0
7 O
ctob
er 2
019.
Dow
nloa
ded
on 3
/14/
2022
7:4
6:21
PM
. T
his
artic
le is
lice
nsed
und
er a
Cre
ativ
e C
omm
ons
Attr
ibut
ion
3.0
Unp
orte
d L
icen
ce.
View Article Online
that the I–V design is dependable, suitable, and perfect for theexamination of real samples with good results (Fig. 10 andTable 4).
5. Conclusion
ZnO$V2O5 NRs were synthesized using an easy wet-chemicaltechnique in basic medium at room temperature and theoptical properties of the prepared ZnO$V2O5 NRs were charac-terized by means of electrochemical instruments (UV-Vis, FTIR,FESEM, XEDS, EIS, XPS, and XRD). A simple modicationprocedure was used to fabricate a GCE with ZnO$V2O5 NRsusing Nf. A sensitive D-glucose sensor was developed, effectivelybased on the tailored GCE/ZnO$V2O5 NRs/Nf sensor by meansof its electrochemical performance. The sensing parameters ofthe modied D-glucose sensor were found good in terms of thesensitivity, LOQ, LOD, LDR, response time RP, and RA. So,a procient procedure can be introduced from this newadvancement regarding selective, stable, reproducible, and
This journal is © The Royal Society of Chemistry 2019
sensitive sensor development in biological elds in a broadscale.
Authors' contributions
MMH and MMR designed the experiment. MMH performed theexperiment and written the whole manuscript. AMA and MMRsupervised this research work and corrected the dra manu-script. All authors approved the corrected manuscript in nallyto publish in this journal.
Conflicts of interest
The authors declared that there is no conict of interest.
Acknowledgements
This work was supported by the Deanship of Scientic Research(DSR), King Abdulaziz University, Jeddah, under grant no. (DF-021-130-1441). The authors, therefore, gratefully acknowledgethe DSR for technical and nancial support.
References
1 Y. J. Kim, H. S. Lee and J.-S. Noh, Thin Solid Films, 2016, 603,160–164.
2 C. Yilmaz and U. Unal, Appl. Surf. Sci., 2016, 368, 456–463.3 G. X. Pan, X. H. Xia, F. Cao, J. Chen and T. J. Zhang,Electrochim. Acta, 2014, 149, 349–354.
4 H. Liu, Y. Gao, X. Liu, Z. Chen, C. Cao, H. Luo andM. Kanehira, J. Solid State Chem., 2014, 214, 79–85.
5 A. Kumar, P. Singh, N. Kulkarni and D. Kaur, Thin SolidFilms, 2008, 516, 912–918.
6 B. A. Bhat, G. R. Khan and K. Asokan, RSC Adv., 2015, 5,52602–52611.
7 F. Fathollahzadeh, M. Hosseini, B. Haghighi, M. Kolahdouzand M. Fathipour, Anal. Chim. Acta, 2016, 924, 99–105.
8 J.-C. Chou, J.-S. Chen, Y.-H. Liao, C.-H. Lai, M.-S. Huang,T.-Y. Wu, B.-Y. Zhuang, S.-J. Yan, H.-T. Chou andC.-C. Hsu, Mater. Lett., 2016, 175, 241–243.
9 K. A. Razak, S. H. Neoh, N. S. Ridhuan and N. M. Nor, Appl.Surf. Sci., 2016, 380, 32–39.
10 C. Liu, Y. Sheng, Y. Sun, J. Feng, S. Wang, J. Zhang, J. Xu andD. Jiang, Biosens. Bioelectron., 2015, 70, 455–461.
11 A. L. Rinaldi and R. Carballo, Sens. Actuators, B, 2016, 228,43–52.
12 F. Qu, X. Guo, D. Liu, G. Chen and J. You, Sens. Actuators, B,2016, 233, 320–327.
13 X. Feng, H. Cheng, Y. Pan and H. Zheng, Biosens.Bioelectron., 2015, 70, 411–417.
14 Q. Wu, Q. Sheng and J. Zheng, J. Electroanal. Chem., 2016,762, 51–58.
15 W. Zhang, Y. Du and M. L. Wang, Sens. Biosens. Res., 2015, 4,23–29.
16 W. Zhang, Y. Du and M. L. Wang, Sens. Biosens. Res., 2015, 4,96–102.
RSC Adv., 2019, 9, 31670–31682 | 31681
RSC Advances Paper
Ope
n A
cces
s A
rtic
le. P
ublis
hed
on 0
7 O
ctob
er 2
019.
Dow
nloa
ded
on 3
/14/
2022
7:4
6:21
PM
. T
his
artic
le is
lice
nsed
und
er a
Cre
ativ
e C
omm
ons
Attr
ibut
ion
3.0
Unp
orte
d L
icen
ce.
View Article Online
17 A. Pandya, P. G. Sutariya and S. K. Menon, Analyst, 2013, 138,2483–2490.
18 T. Arakawa, Y. Kuroki, H. Nitta, P. Chouhan, K. Toma,S. Sawada, S. Takeuchi, T. Sekita, K. Akiyoshi,S. Minakuchi and K. Mitsubayashi, Biosens. Bioelectron.,2016, 84, 106–111.
19 J. P. Devadhasan, S. Kim and C. S. Choi, Analyst, 2013, 138,5679–5684.
20 S. Unser, I. Campbell, D. Jana and L. Sagle, Analyst, 2015,140, 590–599.
21 M. M. Hussain, M. M. Rahman and A. M. Asiri, J. Environ.Sci., 2017, 53, 27–38.
22 M. M. Hussain, M. M. Rahman, A. M. Asiri and M. R. Awual,RSC Adv., 2016, 6, 80511–80521.
23 M. M. Rahman, M. M. Hussain and A. M. Asiri, RSC Adv.,2016, 6, 65338–65348.
24 M. M. Hussain, M. M. Rahman and A. M. Asiri, PLoS One,2016, 11, e0166265.
25 M. M. Rahman, M. M. Hussain and A. M. Asiri, Microchim.Acta, 2016, 183, 3255–3263.
26 M. M. Rahman, M. M. Hussain and A. M. Asiri, Prog. Nat.Sci.: Mater. Int., 2017, 27, 566–573.
27 M. M. Rahman, M. M. Hussain and A. M. Asiri, PLoS One,2017, 12, e0177817.
28 M. M. Rahman, M. M. Hussain and A. M. Asiri, New J. Chem.,2017, 41, 6667–6677.
29 R. Khan, P. Uthirakumar, K.-B. Bae, S.-J. Leem and I.-H. Lee,Mater. Lett., 2016, 163, 8–11.
30 S. Raque, S. M. Abdullah, W. E. Mahmoud, A. A-Ghamdiand K. Sulaiman, RSC Adv., 2016, 6, 50043–50052.
31 M. M. Hussain, M. M. Rahman and A. M. Asiri, Microchim.Acta, 2016, 183, 3265–3273.
32 N. Gogurla, A. K. Sinha, S. Santra, S. Manna and S. K. Ray,Sci. Rep., 2014, 4, 6483.
33 S. Elhag, K. Khun, V. Khranovskyy, X. Liu, M. Willander andO. Nur, Sensors, 2016, 16, 222.
34 S. Zanarini, S. Zanarini, F. D. Lup, A. Bedini, S. Vankova,N. Garino, C. Francia and S. Bodoardo, J. Mater. Chem. C,2014, 2, 8854–8875.
35 A. L. Rinaldi and R. Craballo, Sens. Actuators, B, 2016, 228,43–52.
36 J. R. Anusha, C. J. Raj, B.-B. Cho, A. T. Fleming, K.-H. Yu andB. C. Kim, Sens. Actuators, B, 2015, 215, 536–543.
37 M. M. Hussain, M. M. Rahman, M. N. Arshad and A. M. Asiri,ChemistrySelect, 2017, 2, 7455–7464.
31682 | RSC Adv., 2019, 9, 31670–31682
38 M. M. Hussain, M. M. Rahman, M. N. Arshad and A. M. Asiri,Sci. Rep., 2017, 7, 5832.
39 T. T. Baby and S. Ramaprabhu, Talanta, 2010, 80, 2016–2022.40 X. Yang, Y. Yang, Y. Liu and X. Jiang, Electrochim. Acta, 2013,
108, 39–44.41 T. C. Gokoglan, S. Soylemez, M. Kesik, S. Toksabay and
T. Toppare, Food Chem., 2015, 172, 219–224.42 Y. Wei, Y. Li, X. Liu, Y. Xian, G. Shi and L. Jin, Biosens.
Bioelectron., 2010, 26, 275–278.43 C. He, J. Liu, Q. Zhang and C. Wu, Sens. Actuators, B, 2012,
166–167, 802–808.44 X. Chen, J. Zhu, Z. Chen, C. Xu, Y. Wang and C. Yao, Sens.
Actuators, B, 2011, 159, 220–228.45 Z. Yang, C. Zhang, J. Zhang and W. Bai, Biosens. Bioelectron.,
2014, 51, 268–273.46 L. Yu, H. Wu, B. Wu, Z. Wang, H. Cao, C. Fu and N. Jia, Nano-
Micro Lett., 2014, 6, 258–267.47 H. P. Peng, R. P. Liang, L. Zhang and J. D. Qiu, Biosens.
Bioelectron., 2013, 42, 293–299.48 L. Yang, X. Ren, F. Tang and L. Zhang, Biosens. Bioelectron.,
2009, 25, 889–895.49 S. H. Lee, H. Y. Fang andW. C. Chen, Sens. Actuators, B, 2006,
117, 236–243.50 A. Samphao, P. Butmee, J. Jitcharoen, L. Svorc, G. Raber and
K. Kalcher, Talanta, 2015, 142, 35–42.51 C. Zhang, Q. Gao and M. Aizawa, Anal. Chim. Acta, 2001, 426,
33–41.52 E. Turkusic, J. Kalcher, E. Kahrovic, N. W. Beyene,
H. Moderegger, E. Soc, S. Begic and K. Kalcher, Talanta,2005, 65, 559–564.
53 M. M. Hussain, M. M. Rahman, M. N. Arshad and A. M. Asiri,ACS Omega, 2017, 2, 420–431.
54 M. M. Hussain, A. M. Asiri, M. N. Arshad andM. M. Rahman,New J. Chem., 2018, 42, 1169–1180.
55 A. M. Asiri, M. M. Hussain, M. N. Arshad andM. M. Rahman,New J. Chem., 2018, 42, 4465–4473.
56 M. M. Hussain, A. M. Asiri, M. N. Arshad andM. M. Rahman,Chem. Eng. J., 2018, 339, 133–143.
57 M. M. Rahman, M. M. Alam, M. M. Hussain, A. M. Asiri andM. E. M. Zayed, Environ. Nanotechnol. Monitor. Management,2018, 10, 1–9.
58 A. M. Asiri, M. M. Hussain, M. N. Arshad andM. M. Rahman,J. Ind. Eng. Chem., 2018, 63, 312–321.
59 M. M. Rahman, M. M. Hussain, M. N. Arshad, M. R. Awualand A. M. Asiri, New J. Chem., 2019, 43, 9066–9075.
This journal is © The Royal Society of Chemistry 2019