Embed Size (px)
Citation preview

Vol.:(0123456789)1 3
International Journal of Plant Production (2018) 12:1–11 https://doi.org/10.1007/s42106-017-0001-z
ORIGINAL PAPER
Delineation of Potential Sites for Rice Cultivation Through Multi‑Criteria Evaluation (MCE) Using Remote Sensing and GIS
Syed Muhammad Hassan Raza1 · Syed Amer Mahmood1 · Alamgir Akhtar Khan2 · Veraldo Liesenberg3
Received: 15 May 2017 / Accepted: 25 September 2017 / Published online: 20 December 2017 © The Author(s) 2017. This article is an open access publication
AbstractPunjab, Pakistan is famous for rice production in all over the world, but economic indicators are low toward rice contribu-tion in the regional economy. Climatic and physical factors are responsible for rice yield degradation. Suitable land for rice cultivation can be mapped keeping in view these climatic and physical factors. In this research, rice cultivation season was calculated using Moderate Resolution Imaging Spectro-radiometer (MODIS) time series datasets for the complete year 2014. Landsat 8 thermal datasets were obtained for the rice cultivation season and temperature based growth variability maps were generated. The total area under investigation was 13,657 km2 out of which 931.61 km2 (6.8%) was found to be least suitable, 3316.69 km2 (24.2%) was moderately suitable, 6019.63 km2 (44%) was highly suitable and 3395.28 km2 (24.85%) was not suitable for rice crop cultivation. Results showed that highly suitable area was characterized by a temperature range between 21 and 32 °C, soil pH level between 5.5 and 7.2, soil type was < 78% clay and the soil was imperfectly drained. We compared land suitability map covering the complete land use with rice cultivated area only and found the results as follows: 592 km2 (5.9%) rice cultivation was in least suitable, 4385 km2 (44%) cultivation was in highly suitable, 2210 km2 (23.2%) cultivation was in moderately suitable and 1674 km2 (16.8%) cultivation was in not suitable regions. The techniques applied in this research may be used by local farmers to select cropping patterns and land suitability for rice crop.
Keywords Analytic hierarchy technique (AHP) · Multi-criteria evaluation (MCE) · Inverse distance weighted (IDW) · Rice cultivation · Land suitability
AbbreviationsMODIS Moderate resolution imaging
Spectro-radiometerAHP Analytic hierarchy techniqueMCE Multi-criteria evaluationIDW Inverse distance weightedLOS Length of the seasonEOS End of seasonSOS Start of seasonEC Electric conductivitySSOP Soil Survey of Pakistan
Introduction
Rice (Oryza sativa) is a food crop largely grown and widely used all over the world. About 3 billion population of the world uses it as regular food (Malesh et al. 2016). It is also the mainstay of Pakistan’s agricultural economy. Almost, two-third rural population of Pakistan is directly or indi-rectly involved in any phase of rice preparation, including seedling to harvest and harvest to the marketing and export. About 10% of the total crop area of Pakistan is cultivated with rice that takes part in value addition of about (1.3–1.6) % in the total GDP of Pakistan (Pakistan Bureau of Statis-tics 2015). Its contribution in GDP is very less, however, efforts are on the way to enhance rice productivity to boost the national economy. Urbanization trend in Pakistan is lemmatizing agricultural land so it is important to enhance per acre yield to fulfil food demands of increasing popu-lation (Hassan et al. 2016). Some growth promoting fac-tors, including temperature, pressure, humidity, soil type, soil drainage, pH level and electric conductivity of the soil, affect the rice plant growth (Maddahi et al. 2014). Per acre
* Syed Muhammad Hassan Raza [email protected]
1 Remote Sensing Group, Department of Space Science, University of the Punjab, Quaid-e-Azam Campus, Lahore, Punjab, Pakistan
2 Farm Machinery and Power, MNS University of Agriculture Multan, Multan, Pakistan
3 Forestry, Universidade do Estado de Santa Catarina, Florianópolis, Brazil

2 International Journal of Plant Production (2018) 12:1–11
1 3
productivity may be increased up to double by considering these detergents. Local farmer neglects these factors due to lack of awareness, therefore it is the responsibility of the state to establish research centers at local levels that may guide farmers to take preventive measures to improve rice productivity.
A relationship of land characteristics and crop require-ment is known as suitability (Mustafa et al. 2011). Sustain-able agricultural farming is used to achieve optimized rice production that can be exercised in environment friendly, socially acceptable and economically efficient way (Addeo et al. 2001) using available natural resources for agricul-tural production. Agricultural production can be enhanced by complying with principles of sustainable production, if one can identify the most suitable location for growth and development of a particular crop (Ahamed et al. 2000). Land suitability is a degree of similarity of land units with soil nutrient requirements of a particular crop (FAO 1976). The reflection of local needs and conditions is finally mapped well in the land suitability analysis (Prakash 2003).
Geographic Information System (GIS) is a powerful set of tools that can incorporate the local production variables (Temperature, Humidity, Soil type, Soil Drainage, EC and PH of the soil) and their relative weight according to their importance to achieve optimum production using Multi-criteria evaluation (MCE) approaches (Perveen et al. 2007). Overlay techniques in GIS do not enable one to make a com-parison between underlying production variables (Janssen et al. 1990). MCE is a modern and emerging technique in GIS to handle such limitations for GIS-based decision mak-ing (Pereira et al. 1993). MCE helps in the decision making of multiple alternatives for evaluation of decision criteria (Jankowski et al. 2001).
Due to global warming, temperature has a profound impact on rice crop phenology (Brown et al. 2012). Cool environmental conditions are responsible for the delay in achieving maturity stage for rice plant while high tempera-ture tends to achieve all rice plant development stages ear-lier, so a crop sown at the same time is not ready to harvest at the expected time but a delay is observed (Mahmood et al. 2012). An increase in temperature by 4 °C during the growth period of rice plant results in early maturing of 5–6 days in both wet and dry seasons (Ziska et al. 1997). The germina-tion percentage varies at different temperature ranges with a completion period of 2, 3, 6 and 14 days after incubation. About (90–97)% germination is achieved in 2 days at a tem-perature range of (27–37) °C, in 3 days at a temperature between (25 and 28) °C, in the 6 days between a tempera-ture range of (18–24) °C and in 14 days at a temperature range between (14 and 17) °C (Livingston et al. 1933). In leaf emergence, 100° days are recommended for first leaf emergence so 5 days are required (100/20 = 5 days) at 20 °C and every fourth day at 25 °C which is (100/25 = 4 days).
Growing degree day (GDD) is commonly used as tempera-ture based indicator to examine the rate of plant development across the study area. One degree day is the day when the mean daily temperature is at least one degree above the base temperature i.e., GDD = (Tmax + Tmin)/2 − Tbase (Islam et al. 2011). Succeeding leaf emergence continuous after the former leaf has completed its emergence. Upper leaves have longer life span than the lower ones. A temperature drop of 1 °C causes a delay of 13 days in heading (Yoshida 2012). Low temperature is considered good in the ripening stage of rice plant because the water content decreases faster at high temperatures, however above a certain limit tempera-ture can cause stress in growth which results in low yield (Nakagawa 2003). About (15–21) °C is considered optimum temperature in repining stage while (22–29) °C is critically high (Yoshida 2012).
The specific objectives of this research were to delineate suitability zones for paddy rice crop (O. sativa) with respect to temperature and physical parameters optimization and expanding rice production in the experimental site.
Materials and Methods
Experimental Site
The study area is a subset of the Punjab province in Paki-stan, mapped in Fig. 1c and consists of five major districts, including Lahore, Sheikhupura, Hafizabad, Nankana sahib and Gujranwala, with the spatial extent of 31 N to 32.5 N lat-itude and 73–75 E longitude. These districts are considered as the largest producer of rice in Punjab Pakistan. According to United States Geological Survey (USGS), our study area is the subset of Landsat satellite patch with 149 path No and 38 row No.
Experimental Design
Interviews with local agronomists of Rice Crop Monitoring Center Kala Shah Kaku (RCMCKSK), various references of literature review and opinions of rice crop specialists helped to identify critical requirements for land to be suit-able for rice cultivation. The initial factors considered in this research to differentiate appropriate zones for rice cul-tivation were temperature, soil types, soil pH, soil drainage and soil electrical conductivity. Figure 2 shows the steps involved in this research.
Step 1: Length of Season Calculation for Rice Cultivation
The MODIS time series and Normalized Difference Vegeta-tion Index (NDVI) datasets were obtained from the USGS

3International Journal of Plant Production (2018) 12:1–11
1 3
website. These datasets were collected using 8 days temporal resolution of both MODIS 13A2 and MODIS MYD 13A2. White et al. (2009) midpoint pixel formula was applied to identify the appropriate time of start of season (SOS), end of season (EOS) and length of season (LOS) for rice plantation. The algorithm is formulated as follows.
In Eq. (1), NDVI was daily interpolated value throughout the year, 2014. NDVImax and NDVImin, were the maximum and minimum NDVI values recorded in the same year. Start of season (SOS) was the day of the year when NDVI ratio exceeded 0.5 (White et al. 2009).
Step 2: Pixel Based Temperature Calculation for Different Rice Stages
Landsat 8 thermal datasets for LOS (May 20, 2014–October 20, 2014) were acquired from USGS website, keeping in view the rice plant growth stages detailed in the Table 1. Length of growing season started on May 20 instead of mid of April (111th day of the year) because according to leg-islation, it is a crime to plant rice before the May 20 due to severe borer attack (Punjab rice ordinance 1974).
(1)NDVI Ratio =NDVI − NDVImin
NDVImax − NDVImin
A thermal dataset consists of an array of pixel based numbers known as digital number (DN). Initially, these DN values for each pixel were converted into irradiance using the following formula.
The value of 3.342 × 10⁻⁴ in Eq. (2), (http://landsat.usgs.gov/Landsat8_Using_ Product.php) was extracted from metadata of Landsat 8 image. This formula helped to calcu-late Irradiance against each pixel across the thermal image in watts/(m2 × srad × μm).
For temperature calculation, the irradiance based datasets were used as input factor and the following algorithm was applied in Arc GIS 10.1.
In Eq. (3), K1 and K2 are the constants for thermal bands and their values were mentioned in metadata of Landsat 8 as follows.
K1 constant for band 10 = 774.89K1 constant for band 11 = 480.89K2 constant for band 10 = 1321.08K2 constant for band 11 = 1201.14
(2)Irradiance =
(
3.342 × 10⁻⁴ × Thermal Band
)
+ 0.1
(3)T = {K2∕ln(�K
1∕Irradiance + 1)} − 272.15
Fig. 1 Site map

4 International Journal of Plant Production (2018) 12:1–11
1 3
Value of emissivity (Ɛ) used in the Eq. (3) was 0.95. The complete procedure of temperature calculation is mentioned on USGS website.
Step 3: Soil Suitability Parameters
The data of soil suitability parameters for rice crop obtained by the courtesy of the Soil Survey of Pakistan
(SSOP). These parameters included soil type, soil drain-age, soil pH and soil electric conductivity. The soil data was in excel sheets, which was later transformed into shape files and applied inverse distance weightage (IDW) to calculate the spatial distribution across the study area. Weights were applied to each soil parameter using ana-lytical hierarchy process (AHP). The main objective of
Step 1.
Step 2.
Step 4.
SOS & EOS LOS (Days) = EOS - SOSMODIS NDVI
�me series
L 8 Thermal B 10
L 8 Thermal B 11
L8 Thermal Band
Acquisi�on for LOS
Temp B 10
Temp B 11
Average Temp
of B 10 & B 11
Pixel based
Temp in °C
Acronyms
SOS Start of Season
EOS End of Season
LOS Length of Season
L8 Landsat 8
B 10 Band 10
EC Electric Conduc�vity
MCE Mul�-Criteria Evalua�on
SSOP Soil Survey of Pakistan
Soil EC data
Source: SSOP
Soil type data
Source: SSOP
Soil pH data
Source: SSOP
Soil drainage data
Source: SSOP
Spa�al
Interpola�on
EC distribu�on map
Soil type distribu�on map
pH based soil distribu�on map
Soil drainage distribu�on map
Reclassifica�on
6 Temp maps
Soil EC map
Soil type map
Soil pH dataset map
Soil drainage map
MCE technique
weight assignment
Land suitability
Poten�al sites Rice Cul�va�on
Map
Delinea�on of rice cul�va�on in
various suitability zones
Irradiance B10
Irradiance B11
Mid Point Method
Fig. 2 Flowchart of methodology for suitability zones for rice cultivation

5International Journal of Plant Production (2018) 12:1–11
1 3
assigning weight is to express the importance of a soil parameter as compared to the other (Kihoro et al. 2013).
Step 4: Weight Assignment for Multi‑Criteria Decision Making
Comparison of two factors is used to assign the weight. This weight actually defines the mutual relationship between two parameters using a pairwise comparison matrix with a scale from 9 to 1/9 by Saaty (1980). In the matrix, the diagonal is assigned as 1 because one parameter is compared with itself. The matrix is divided into two triangles (Upper and Lower), upper triangle is exactly the reciprocal to the lower one (for example, if electrical conductivity relative to soil type is 7, the soil type relative to electric conductivity is 1/7).
Results and Discussion
Length of Season for the Study Site
Figure 3 shows that SOS for rice plantation, started on 111th day of the year (mid of April) and end of season (EOS) was
320th day (November), so rice cultivation was good to exer-cise in this time span in our study area.
The curve in Fig. 3 represents the variations in NDVI values throughout the year, 2014. The linear increase in NDVI reached 0.5 on 111th day so the time between (Janu-ary–Mid of April) was not suitable for rice cultivation. Sharp increase in vegetation index has been noticed after 111th day which gradually increased to the value around 0.71 and then showed dip. Dip or twist in the curve showed that vegetation index degraded in the month of May–July. The sudden rise in temperature was also noticed during these months and dip in curve can be related to rise in temperature values as curve got another jump when ambient temperature got moderate during the months of August–September.
Delineation of Potential Zones for Rice Crop at Different Temperature Values
Table 2 was prepared by mixing thoughts obtained via inter-views from local agronomists and the field observations. This table illustrates that all rice plant stages were sensitive to temperature. The temperature values, less than 15 °C and above (40–45) °C were not suitable for any development stage of rice plant and temperature values for germination (22–32) °C, flowering, milky dough (25–30) °C and ripening stage (18–28) °C were highly suitable for rice crop. High temperature values were suitable when the rice plant was in tillering and panicial primoda initiation stage. Ripening stage was sensitive to temperature that ended in 13 days at 28 °C and 33 days at 16 °C. The same results were obtained by the findings of recent researches of Yoshida et al. 2012a and Zhang et al. 2016.
We computed pixel based temperature values for all thermal datasets discussed in Table 1 in Arc GIS 10.1 and
Table 1 Landsat eight image acquisition for rice plant growth stages
Date Rice plant growth stages
21-05-2014 Leaf emergence stage22-06-2014 Tillering stage08-07-2014 Panical primoda initiation stage25-08-2014 Flowering stage13-09-2104 Milky dough stage15-10-2014 Ripening stage
Fig. 3 Length of season calcula-tion for rice crop using NDVI values

6 International Journal of Plant Production (2018) 12:1–11
1 3
Table 2 Temperature based growth variability levels for rice plant
Rice stages Leaf emergence (°C) Tillering (°C) Panical primoda (°C) Flowering (°C) Milky dough (°C) Ripening (°C)
Less suitable > 20 > 18 > 23 > 28 > 25 > 18Moderately suitable 28–35 18–24 37–45 32–40 30–40 28–35Highly suitable 20–28 24–32 23–37 28–31 25–30 18–28Not suitable > 15 & < 35 > 15 & < 32 > 15 & < 45 > 15 & < 40 > 15 & < 45 > 15 & < 35
Fig. 4 Temperature based growth variability maps. a Rice crop in leaf emergence stage, May 21, 2014. b Rice crop in tillering stage, June 22, 2014. c Rice crop in panicle primoda initiation stage, July 08, 2014. d Rice crop in the flowering stage, Aug 25, 2014. e Rice crop on milky dough stage, Sep 13, 2014. f Rice crop on ripening stage, Oct 15, 2014 (g)

7International Journal of Plant Production (2018) 12:1–11
1 3
applied temperature based suitability levels defined in Table 2. Temperature based suitability zones for rice crop were mapped in Fig. 4. All the maps (a–f) in Fig. 4 were averaged that returned the final land suitability map (g) on temperature grounds using spatial analyst tools in Arc GIS 10.1. The maps (a–f) in Fig. 4 describes the suitability levels as follows: the red regions in all maps (a–f) were urban areas
those did not show suitability for rice cultivation, perhaps due to high temperature and high concentration of pollution values, and dark green areas in outskirts of roads and urban population appeared moderately suitable for rice cultivation. The light green areas away from roads and urban population showed high suitability for rice cultivation and the areas along with water body appeared less suitable for rice cultiva-tion may be due to low temperature values.
Final temperature based suitability map was obtained by taking the average of all temperature based maps (a–f) gen-erated for each rice crop growth stage.
Fig. 4 (continued)
Table 3 Suitability levels for soil based parameters for rice crop
Scale Soil type Soil drainage Soil pH Soil EC
Less suitable Sandy clay Highly drained 4.0–5.0 0.00–0.25Moderately suitable Silty clay Well drained 7.7–8.3 0.25–0.75Highly suitable Clay Imperfectly drained 5.5–7.2 0.75–1.50Not suitable Sand Excessively drained > 4 & < 8.4 1.75–2.25
Table 4 Pairwise comparison matrix of criteria in Analytical Hierar-chy Process (AHP) for soil parameters
Scale Soil type EC pH Soil drainage Weightage
Soil type 1 0.3555EC 3′ 1 0.2740pH 1/5 1/3 1 0.2104Soil drainage 1/3 1/3 1/7 1 0.0983
∑ = 1

8 International Journal of Plant Production (2018) 12:1–11
1 3
Delineation of Potential Zones for Rice Crop at Different Land Suitability Parameters
Table 3 shows that the clay was highly suitable because it was imperfectly drained, sand was not suitable because it
was excessively drained, silty clay was moderately suitable because it was well drained and sandy clay was less suitable because it was highly drained. Electric conductivity (EC) values between 1.75 and 2.25 were not suitable because it led to burn the rice plant, the EC values between 0.75 and
Fig. 5 Growth variability maps on soil suitability parameters. a Drainage map. b EC map. c pH map. d Soil type map. e Combination of EC, pH, Drainage and soil type layers using weight
Fig. 6 Rice crop land suitability map on the basis of both temperature and physical parameters
9International Journal of Plant Production (2018) 12:1–11
1 3
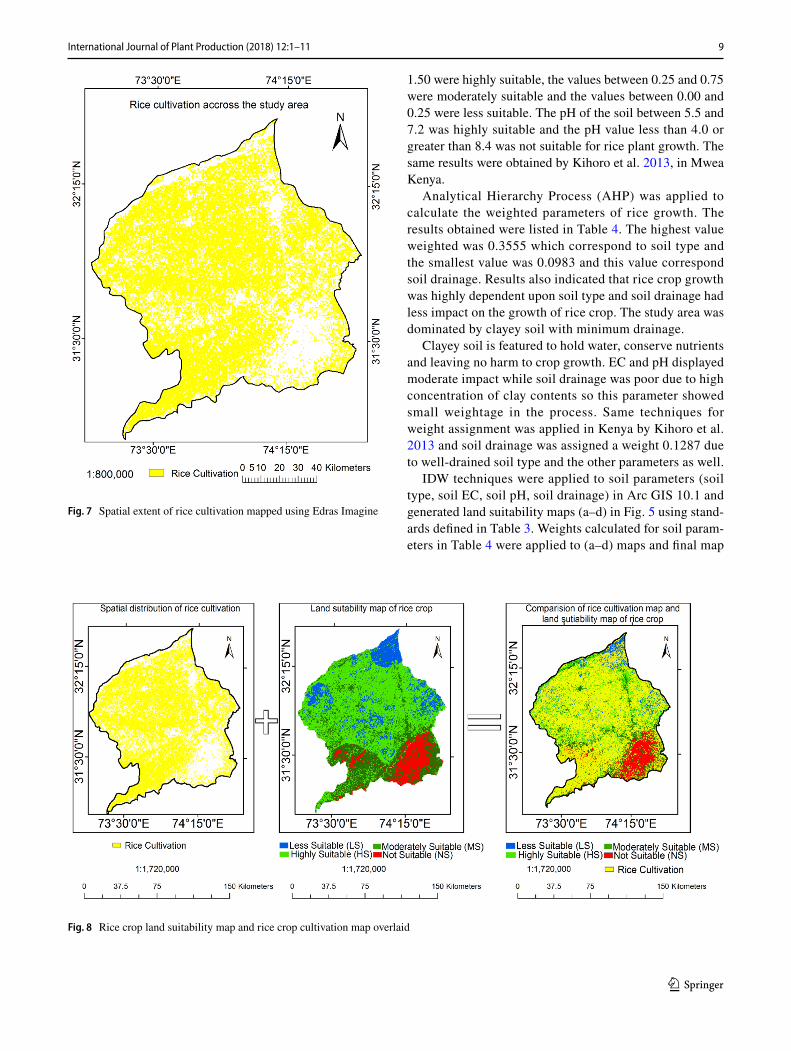
1.50 were highly suitable, the values between 0.25 and 0.75 were moderately suitable and the values between 0.00 and 0.25 were less suitable. The pH of the soil between 5.5 and 7.2 was highly suitable and the pH value less than 4.0 or greater than 8.4 was not suitable for rice plant growth. The same results were obtained by Kihoro et al. 2013, in Mwea Kenya.
Analytical Hierarchy Process (AHP) was applied to calculate the weighted parameters of rice growth. The results obtained were listed in Table 4. The highest value weighted was 0.3555 which correspond to soil type and the smallest value was 0.0983 and this value correspond soil drainage. Results also indicated that rice crop growth was highly dependent upon soil type and soil drainage had less impact on the growth of rice crop. The study area was dominated by clayey soil with minimum drainage.
Clayey soil is featured to hold water, conserve nutrients and leaving no harm to crop growth. EC and pH displayed moderate impact while soil drainage was poor due to high concentration of clay contents so this parameter showed small weightage in the process. Same techniques for weight assignment was applied in Kenya by Kihoro et al. 2013 and soil drainage was assigned a weight 0.1287 due to well-drained soil type and the other parameters as well.
IDW techniques were applied to soil parameters (soil type, soil EC, soil pH, soil drainage) in Arc GIS 10.1 and generated land suitability maps (a–d) in Fig. 5 using stand-ards defined in Table 3. Weights calculated for soil param-eters in Table 4 were applied to (a–d) maps and final map
Fig. 7 Spatial extent of rice cultivation mapped using Edras Imagine
Fig. 8 Rice crop land suitability map and rice crop cultivation map overlaid

10 International Journal of Plant Production (2018) 12:1–11
1 3
(e) in Fig. 5 was generated using a spatial analyst tool in Arc GIS 10.1.
Application of MCE Techniques to the Both Temperature Based and Soil Suitability Parameters Based Maps
Multi-criteria evaluation (MCE) techniques, then applied to (g) map in Fig. 4 (temperature base suitability map for rice crop) and (e) map in Fig. 5 (soil base suitability map for rice crop) to make a combined map shown in Fig. 6. This map was generated using weighted overlay tools of Spatial Analyst in Arc GIS 10.1. Area in square kilometer was calculated for each suitability class as follows, the total area under investigation was 13,657 km2 out of which 931.61 km2 (6.8%) was less suitable, 3316.69 km2 (24.2%) was moderately suitable, 6019.63 km2 (44%) was highly suitable and 3395.28 km2 (24.85%) was not suitable for rice crop cultivation. Results showed that highly suitable area was characterized by a temperature range between (21 and 32) °C, soil pH level between 5.5 and 7.2, soil type is more than 78% clay and the soil drainage is imperfectly drained. Not suitable areas were characterized by dense urban population with high temperature, imperfect soil type and soil pH levels less than 4 or more than 8.4.
Supervised Classification
To improve the results, we performed land use/cover (LULC) supervised classification in Erdas Imagine 14.0 and the rice cropped area was extracted and mapped in Fig. 7 that was 8611 Km2. A field survey was conducted along with Maali patwari (a person who preserves the complete record of crop plantation in his area of command) to cross vali-date and compute the reliability of classification which was 92.5% reliable. The reliability of supervised neighborhood classification may be up to 94% according to international standards (Sisodia et al. 2014).
We compared the rice crop actual cultivation map obtained by supervised classification in Fig. 7 with rice crop suitability map in Fig. 6 using overlay analysis in Arc GIS 10.1 and mapped the results in Fig. 8. The main purpose of this comparison was to determine the actual rice cultivation area in less suitable, moderately suitable, highly suitable and not suitable zones. We found the rice cultivation area as fol-lows: 592 km2 (5.9%) area in less suitable, 4385 km2 (44%) area in highly suitable, 2410 km2 (23.2%) area in moderately suitable and 1674 km2 (16.8%) area in not suitable regions. The less suitable area decreased from 6.8 to 5.9%, moder-ately suitable area decreased from 24.2 to 23.2%, highly suit-able area remained the same and not suitable area decrease from 24.85 to 16.8% due to the comparison. This variation
in results may be due to rice cultivation in built up areas, water covered areas and the outskirts. So, the race to develop regional economy is not only affecting the climatology of the rice plant, but also the physical characteristics of soil are disturbed that finally leads to yield degradation. It also shows that practically rice was also being grown in areas which are not suitable or less suitable for rice resulting into yield degradation as shown in (Fig. 8).
Conclusions and Recommendations
Spatial analytical techniques in Arc GIS 10.1 are useful to identify suitable sites for rice cultivation. Multi-criteria evaluation using analytical hierarchy process makes a deci-sion and policy maker capable enough to make a fruitful policy to get enhanced rice crop yield. This technique has been used in other countries, but it is a new and originally applied in Eastern Punjab Pakistan. Local farmers can use this application to select cropping pattern biophysically. But they are not educated enough to apply these techniques so it is recommended that the Government should introduce it at cluster level in agricultural centers for awareness of the locals to improve crop productivity.
This work was completed to provide a tool to enhance per acre yield to fulfil food demands of the increasing popula-tion. This research model may be applied anywhere in the world to demarcate the rice friendly land which will result in enhancing regional economy because satellite data is freely available, soil parameters are easy to collect and finally the GIS based techniques are easy to apply.
Acknowledgements The authors acknowledge the worthy vice chan-cellor of University of the Punjab for provision of enough research funds for purchasing equipment to conduct filed survey and establish-ment of research lab to the remote sensing and GIS group at department of Space Science University of the Punjab Lahore. The authors are also thankful to the Soil Survey of Pakistan for sharing the soil related data.
Open Access This article is distributed under the terms of the Creative Commons Attribution 4.0 International License (http://creativecom-mons.org/licenses/by/4.0/), which permits unrestricted use, distribu-tion, and reproduction in any medium, provided you give appropriate credit to the original author(s) and the source, provide a link to the Creative Commons license, and indicate if changes were made.
References
Addeo, G., Guastadisegni, G., & Pisante, M. (2001). Land and water quality for sustainable and precision farming. Madrid: I World Congress on Conservation Agriculture.
Brown, M. E., et al. (2012). Global phenological response to climate change in crop areas using satellite remote sensing of vegetation, humidity and temperature over 26 years. Remote Sensing of Envi-ronment, 12(6), 174–183.

11International Journal of Plant Production (2018) 12:1–11
1 3
FAO. (1976). A framework for land evaluation: soils bulletin 32. Rome: Food and Agriculture Organization of the United Nations.
Hassan, et al. (2016). Spatiotemporal monitoring of urban sprawl and its impact assessment in district Sheikhupura through remote sensing and GIS using satellite images from 1976–2014. Science International (Lahore), 28(2), 1583–1588.
Islam, M. R., et al. (2011). Phenology and degree days of rice culti-vars under organic culture. Bangladesh Journal Botony, 40(2), 149–153.
Jankowski, P., Andrienko, N., & Andrienko, G. (2001). Map-cantered exploratory approach to multiple criteria spatial decision mak-ing. International Journal of Geographical Information Science, 15(2), 101–127.
Janssen, R., & Rietveld, P. (1990). Multi-criteria analysis and geo-graphical information systems: An application to agricultural land use in the Netherlands. In H. J. Scholten & J. C. H. Stillwell (Eds.), Geographical information systems for urban and regional planning (pp. 129–139). Dordrecht: Kluwer Academic.
Kihoro, J., et al. (2013). Suitability analysis for rice growing sites using a multicriteria evaluation and GIS approach in great Mwea region, Kenya. Springer Plus, 2, 265. https://springerplus.springeropen.com/track/pdf/10.1186/2193-1801-2-265?site=springerplus.sprin-geropen.com
Livingston, B. E., & Haasis, F. W. (1933). Relations of time and main-tained temperature to germination percentage for a Lot of rice seed. American Journal of Botany, 20 (9), 596–615.
Maddahi, Z., et al. (2014). Land suitability analysis for rice cultiva-tion using multi criteria evaluation approach and GIS. European Journal of Experimental Biology, 4(3), 639–648.
Malesh, M. K., et al. (2016). Development of remote sensing based rice yield forecasting model. Spanish Journal of Agricultural Research, 14 (3), 0907.
Mahmood, N., et al. (2012). Impact of temperature and precipitation on rice productivity in rice-wheat cropping system of Punjab prov-ince. The Journal of Animal and Plant Sciences, 22(4), 993–997.
Mustafa, A. A., Man, S., Sahoo, R. N., Nayan, A., Manoj, K., Sarangi, A., et al. (2011). Land suitability analysis for different crops. A multi criteria decision making approach using remote sensing and GIS. New Delhi: Indian Agricultural Research Institute.
Nakagawa, H., et al. (2003). Effects of climate change on rice produc-tion and adaptive technologies. Philippines: Rice science: inno-vations and impact for livelihood. International Rice Research Institute pp 635–658.
Nisar Ahamed, T. R., Gopal Rao, K., & Murthy, J. S. R. (2000). GIS-based fuzzy membership model for crop-land suitability analysis. Agriculture System, 63(2), 75–95.
Pakistan Bureau of Statistics, 2015. Pakistan Bureau of Sta-tist ics repor t 2015 (http:/ /www.pbs.gov.pk/content/monthly-bulletin-statistics-October-2015)
Pereira, J. M. C., & Duckstein, L. (1993). A multiple criteria deci-sion-making approach to GIS-based land suitability evaluation. International Journal of Geographical Information Science, 7(5), 407–424.
Perveen, F., Ryota, N., Imtiaz, U., & Hossain, K. M. D. (2007). Crop land suitability analysis using a multi-criteria evaluation and GIS approach, Fifth International Symposium on Digital Earth (pp. 1–8). Berkeley: The University of California.
Prakash, T. N. (2003). Land suitability analysis for agricultural crops: A fuzzy multi-criteria decision making approach (pp. 6–13). Enschede: International Institute for Geo-information Science and Earth Observation.
Punjab Laws (Adaptation) Order, 1974 (Pb. A.O. 1 of 1974); and pub-lished in the Punjab Gazette (Extraordinary), dated 20.11.1974, pages 1425-A to 1425-PP, see Article 2 and Schedule, Part III, at entry No. 90 (w.e.f. 14.8.1973)
Saaty, T. L. (1980). The analytic hierarchy process: planning, priority setting, resource allocation. McGraw Hill, New York
Sisodia, P.S., Tiwari, V., Kumar, A. (2014). Analysis of supervised maximum likelihood classification for remote sensing image IEEE international conference on recent advances and innovations in engineering (ICRAIE-2014), May 09–11, 2014, Jaipur, India.
White, M. A., de Beurs, K., Inouye Didan, K., Richardson, A., Jensen, O., et al. (2009). Inter comparison, Interpretation, assessment of spring phonology in north America estimated from remote sens-ing for 1982–2006. Global Change Biology, 15, 2335–2359.
Yoshida, S. (2012a). Effects of temperature on growth of the rice plant (Oryza sativa L.) in a controlled environment. Soil Science and Plant Nutrition, 19(4), 304–307.
Yoshida, S. (2012b). Effects of temperature on growth of the rice plant (Oryza sativa L.) in a controlled environment. Soil Science and Plant Nutrition, 19(4), 302–304.
Zhang, Y., et al. (2016). Remote monitoring of heading rice growing and nitrogen content based on UAV images. International Journal of Smart Home, 10(7), 103–114.
Ziska, E., Fraser, D., et al. (1997). Assessing risks of climate variability and climate change for rice. Science, 240, 996–1002.