Embed Size (px)
Citation preview
Government of the Republic of Macedonia
D R A F T
STRATEGIC COHERENCE FRAMEWORKof the Republic of Macedonia
2007 – 2013
Skopje
July 2007
Strategic_Coherence_Framework_Final_31 07 07 1
Table of Contents
1. Preparation of the Strategic Coherence Framework ................................................ 41.1. Policy context .......................................................................................................... 41.2. National preparation process and timetable.......................................................... 5
2. Analysis of the socio-economic situation................................................................. 72.1. Recent economic developments............................................................................. 72.2. Socio-economic analysis ........................................................................................ 92.3. SWOT analysis covering the sectors and priorities for support ........................ 26
3. Objectives and consistency..................................................................................... 313.1. Objectives to be pursued under IPA Regional Development and HumanResources Development components ........................................................................ 313.2. Consistency with Community priorities (MIPD and Strategic Guidelines) ........ 323.3. Consistency with national priorities..................................................................... 343.4. SCF internal consistency ...................................................................................... 37
4. Operational Programmes – brief description of main priority axes (strategicpriorities) under each operational programme............................................................... 38
4.1. Regional development Multi-annual Operational Programme............................ 384.2. Human Resources Development Multi-annual Operational Programme ........... 40
5. Indicative breakdown of the financial allocations between the underlyingoperational programmes (covering 3-year period in accordance with MIFF and MIPD)........................................................................................................................................... 43
5.1. Regional Development Operational Programme ................................................. 435.2. Human Resources Development Operational Programme ................................. 43
6. Key elements of implementation ............................................................................. 446.1. Sectoral and geographical coordination and partnership arrangements.......... 446.2. Complementarities and synergies between Operational Programmes.............. 456.3. Coordination with other national programmes supported by internationalfinancial institutions (IFIs) or other relevant external assistance ............................. 466.4. Coordination with other IPA components............................................................ 50
7. ANNEXES ...................................................................................................................... 537.1. Tables ..................................................................................................................... 537.2. Maps ....................................................................................................................... 58
Strategic_Coherence_Framework_Final_31 07 07 2
LIST OF TABLES
Table 2-1 Contribution to growth by economic sectors (2005-2006) ..................................... 7
Table 2-2 Regional disparities ............................................................................................ 17
Table 2-3 Average and expected years of schooling, 2005................................................ 22
Table 2-4 Vertical progress of the student’s generation 1991/1992..................................... 23
Table 2-5 Public social protection expenditures (in mill. denars)......................................... 25
Table 2-6 SWOT analysis covering Regional Development component.............................. 27
Table 2-7 SWOT analysis covering Human Resources Development component ............. 29
Table 5-1 Financial allocations of IPA funds under Regional Development OP 2007-2009 (inmillion EUR) ....................................................................................................................... 43
Table 5-2 Financial allocations of IPA funds under Human Resources Development OP2007-2009 (in million EUR)................................................................................................. 43
Table A1 Basic macroeconomic data for the Republic of Macedonia.................................. 53
Table A2 Forecasted traffic flow for years 2007-2020 Specific Sections on Corridor X ....... 54
Table A3 Participation and employment rates by different characteristics, 2003-2006 ........ 55
Table A4 Participation, employment and unemployment rates by ethnicity, 15-80 .............. 55
Table A5 Regional (NUTS 3) labour market characteristics, 15-80 ..................................... 55
Table A6 Employed by economic status and ownership in % of total, 15-80....................... 56
Table A7 Unemployment rates by different characteristics, 2003-2006............................... 56
Table A8 Social Assistance: Regional Structure of Beneficiaries ........................................ 57
Table A9 Number of students at educational levels by ethnic origin in 2002/2003 .............. 58
LIST OF FIGURES
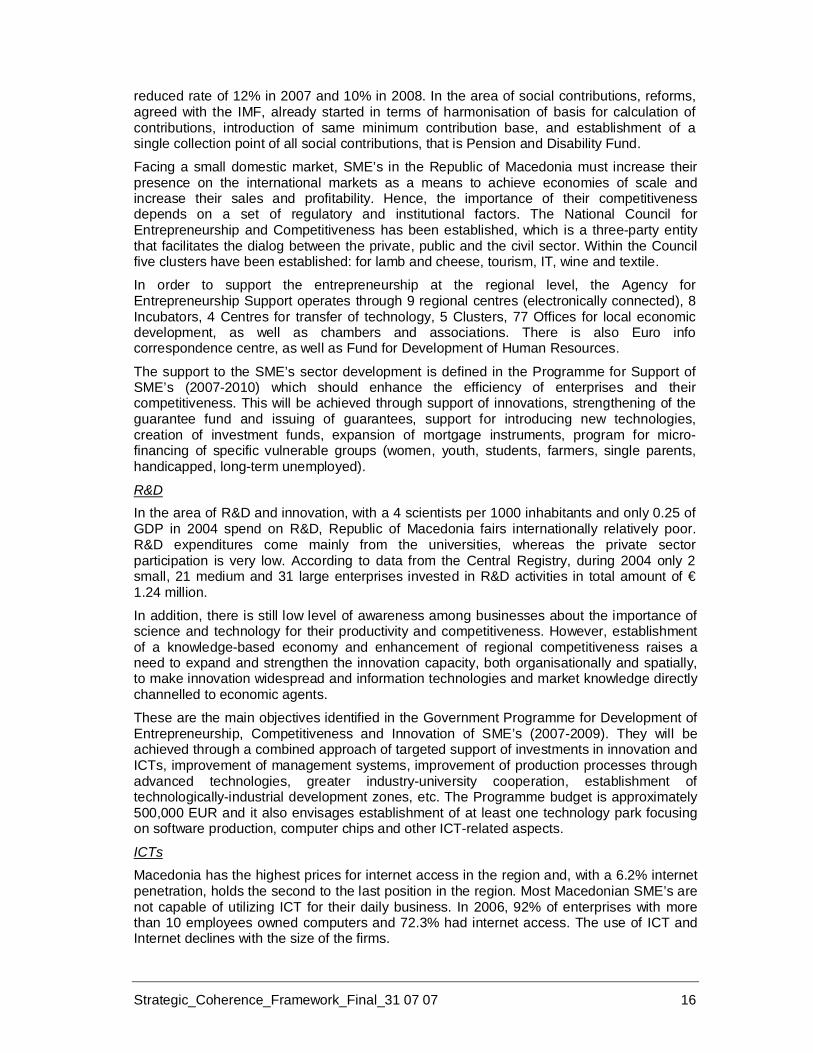
Figure 2-1 GDP per capita (PPP in $US)............................................................................ 18
Figure 2-2 Employment rates for different groups, 2003 and 2006...................................... 19
Figure 2-3 Employment by sectors, 2006............................................................................ 20
Map B1: Pan European Corridors in Republic of Macedonia (Road Infrastructure)............. 58
Map B2: Pan European Corridors in Republic of Macedonia (Rail Infrastructure) ............... 59
Map B3: Macedonia Statistical NUTS level 3 regions (last proposal) .................................. 59
Strategic_Coherence_Framework_Final_31 07 07 3
List of abbreviationsALMP’s Active Labour Market PoliciesAPEP Action Plan for European PartnershipBEEPS Business Environment and Enterprise Performance SurveyCEB Council of Europe Development BankCSW Centre for Social WorkCPS Country Partnership StrategyDIS Decentralised Implementation SystemDPM Deputy Prime Minister (Office for Economic Affairs)DPL’s Development Policy LoansEAR European Agency for ReconstructionEC European CommissionECD European Commission DelegationEP European PartnershipESF European Social FundESA Employment Service AgencyEU European UnionFB Final BeneficiaryGEF Global Environment FacilitiesGoRM Government of the Republic of MacedoniaILO International Labour OrganizationIPA Instrument for Pre AccessionIPARD Instrument for Pre-Accession Assistance for Rural DevelopmentJAP Joint Assessment PaperJIM Joint Inclusion MemorandumLFS Labour Force SurveyLSG’s Local Self GovernmentsMoEPP Ministry of Environment & Physical PlanningMoF Ministry of FinanceMoLSP Ministry of Labour & Social PolicyMoTC Ministry of Transport & CommunicationsNAPE National Action Plan for EmploymentMoU Memorandum of UnderstandingNDP National Development PlanNES National Employment StrategyNPAA National Programme for the Adoption of the AcquisOP(s) Operational Programme(s)PPP Public Private PartnershipRM Republic of MacedoniaSCF Strategic Coherence FrameworkSEA Secretariat for European AffairsSEETO South East Europe Transport ObservatorySME’s Small Medium EnterprisesSPIL Social Protection Implementation LoanSWC Social Work CentreTA Technical AssistanceTOR Terms of ReferenceTWA’s Temporary Work AgenciesUNDP United Nation Developing ProgrammeUSAID US Agency for International DevelopmentVET Vocational Education & TrainingWWTP’s Water Waste Treatment Plants

Strategic_Coherence_Framework_Final_31 07 07 4
1. PREPARATION OF THE STRATEGIC COHERENCE FRAMEWORK1.1. Policy contextConsidering the country’s commitment for a full integration into the EU, as an ultimate andstrategic goal of the Republic of Macedonia, the Strategic Coherence Framework (SCF) forthe period 2007-2013 aims at strategic programming of investments in the areas ofregional and human resources development, consistent with the EU Multi-AnnualIndicative Planning Document (MIPD) 2007-2009, as well as with the National DevelopmentPlan (NDP) 2007-2009 and other strategic documents prepared by the Government of theRepublic of Macedonia (GoRM). The document is complementary with the guiding principlesof the EU.
At the European Council Summit in December 2005, Republic of Macedonia was granted a"candidate country" status. Similarly as in the case of other candidate countries beforetheir accession to the EU, the Republic of Macedonia is entitled for the pre-accessionassistance that should support the country in copping with the challenges of the Europeanintegration process. In particular, it should assist and support the country in implementingthe necessary reforms; to accomplish obligations arising from the Stabilisation andAssociation Process and to fulfil the Copenhagen economic, political and acquis relatedcriteria.
According to the Council Regulations 1085/2006, the EU pre-accession assistance will bechannelled to the candidate countries through the Instrument for Pre-accession Assistance(IPA). As a candidate country Republic of Macedonia will be eligible for all five componentsof the IPA, namely for:
• Transition Assistance and Institution Building component;
• Cross-border Co-operation component;
• Regional Development component;
• Human Resources Development component and
• Rural Development component.
The EU basic policy documents for setting down the priorities for programming of theassistance under IPA are the Enlargement Strategy Paper, the MIPD, the EuropeanPartnership (EP), as well as the annual Progress Report on the EU accession, includingimplementation and enforcement of EU standards.
The legal basis and the objectives are set out by the Council Regulation 1085/2006.The MIPD 2007-2009, adopted by the European Commission in May 2007 is the key multi-annual planning document covering the assistance granted to the country under IPA for theperiod 2007-2009. It follows the Multi-annual Indicative Financial Framework (MIFF) 2007-2010, which indicatively allocates funds per beneficiary and per component. The prioritiesset out in the MIPD were basis for the preparation of the SCF 2007-2013 and serve as abasis for the programming of EU funds for each of the five IPA components.
Along with the candidate status, the Republic of Macedonia also received the secondEuropean Partnership modified and updated according to the findings of the EC’s Avis,presenting a list of short- and medium-term priorities of the country in light of itspreparations for integration into the EU.
Given the fact that the preparation of the SCF (and Operational Programmes-OP’s) shouldbe based on relevant national development documents, in February 2007, the Governmentof the Republic of Macedonia (GoRM) adopted the National Development Plan 2007-2009.The National Development Plan (NDP) is a mid-term strategic document that sets out thenational investment/development priorities, respecting the Community priorities set out inthe MIDP 2007-2009. The SCF 2007-2013 is a strategic document covering the areas of
Strategic_Coherence_Framework_Final_31 07 07 5
regional and human resources development of IPA assistance, with a longer time horizonrelative to the NDP.
Having in mind that the resources under the five IPA components are governed by the so-called programming principle, it is requested from each IPA beneficiary country to developannual and multi-annual operational programmes per components, that will consistentlyintegrate the EU assistance into the general framework of the country’s development, andwill ensure that the development priorities and the policies of the country and of the EU areintertwined. During the implementation of the operations co-financed by IPA, all appropriatesteps will be taken to prevent any discrimination on the basis of gender, race or ethnicorigin, religion or belief, disability, age or sexual orientation.
Assistance provided in the framework of the SCF will be in full compliance with thesustainable development principles and will meet the relevant environmental norms, inparticular EIA, Habitats, Birds (in order to avoid negative impacts on potential Natura 2000sites) and the relevant environmental acquis. Investments in the environmental sector will beplanned based on the integrated and strategic approaches, in particular in line with the riverbasin approach and waste management planning. The projects to be financed will beappraised case by case in order to be coherent with the relevant obligations of theenvironmental acquis. The relevant international initiatives/conventions (DABLAS andBarcelona) should also be taken into account including in the investment planning.
Whereas, programming for the first two IPA components, i.e. for Transition Assistance andInstitution Building component and for Cross-border Co-operation component , has beenbased by most on the priorities defined in the EP and the National Programme for theAdoption of the Acquis (NPAA), the SCF 2007-2013 provides a frame of reference andbasis for the IPA Regional Development and Human Resources Development components.These two IPA components will also be covered in details by separate OperationalProgrammes. In particular, the SCF and OP’s are expected to outline “priority axis”, i.e.,global objectives that will be achieved in a particular field, and “measures”, i.e., means bywhich the “priority axis” are supposed to be implemented.
1.2. National preparation process and timetableRepublic of Macedonia is strongly committed to become member state of the EU and in thisrespect it streamlines all its efforts and resources to the process of fulfilment of allnecessary preconditions and requirements. Furthermore, the GoRM takes all necessarysteps towards the harmonisation and implementation of the relevant EU acquis andstandards.
The process of preparation of the SCF is part of the general process of preparation forutilisation of IPA funds, i.e. the process of national IPA programming. The preparations ofthe Republic of Macedonia for IPA started very soon after this instrument was promoted andintroduced by the EC. By the end of the year 2005 the national authorities were introducedto the concept of this instrument, to the possibilities it offers and to the requirements thecountry should satisfy in order to start utilizing the assistance under IPA. In this context twoparallel set of activities started in order to prepare the country for the programming processand for the decentralized implementation of the assistance under this new instrument. Thepreparations intensified in 2006 with increased dynamics in the communication between thenational authorities and the Commission’s services.
Adoption of the NDP 2007-2009 was important, being starting point for the preparation ofthe SCF 2007-2013, since NDP serves as basis for further development of strategies andprogramming documents.
Candidate status gave Macedonia access to all IPA components. Government of theRepublic of Macedonia started the preparations for IPA at the beginning of 2006, and onDecember 27, 2006, in consultations with EC, it adopted draft the National Action Plan for

Strategic_Coherence_Framework_Final_31 07 07 6
IPA preparations which was thereafter amended on June 12, 2007. The Action Plandefines the timetable for the preparation of all programming documents per components andfor the SCF, as well as for the preparation for managing IPA funds. It serves as aninstrument for enhancement of the coordination among the national institutions, as well asfor intensification of the activities related to the programming of IPA and the preparations forits future utilisation. It sets the dynamics of the activities of the Government related to thepreparation of all programming documents per each IPA component, as well as of theactivities for the establishment and accreditation of the national system for decentralizedmanagement of EU funds. Until today, several planned steps were implemented, and hencethe Action Plan has to be amended.
In addition, activities related to the establishment of the national structure that will deal withthe programming and implementation of the assistance under IPA started in October 2006.On its session held on 9th of December 2006, the GoRM confirmed the formation of theNational IPA Structure responsible for drafting OP’s and SCF. Then, Strategic Coordinator- Deputy Prime Minister (DPM) for Economic Affairs, established the National ProgrammingTeam for SCF. The SCF and the two OP’s were prepared in close cooperation between thethree national programming teams assisted by the external consultants provided by EC andEuropean Agency for Reconstruction.
In March 2007, Ministry of Finance, in coordination with the programming team, preparedthe first draft of SCF, which, on 19th March 2007, was shared with DG Regio and DGEmployment for preliminary comments. The relevant DG’s delivered to the Governmentunofficial and preliminary comments and suggestions for improvement of the draftdocument, which were respectively taken into consideration. The revised and improvedversion of the document was sent back for consideration and further comments to therelevant DGs on 18th April 2007.
In the period 23-25th April, programming mission of DG Regio took place in Skopje. Withinthis mission, separate meetings with the Strategic Coordinator and the line ministries, on thepreparation of SCF were held, and resulted with further modifications and finalisation of thedocument.
On the 8th of June 2007 the revised version of the draft SCF was officially transmitted byDPM and NIPAC to the EC services for considerations, interservice consultations and officialcomments. On the 25th of June DG Regio delivered the official comments on the draft SCF.The improved draft version of SCF incorporating the Commission’s comments and remarkswas submitted by DPM and NIPAC to DG Regio on 11th of July 2007. The document will befinalised within the Programming mission of DG Regional Policy and DG Employment thatwill take place on 24-25 July.
In parallel with the programming process, the Government is preparing itself for the conferralof management of EU funds by European Commission. GoRM is establishing the system fordecentralised implementation of EU funds, and undertook the necessary activities andpreparations for the accreditation process. Accredited DIS system and conferredmanagement is precondition for the implementation of the assistance under the RegionalDevelopment, Human Resources and Rural Development components of IPA.

Strategic_Coherence_Framework_Final_31 07 07 7
2. ANALYSIS OF THE SOCIO-ECONOMIC SITUATION2.1. Recent economic developmentsThe macroeconomic performance of Republic of Macedonia in the last few years has beenquite favourable, with average growth of around 4%; low and stable inflation rate; decliningcurrent account balance, strong growth of credit to private sector and declining trend ofinterest rates, as well as modest decline of unemployment rate.
According to the preliminary data provide by the State Statistical Office, quarterly data onGDP in 2006 show a real growth of 3.1% in 2006 (on annual basis)1. The growth was mainlyresult of the growth in the service sector, where trade increased by 5.5%, while transportand communications grew by 7.5%. Still, achievements in the real sector are somewhatlower than the projected, due to the low industry growth and the low growth in constructionsector. In particular, in 2006, industrial production increased by 3, 6%, whereas theprojected annual growth was 4.1%. A significant decline was noted in the publishing (18%),furniture industry (22%) and supply of electricity gas and water (0.6%).
Table 2-1 Contribution to growth by economic sectors (2005-2006)
Productionapproach
2005 2005 2006 2006
I II III IV I II III IV
Agriculture 0.1 0.1 0.0 -0.1 0.0 0.1 0.1 0.0 0.0 0.1
Industry 0.6 2.6 0.9 0.5 1.1 -0.2 1.2 2.0 0.4 0.8
Construction -0.3 -0.5 -0.1 0.0 -0.2 -0.1 0.1 0.1 -0.2 0.0
Services 0.8 1.2 1.6 1.6 1.4 1.9 1.6 8.7 8.7 1.8
GDP 2.8 4.9 3.9 3.8 4.1 2.2 3.4 4.0 2.7 3.1
Note: Adding taxes, imputed banking services, and imputed rents to the table will make thesectoral growth rates to add up to total GDP growth rate.
Source: State Statistical Office and MoF calculations
In absence of comprehensive data on domestic consumption in the Republic of Macedonia,analysis of the expenditure side of GDP is based on a qualitative assessment according tothe anticipated changes in each component of domestic consumption, as well as of the mainindicators. This analysis points out that growth in 2006 was still higher than the onedetermined on the production side. The actual public expenditure growth in the first threequarters of 2006, as well as the presumed personal consumption growth on the basis of thesalary rise, credit expansion to households, growth of retail trade, higher inflows from privatetransfers and higher import of consumption goods, point out to a growth of the finalconsumption in the first half of 4.5-5% and a positive effect on the GDP. At the same time,significant growth of investments in machines and equipment in the analysed period by20.2% points out to high positive share of gross investments in GDP growth. The risk of thisassumption is investments in construction, for which no preliminary data exist yet, but takinginto account the results achieved in the construction sector in the first three quarters of 2006(increase by only 0.3%), their growth is likely to be relatively low. On the basis of thepreliminary data, import and export forecasts suggest a negative effect on the net export onthe GDP growth by around 2-2.5%.
1 MoF’s estimation for the real GDP growth is 4%, based on the strong leading indicators in 2006:18% growth of investment in machinery and equipment, 7.3% nominal growth of wages, 20% higherimports of investment and intermediate goods, credit to enterprises growth of 30% etc.

Strategic_Coherence_Framework_Final_31 07 07 8
Growth of economic activity in 2006 led to a greater commodity trade, whereby export ofgoods grew by 17.5%, and import grew by around 16.5%. Such trends resulted in anincrease of trade deficit by 14% compared to the last year. Such situation was largelyinitiated by the significant rise of oil price on the world stock markets, i.e. the share of oil inthe trade deficit is approximately 51%.
Greater export activity and high inflow of private transfers in the previous period led toreduced current account deficit and pressures for appreciation of the denar exchange ratethat existed on the foreign exchange market. To the end of maintaining the stability of thenominal denar exchange rate to the Euro, during the observed period, there was a surplusof foreign currency on the foreign exchange market through foreign exchange transactionsof the National Bank of the Republic of Macedonia.
The real effective exchange rate is an important indicator of the competitiveness of thedomestic economy. In the period 2001-2006, real effective exchange rate was relativelystable, pointing a maintained price competitiveness of national exporters on the foreignmarkets and external sustainability. It was mainly a result of the lower process in thedomestic economy in relation to the countries that are the biggest trade partners, wherebyits level in 2006 was almost unchanged compared to 2005. External competitivenessrelative to the countries that are the largest trade partners from the Euro zone (thecalculation included 8 countries) was also relatively stable. However, in 2006 REERappreciated by around 1% for the higher inflation in Macedonia compared to the Euro area.
Achievements in the real sector and intensification of the economic activity had a respectivepositive reflection in the social sector as well, i.e. on the labour market. Thus, in the fourthquarter in 2006, employment rate increased by 1.2% in relation to the same quarter lastyear, while the unemployment rate dropped by 0.6 percentage points. Still, taking intoaccount the high unemployment in the Republic of Macedonia (35.9% in the fourth quarterin 2006), higher GDP growth rates, mainly through micro policies, as well as intensificationof the active labour market policies are required to improve the unemployment situation.
Considering the fact that the main reason for the lower economic growth of the Macedonianeconomy when compared with other transition economies is the structural imbalance's ofthe economy and the institutions, in 2006, the GoRM presented ambitious economicprogram of structural reforms with final objective of acceleration of the economic growth andthe process of EU integration, as well as the improvement of the living standard of thepeople of Macedonia.
The ambitious economic programme of the GoRM, as well as the programme onaccelerating implementation of structural reforms has already shown positive economicresults. The reforms in the area of entry and exit from the market (in order to createconditions for competitive business ambience), the judicial reforms, the labour market, thereforms in the education and health have already created conditions for better life of thecitizens of the Republic of Macedonia.
In fact, the macroeconomic performance of the Macedonian economy at the beginning of2007 has finally shown that the country can economically grow with high growth rate, as wellas the more prosperous transition countries. According to the official data of the StateStatistics Office, gross domestic product grew by 7% in the first quarter of 2007, being thehighest growth in the last 15 years. What is especially important is the fact that such growthwas supported by low and stable inflation of 0.8%, strong growth of the export by around50%, industrial production growth, strong investment activity arising by both domestic andforeign investors, downward trend of the interest rates and converging to those of the EUmember countries, as well as increasing foreign exchange reserves.
On the expenditure side, the growth was encouraged by the personal consumption, theexport and the investments in the beginning of 2007. In fact, the real sector growth alsoinfluenced the increase of salaries in the Republic of Macedonia, whereby nominal salariesincreased by 6.4% in the first four months of 2007 (by 5.6% in real terms). The remarkable

Strategic_Coherence_Framework_Final_31 07 07 9
reduction of the percentage of the population which had not received personal income forthe last month (It amounted to 12.8% in April, 2007) was also important, thus contributingsignificantly to the consumption growth. The increase at the personal consumption was alsoencouraged by the growth of crediting to the population, which amounted to 46% in the firstfive months of 2007.
Strong investment activity was noticed at the beginning of 2007, whereby the growth ofinvestments in machines and equipment amounted to 11% in the first quarter of 2007, thegrowth of the import of investment and intermediate products amounted to 48%, while in linewith the National Bank of the Republic of Macedonia data, the growth of the long-termcredits of the enterprises (those that refer mainly to investment activity) amounted to 44%.The active promotion of the Republic of Macedonia as an investment destination hasalready shown results, whereby the investment of the eminent French Bank was the mostsignificant investment in 2007, thus continuing to strengthen the banking sector in theRepublic of Macedonia. In addition to all this, other important foreign investments werenoticed in the insurance industry (Vardar Insurance, Tabak Insurance), the IT industry (ON-NET), Telecommunications - Mobilcom Austria, the automobile industry - Jonson Controls,Food Industry - SWEDMILK etc.
Proof of the acceleration of the economic activity in 2007 was the high growth of the volumeof the foreign trade. In fact, export of goods and services grew by 51.5% in the periodJanuary-May 2007, with a simultaneous increase of the import by around 31.7%,contributing to the reduction of the deficit in the trade with abroad in real terms (in nominalterms, the deficit grew by only $ 6 million). Stable level of private transfers at the beginningof 2007 showed that the current account deficit would not exceed the expected 2% to 3% ofGDP.
Positive trends in the external sector have their positive influence in on the foreign exchangereserves as well. The foreign exchange reserves amounted to EUR 1.4 billion at the end ofJune 2007, being a small increase compared to the end of 2006. Thereby, the level offoreign exchange reserves was lower than the expected one due to the activities of theMinistry of Finance for early repayment of the external debt (EUR 77 million for earlyrepayment to the Paris Club, as well as EUR 103 million for early repayment of the creditsfrom the World Bank and the European Investment Bank).
Such positive trends did not have the expected strong positive influence on the inflation rate.In fact, the costs of living grew modestly by 0.9% in the first half of 2007, thus pointing out tothe fact that the inflation rate was supported not only by the increased demand, but also bythe increased supply (supply side driven), in line with the increased real growth of theproduction.
Low and stable inflation was also supported by growth of industry productivity, whichamounted to 15% in the first quarter of 2007 (productivity growth amounted to 5% in 2006).
2.2. Socio-economic analysis
Geographical location of the countryMacedonia is a small country, with 25,713 sq. km. and a population of about 2 million. It isalso a landlocked country, located in the heart of the Balkan Peninsula, bordering one EUmember state in the South - Greece with a mainland border 246 km long, one EU memberstate in the East - Bulgaria with border 165 km long, Serbia (including Kosovo) in the North(232 km) and Albania in the west (151 km). Half of the territory, 49% is agricultural land,while forests account for additional 37% of the territory. According to Census of population,households and dwellings in the Republic of Macedonia, 2002, total population of theRepublic of Macedonia according the ethnic affiliation is following: Macedonians 64.18%;

Strategic_Coherence_Framework_Final_31 07 07 10
Albanians 25.17%; Turks 3.85%; Roma 2.66; Serbs 1.78%; Bosniaks 0.84%; Vlachs 0.48%;and other 1.04%.
Transport infrastructureRepublic of Macedonia is geographically situated at the intersection of the Pan–Europeancorridors VIII and X. A more developed transport sector would facilitate goods and labourmobility; increase competitiveness of the Macedonian economy and its economic growth;create jobs and intensify the integration of the RM into the EU.
However, with some exceptions, the transport infrastructure and infrastructure policies in theRepublic of Macedonia are not in full compliance with the development needs of theeconomy. In other words, the insufficiently developed transport sector and infrastructurecurrently seem to be an impediment for a faster overall development of the country.
The country’s basic road network is composed of over 13,278 km of roads, including 209 kmof motorways, 906 km of national roads (548 km are “E” designated roads), 8,566 km oflocal roads and 3,806 km regional roads. The backbone of the country’s road network isrepresented by the two Pan-European corridors VIII and X identified as major trans-nationalaxes by the European Commission (High Level Group)2. The effective use of these corridorsis strongly dependent on the construction of the parts that have not been finished yet, aswell as on the development and maintenance of the regional network.
The Pan-European Corridor X is the most important element of the core transport network,linking countries from Turkey and Greece through Bulgaria, Macedonia, Serbia, Croatia andSlovenia to Austria. The present average annual daily traffic of 15,000 is set to increase at6% per annum to over 20,000 and to 40,000 by 2020. The E-75 is mostly four lanemotorway, tolled in Croatia, Serbia and Macedonia. A high proportion (25%) of it is regionalor international3.
Concerning the construction of road infrastructure along the corridor X, of the 172 km longpan-European Corridor X passing through Macedonia in the North – South direction, 70.1%has been already constructed at modern highway standards with the remaining 29.9% beingready for construction. The latter include the Demir Kapija-Udovo-Smokvica and Kumanovo-Tabanovce sections of the corridor.
The railway line along the Pan-European Corridor X is 215 km long and starts from theborder crossing Tabanovce in the north and ends in the south with the border crossingGevegelija, including the branch Xd of the Corridor X that starts in Veles and ends at theborder crossing Kremenica by Bitola. The railway connection, along the Corridor X providesfor speed of 100 km/h, and at some points the speed is drastically limited. Taking intoconsideration that large proportion of the transport is performed on the Corridor X, specialpriority is given to the increase of speed on certain sections to 130 km/h and to improve thelevel of infrastructure, with an aim to achieve technical conditions on a level of a Corridor,supported by the initiative SEECP- South-East European Cooperation Process.
The Pan-European Corridor VIII spans over the South Eastern European area wheretransport infrastructure is traditionally weak. It is connecting the Adriatic with the Black Seathrough Italy, Albania, Macedonia and Bulgaria linking Greece and Turkey.
From an economic point of view, with the trans-European networks the EuropeanCommission aims at enhanced access to EU countries, and increased mobility ofpeople/goods, following the single market objectives and the principles of sustainablemobility. From a transport point of view, Corridor VIII is a multi-modal transport system alongthe East-West axis comprising of sea and river ports, airports, multi-modal ports, roads andrailways, with a total extension of 1270 kilometres of railways and 960 kilometres of roads.
2 Report from the High Level Group Networks for Peace and Development, November 2005.3 SEETO Five Year Multi-annual Plan 2006-2010, May 2006.
Strategic_Coherence_Framework_Final_31 07 07 11
The Pan-European Corridor VIII is passing through the territory of Macedonia from East toWest with a total length of 304 km. Concerning the road infrastructure along the CorridorVIII only 27.6% of the total is already built at modern highway standards with another 8.7%being currently under construction (The Skopje Bypass).
The railway line along the Pan-European Corridor VIII is in total length of 315km, whereasonly 50% of the railway line has been constructed so far. At the moment, the country doesnot have railway links with the two neighbouring countries Republic of Albania and Republicof Bulgaria. The Eastern part of the corridor VIII towards Republic of Bulgaria requiresanother 89 km to be built (29 % of the total), while on its Western section towards Republicof Albania another 66 km need to be constructed (21 % of the total).
Insufficient road infrastructure quality contrasts sharply with the relatively high importance ofthis mode of transportation in the Republic of Macedonia. In particular, road transportationaccounts for by far the largest share of total transportation of goods and passengers in thecountry. Within the total road transport of the goods, internal transport participates with adominant share while the rest is distributed between international transport and transit. Withreference to passengers transport, road transportation is even more dominant, as only anegligible percent of all national passengers travels are by railways. One of the prioritiesforeseen for the future is also the development of a multimodal terminal for connecting thedifferent transport modes.
Development of the Core Regional Transport Network of South-East Europe is considered tobe one of the most important policies for bringing economic prosperity to South-East Europe.This has been acknowledged by signing the Memorandum of Understanding (MoU) for themain Regional Transport Network of South-East Europe in June 2004.The MoU was signedby Albania, Bosnia and Herzegovina, Croatia, Macedonia, Serbia, Montenegro,Kosovo/UNMIK (UNSCR 1244) and the European Commission. The aim of the MoU is tocooperate on the development of the main and ancillary infrastructure on the multimodalSouth East Europe Core Regional Transport Network and to enhance policies in this areawhich facilitate such development. The development of the Network should includemaintenance, reconstruction, rehabilitation, upgrading and new construction of main andancillary infrastructure as well as its operation and use with a view to fostering the mostefficient and environmentally friendly transport modes on a regional scale.
The Core Network has been defined to include road, rail and inland waterway links in theseven SEE entities, together with a number of designated seaport, river port and airportnodes. The main international links include three road and rail arteries (Pan-EuropeanCorridors) plus one international waterway (the Danube), all of which connect with otherEuropean countries in each direction. These are defined as Corridors in the SEETOnetwork. In addition, seven regional road arteries and six regional rail arteries have beenincluded in the network, defined as Routes. The Core Network also includes seven seaports,two river ports and eleven airports.
In order to strengthen the development of the Core Regional Transport Network, IPAinterventions will be concentrated on the Pan European Corridors crossing through theterritory of Republic of Macedonia.
Environment infrastructureDuring the period of the 1980s and 1990s, the Republic of Macedonia has made someimportant progress in the environmental protection. The most significant achievementsinclude:
• improvement and enlargement of water supply systems in urban areas, connectionof rural settlements to regional water supply systems and construction of local watersupply systems;
Strategic_Coherence_Framework_Final_31 07 07 12
• construction and extension of waste water collection systems in urban areas andconstruction of sewerage networks in rural areas;
• construction of waste water collection and treatment facilities in the areas of threeprotected natural lakes, Ohrid, Prespa and Dojran; and
• establishment of an organised municipal waste collection in most urban areas.
These positive developments with respect to the provision of environmental services areresult of a high priority and importance the authorities have given to this subject. However,an impediment to a further improvement in some areas of environmental infrastructure is theunclear division of responsibilities for the environmental policies. In particular, thecompetences for the development of the sector are shared (overlapped) among several lineministries. Considerable investment is needed to improve environmental managementinfrastructure (wastewater, solid waste, rehabilitation of industrially contaminated sites etc.).In addition, investments in Ministry of Environment & Physical Planning staff in order toimprove their quantity and quality.
The water connection rate in the municipalities, range from 82 to 100%. The available dataindicate average connection rates of about 70%. About 1.2 million inhabitants are connectedto a public water supply system. In rural areas, however, connection rates exhibit a spreadbetween only 10% and up to 100%.
The total length of the sewage collection network in Macedonia is 1,239.1 km. In average,60% of dwellings are connected to a public sewage system, whereas 21% of the dwellingshave septic tanks, and another 12% have only a system of uncontrolled waste waterdischarge. Though, sewerage network cover approximately 65% of the population, whileonly 12.5% is connected to the waste water treatment plants. The only 12.5% is facilitatedby the waste water system. The surface water pollution in the country can be mainlyattributed to the discharge of untreated municipal waste waters.
There is no monitoring of the waste water being discharged by municipal sewage systems,except for those equipped by Waste Water Treatment Plants (WWTP’s) in operation (inOhrid, Prespa, Dojran, Makedonski Brod, etc.). There are WWTP’s which are out ofoperation (e.g. Sveti Nikole) due to high operating costs and inappropriate maintenance.WWTP in Krivogastani is in the final phase of implementation while WWTP in Kumanovostarted with operation in the end of 2006. Construction of WWTP in Gevgelija is expected tostart in near future.
Water supply and waste water services in the Republic of Macedonia are by and largeprovided by public enterprises established by local authorities. Until now, there has been noinvolvement of the private sector in the water supply and waste water services, as well as inthe construction of infrastructure in these areas. Municipal enterprises experience financialproblems because they cannot cover the full cost of operation and maintenance from thecharged tariffs. In particular, level of tariffs and the collection rates are low. In addition, thereis a cross-subsidisation among various activities performed by the utilities, so that goodperformers are “punished”. Given the financial problems, investments of public enterprisesare almost entirely financed by the state budget, infrastructure is poorly maintained andquality of services is inadequate. For example, water losses in some municipalities are highand overpass 50%.
Regular waste collection services are mainly limited to urban areas, providing up to 90%coverage in cities and outskirts. About 70% of the total population in Macedonia receivesregular waste collection services, while the remaining population, mainly from ruralsettlements far from the main collection areas, manage wastes on their own. Regularseparate collection of municipal waste does not exist, except for some separate bulky wastecollection in Skopje. Some recycling activities are undertaken by the informal sector forrecyclables as metals, paper, plastics, car batteries and accumulators, waste oils. Therecovery of the various types of potentially recyclable materials is considered not financially

Strategic_Coherence_Framework_Final_31 07 07 13
viable under prevailing conditions. Scrap metals represent the biggest part of the collectedrecyclables, and are being processed by the steel factory “Makstil” in Skopje. Moreover,there is a well-established network of collectors and/or brokers, as well as a strong andstable market for recovered scrap metals. It could be estimated that scrap metals representalmost 80% of the collected commodities.
Waste collection services are primarily performed by the public utilities providing at thesame time water supply and waste water collection services, and very often also othercommunal services, such as street cleaning, public parks, gardens, and cemeterymaintenance. In 2004, there were 54 municipal dumps used by communal enterprises andthousands of illegal dumpsites created by population not receiving waste collection service.Waste disposal practices do not comply with any technical and/or environmental standards.Most of existing municipal dumpsites are to be closed since the site conditions do not allowtheir upgrading to EU conform landfills under reasonable costs.
The past practices of complex technical documentation preparations, concerning theconstruction of existing waste water treatment facilities have not been properly revised.Moreover, the socio-economic effects from the operation of these facilities have not beenthoroughly assessed. Apart from this, their operation has not been accompanied by properregulation of prices for the service provided by public enterprises. Namely, operators ofthese systems lacked appropriate prior estimates and basis for the service price regulation.Under this component, each planned investment will be preceded by development oftechnical documentation which will include, apart from preliminary solution and feasibilitystudy, socio-economic studies with the relevant estimates of socio-economic implications.Cost-benefit analyses and affordability analyses of the service price and its prior calculationbased on justification of defined levels will be carried out as well, in order to provide futuresustainability and proper operation of environmental infrastructure.
Adoption of the relevant environmental legislation is also an important step towards theimplementation of projects that put in place EU requirements concerning wastewatercollection and treatment, as well as solid waste management. Further more, it providesbasis to overcome deficiencies with respect to overlapping of responsibilities in theenvironmental sector.
With respect to the water sector, draft Law on Waters, aside of introducing the approach ofan integrated water management, provides for a clear division of responsibilities. Law onWaste Management prescribes that public utilities need to be adjusted to the condition set inthe law in the next three years. At the moment, number of ongoing activities is orientedtowards strengthening the capacities of public utilities, as well as their adequateorganization. Requirement for institutional strengthening, adjusting the organizational set-upand efficient performance of public utilities, is ever more becoming a precondition forsuccessful working, as well as receiving state guaranties for possible IFIs loans and donorinvestments.
The focus of number of measures that are to be undertaken is especially on more profitable,commercial and competitive way of public utilities performance, as stipulated in the NationalAction Plan for Decentralisation.
Even though current involvement of the private sector is limited, it should be pointed out thatprivate sector has been expressing great interest in further involvement. Law on WasteManagement allows for participation of the private sector in waste management, while theproposed amendments to the Law on Concessions and Law on Public Utilities will stimulatethe public-private partnerships.
Main sources of air pollution in Macedonia are stationary sources and mobile sources of airpollutants, such as: energy production and transformation, fuels combustion, heat productionfor industry and heating for residential and administrative buildings. As a result of obsoleteequipment and lack of modern technologies, industrial sector is the major air polluter. Themain pressures derive from activities in the metallurgy sector, and the chemical industry.

Strategic_Coherence_Framework_Final_31 07 07 14
By 2000, air emissions decreased, mainly due to the overall transition, which had thegreatest impact on industry. Since then, however, the trend has been slowly reversing,leading to modest, but steady, increases in the level of industrial activity, and mild increasein the emissions of SO2, NOx and dust. Air quality problems are particularly encounteredaround the bigger cities, thus potentially affecting 60% of the total population.
Almost two thirds of the total annual SO2 emission derives from the energy combustion andtransformation, while energy generation and mobile sources are the major sources ofemissions of NOx. With regard to dust, individual industrial production processes are themain sources, while road traffic is the major source of CO emissions. Energy generationfrom thermal power plants (REK Bitola covers approximately 75% of the total nationalelectricity demand) and heat production facilities are other sectors, the activities of whichseverely affect the air quality. Level of air emissions from mobile sources depends not onlyon the level of activity, but there is also a direct relation to the quality of fuel used.
Law on Ambient Air Quality4 regulates the adoption of limit values; margins of tolerance;target values; and upper and lower assessment thresholds for individual pollutants asspecified in the EU Framework Directive 96/62/EC. Development of secondary legislation onambient air quality provides for further harmonization with the Framework Directive on AirQuality 96/62/ , and with the related daughter Directives.
With regard to the current situation in the Republic of Macedonia, monitoring of air quality isperformed automatically by means of monitoring stations (13 fixed air quality monitoringstations, one mobile and one traffic pollution monitoring station), and by manual sampling atseveral predefined measuring points. Monitoring stations measure environmentalparameters (carbon monoxide, sulphur dioxide, nitrogen oxides, ozone and PM10 -suspended particles in the air with a size of 10 micrometers), as well as meteorologicalparameters (wind velocity, wind direction, temperature, humidity, pressure, global radiation).Four high volume and six low volume samplers have been installed for the purpose ofanalysing the composition of suspended particles of 10 micrometers, i.e. detecting thepresence of heavy metals in the air. As part of the system, there is a calibration laboratoryused for analysers calibration.
With regard to emissions, Cadastre for Air Emissions and Polluters was prepared for 2004,and it covered around 600 individual sources - companies and around 1000 collective orminor sources of emission from the traffic on the territory of the Republic of Macedonia. Inthe field of emission inventory, CORINAIR (CoR Inventory Air Pollution) methodology hasbeen introduced as national methodology applied on the inventory development.
Main objective in this area is improvement of air quality by reducing emissions of majorpollutants from relevant sectors, while monitoring of both air emissions and air qualityestablishes the basis for undertaking the protection measures. Following future needs havebeen identified, aimed at achieving this objective in line with the requirements of the relevantDirectives: upgrading (extension) of automatic monitoring system; introduction of data qualityassurance and quality control system; maintenance and updating of national Cadastre andRegisters of polluters and polluting substances, as well as institutional strengthening.
In this area, development of National Air Quality Management Plan is confirmed as priority,as well as the Programme for air pollution reduction and ambient air quality improvement.Definition of assessment criteria for ambient air quality and lists of zones andagglomerations are also included among the obligations that have to be implemented in theforthcoming period.
4 The Law establishes grounds for laying down ambient air quality limit values and alert thresholds, emission limit values forexhaust gases and vapours from stationery sources, emission limit values for exhaust gases from mobile sources, andcontents of harmful substances in fuels (Official Gazette of RM No. 67/04)

Strategic_Coherence_Framework_Final_31 07 07 15
Regional competitivenessImproving regional competitiveness is one of the Government’s priorities in the forthcomingperiod aimed at higher growth and capacity building to withstand future competitive pressurein the EU.
Cross-country studies show relatively weak competitiveness of the Macedonian economy.According to the Country National Competitiveness Report for 2006, prepared by theNational Council for Entrepreneurship and Competitiveness, the Global CompetitivenessIndex (Global CI) for the Macedonian economy has improved from 3.84 in 2005 to 3.86 in2006, but the ranking of the country has dropped from 75th to 80th position.
SME s and Business environmentSmall and medium sized enterprises (SME’s) are dominant type of enterprises inMacedonian economy, with a 98.8% share in total number of enterprises in 2005. However,there are 21.1 SME’s per 1000 inhabitants in Macedonia, which compares unfavourably withthe EU – 15 average of 52.8. SME’s are mainly concentrated in retail and wholesale trade.An analysis of the spatial distribution of SME’s activity indicates a lower concentration in theeastern parts of the country.
The importance of the SME sector is mirrored in the employment figures, where in 2005over 75% of the total employment is in SME's. The average size of SME’s in 2005 in termsof employment was 6 persons per SME. The number of active SME’s in the RM has beengrowing steadily over the last 5 years at rates between 3.8% and 7.5% p.a., with an averageannual growth rate of 5.7%. The share of the SME’s sector in the gross value added wasincreasing steadily throughout the years and reached 72.0% in 2004. Given the size of theSME’s sector in Macedonia, and based on international experiences, a further developmentof the SME’s sector is one of the main preconditions for improvement of the regionalcompetitiveness of the country. In this regard, a national SME’s observatory was establishedwith an aim to prepare a SME’s analysis, propose measures to stimulate their developmentand follow on the European Charter on SME’s.
There are no national analyses at company level, but according to the World Bank’sBusiness Environment and Enterprise Performance Survey (BEEPS) conducted in 2002 and2005, large progress has been made in the business environment, especially in the followingareas: macroeconomic stability, reduction of the organised crime, reduction of theuncertainty in the regulatory policy and customs and trade regulation. However, a survey offirms’ perception in 2005 reveals that the largest obstacles for their activity are still thecorruption, court system, non-competitive behaviour, cost of and access to financing, andtransport.
Starting from 2005, there has been a continuous improvement in the business environmentin several areas. First, given the inefficient court system and long-lasting disputes, inDecember 2005 the Parliament approved a series of Constitutional amendments aimed atmaking the judiciary more efficient and reducing the extent of political influence. Second, inorder to ease market entry, reforms have been conducted to reduce time and financialresources to register a business. In this respect, a “one-stop shop” for the registration ofbusinesses came into force in January 2006, significantly reducing the time and moneyneeded to start up a business. Third, market exit was facilitated by the new bankruptcylegislation from March 2006 that streamlined and shortened bankruptcy procedures andreduced their costs. Forth, the new Government started a regulatory reform aimed atsimplifying and minimizing regulatory requirements and burden on businesses. Fifth, giventhe effect of tax system on businesses both from administrative and financial point, startingfrom 2006, the Government has undertaken several measures to improve this system.Towards the end of 2006 the Government started reforms in the area of taxes and socialcontributions to further reduce the burden on enterprises. In particular, it reduced thecorporate tax from 15 to 12% in 2007 and 10% in 2008. A flat personal income tax wasintroduced instead of the previous progressive system with 3 rates (15, 18 and 24%), with a
Strategic_Coherence_Framework_Final_31 07 07 16
reduced rate of 12% in 2007 and 10% in 2008. In the area of social contributions, reforms,agreed with the IMF, already started in terms of harmonisation of basis for calculation ofcontributions, introduction of same minimum contribution base, and establishment of asingle collection point of all social contributions, that is Pension and Disability Fund.
Facing a small domestic market, SME’s in the Republic of Macedonia must increase theirpresence on the international markets as a means to achieve economies of scale andincrease their sales and profitability. Hence, the importance of their competitivenessdepends on a set of regulatory and institutional factors. The National Council forEntrepreneurship and Competitiveness has been established, which is a three-party entitythat facilitates the dialog between the private, public and the civil sector. Within the Councilfive clusters have been established: for lamb and cheese, tourism, IT, wine and textile.
In order to support the entrepreneurship at the regional level, the Agency forEntrepreneurship Support operates through 9 regional centres (electronically connected), 8Incubators, 4 Centres for transfer of technology, 5 Clusters, 77 Offices for local economicdevelopment, as well as chambers and associations. There is also Euro infocorrespondence centre, as well as Fund for Development of Human Resources.
The support to the SME’s sector development is defined in the Programme for Support ofSME’s (2007-2010) which should enhance the efficiency of enterprises and theircompetitiveness. This will be achieved through support of innovations, strengthening of theguarantee fund and issuing of guarantees, support for introducing new technologies,creation of investment funds, expansion of mortgage instruments, program for micro-financing of specific vulnerable groups (women, youth, students, farmers, single parents,handicapped, long-term unemployed).
R&DIn the area of R&D and innovation, with a 4 scientists per 1000 inhabitants and only 0.25 ofGDP in 2004 spend on R&D, Republic of Macedonia fairs internationally relatively poor.R&D expenditures come mainly from the universities, whereas the private sectorparticipation is very low. According to data from the Central Registry, during 2004 only 2small, 21 medium and 31 large enterprises invested in R&D activities in total amount of €1.24 million.
In addition, there is still low level of awareness among businesses about the importance ofscience and technology for their productivity and competitiveness. However, establishmentof a knowledge-based economy and enhancement of regional competitiveness raises aneed to expand and strengthen the innovation capacity, both organisationally and spatially,to make innovation widespread and information technologies and market knowledge directlychannelled to economic agents.
These are the main objectives identified in the Government Programme for Development ofEntrepreneurship, Competitiveness and Innovation of SME’s (2007-2009). They will beachieved through a combined approach of targeted support of investments in innovation andICTs, improvement of management systems, improvement of production processes throughadvanced technologies, greater industry-university cooperation, establishment oftechnologically-industrial development zones, etc. The Programme budget is approximately500,000 EUR and it also envisages establishment of at least one technology park focusingon software production, computer chips and other ICT-related aspects.
ICTs
Macedonia has the highest prices for internet access in the region and, with a 6.2% internetpenetration, holds the second to the last position in the region. Most Macedonian SME’s arenot capable of utilizing ICT for their daily business. In 2006, 92% of enterprises with morethan 10 employees owned computers and 72.3% had internet access. The use of ICT andInternet declines with the size of the firms.

Strategic_Coherence_Framework_Final_31 07 07 17
In 2005, a National Strategy for Information Society Development was prepared with anoverall objective to enable efficient implementation and use of ICT by all entities in theRepublic of Macedonia. This broad objective is expected to be achieved through thecompletion of numerous policies and measures, mainly setting up an institutional frameworkfor an ICT society, raising public awareness for the needs and advantages of the informationsociety advancements, better access to internet for all citizens, etc.
The GoRM has a twofold role in establishment of Information Society. In particular, on thesupply side, the GoRM role is to enhance the development of a fast and cost-effectivecommunications, infrastructure and technologies. On the demand side, the GoRM willimprove its services through development of e-business, e-government, e-education, e-health, and e-citizen.
Regional disparities
In the Republic of Macedonia, according to the NUTS classification there are eight NUTS 3regions (see Map B3 in the Annex) - Pelagonia region, Vardar region, North-East, South-Waste, Skopje region, South-East, Polog region and East region and further into 84municipalities and the City of Skopje.
Analysis of the available disaggregated economic data demonstrates significant disparitiesamong regions, especially if we compare Skopje region with others.
Table 2-2 Regional disparities, 2002
Skopje region with GDP per capita (PPP) of $11.964 is far ahead compared with the othersregions and the average of the country ($6.850). Furthermore, GDP per capita of Skopjeregion is around 50% of the EU average (which is higher than most new EU members). Thesame pattern is present when the other indicators by regions (NUTS 3) are compared.
PopulationEmployed Unemployment
rateGDP
(PPP in $)
GDP perCapita(PPP in
$)
% of country'saverage
Average GDPper capita
growth rate1998-2002
Macedonia
Pelagonia
Vardar
North-East
South-West
Skopje
South-East
Polog
East
2022547
238136
133180
172787
219741
578144
171416
305930
203213
460544
62551
31672
30841
39589
154914
50559
35638
54779
38.1
39.9
43.9
48.7
42.4
30.4
34.4
49.9
34.5
13854081
1644320
744617
611910
921123
6916835
1036996
941066
1037213
6850
6905
5591
3541
4192
11964
6050
3076
5104
100
101
82
52
61
175
88
45
75
5.2
2.4
2.3
-1.0
2.8
8.7
4.1
1.4
1.9
Source: State Statistical Office and UNDP
Figure 2-1 GDP per capita (PPP in $US), 2002
0
2 0 0 0
4 0 0 0
6 0 0 0
8 0 0 0
1 0 0 0 0
1 2 0 0 0
1 4 0 0 0
M
P

Regarding ethnical and regional characteristics of participation (and employmenunemployment), there are no available data from the LFS. Data can be obtained from the2002 Census which, regarding the economic activity of the population, used LFSdefinitions. Participation rate is different regarding the members of different ethnranging from 29.3% Albanians, 38.1% Turks, 47.3% Serbs, 47.6% Romas, 48.3% Vlahs and53.5% Macedonians. Accordingly, the lowest participation rates are found among Albaniansand Turks. Macedonians have the highest participation rate.A4)
There are differences in participation rates across regions where Polog (32.6%), South(41.9%) and NorthTable A5)
EmploymentEmployment rate in Macedonia ha

measures to ease schoolthrough changes in the curriculum, such as introduction of career guidance, involvement oflocal employers and other stakeholders in curriculum design, etc.
Data on employment rates by education show that the lowesthose who have completed lower secondary education or less, whereas highest employmentrate accounts for those who completed tertiary education.
Data from 2002 Census, presented in Table A4, show lowest employment rate of Rpopulation (10.2%), followed by Albanians (11.4%) and Turks (15.9%). Table A5 documentsrelatively large variability in employment rates among NUTS 3 regions.differences in the employment rates for various regions in the country.Census data, employment rate in Polog, Northeast and Southwest regions was 1.5 to 2times lower than the total average employment rate in the country. Only the Southeastregion had higher employment rate compared to the average in th
fixed-term contracts, extending the maximum period for which theto four years. As one of the measures for further flexibility of the labour market, temporaryemployment was introduced in 2006 through the legislation regulating Temporary WorkAgencies (TWAs). In particular, TWAs can provide hefoster flexibility on the labour market. Currently, there are 18 registered TWAs that havesigned 3, 210 work contracts.
UnemploymentIn 2006, unemploymentcompared to 2005), though it was still at an exceptionally high levelwomen was 1.9 percentage points higher than the unemployment rate among men (seeTable A7). As elsewhere, young people are more likely to be unemployed: theirunemployment rate is 1.7 times higher than the national average, imposing the need tofocus active labour market policies (ALMPs) towards young people and/or to adjust their

January 2007 the Government conducted a tax reform (introduction of flat tax with a rate of12% for 2007 and 10% afterwards) and is starting reforms in the area of social contributionsto reduce labour costs and further incof ALMPs is rising with a gradual improvement in their organisation, targeting,implementation and monitoring. Forth, microimprovement of the business climate will evebeginning of 2007, Government adopted an Action plan to fight grey economy. Last, but notleast, establishment of alternative labour dispute resolution mechanisms, and arenegotiation of collective agreements will
Regarding the institutional structure of labour market services provision, EmploymentService Agency (ESA) is primarily responsible for implementation of active and passivelabour market policies.one central unit and 30 local employment centres covering the entire territory of the Republicof Macedonia. It provides services in the labour market according to the requirements of

the first year of primary education. The biggest drop out from the schools is coming from theRoma ethnic community and they have the highest rate of unemployment.
The gross enrolment rate in rural areas is 62.36% and is significantly lower than in urbanareas, 78.52%. There are no data for the educational levels by geographical areas.
Though official data on school dropouts calculated and published by the SSO show very lowdrop-out and repeat rates at primary and secondary education, data on the vertical progressin education for students from one generation presented in Table 2.4 suggest large dropouts after the end of compulsory (primary education) and upper secondary education.
Table 2-4 Vertical progress of the student’s generation 1991/1992

primary and secondary education (though in experimental stage); introduction of an externalevaluation; implementation of common student assessment; improvement of schoolmanagement; introtraining programmes, etc. Currently, there are several ongoing and planned reforms, suchas: introducing of the compulsory secondary education, modernising the educational andtraining system in the 3adult education, improving the access to educational and training system for the ethniccommunities, especially Albanians and Roma population.
The educational attainment level15 and NMS. Only a relatively small proportion of Macedonian adults (14%) attained tertiaryeducation compared with the EU 15 (22%) in 2003, at the same time the share of those withonly low educational attainment (43%) is comparatively high, in particular with regard to theNMS (19%). An additional disadvantage for the Macedonian labour force is the loweducational level of the unemployed. Apart from the fact that unemployed people with only

Informal sector jobs, seasonal work and social assistance are considered as main sourcesof income of Roma population. Data show that from the total number of households in theRepublic of Macedonia that received social afamilies from the Roma community.
The equal representation of citizens from all ethnic communities living in the Republic ofMacedonia in the public administration is addressed by the Ohrid Framework Agreement,according to the proportional rate of participation within total population.
Social expenditures in Macedonia (pensions, health care, social assistance programs andunemployment benefits) represented an equivalent of a 16% of GDP in 2006 and comprisednearly half of the general government spending (see Table 2.6).
Table 2-5 Public social protection expenditures (in mill. denars)

The social care services and measures are focused on minors without parental care up tothe age of 18; persons who untparental care, up to the age of 26; minors with educational and social problems;educationally neglected minors; minors with disabilities; other minors; elderly; intellectuallyand physically chaindividuals, service users.
Institutional social protection is provided in eleven institutions:
1. Institution for young children without parents and parental care aged 0Bitola (the capacity of the institution is 120 children, and its main activity is careprotection, nourishment and stimulations of children without parents with specialemphasis of the methods for empowering the development of intellectual potentialsof children)
2. Institution for children without parents and parental care aged 3
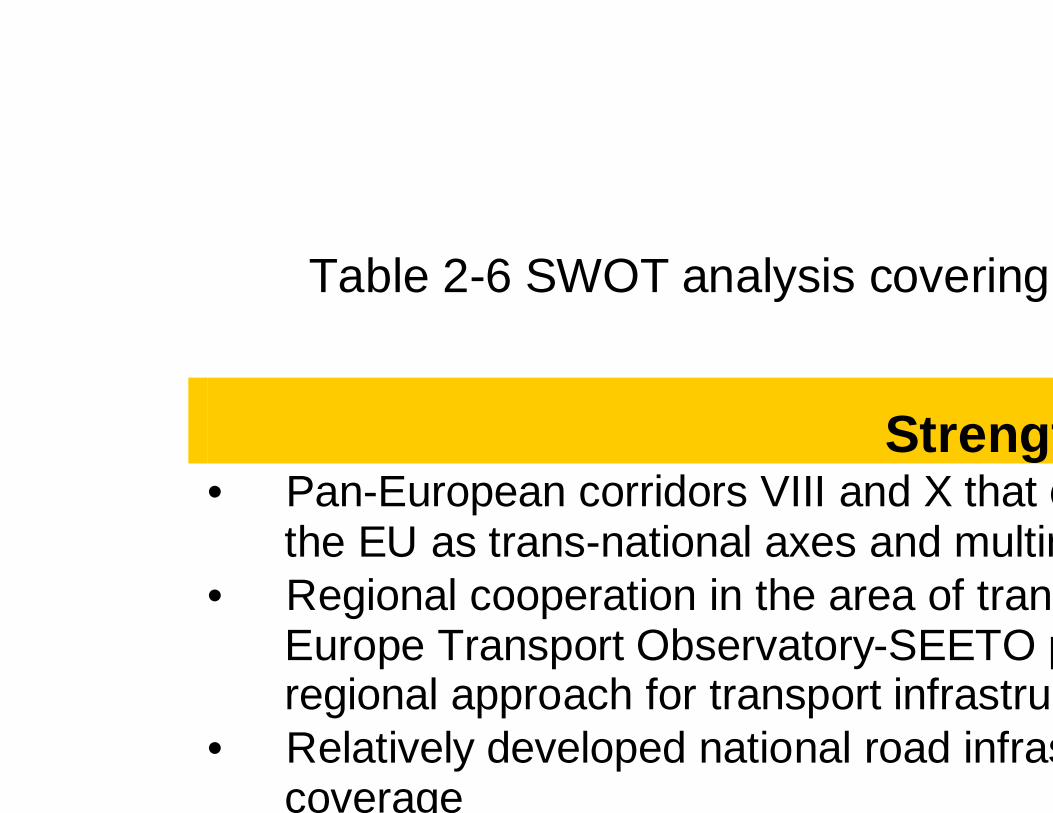
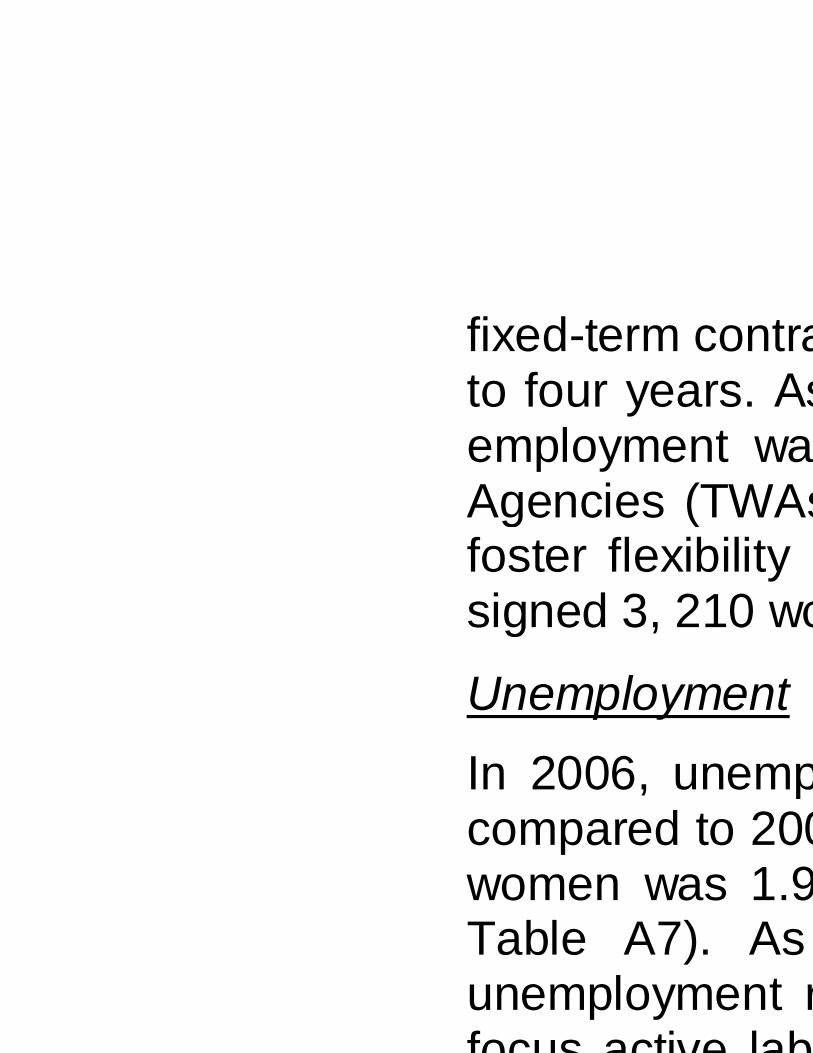
Table 2-6 SWOT analysis covering Regional Development component
Strengths• Pan-European corridors VIII and X that cross th
the EU as trans-national axes and multimodal directions• Regional cooperation in the area of transport (Established South East
Europe Transport Observatory-SEETO providing project development andregional approach for transport infrastructure development)
• Relatively developed national road infrastructure in terms of a country’scoverage

Opportunities• Geographical proximity to the major EU markets• Proximity to Adriatic and Mediterranean seas• Geographical location favourable for transit of goods, services, and
energy resources within the regional framework• Availability of the IPA funds as an EU accession candidate country
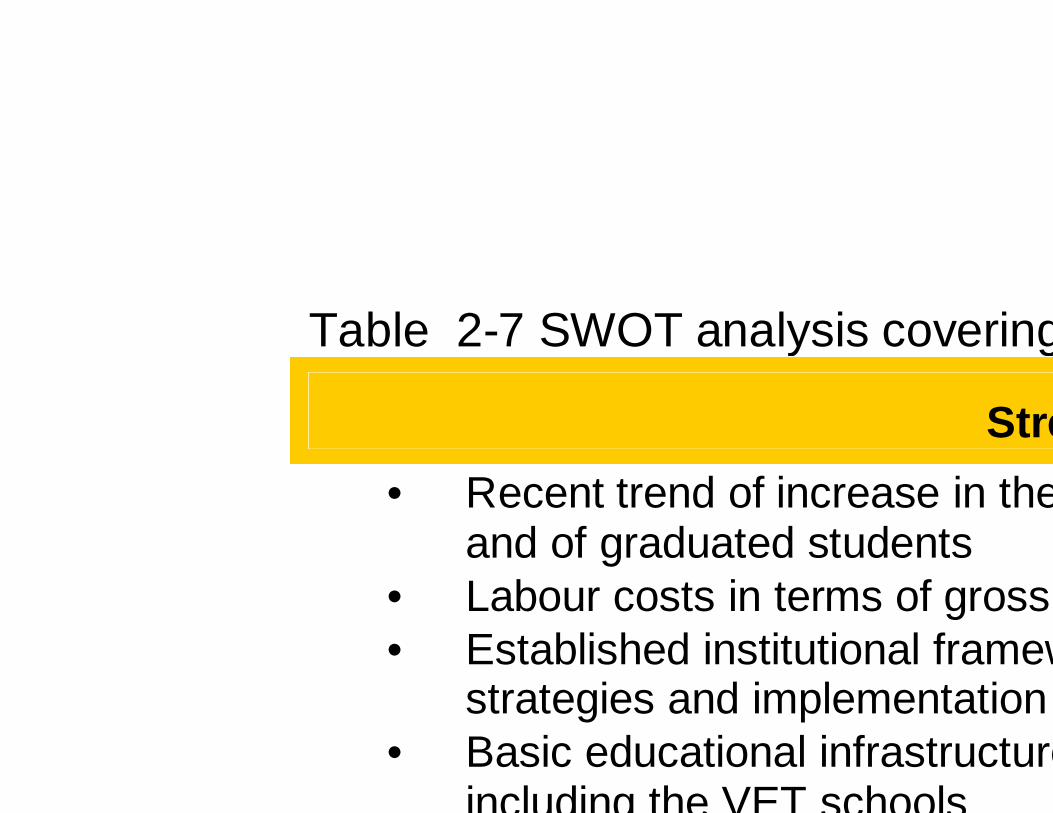
Table 2-7 SWOT analysis covering Human Resources Development component
Strengths• Recent trend of increase in the share of young people in education
and of graduated students• Labour costs in terms of gross wage among the lowest in Europe• Established institutional framework that supports employment
strategies and implementation of policies• Basic educational infrastructure in place in most parts of the country,
including the VET schools

Opportunities• EU accession process• Labour force potential which can be mobilised• Modernised educational system that will provide well educated and highly
productive workforce with a positive effect on the country’s competitiveness• Reinforce the State Education Inspectorate to address non
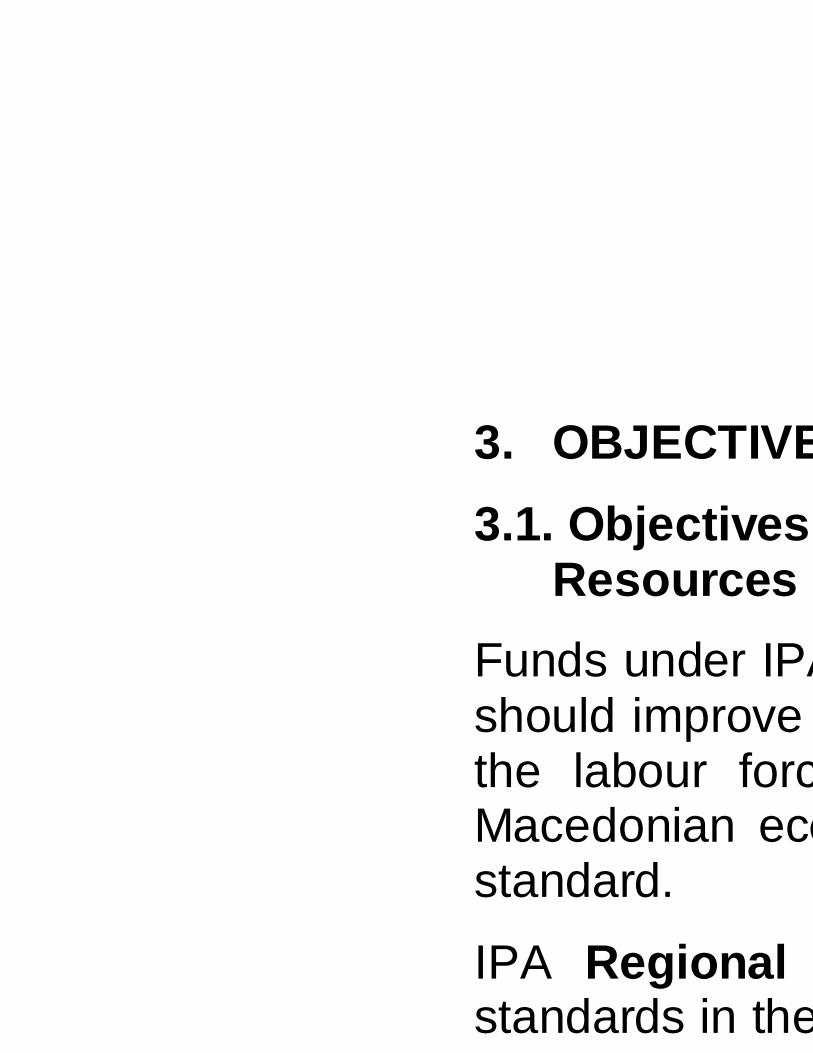
3. OBJECTIVES AND CONSI3.1. Objectives to be pursued under IPA Regional Development and Human
Resources Development compoFunds under IPA Regional Development and Human Resources Development componentsshould improve the basic economic infrastructure and upgrade the skills and knowledge ofthe labour force. Eventually, this will strengthen productivity and competitiveneMacedonian economy contributing to a higher GDP growth and raise income and livingstandard.
IPA Regional Developmentstandards in the Macedonian economy through development of a reliable and cinfrastructure services in the area of transport, environment, business infrastructure, as well

labour market functioning and employment possibilities, especially for vulnerable groups(young persons, older workers, females, minorities and longspeeding the transition of the grey economy employment into the formal sector.
Competitiveness of firms in today’s era of knowledgequality and quantity of country’s human capital. In this regard, education subshould improve quality of the Macedonian education system ensuring, on the longgreater educational attainment of Macedonian citizens. In addition, education systemreforms should increase responsiveness of this system to the labour market needs,demands and changes. Education and training systems should enhance the learning ofentrepreneurship an
Main objective in the area of social inclusion subefficiency of the social system, including policy and institutions, in terms of fast integration ofdisadvantaged persons in the society (and labour market) and reduction of poverty. It

The overall and specific objectives of the SCF 2007of common political aims laid down in the Community Strategic Guidelines for Cohesion2007-2013 and are in line wi
• Expanding and improving transport infrastructures giving priority to projects ofEuropean interest:
- Better access to rail infrastructure
- Improving connectivity (TENs)
- Promoting environmentally sustainable trans
• Improving the environmental contribution to growth and jobs by:
- Investment in infrastructure to comply with environmental legislation (especiallyin new Member States)

Human Resource Development should improve current sociothrough systematic actions and pilot projects in the area of employment, education andsocial inclusion. Employment initiatives shall contribute to further development ofemployment services, supporting employment strategy implementationlabour market situation particularly for vulnerable groups. Activities related to education aimto modernise education and training systems and improve access to education for ethniccommunities. In the field of social inclusion, assistanof disadvantaged people and enhancing the participation of civil society. In this area, theMIPD indicates following priorities:
• Attracting and retaining more people in employment and reducing unemployment
• Investing in human capital through better education and training
• Promoting an inclusive labour market.
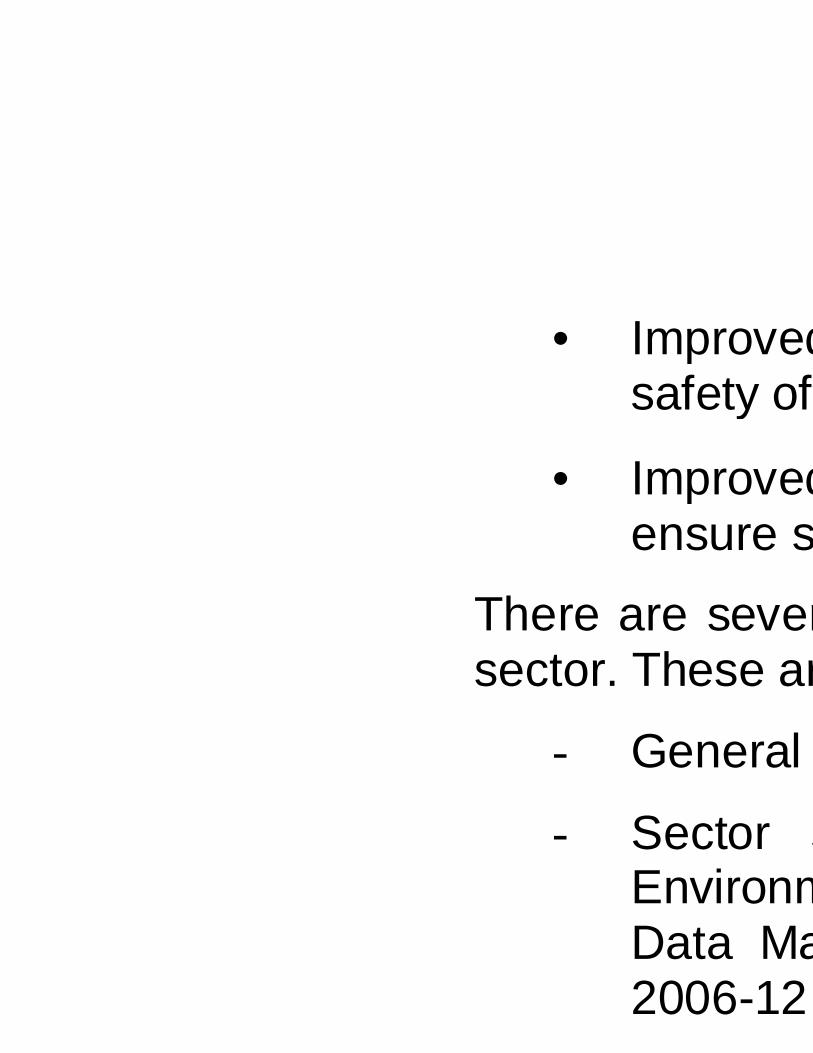
• Improved safety of journeys by reducing accidents and enhancing the psafety of pedestrians, cyclists, drivers, passengers and staff; and
• Improved integration by making journey planning and ticketing easier and working toensure smooth connection between different forms of transport.
There are several national stratesector. These are:
- General national documents
- Sector specific documentsEnvironmental Plan (2006), EnvironmenData Management Strategy (2006), National Plan for Solid Waste Management2006-12 (to be adopted), etc.
The NDP 2007-

These reforms should lead to a switch from laboura high value added ma
High unemployment points to an underutilisation of human capital in Macedonia, hinderingits economic growth. Hence, main priorities in the area of employment and labour marketare to stimulate job creation, reduce rigidities and administrative barriers in the labourmarket, and improve efficiency of the main labour market institutions, mainly theEmployment Service Agency (ESA) and its regional centres. These priorities are alsodefined in the National Employment Strategy (NES)Action Plan for Employment (NAPE)strategic documents is stimulating job creation, reducing unemployment and poverty.
The NES 2010 contains the mediumMacedonia. It comprises the main labour market challenges for the period up to 2010 anddefines national targets and specific employment policies that will ensure achievement of
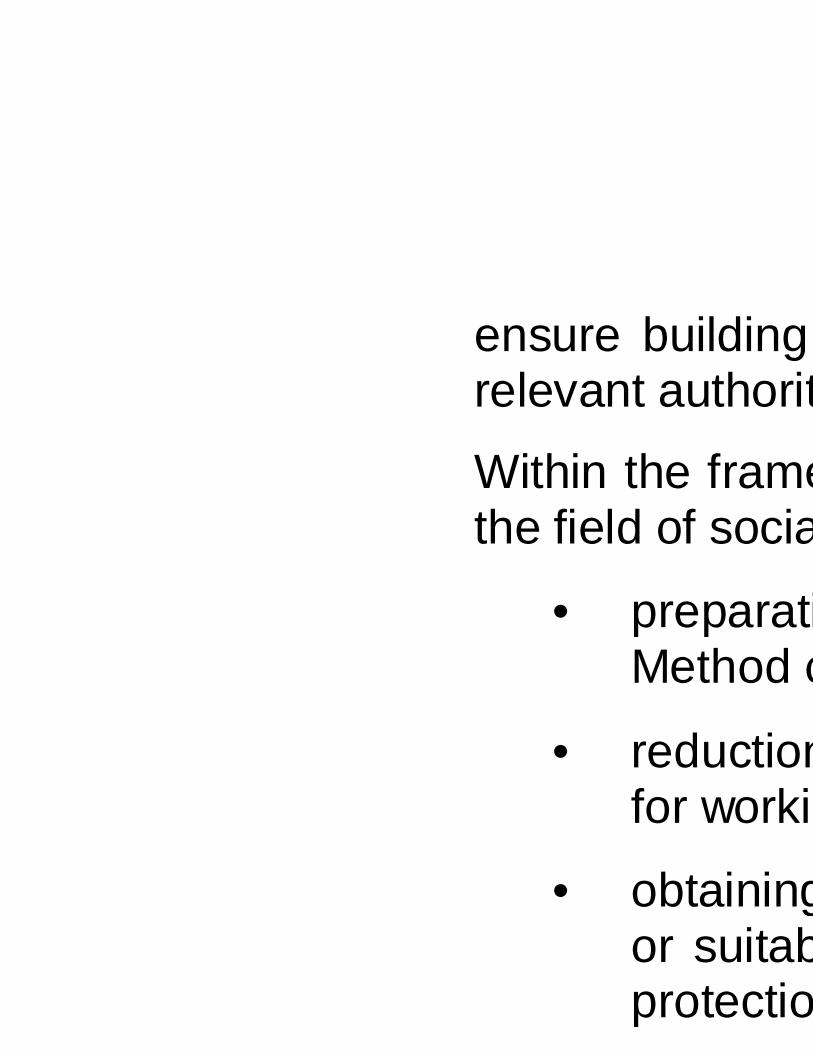
ensure building up the capacities for taking ownership of social inclusion policies by therelevant authorities and involving all relevan
Within the framework of the NPAA, the following priorities of the Republic of Macedonia inthe field of social inclusion are envisaged:
• preparation of the Republic of Macedonia for a complete participation in theMethod of Coordinatio
• reduction offor working with the victims of the domestic violence;
• obtaining the right of the child to live and to be taken care off in the biological familyor suitably alternatively sheltered, through providing the suitable outprotection;
•

4. OPERATIONAL PROGR(STRATEGIC PRIORITIEThe Strategic Coherence Framework sets out the strategy that underpins the OperationalProgrammes for regional and human resourcefinanced by the Instrument for Pre
4.1. Regional development MultiIn the period 2007single Operational programme (OP) which will focus on transport and environmentinfrastructure. ThoughMIPD 2007-2009 does not foresee EU’s preperiod. Afterwards, for the period 2010transport, environment and regional competitiveness respectively.
infrastructure that shall be established under the IPA assistance, within the OP, will ensurelong-term sustainability of the eresources.
Republic of Macedonia will have to comply with the requirements of Council Directive91/271/EEC on urban waste water treatment both for all categories of agglomerations with apopulation equivalent (PE) above 10,000 and for agglomerations with PE between 2,000and 10,000. Following the directive, priorityfocused on agglomerations with over 10,000 (PE) with an emphasis to agglomerationsover 100,000 inhabitants which are at most importance. For waste management, severalpossible regions are specified.
The following priority axis are specified within the Regional Development OperationalProgramme for the programming period 2007
Priority axis 1:

• To reduce pollution by untreated waste water by establishment of waste watercollection and treatment system meeting the EU requirements;
• To increase share of population cby waste water treatment of requisite parameters on effluent;
• To avoid further deterioration of the environment by uncontrolled waste managementthrough creation of conditions for sound solid waste collection
• To reduce the volume of communal solid waste disposed to landfills and increasethe share of waste separated, composed and recycled; and
• To increase population served by waste collection and disposal in compliance withthe EU standards.
Priority axis 4: Technical Assistance

According to the priorities in this area identified in section 3.3, following results should beachieved through Human Resources Component OP:
- Enhancement of employability, social inclusion and human capital of people whobenefit from interventions, specifically the following groups: young, elderly, women,long-term unemployed, persons with disabilities and minorities.
- Strengthening the capacity ofareas of employment, social inclusion and education and training in terms of policydesign, implementation, monitoring and evaluation.
Priority axis 1: EmploymentThe aim is to modernise and improve services delivered by the Employment Service Agency(ESA) and develop and implement better active approaches for addressing the labourmarket malfunctioning.
• Fostering of a programme for literacy and the fulfilment of elementary education forexcluded persons.
Priority axis 3:This priority axis should optimise the effect of social protection by training profvolunteers involved in social inclusion, as well as through enhanced linkages between allpartners. In addition, this priority axis will aim at strengthening the capacity of civil society toprovide (quality) social assistance to targeted groinstitutional set for provision of care to the particular vulnerable groups.
Objectives:
• To improve the efficiency of social services in respect of promoting social inclusionof vulnerable groups by training prosecurity and social services;

5. INDICATIVE BREAUNDERLYING OPERATIONACCORDANCE WITH MIFF
5.1. Regional Development Operational Programme
Financial breakdown of projects that will be financed under RegionaOperational Programme 2007allocation of funds under Regional Development component. Compatible with article 149 ofCouncil Regulations 1085/2006, this table represents amount assigned foRegional Development Operational Programme. The projects will be cobudget. As regards the Regional Development component, without prejudice of the financialallocations to be proposed in future MIPDs and MIFFs, the inoperational programmes during the period 2010
6. KEY ELEMENTS OF IMPL
6.1. Sectoral and geographical coordination and partnership arrangements
In order to ensure greater impact on the objectives defined in this SCF, IPA and nafunds will be concentrated on a carefully selected sectors and geographical areas. In otherwords, the appropriate geographic and sectoral concentration should maximise the impact ofIPA, allowing for complementarities and synergies of programme comencourage development of a coherent development policy addressing regional disparities,one of the principal challenges to Macedonia's socio
In parallel with the programming process, the country is preparing itsmanagement of EU funds by EC. In this respect, GoRM is establishing the system fordecentralised implementation of EU funds, and is undertaking the necessary activities and

Stakeholders in environment sector that were involved in preparation of the SCF 2007are the Ministry of Environment and Physical Planning, Association of Units of LocalGovernments and rworkshops and their comments were taken into account.
Partnership and consultation in the area of employment and social policy is ensured throughthe Economic-Social Council. Members of the CPolicy, the Minister of Finance and the Minister of Economy, employers and employeesrepresentatives and representatives from the Association of Units of LocalGovernments and is chaired by the Minister ofthat are involved in this area were consulted, in particular UNDP which assists the GoRM inimplementation of active labour market policies.
In the area of education, objectives and measures were defined in consustakeholders. This was achieved through school boards and councils in which there are
life and work in urban centres, connections centrethemselves. Furthermore, it will stimulate interrealisation of investment projects in local infrastructure.
The resources under Regional Development and Human Resources Developmentcomponents will be utilised, first and foremost, to introduce into the national framework foreconomic and employment development theguiding the implementation of EU structural instruments.complementarity between interventions under components III andconsideration, both at strategic level and at the level of implementation of the twocomponents. At the strategic level, there is no evidence of overlapconsidered and other interventions in the country and/or other donors' interventions,particularly Member States, as well as of contradictions between the different leobjectives of the Operating Programmes that might affect the foreseen outcomes.

section Smokvica Gevgelija, being part of Corridor X. The project is expected to becompleted during 2008.
Future cooperation with the European Investment Bank (EIB) will be aimed at roadinfrastructure, in particular Corridor sections (Demir Kapijaof co-financing through a loan. EIB has also expressed readiness, together with EBRD, toextend co-financing loan for modernisation of the Airport Alexander the Great, dethe model of modernisation to be determined by the Government and the financing needs.
EBRD will become more active in the Macedonian public sector after 2008. The Bankconsiders the possibility to coroad project, to cover rehabilitation of certain sections of the Panassessed as economically justifiable.
Within employment and labour market developmentsTechnical assistance for inst

children with psychic and physical constraints in their development in order to strengthen theconcepts and care services for this category of vulnerable groups.
USA through itsquality education at all levels. USAID is focusing on increasing teaching capacity in thebusiness administration and computer science and technology faculties in the South EastEuropean University (SEEU). Another focus of USAIDstudents into creative and critical thinkers and works with prefuture teachers start their jobs prepared with student
UNDP provides assistance for Promoting aand for Sustainable Development, Environmental Protection and Management of NaturalResources. UNDP intervenes in increasing the current low level of capital utilization and thelarge pool of unemployed.Employment Mediation for Highly Educated Young Unemployed
Foreign Assistance.In the past it proved to be rather difficult to obtain a clear and comprehensive picture of alldonors' activities in the countryNonetheless, coordination has improved with initiatives taken by the beneficiary and thelarge stakeholders, including the Commission and the EAR, to enhance the exchange ofinformation. The past EU proauthorities and other international agencies to ensure that the activities closelycorresponded to the needs of the country. Together with the Secretariat for EuropeanAffairs, the Commission anan intensive dialogue also with the EU member states and other multilateral and bilateraldonors. Furthermore, the European Commission together with the World Bank have set up aJoint Office for South East Europeinternational assistance for the reconstruction and development of the country. In theframework of established

between IPA and othmechanisms through:
• Capacities for monitoring, analysis and policy support, in particular:
- data quality on foreign assistance, improved, analysed and widely disseminatedin a coordinated mann
- priority needs, as a basis for programming the foreign assistance, identified andformulated (analysis of the priority areas for donor assistance; gaps analysis);
- mechanism for monitoring and evaluation in place (establishing thematic workinggroups limonitoring purposes of the IPA funded projects);
• Coordination activitiesprojects identified and communicated with donors (organis

contribute to implementation of EU standards by supporting infrastructure investments in theenvironmental sector that will enhance the sustainabwhole.
As regards social policy, employment and education,strengthening the capacities in central and local state institutions, especially to the labourinspectorates, and to the supportinclusion. This is fully consistent with the Component IV objective of preparing theadministration for management, implementation, monitoring, audit and control of ESFmeasures at both national and
IPA Component I will also provideensuring smooth programming and the maintenance of high quality in delivering IPA funds.This type of assistance will allowmanner by support the preparation and early implementation of activities under the five IPA
The Priority axis 3, that isof life in rural areasoff-farm) economic activities in rural areas. Similaup economic activities, creating additional
However, a lack of basic transport and environment infrastructures and servicesidentified as the main problems in aagriculture production sectorand environment planned in this SCF and the OP for the Component III.development is also challenprojects financed through IPA under Component III.
Development of the rural economyand the provision of transport infrastructure. Qualityprovision and quality of public services, health and education, public infrastructure as water

7. ANNEXES
7.1. Tables
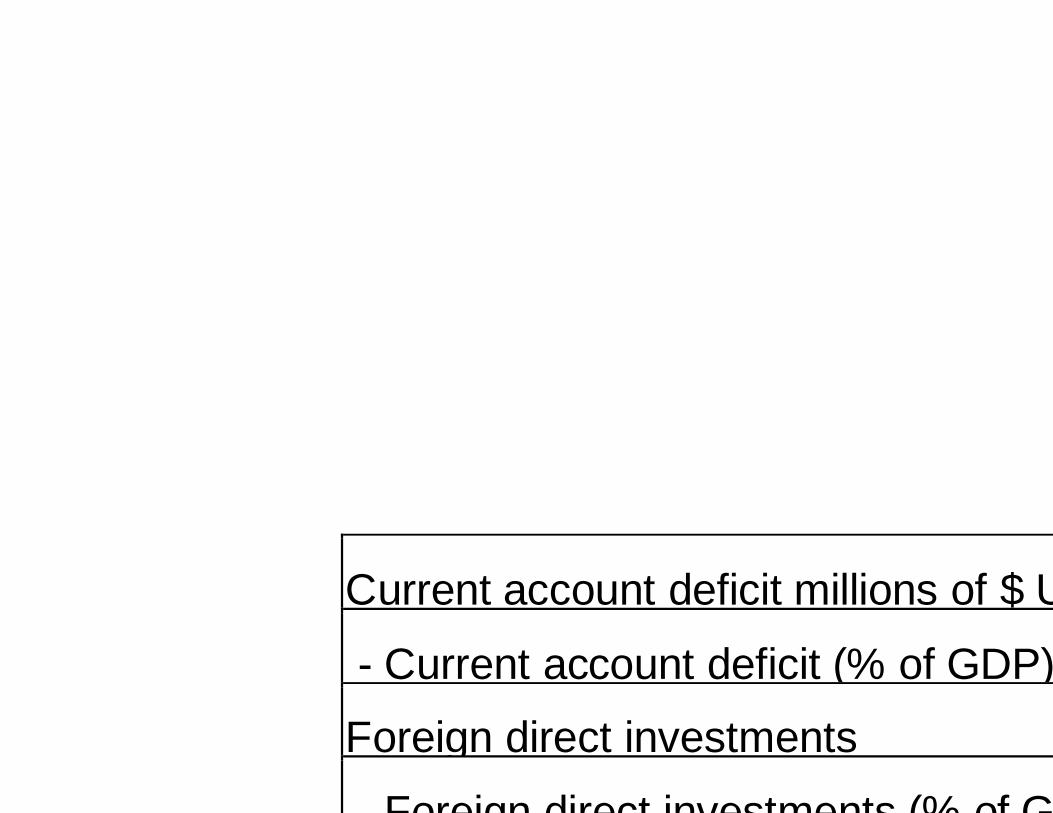
Current account deficit millions of $ US
- Current account deficit (% of GDP)
Foreign direct investments
- Foreign direct investments (% of GDP)
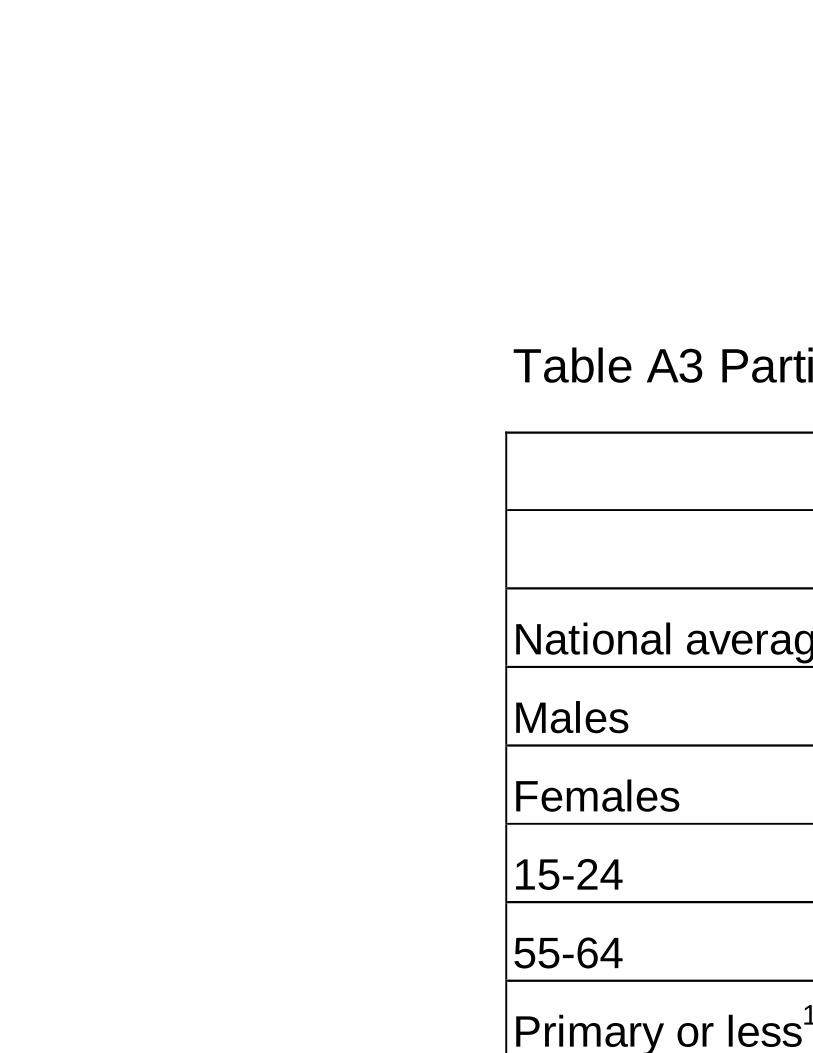
Table A3 Participation and employment rates by different characteristics, 2003
National average
Males
Females
15-24
55-64
Primary or less1

Table A6 Employed by economic status and ownership in % of total, 15
Employed
Employer
Self – employed
Unpaid family workers
Private ownership
Source: LFS, various years.
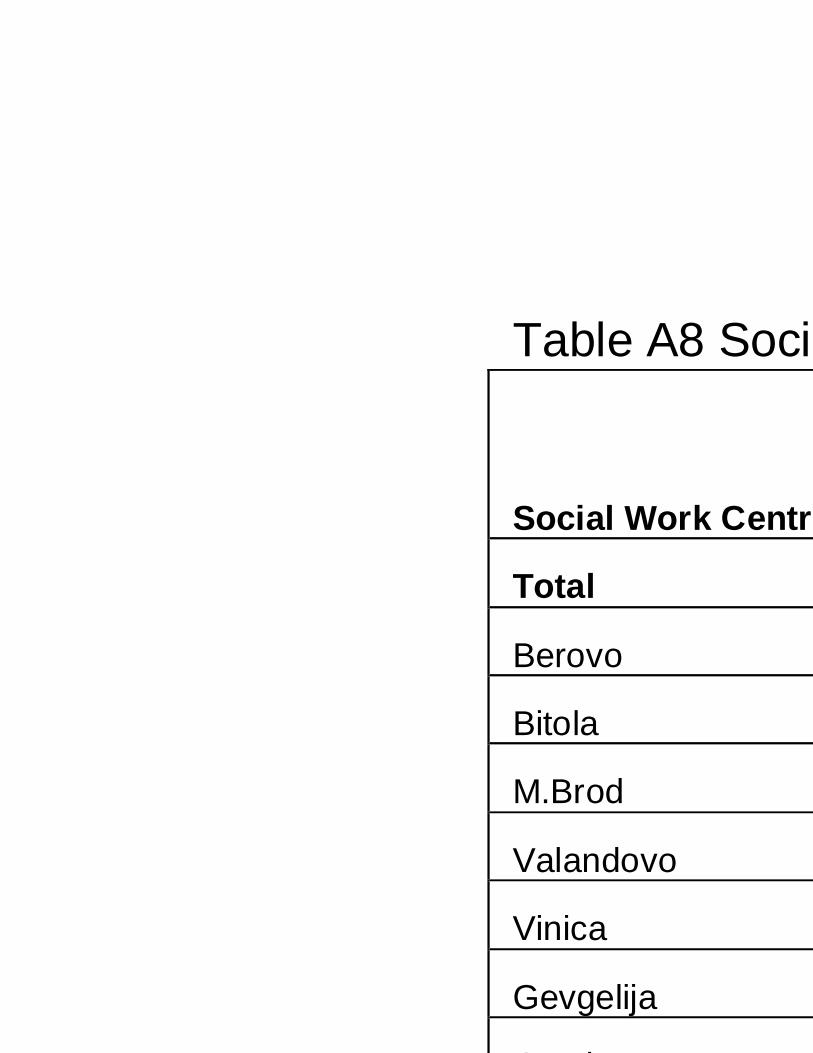
Table A8 Social Assistance: Regional Structure of Beneficiaries
Social Work Centres
Total
Berovo
Bitola
M.Brod
Valandovo
Vinica
Gevgelija
Gostivar
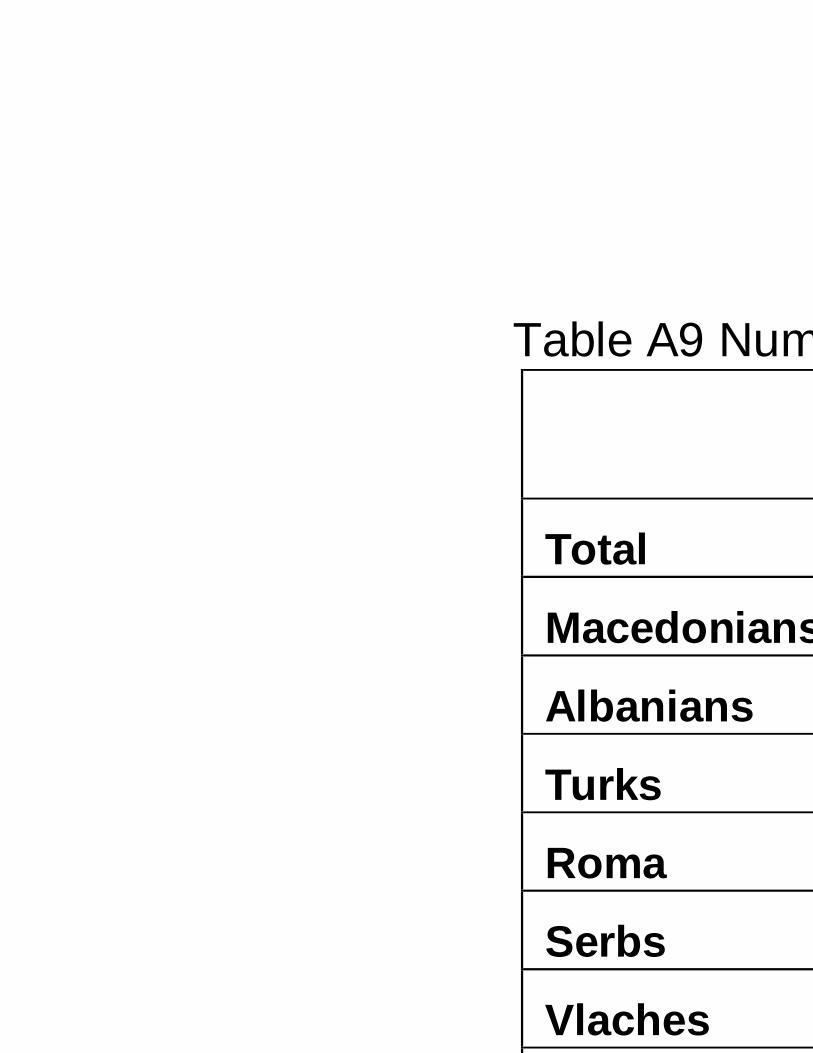
Table A9 Number of students at educational levels by ethnic origin in 2002/2003
Total
Macedonians
Albanians
Turks
Roma
Serbs
Vlaches

Map B2: Pan European Corridors in Republic of Macedonia (Rail Infrastructure)