Embed Size (px)
Citation preview
AD-A258 636
Implementation and Evaluation of a Three-DimensionalPhotometric Sampler
Hideichi Sato, Shree K. Nayar, and Katsushi Ikeuchi
CMU-CS-92-148
July, 1992
School of Computer ScienceCarnegie Mellon UniversityPittsburgh, PA 15213 USA D T IC
S ELECTE DDEC14 1992 11
EU@ 1992 Carnegie Mellon University
This research was conducted in the Task-oriented Vision Laboratory, Vision andAutonomous Center, School of Computer Science, Carnegie Mellon University.Image Understanding Research in the TVL is supported in part by the Westing-house Electric Corporation and in part by the Defense Advanced Research ProjectAgency, DOD, through ARPA order No. 7597, and monitored by the Air ForceAvionics Laboratory under contract F33615-90-C- 1465.
Approved for public releoOS jDistri b u,=tio 92-31327
92 12 14 007

Keywords: Computer vision, shape from shading, photometric stereo, roughness measurement, surfaceinspection
Contents1 Introduction 3
2 Photometric Sampling 52.1 Basic Photometric Function ........................ 52.2 Extended Light Source ............................ 82.3 Photometric Function for Extended Sources .............. 102.4 Sampling ................................... 112.5 Extracting Shape and Reflectance of Surfaces ............. 12
3 Three-Dimensional Photo-sampler Apparatus 163.1 Designing the Apparatus .......................... 163.2 System Parameters .............................. 173.3 Calibration ........................... 19
3.3.1 Device characteristic parameters ................ 213.3.2 Brightness distribution parameters ............... 243.3.3 Lookup table for surface orientations given specular com-
ponent ................................ 253.3.4 Light source brightness ..................... 27
3.4 Extraction Procedure ............................ 28
4 Experimental Results 324.1 Specular spherical surface ......................... 324.2 Lambertian spherical surface ........................ 334.3 Hybrid spherical surface .......................... 344.4 Industrial object surface: Dip Switch .................. 344.5 Solder Joint ....... ........................... 344.6 Transparent surface ...... ....................... 34
5 Conclusions Accesion For 36
NTIS CRA&IDTIC TABUnannouncedJustification
By ..................................................Distribution I
Availability Codes
Avail a!, d IorDist Special
Abstract
The photometric sampling method extracts shape and reflectance propertiesof surfaces (Lambertian, specular, and hybrid) by using multiple illuminationdirections and a single viewing direction. In this paper, we describe a completeimplementation and a performance evaluation of a three-dimensional version ofthe photometric sampler.
All existing shape extraction techniques that are based on photometric mea-surements rely on assumed surface reflection properties. We proposed a methodfor determining the shape of surfaces whose reflectance properties may vary fromLambertian to specular without prior knowledge of the relative strengths of theLambertian and specular components of reflection.
The object surface is illuminated using extended light sources and is viewedfrom a single direction. Extended light sources make it possible to ensure thedetection of both Lambertian and specular reflections. Extended sources aregenerated by illuminating a diffuser with a point source of light. In the 3Dimplementation of the photosampler, multiple extended sources are generatedby distributing 36 point sources around a spherical diffuser, each light source islocated at the vertex of a one-frequency icosahedron.
An extraction algorithm uses the set of image brightness values measuredat each surface point in order to compute orientation as well as the strengthsof the Lambertian and specular reflection components. In order to increase theaccuracy in measured orientations and reflectance parameters, we have developeda calibration method to overcome the the difference between the theoretical andthe actual distributions of extended source brightness.
The experimental conducted on Lambertian surfaces, specular surfaces, andhybrid surfaces show high accuracy in both estimated orientations as well asreflectance parameters. We have demonstrated the ability of our system to detectcracks, and reflectance parameter variances in several industrial objects.
1 Introduction
Shape from shading [4,6, 11], photometric stereo [16,5,2], and local shape fromspecularity [3] are examples of techniques that extract three-dimensional shapeinformation from photometric measurements. All of these techniques rely onprior knowledge of surface reflectance properties. The reflectance properties areeither assumed, or measured using a calibration object of known shape. In manyreal-world applications, such as those involving surfaces of different reflectancecharacteristics, the calibration approach is not a practical one. Therefore, theexisting shape extraction methods are often used by assuming surface reflectance tobe either Lambertian or specular. Many surfaces encountered in practice are hybridin reflectance; their reflectance models are linear combinations of Lambertian andspecular models. Therefore, Lambertian and specular models are only limitinginstances of the hybrid model. It is desirable to have a method that is capable ofextracting the shape of hybrid surfaces as well as Lambertian and specular ones.
In many industrial applications, surface polish and roughness are found to beimportant inspection criteria. In such cases, surface reflectance properties may beinterpreted as measures of surface polish and roughness. Furthermore, reflectanceproperties may be used to segment an image into different regions; each regionmay be regarded as a different surface to aid the process of inspection. For thesereasons, it would be of great value to have a technique that could, in additionto determining shape, also estimate the reflectance properties of each surfacepoint [8, 15, 7].
We have presented the photometric sampling [9] for determining the shape ofobjects whose surfaces may be Lambertian, specular, or hybrid. The method usedextended light sources to illuminate an object surface. A sequence of images of theobject are generated by actively controlling an array of extended sources, which arelocated on a plane passing through the object. Surface orientation was extractedwithout prior knowledge of the relative strengths of the Lambertian and specularreflection components. However, we had only implemented and demonstrated 2Dversion of the photometric sampling method: all of the light sources were locatedin the same plane and only objects with translated symmetry could be handled.
This paper describes the extension of our previous work, a 3D version ofthe photometric sampling which can handle surfaces of arbitray shape. Surfaceorientation is extracted without prior knowledge of the relative strengths of theLambertian and specular reflection components. The method also determinesthe parameters of the reflectance model at each surface point The experimental
3

results have shown high accuracy in extra, ted object shape and surface reflectanceproperties.
4
2 Photometric Sampling
2.1 Basic Photometric Function
The brightness distribution in the image of an object is closely related to thereflectance properties and shape of the object surface, and the characteristics ofthe light source used to illuminate the object. The basic photometric functionis defined as one that relates image brightness to the surface reflectance and theimaging geometry: surface orientation, viewer and source direction I
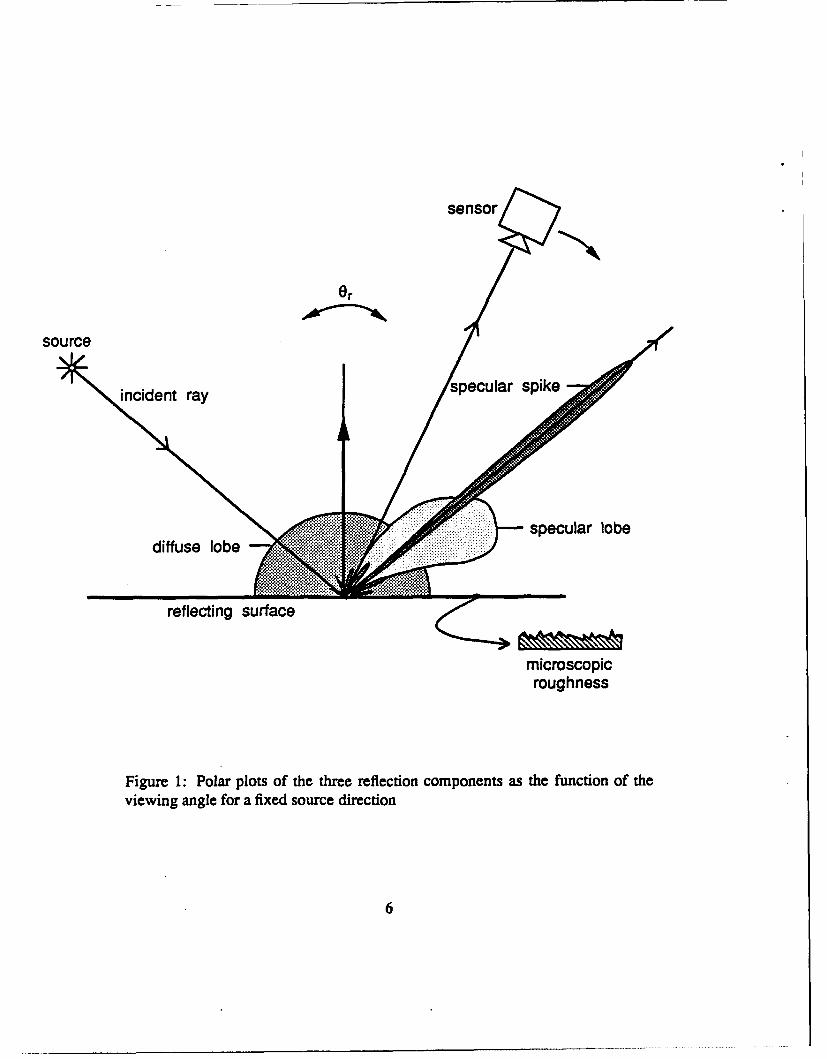
Consider the illumination of an object by a point source of light. The pointsource emits light in all directions. Light energy reflected by the surface in thedirection of the camera causes an image of the surface to be formed in the camera.For a given orientation of the surface and direction of the point source, the amountof light energy reflected by the surface in a particular direction is determinedby its reflectance properties. The photometric function of a large number ofsurfaces comprises three components, namely, the Lambertian (diffuse), the lobe(rough) component, and the specular (gloss) component [10]. Figure 1 shows therelationship between these three components and the imaging geometry.
Our photometric sampling method handles smooth surfaces 2. Then, we canneglect the specular lobe component and express the brightness at an image pointas:
1 = IL+IS. (1)
where IL and IS denotes the image brightness due to the Lambertian componentand the specular spike component, respectively.
The Lambertian brightness IL results from the non-homogeneous nature of thelayers that constitute the object surface. Light rays penetrating the surface undergomultiple refractions and reflections at the boundaries between surface layers andreemerge near the point of entry with a variety of directions. These surfaces appearequally bright from all directions; the brightness IL is independent of the viewingdirection.
IThM photometric function is similar to the image irradiance equation [4]; both represent therelationship between the image brightness and the imaging geometry. The reader may, therefore,regard the photometric function as an unnormalized image irradiance equation.
2More precisely, we assume that the surface roughness measure g is much smaller than 1.See [10].
5
sensor
Or
source
incident ray specular spike
specular lobediffuse lobe......
reflecting surface
microscopicroughness
Figure 1: Polar plots of the three reflection components as the function of theviewing angle for a fixed source direction
6
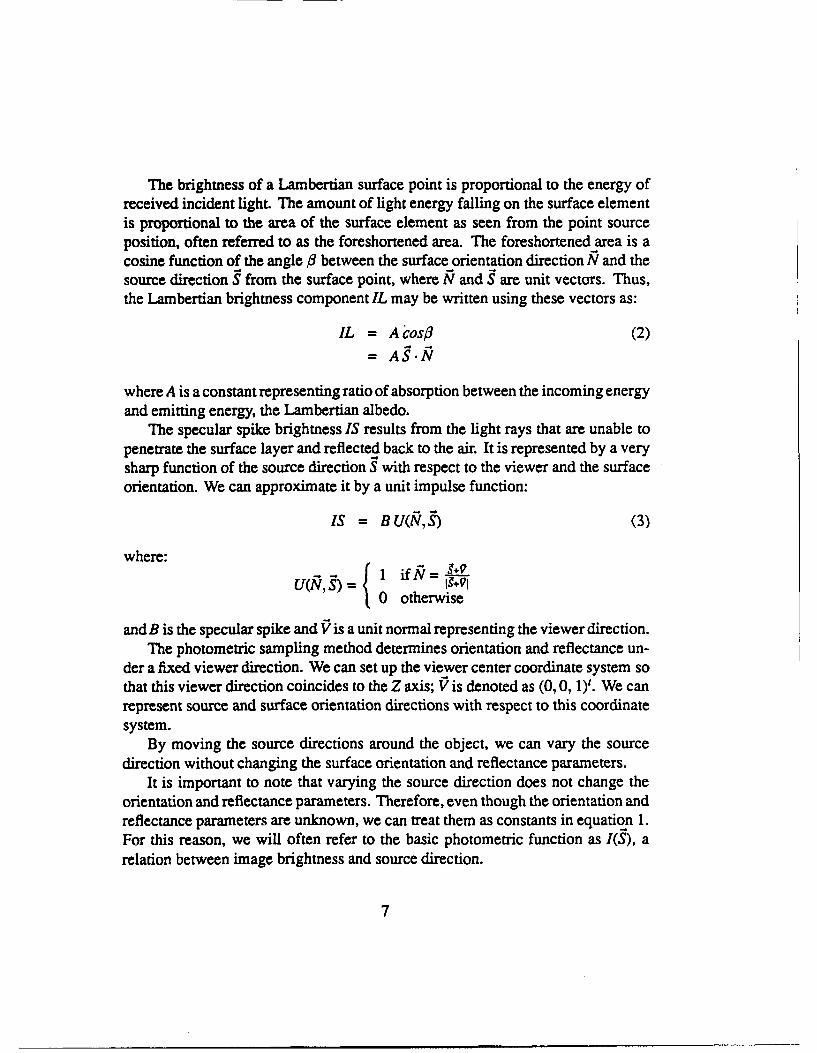
The brightness of a Lambertian surface point is proportional to the energy ofreceived incident light. The amount of light energy falling on the surface elementis proportional to the area of the surface element as seen from the point sourceposition, often referred to as the foreshortened area. The foreshortened area is acosine function of the angle /3 between the surface orientation direction R and thesource direction S from the surface point, where R and , are unit vectors. Thus,the Lambertian brightness component IL may be written using these vectors as:
IL = A'cos3 (2)-- AS.N
where A is a constant representing ratio of absorption between the incoming energyand emitting energy, the Lambertian albedo.
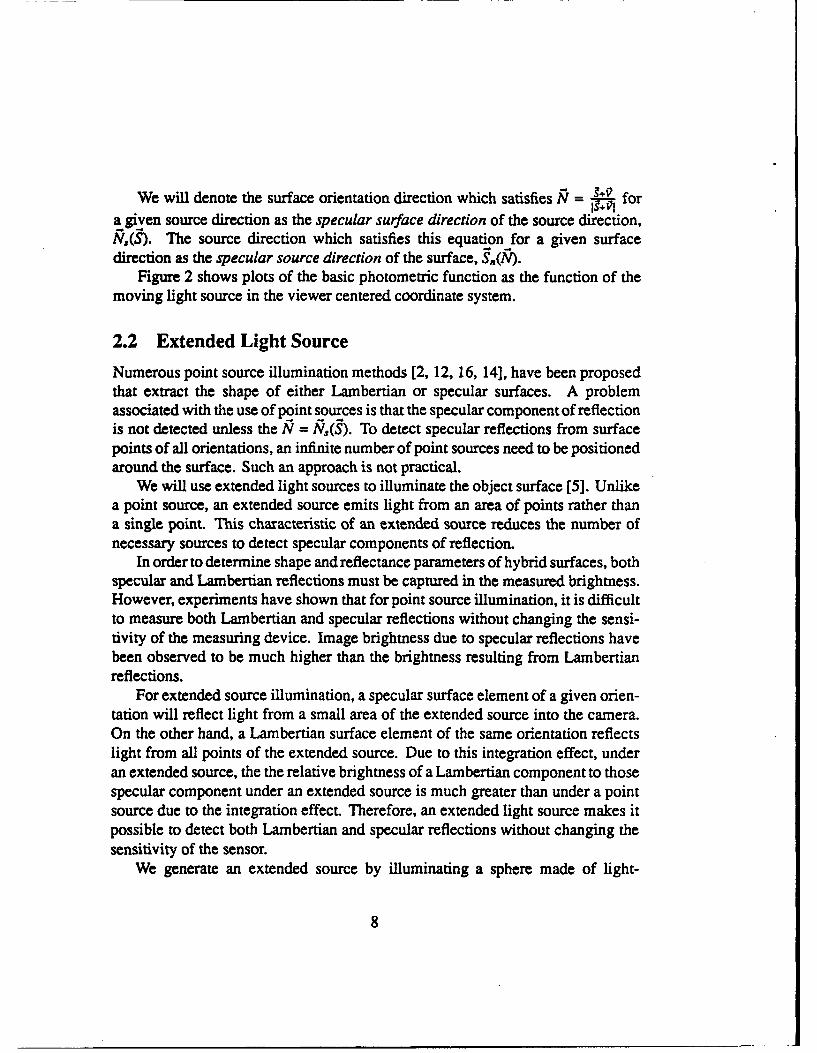
The specular spike brightness IS results from the light rays that are unable topenetrate the surface layer and reflected back to the air. It is represented by a verysharp function of the source direction S with respect to the viewer and the surfaceorientation. We can approximate it by a unit impulse function:
IS = BU(N (3)
where:
N190 otherwise
and B is the specular spike and V is a unit normal representing the viewer direction.The photometric sampling method determines orientation and reflectance un-
der a fixed viewer direction. We can set up the viewer center coordinate system sothat this viewer direction coincides to the Z axis; V is denoted as (0, 0, 1)'. We canrepresent source and surface orientation directions with respect to this coordinatesystem.
By moving the source directions around the object, we can vary the sourcedirection without changing the surface orientation and reflectance parameters.
It is important to note that varying the source direction does not change theorientation and reflectance parameters. Therefore, even though the orientation andreflectance parameters are unknown, we can treat them as constants in equation 1.For this reason, we will often refer to the basic photometric function as I(S), arelation between image brightness and source direction.
7
We will denote the surface orientation direction which satisfiesNV for
a given source direction as the specular surface direction of the source direction,N,(S). The source direction which satisfies this equation for a given surfacedirection as the specular source direction of the surface, S,(N).
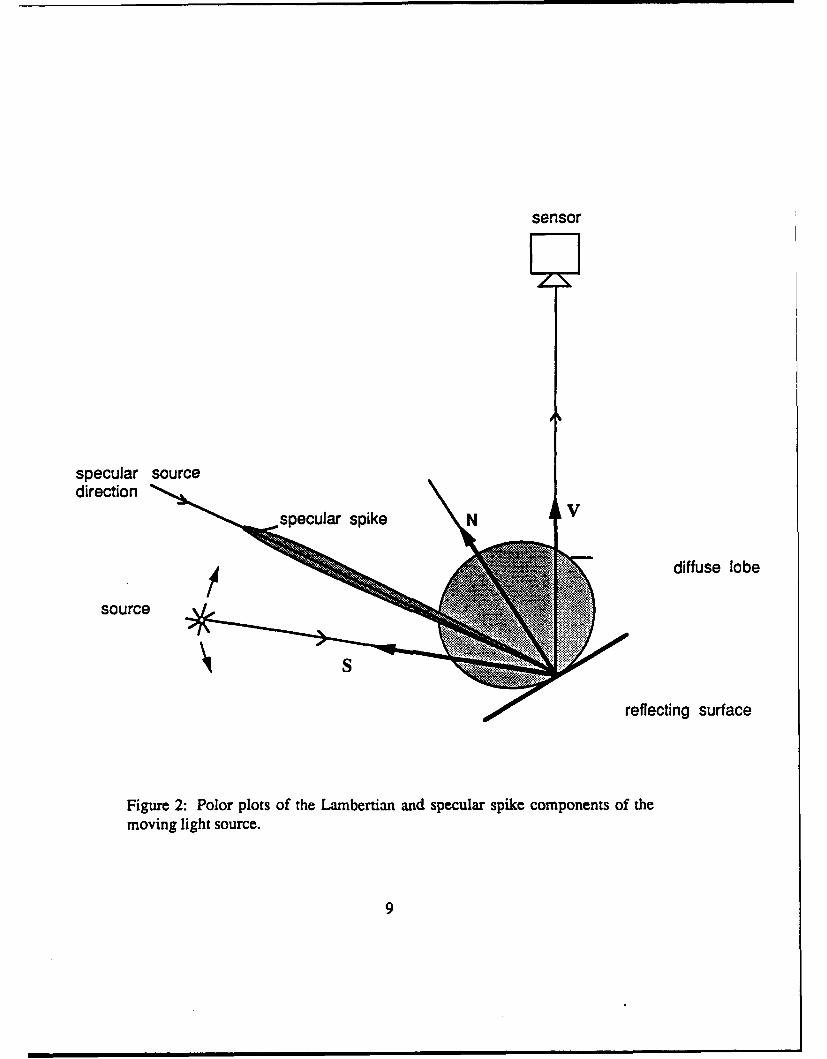
Figure 2 shows plots of the basic photometric function as the function of themoving light source in the viewer centered coordinate system.
2.2 Extended Light Source
Numerous point source illumination methods [2, 12, 16, 14], have been proposedthat extract the shape of either Lambertian or specular surfaces. A problemassociated with the use of point sources is that the specular component of reflectionis not detected unless the N = Ne(S). To detect specular reflections from surfacepoints of all orientations, an infinite number of point sources need to be positionedaround the surface. Such an approach is not practical.
We will use extended light sources to illuminate the object surface [5]. Unlikea point source, an extended source emits light from an area of points rather thana single point. This characteristic of an extended source reduces the number ofnecessary sources to detect specular components of reflection.
In order to determine shape and reflectance parameters of hybrid surfaces, bothspecular and Lambertian reflections must be captured in the measured brightness.However, experiments have shown that for point source illumination, it is difficultto measure both Lambertian and specular reflections without changing the sensi-tivity of the measuring device. Image brightness due to specular reflections havebeen observed to be much higher than the brightness resulting from Lambertianreflections.
For extended source illumination, a specular surface element of a given orien-tation will reflect light from a small area of the extended source into the camera.On the other hand, a Lambertian surface element of the same orientation reflectslight from all points of the extended source. Due to this integration effect, underan extended source, the the relative brightness of a Lambertian component to thosespecular component under an extended source is much greater than under a pointsource due to the integration effect. Therefore, an extended light source makes itpossible to detect both Lambertian and specular reflections without changing thesensitivity of the sensor.
We generate an extended source by illuminating a sphere made of light-
8
sensor
specular sourcedirection
specular spike NV
diffuse lobe
source
reflecting surface
Figure 2: Polor plots of the Lambertian and specular spike components of the
moving light source.
9
diffusing material with a point source of light. The object is placed at the center ofthe spherical diffuser and is viewed by the camera through a hole in the diffuser.In the following discussion, the origin of the viewer center coordinate system isdefined as the sphere center, and the Z axis corresponds to the optical axis of theTV camera. All vectors, such as S and A, are defined in this viewer centeredcoordinate system.
Each point source illuminates the spherical diffuser, and the illuminated areaon the spherical diffuser acts as an extended light source. Brightness at anypoint on the sphere, P, is described by the brightness distribution function of theextended light source, L(P, S), given by the illumination geometry. The brightnessdistribution function has the following characteristics:
"* the position of an extended source is defined as the direction, S, of the pointsource which generates the extended source,
" the brightness distribution function has a non zero area. It is bounded bya circle whose radius is a and whose center is the position of the extendedsource. In other words, L = 0 for j3 > a, where P3 = cos-'(S• P). We willrefer to a as the termination angle of the extended light source,
" the brightness distribution function is rotational symmetric with respect tothe source position S,
" its magnitude decreases as P deviates from S.
2.3 Photometric Function for Extended Sources
We will modify the point source illumination photometric function (Eq. 1) intoan extended source illumination photometric function. An extended source maybe thought of as a collection of point sources. Each point source has a brightnessthat is dependent on its position in the extended source. The brightness of lightreflected by an object surface that is illuminated by an extended source may bedetermined by computing the integral of the light energy reflected from all pointson the extended source. Therefore, the modified photometric function I'(S) isdetermined by convolvingkthe basic photometric function I(S) with the brightnessdistribution function L(P, S).
10
For a surface point of orientation N the Lambertian component IL' of the
modified photometric function is determined as:
IV'=J IL(P)L(P , S)dP= JJlA(NP),(P,Sd
= A'. N*S (4)
The specular component of the modified photometric function is proportionalto the brightness of the extended source at the specular source direction, S,(N).Therefore, the photometric function for surface illumination by the extended sourceis:
I' = A'N -. + B'L(S,(N-), S) (5)
Eq. 5 is the modified photometric function that relates image brightness tosurface orientation, surface reflectance, and source position for extended sourceillumination. In the equation, surface orientation and reflectance parameters areunknown, but constant, for a given surface point. For this reason, we will fre-quently refer to the modified photometric function as a relation between imagebrightness and extended source direction, I(S).
2.4 Sampling
The process of measuring image brightness for different source directions is equiv-alent to sampling the modified photometric function, I(S), at various Si. Samplesof the photometric function may be obtained by moving an extended source aroundthe object and taking images of the object for different source positions. An al-ter'ative approach would be to distribute an array of extended sources around theobject such that each source illuminates the object from a different direction. Theentire array of extended sources may be scanned by sequentially activating eachsource one at a time and taking an image. Therefore, the scanning process resultsin a set of brightness, Ii : i = 1,..., M, measured at each point on the objectsurface. M equals the number of extended sources.
The number of samples measured at each surface point is determined by thetermination angle a. As stated earlier, in order to extract the shape and reflectanceparameters of hybrid surfaces, both Lambertian and specular components of imagebrightness must be detected. Since we have used a unit impulse specular reflection
11
model, the area of the photometric function that contains specular brightness isbounded by an a radius circle.
Uniform sampling of the photometric function may be obtained by distributingextended sources in a tessellation that results from projecting onto the unit spherea regular polyhedron whose center coincides with that of the sphere[ 1]. A higherfrequency polyhedron which consists of triangular faces can be used [ 13] fcr asmaller meshed tessellation.
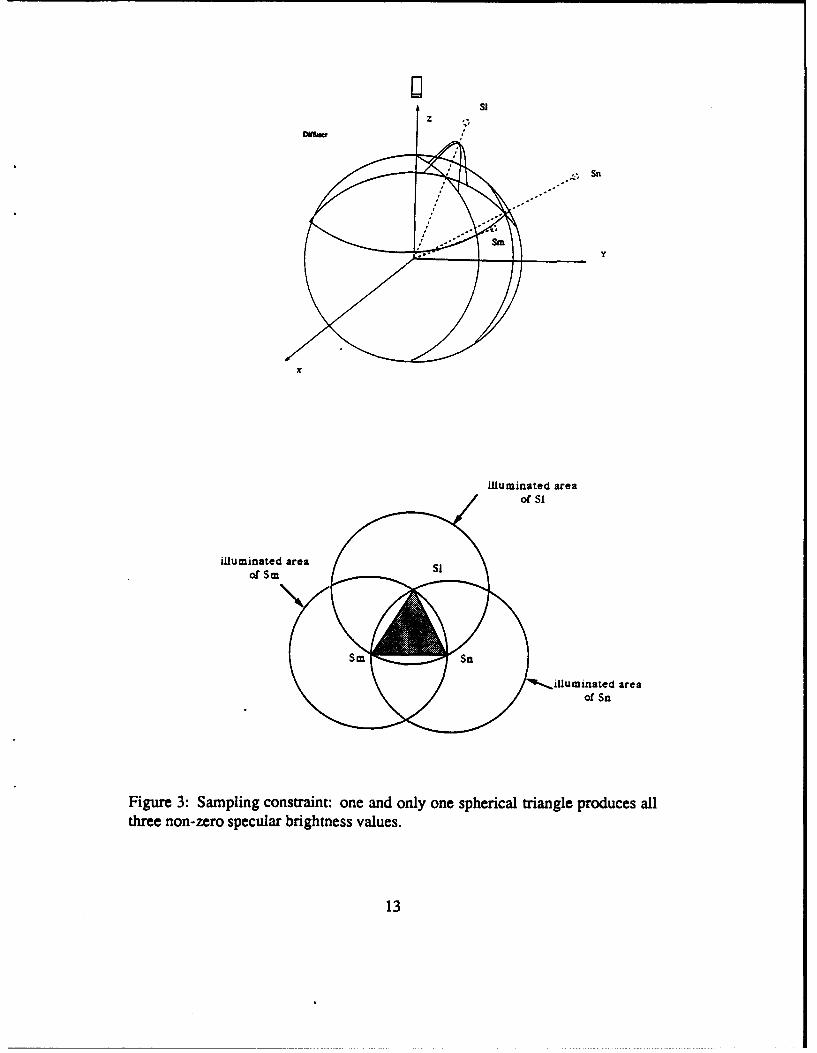
We will use a polyhedron whose edge length projects to an arc length equivalentto a. This spacing allows the photometric function to be uniformaly sampled atan interval equal to a. Under this sampling interval, one and only one sphericaltriangle gives three non-zero specular brightnesses. (See Figure 3.) We will usethis constraint for designing a recovery algorithm. We will refer to this triangle andthe constrain as the specular triangle and the sampling constraint, respectively.
2.5 Extracting Shape and Refle:tance of Surfaces
Given the set of image brightness values, Ii : i = 1, ... , M we want to determine thesurface orientation, N, and the strengths, A' and B', of the Lambertian and specularcomponents of reflection. The shape and reflectance properties extracted at eachsurface point are solely based on the image brightness recorded at that point. Thesurface property values assigned to a surface point are not influenced by the imagebrightness measured at neighboring points. We will first develop techniques toextract surface orientations of purely Lambertian and purely specular surfaces.Later, these techniques will be used as tools to extract surface orientations andreflectance properties of hybrid surfaces.
Lambertian Surfaces Consider the case where the surface of an object is knownto be purely Lambertian, and the shape of the object is to be determined. Thephotometric samples for a Lambertian surface may be written as:
I = A'R -(6
We would like to compute the surface orientation, N, and and the strength,A', of the Lambertian reflection component. These variables may be e.;timated byfitting the equation to the set of image brightness, Ii : i = 1,... , M and extendedsource directions, Si : i = 1, ... , M, using the least square fitting method.
12
U$1
Z e
Y
x
illuminated area
illuminated area sof SM
'"-....i11uminated areaof Sn
Figure 3: Sampling constraint: one and only one spherical triangle produces allthree non-zero specular brightness values.
13
Specular Surfaces Now consider the case where the object surface is knownto be purely specular, and the shape of the object is to be determined. From thesampling constraint, we can assume that only three brightness values are non-zero,and the corresponding three directions form a specular triangle.
Given the image brightness set, Ii : i = 1, .. , M, at a surface point, the threenon-zero image brightness values in the set are first determined. These threevalues, It, I,., I., and their corresponding source directions, S,, S, S, must satisfythe following four equations:
It = B'L(S(&S 1)I. = B'L0.(SV),S.) (7)
I. = 'L(3(NO, §)
INI = 1
By solving these four equations, we can determine the surface orientation, N,and specular strength, B' at each point. In the actual implementation, however,we use a lookup table to convert a triple of brightness values into a unique surfaceorientation [5].
Hybrid Surfaces A large number of surfaces may be classified as hybrid surfaceswhose photometric functions are linear combinations of Lambertian and specularcomponents. The hybrid surface class includes plastic surfaces and painted smoothsurfaces. We will develop an algorithm to recover the Lambertian strength andspecular strength, and surface orientation of a hybrid surface. The extractionalgorithm is developed based on the sampling constraint.
This method assumes that all the image brightness does not contain any spec-ular component. We will determine the surface orientation, Ntad, and the Lam-bertian strength, A', using the least square fitting method as mentioned above.
Then, we will calculate the theoretical brightness, 1• : i = 1, ... , M, for allsource directions using A', Na,,,, and Si : i = 1, ... , M. By subtracting theoreticalbrightness values from the observed ones, we obtain residual brightness valuesAli = Pi - Ii. The residual brightness represents specular brightness. The samplingconstraint guarantees that only three residual values contain non-zero values. Byfinding these residual brightness, we can identify the specular triangle. Using thethree brightness residual brightness and the specular triangle, we can determinethe surface orientation, Nsp,,, and the specular strength, B', by using the sameprocedure as was used for specular surfaces.
14
Third, we will use the least square fitting method on the remaining bright-ness values and redetermine the surface orientation, Nb, and the Lambertianstrength, A'. Using these values, we will recalculate the brightness residues. Wefind the three largest residues and redetermine the specular triangle. Then, weagain estimate the specular strength, B', and surface orientation, Np,,, from theseresidues.
We have two surface orientations given by two different methods (Lambertianand specular). We compute a weighted average of both surface orientations into asingle value based on the ratio of Lambertian and specular strength:
-A 'N,, + B'
15
3 Three-Dimensional Photo-sampler Apparatus
3.1 Designing the Apparatus
We produce an extended source by illuminating a spherical diffuser with a pointsource. The object is placed at the center of the spherical diffuser. Point lightsources are distributed uniformly over the diffuse sphere. Each point sourceilluminates a part of the diffuser, and that part acts as an extended source. Thisilluminated area on the diffuse sphere is referred to as the effective area of theextended source. The effective area is bounded by a spherical circle whose radiusis the termination angle a and whose center is the light source direction.
The termination angle determines the number of point sources necessary tocover the entire surface of spherical diffuser. In terms of efficiency, we prefera larger a value. A large a needs fewer sources to cover the spherical surface.But, a large a degrades the resolution of the surface orientation measurements,because the gradient of extended sources become flat. A smaller a gives a bettersurface orientation resolution because of the steep gradient of extented sources.On the other hand, the area of the extended source becomes smaller. We wouldrequire more sources. A smaller a also makes the Lambertian surfaces relativelydarker than the specular surfaces. This makes it difficult to extract the Lambertiancomponent. From several experiment, we select 400 as the optimal terminationangle: a = 400. This configuration of point light source distribution can berealized by locating point sources at each vertex of one frequency icosahedron.This requires 42 light sources.
The distance H between a point source and the surface of the diffuser is relatedto the termination angle a:
cosa = - ,(8)R+H'
where R denotes the radius of the diffuser. See Figure 4. Therefore, once wedetermine the termination angle, a, we can determine H as H = 1-cos*,
By using, R and H we can express the brightness distribution function of anextended light source as
L(S;RH) = C[(R + H)(S. -P) - R][(R + H - R (9 -j))2 + (R(1 - (S. P)2)]2 (9)
where P denotes a unit vector to a point on the diffuse surface from the spherecenter and S denotes the point light source direction from the sphere center.
16
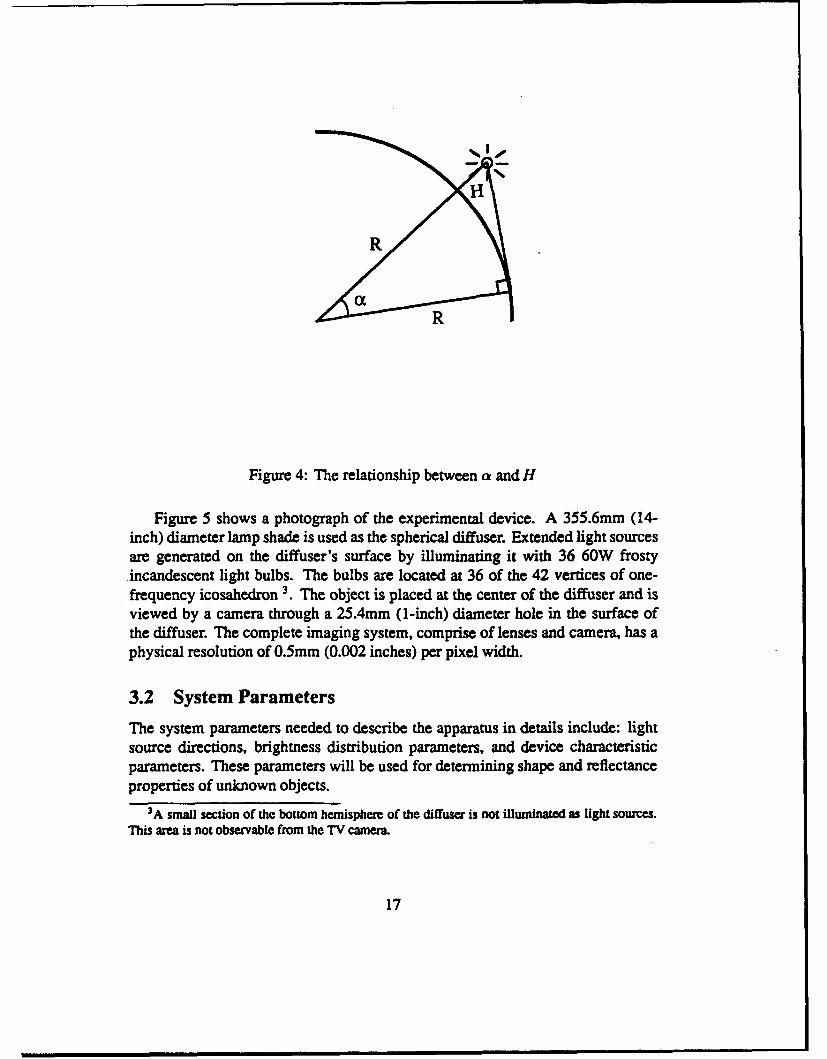
R
Figure 4: The relationship between a and H
Figure 5 shows a photograph of the experimental device. A 355.6mm (14-inch) diameter lamp shade is used as the spherical diffuser. Extended light sourcesare generated on the diffuser's surface by illuminating it with 36 60W frostyincandescent light bulbs. The bulbs are located at 36 of the 42 vertices of one-frequency icosahedron 3. The object is placed at the center of the diffuser and isviewed by a camera through a 25.4mm (1-inch) diameter hole in the surface ofthe diffuser. The complete imaging system, comprise of lenses and camera, has aphysical resolution of 0.5mm (0.002 inches) per pixel width.
3.2 System Parameters
The system parameters needed to describe the apparatus in details include: lightsource directions, brightness distribution parameters, and device characteristicparameters. These parameters will be used for determining shape and reflectanceproperties of unknown objects.
3A small section of the bottom hemisphere of the diffuser is not illuminated as light sources.This area is not observable from the TV camera.
17
....................... o.•
,,,,t .: ' .: ! ........... .....
i -]/J
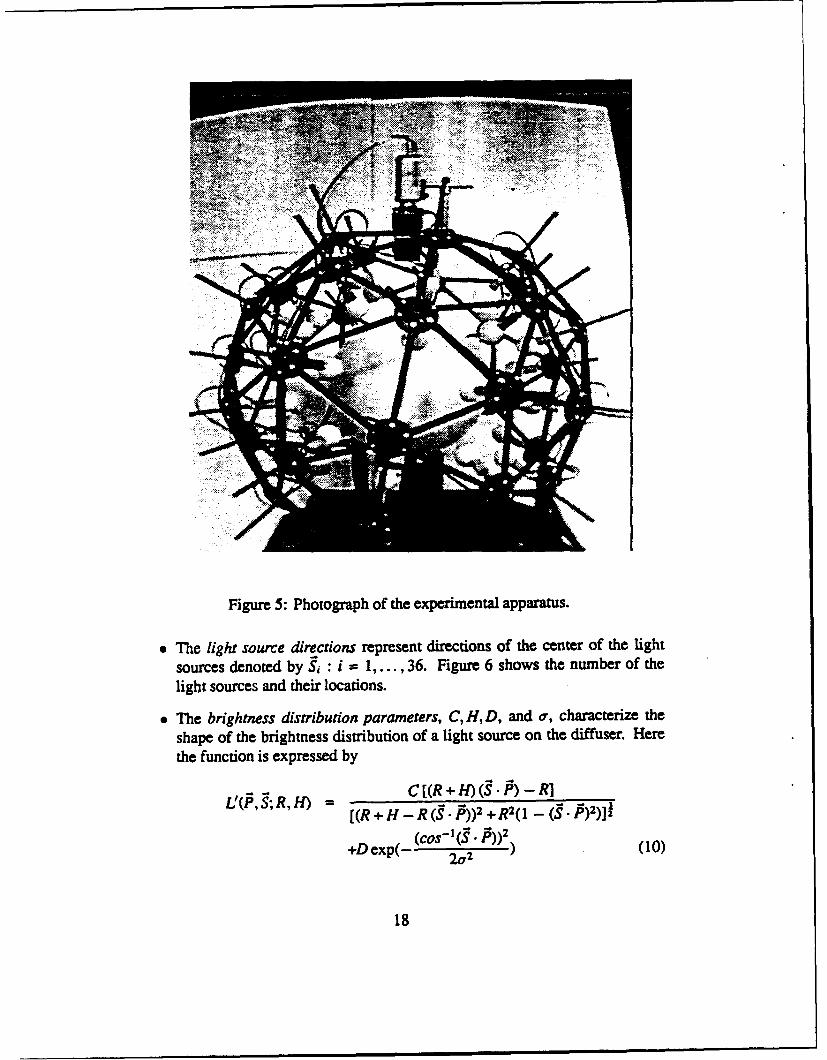
Figure 5: Photograph of the experimental apparatus.
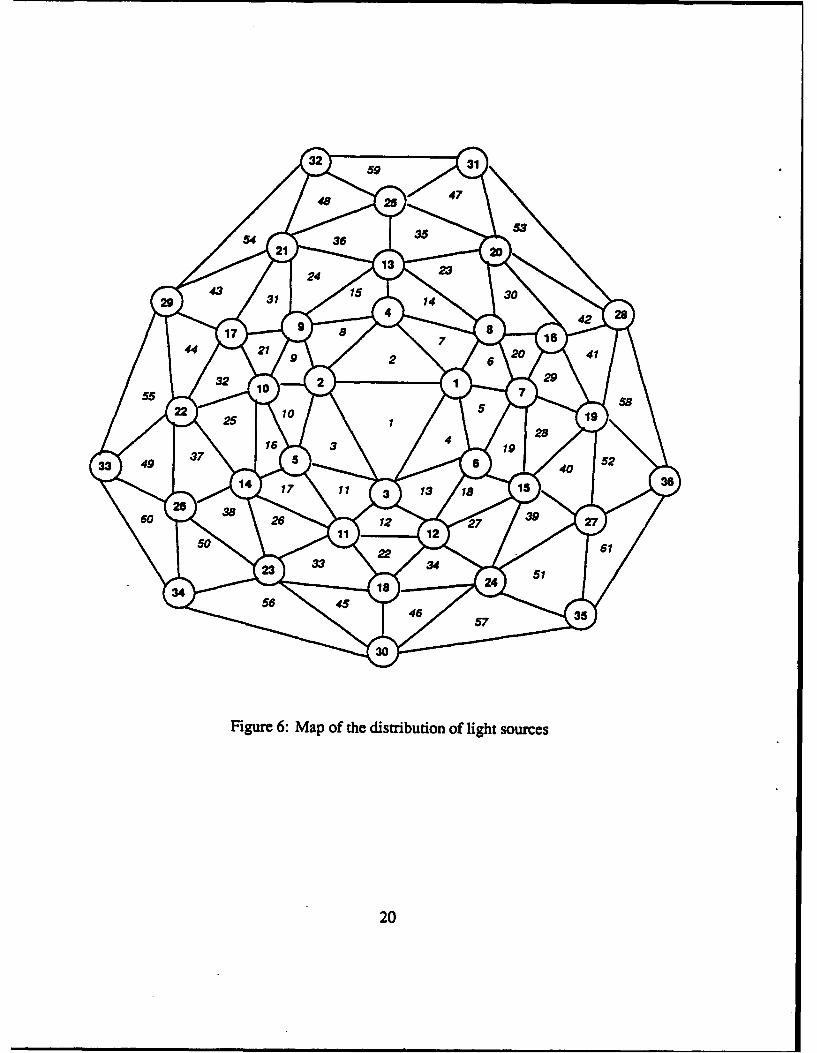
I The light source directions represent directions of the center of the light
sources denoted by Si : i = 1,..., 36. Figure 6 shows the number of thelight sources and their locations.
* The brightness distribution parameters, C, H, D, and a, characterize theshape of the brightness distribution of a light source on the diffuser. Herethe function is expressed by
C [(R + H) (S. P) - RI[(R +H - R P-•)) 2 +R 2 (1 - PS- •)2)]
+D exp(- (cos .21 (9 -P) 10
18
For an ideal diffuser, the first term in the above the equation is accurate.However, since the sphere is not an ideal Lambertian diffuser, we add aGaussian function to compensate this discrepancies. C and D represent thestrength of the Lambertian and Gaussian functions, respectively. H anda are related with the width of the Lambertian and Gaussian functions,respectively.
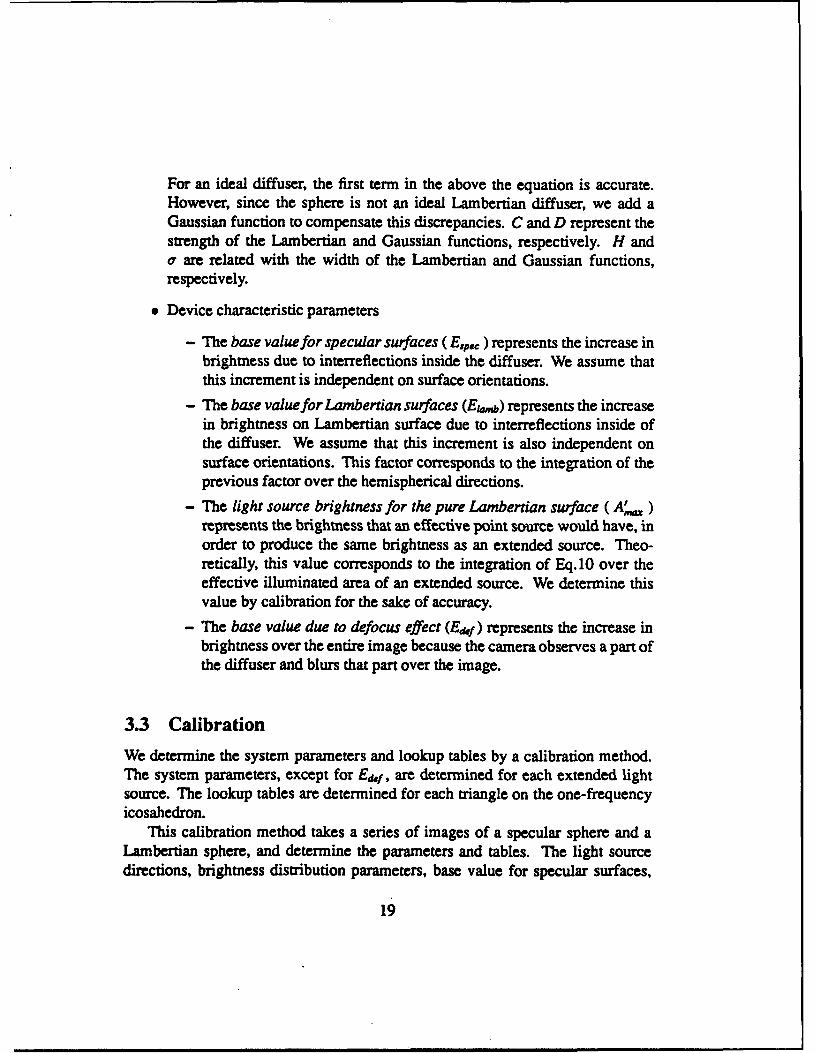
e Device characteristic parameters
- The base value for specular surfaces ( E~p, ) represents the increase inbrightness due to interreflections inside the diffuser. We assume thatthis increment is independent on surface orientations.
- The base valuefor Lambertian surfaces (Elb) represents the increasein brightness on Lambertian surface due to interreflections inside ofthe diffuser. We assume that this increment is also independent onsurface orientations. This factor corresponds to the integration of theprevious factor over the hemispherical directions.
- The light source brightness for the pure Lambertian surface ( A')represents the brightness that an effective point source would have, inorder to produce the same brightness as an extended source. Theo-retically, this value corresponds to the integration of Eq.10 over theeffective illuminated area of an extended source. We determine thisvalue by calibration for the sake of accuracy.
- The base value due to defocus effect (Ed.!) represents the increase inbrightness over the entire image because the camera observes a part ofthe diffuser and blurs that part over the image.
3.3 Calibration
We determine the system parameters and lookup tables by a calibration method.The system parameters, except for Edf, are determined for each extended lightsource. The lookup tables are determined for each triangle on the one-frequencyicosahedron.
This calibration method takes a series of images of a specular sphere and aLambertian sphere, and determine the parameters and tables. The light sourcedirections, brightness distribution parameters, base value for specular surfaces,
19
32 59 31
48 25 47
54 36 35 53
21 20
24 13 23
29 43 31 15 14 30
17 9 8 4 7 is 42 28
44 21 9 2 6 20 41
55 22 32 10 10 2 1 5 7 29 19 58
25 1
33 49 37 16 5 3 4 6 19 28 40 52
14 17 11 3 13 18 is 36
60 25 36 26 12 7 39 2711 12
50 22 61
34 23 33 is 34 24 51
56 4546 5 35
30
Figure 6: Map of the distribution of light sources
20
and the base value for the defocus effect are determined by processing 36 imagesof a specular sphere under the 36 extended light sources. The lookup tables are alsoconstructed using 36 images of the specular sphere. The light source brightnessfor the pure Lambertian surface and base value for the Lambertian surfaces aredetermined by processing 36 images of a Lambertian sphere under the 36 extendedlight sources.
3.3.1 Device characteristic parameters
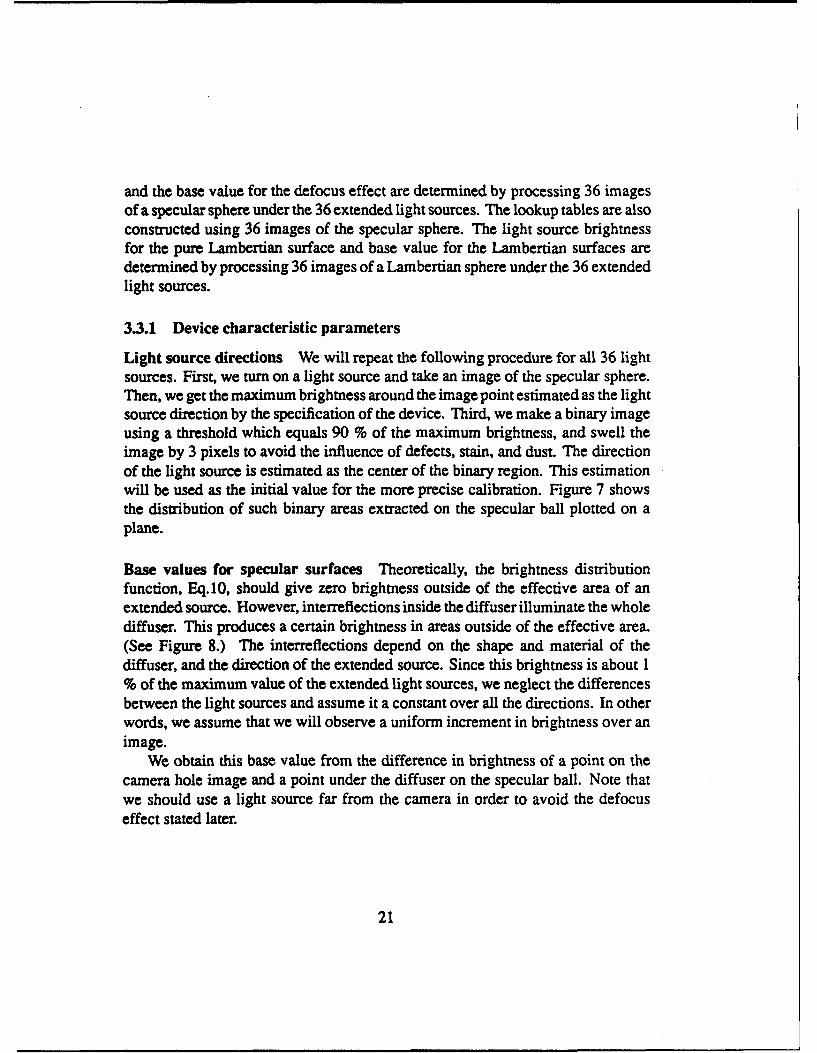
Light source directions We will repeat the following procedure for all 36 lightsources. First, we turn on a light source and take an image of the specular sphere.Then, we get the maximum brightness around the image point estimated as the lightsource direction by the specification of the device. Third, we make a binary imageusing a threshold which equals 90 % of the maximum brightness, and swell theimage by 3 pixels to avoid the influence of defects, stain, and dust. The directionof the light source is estimated as the center of the binary region. This estimationwill be used as the initial value for the more precise calibration. Figure 7 showsthe distribution of such binary areas extracted on the specular ball plotted on aplane.
Base values for specular surfaces Theoretically, the brightness distributionfunction, Eq.10, should give zero brightness outside of the effective area of anextended source. However, interreflections inside the diffuser illuminate the wholediffuser. This produces a certain brightness in areas outside of the effective area.(See Figure 8.) The interreflections depend on the shape and material of thediffuser, and the direction of the extended source. Since this brightness is about 1% of the maximum value of the extended light sources, we neglect the differencesbetween the light sources and assume it a constant over all the directions. In otherwords, we assume that we will observe a uniform increment in brightness over animage.
We obtain this base value from the difference in brightness of a point on thecamera hole image and a point under the diffuser on the specular ball. Note thatwe should use a light source far from the camera in order to avoid the defocuseffect stated later.
21
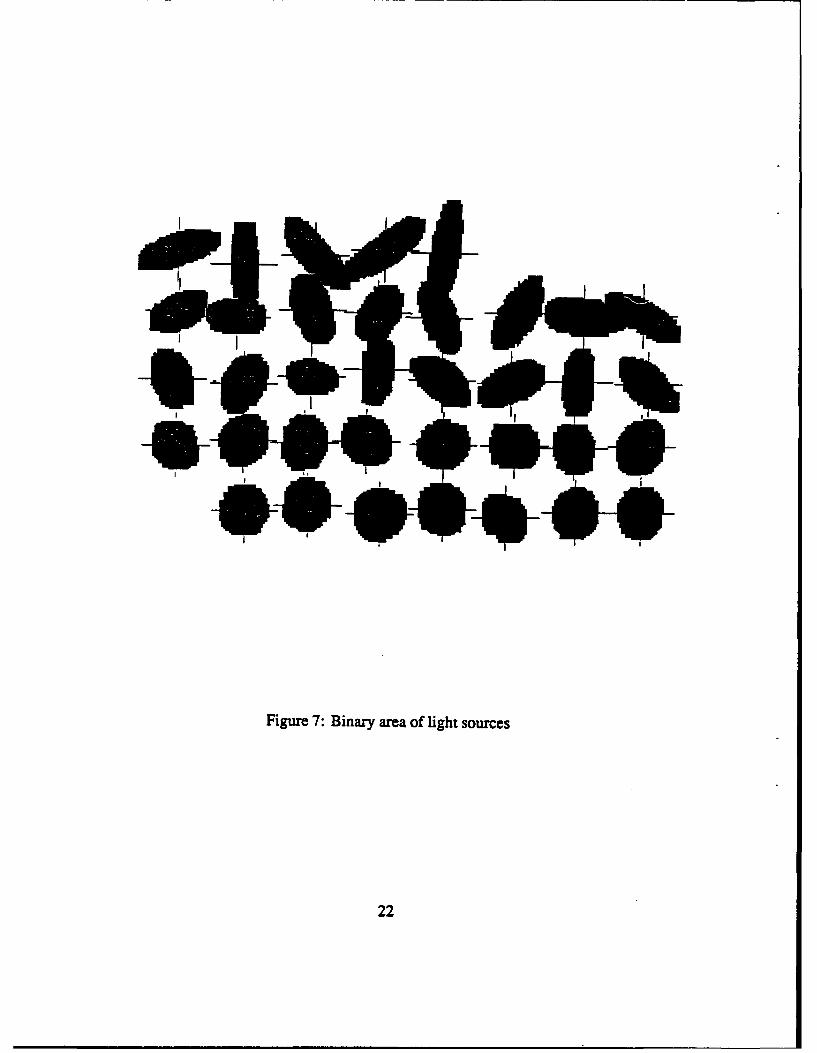
Figure 7: Binary area of light sources
22
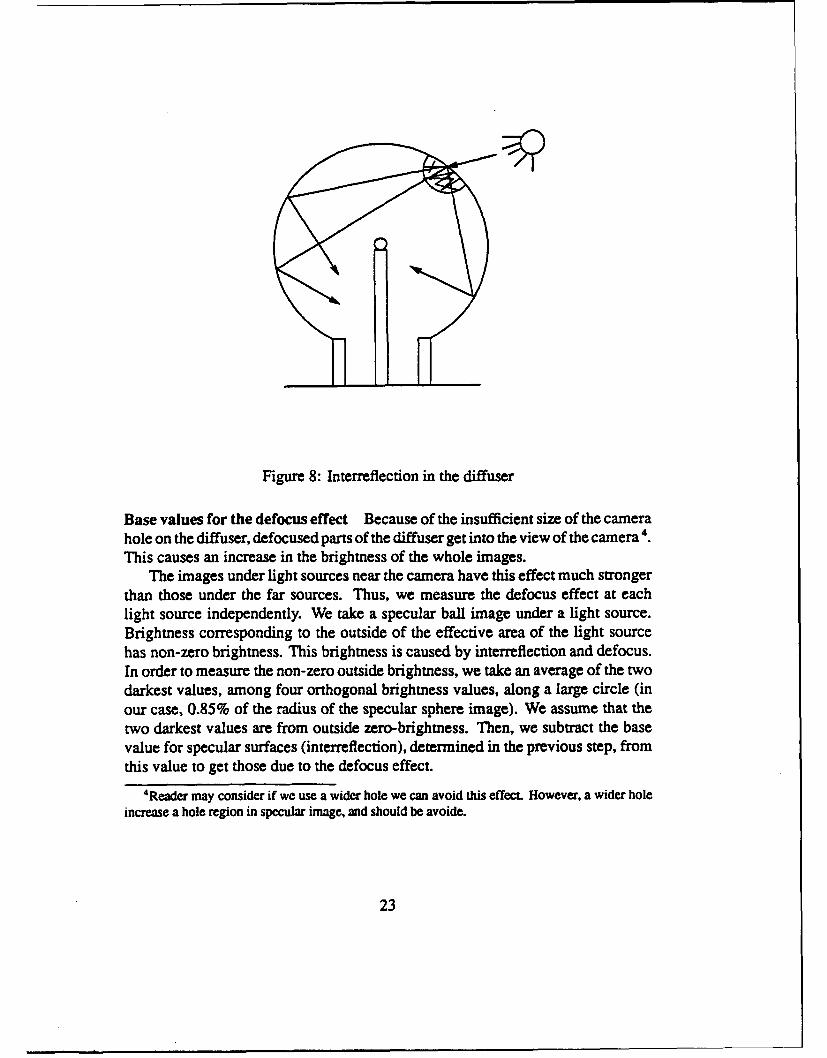
Figure 8: Interreflection in the diffuser
Base values for the defocus effect Because of the insufficient size of the camerahole on the diffuser, defocused parts of the diffuser get into the view of the camera'.This causes an increase in the brightness of the whole images.
The images under light sources near the camera have this effect much strongerthan those under the far sources. Thus, we measure the defocus effect at eachlight source independently. We take a specular ball image under a light source.Brightness corresponding to the outside of the effective area of the light sourcehas non-zero brightness. This brightness is caused by interreflection and defocus.In order to measure the non-zero outside brightness, we take an average of the twodarkest values, among four orthogonal brightness values, along a large circle (inour case, 0.85% of the radius of the specular sphere image). We assume that thetwo darkest values are from outside zero-brightness. Then, we subtract the basevalue for specular surfaces (interreflection), determined in the previous step, fromthis value to get those due to the defocus effect.
4Reader may consider if we use a wider hole we can avoid this effecL However, a wider holeincrease a hole region in specular image, and should be avoide.
23
Source
Camera
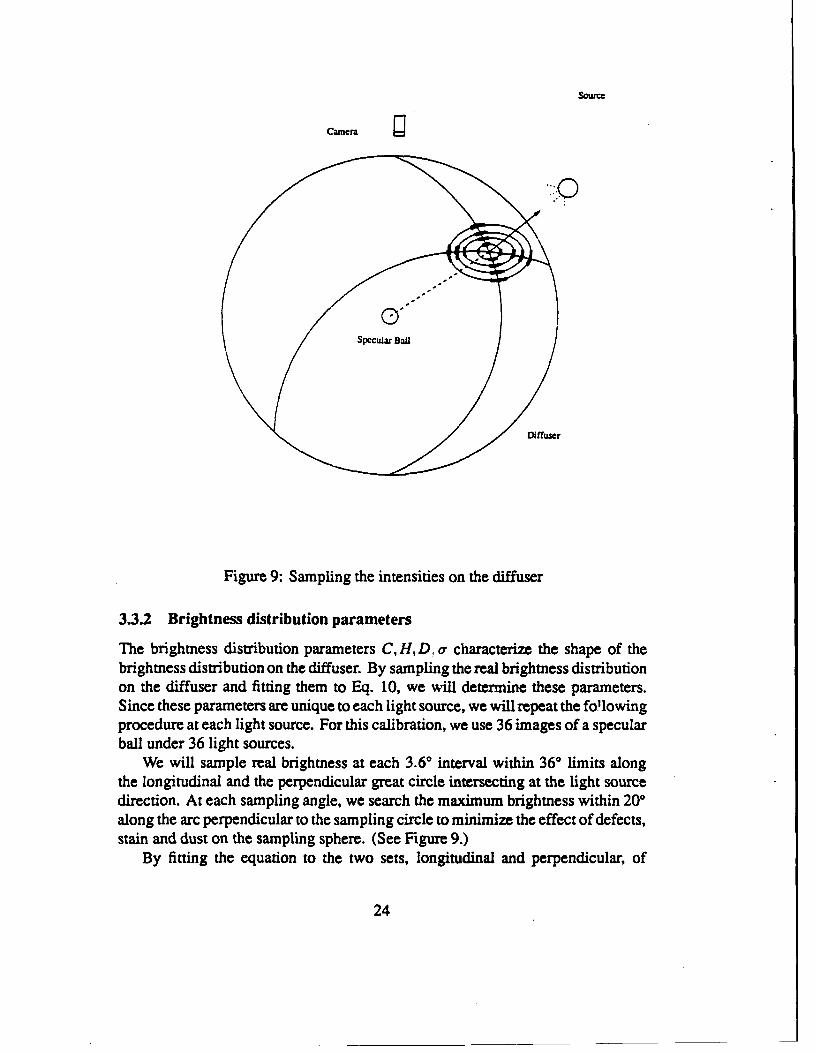
Figure 9: Sampling the intensities on the diffuser
3.3.2 Brightness distribution parameters
The brightness distribution parameters C, H,D, Da characterize the shape of thebrightness distribution on the diffuser. By sampling the real brightness distributionon the diffuser and fitting them to Eq. 10, we will determine these parameters.Since these parameters are unique to each light source, we will repeat the fo!lowingprocedure at each light source. For this calibration, we use 36 images of a specularball under 36 light sources.
We will sample real brightness at each 3.60 interval within 360 limits alongthe longitudinal and the perpendicular great circle intersecting at the light sourcedirection. At each sampling angle, we search the maximum brightness within 200along the arc perpendicular to the sampling circle to minimize the effect of defects,stain and dust on the sampling sphere. (See Figure 9.)
By fitting the equation to the two sets, longitudinal and perpendicular, of
24
sampled brightness, two sets of parameters C, H, D, oa, and 69 are determined.Then, these two sets of parameters are averaged. Here, C, H,D, a are the same asthose in Eq. 10 and 69 denotes the difference between the real and the estimatedlight source direction.
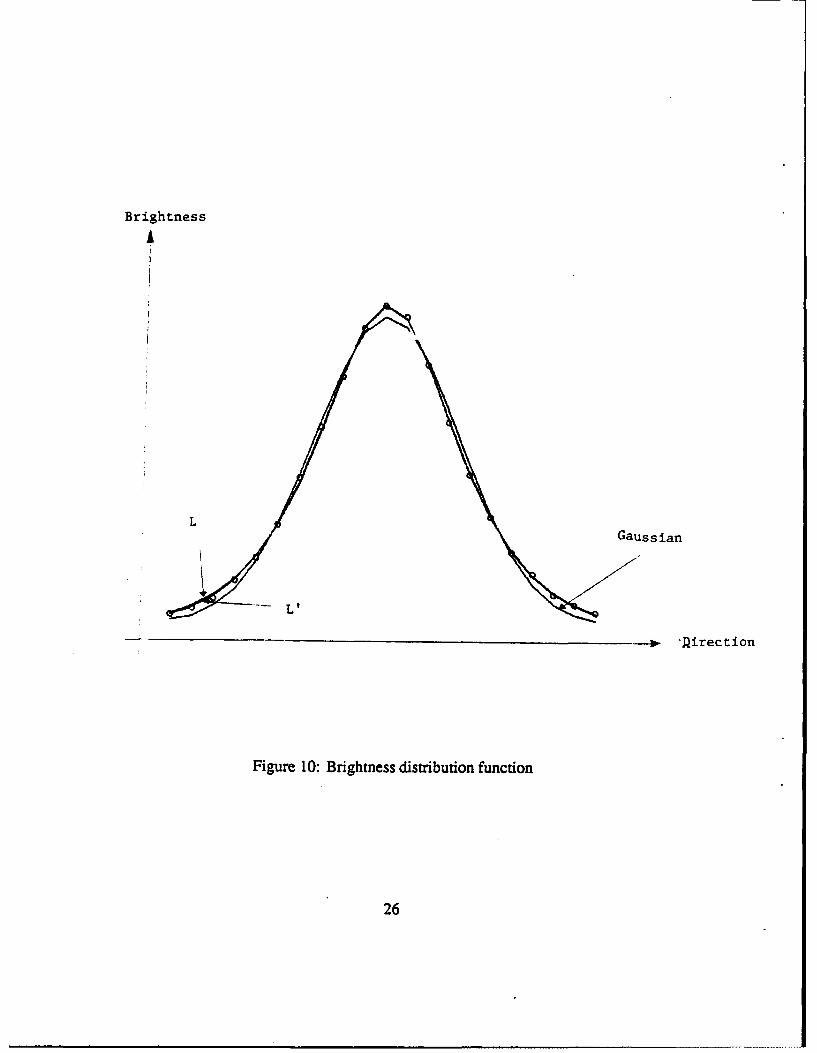
Each fitting process is executed in the following three steps. The first stepdetermines the parameters for the Lambertian component, 69, C, H, and the secondstep determines those for the Gaussian component, D and a. The last step adjuststhe relative strength, C and D so that the difference between the real one and. theone described by these parameters is minimized.
The first step approximates the brightness distribution by the Lambertian com-ponents of Eq. 10 and determines the parameters, 69, C andHby using a non-linearleast square fitting method. Using H given by the device dimension and D givenby the maximum brightness value, the method obtains the 68 which gives the min-irtum error among the possible 69 values, ±50 limits around the estimated lightsource direction and 0.10 intervals. Then, the method determines the height H thatgives the minimum error under the C given by thd• iiaimum brightness. Finally,using these H and C as the initial values, the method determines the optimal H andC for the Lambertian component of Eq. 10 by the Gauss-Newton non-linear leastsquare fitting method, iteratively.
The second step approximates the brightness distribution by the Gaussiancomponent of Eq. 10 and determines the parameters, D and a of Eq. 10. D and oaare determined by the Gauss-Newton non-linear least square fitting method. Theinitial value of D is given by the maximum brightness value. The initial value ofa is chosen so that the Gaussian component gives the same value as the one givenby the Lambertian component at 90 = 0.1571 radian. Namely, oa - 0.1571 where
Lo denotes the brightness at 90 from the light source direction.The third step adjusts the ratio between the Lambertian and Gaussian com-
ponents. Fixing all parameters except C and D, we obtain these two parametersby using the least square fitting method. Figure 10 shows some of the brightnessdistribution function superimposed on the measured brightness.
3.3.3 Lookup table for surface orientations given specular component
A specular surface obeys the law of reflection and gives the brightness of anextended source at the specular source direction. From observing a triple of thesebrightness given by three different extended sources, we can determine the surface
25
Brightness
LGaussian
- P 'irection
Figure 10: Brightness distribution function
26
orientation of the surface as described in section 2.5.The device consists of many triangular tessellations. Within one triangular
tessellation, the effective areas of three extended light sources overlap with eachother. We will make the lookup table at each triangular tessellations.
We will construct a lookup table to convert a triple of brightness values toa surface orientation analytically. Here the axes of the three dimensional tablecorrespond to three brightness values, and each cell of the table contains a surfaceorientation corresponding to a triple.
We sample orientation over a triangular tessellation. At each sampled orienta-tion, we can calculate the three brightness values using Eq. 10 analytically. Herethe parameters for the equation are given by the calibration method in the previoussection. Then, we place the corresponding surface orientation at the cell of thetable, corresponding to the calculated triple of the brightness. In order to avoidnull spaces in the lookup table due to the insufficient sampling, we interpolate andextrapolate the contents of the table.
3.3.4 Light source brightness
The light source brightness for the pure Lambertian surface, AX,,, and the basevalue for the Lambertian surface. E.,,, are obtained by calibration at each lightsource. Here, the brightness value of a pure Lambertian surface can be describedas:
where S and R denote the light source direction Both the base value and the sourcebrightness can be obtained by integrating appropriate equations. However, wewill determine these parameters experimentally for the sake of accuracy.
These parameters are extracted by processing the 36 images of a pure Lam-bertian ball under 36 light sources independently. At each image, we sample, at120, a set of brightness values along the longitudinal great circle of the Lambertiansphere which passes through the light source direction. We can calculate 9. - ateach sampling point. Substituting these values and brightness values to Eq. 11,we can determine A'. and Ei, by the least square fitting method.
When a surface normal makes an angle near ±900 with respect to the lightsource direction, part of the extended light source is occluded by the surface itself.The brightness departs from the cosine curve. Therefore, only the brightnessvalues given by the normal direction between ±600 are used for this fitting.
27
The camera cannot see the entire area illuminated by an oblique direction ofa source, due to occlusion by the Lambertian sphere. We can observe brightnessonly at the peripheral part of the cosine curve. In this case, the fitting methodbecomes unstable. Thus, we artificially generate a symmetric set of brightnesswith respect to the light source, and apply the least square fitting to the combinedset of measured and the artificially generated brightness values.
3.4 Extraction Procedure
Image brightness at each pixel under the extended light source i can be representedusing the system parameters as:
lf(llA', B) = A'(S, N R + Etab) + B'(L'(§S,Nl) + Epc) + Ef (12)
Here, the device characteristic parameters, Eta,, Ep,,, E&f, the light source di-rection ,5. and the light source brightness for the pure Lambertian surface, A.'.are given by the previous calibration procedure. The number of the light sourcesis 36. Namely, i 1,. 36
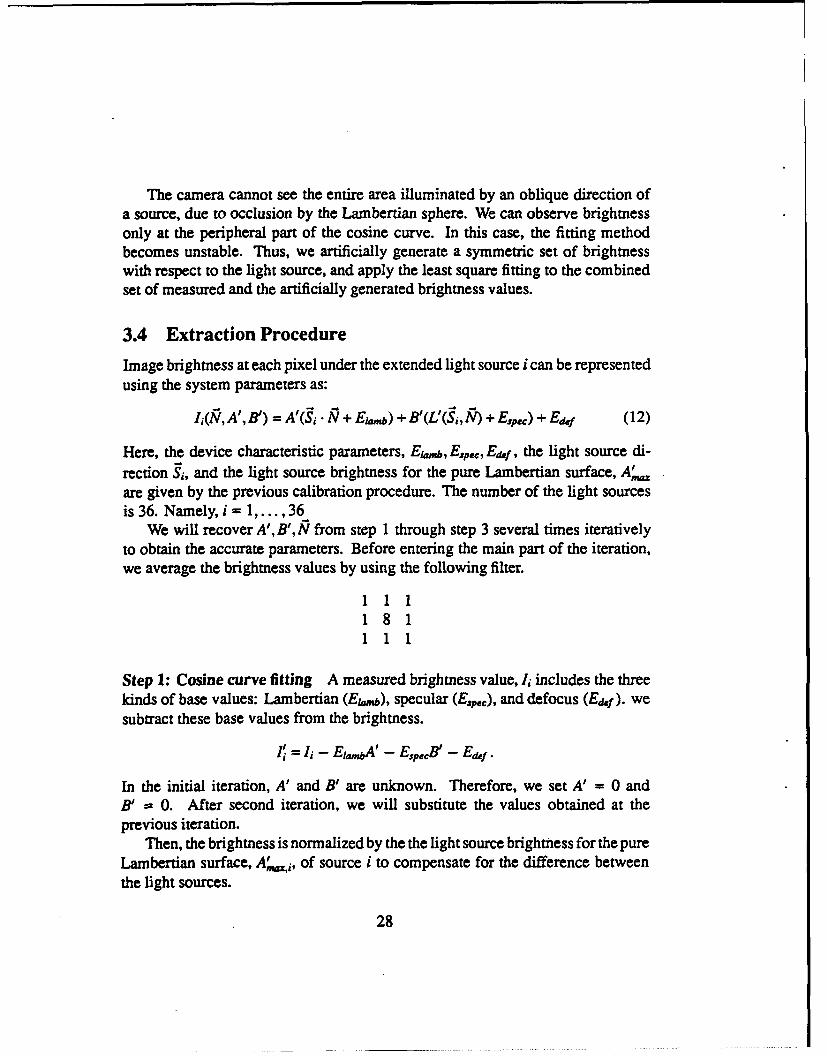
We will recover A', B', N from step 1 through step 3 several times iterativelyto obtain the accurate parameters. Before entering the main part of the iteration,we average the brightness values by using the following filter.
1 8 11811 1 1
Step 1: Cosine curve fitting A measured brightness value, 1i includes the threekinds of base values: Lambertian (Ew,,b,), specular (Ep,,), and defocus (Ef ). wesubtract these base values from the brightness.
1 = i - E .A' - EspEcB' - E,.
In the initial iteration, A' and B' are unknown. Therefore, we set A' = 0 andB' = 0. After second iteration, we will substitute the values obtained at theprevious iteration.
Then, the brightness is normalized by the the light source brightness for the pureLambertian surface, A',, of source i to compensate for the difference betweenthe light sources.
28
Brightness values larger than a thresh'nld (0.05) are considered as valid mea-surements and are used for fitting. This is because the actual photometric functionof Lambertian surfaces does not follow a cosine curve in the peripheral area. Ifthe number of valid measurements is larger than a threshold (currently, sevenincluding the light sources on the specular triangle), the results of the fitting areregarded as valid and the surface orientation, N,,, and the Lambertian strength,A', are obtained. If not, the Lambertian component is considered not to exist.
Step 2: Specular triangle determination We subtract the base value and theLambertian brightness values, extracted in the former step, from the measuredbrightness. We obtain the specular brightness as follows:
P~i' = 1i -- A~i - Rlla.b -- A'gEamb - E,,If.
Theoretically, three source directions, giving three largest specular brightnessvalues, form the specular triangle. However, when the specular source directionof a surface patch agrees with the light source direction, the second and thethird largest direction becomes unstable, and does not always belong to the sametriangle.
In order to compensate this instability, we use the following procedure. Weselect the two largest brightness directions among the specular brightness, (I', i =1, ... , 36). Usually, the two light sources of the largest values are adjacent witheach other. In this case, the common edge of the sources belongs to two triangles.We will choose the one having the larger brightness at the third vertex, and formthe specular triangle.
Sometimes, the two light sources giving maximum values are not adjacentwith each , -her. In this case, we will pick the largest direction and search the nextlargest direction among the adjacent directions around it. We will form a commonedge by the largest and the direction found in the previous search. Then, we willfind the specular triangle among two triangles which shares the common edge.
Step 3: Table lookup The previous procedure gives the specular triangle, i.e.three specular brightness values, I1, -,,Is. In order to refer to the lookup table,we will normalize the specular brightness as
" 11 k2- 1 9
-6 1
29
where k represents the total mesh number of an axis of the lookup table.Using the normalized brightness, we can refer to the lookup table. In order to
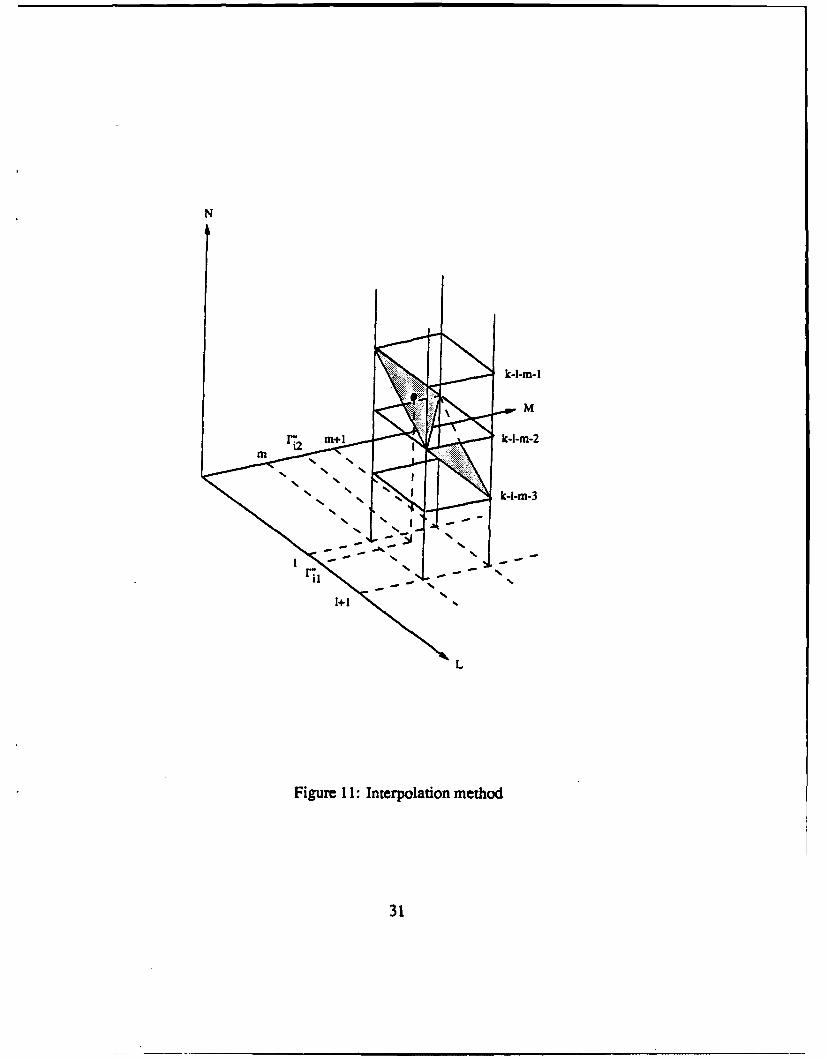
obtain accurate orientation, we will use the following interpolation method.The first step generates 4 sets of indices around fi", IP", Pi":
(1+l,m,k-2-l-m),
(l,m + l,k -2- 1-rm),
(1+ l,m+ l,k- 3-1-m)
where= [I=14, m = [Ix'] and 1, = IF•' - 1, m, = IP' - m. See Figure 11.The second step actually refers to the table using these indices. However, since
some of the referred cells in the table may not contain orientation information, wewill execute the following interpolation procedure.
"* Case 1: When three or four cells, that are pointed to by the indices, containorientations, interpolate between them by using the residue, i,, j,.
"* Case 2: When one or two cells, pointed to by the indices, contain orienta-tions, use those values without interpolation.
"* Case 3: When none of the cells contains an orientation, send the failuresignal.
Case 1 and 2 provide surface orientation, Npc. By using this orientation, wecalculate the specular source direction, S,(N) of the orientation. Then, we find thenearest light source direction Si from this direction, §.(Nr). Substituting the sourceand specular direction in Eq. 10 gives the theoretical brightness. The specularalbedo B' is determined as the ratio of the measured specular and the theoreticalbrightness.
30
N
M
1" +1 -m2
L
Figure 11: Interpolation method
31
4 Experimental Results
This section describes experiments conducted to evaluate the performance of thephotosampling method. As explained. previously, the method can extract shape andreflectance of Lambertian, specular, and hybrid surfaces. In order to evaluate theaccuracy of the method, first, we measure three kinds of spherical surfaces, knownshape and known reflectance: Lambertian, specular, and hybrid surfaces. Then,we applied the method to other interesting surfaces to demonstrate the feasibilityof the method in practical applications as well as to investigate its limitations.
4.1 Specular spherical surface
Figure 12 shows a 0.5 inch diameter specular ball and its 36 images obtained usingthe photo-sampling device. By applying the extraction procedure to these images,we obtain the Lambertian strength as shown in Figure 13(a) and the specularstrength as shown in Figure 13(b). The surface orientation distribution is obtainedas shown in Figure 14(a), where a small needle depicts the orientation at thatpixel. The detected error of the surface normals along the X axis is shown in theFigure 14(c). We find that the errors are less than 1 degree in the central region ofthe ball.
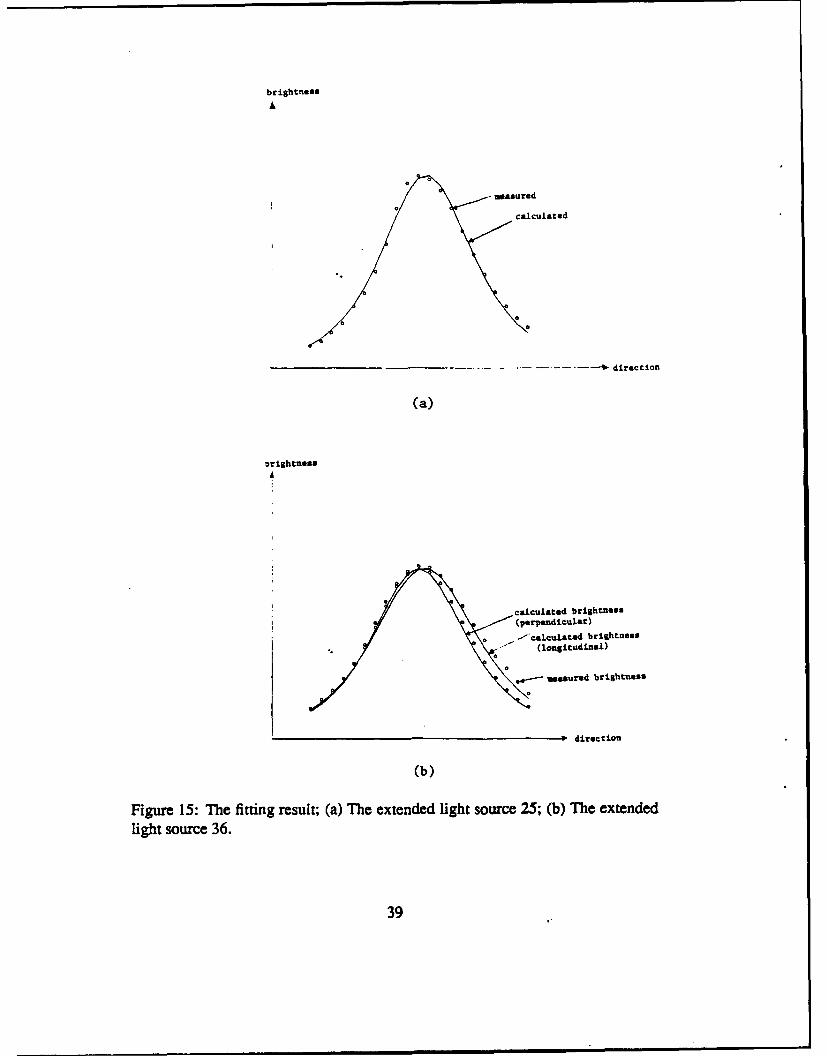
Figure 14(b) shows the distribution of the errors in computed surface orienta-tions. The figure indicates that the peripheral area has larger error than the centralarea. This tendency can be explained by the discrepancy of the actual brightnessdistribution of a light source from the theoretical one. Figure 15(a) and 15(b)shows the fitting results of the 25th light, which is located in the horizontal direc-tion, and the 36th light, which has the maxmum angle with respect to the camera,as the examples of the fitting results at the peripheral area. The actual brightnessdistribution has larger discrepancy from the theoretical one in the longitudinaldirection than the perpendicular direction as shown in the Figure 15.
The brightness in a pixel measured by a TV camera is the resu! of the inte-gration of those over the corresponding area on the diffuser. On the other hand,the theoretical brightness is defined as multiplication of the pixel area with thoseat the center direction of the pixel. The variance in surface orientations within apixel becomes larger in the circumference of the ball; thus the variance in bright-ness within a pixel increases in the circumference of the ball. A larger brightnessvariance causes more departure of the integrated brightness from those given bymultiplication of the pixel area with those at the center of the pixel. This departure
32
causes a relatively larger error at the circumference. If the tables for specularsurfaces are made directly from the brightness of the specular ball images, theaccuracy will be improved.
We can also observe the systematic error distribution over the ball correspond-ing to the tessellations. The accuracy of an obtained surface orientation is relatedto the gradient of a brightness distribution function of an extended light source.A steeper portion of the function gives a more accurate orientation. The gradientof the source distribution function is not constant over a triangle. It becomes rel-atively flat around the peripheral area of a triangle. Consequently, errors increasein that region.
Therefore, it is desirable for the function to have a steep gradient at theperipheral area of a triangle. In order to achieve this condition, we should havea larger a than the width of a triangle. In other words, the distance betweenthe light sources and the diffuser should be wider than those given by the designspecification in Eq. 8.
4.2 Lambertian spherical surface
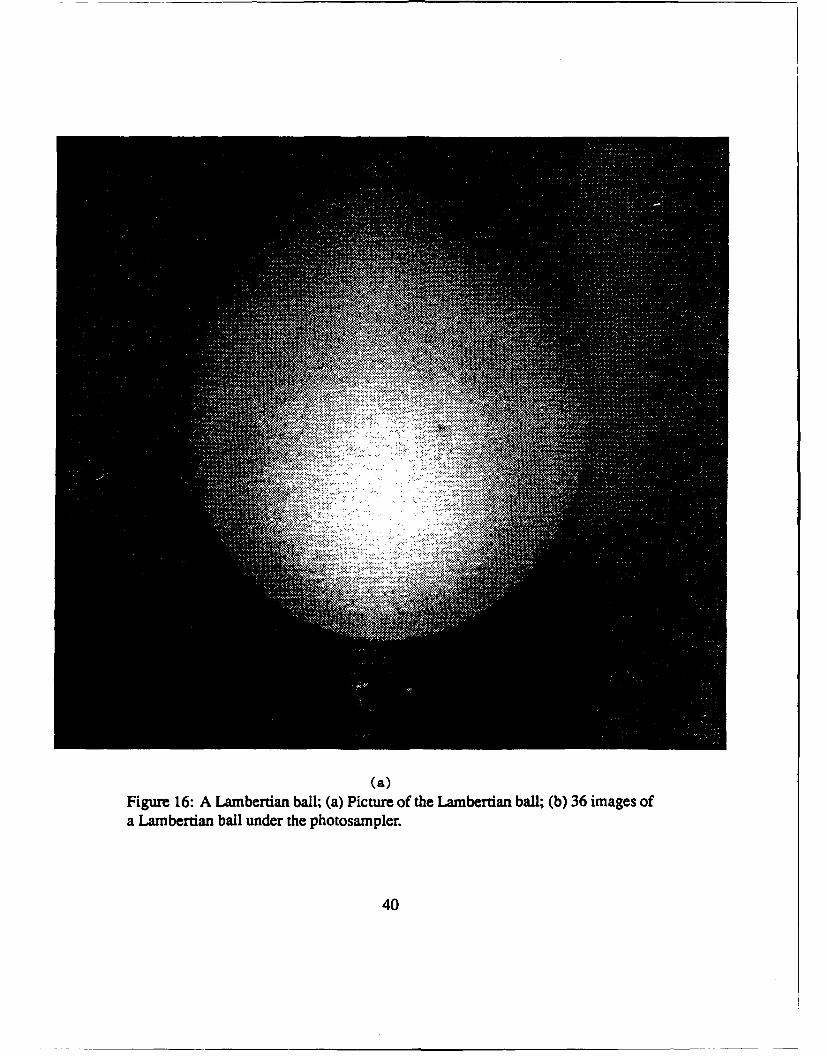
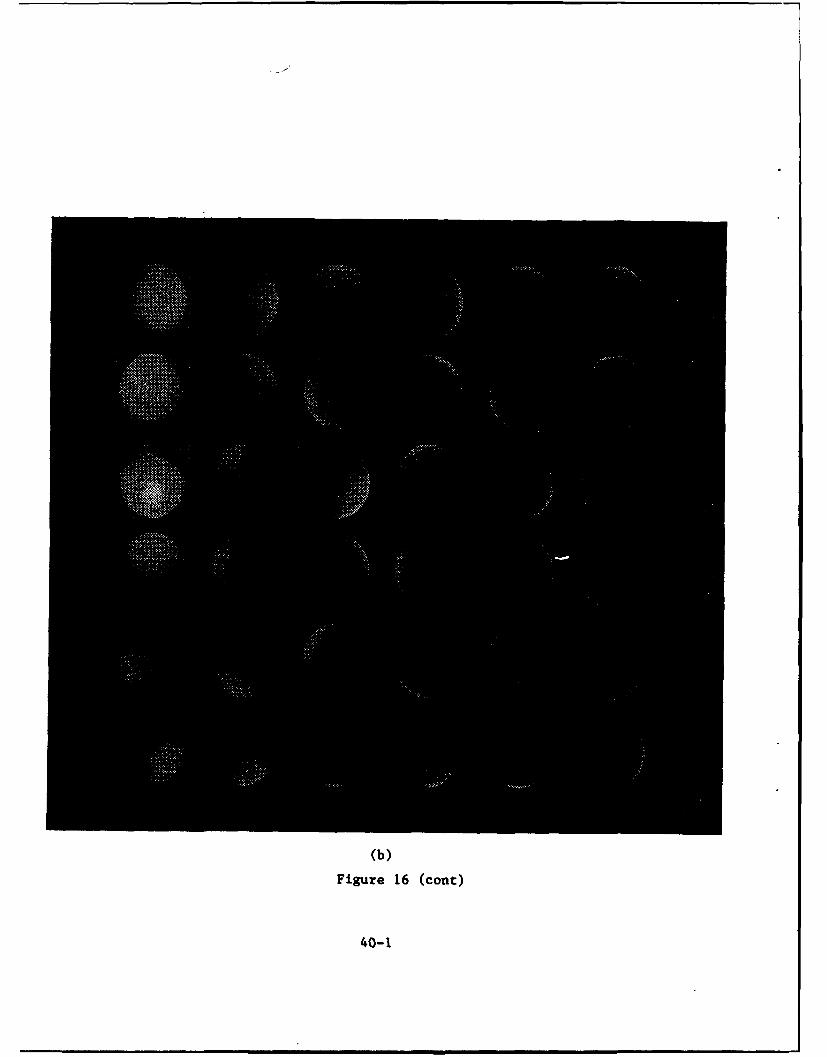
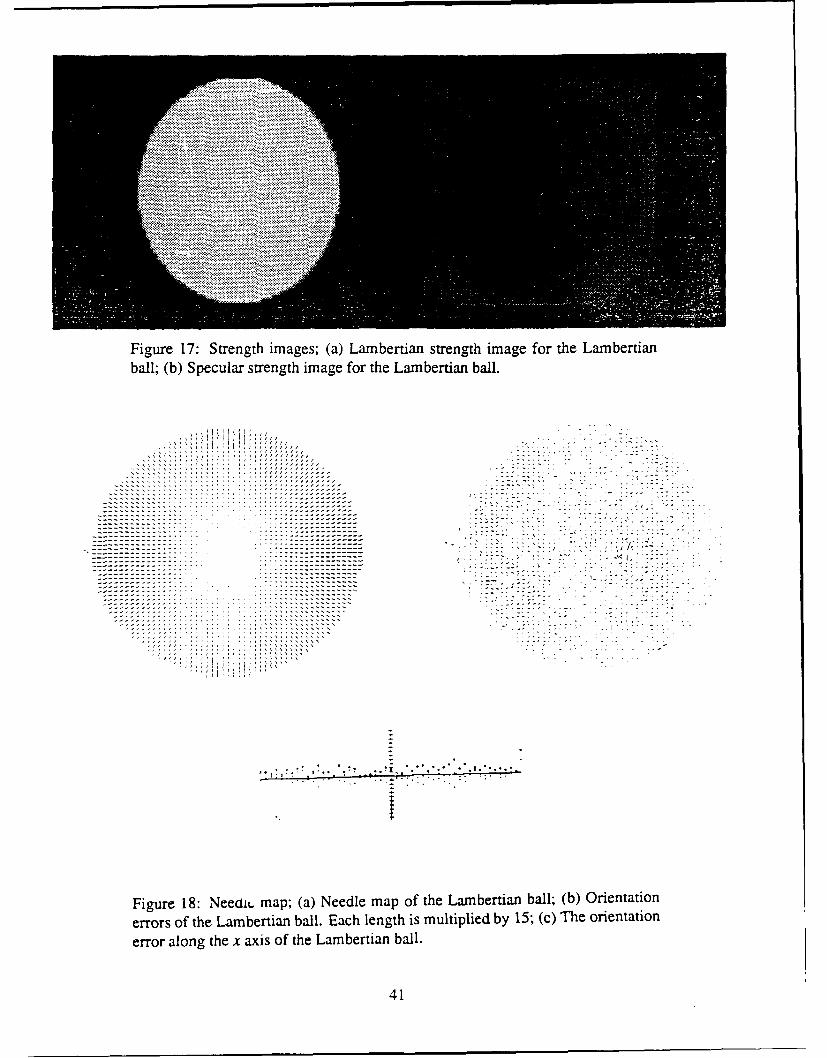
Figure 16 shows a 0.5 inch diameter matt-white painted Lambertian ball andits 36 images taken under our device. Figure 17(a) represents the Lambertianstrength, and Figure 17(b) represents the specular strength. Figure 18(a) showsthe orientation distribution depicted as a needle map.
Figure 18(b) shows the error distributions over the sphere. Figure 18(c) showsthe error distributions along x axis. The average error is 2% and the maxmum erroris 3.5%. We can conclude that the Lambertian ball has larger errors in obtainedorientations. This is because the cosine curve, the photometric function of aLambertian surface, has more flat gradient than that for a pure specular surface.
In addition, the maxmum brightness of Lambertian surfaces is about only20% of those of specular surfaces. Although we use extended light sources todetect both specular and Lambertian surfaces with the same order of brightness, toequate the maxmum brightness of Lambertian surface to those of specular surfacesrequires that the termination angle be larger than 900. Thus, we cannot realizesuch large termination angles5 .
51t is still reasonable to make Lambertian surfaces darker than specular surfaces because the
Lambertian components are extracted from more data than specular comnonents by using the leastmean square fitting method which is stable with noise.
33
4.3 Hybrid spherical surface
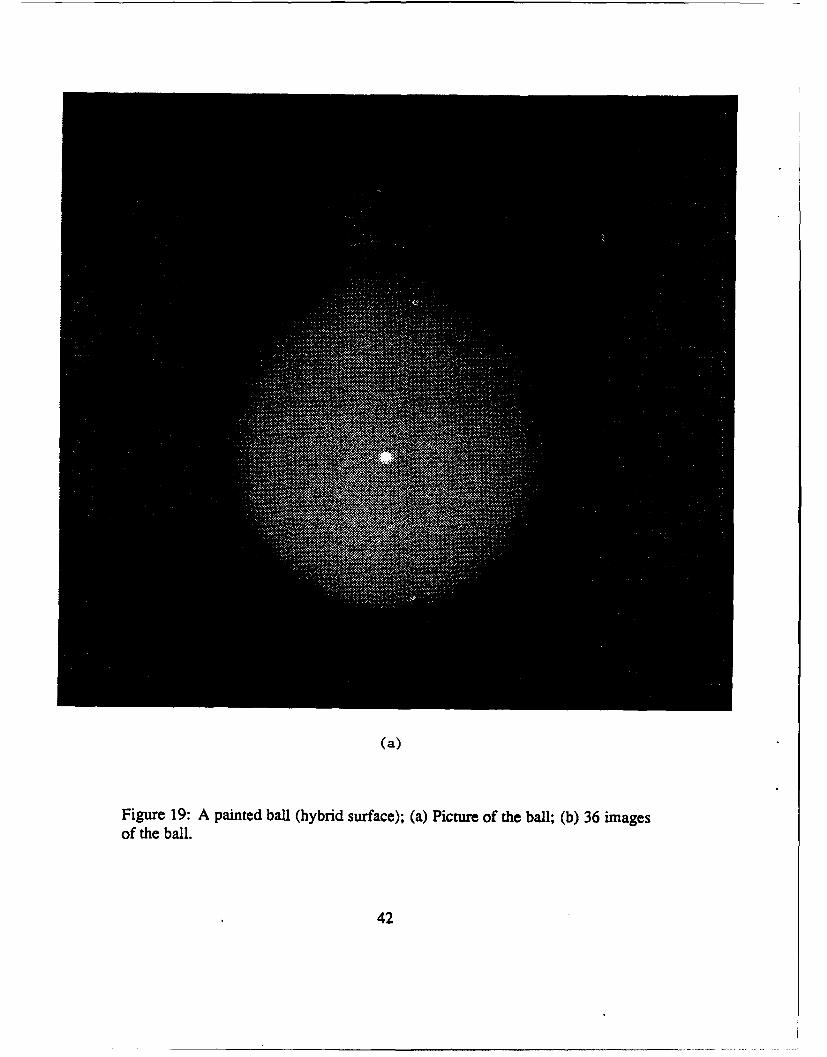
Examples of the hybrid surfaces include smooth plastic and glossy painted sur-faces. To examine the system performance on such hybrid surfaces, we use aglossy painted ball in this experiment. Figure 19 shows a 0.5 inch diameter glossypainted ball and its 36 images. Figure 20(a) and Figure 20(b) represent the Lamber-tian and specular strength, reepectively. Figure 21(a) shows the needle map of theextracted surface normals. F pure 21 (b) and Figure 21 (c) depict error distributionsin surface orientation of an entire sphere and along the x-axis, respectively.
4.4 Industrial object surface: Dip Switch
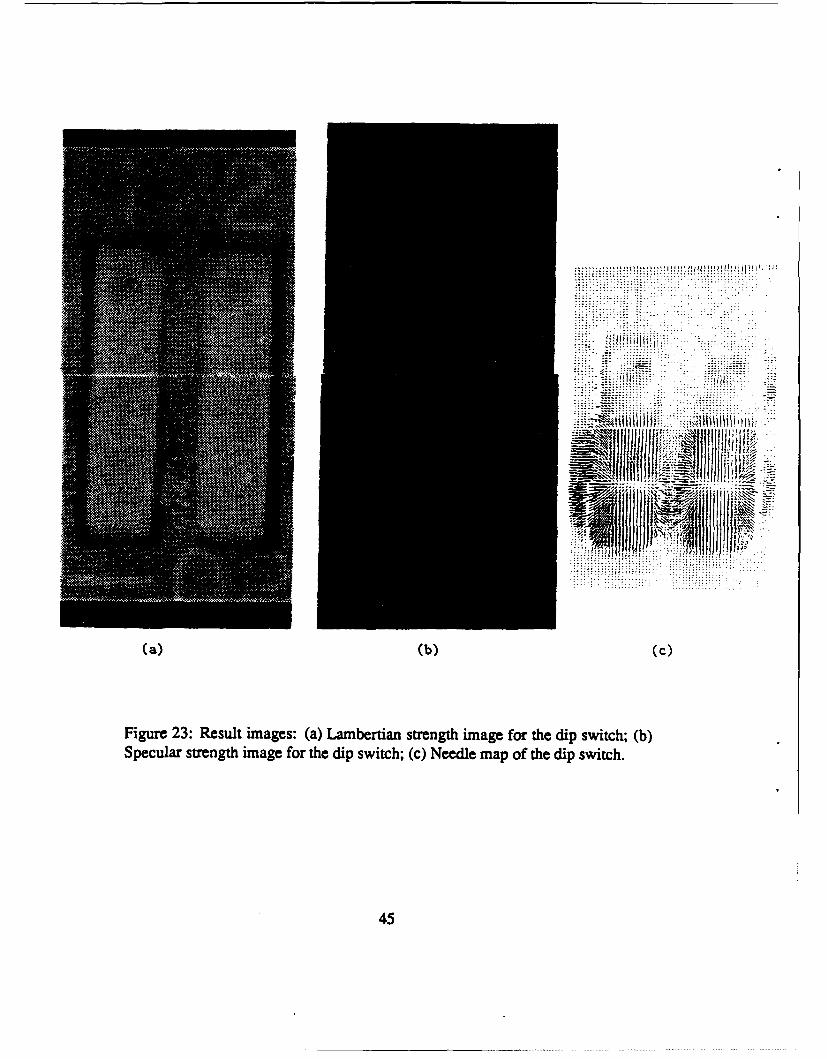
A dip switch, shown in Figure 22, is an example of the plastic object with acomplicated shape. Figure 23(a) shows the Lambertian strength, Figure 23(b)shows the specular strength. As we expected, the system successfully obtainedconstant Lambertian strength distribution over the complicated shape. Althoughthe switch has two different albedo areas, the distribution of the surface normals,depicted as the needle map in Figure 23(c), is seen not to be influenced by thisalbedo variation. However, concave and side areas are not detected correctly dueto the occlusion. For example, the small circular concave on the switch is extractedwith smaller albedo than actual, while the adjacent part to the switch is detectedwith inaccurate surface normal.
4.5 Solder Joint
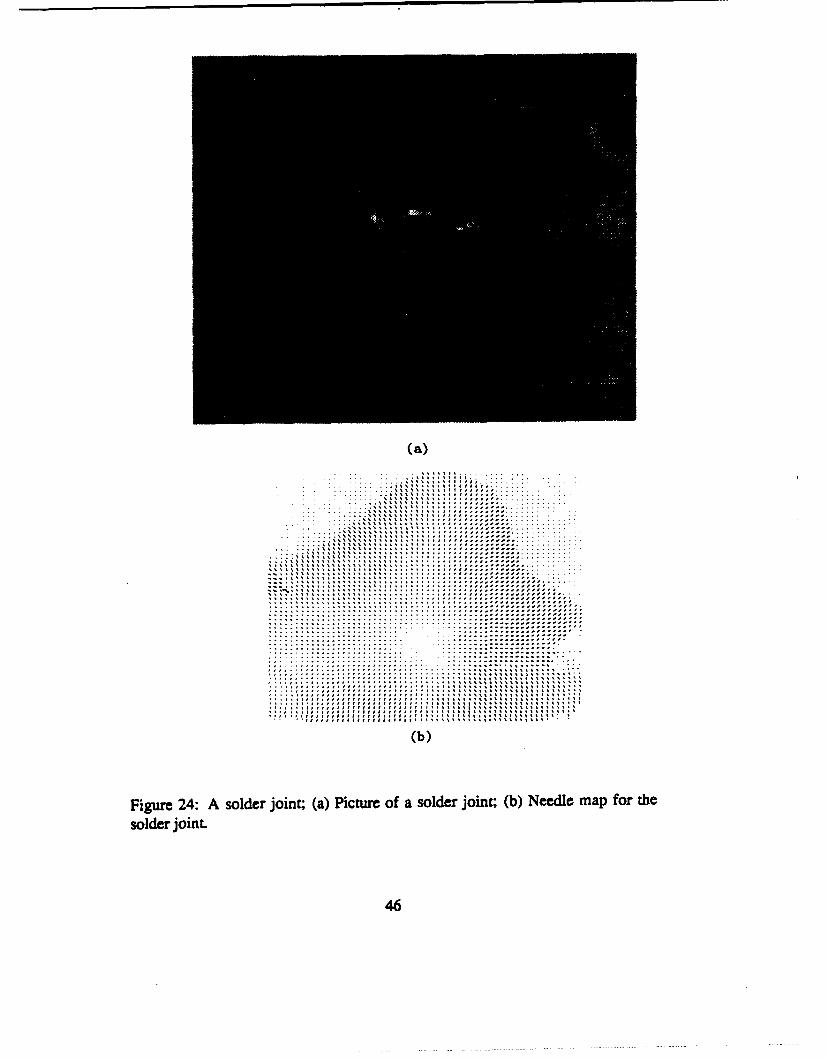
Figure 24(a) shows a solder joint. Figure 24(b) shows the needle map of thesurface normals.
4.6 Transparent surface
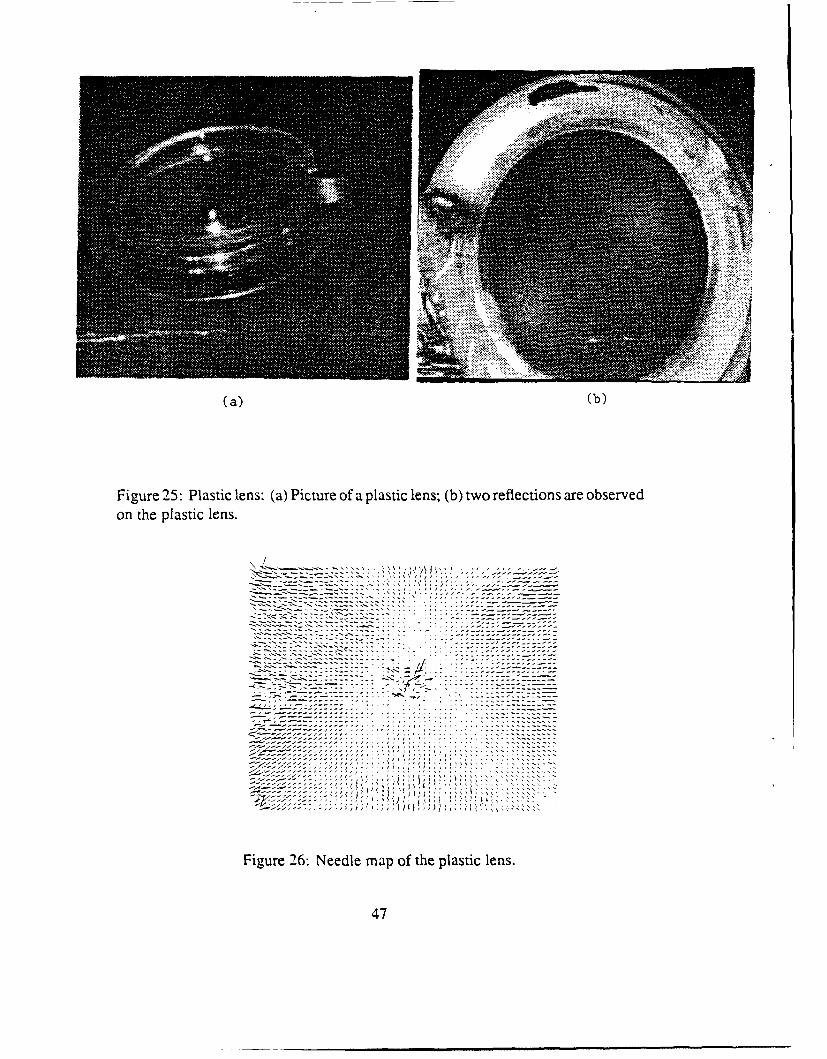
Transparent objects do not have a Lambertian component, but do have a specularcomponent. As an example of a transparent surface, we have used the surface ofa plastic lens as shown in Figure 25(a)
The plastic lens causes double reflections; a light ray hits the surface fromthe air to the plastic lens and a penetrated light ray hits the back surface from theplastic to the air. Figure 15(b) contains such double reflections.
34

In order to measure the only front reflection, we paint the lower surface withdull black spray. Figure 26 shows the result. Here, the length of each needle ismultiplied by 5 times. The errors at the center is due to the hole of TV camera.
35
5 Conclusions
This paper describes a three-dimensional photometric sampling method to de-termine shape and reflectance of glossy surfaces by measuring image brightnessunder various light source directions and viewing from a single direction.
Extended light sources make it possible to ensure the detection of both Lamber-tian and specular reflections. We have distributed 36 light sources on the vertices ofa one frequency icosahedron circumscribing a diffused sphere to generate evenlydistributed extended light sources.
An extraction algorithm uses the set of image brightness values measuredat each surface point in order to compute orientation as well as the strengthsof the Lambertian and specular reflection components. In order to increase theaccuracy in measured orientations and reflectance parameters, we have developeda calibration method to overcome the the difference between the theoretical andthe actual distribution of extended source brightness.
The experimentalresults forLambertian surfaces, specular surfaces, and hybridsurfaces show high accuracy in both orientations and reflectance parameters. Wehave demonstrated the ability of our system to detect surface orientations andreflectance parameter variations on a plastic and transparent surfaces, as well.
Acknowledgements
Takeo Kanade provided many useful comments and encouragements. Mark De-Louis built the experimental apparatus. Fredric Solomon proofread drafts of thispaper and provided many useful comments which have improved the readability ofthis paper. The authors also thank Yoshimasa Fujiwara for his valuable commentsand Ye Mei for drawing several figures.
This research was conducted in the Task-oriented Vision Laboratory, Visionand Autonomous Center, the Robotics Institute, Carnegie Mellon University. Im-age Understanding Research in the TVL is supported in part by the Westing-house Electric Corporation and in part by the Defense Advanced Research ProjectAgency, DOD, through ARPA order No. 4976, and monitored by the Air ForceAvionics Laboratory under contract F33615-87-C-1499. Hideichi Sato was onleave of absence from Komatsu Ltd., Kanagawa, Japan.
36
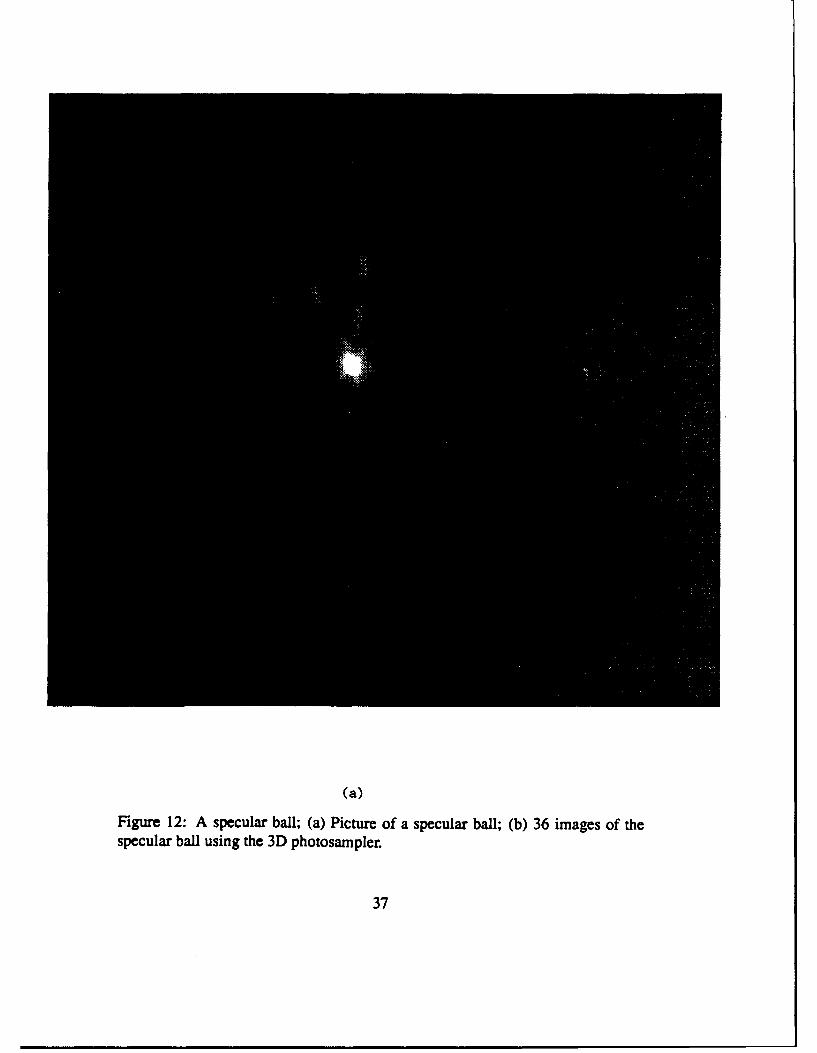
(a)
Figure 12: A specular ball; (a) Picture of a specular ball; (b) 36 images of thespecular ball using the 3D photosampler.
37
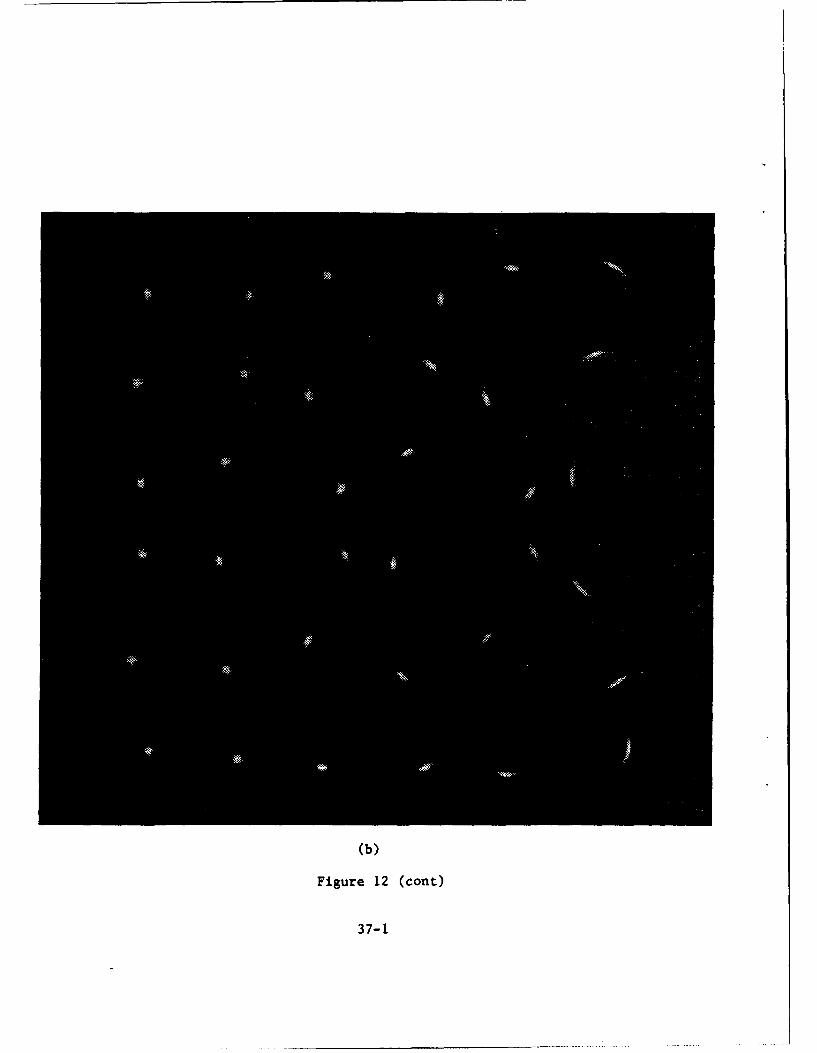
(b)
Figure 12 (cont)
37-1
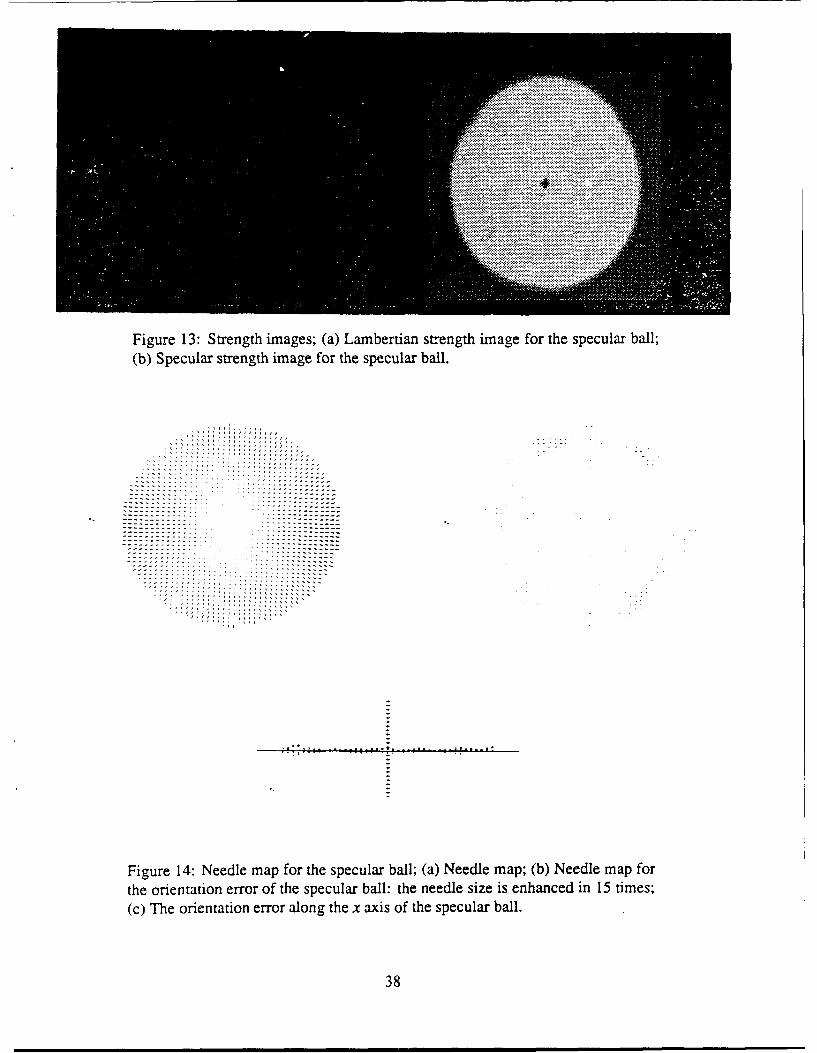
Figure 13: Strength images; (a) Lambertian strength image for the specular ball;(b) Specular strength image for the specular ball.
:=:2:2::2:..... ....::: : :2 :
Figure 14: Needle map for the specular ball; (a) Needle map; (b) Needle map forthe orientation error of the specular ball: the needle size is enhanced in 15 times;(c) The orientation error along the x axis of the specular bail.
38
brightness
ameasured
ces calculated
... . . . • direction
(a)
*rightnessA
calculated brightness(perpendicular)
-"calculated brightnessO- (longitudinal)
- measured brightness
0 direction
(b)
Figure 15: The fitting result; (a) The extended light source 25; (b) The extendedlight source 36.
39
i"A
(a)..........
Figure 16: A Lambertian ball; (a) Picture of the Lambertian ball; (b) 36 images ofa Laxnbertian ball under the photosainpler.
40
(b)
Figure 16 (cant)
40-1
__ - .1 ..... .......
S'•ma• _.• .... Jr_ •,•" .- • .. ~ ....• .... "---..L.-•- • ,, -•
Figure 17: Strength images; (a) Lambertian strength image for the Lambertian
ball; (b) Specular strength image for the Lambertian ball.
. . ......... ........ .. ._,. *.
. . . .. . . ..-.--
S. .. . . . . . . . . ... , . ... .: 2 - . . .. . . .
.. z
Figure 18: NeecliL map; (a) Needle map of the Lambertian ball; (b) Orientation
errors of the Lambertian ball. Each length is multiplied by 15; (c) The orientation
error along the x axis of the Lambertian ball.
41
(a)
Figure 19: A painted ball (hybrid surface); (a) Picture of the ball; (b) 36 imagesof the ball.
42
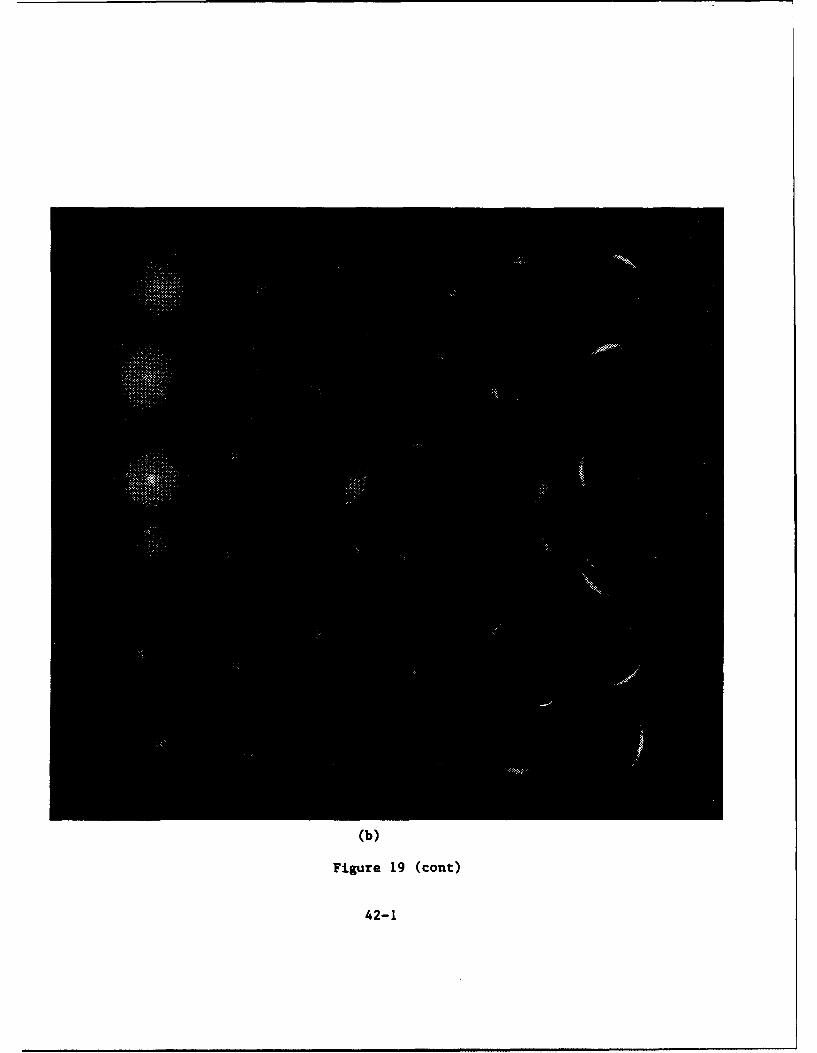
(b)
Figure 19 (cant)
42-1
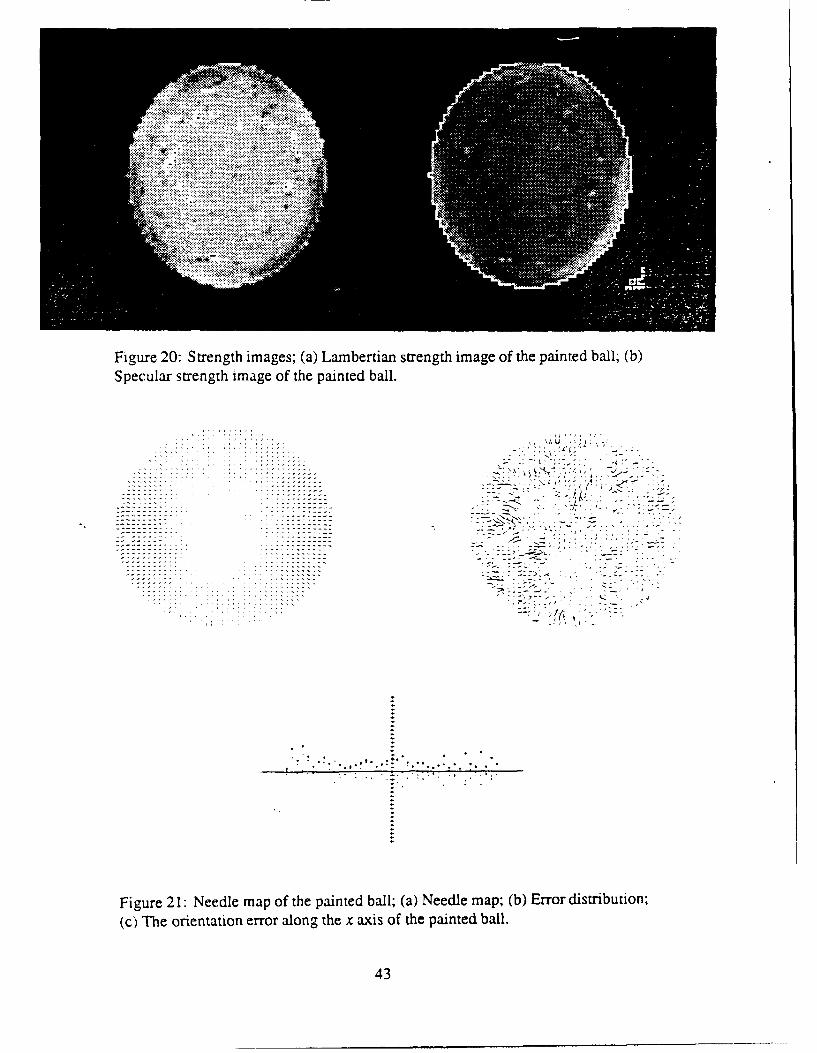
Figure 20: Strength images; (a) Lanmbertian strength image of the painted ball; (b)Specular strength image of the painted ball.
....... .' ;,
.:: : : : .. . .. .. ...-...... "....: 4 • '' :;
_ -. ........ . . -.. ..-.. ... . .
C -I
... ...... ...... .... .. •
- - - -- - - - -. . . . . . .
Figure 21: Needle map of the painted ball; (a) Needle map; (b) Error distribution;(c) The orientation error along the x axis of the painted ball.
43
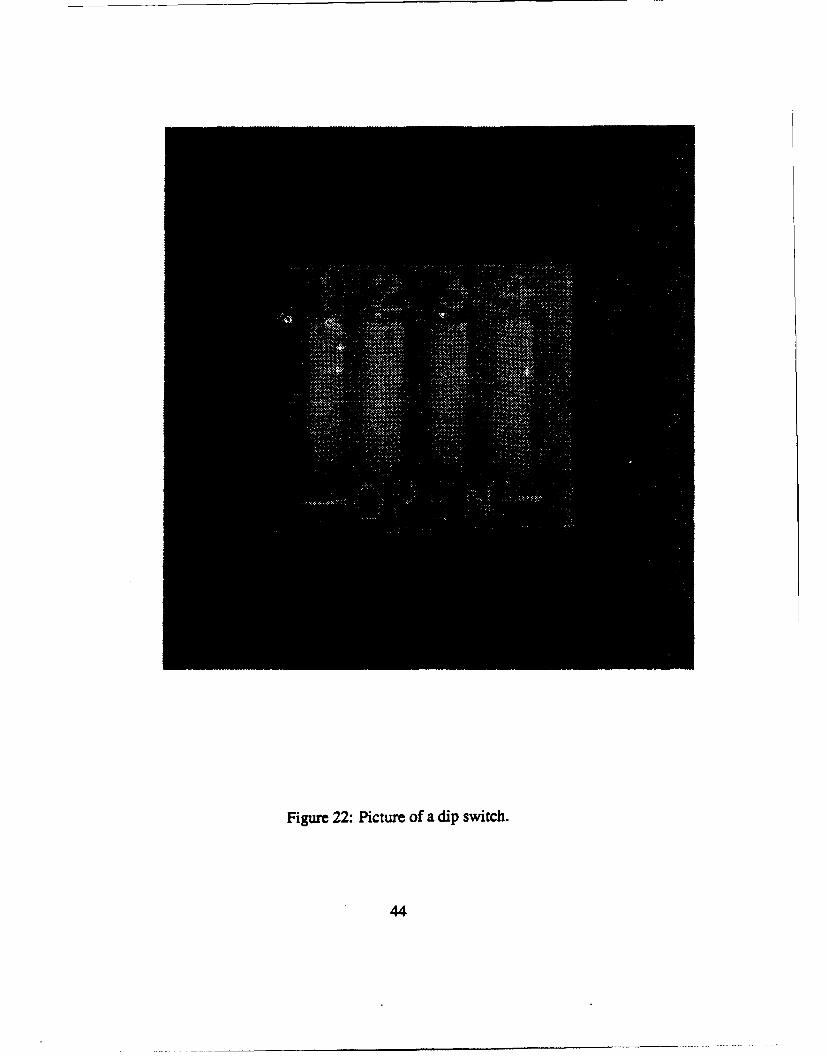
Figure 22: Picture of a dip switch.
44
i...........
z zz zi : • ! i Z .• : . .: : . ........u , . . 1•... J
•h~iii.L~iH :•£ f": o - :! 1 • { ::
RI:
::• : { •:• H ' {iii:: :i ".. .. ... i "....
* llitII { ll*'l
(a) (b) (c)
Figure 23: Result images: (a) Lambertian strength image for the dip switch; (b)Specular strength image for the dip switch; (c) Needle map of the dip switch.
45
(a)
.... ..... .. . . ....... .... .... .................. . . .
....... ............"'• 'I I. .. i .....%... %1. 11 . . : ...... : .. .. I I ....": .: ": '. .
:: :: : : :: : :: :: :: : .: . . . . . .. . . . . . . . . . . .
~~~~~~~ ... , , , , , , , , , . . .. .. .. .. . .. . , , , ,, ,
(b)
Figure 24: A solder joint; (a) Picture of a solder joinT. (b) Needile map for the
solder joint.
46
!MM
(a) (b)
Figure 25: Plastic lens: (a) Picture of a plastic lens; (b) two reflections are observedon the plastic lens.
.•-•.• .•_ • '• :,'.• " ...•'•, • " ...... ...
) V
.- .._ ...--.. ....... . . -' . . . ., . . . _
Figure 26: Needle map of the plastic lens.
47
References
[1] C. Brown. Fast display of well-tessellated surfaces. Computer and Graphics,4(4):77-85, April 1979.
[2] E.N. Coleman and Jain. R. Obtaining 3-dimensional shape of textured andspecular surface using four-source photometry. Computer Graphics andImage Processing, 18(4):309-328, 1982.
[3] G. Healey and T.O. Binford. Local shape from specularity. Computer Vision,Graphics, and Image Processing, 42:62-86, 1988.
[4] B.K.P. Horn. Obaining shape from shading. In PH. Winston, editor, ThePsychology of Computer Vision, pages 115-155. McGraw-Hill, New York,1975.
[5] K. Ikeuchi. Determining surface orientation of specular surfaces by usingthe photometric stereo method. IEEE Trans. Pattern Analysis and MachineIntelligence, PAMI-3(6):661-669, November 1981.
[6] K. Ikeuchi. Recognition of 3-d objects using the extended gaussian image.In International Joint Conf. on Artificial Intelligence, pages 595-600, 198 1.
[7] K. Ikeuchi and K. Sato. Determining reflectance parameters using range andbrightness images. In Proc. of Intern. Conf. on Computer Vision, Osaka,JAPAN, December 1990. a longer version is avaiable as CMU-CS-90-106.
[8] G.J. Klinker, S.A. Shafer, and T. Kanade. The measurement of highlights incolor image. Intern. Journal of Computer Vision, 2(l), 1988.
[9] S.K. Nayar, K. Ikeuchi, and T. Kanade. Extracting shape and reflectance oflambertian, specular, and hybrid surfaces. Technical Report CMU-RI-TR-88-14, Carnegie Mellon University, Robotics Institute, August 1988.
[10] S.K. Nayar, K. Ikeuchi, and T. Kanade. Surface reflection: physical andgeometrical perspectives. Technical Report CMU-RI-TR-89-7, CarnegieMellon University, Robotics Institute, March 1989.
[11] A.P. Pentland. Local shading analysis. IEEE Trans Pattern Analysis andMachine Intelligence, PAMI-6(2): 170-187, March 1984.
48
[12] A.C. Sanderson, L.E. Weiss, and S.K. Nayar. Structured highlight inspec-tion of specular surfaces. IEEE Trans. on Pattern Analysis and kf-chineIntelligence, 10(1):44-55, January 1988.
[13] MJ. Wenninger. Spherical Models. Cambridge Univ. Press, Cambridge,UK, 1979.
[14] L.B. Wolff. Spectral and polarization stereo methods using a single lightsource. In Proc. ofDARPA Image Understanding Workshop, pages 810-820.Science Application Inc., February 1987.
[15] L.B. Wolff. Using polarization to separate reflection components. In Proc.of IEEE Conf. on Computer Vision and Pattern Recognition, pages 363-369,1989.
[16] R.J. Woodham. Reflectance map techniques for analyzing surface defectsin metal castings. Technical Report AI-TR-457, Massachusetts Institute ofTechnology, Artificial Intelligence Laboratory, Cambridge, MA, 1978.
49