Embed Size (px)
Citation preview
Supported by
Energy saving concepts for the European ceramic industry
CERAMIN
Energy consumption figures of different ceramic branches
and EU-countries
The sole responsibility for the content of this publication lies with the authors. It does not necessarily reflect the opinion of the European Communities. The European Commission is not responsible for any use that may be made of the information contained therein.
Contract number
EIE/06/222/SI2.444565

EIE/06/222/SI2.444565 CERAMIN – Energy Consumption
2
1 Introduction
The objective of this report is to collect data about energy consumption of the EU
ceramic-industry and to identify the ceramic branches and sub-branches with the
highest energy consumption. For this report mainly the partner-countries of
CERAMIN
Poland, Germany, France, United Kingdom, Italy and Spain
are taken into consideration. For detailed data about each partner look
http://www.ceramin.eu/partners.htm.
Further countries (e.g. Netherlands, Austria and Portugal) will be considered as far
as data are available.
CERAMIN, the name of the project comes from ceramics and minimum. The name of
the proposed label is: EEE – which shall award Extraordinary Energy Efficient
ceramic products and production. The result of the report will be used to make
suggestions about the choice of the sub-branches considered for the EEE-Label.
2 Classification of ceramic sub-branches
The division of the ceramic branch into sub-branches refers mostly to BREF Ceramic
Manufacturing Industry, December 2006 (BREF.... Best available Techniques
REFerence document) as shown below :
1.5.1.1 Masonry bricks, lightweight bricks, (kiln temperature mostly < 1000 °C)
1.5.1.2 Facing bricks, paving bricks (kiln temperature mostly > 1050 °C)
1.5.1.3 Roofing tiles
BREF summarizes these sub-branches to
1.5.1 “Bricks and roof tiles”.
For the objectives of CERAMIN it is necessary to divide them into the above written
sub-branches. Sometimes when no divided data are available this class will be used
as sum.
EIE/06/222/SI2.444565 CERAMIN – Energy Consumption
3
1.5.2 Vitrified clay pipes
1.5.3 Refractory products
1.5.4 Expanded clay aggregates
1.5.5 Wall and floor tiles
1.5.6 Table- and ornamental ware (household ceramics)
1.5.7 Sanitary ware
1.5.8 Technical ceramics
1.5.9 Inorganic bounded abrasives
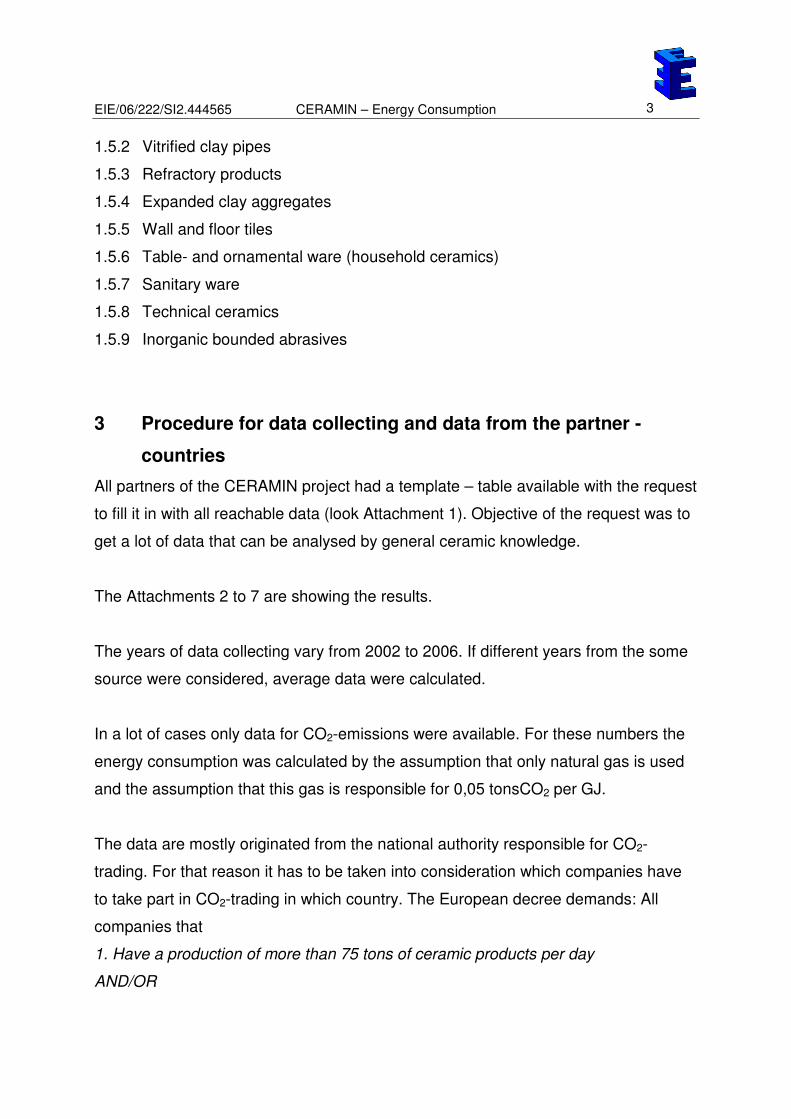
3 Procedure for data collecting and data from the partner -
countries
All partners of the CERAMIN project had a template – table available with the request
to fill it in with all reachable data (look Attachment 1). Objective of the request was to
get a lot of data that can be analysed by general ceramic knowledge.
The Attachments 2 to 7 are showing the results.
The years of data collecting vary from 2002 to 2006. If different years from the some
source were considered, average data were calculated.
In a lot of cases only data for CO2-emissions were available. For these numbers the
energy consumption was calculated by the assumption that only natural gas is used
and the assumption that this gas is responsible for 0,05 tonsCO2 per GJ.
The data are mostly originated from the national authority responsible for CO2-
trading. For that reason it has to be taken into consideration which companies have
to take part in CO2-trading in which country. The European decree demands: All
companies that
1. Have a production of more than 75 tons of ceramic products per day
AND/OR
EIE/06/222/SI2.444565 CERAMIN – Energy Consumption
4
2. Have a firing aggregate (kiln) with more than 4 cubic meters volume and have
more than 300 kg ceramic products per cubic meter.
have to take part in CO2-trading.
According to the AND/OR written in capitals different EU-countries have different
national rules for CO2-trading. These rules influence the number of companies (and
the data) reported by the respective country. In table 1 the four possibilities and the
rules of each country are listed if available. Possibility 2 is among these possibilities
the strongest one and possibility 1 the weakest.
Possibility 1 companies that fulfil item 1 AND 2 have to take part UK, I, PL
Possibility 2 companies that fulfil item 1 OR 2 have to take part F
Possibility 3 companies that fulfil item 1 have to take part
Possibility 4 companies that fulfil item 2 have to take part D
Table1: Different use of the European decree about CO2-trading in the partner -
countries
The classification of the companies from the general classification “Ceramics” to the
sub-branches defined in Chapter 2 was done by the knowledge of the respective
company, by checking their Internet site or by a personal phone call.
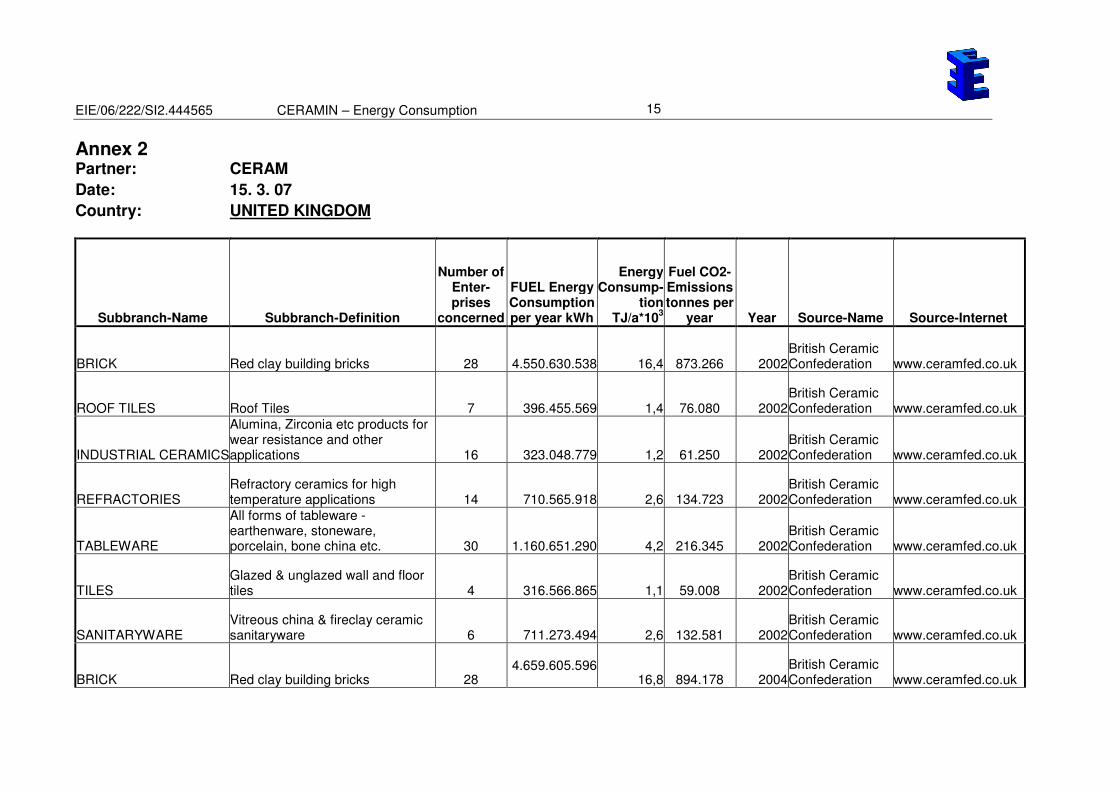
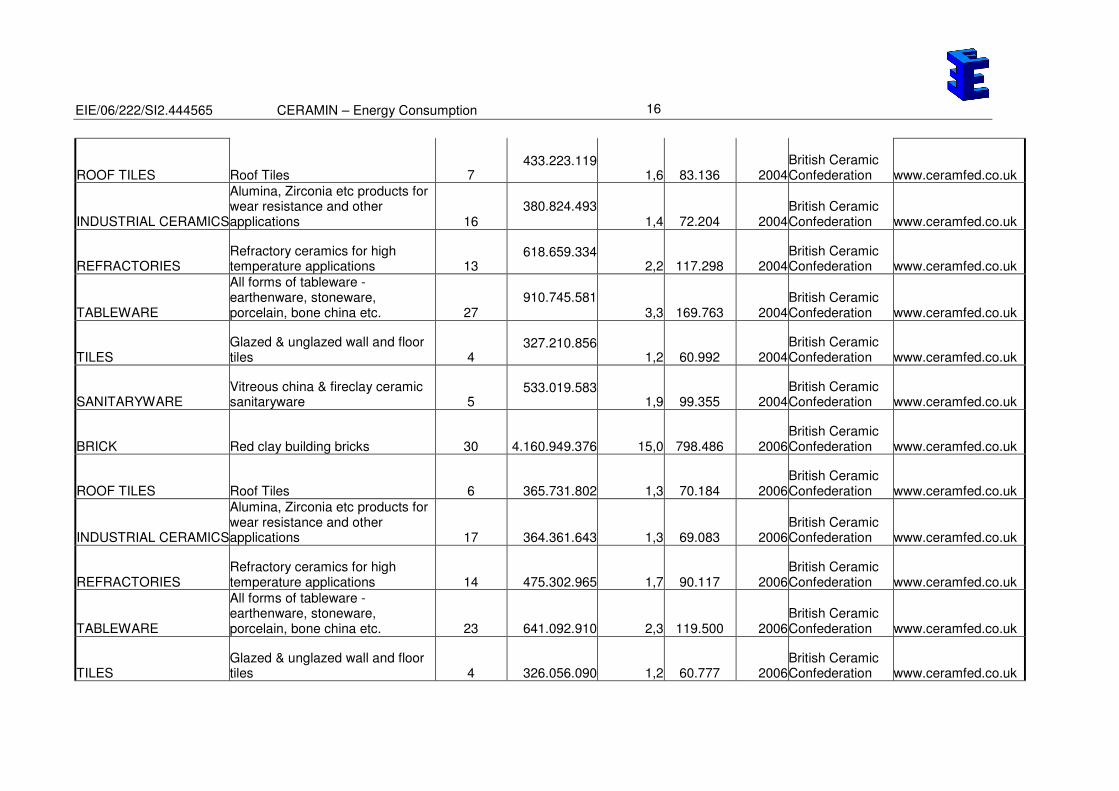
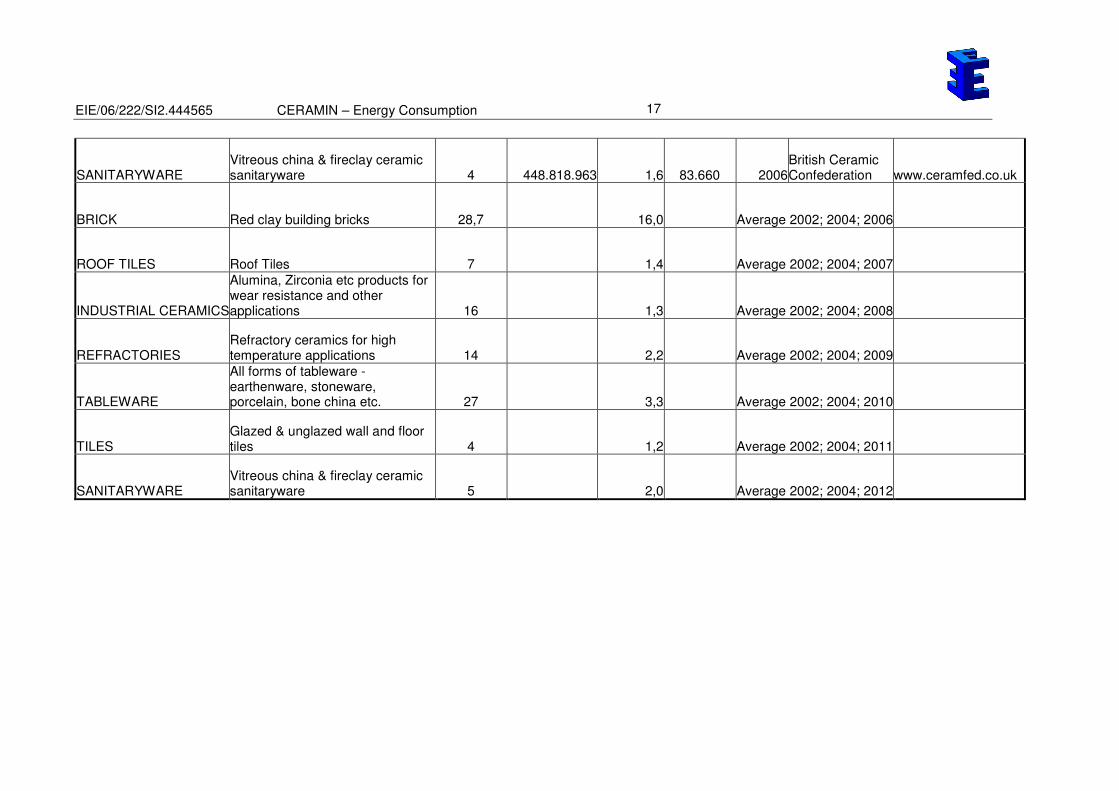
3.1 United Kingdom (Annex 2)
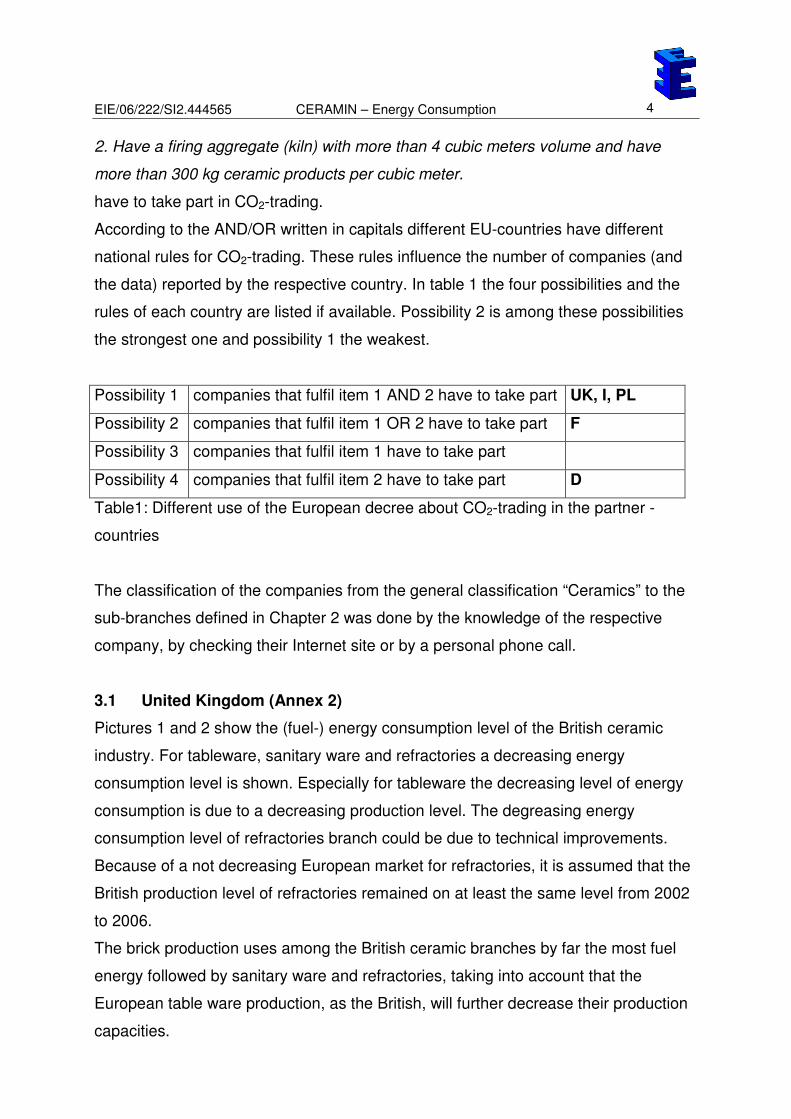
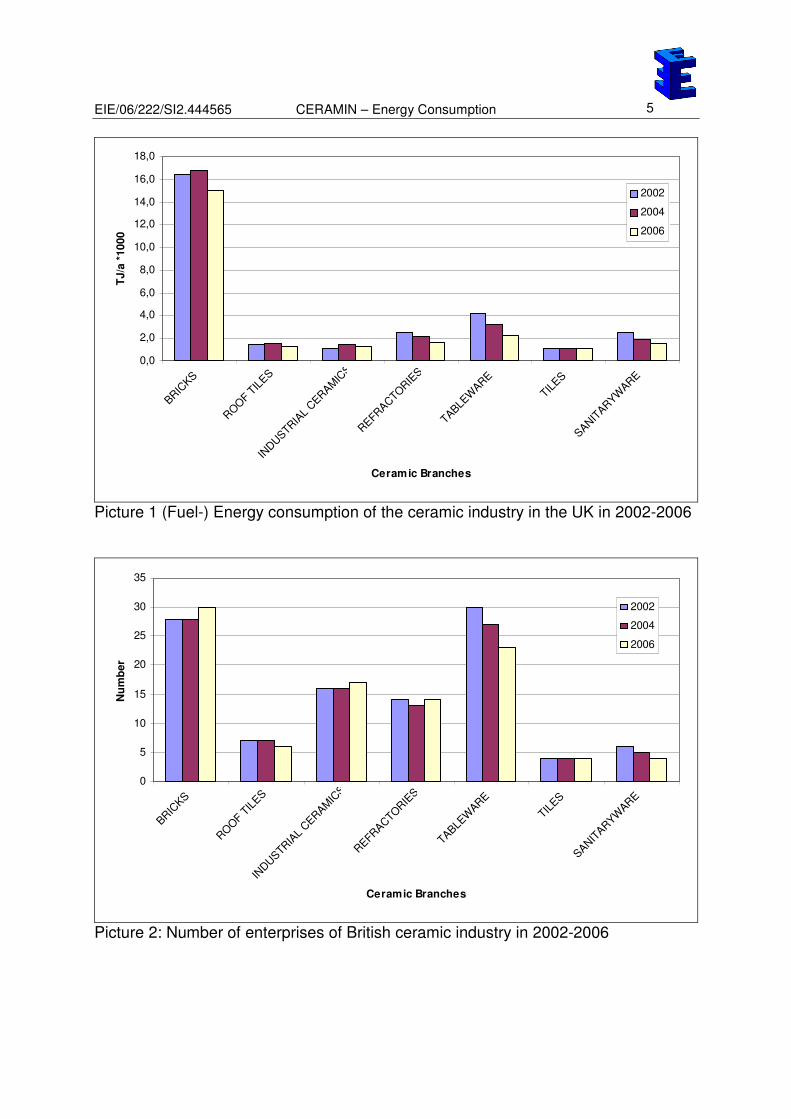
Pictures 1 and 2 show the (fuel-) energy consumption level of the British ceramic
industry. For tableware, sanitary ware and refractories a decreasing energy
consumption level is shown. Especially for tableware the decreasing level of energy
consumption is due to a decreasing production level. The degreasing energy
consumption level of refractories branch could be due to technical improvements.
Because of a not decreasing European market for refractories, it is assumed that the
British production level of refractories remained on at least the same level from 2002
to 2006.
The brick production uses among the British ceramic branches by far the most fuel
energy followed by sanitary ware and refractories, taking into account that the
European table ware production, as the British, will further decrease their production
capacities.
EIE/06/222/SI2.444565 CERAMIN – Energy Consumption
5
0,0
2,0
4,0
6,0
8,0
10,0
12,0
14,0
16,0
18,0
BRIC
KS
ROOF T
ILES
INDUSTR
IAL
CER
AM
ICS
REFR
ACTO
RIE
S
TABLE
WAR
E
TILES
SANIT
ARYW
ARE
Ceramic Branches
TJ/a
*1000
2002
2004
2006
Picture 1 (Fuel-) Energy consumption of the ceramic industry in the UK in 2002-2006
0
5
10
15
20
25
30
35
BRIC
KS
ROOF T
ILES
INDUSTR
IAL
CER
AM
ICS
REFR
ACTO
RIE
S
TABLE
WAR
E
TILES
SANIT
ARYW
ARE
Ceramic Branches
Nu
mb
er
2002
2004
2006
Picture 2: Number of enterprises of British ceramic industry in 2002-2006
EIE/06/222/SI2.444565 CERAMIN – Energy Consumption
6
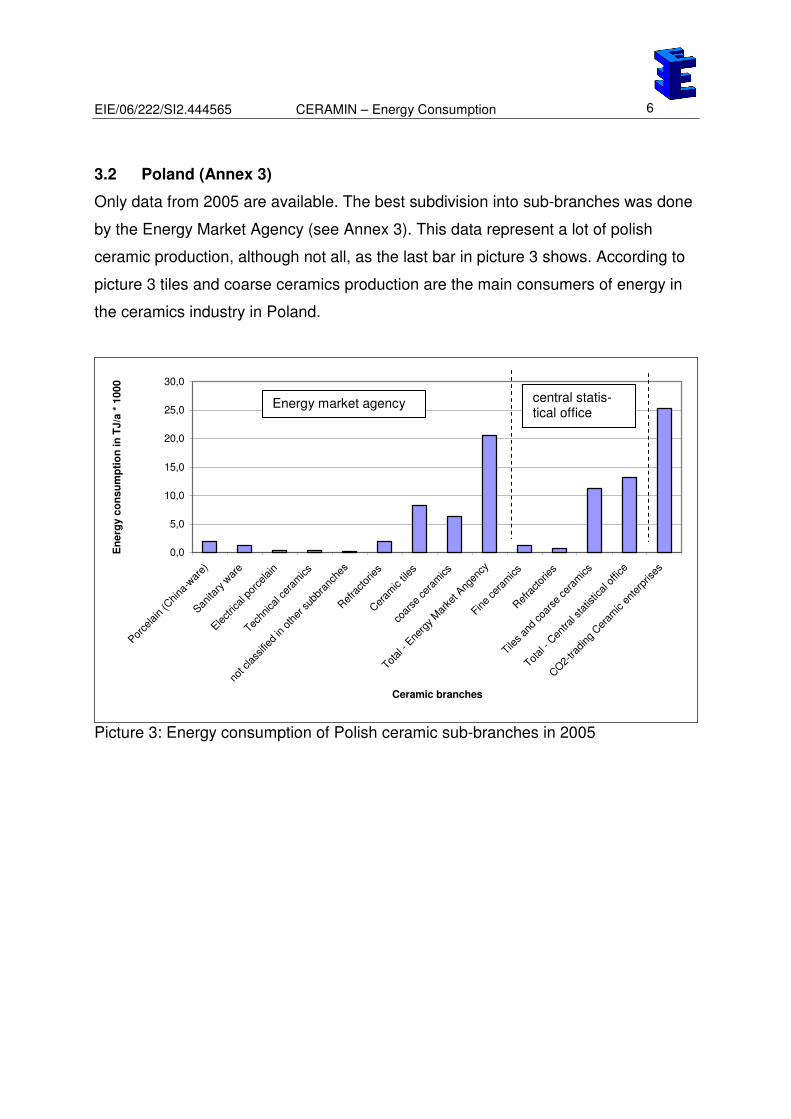
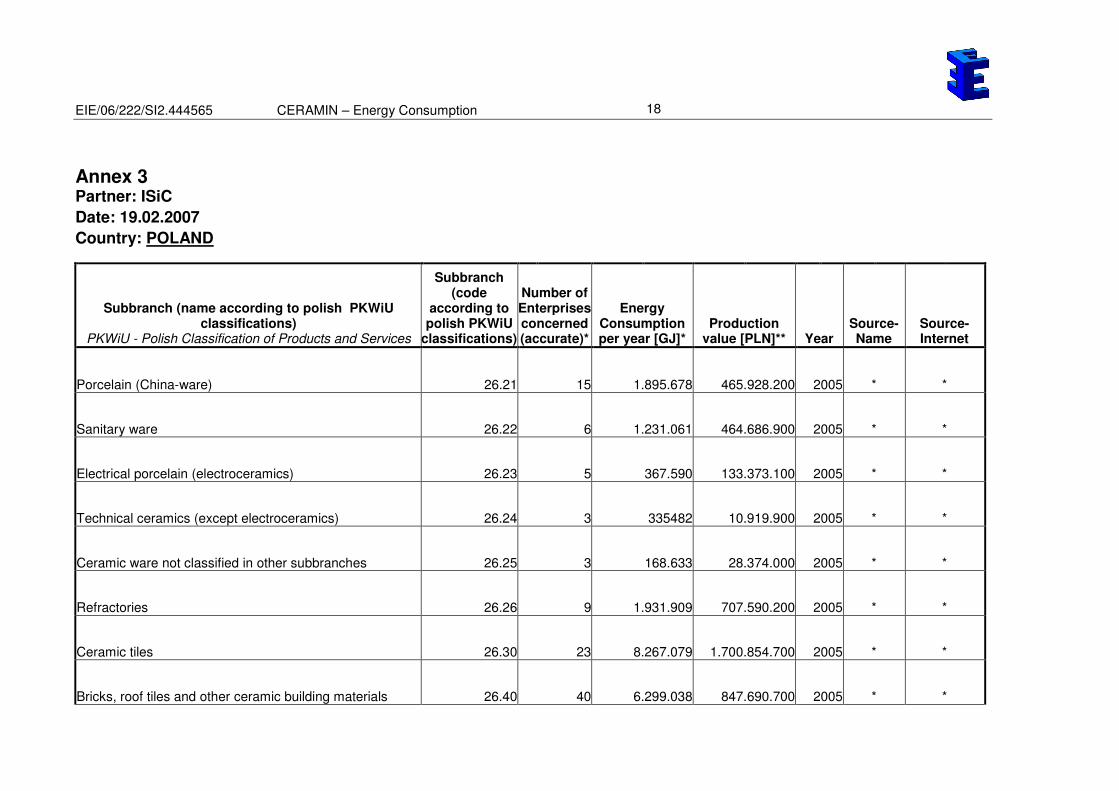
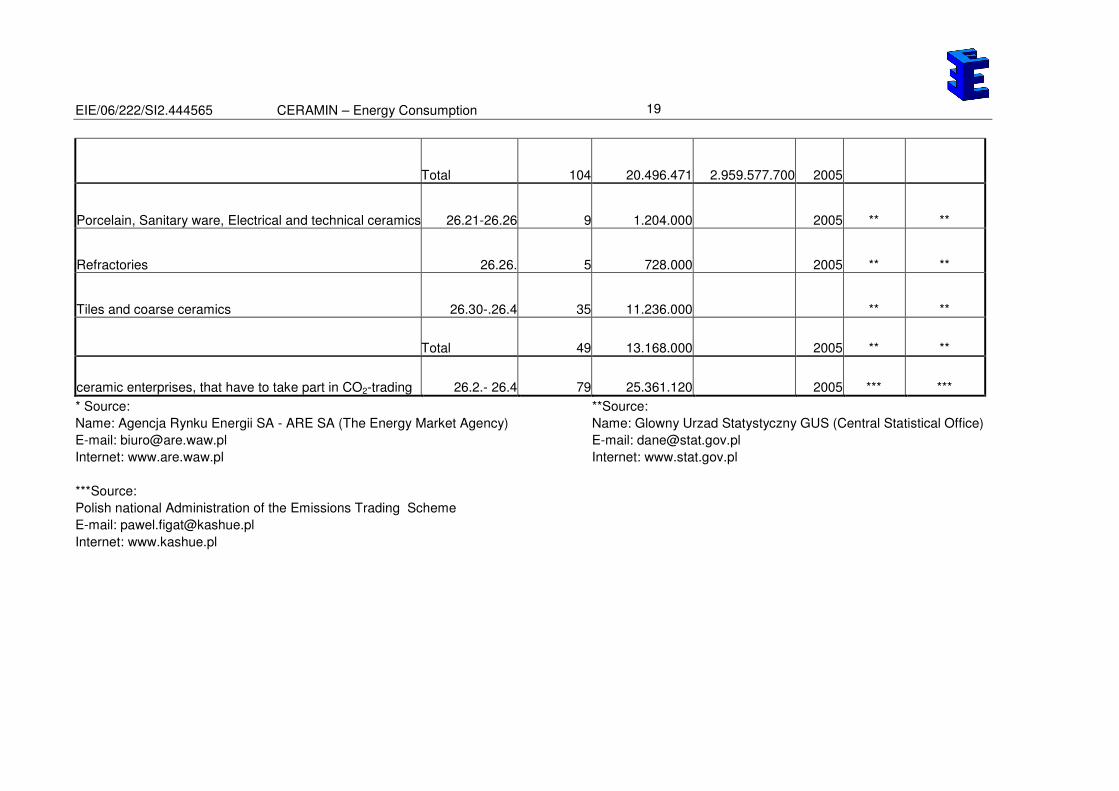
3.2 Poland (Annex 3)
Only data from 2005 are available. The best subdivision into sub-branches was done
by the Energy Market Agency (see Annex 3). This data represent a lot of polish
ceramic production, although not all, as the last bar in picture 3 shows. According to
picture 3 tiles and coarse ceramics production are the main consumers of energy in
the ceramics industry in Poland.
0,0
5,0
10,0
15,0
20,0
25,0
30,0
Porce
lain
(China
-war
e)
Sanita
ry w
are
Electric
al p
orce
lain
Techn
ical
cer
amics
not c
lass
ified
in o
ther
sub
bran
ches
Ref
ractor
ies
Cer
amic tiles
coar
se cer
amics
Total
- Ene
rgy M
arke
t Ang
ency
Fine
cera
mics
Ref
ractor
ies
Tiles
and
coar
se c
eram
ics
Total
- Cen
tral s
tatis
tical o
ffice
CO2-
trading
Cer
amic e
nter
prises
Ceramic branches
En
erg
y c
on
su
mp
tio
n in
TJ
/a *
10
00
Picture 3: Energy consumption of Polish ceramic sub-branches in 2005
Energy market agency central statis-tical office
EIE/06/222/SI2.444565 CERAMIN – Energy Consumption
7
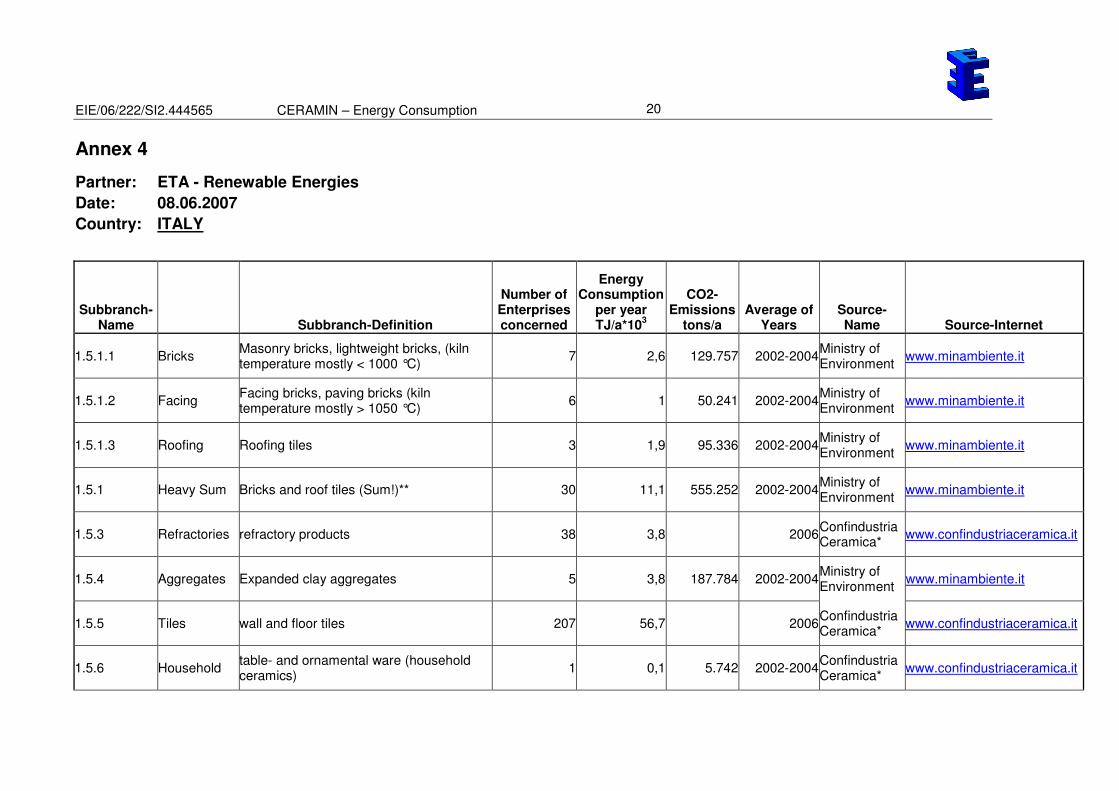
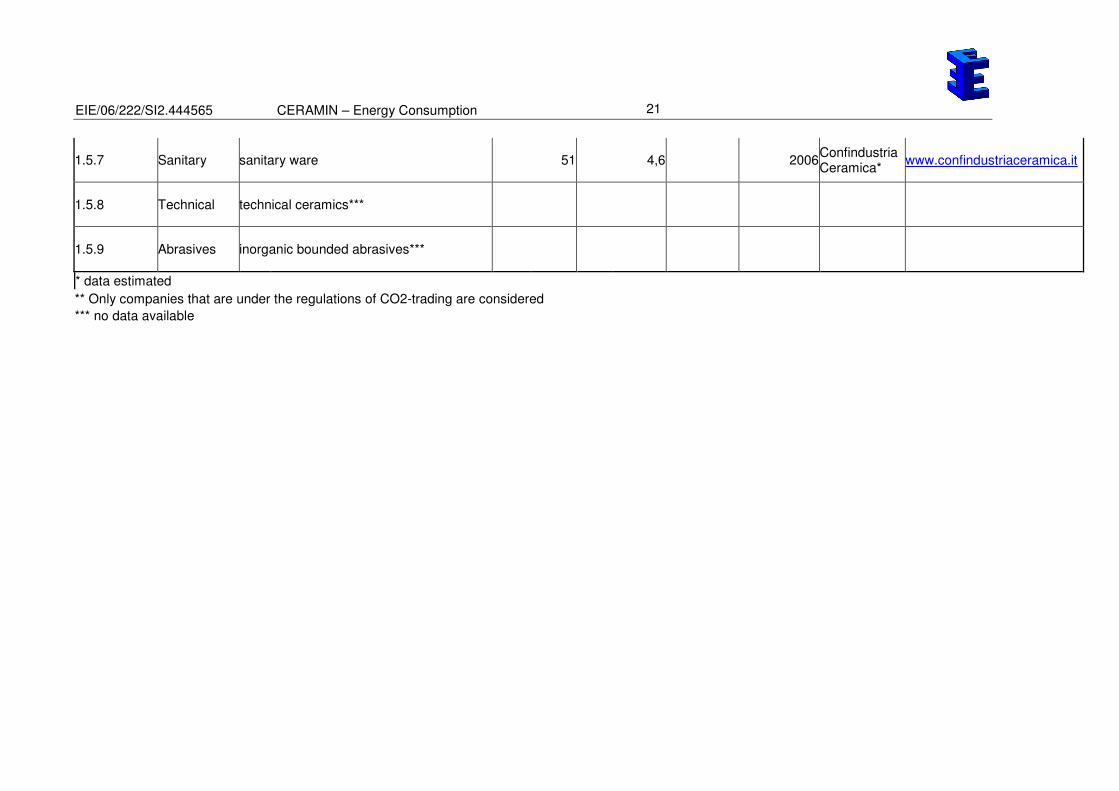
3.3 Italy (Annex 4)
0
10
20
30
40
50
60
Bricks
Facin
g
Roofing
Heavy S
um
Refr
acto
ries
Aggre
gate
s
Tile
s
Household
Sanitary
Technic
al
1.5.1.1 1.5.1.2 1.5.1.3 1.5.1 1.5.3 1.5.4 1.5.5 1.5.6 1.5.7 1.5.8
En
erg
y c
on
su
mp
tio
n
0
50
100
150
200
250
Nu
mb
er
Energy consumption
Number of enterprises
no
da
ta a
va
ilab
le
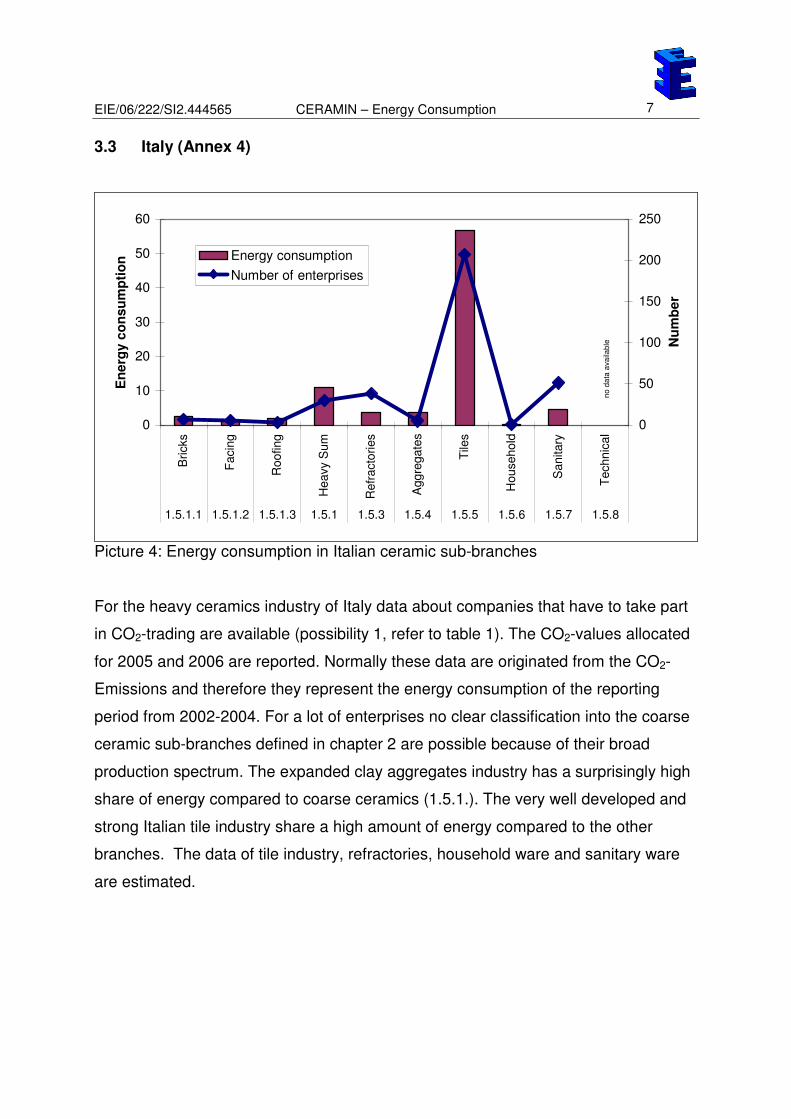
Picture 4: Energy consumption in Italian ceramic sub-branches
For the heavy ceramics industry of Italy data about companies that have to take part
in CO2-trading are available (possibility 1, refer to table 1). The CO2-values allocated
for 2005 and 2006 are reported. Normally these data are originated from the CO2-
Emissions and therefore they represent the energy consumption of the reporting
period from 2002-2004. For a lot of enterprises no clear classification into the coarse
ceramic sub-branches defined in chapter 2 are possible because of their broad
production spectrum. The expanded clay aggregates industry has a surprisingly high
share of energy compared to coarse ceramics (1.5.1.). The very well developed and
strong Italian tile industry share a high amount of energy compared to the other
branches. The data of tile industry, refractories, household ware and sanitary ware
are estimated.
EIE/06/222/SI2.444565 CERAMIN – Energy Consumption
8
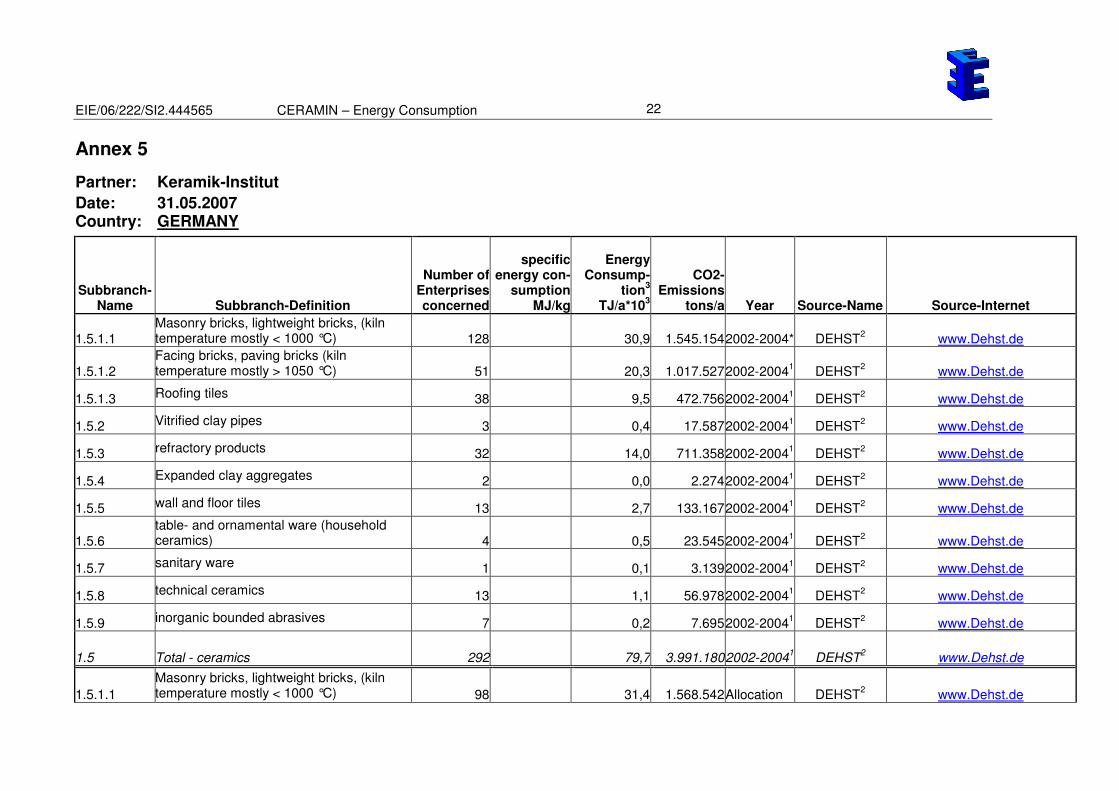
3.4 Germany (Annex 5)
The German data have his origin mostly in data published by the Deutsche
Emissionshandelsstelle (www.dehst.de). In Germany only companies that fulfil
Possibility 4 according to chapter 3 have to take part in CO2-trading.
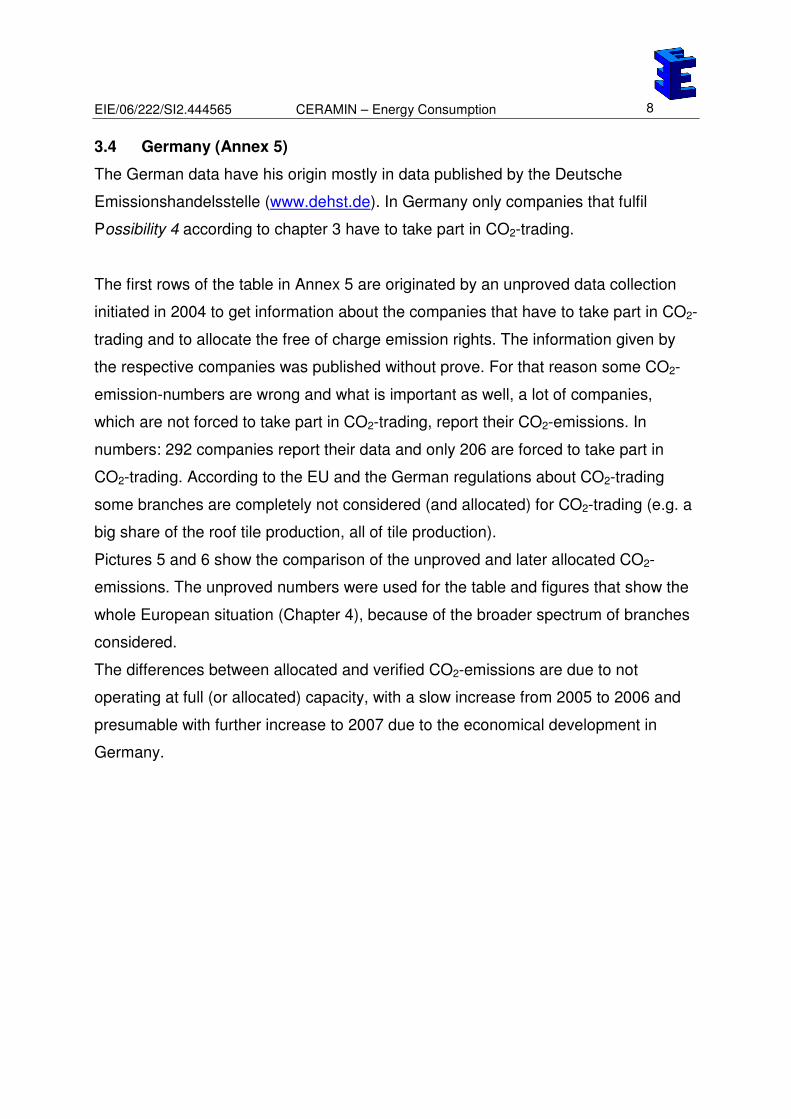
The first rows of the table in Annex 5 are originated by an unproved data collection
initiated in 2004 to get information about the companies that have to take part in CO2-
trading and to allocate the free of charge emission rights. The information given by
the respective companies was published without prove. For that reason some CO2-
emission-numbers are wrong and what is important as well, a lot of companies,
which are not forced to take part in CO2-trading, report their CO2-emissions. In
numbers: 292 companies report their data and only 206 are forced to take part in
CO2-trading. According to the EU and the German regulations about CO2-trading
some branches are completely not considered (and allocated) for CO2-trading (e.g. a
big share of the roof tile production, all of tile production).
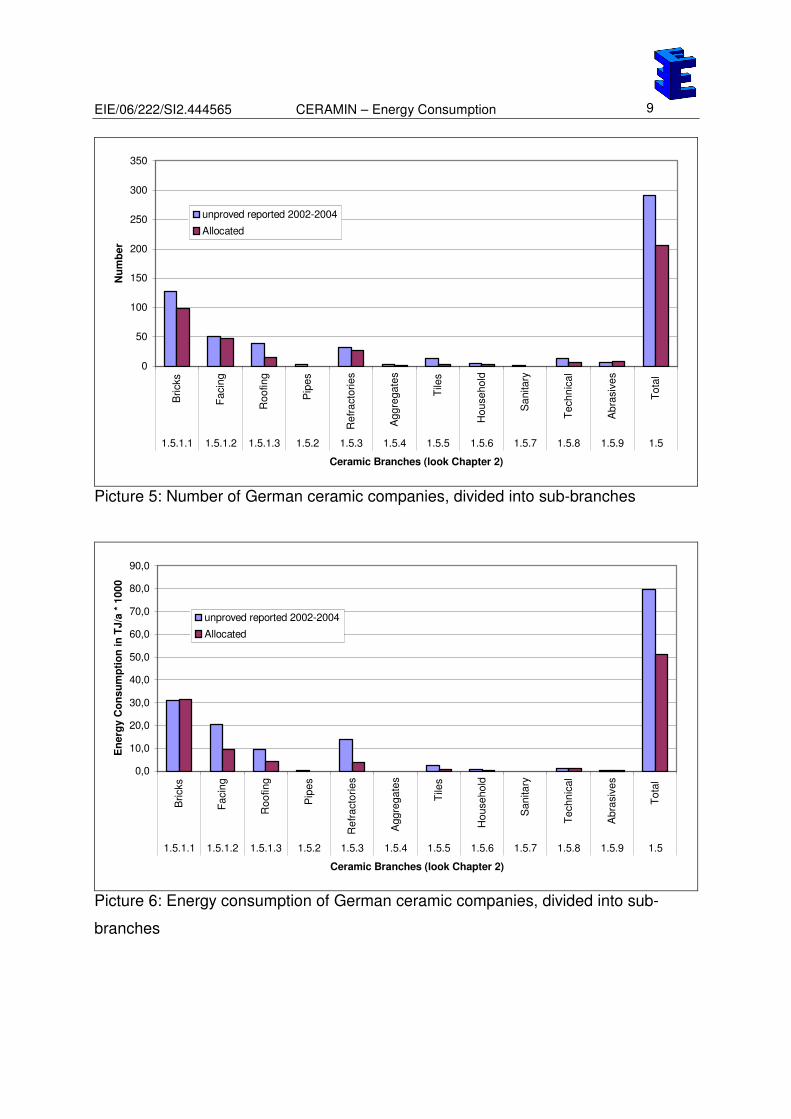
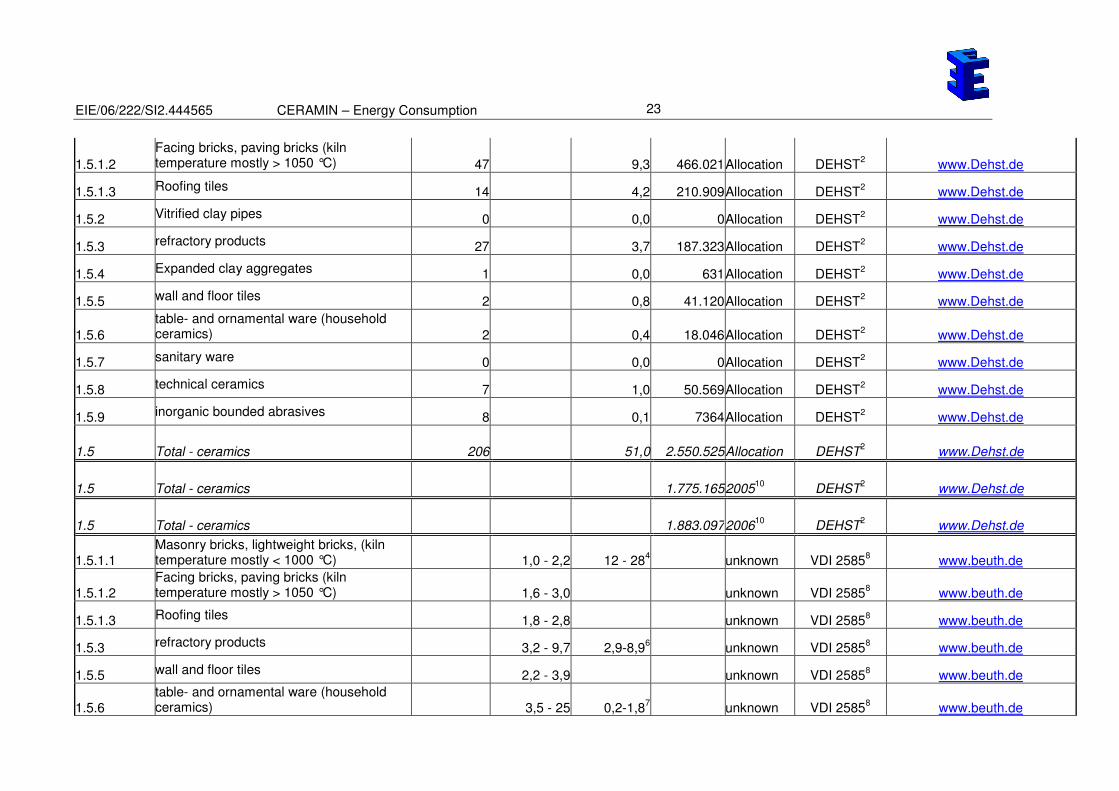
Pictures 5 and 6 show the comparison of the unproved and later allocated CO2-
emissions. The unproved numbers were used for the table and figures that show the
whole European situation (Chapter 4), because of the broader spectrum of branches
considered.
The differences between allocated and verified CO2-emissions are due to not
operating at full (or allocated) capacity, with a slow increase from 2005 to 2006 and
presumable with further increase to 2007 due to the economical development in
Germany.
EIE/06/222/SI2.444565 CERAMIN – Energy Consumption
9
0
50
100
150
200
250
300
350
Bri
cks
Fa
cin
g
Ro
ofin
g
Pip
es
Re
fra
cto
rie
s
Ag
gre
ga
tes
Tile
s
Ho
use
ho
ld
Sa
nita
ry
Te
ch
nic
al
Ab
rasiv
es
To
tal
1.5.1.1 1.5.1.2 1.5.1.3 1.5.2 1.5.3 1.5.4 1.5.5 1.5.6 1.5.7 1.5.8 1.5.9 1.5
Ceramic Branches (look Chapter 2)
Nu
mb
er
unproved reported 2002-2004
Allocated
Picture 5: Number of German ceramic companies, divided into sub-branches
0,0
10,0
20,0
30,0
40,0
50,0
60,0
70,0
80,0
90,0
Bri
cks
Fa
cin
g
Ro
ofin
g
Pip
es
Re
fra
cto
rie
s
Ag
gre
ga
tes
Tile
s
Ho
use
ho
ld
Sa
nita
ry
Te
ch
nic
al
Ab
rasiv
es
To
tal
1.5.1.1 1.5.1.2 1.5.1.3 1.5.2 1.5.3 1.5.4 1.5.5 1.5.6 1.5.7 1.5.8 1.5.9 1.5
Ceramic Branches (look Chapter 2)
En
erg
y C
on
su
mp
tio
n in
TJ
/a *
10
00
unproved reported 2002-2004
Allocated
Picture 6: Energy consumption of German ceramic companies, divided into sub-
branches
EIE/06/222/SI2.444565 CERAMIN – Energy Consumption
10
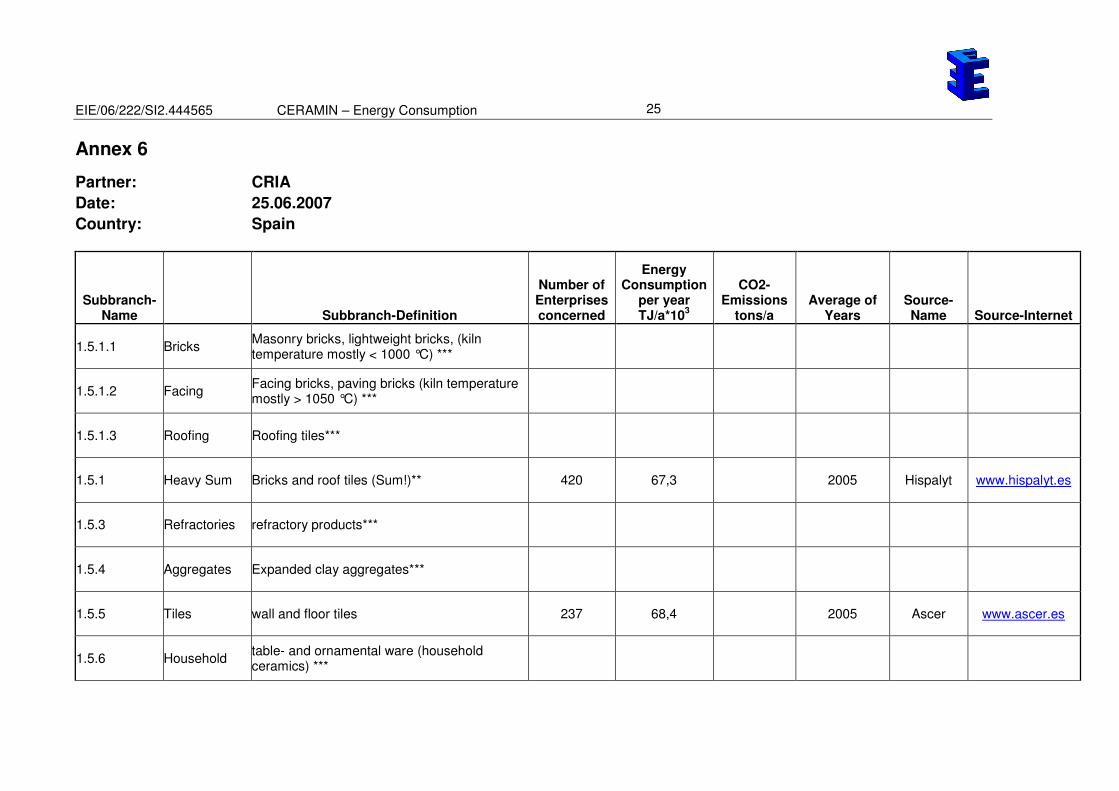
3.5 Spain (Annex 6)
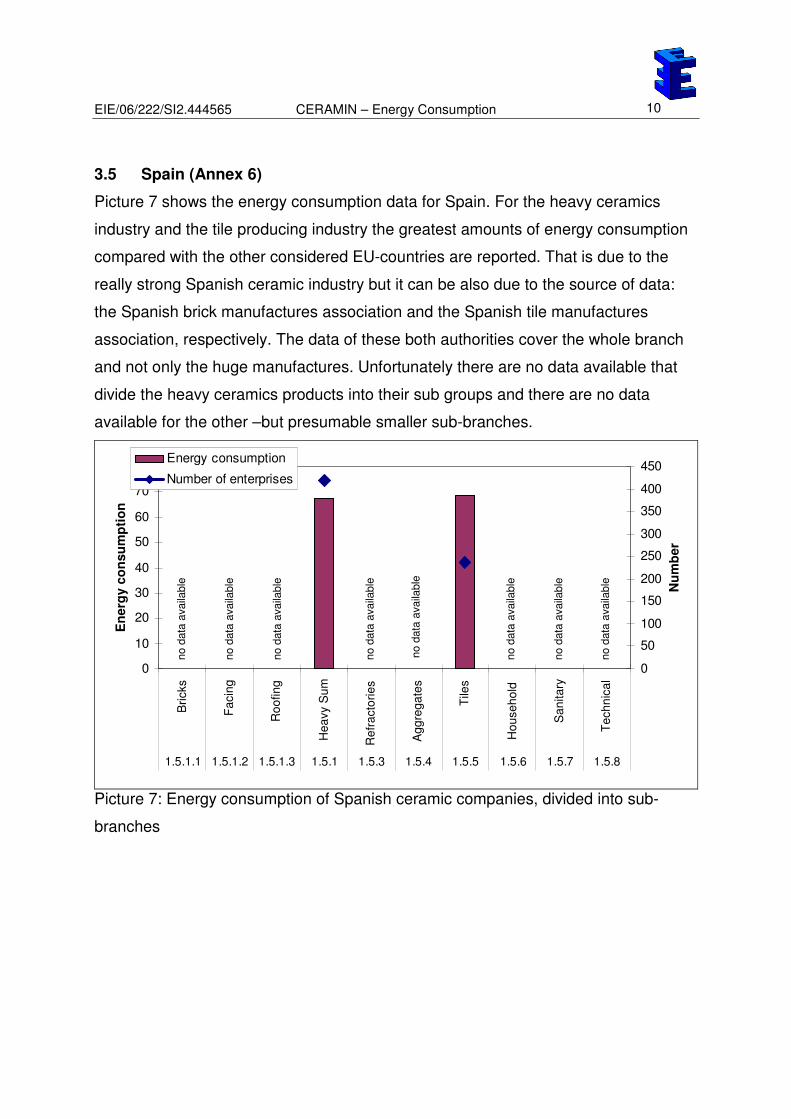
Picture 7 shows the energy consumption data for Spain. For the heavy ceramics
industry and the tile producing industry the greatest amounts of energy consumption
compared with the other considered EU-countries are reported. That is due to the
really strong Spanish ceramic industry but it can be also due to the source of data:
the Spanish brick manufactures association and the Spanish tile manufactures
association, respectively. The data of these both authorities cover the whole branch
and not only the huge manufactures. Unfortunately there are no data available that
divide the heavy ceramics products into their sub groups and there are no data
available for the other –but presumable smaller sub-branches.
0
10
20
30
40
50
60
70
80
Bri
cks
Fa
cin
g
Ro
ofin
g
He
avy S
um
Re
fra
cto
rie
s
Ag
gre
ga
tes
Tile
s
Ho
use
ho
ld
Sa
nita
ry
Te
ch
nic
al
1.5.1.1 1.5.1.2 1.5.1.3 1.5.1 1.5.3 1.5.4 1.5.5 1.5.6 1.5.7 1.5.8
En
erg
y c
on
su
mp
tio
n
0
50
100
150
200
250
300
350
400
450
Nu
mb
er
Energy consumption
Number of enterprises
no d
ata
availa
ble
no d
ata
availa
ble
no d
ata
availa
ble
no d
ata
availa
ble
no d
ata
availa
ble
no d
ata
availa
ble
no d
ata
availa
ble
no d
ata
availa
ble
Picture 7: Energy consumption of Spanish ceramic companies, divided into sub-
branches
EIE/06/222/SI2.444565 CERAMIN – Energy Consumption
11
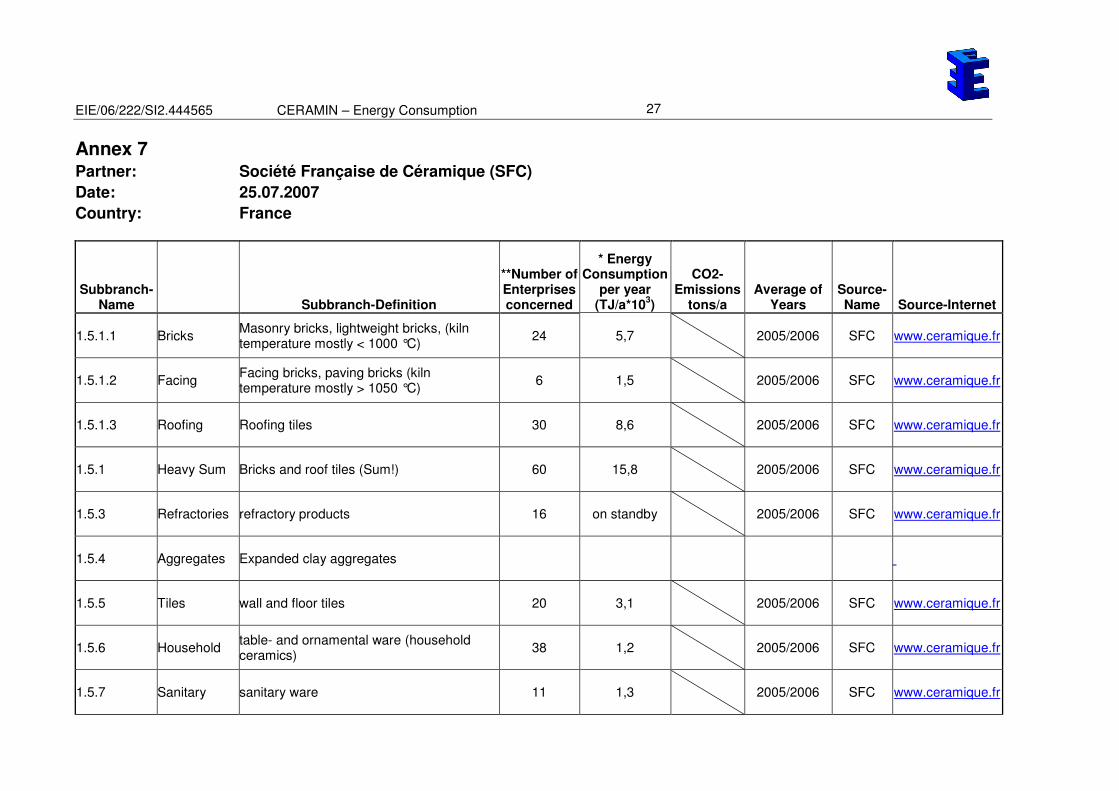
3.6 France (Annex 7)
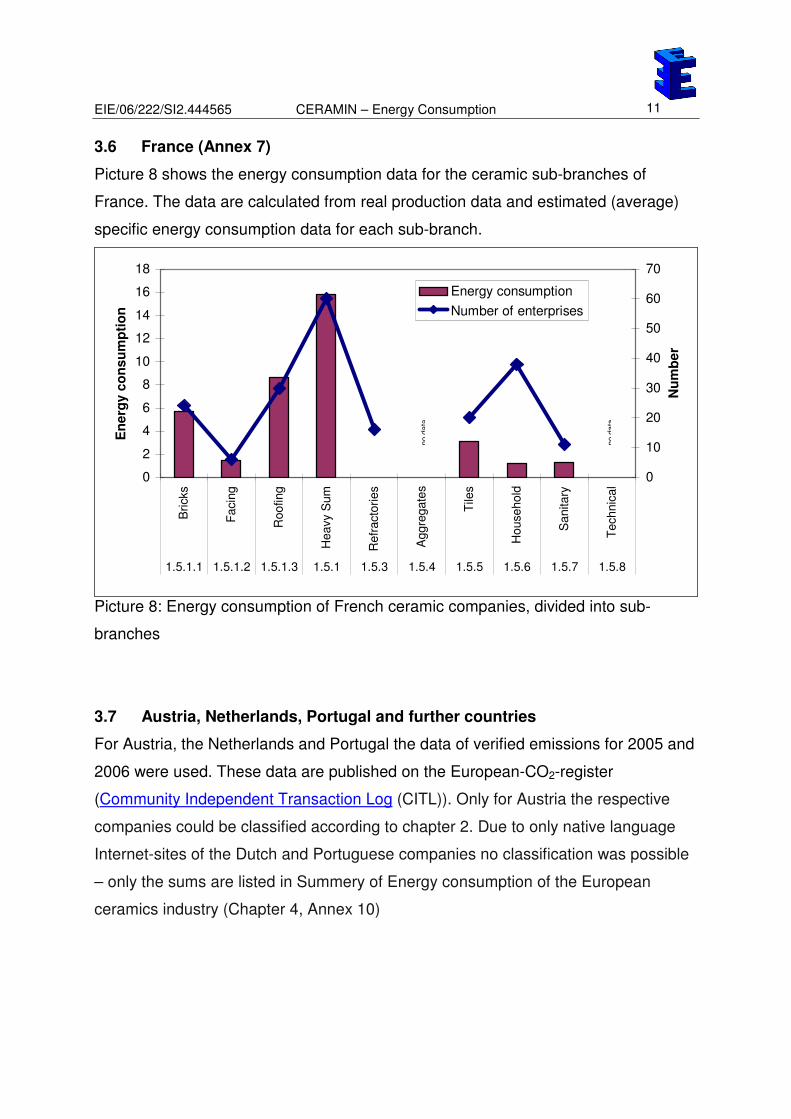
Picture 8 shows the energy consumption data for the ceramic sub-branches of
France. The data are calculated from real production data and estimated (average)
specific energy consumption data for each sub-branch.
0
2
4
6
8
10
12
14
16
18
Bricks
Facin
g
Roofing
Heavy S
um
Refr
acto
ries
Aggre
gate
s
Tile
s
Household
Sanitary
Technic
al
1.5.1.1 1.5.1.2 1.5.1.3 1.5.1 1.5.3 1.5.4 1.5.5 1.5.6 1.5.7 1.5.8
En
erg
y c
on
su
mp
tio
n
0
10
20
30
40
50
60
70
Nu
mb
er
Energy consumption
Number of enterprises
no
da
ta
no
da
ta
Picture 8: Energy consumption of French ceramic companies, divided into sub-
branches
3.7 Austria, Netherlands, Portugal and further countries
For Austria, the Netherlands and Portugal the data of verified emissions for 2005 and
2006 were used. These data are published on the European-CO2-register
(Community Independent Transaction Log (CITL)). Only for Austria the respective
companies could be classified according to chapter 2. Due to only native language
Internet-sites of the Dutch and Portuguese companies no classification was possible
– only the sums are listed in Summery of Energy consumption of the European
ceramics industry (Chapter 4, Annex 10)
EIE/06/222/SI2.444565 CERAMIN – Energy Consumption
12
4 Summery of European Energy consumption in the ceramic industry
divided into sub-branches
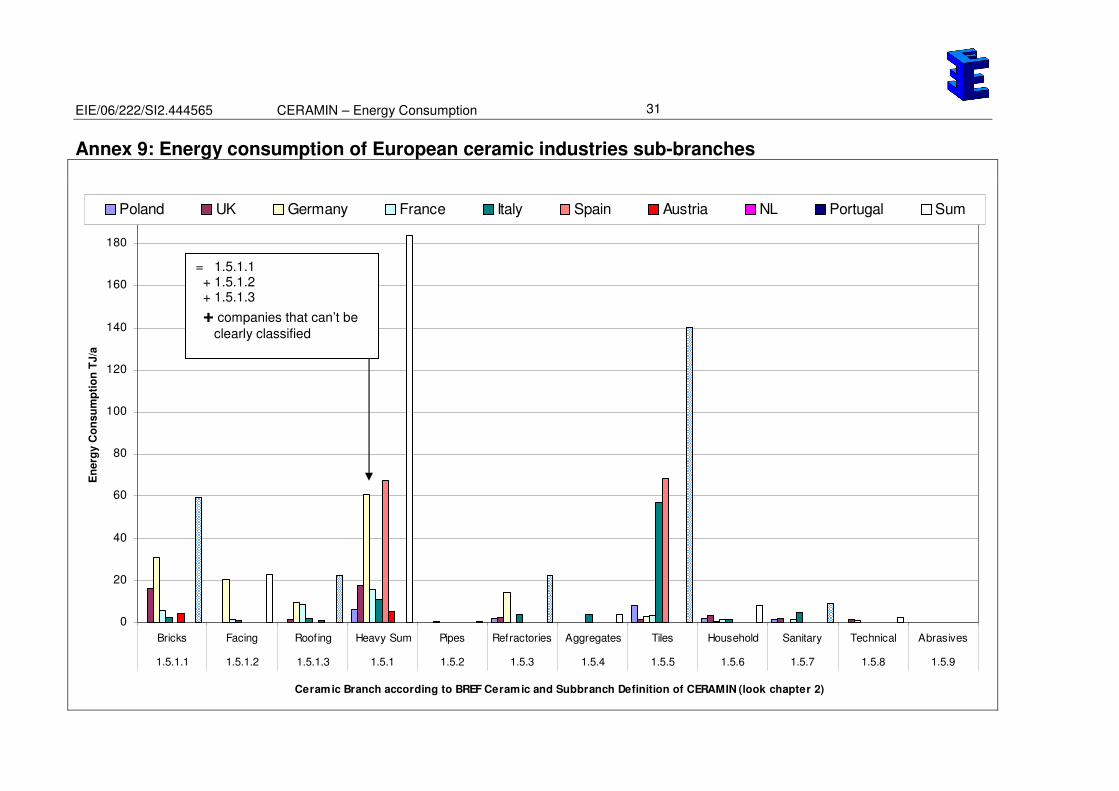
In Annex 8 all summarized data are listed. Annex 9 and 10 show the data graphically.
According to the Annex 9, tiles and heavy ceramics sub-branches are the ones with
the greatest energy consumption. The difference between these two sub-branches is
smaller then expected. The very strong tile industries of Italy and Spain are
responsible for that. Beside these two branches the refractories have mentionable
energy consumption, mainly due to German factories. The numbers of this sub-
branch might be much higher if the strong French refractories branch could be also
taken in account (16 French companies, but there is no energy consumption data
available so far). Additionally, the division between refractories and technical
ceramics is sometimes a bit difficult, because differences are mainly defined by the
application of the product (refractory: support high temperature processes, technical
ceramics: electrical, medicine, engineering use)
From the technical point of view the energy consumption for heavy ceramics
products and tiles are high due to huge production amounts and the reasonable high
energy consumption of refractories is due to high kiln temperatures. That means a
small decrease of energy consumption per unit of heavy ceramics or tiles has great
effects on the whole energy consumption of the sub-branch. For refractories
respectively technical ceramics the situation is more complicated due to mostly
sophisticated and special products.
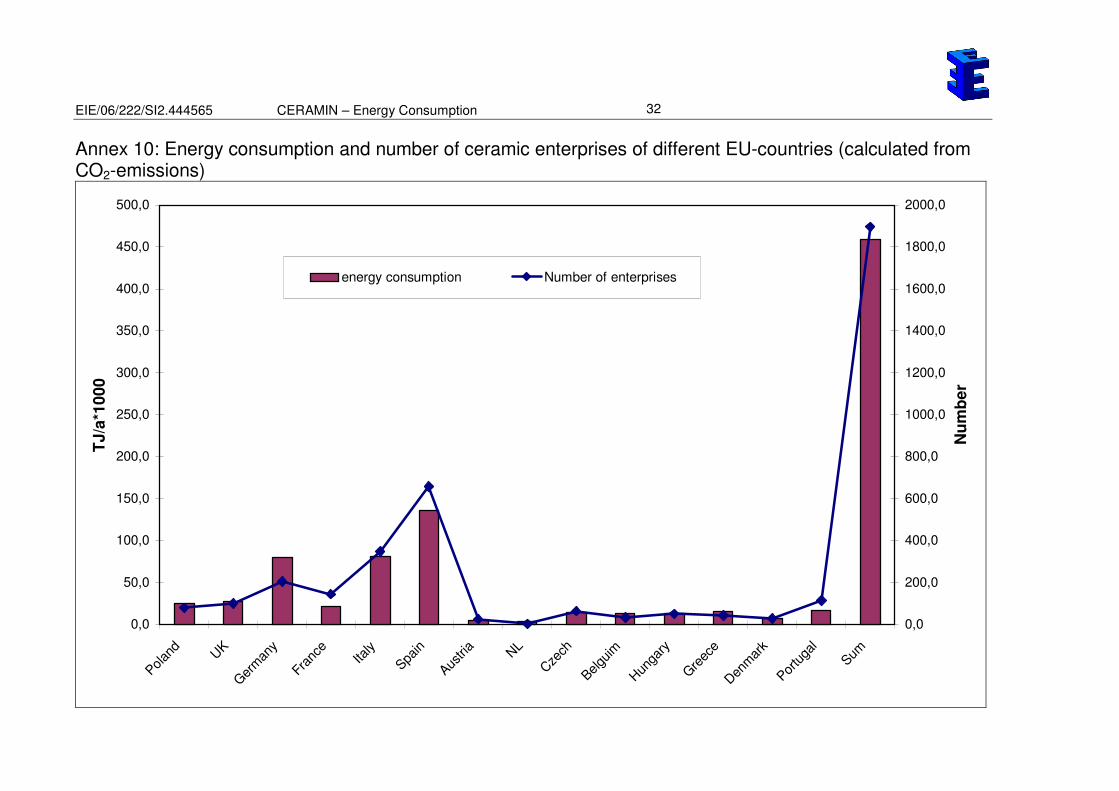
Concerning the allocation of energy use in the EU-countries it can be stated that the
consortium consist of the main European “ceramic countries” among them Italy,
Spain and Germany are the main players.
5 Suggestion of sub-branches for the EEE-Label
The following branches will be viewed within the EEE-Labelling:
1. Masonry bricks, lightweight bricks, (kiln temperature mostly < 1000 °C)
2. Facing bricks, paving bricks (kiln temperature mostly > 1050 °C)
3. Roofing tiles
EIE/06/222/SI2.444565 CERAMIN – Energy Consumption
13
4. Refractory products
5. Wall and floor tiles
6 Suggestion of criteria for EEE-Label
Procedure
• Asking each company for its yearly CO2-emission report
or (if the are not forced to take part in GHG-emission trading)
Asking the respective company to fill in the respective national forms for the CO2-
emission report on voluntary basis only for the EEE-Label
Advantages
• No effort for the development of new forms or questionnaires
• Clear rules defined by EU-authorities for the verification of data
• Verified energy consumption data PLUS production data (because of the carbon-
content of most ceramic bodies)
• Very low effort for the respective company and the CERAMIN-Partner
• Reliable data
• Low barriers for the respective company, because the data are mostly public
• The EEE-Label is an added value for the respective company concerning CO2-
trading
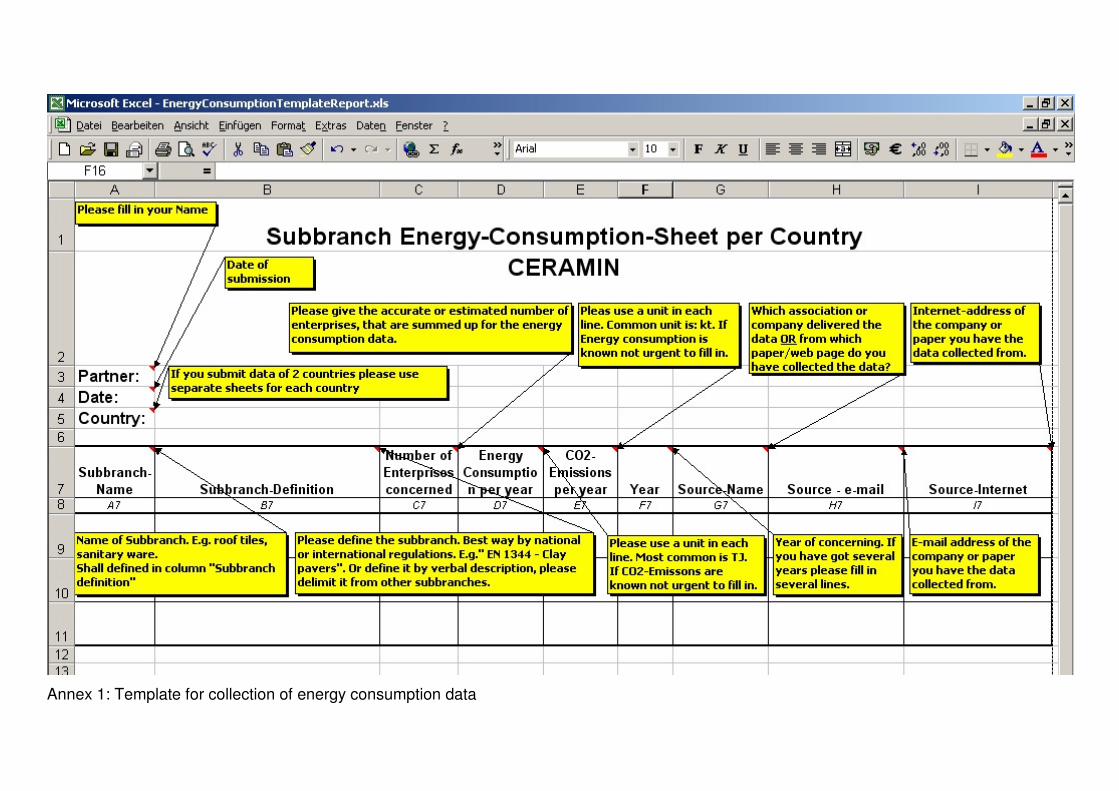
Annex 1: Template for collection of energy consumption data
EIE/06/222/SI2.444565 CERAMIN – Energy Consumption
15
Annex 2 Partner: CERAM
Date: 15. 3. 07
Country: UNITED KINGDOM
Subbranch-Name Subbranch-Definition
Number of Enter-prises
concerned
FUEL Energy Consumption per year kWh
Energy Consump-
tion TJ/a*10
3
Fuel CO2-Emissions tonnes per
year Year Source-Name Source-Internet
BRICK Red clay building bricks 28 4.550.630.538 16,4 873.266 2002British Ceramic Confederation www.ceramfed.co.uk
ROOF TILES Roof Tiles 7 396.455.569 1,4 76.080 2002British Ceramic Confederation www.ceramfed.co.uk
INDUSTRIAL CERAMICS
Alumina, Zirconia etc products for wear resistance and other applications 16 323.048.779 1,2 61.250 2002
British Ceramic Confederation www.ceramfed.co.uk
REFRACTORIES Refractory ceramics for high temperature applications 14 710.565.918 2,6 134.723 2002
British Ceramic Confederation www.ceramfed.co.uk
TABLEWARE
All forms of tableware - earthenware, stoneware, porcelain, bone china etc. 30 1.160.651.290 4,2 216.345 2002
British Ceramic Confederation www.ceramfed.co.uk
TILES Glazed & unglazed wall and floor tiles 4 316.566.865 1,1 59.008 2002
British Ceramic Confederation www.ceramfed.co.uk
SANITARYWARE Vitreous china & fireclay ceramic sanitaryware 6 711.273.494 2,6 132.581 2002
British Ceramic Confederation www.ceramfed.co.uk
BRICK Red clay building bricks 28 4.659.605.596
16,8 894.178 2004British Ceramic Confederation www.ceramfed.co.uk
EIE/06/222/SI2.444565 CERAMIN – Energy Consumption
16
ROOF TILES Roof Tiles 7 433.223.119
1,6 83.136 2004British Ceramic Confederation www.ceramfed.co.uk
INDUSTRIAL CERAMICS
Alumina, Zirconia etc products for wear resistance and other applications 16
380.824.4931,4 72.204 2004
British Ceramic Confederation www.ceramfed.co.uk
REFRACTORIES Refractory ceramics for high temperature applications 13
618.659.3342,2 117.298 2004
British Ceramic Confederation www.ceramfed.co.uk
TABLEWARE
All forms of tableware - earthenware, stoneware, porcelain, bone china etc. 27
910.745.5813,3 169.763 2004
British Ceramic Confederation www.ceramfed.co.uk
TILES Glazed & unglazed wall and floor tiles 4
327.210.8561,2 60.992 2004
British Ceramic Confederation www.ceramfed.co.uk
SANITARYWARE Vitreous china & fireclay ceramic sanitaryware 5
533.019.5831,9 99.355 2004
British Ceramic Confederation www.ceramfed.co.uk
BRICK Red clay building bricks 30 4.160.949.376 15,0 798.486 2006British Ceramic Confederation www.ceramfed.co.uk
ROOF TILES Roof Tiles 6 365.731.802 1,3 70.184 2006British Ceramic Confederation www.ceramfed.co.uk
INDUSTRIAL CERAMICS
Alumina, Zirconia etc products for wear resistance and other applications 17 364.361.643 1,3 69.083 2006
British Ceramic Confederation www.ceramfed.co.uk
REFRACTORIES Refractory ceramics for high temperature applications 14 475.302.965 1,7 90.117 2006
British Ceramic Confederation www.ceramfed.co.uk
TABLEWARE
All forms of tableware - earthenware, stoneware, porcelain, bone china etc. 23 641.092.910 2,3 119.500 2006
British Ceramic Confederation www.ceramfed.co.uk
TILES Glazed & unglazed wall and floor tiles 4 326.056.090 1,2 60.777 2006
British Ceramic Confederation www.ceramfed.co.uk
EIE/06/222/SI2.444565 CERAMIN – Energy Consumption
17
SANITARYWARE Vitreous china & fireclay ceramic sanitaryware 4 448.818.963 1,6 83.660 2006
British Ceramic Confederation www.ceramfed.co.uk
BRICK Red clay building bricks 28,7 16,0 Average 2002; 2004; 2006
ROOF TILES Roof Tiles 7 1,4 Average 2002; 2004; 2007
INDUSTRIAL CERAMICS
Alumina, Zirconia etc products for wear resistance and other applications 16 1,3 Average 2002; 2004; 2008
REFRACTORIES Refractory ceramics for high temperature applications 14 2,2 Average 2002; 2004; 2009
TABLEWARE
All forms of tableware - earthenware, stoneware, porcelain, bone china etc. 27 3,3 Average 2002; 2004; 2010
TILES Glazed & unglazed wall and floor tiles 4 1,2 Average 2002; 2004; 2011
SANITARYWARE Vitreous china & fireclay ceramic sanitaryware 5 2,0 Average 2002; 2004; 2012
EIE/06/222/SI2.444565 CERAMIN – Energy Consumption
18
Annex 3 Partner: ISiC
Date: 19.02.2007
Country: POLAND
Subbranch (name according to polish PKWiU classifications)
PKWiU - Polish Classification of Products and Services
Subbranch (code
according to polish PKWiU
classifications)
Number of Enterprises concerned (accurate)*
Energy Consumption per year [GJ]*
Production value [PLN]** Year
Source-Name
Source-Internet
Porcelain (China-ware) 26.21 15 1.895.678 465.928.200 2005 * *
Sanitary ware 26.22 6 1.231.061 464.686.900 2005 * *
Electrical porcelain (electroceramics) 26.23 5 367.590 133.373.100 2005 * *
Technical ceramics (except electroceramics) 26.24 3 335482 10.919.900 2005 * *
Ceramic ware not classified in other subbranches 26.25 3 168.633 28.374.000 2005 * *
Refractories 26.26 9 1.931.909 707.590.200 2005 * *
Ceramic tiles 26.30 23 8.267.079 1.700.854.700 2005 * *
Bricks, roof tiles and other ceramic building materials 26.40 40 6.299.038 847.690.700 2005 * *
EIE/06/222/SI2.444565 CERAMIN – Energy Consumption
19
Total 104 20.496.471 2.959.577.700 2005
Porcelain, Sanitary ware, Electrical and technical ceramics 26.21-26.26 9 1.204.000 2005 ** **
Refractories 26.26. 5 728.000 2005 ** **
Tiles and coarse ceramics 26.30-.26.4 35 11.236.000 ** **
Total 49 13.168.000 2005 ** **
ceramic enterprises, that have to take part in CO2-trading 26.2.- 26.4 79 25.361.120 2005 *** ***
* Source: **Source:
Name: Agencja Rynku Energii SA - ARE SA (The Energy Market Agency) Name: Glowny Urzad Statystyczny GUS (Central Statistical Office)
E-mail: [email protected] E-mail: [email protected]
Internet: www.are.waw.pl Internet: www.stat.gov.pl
***Source:
Polish national Administration of the Emissions Trading Scheme
E-mail: [email protected]
Internet: www.kashue.pl
EIE/06/222/SI2.444565 CERAMIN – Energy Consumption
20
Annex 4
Partner: ETA - Renewable Energies
Date: 08.06.2007
Country: ITALY
Subbranch-Name Subbranch-Definition
Number of Enterprises concerned
Energy Consumption
per year TJ/a*10
3
CO2-Emissions
tons/a Average of
Years Source-Name Source-Internet
1.5.1.1 Bricks Masonry bricks, lightweight bricks, (kiln temperature mostly < 1000 °C)
7 2,6 129.757 2002-2004Ministry of Environment
www.minambiente.it
1.5.1.2 Facing Facing bricks, paving bricks (kiln temperature mostly > 1050 °C)
6 1 50.241 2002-2004Ministry of Environment
www.minambiente.it
1.5.1.3 Roofing Roofing tiles 3 1,9 95.336 2002-2004Ministry of Environment
www.minambiente.it
1.5.1 Heavy Sum Bricks and roof tiles (Sum!)** 30 11,1 555.252 2002-2004Ministry of Environment
www.minambiente.it
1.5.3 Refractories refractory products 38 3,8 2006Confindustria Ceramica*
www.confindustriaceramica.it
1.5.4 Aggregates Expanded clay aggregates 5 3,8 187.784 2002-2004Ministry of Environment
www.minambiente.it
1.5.5 Tiles wall and floor tiles 207 56,7 2006Confindustria Ceramica*
www.confindustriaceramica.it
1.5.6 Household table- and ornamental ware (household ceramics)
1 0,1 5.742 2002-2004Confindustria Ceramica*
www.confindustriaceramica.it
EIE/06/222/SI2.444565 CERAMIN – Energy Consumption
21
1.5.7 Sanitary sanitary ware 51 4,6 2006Confindustria Ceramica*
www.confindustriaceramica.it
1.5.8 Technical technical ceramics***
1.5.9 Abrasives inorganic bounded abrasives***
* data estimated
** Only companies that are under the regulations of CO2-trading are considered
*** no data available
EIE/06/222/SI2.444565 CERAMIN – Energy Consumption
22
Annex 5
Partner: Keramik-Institut
Date: 31.05.2007 Country: GERMANY
Subbranch-Name Subbranch-Definition
Number of Enterprises concerned
specific energy con-
sumption MJ/kg
Energy Consump-
tion3
TJ/a*103
CO2-Emissions
tons/a Year Source-Name Source-Internet
1.5.1.1
Masonry bricks, lightweight bricks, (kiln temperature mostly < 1000 °C) 128 30,9 1.545.1542002-2004* DEHST
2 www.Dehst.de
1.5.1.2
Facing bricks, paving bricks (kiln temperature mostly > 1050 °C) 51 20,3 1.017.5272002-2004
1 DEHST
2 www.Dehst.de
1.5.1.3 Roofing tiles 38 9,5 472.7562002-20041 DEHST
2 www.Dehst.de
1.5.2 Vitrified clay pipes 3 0,4 17.5872002-20041 DEHST
2 www.Dehst.de
1.5.3 refractory products 32 14,0 711.3582002-20041 DEHST
2 www.Dehst.de
1.5.4 Expanded clay aggregates 2 0,0 2.2742002-20041 DEHST
2 www.Dehst.de
1.5.5 wall and floor tiles 13 2,7 133.1672002-20041 DEHST
2 www.Dehst.de
1.5.6
table- and ornamental ware (household ceramics) 4 0,5 23.5452002-2004
1 DEHST
2 www.Dehst.de
1.5.7 sanitary ware 1 0,1 3.1392002-20041 DEHST
2 www.Dehst.de
1.5.8 technical ceramics 13 1,1 56.9782002-20041 DEHST
2 www.Dehst.de
1.5.9 inorganic bounded abrasives 7 0,2 7.6952002-20041 DEHST
2 www.Dehst.de
1.5 Total - ceramics 292 79,7 3.991.1802002-20041 DEHST
2 www.Dehst.de
1.5.1.1
Masonry bricks, lightweight bricks, (kiln temperature mostly < 1000 °C) 98 31,4 1.568.542Allocation DEHST
2 www.Dehst.de
EIE/06/222/SI2.444565 CERAMIN – Energy Consumption
23
1.5.1.2
Facing bricks, paving bricks (kiln temperature mostly > 1050 °C) 47 9,3 466.021Allocation DEHST
2 www.Dehst.de
1.5.1.3 Roofing tiles 14 4,2 210.909Allocation DEHST2 www.Dehst.de
1.5.2 Vitrified clay pipes 0 0,0 0Allocation DEHST2 www.Dehst.de
1.5.3 refractory products 27 3,7 187.323Allocation DEHST2 www.Dehst.de
1.5.4 Expanded clay aggregates 1 0,0 631Allocation DEHST2 www.Dehst.de
1.5.5 wall and floor tiles 2 0,8 41.120Allocation DEHST2 www.Dehst.de
1.5.6
table- and ornamental ware (household ceramics) 2 0,4 18.046Allocation DEHST
2 www.Dehst.de
1.5.7 sanitary ware 0 0,0 0Allocation DEHST2 www.Dehst.de
1.5.8 technical ceramics 7 1,0 50.569Allocation DEHST2 www.Dehst.de
1.5.9 inorganic bounded abrasives 8 0,1 7364Allocation DEHST2 www.Dehst.de
1.5 Total - ceramics 206 51,0 2.550.525Allocation DEHST2 www.Dehst.de
1.5 Total - ceramics 1.775.165200510
DEHST2 www.Dehst.de
1.5 Total - ceramics 1.883.097200610
DEHST2 www.Dehst.de
1.5.1.1
Masonry bricks, lightweight bricks, (kiln temperature mostly < 1000 °C) 1,0 - 2,2 12 - 28
4 unknown VDI 2585
8 www.beuth.de
1.5.1.2
Facing bricks, paving bricks (kiln temperature mostly > 1050 °C) 1,6 - 3,0 unknown VDI 2585
8 www.beuth.de
1.5.1.3 Roofing tiles 1,8 - 2,8 unknown VDI 25858 www.beuth.de
1.5.3 refractory products 3,2 - 9,7 2,9-8,96 unknown VDI 2585
8 www.beuth.de
1.5.5 wall and floor tiles 2,2 - 3,9 unknown VDI 25858 www.beuth.de
1.5.6
table- and ornamental ware (household ceramics) 3,5 - 25 0,2-1,8
7 unknown VDI 2585
8 www.beuth.de
EIE/06/222/SI2.444565 CERAMIN – Energy Consumption
24
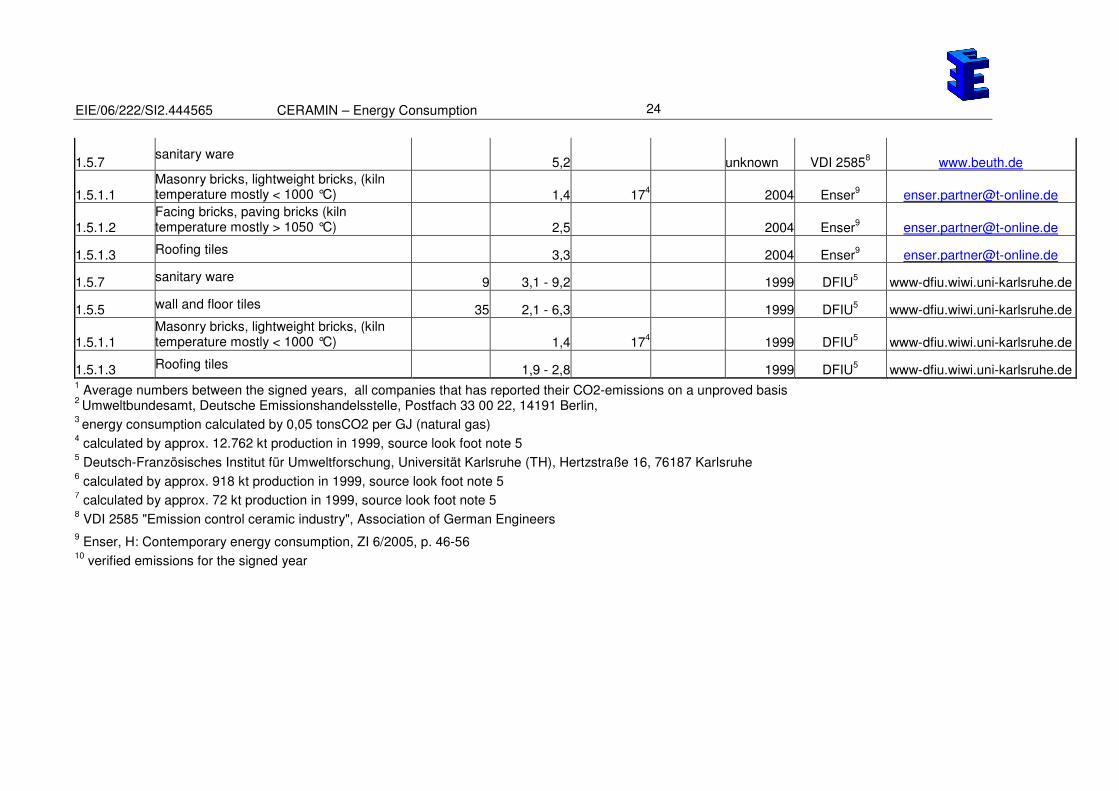
1.5.7 sanitary ware
5,2 unknown VDI 25858 www.beuth.de
1.5.1.1
Masonry bricks, lightweight bricks, (kiln temperature mostly < 1000 °C) 1,4 17
4 2004 Enser
1.5.1.2
Facing bricks, paving bricks (kiln temperature mostly > 1050 °C) 2,5 2004 Enser
1.5.1.3 Roofing tiles 3,3 2004 Enser9 [email protected]
1.5.7 sanitary ware 9 3,1 - 9,2 1999 DFIU5 www-dfiu.wiwi.uni-karlsruhe.de
1.5.5 wall and floor tiles 35 2,1 - 6,3 1999 DFIU5 www-dfiu.wiwi.uni-karlsruhe.de
1.5.1.1
Masonry bricks, lightweight bricks, (kiln temperature mostly < 1000 °C) 1,4 17
4 1999 DFIU
5 www-dfiu.wiwi.uni-karlsruhe.de
1.5.1.3 Roofing tiles 1,9 - 2,8 1999 DFIU5 www-dfiu.wiwi.uni-karlsruhe.de
1 Average numbers between the signed years, all companies that has reported their CO2-emissions on a unproved basis
2 Umweltbundesamt, Deutsche Emissionshandelsstelle, Postfach 33 00 22, 14191 Berlin,
3 energy consumption calculated by 0,05 tonsCO2 per GJ (natural gas)
4 calculated by approx. 12.762 kt production in 1999, source look foot note 5
5 Deutsch-Französisches Institut für Umweltforschung, Universität Karlsruhe (TH), Hertzstraße 16, 76187 Karlsruhe
6 calculated by approx. 918 kt production in 1999, source look foot note 5
7 calculated by approx. 72 kt production in 1999, source look foot note 5
8 VDI 2585 "Emission control ceramic industry", Association of German Engineers
9 Enser, H: Contemporary energy consumption, ZI 6/2005, p. 46-56
10 verified emissions for the signed year
EIE/06/222/SI2.444565 CERAMIN – Energy Consumption
25
Annex 6
Partner: CRIA
Date: 25.06.2007
Country: Spain
Subbranch-Name Subbranch-Definition
Number of Enterprises concerned
Energy Consumption
per year TJ/a*10
3
CO2-Emissions
tons/a Average of
Years Source-Name Source-Internet
1.5.1.1 Bricks Masonry bricks, lightweight bricks, (kiln temperature mostly < 1000 °C) ***
1.5.1.2 Facing Facing bricks, paving bricks (kiln temperature mostly > 1050 °C) ***
1.5.1.3 Roofing Roofing tiles***
1.5.1 Heavy Sum Bricks and roof tiles (Sum!)** 420 67,3 2005 Hispalyt www.hispalyt.es
1.5.3 Refractories refractory products***
1.5.4 Aggregates Expanded clay aggregates***
1.5.5 Tiles wall and floor tiles 237 68,4 2005 Ascer www.ascer.es
1.5.6 Household table- and ornamental ware (household ceramics) ***
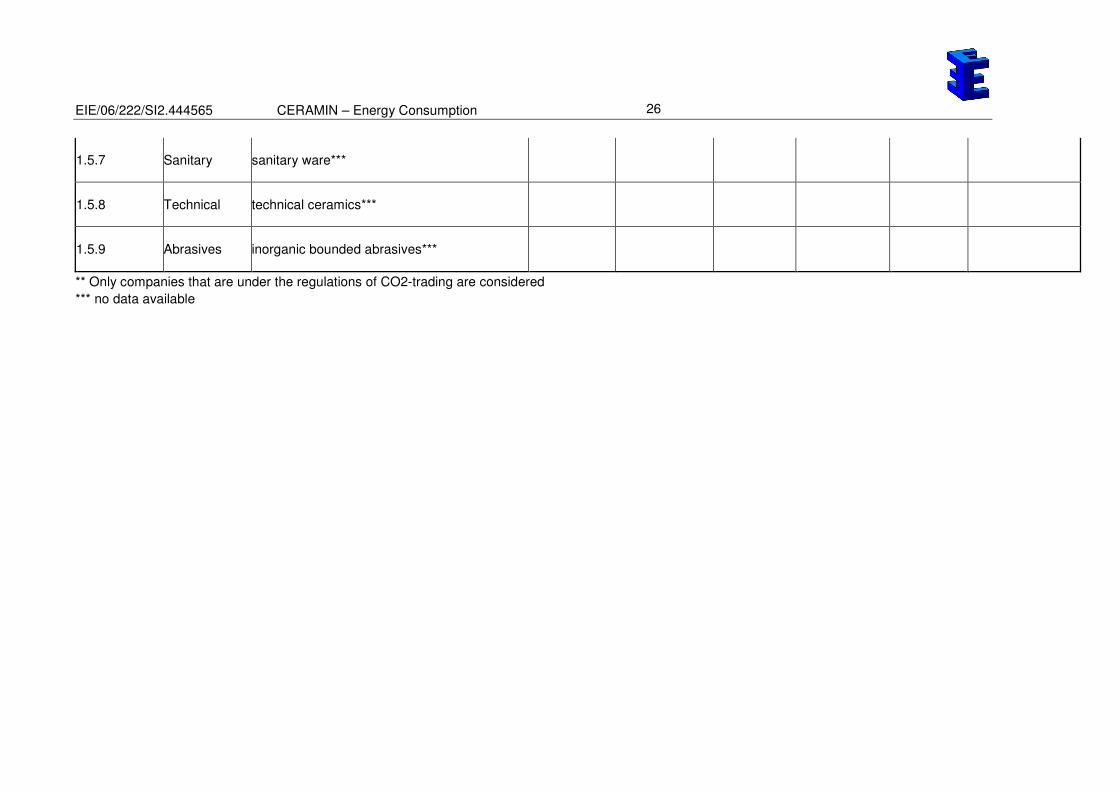
EIE/06/222/SI2.444565 CERAMIN – Energy Consumption
26
1.5.7 Sanitary sanitary ware***
1.5.8 Technical technical ceramics***
1.5.9 Abrasives inorganic bounded abrasives***
** Only companies that are under the regulations of CO2-trading are considered
*** no data available
EIE/06/222/SI2.444565 CERAMIN – Energy Consumption
27
Annex 7 Partner: Société Française de Céramique (SFC)
Date: 25.07.2007
Country: France
Subbranch-Name Subbranch-Definition
**Number of Enterprises concerned
* Energy Consumption
per year (TJ/a*10
3)
CO2-Emissions
tons/a Average of
Years Source-Name Source-Internet
1.5.1.1 Bricks Masonry bricks, lightweight bricks, (kiln temperature mostly < 1000 °C)
24 5,7 2005/2006 SFC www.ceramique.fr
1.5.1.2 Facing Facing bricks, paving bricks (kiln temperature mostly > 1050 °C)
6 1,5 2005/2006 SFC www.ceramique.fr
1.5.1.3 Roofing Roofing tiles 30 8,6 2005/2006 SFC www.ceramique.fr
1.5.1 Heavy Sum Bricks and roof tiles (Sum!) 60 15,8 2005/2006 SFC www.ceramique.fr
1.5.3 Refractories refractory products 16 on standby 2005/2006 SFC www.ceramique.fr
1.5.4 Aggregates Expanded clay aggregates
1.5.5 Tiles wall and floor tiles 20 3,1 2005/2006 SFC www.ceramique.fr
1.5.6 Household table- and ornamental ware (household ceramics)
38 1,2 2005/2006 SFC www.ceramique.fr
1.5.7 Sanitary sanitary ware 11 1,3 2005/2006 SFC www.ceramique.fr
EIE/06/222/SI2.444565 CERAMIN – Energy Consumption
28
1.5.8 Technical technical ceramics***
1.5.9 Abrasives inorganic bounded abrasives***
* : These datas are calculated about the real production of ceramic products and an aproximatively specific energy about the different types of products
**: Sum of number of enterprises belonging to 1.5.1.1 and 1.5.1.2 is 30, individual numbers of these two subbranches are estimated
*** no data available
EIE/06/222/SI2.444565 CERAMIN – Energy Consumption
29
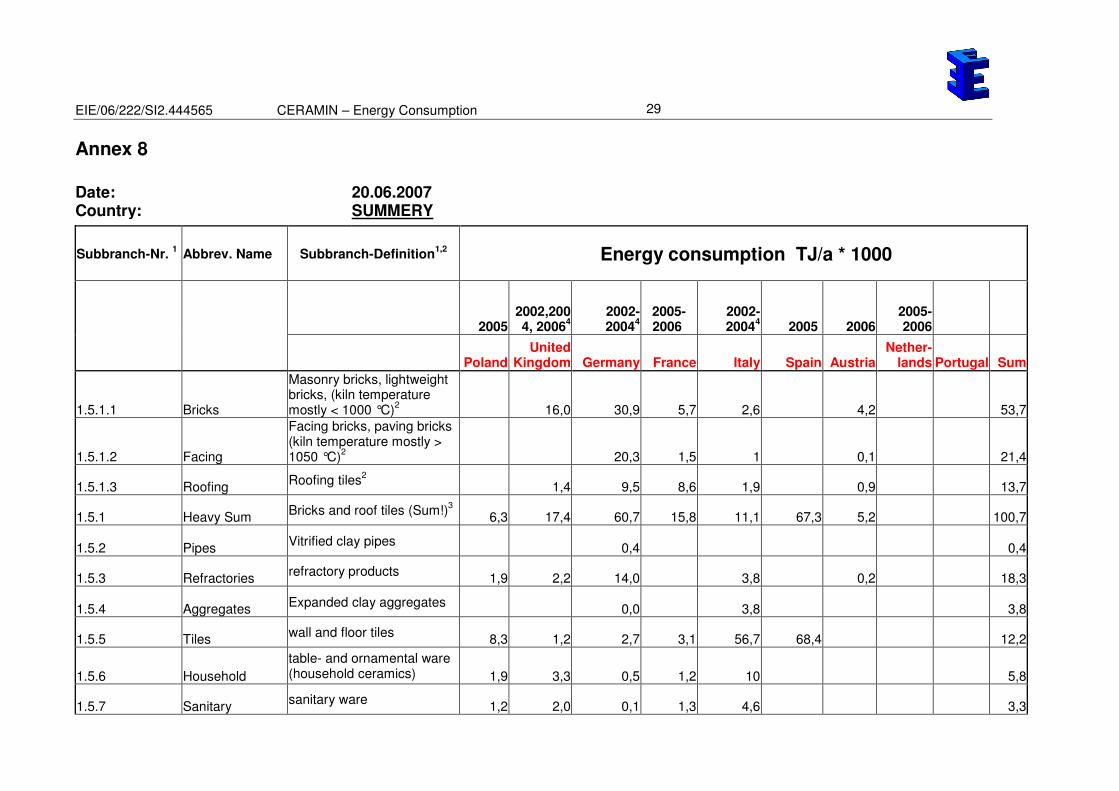
Annex 8
Date: 20.06.2007 Country: SUMMERY
Subbranch-Nr. 1 Abbrev. Name Subbranch-Definition
1,2 Energy consumption TJ/a * 1000
2005
2002,2004, 2006
4
2002-2004
4
2005-2006
2002-2004
4 2005 2006
2005-2006
Poland United
Kingdom Germany France Italy Spain Austria Nether-
lands Portugal Sum
1.5.1.1 Bricks
Masonry bricks, lightweight bricks, (kiln temperature mostly < 1000 °C)
2 16,0 30,9 5,7 2,6 4,2 53,7
1.5.1.2 Facing
Facing bricks, paving bricks (kiln temperature mostly > 1050 °C)
2 20,3 1,5 1 0,1 21,4
1.5.1.3 Roofing Roofing tiles
2
1,4 9,5 8,6 1,9 0,9 13,7
1.5.1 Heavy Sum Bricks and roof tiles (Sum!)
3
6,3 17,4 60,7 15,8 11,1 67,3 5,2 100,7
1.5.2 Pipes Vitrified clay pipes
0,4 0,4
1.5.3 Refractories refractory products
1,9 2,2 14,0 3,8 0,2 18,3
1.5.4 Aggregates Expanded clay aggregates
0,0 3,8 3,8
1.5.5 Tiles wall and floor tiles
8,3 1,2 2,7 3,1 56,7 68,4 12,2
1.5.6 Household
table- and ornamental ware (household ceramics) 1,9 3,3 0,5 1,2 10 5,8
1.5.7 Sanitary sanitary ware
1,2 2,0 0,1 1,3 4,6 3,3
EIE/06/222/SI2.444565 CERAMIN – Energy Consumption
30
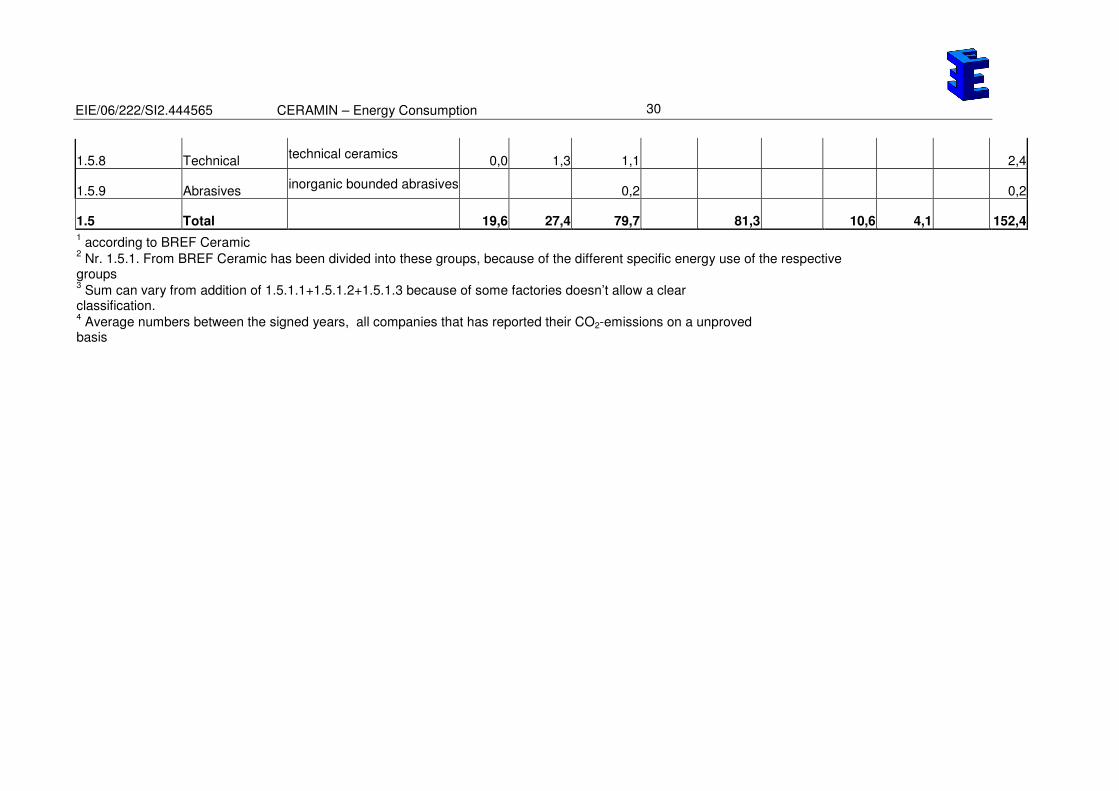
1.5.8 Technical technical ceramics
0,0 1,3 1,1 2,4
1.5.9 Abrasives inorganic bounded abrasives
0,2 0,2
1.5 Total 19,6 27,4 79,7 81,3 10,6 4,1 152,4 1 according to BREF Ceramic
2 Nr. 1.5.1. From BREF Ceramic has been divided into these groups, because of the different specific energy use of the respective
groups 3 Sum can vary from addition of 1.5.1.1+1.5.1.2+1.5.1.3 because of some factories doesn’t allow a clear
classification. 4 Average numbers between the signed years, all companies that has reported their CO2-emissions on a unproved
basis
EIE/06/222/SI2.444565 CERAMIN – Energy Consumption
31
Annex 9: Energy consumption of European ceramic industries sub-branches
0
20
40
60
80
100
120
140
160
180
200
Bricks Facing Roofing Heavy Sum Pipes Refractories Aggregates Tiles Household Sanitary Technical Abrasives
1.5.1.1 1.5.1.2 1.5.1.3 1.5.1 1.5.2 1.5.3 1.5.4 1.5.5 1.5.6 1.5.7 1.5.8 1.5.9
Ceramic Branch according to BREF Ceramic and Subbranch Definition of CERAMIN (look chapter 2)
En
erg
y C
on
su
mp
tio
n T
J/a
Poland UK Germany France Italy Spain Austria NL Portugal Sum
= 1.5.1.1 + 1.5.1.2 + 1.5.1.3
+ companies that can’t be
clearly classified
EIE/06/222/SI2.444565 CERAMIN – Energy Consumption
32
Annex 10: Energy consumption and number of ceramic enterprises of different EU-countries (calculated from CO2-emissions)
0,0
50,0
100,0
150,0
200,0
250,0
300,0
350,0
400,0
450,0
500,0
Polan
d
UK
Ger
man
y
Franc
e
Italy
Spain
Austri
a
NL
Cze
ch
Belgu
im
Hun
gary
Gre
ece
Den
mar
k
Portu
gal
Sum
TJ
/a*1
00
0
0,0
200,0
400,0
600,0
800,0
1000,0
1200,0
1400,0
1600,0
1800,0
2000,0
Nu
mb
er
energy consumption Number of enterprises