Embed Size (px)
Citation preview

IbYNAMIC AND STATIC FATIGUE OF SILICATE GLASSES
By
John U. Ritter, Jr. and Charles L. Sherburne
N Contract No. ONR-NO(X.'O,4-68-A-Ol46-3
Report No. UM-70-9
DISTRIBUTION OF THIS DOCUMENT IS UNLIMITED
D0D
LU9 19711
B
lkecvmhl'r 1970 ul

I
IApproved for Release
Reproduction in whole or in part is permitted for
any purpose of the United States Government. This
research was sponsored by the Office of Naval
Research under GNR Contract No. NOOOW4-68-A-0146,
Subcontract No. NOOO14-68-A-0146-3, ONR Contract
Authority Identification No. NR 200-016.
Charles Li. lutchinson
Contract Co-ManagerUniversity of Massachusetts

Iii
ACKNOWLEDGMENT
'lIis research was accomplished with the
support of the Office of Naval Research.
I!iIIiIII

iv.
I
ABSTRACT
j Fatigue of silicate glasses was studied using both static and
dynamic tests. Static t.Ligue data for acid-etched, soda-lime-silica
j glass determined at 74* F in atmospheres of 50 and 100% relative humidity
could be represented by a jingle universal fatigue curve. The UFC for
acid-etched glass does not lie on the UFC of Mould and Southwick which
was determined for aoraded soda-lime-silica glass; the acid--etched
glass being less susceptible to static fatigue. On comparing the
fatigue behavior of acid-etcied, soda-lime-silica glass to that of
pristine E-glass and fused silica fibers, little difference was iound
in the susceptibility to static fatigue. In addition, dynamic fatigue
data for a wide variety of silicate glasses (soda-lime-silica, E-glass,
pyrex, and fused quartz) was compared to fundamental crack velocity
data for these glasses utilizing the dynamic fatigue theory of Charles.
Agreement was gocd on both a quantitative and qualitative level. The
theoretical implicatioius of these results on static and dynamic fatigue
are discussed.
IJ

I
TABLE OF CONTENTS
Page
I ACKNOWLEDGEMENT iii
ABSTRACT iv
LIST OF FIGURES viii
LIST OF TABLES ix
j Section
1.0 INTRODUCTION 1
f 2.0 LITERATURE SURVEY 3
, 2.1 Strength of Glass 3
2.2 Static Fatigue 4
2.3 Fatigue Theory of Charles 5
2.4 The Universal Fatigue Curve of Mould andSouthwick S
2.5 The Theory of Charles and Hillig 7
2.6 The Crack Velocity Measurements of Wiederhorn 11
2.7 Glass Fibers 13
2.8 Static Fatigue of High Strength Glass Fibers 14
3.0 PLAN OF WORK 18
4.0 PREPARATION OF ACID-ETCIIEI RODS 19
S5.0 PREPARATION OF ABRADED RODS 22
6.0 DYNAMIC APPARATUS '5
S7.0 STATIC APPARATUS 26
7.1 The Buckling lnstability in Four Pcint Bending 26I7.2 Testing Stations 27
7.-1 Type A Static Fatigue Testing Stations 27
7.22 Type B Static Fatigue Testing Stations 33It.

I
vi
I Section Page
7.3 Environmental Chamber 36
8.0 EXPERIMENTAL PROCEDURE 39
8.1 Preliminary Invrestigations 39
8.11 Storage of Acid-Etched Rods 39
8.12 Effect of Tygon Sleeves 39
8.13 Surface Condition of Pyrex 40
8.2 Static Fatigue 41
8.3 LVynamic Fatigue 44
9.0 RESULTS OF PRELIMINARY INVESTIGATORS 46
9.1 Storage o,: Acid-Etched Rods 46
9.2 Effect of Tygon Sleeves 46
9.3 Surface Condition of Pyrex so
j 10.0 STATIC FATIGUE 54
10.1 Static Fatigue Data S4
10.2 Comparissr, of Static Facig•,u Data with theUniversal Fatigue Curve of Kould andSouthwick 59
10._ Comparison of Static Fatigue Pata with theTheory of Charles an.I Hillig 61
S11.0 OYNk$IC FATIGUE RESULTS AND THEORY OF C11ARLES 6Z
1-,.0 DISCUSSION--STATIC AND) DYNAMIC FATIGUE OF SILICATEGLASSES 63
12.1 Dynamic Fatigue 68
12.2 Static Fatigue 70
13. 0 C.ONC•IS IONS 76
I,.I0 F1r111,111W WORK 77
Ij

I
I vii
I Page
REFERENCES 78
APPENDIX A--SAMPLE CALCULATIONS 81
APPENDIX B--RE-lTIONSfIIP OF FAILURE STRESS TO STRESSING RATE 83
I
vili
LIST OF FIGURES
Number Title Page
1. Universal Fatigue Curve for Soda-Lime Glass Abradedin Various Ways 6
2. Hypothetical Changes in Flaw Geometry Due to Corrosionor Dissolution 9
3. Static Fatigue of High Strength E-Glass Fibers 15
4. Static Fatigue of Fused Silica 16
5. The Etching Apparatus 20
0. The Abrasion Apparatus 23
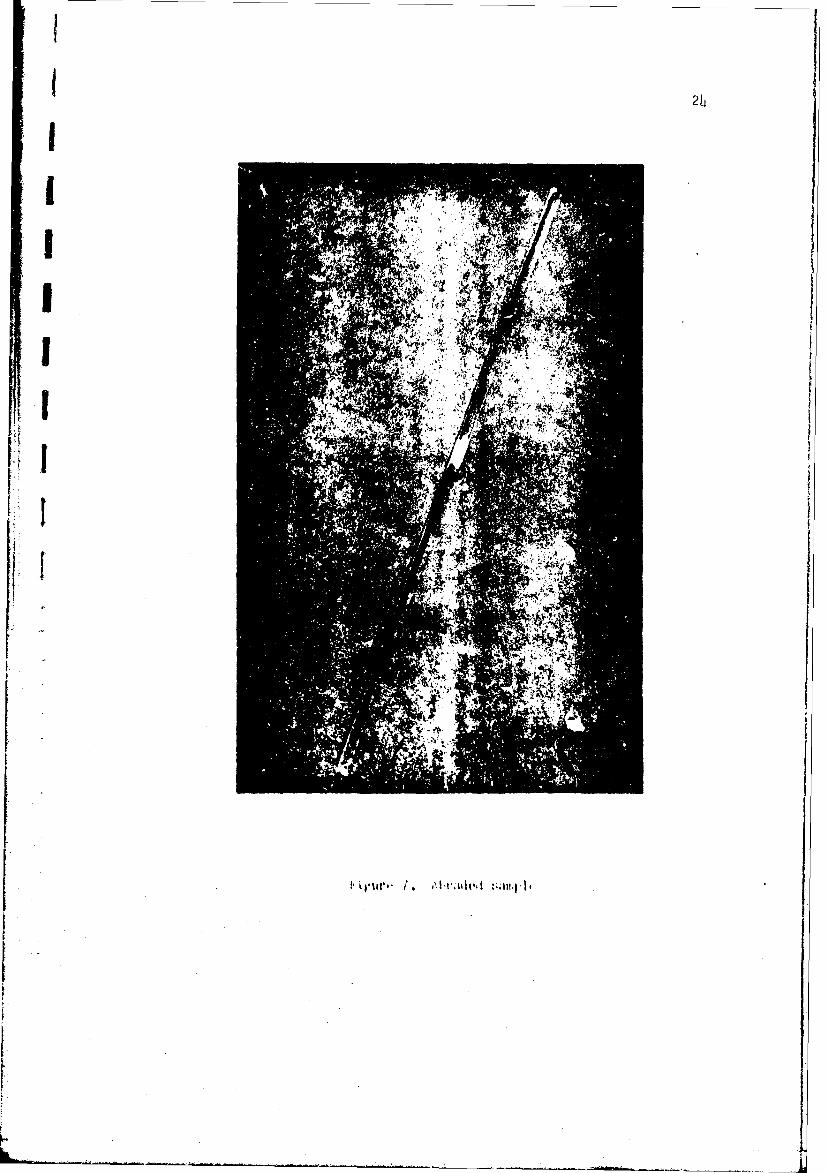
7. Abraded Sample 24
8. Schematic of Type A Static Fatigue Testing Station 28
9. Static Fatigue Test Station Circuit 30
10. Type B Static Fatigue Testinj, Station 34
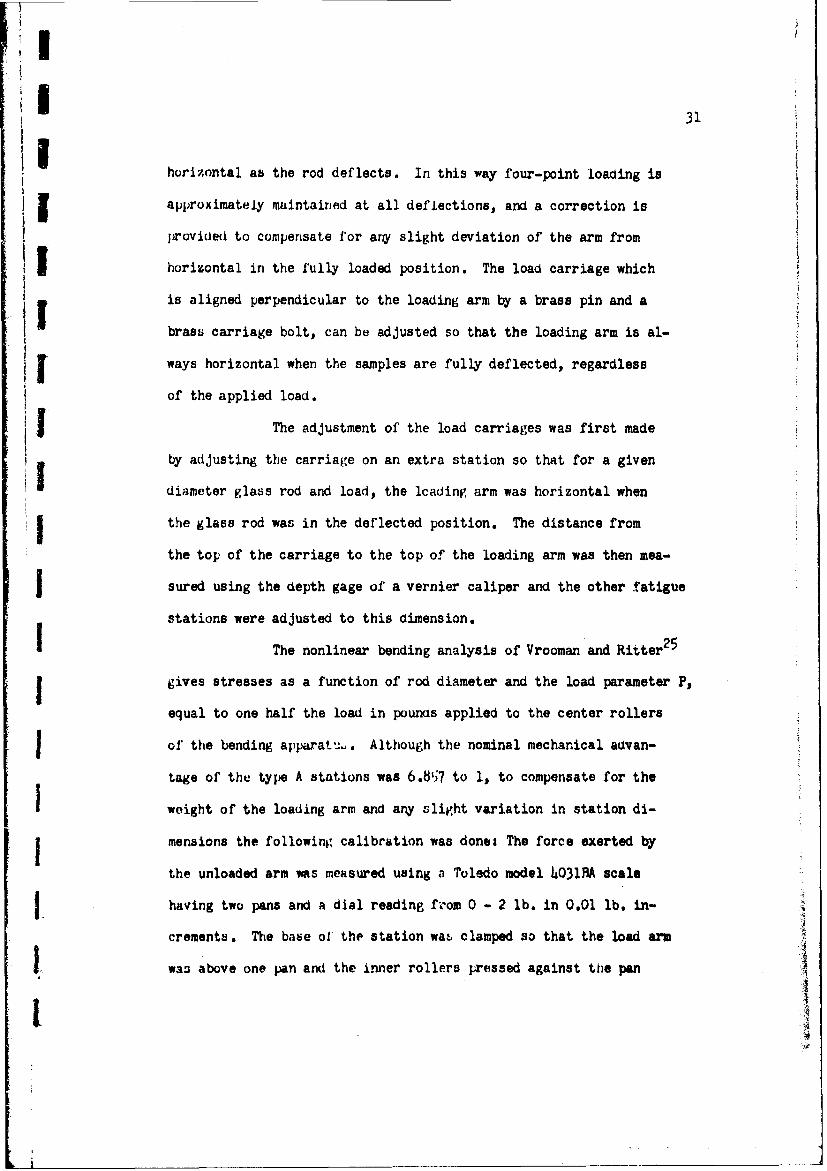
11. Environmental Chamber 37
[2. Calculated Bending Stress versuu One-Half the AppliedLokd in Four Point Bending at Various SpecimenDiameters for the Type B Fatigue Testing Station 43
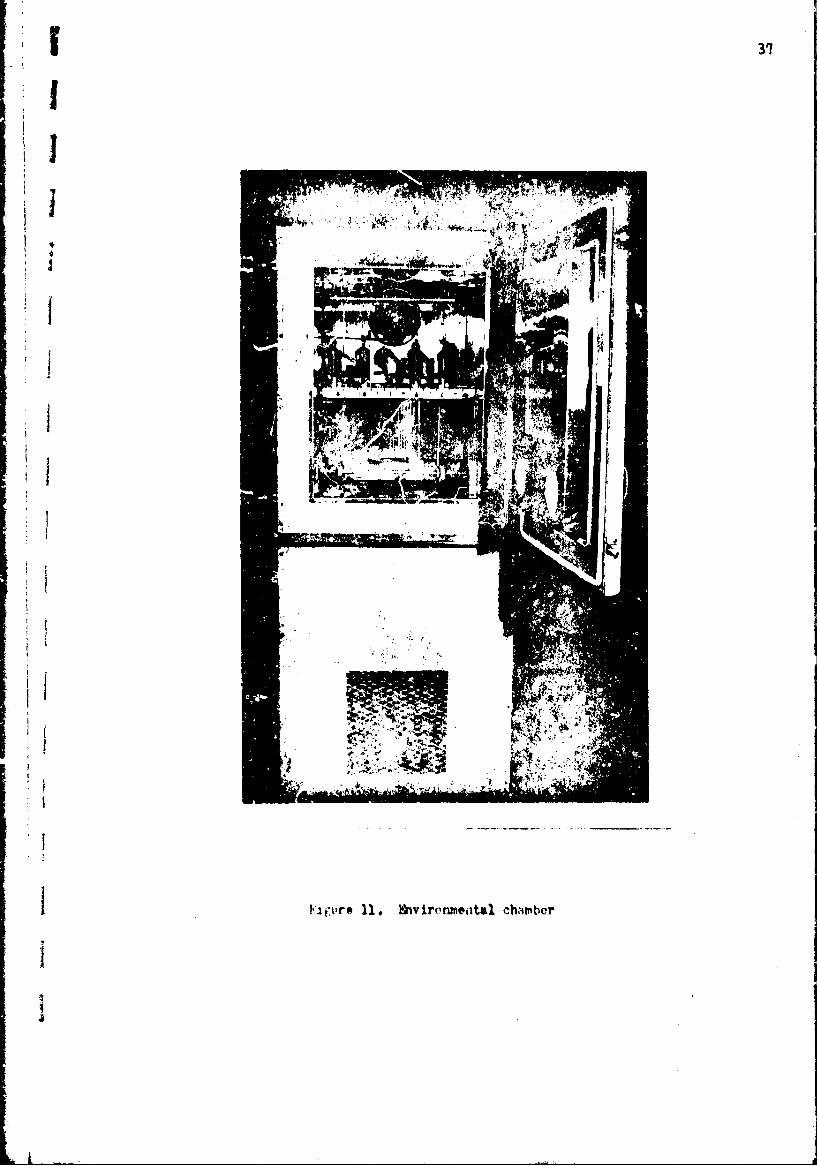
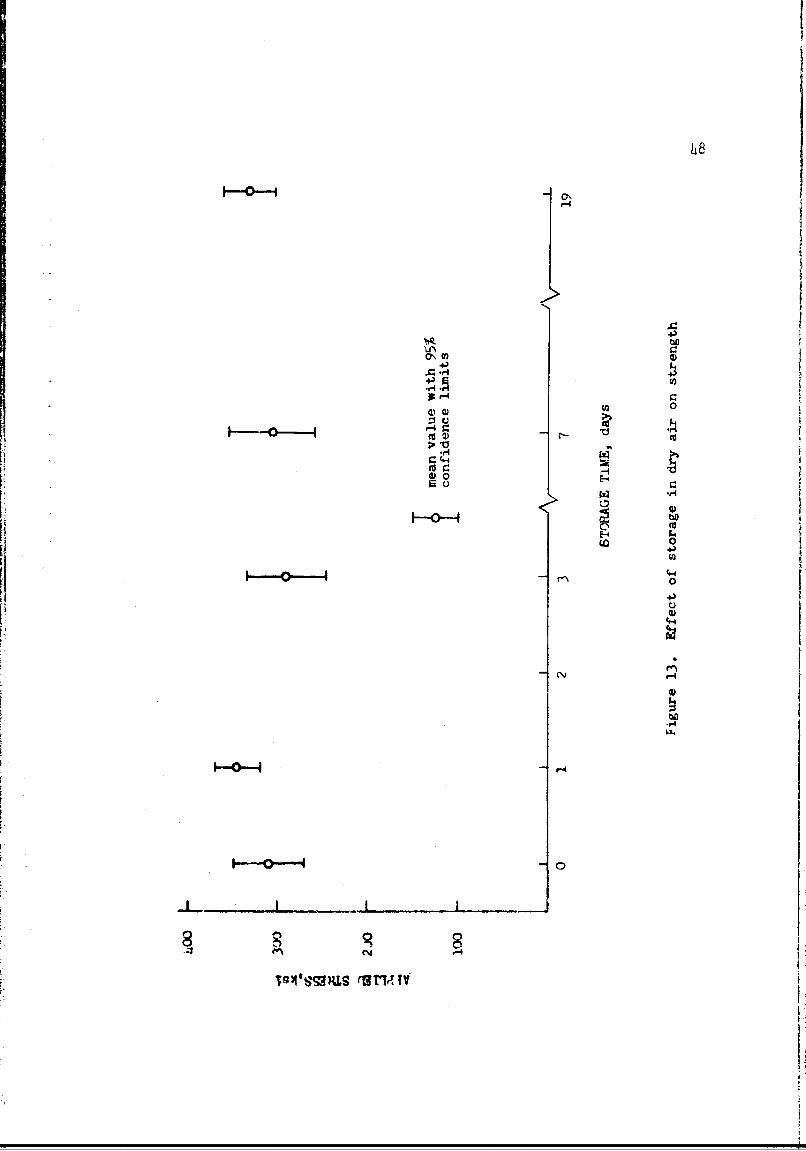
13. Effect of Storage in Dry Air on Strength 48
lb. Surface Condition of lyrex 53
15. Static Fatigue of Acid-Etched, Soda-Lime-SilicaGlass at 71- 57
16. Static katigue of Acid-Etched, Soda-Lime-SilicPGlass at 74'F and 100% Relative Humidity Flottedin Units of Keduced Stresb and Time 6)
It. Dynamic latigue o!* Fused 4uartz 66
18. iDyram!iý hatigur'- I Pyrex 67
1%). Universal Static )atigue Curve of Acid-Etched,Si;,-Liiie-Silica Glass at 714 F Y2
.' .Static katijtue of, !.Ilicate ,:labsos 7L

ix
LIST OF TABLES
Number Title Page
1. Effect of Desiccator Storage on Acid-Etched,Soda-Lime-Silica Glass Rods 47
2. Effect of Tygon Sleeves on Strength of Acid-Etched,Soda-Lime-Silica Glass Rods h9
3. Surface Condition of Pyrex 51
j. Static Fatigue oI Acid-Etched, Soda-Lime-SilicaGlass at 7I F 100% Relative Humid tt• 55
5. ";tatic Fatigue of Acid-Etched, Soda-Lime-SilicaGlass at 7h 0 F 50% Relative Humidity 56
6. Median Times to Failure Tor Acid-Etched, Soda-Lime-Silica Glass at 100% r'elative Humidityfor Various Temperatures ard Stress Levels 58
7. Dynamic Fatigue of Fused tuartz 64
8. Dynamic .atigue of Pyrex 65
9. Comparison of Crack Velocity, and Dynamic Fatigue 69Data
I.
I.

1
1.0 INTROUUCTION
An area of great teohnological importance and scientific in-
terest, is the dependence of fracture ýtress on the time of loading,
known as static fatigue. Glass loaded at a rapid rate or forced
to support a given load for a short. period cf time is found to be
relativelj strong. In contrast, glass is found to be relatively
weak 1i the load. ig rate is slow or if the glass is forced to
support a given load for a long time. The main experimental and
theoretical results on jtatic fatigu3 have been summarized 1 ' 2 and
the dominant belief is that static fatigue results from a stress-
dependent chemical reaction between water vapor and the surface
of the gla&. that causes a pre-existing flaw to grow to critical
dimensions for spontaneous crack propagation.
The theoretical stress corrosion model of Charles and Hillig3 '4h 5
has been shown to satisfy most of the experimental results on static
fatigut of abraded, low s,rength glass. However, because of its
potentially high mechanical atrength there is an increasing interest
in the use of silicat.e glasses as a practical load-bearing material
in such structures as deep submersible vehicles.2 Therefore, it
is important that the fatigue behavior of high strength glass be
well understood on both an experimental and theoretical basis.
By measuring; the dependence of' strengjth on stressing rate of abraded
and A,.'idt-etched, suda-lime-silica Riass, P~itter6 has established
twit thf svt ross corros;ion model of Chirles correctly predicts the
oef',,•t of' dyvummic loadlng on t4bh hit:h and low strength soda-lime-

2
silica glasn. Part of the objective of the present study is to
extend the experiments of hitter to test whether or not the stress
corrosion model can predict th efifect of static loading on acid-
etched, soda-lime-silica glass.
While there have been extensive studies on the effect of che-
mical composition on corrosion behavior,7 there has been relatively
little work done on relating chemical composition to stress corrosion,
although it has been shown that the susceptibility to stress corrosion
deponds on chemical composi:,ion. 8 The only extensive work known to
the present author is that of Wiederhorn(1, 10 who measured slow crack
propagation as a function of stres:; in various silicate glasses by
the double cantilever beam technique. Thus, the second phase of
the present study is to measure the strain rate sensitivity of va-
rious silicate glasses and compare these results to those of Wieder-
horn. In this way it is hoped to more clearly elucidate the depen-
dence of stress corrosion susceptibility to chemical composition.

I
" ~3
2.0 LITERATURE SURVEY
2.1 Strength of' Glass
.€All theoretical et~timates of' the steghof' gasresult
in values fron 1 x 1U6 to 5 x 10⁶ pui.2'II'12 Since the measured
strengths of glass articles are in thousands, not millions, of
pounds per square inch, Griffith13 proposed that micro-cracks or
small flaws exist at the surface of glass, By equilibrating tne
rate of decrease of strain energy associated with growth of the flaw
under stress to the rate of increase of surface anergy, he found that
the fracture strests is inversely proportional to the square root of
the depth of the surface flaw. Orowan reached the same conclusion
through an alternate derivation. Orowan proposed that fracture is
due to the stress-concentrating action at the tip of the flaw.
ýracture occurs when the applied stress produces a stress at the flaw
tip equal to the intrinsic strength of the glass. The observed
strength of a glass specimen is thus the applied tensile stress
that will ..nitiate crack propagation at the most severe flaw pre-
sent in the stressed region. Once btarted, the extension of the
crack is ensured by the applied stress and the increasing stress
concentration factor of the growing crack. Surface flaws can range
from discontinuities of atomic dciierisionb, with as:ociated strengths
ini th' range of one million psi, to gross mechanical damage that
reoucews the strength to a few thousand psi. Since the flaws cannot
grow under a compresi•ive stress:, the flaw concept aiso accounts
for the fact that glass is extremely strong in compression. The
I

tb
Ipresence of surface flaws is by far the most important single factor
in determining the observed strength of any glass specimen.
2.2 Static Fatigue
When glass supports a load the chemical interaction of at-
mospheric water vapor with the glass surface often leads to a time-
dependent reduction in strength, known as static fatigue or delayed
failure. Excellent reviews of the subject have been written by
several authors. It is generally believed that static
fatigue results from a stress-dependent hiemical reaction between
water vapor and the glass surface which causes an alteration in the
shape and/or depth of surface flaws. The rate of the reaction is
thought to increase with the state of stress at the surface, the rate
increasing with increasing stress. Because of the stress concentra-
tion effect, the chemical reaction proceeds more rapidly from the
tips of surface cracks, and since the reaction products are weaker
j than the unreacted glass, the c racks lengthen with time. Failure
occurs when the crack is su'ticiently long to satisfy the Griffith
f criterion. That is when the stress at the c rack tip increases to
the ultimate cohesive strength of the glass. The time to failure
in a static fatigrue test is the time for a surface flaw to grow from
subcritical to critical Griffith sly.e. This time depends on the
magnitude of the applied stress, the duration of exposure to a
j reactive environment, and physical parameters characteristic of the
material.
!

5
2.3 Fatigue Theory of Charles
Charles assumed flaw growth at a constant temperature
Jmay be described by an equation oI the form
vx = k (')
where vx = velocity of the flaw tip in the x direction (the direction
* of maximum tensile stress gradient), a' = normal tensile stressm
at the flaw tip and k,n = constants. He derived that for the case
of dynamic fatigue, where an increasing load is applied until failure,
the breaking strength of glass should vary with the rate of stress
application as follows:
0' = KP /n+l (2)
where 0 af = macroscopic applied tensile stress at -which failure
occurs,/3 = rate of stress application, and K = constant.
2.h The Universal Fatigue Curve of' Mould and Southwick
The most comprehenasive experimental investigation of static
fatigue was conducted by Mould and Southwick15 who studied delayed
failure as a funr:tion of stress over nine logarithmic decades of time.
Workinlt, with soda-lime-silica glass micf ),,;cope slideti subjected to
a vaw•ity of' surkice atrazioriu, they found that the static fatigue
NiUImvior could bt, •.hur'c Lurlv'toti tLy .i -.iti.1e curve, kig. 1, when
Ja ilur,, tk.inj :ind :ipilied stres,-,,'-artr, riven in reduced units.
The r4duced tr, it; defined as. ( /0- where (- is the fractureN N
:;tresz- measured at liquId nitrQpefl umsperature. The reduced tipe

I
16
ILO
I 0.9 Symbol Abrasion
• b
0.7
0 f2
Q3
I I * ,.. . i -.....
I
F'igure 1. Universal fatigue curve for soda-lime +: ao••rticed in
I I
various ways (after Mould and Southwick ).G"is the
Sapplied stress. o-N is the fracture stres~s me:asuredf
IQ
' ~at liquid nitrogen temperatures. t is the delayed
failure time. t is the failure time at une-hallf0.5
the strength at liquid nitrogen temperaturc.

!
is defined as t/to. where t is the delayed failure time at one0.5 0.5
I hail the strength at liquid nitrogen temperature. It should be em-
phasized that the abrasions studied covered only a small range of
severe damage with correspondingly low strengths and that the curve
was determined for soda-lime-silica glass tested at room tempera-
ii ture in distilled water.
2.5 The Theory of Charles and Hillig
Charles and Hillig5 by refining the original model of Charlesh
developed a stress corrosion model that best satisfies the available
* experimental data. They considered an isotropic, brittle material
as an elastic continuum which chemically reacts with its environ-4
ment. Failure of the material under load was attributed to an
alteration, by a corrosion reaction, of the geometries of pre-exis-
ting flaws or cracks on the surface. The model analyzed was an
elument of material under uniaxial stress and containing a semi-
elliptical surface flaw. The equation developed for the velocity
of a moving crack in a corrosive environment and having a crack
* tip stress cr was
V = v exp- ( - V*-+ Cc"r + r Vm/2e )/RT (3)
where v0 represents the corrosion rate for a stress free surface
and V is termed the activation volume. The term Co" represents
Ij the combined effect of the disappearance of strain energy and a
second order term in the expansion of activation free energy.
SThe term /Vo/2C represents the effect of curvature of the reaction
I

surface. I' is the surface free energy of the glass-corrosion
product interface. Vm is the molar volume of the glass and
is the radius of curvature of the crack tip. Charles and Hillig
utilized the above velocity equation to derive a differential
equation expressirib the change of flaw contour with time. Three
different chang,,es in flaw geometry depierident on the level of applied
istress are illustrated in Fig. 2. In Fig. 2a the glass is under
no stress and the corrosion process attacks all surfaces uniformly.
This rounds out the flaw tip and leads to a reduction in stress
concentration and an increase in strength. This is what occurs,
for example, on etching glass in hydrofluoric acid. When the applied
stress is just insufficient to cause immediate fracture, it is
assumed that corrosion takes place more rapidly in the highly stressed
region near the crack tip. The crack lengthens and 6harTenj with
time, which increases the stress concentration until eventually
catastrophic failure occurs, Fig. ?c. At some intermediate applied
stres,; the sharpening, ofe the flaw by stress corrosion is balanced
by the rounding out effect and the stress concentration of the flaw
remains constant, Fig. 2b. This accounts for the existance of a
fatigue limit in static fatigue.
Ey making various assumptionis about flaw geometry ana size,
the following basic equations for static fatigue wer'e derived:
[3C r v, "s 8, u ,
!I
mil m in m u m• • m m m umum • m• u • • •, • nN wli nl• nm~ a w• mu~um ~ m , • u• lnw •

FIiI
i I I III I
I I
Figure 2. Hypothetical changes in flaw gr.ometry due to corrosion
or dissolution: (a) flaw rounding by corrosion; (b)
flaw growth such that the rounding of the til by stress
corrosion balances the lengthening of the flaw; (c) flaw
.iharpiening as a re-ult of stress corrosion (after Charles
Iaio hilli )

I
10
IS is the fatigue limit stress, the applied stress below which no
failure of' the specimen can occur. is the theoretical strength
of the material. L is the initial depth of t~he flaw. The other
I terms are as previously defined.
-VIn t/to. -G-- (OT-/hN (5)
t/t is defined as the reduced time where t is the time-to-failure
at one-half the liquid nitrogen failure stress. C-/C-F is definedN
as the reduced stress where o- is the failure stress and OcN is the
failure stress at liquid nitrogen temperatures. It is important
to note that static fatigue is not observed at liquid nitrogen tem-
peratures, therefore - reflects the initial flaw size of a givenUN
sample without prior flaw growth. f(C-/O-N) is a slowly varying
function which relates the short time behavior of t.he fatigue system
to the time behavior of the system ai it approaches the fatigue limit.
Thus, this theory provides a basis for the broad understanding of
the delayea failure process in terms of readily interpretable
parameters and allows quantitative predictions to be made of the
effect of' tempdrature, corrosive environment, surface tension, etc..
L}y comparing the exp~erimentally .eteri-ined slope and fatigue limit
of the uriiverýal fati6ue curve of Moula and Southwick with the
expectations of Eq. (4) and (5), Charles and Hillig obtained rea-
sonablt, valuer 'or the parameters (T , V , and and the experi-
merntally me•sured quantities 1] and SL,

2.6 The Crack VelociLy lPeasurements of Wiederhorn
A9ii Wiederhorn used the double cantilever cleavage technique
tu study the effect of water vapor on crack propagation in soda-
lime glass. He found the crack motion could be divided into three
regions. In Relrion I the crack propagation was due to the corrosive
attack of' water vapor on the glass at the crack tip. The crack
velocity in Region II was believed to be limited by the rate of water
vapor transport to the crack tip. In Region III an unknown propaga-
tion mechanism occurred which was independent of' water vapor con-
centration.
5From the crack velocity equation of Charles and Hillig,
SI iWiecerhorn derived a relation that relrer--ted the crack velocity
behavior of' Regions I and 11, however, his theory only partially
explained the effect oi' water vapor concentration on crack velocity
in Itegion II. The disagreement was thought to be due to the un-
certainty of the chemical reactions occurring at the crack tip
and tte assumption of a constant boundary layer thickness at the
crack tip. No satisfactory explanation was found for crack propaga-
I tion in Region Ill.
JO"Recently Wiederhorn showed that his data may be representedI
by velocity equation of' the form
I
" v , V ,x:,. - # - b K (6)tf
II wh,,re K vr tHe W .tre.i cand eU:tritoua Exctor for tie notched double1] cantilever confii'urat~ion ;rin b, vand. • are experiwental constants
SVo
I
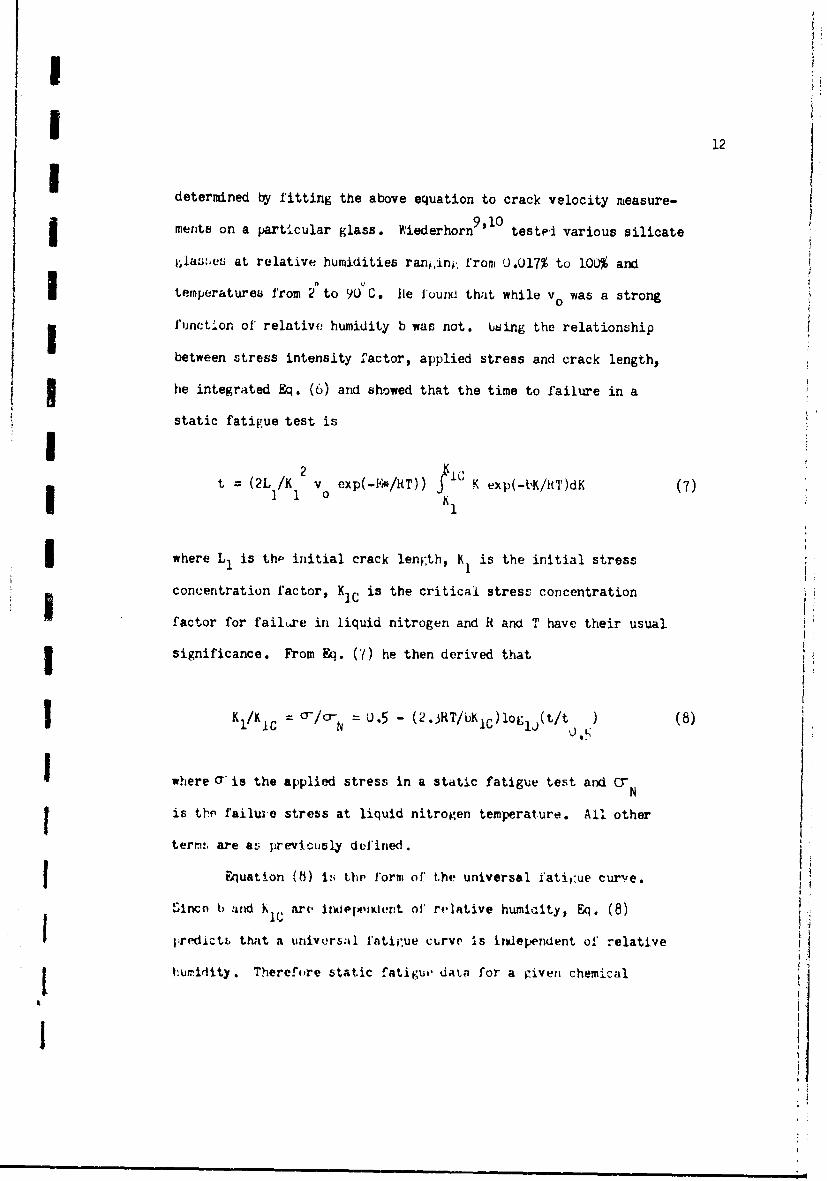
i I 12I,.determined by fitting the above equation to crack velocity measure-
I ments on a particular glass. Wiederhorn91I0 tested various silicate
jjas:se at relative, humidities raniinp from 0.017% to 1O0% and
temperatures from 2"to 90 C. lie found that while v was a strong
function of' relative humidity b was not. Using the relationship
between stress intensity factor, applied stress and crack length,
i3he integrated Eq. (6) and showed that the time to failure in a
static fatigue test isI2 I
t (2L/K v exp(-IE*/RT)) K exp(-bK/RT)dK (7)I 1 1 o •
I where LI is thp initial crack length, K1 is the initial stress
concentration factor, KIC is the critical stress concentration
factor for failire in liquid nitrogen and R and T have their usual
significance. From Eq. ('7) he then derived that
K K1lKic = N = 0.5 - (2.3RT/bKiC)logl1,tlt) (8)
Swhere Y is the applied stress in a static fatigue test and (3-N
is the failuie stress at liquid nitroren temperature. All other
term-- are as previously defined.
Equation (%8) 1 the form of* the universal fati1 :ue curve.
Sinco b and Khc art, iwlwiehlKient of relative humloity, Eq. (8)
I redictt, that a universal fatig-ue curve is irdependent of relative
I |huridity. Therefore static fatikut, daLa for a given chemicalI

L I13
composition and fixed temperature should lie along the same uni-
vIrw J'atipue curve regardless of' what relative humidity is chosen
for tetsting , The equation also predicts that the effect of increasing,I*temperature on a universal fatigue curve should be to increase the
slope in the negative sense.
Eq. (b) may also be rearranged to get
Cr= (-2.3iTTO-/bK )loglot + (O.5C-N + 2.3RTO'N/bK.C)loglot 0 .5 (9)
This is the form of static fatigue curves presented in the usual
way (failure stress versus log time to failture). Eq. (,)) predicts
that static fatig;ue curves for a given chemical composition and
temperature but determined at different relative humidities are
parallel and are just shifted i'ith respect to one another by an
amount determined by log to.50
2.7 Glass Fibers
The strengths of glass fibers are greater than any of the
commonly available materials of construction. Pristine F-glass
Sfibers exhit:it averAge streng,.hs of' '.2 x 10 psi in room environment
and d.2 x I0 pui at liquid nitrogen temperatures, it is thought
that the strength at liquid nitrogn temperatures represents the
theoreLical strenigth of uidamaged glass fibers. At liquid nitrogen
temperaturev; thermally activated corrosion processes are practically
inoperative. It is believed that in undamaged fibers fracture is
initiated by interstices in the atomic structure. The lower strengths
I,"

I
Iin room atmosphere are believed to result from static fatigue.
1 2 .8 Static Fatigue of High Strength Glass Fibers
I Static fatigue curves for E-glass fibers from various investi-
19 20pators are shown in Fig. 3. Both Otto and Hollinger et al. took
their data at room temperature and 50% relative humidity. Schmitz
and Metcalfe2 1 obtained their data at 100% relative humidity and
temperatureL between 8f and 860F. The curve and data points marked
I Hollinger, et al., was obtained by reading the data points from
a plot in Reference 20 then taking the least square- line. The
curve marked Otto is the line throuigh his data as read off his
f! graph by the present author. The curvo and data points marked
Schmitz and Metcalfe were read from Rteference 21. Fr~om Fig. 3
it can be seen that the static fatigue curve of E-glass does vary
somewhat from investigator to investigator. This could be due to
differences in temperature, chemical composition, handling, or
zv'anufacturing processing. It is interesting to note that Schmitz
and Metcalfe did not observe a fatigue limit but instead a drop
off in their data. The reason for this is unknown.
lure fusod Lilica is believmi to be the strongest of the
silicate glasses. Morly et al. have obtained average strengths
of H.5 X10 psi. n room atmosphere with fibers of fused silica.
6In liquid nitrogen strengths increa:se to 2.0 x1O psi. Proctor
f et ai.23 investigated static fatigue of fused silica at 30eC and
100% relative humidity. Figure 4 shows the line he determined
through hiF data as read by the present author from a plot in Refer-
1

*15
IIY
III - Nla
r4.
co Co
0 lot
C %J
0K
Iý C~14Tox~~ 'mt a m

1 16
40
A F-4to g .
04
-r-4
C0,
r-I,
UN-

'I 17
I on'ce 23. The remarkably high strength of fused silica is evident
I ~by co>mparis(on with E-glass Fig. 3.
Iii
ii
ii
iI
i
IIA

|i 18
3.0 PLAN O• WORK1After reviewing previous literature, it was proposed to
experimentally determine the static fatigue curve (failure stress
vs time to failure) of high strength, acid etched, soda-lime-silica
glass rods at 74°F and relative humidities of 50% and 100%. These
results will be compared to the universal fatigue curve of Mould and
Southyiick 1 5 and theoretical predictions of the stress corrosion
theory of Charles and Hillig.5 Using this st .ss corrosion theory,
fundamental parameters describing stress corrosion will be determined.
By making additional static tests at 100% relative humidity and
different temperatures, an attempt will also be made to determine
the apparent activation energy for stress corrosion.
In addition, the susceptibility to stress corrosion of fused
quartz and borosilicate glass will be determined by measuring the
[ jdependence of strength on stressing rate. The results will be analyzed
in the light of Weiderhorn's 9 '!o crack velocity studies and Charles'
Stheory3 of dynamic fatigue. An effort will be made to correlate
Wiederhorn's fundamental crack velocity data with the dynamic fatigue
data of various silicate glasses.
Ir
719
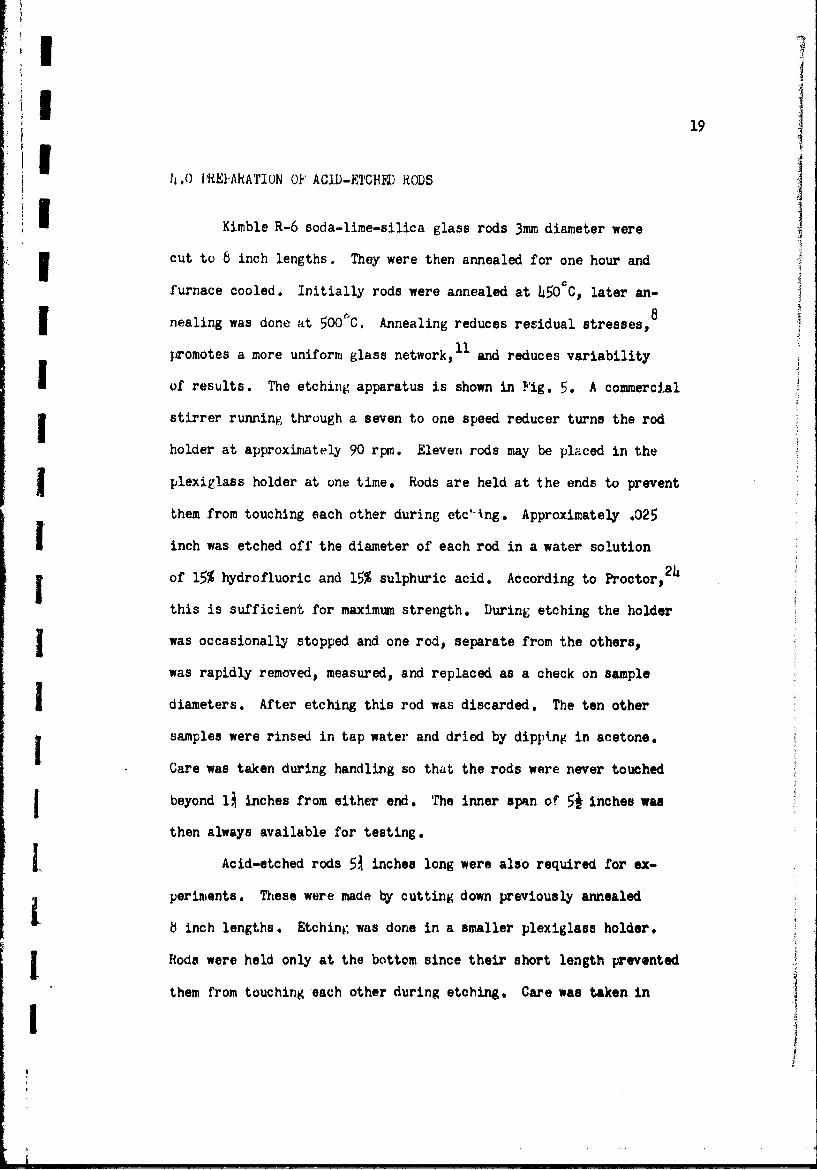
I ~h .() MI'M1AATION OFh ACID-FTCHFN) RODS
iIi
Kimble R-6 soda-lime-silica glass rods 3mm diameter were
cut to 8 inch lengths. They were then annealed for one hour and
furnace cooled. Initially rods were annealed at 45OCC, later an-
nealing was done at 5006C. Annealing reduces residual stresses,8
promotes a more uniform glass network, 11 and reduces variability
I of results. The etching apparatus is shown in Fig. 5. A commercial
stirrer running through a seven to one speed reducer turns the rod
holder at approximately 90 rpm. Eleven rods may be placed in the
j plexiglass holder at one time. Rods are held at the ends to prevent
them from touching each other during etc'Jing. Approximately .025
1 inch was etched off the diameter of each rod in a water solution
of 15% hydrofluoric and 15% sulphuric acid. According to Proctor, 2s
this is sufficient for maximum strength. During etching the holder
J was occasionally stopped and one rod, separate from the others,
was rapidly removed, measured, and replaced as a check on sample
I diameters. After etching this rod was discarded. The ten other
samples were rinsed in tap water and dried by dipping in acetone.
Care was taken during handling so that the rods were never touched
I beyond 11 inches from either end. The inner span of 51 inches was
then always available for testing.
S..Acid-etched rods 51 inches long were also required for ex-
periments. These were made by cutting down previously annealed
8 inch lengths. Etching was done in a smaller plexiglass holder.
Rods were held only at the bottom since their short length prevented
them from touching each other during etching. Care was taken in
| I

IIIIIII
iiI
K 'LI
III
I, i� I A �'t*�''�'� lbII
LI

21
handling so that these rods were never touched more than 3/4 inch
in from either end. An inner span of 3 3/4 inches was always avail-
able for testing. After preparation acid-etched rods were storedH ' in a debuicator (Section 9.1) or tested immediately.
<I
Ii
I
Ij!
1ii
,I

1m 22
5.0 PiEPARATION OF ABADED RODS
SI Caorai26,
The abrasion apparatus, similar to that of Caporai 2 is
shown schematically in Fig. 6. It was used to produce a controlled
reproducible abrasion in the sample surface. In operation Qompressed
I air ib regulated to 7 psi and fed to the grit supply and grit blast
inlets. The motor is adjusted to rotate the glass rod at approximately
250 rpm. The compressed air it turned on for 5 seconds. Number 240
silicon carbide grit is blown through the blast nozzle against the
sample and the result is shown in Fig. 7. Although the visible
area of highest flaw density isi relatively small, it should be noted
that practically the entire length of the sample is exposed to abra-
,I sion during blasting. After blasting the samples were rinsed in dis-
tilled water to remove any clinging grit. They were then ready for
ageing treatment (Section 8.3) or immediate testing.
L~I

I
As Grit reservoir plug
B: Grit reservoir
A) Cs Air inlet 7 psi
/ 1),: Solder fill
E Fz: 1last funnel
IF: Glass rod0. G Aluminum coupling
[H: Elect~ric motor 250 rI~n
S1: Wa.-t,e, outlet
KJ: Rubber plug
h,: Air inlet 7 psi
L: Grit entry
/1
I F-®
fl771i1I
.4
1 0I'it-ure r,. Abrader schelndtie
L
I
IIIII
I'I
II
If
I
F

|I 25
6.0 bYNAMIC A}'HIAATUS* 6
The dyn;mnic apparatus used by Ritter to measure breaking
strength in a dynamic test was mounted in an Instron universal test-
ing machine. This is a four point bending apparatus with inner and
,iter spans of 0.813 and 2.808 inches respectively. The supportsare ball be:.rings ol' 0.750 inch diameter. The inner rollers are
fitted with brass sleeves having a peripheral radial groove with
a diameter of .7b0 inch. This ;roove enables . specimen to sit
stably on the center rollers while the outer rollers are brought
into contact with it. Cross head speed on the instron could be
varied from .005 to 5 cm/min. The specimen is accessible during
j test so that it can be wetted if desired.
iI
III
II
I

I
7.0 STATIC APPARATUS
I 7.1 The Buckling Instability in Four Point Bending
I In investigating the fatigue behavior of pristine soda-lime-
silica glass in four point bending, large deflections are imposed
on the glass rods. These large dc(r-+ions lead to non-linear re-
I lations between load and deflecticn. Therefore, the assumptions
of Limple beam tLhory are no longer applicable. These assumptions
j Iinclude that the reactions at the supports are vertical, and that
2the term (dy/dx) is small compared to unity in the expression
I for curvature. Also, the effect of shifting of the point of tan-
j gency at the load and support points is not considered in simpleU
beam theory. Therefore, for large deflections the complete non-
f linear differential equation governing beam deflection must be
solved and corrections made for changes in geometry during loading
I as well. Recently this has been doiie by Vrooman and Ritter25
using numerical techniques. Their solution shows that in a four
point bending test with large deflections simple beam theory may
result in a significant error in comparison with the numerically
calculated stress. They also show thRt above a certain load a sample
will buckle and pull through the outer span. The stress corresponding
to the bucklini, load represents the maximum stress that can be mea-
sured. All the fracture stresses for acid-etched glass specimens
where large deflections occurred were calculated using the numeri-
cal analysis of Vrooman and Ritter.

7.2 Tes.inp Stations
Two types of testing stations were used to investigate static
if fatigue. These were basically similar in design and were termed
types A and B. Dimensions of the A type testing station are such
J that four samples could be tested simultaneously inside the envi-
ronmental chamber while only one sample could be tested using the
type B station. Therefore, for static fatigue tests at the lower
I stress levels, where failure times are likely to be appreciable,
the type A stations were used. The type B station was designed for
J testii at stre,,s levels above the buckling stresst of' type A. It
was anticipated that such tests would be required for high stress
levels at 50% relative humidity.
1 7.21 Type A Static Fatigue Testing Stations
S•Fit,. h is a schematic sketch of a type A static fatigue
testing station. These stations were originally used by Ritter
I and Vrooman2 7 and were modified for the present investigation.
The load is applied to the glasu rods in four point bending through
n pivoted load ;rin. Altlr a specimen f'ractures thn load arm is
j ,aught by m rubber bumper to prevcoi. shock loads in adjoining sta-
tions. The wei,,,hts which are attached to the ends of the loading
I arms are commercially available kilogram sets having a tolerance
ofI 1.0 gramsi; per kilogram and are enamel coated to resist corrosive
environments.
J >ilure times are recorded by eight electrical dig-
Ij
I

II 2 8
V, .i
Ii 0
0 cc
.r4II)
804
100Ito r-4 0r4'.
0 W$44-
4.I,

29
'I ital clocks mounted on a panel board which are turned on and off
by microswitches which sense the position of the loading arm during
specimen loading and after fracture. Two clocks are used for each
station. The first records the time in minutes and tenths of' minutes
up to six digits. The second records the time in seconds and tenths
I of seconds up to five digits. The electrical schematic is shown
I in Fig. 9. Four parallel circuits of this type were used. All
materials in the fatigue apparatus are aluminum, brass, or stainless
steel to resist the corrosive atmosphere of water vapur used in
the fatigue tests.
The loading arm is 12 inches long, providing a nominal me-
g chanical advantage of 6.857 to 1. The arm pivots in a .625 inch o.d.
sealed stainless steel bearing to reduce friction. The outer supports
are .750 diameter stainless steel rollers having a .125 inch radial
groove of .621 inch diameter, The grooves enable a glass rod to
i rest stably in the center of the roller and provide accurate align-
ment of the specimen during testing. The load is applied at the
center of the 31 inch gage length between the outer rollers through
sealed stainless bearings of .625 inch dia-eter. The inner rollers
are 1.31? inches apart. Both the load and support rollers are pinned
to allow the glass rod to deflect with a minimum of friction at
i the supports. In addition, the load bearings are attached to an
aluminum block which is pinned so that it can pivot in the loading
carriage. As the arm is lowered, two bearings adjust to a hori-
sontal position when they contact the glass rod and remain eseentially
.1

I30
II12UV 11
I R
SI-'Ll L2
I
I
Figure 9. Static fatigue test station circuit
I IIS1 is the microswitch against the loading arm
and turns timers on during loading.
")S2 is the microswitch below the load arm to shut
timers off when sample fails.
Dl, U2 are digital readout timers.
kLl, PL2 are pilot lights.
r.
I31
horizontal as the rod deflects. In this way four-point loading isA approximately maintained at all defiections, and a correction is
provided to compensate for any slight deviation of the arm from
11 horizontal in the fully loaded position. The load carriage which
is aligned perpendicular to the loading arm by a brass pin and a
brass carriage bolt, can be adjusted so that the loading arm is al-
I ways horizontal when the samples are fully deflected, regardless
of the applied load.
< I The adjustment of the load carriages was first made
by adjusting the carriage on an extra station so that for a given
diameter glass rod and load, the lcading arm was horizontal when
the glass rod was in the deflected position. The distance from
the top of the carriage to the top of the loading arm was then mea-
• •sured using the depth gage of a vernier caliper and the other fatigue
stations were adjusted to this dimension.
The nonlinear bending analysis of Vrooman and Ritter25
gives stresses as a function of rod diameter and the load parameter P,
equal to one half the load in pounds applied to the center rollers
Sof the bending apparatus. Although the nominal mechanical advan-
tage of the type A stations was 6.807 to 1, to compensate for the
weight of the loading arm and any slight variation in station di-
mensions the following calibration was donei The force exerted by
the unloaded arm was measured using a Toledo model 4031RA scale
having two pans and a dial reading fr-om 0 - 2 lb. in 0.01 lb. in-
crements, The base of the station wa•. clamped so that the load armwrSwas above one pan and the inner rollers pressed against the pan "•
I l

32
., Ithrough ground spacer blocks. Weights were added to the other
4par until the load arm wa1 horizontal as measured by a bubble type
level, Weights used were commercial kilogram sets having a toler-
I ance of 1.0 grams per kilogram. Then the scale reading was added
SI to the weight in the second pan and the weight of the spacers
was subtracted to give the weight of the unloaded arm. The mecha-
nical advantage was computed using the following formula:
A = wt. in pan + scale reading - wt. of arm - wt. of' spacers (10)load
Where A is the mechanical advantage and load is the weight hung
on at the end of the loading arm. Loads of 500, 1000 and 150O
I: grams were used and mechanical advantage was computed for each load.
This procedure was then repeated for the three remaining station.
The measured weights of the unloaded arms were then averaged.
The computed values of mechanical advantage for each station were
averaged and the average taken oif these. The average arm weight
I was 1.� a 8 lbs. and the average mechanical advantage of all stations
was 6 85 in arreement with the nominal value of 6.857. Therefore,
for all stations the total V orce F in lb,;. exerted on a specimen
by the center rollers was considered to be given by
F - 1.98 + 6.85 x LOAD (LB) ()
Since P is one half the total force, the relation between load hung
on the encý of' the loading arm in grams and P in lbs. is

S33
LOAD (Gm) = (P-.99) x 453.59 (12)xiT? -
Focr all static fatigue tests using type A stations, P wa3 deter-
mined at a g'.ven stres., level from a plot of the nonlinear analysis
arid the above equation was used to determine load. The average
buckling stress of the type A station was 280000 psi for the rod' size range used. Therefore, static fatigue tests using the type A
stations were not made at stresses above 270,000 psi.
I To determine the minimum response time of the appara-
tus using the type A stations the following test was run. Loads
of 3 kilograms were hung on the end of each load arm. This load
is much greater than needed to fracture the glass rods and hence
immediate failure results when the load arms are lowered. Acid-
I etched soda-lime-silica glass rods .098 inches in diameter were
placed in the stations and when 71?F arn 100% relative humidity
was reached the arms were lowered and times to failure recorded.
This procedure was repeated until 15 samples had been tested.
The average time to failure was computed to be .003 minutes with
I recorded failure times ranging from .001 to .006 minutes.
I 7.22 Type H Static ýatigue Testing Station
I Fi,,ure 10 41,; a phol.o,:raph or the type Ii static fatigue
testing station. The type H station was designed for use at stress
I levels above the buckiing stress of type A and where static fatigue
failiure times were antiripated to be vhort. The type 3 static fatigue
testinG station is similar in design, construction., and operation
L

II
I
•
r4'
I cIt
ICdir.4
I

LI
I 35
to the type A. Its principal features are reduced inner and outer
spans, smaller rollers, and a longer loading arm.
The loading arm is 18 inches long providing a nominal
mechanical advantage (geometrically calculated) of 16.74. The outer
supports are .475 inch diameter stainless steel rollers and have a
.125 inch radial groove of .375 diameter. The inner rollers, also
Sof stainlesL steel, are .375 diameter. All rollers are pinned to
reduce friction. The inner and outer spans are 2.150 and 0.750
I inches respectively. A mercury switch attached to the load arm
starts experiment timing instead of the normally open microuwitch
used on the type A. Timing is stopped when the sample fails and the
load arm contacts a "nicroswitch.
The force exerted on the center rollers by the unloaded
j arm of the type B station was determined by the same procedure as
described for the type A except that a ground roller was placed
I between the inner rollers to decrease friction between the arm and
the scale pan. The force exerted by the unloaded arm was found to
be 5.99 lb. Previous experience with the type A stations in deter-
mining the mechanical advantage had shown good agreement betweua
nomiMn (geometrically calculated) and measured values. Also, the
I force exerted by the center rollers of the type H station was far
above the scale capacity of 30 lb. Therefore, the nominal value
of 16.7h was used and for the tyFe B ottatic fatigue testing station
the relationship between the weight in grams hung on the load arm
and the load parameter P in lbs. from nonlinear bending analysis
I was
II
r

36
.OAD(Om) = (.P-3.0) x 453.59 (13)
For all static fatigue tests using type B stations, P was determined
from a plot of the nonlinear analysis and the above equation was
;I used to determine loaa, The average buckling stress of the type B
was 470,O00 psi for the rod size range used. This was well above
the highest anticipated testing stress for static fatigue.
To determine the minimum rasponse time of the appa-
ratus using the type B station the following test was run. A load
of 4 kilograms was hung on the end of the load arm. This load is
much greater than needed to fracture a sample and hence immediate
T failure results when the load arms are lowered. An acid-etched
soda-lime-silica glass rod was placed in the station and when 74 F
and 50" relative humidity was reached the load arm was lowered and
the failure time recorded. This procedure was repeated until 10
samples had been tested. The average time to failure was computed
to be .003 minutes with recorded failure Ur-.- i'-nging from .001
to ,005 minutes.
7.3 Enironmental Chamber
Static fatigue tests were made inside a Develco Vodel VC08
temperature humidity test chambor, Fig. 11. Chamber inside dimensions
are 30 In. high x 24 in. wide x 22 3/4 in. deep. Wet and dry bulb
temperatures are read on a Bristol Model 2TM0OFF-38-3B-Oi recorder
"controller from probe located inside the chamber. During testing
IOU% relative humidity was easily maintained at 74°0 1. However,
~1
371
1111rneoa hme

II
1 38I
during the 50% relative humidity tests at 7L0F the lowest relative
I humidity obtainable varied between 50 and 58%. On hot, humid days
the refrigeration compressor would shut down automatically due to
overheating. This was finally cured by having a ½ hp fan with
two siroccc blades blow air through the condenser thereby increasing
cooling.
An aluminum rack was installed inside the chamber and leveled
for mounting of either type static a=tigue testing station. Each
station was then mounted on rubber pads as shown in Fig. 8 as pro-
tection against external vibrations and vibrations caused by failure
of the glass rods in adjacent stations. The rack was slotted so
V that sheets of plexiglass could be placed between the type A stations
tc prevent fragments of broken glass rods from one station causing
I Ifailure in adjacent stations, An external crank was added and ar pulley system using nylon cords was built inside the chamber to
raise and lower the testing station loading arms. Fatigue tests
could be observed by turnint on a light inside the chamber and
looking, through the thermopane window in the chamber door.
i
I
I

!I
!39I
8.0 EXPERIMENTAL PROCEDURE
8.1 Preliminary Investigations
I 8.11 Storage of Acid-Etched Rods
The effect of storage in vacuum and dry air was in-
vestigated to determine if acid-etched rods could be stored before
testing without loss of strength. Acid-etched rods were produced
iJ as described in Section 5.1. A 10 inch diameter glass vacuum de-
siccator was obtained axd two steel racks were made so that speci-
j mens could be placed horizonitally in two layers inside the desiccator.
A maximum of 35 rods could be stored in this manner and the desicca-
tor was loaded with freshly e-ched samples several times. For
j dry air tests the desiccant used was either calcium chloride or
a mix-urp of calcium chloride and Drierite (anhydrous calcium sul-
phate). For vacuum tests a mechanical pump was connected to the
desiccator, A vacuum could be maintained at 0.08 Torr as read by
Sa thermocouple sensor in the vacuum line. The dgsiccator wnb opened
at intervals of from one to nineteen days. Groups of fourteen to
thirty-one rods were removed and tebteOj dynamically. A group of
thirty-one shmil.ls were tested immediately after etching as a control.
8.12 Effect of Tygon Sleeves
It has been suggested in the literature that less
variation is obtained in the breaking strength of glass ro4s when
t.he ,ds are tested with short sleeves of tygon tubing at the erma

ii 11to prevent direct contact between the outer pair of rollers and the
specimen. To determine if this was true, three groups of rods were
tested using the dynamic apparatus described in Section 6.0. Acid-
etched rods were freshly made in the usual way (Sect. 4.0), and
fresh tygon tubing 1/8 i.d. x 3/16 l.d. was cut in one inch lengths.
For the first series of seventeen rods the same two tygon sleeves
were used throughout. These two sleeves had also been used to break
two rods in practice runs. For the second series of 16 rods, new
tygon sleeves were used for each rod. Throughout the testing care
was taken in sliding the slee-@s on -he rods so that they did not
come closer together than 2.1 inches which insured that the center
span was not touched. A third group of nine rods was tested without
sleeves as a control. Crosshead speed was 0.5 cm/min. Rods were
tested dry in the laboratory atmosphere.
8.13 Surface Condition of Pyrex
Large variations in sample strength tend to mask
other effects. Therefore, as preparation for later dynamic measure-
ments the effect of surface condition on the variability in strength
1eof Pyrex was studied. Mould 3nd Southwick have shown that in the
case of soda-lime glass microscope slides, controlled abrasion
reduced the variability in strength to standard deviations as low
as 5 to 10% of the mean.
For the present study 3 mm Pyrex brand rod was cut
into 5j inch lengths. The samples were then annealed at 565:C

141
for ½ hour and furnace cooled. These samples were then u-1' for
i tests with four surface conditions; grit blasted, acid etched,
acid etched then grit blasted, and as-received. Etching was done
by dipping samples into an etching solution of 15% hydrofluoric
and 15% sulphuric acid in water for one minute. The samples were
then removed and rinsed in tap water. The purpose of this light
etch was to remove any gross mechanical damage in the as-received
samples in the hope that there would be less variability in samples
that were subsequently grit blasted. Grit blasting was done using the
abrasion apparatus and method described in Section 5.0. After blast-
I ing the samples were rinsed in tap water. The as-received samples were
also rinsed in tap water before testing. Tests were begun immediately
after the samples were prepared. Dynamic tests were made in four
I point bending using the apparatus described in Section 6.0. Cross-
head speed was 0.5 cm/min. Since abrasion leaves a small visible
area of high flaw density around the center of the sarple, Fig. 7,
care was taken to position this region between the inner rollers
during loading.
8.2 Static Fatigue
Static fatigue curves of high strcrngth, acid-etched soda-
lime-silica t'lass were experimentally determined at 71&"F and 50%
and 100% relative humidity, 100% relative humidity was easily main-
taired. However, durinir the 50% relative humidity tests, the actual
rretltve ?,imidity varied Irrom 9;0% to L;•. In an attempt to obtain
I the :alpir.,tit act, Ivualiwt ,iw•- : Fl'r -. tattIv. fatigue at 100% relative

I
SI
I humidity, additional dat-a was taken at 100F at stress leve1 s of
200,000 and 210,000 psi, and at 50''F at a stress level of 200,000 psi.
Acid-etched rods were prepared (Sect. 4.0) and either tested
immediately or stored before test in a closed desiccator. Rods
were measured with a micrometer at both ends and the average taken
as the true diameter. The required load parameter P was determined
from plots of' the nonlinear analysis for four point bending using
the rod diameter and stress level desired. Separate plots were
I made for both type A and B testing stations. kig. 12 is a sample
plot of the solution for the type 1 testing station. Actual plots
used were considerably larger. The load in grams to be hung on the
test station loading arms was then determined from a computer
tabulation of P versus lhad in grams from Eqn. (12) or (13) depending
j on the type testing station in use. The type A stations were
used for all tests at 100% relative humidity, including the acttva-
tion energy data, The type A stations were also used at 50% rela-
tive humidity for stress levels as high as 270 kpsi. It was an-
"ticipated that the type B station would be required at 50% relative
humidity for tests at stress levels a.bove 270,000 p5i; however,
data could not be taken at stresses above 270,000 psi since times
to failure were less than the minimum measurable time to failure.
Therefore, the type H station was :ilso usrd at 50% relative humidity
for stress levels from 230,000 to 270,00) psi.
Testing with the four type A stations was begun by establish-
ing the desLied temperature and humicity .i the envirormental chamher.
This facilitates reŽestabliuhint, these conditiont; after the chamber

Li3
IAI
1 44
4 40
0%0
Sto024
u&42
S 43
04 0
V CY Oj r

!I
Ihas been opened and the specimens placed in the bending a.:. ratus.
The external crank was then ti'rned and locked to raise the loading
arms so that the etched rods could be placed in the fatigue stations.
The correct weights for each rod size and stress level were hung
on the station loading arms. The etched rods were placed on the
support rollers so that the etched, untouched portion overhung
the outer rollers on each end Plexiglass shields were placed be-
tween the stations. The chamber was then closed and the desired
temperature and humidity reestablished. The timers were reset and
the crank was unlocked and rotated 3/h turn to allow the load
rollers ,o lower on the glass rods. As each loading arm came within
15 of horizontal, the individual microswitch on the arm started
the timers. After failuro occurred at a station, the loading arm
dropped and tripped another microswitch which shut off the timers
V for that station. The procedure for the type B station was similar
except that plexiglass znields were unnecessary and timers were
started by a mercury switch on the loading arm instead of a micro-
switch, Tests were generally terminated for samples that did not
fail after one day although in tstablisning the fatigue limit some
testb at low eLresses were all(.wed to run for several days. Tests
to be used to determine activation energy were generally terminated
after one hour since the anticipated median failure time wazi within
that limit by two or three ordo.rs of magnitude.
A I Tmam4r- .. .i--im
The susceptibility to stress corrosinn of' fused quartz and

I4
Svyrex (borosilicate) glass was determined by measuring tl,• lependence
oI strength on stressing rate. The testing procedure for pyrex
was as follows: Rods of 3mw. P-yrex brand glass rods were cut to
( 51 inch lengths. The rods were annealed at 5650C for I' hour then
furnace cooled, They were then abraded using the apparatus and
procedure described in Secti.on 5.0. After abrasion the samples were
aged in distilled water for .5 hours. Mould 1 3 has shown that storage
in distilled water is the most easily controlled and reproducible
treatment for fresh abrasions before test. Groups oi' 20 samples
were broken at each of 7 different crosshead speeds. These cross-
I head speeds were 0.005 0.01, 0.05, 0.1, 0.5, 1.0, and 2.0 cm/min,
Samples were tested wet and at the lower crosshead speeds were
periodically wetted with distilled water to insure that they remained
I wet during testing. A similar procedure was used to test 3mm fused
quartz rods. Howevrr, fused quartz samples were not annealed due
to the possibility of devitrification and were ajý.ed in distilled
water 38 houva belore testing.
I

46
9.0 REULTS OF PRELIMINARY INV&TIGATIONS
9,1 Storage of Acid-Etched Rods
Results are summarized for both air and vacuum tests in
Table 1. The samples stored in vacuum for one day were evidently
mechanically damaged during storage as evidenced by the low strengths
and large variability. This damage probably oc'urred when the
vacuum line was accidentally pulled off the desiccator since an
oily grit was found in the vacuum connection of the desiccator.
The results of storage in the desiccator with air are shown graph-
ically in Fig. 13. Samples showed no discernable loss in strength
for storage times of up to 19 days. It was therefore concluded that
acid-etched samples could be stored in a closed desiccator before
test with no detrimental strenlth effects. Sample.-- were generally
stored for lesb than one week with most being tested immediately
after etching.
9.2 Effect of Tygon Sleivves
Results for all three series :f tests are summarized in Table 2.
The somewhat lower strenrths recorded in series 1 when the same two
sleives were used for all test.; are probably the rerult of gross
mechanieal damage. It is like'qy tU t t,.e sleeves became impregnated
with broken glass or corrosion products from the surface of the rods.
Strengths recordeti in the seconrd ntio third series are comparable
"aixi within the rmrk:c of' the de:; Io•tor t.i•trsge experiments which
wnrti eotlxucted without, tygon altevc,:;. Ah.,o, thc secntd and third

I47
4) ON O - . 4 co4)U-m . 4 c li \ 10
q d 0 0 0 0 0 Co -4-) )4> +- +) 0
u~ 41 r"- - u ' \~ IR-r*4 -4 Q~ Ul\ co V\ %k~ TA OIA rl .4 ! U '\ 0 U '\ C'.jIn C'~J (n C\1. 04j fV an,
01
1-.r4 r4 C) - ll % i c C
.1 r40 H 0 ,- ' " .0 -H,-
44 ~ ~ ~ ~ 4.~ cv f4ý ~ \ -
Lid
0 040'. CY gor-4 t~ c'a 4
4-) cu \0 +
U)0 -:)cI'.41 L
0 :2 ( 1 040H
iii4.)~~~U Inr #N41f)
P44.fa
P64 0A 4Hf
Ii 0b2
~c4 -
4) o4
0V3
'-44
0X
~S~1~.L (Wtr.T

Lo
TABLE 2
SEffect of Tygon Sleeves on Strength of Acid-Etched, Soda-Line-SiLica
Gla:n:;s kods
Series 1 - Same sleeves used throughout
17 Saa%.les
Yean (psi) 251 3j36
t Standard deviation (psi) 72805
Coefficient of variation (L) 28.5
95% Confidence interval (psi) 217h01 to 292270
Series 2 - New sleeves each test
16 Samples
I Iean (psi) 315036
- tandard deviation (psi) 86952
Coefficient of variation (%) 27.6
S95% Confidence interval (psi) 268712 to 361359
j: Series 3 - Without sleeves
9 Samples
S1Mean (psi) 2827L9
Standard deviation (psi) 6W4O
I. Coefficient of variation (%) 23."
9'% Confidence int~erval (pisi) 2.31678 to 333820
II

II
I series chow siuilar variation in strength regardless of whe her
I the samples were tested with fresh sleeves cr without sleeves.
Therefore, it was concluded that there was no advantage in using
tygon sleeves on the acid-etched samples.
9.3 Surface Condition of .7rex
j Results for all four surface conditions are surnarized in
Table 3 and grapnically in Fig. lb. The effect of abrasion was to
+j greatly reduce the variability of breaking streiigth since there
was no significant difference between the as-received abraded and
the acid-etched abraded samples. As-received sams.-es, therefore,
i were abraded in all subsequent dynamic testing. The large varia-
bility in breaking strength shown by the lightly acid-etched samples
and to a lesser extent by the as-received samples is a reflection
of the large distribution of flaw sizes expected to be found on
I the surface of these glasses.
IIIII!I

1 51
TABLE 3
Surface Condition and Stre:ngth of fyrex
Series I - Acid etched
I0 Samples
-Vean (psi) 62669
"Standard deviation (psi) 36805
Coellicient of variation (%) 56.7
95% Confidence interval 363h2 to 88996
Series 2 - Acid etched and abraded
10 Samples
Mean (psi) 13605
Standard deviation (psi) 851
Coefficient of variation (%) 6.2
95% Confidence interval 1299o to 14214
Series 3 - Abraded
9 Samples
Mean (psi) 12687
Standard deviation (psi) 53h
Coefficient of variation (%) 4.1
95% Confidence interval 12476 to 13297

52
TABLE 3 (continued) -
Series I - As recieved
Ir Samples
Mean (psi) 1605i )h
Standard deviation 6338
Coefficient of variation (M) 39.h
95% Confidence interval (psi) 11520 to 20587

I 90 -55!
80
iJ 70
etched
60
50
30
etched120 an ,,dT
abraded as recieved
abraded
I10Figure 14. Surface condition and strength of pyrex
I- |

54
10.0 STATIC FATIGUE
10.1 StLtic Patigue Data
Results of static fatigue tests of acia-etched, soda-lime-
silica glass rods at 74'F are summarized in Tables 4 and 5 for
100% and 50% relative humidity .espectively. Stresses and failure
times are plotted in Fig. 15 and representative least squares lines
are shown for both 100% and 50% relative humidity. Data points
at 230,000 psi .00% relative humidity, and 270,000 psi 50% rela-
tive humidity, were used in fitting the lines although it should
be noted that the corresponding failure times were approximately
the minimum response time determined for the apparatus. The slope
of the least squares line for 100% relative humidity is 14,619 psi/log
decade and the intercept is 190,260 psi with a correlation -. 992.
The slope of the least squares line fcr 50% relative humidity is
14,419 psi/log decade and the intercept is 223,005 psi with a cor-
relation of -. 954. The static fatigie lirnit stresses, given in
Tables 4 and 5, are 150,000 and 160,000 psi for 100% and 50% rela-
tive humidity respectively and are indicated in Fig. 15 by arrows
in the appropriate data points.
Median times to failure determined for acid-etched, soda-
lime-silica glass rods at 100% relative humidity for various tem-
peratureb and stress levels are shown in Table 6. It was hoped
that these median tim•t,. to failure could be uved to comRputIe the
aljireont activi•t b)l onrgy J'or z I. i• I'sit. igue, howevetrz, thl, data
Is tLot) incuriBIStant to allow t.hiib t:,cUl1ltilul. Kr teamllple, for

*ýo~~~ 01 Ntr
*(fl F-4 N- C 0 r
000 H 0 O-L~~ \ '0
+3 r4 0 0 0 0 0 0 m 0 -.3
t-4~C .0- Cu C Clol
E-:
@20 0 .4 H r-4 r0C -4 H
H +3
r-4 A4 Q
ri ~ ~ ~ o\ 0 - o, O ' 0 044 ON H-
r. 1C/) 03 ~~~0P U)
0 0
P uq
V4 00" aICM ~ N 0
IC C'14
~4 ~ p. p. .4 4 C
I1r

5 56
I CN
~~\0
'0,j~~U 0 IA N r
0 on, ICA #-40 0
4- o
+2. 00 . a C
0n P40
U) C: '2
H 4 H C
0o
oto' g o , 040
r 4) 41
r-40 C0
f-4~~~~~4 r- n ;, .- 10 C -
00 0 0 V
00 ra(n~~~U 0U)Cj n0 13+
.6) H. f- r .- 4- 0
pP. to=
C.) 0
V) as4 v.

) .0 co
4.)
A o cc
1 Al
0 0 0.
C14 *r4 N) r4 .
Vii"a 0 0 4,4

58I
Median iailure Times for Acid-Etehed, Soda-Lime-Silica Glass
at 100% P. H. arid Various Temjeratures and Stress Levels
kedian•
Temperature IItres, tfailure time No. samples() (ki) (min) tested
100 210 .1066 31
7h 210 .00O from kig. 15
100 200 .008m 40
71 . 200 .200) from Fig. 15
50 2u0 .00)1 b1
S.1
V
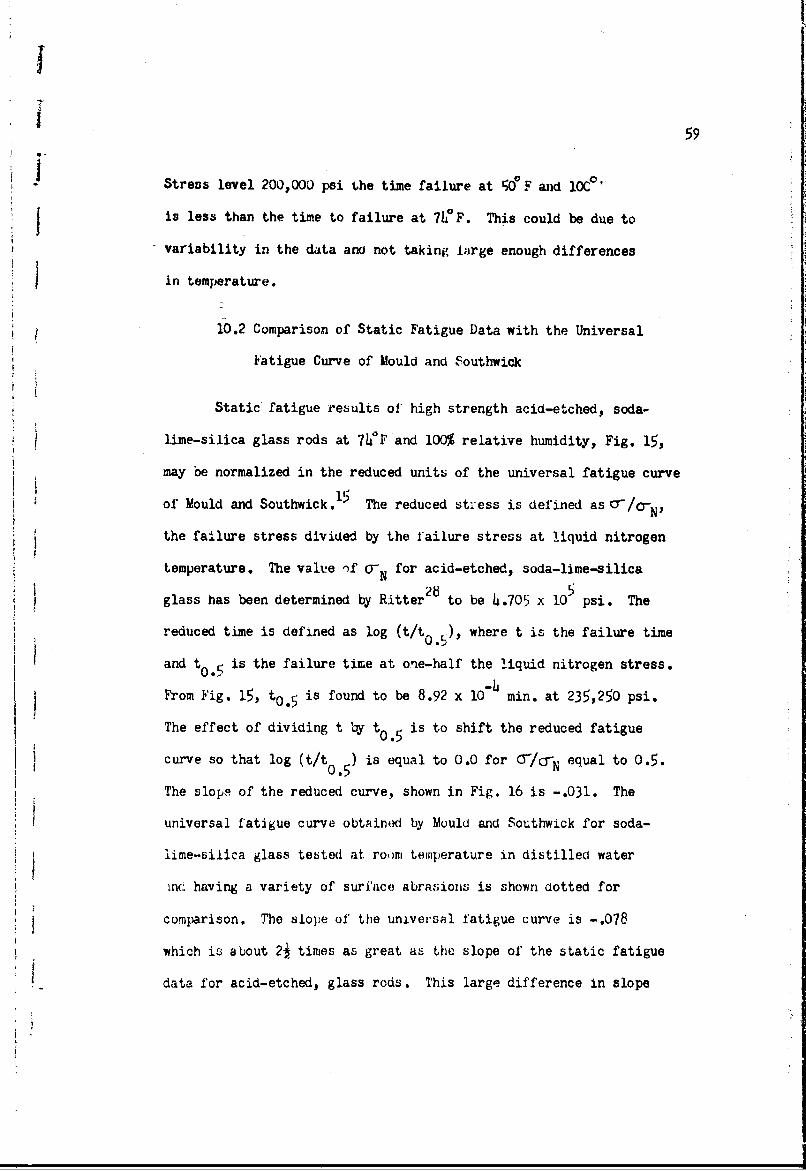
i 59
Stress level 200,000 psi the time failure at 50o F agd Ic°
is less than the time to failure at 714F. This could be due to
variability in the data and not taking large enough differences
I in temperature.
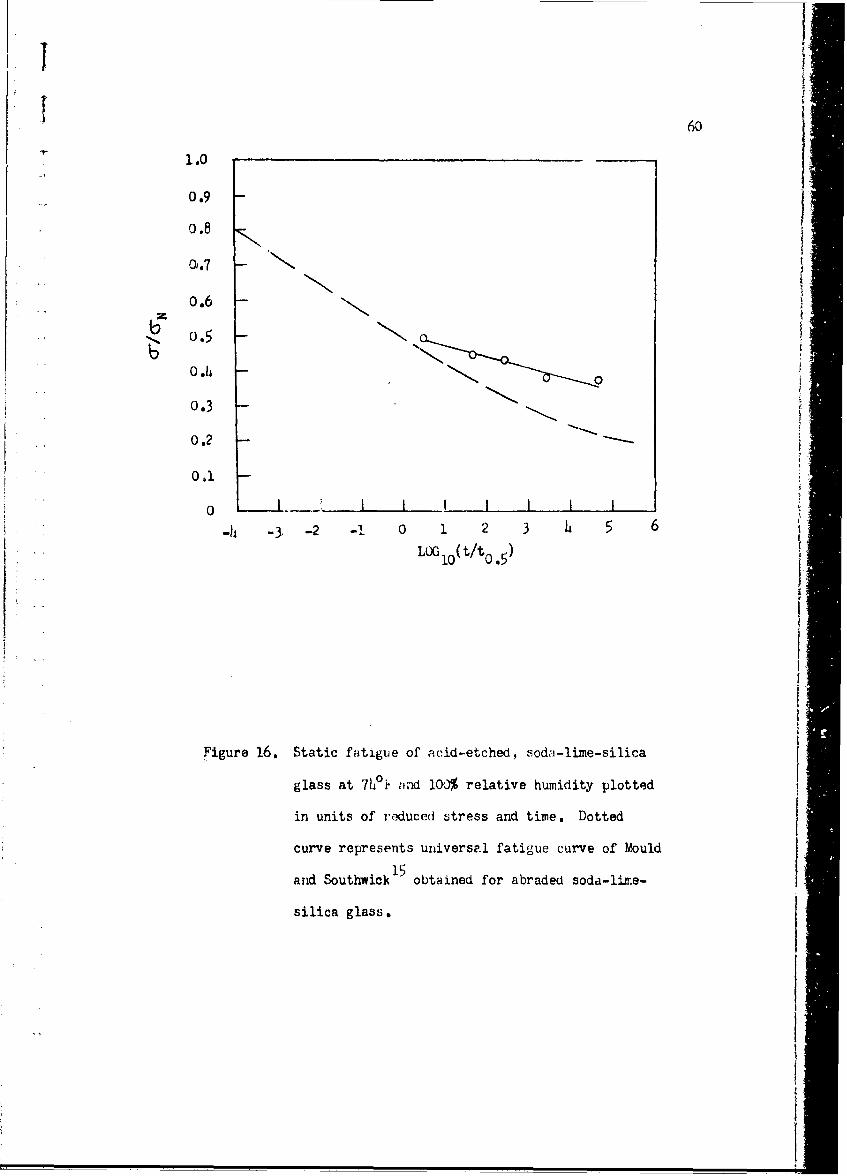
10.2 Comparison of Static Fatigue Data with the Universal
Fatigue Curve of Mould and Fouthwick
Static fatigue results of high strength acid-etched, soda-
lime-silica glass rods at 74°F and 100% relative humidity, Fig. 15,
may be normalized in the reduced units of the universal fatigue curve
of Mould and Southwick. 1 5 The reduced stress is defined as O-
the failure stress divided by the failure stress at liquid nitrogen
temperature. The valhe -f cr- for acid-etched, soda-lime-silica
glass has been determined by Ritter28 to be 4.705 x 10⁵ psi. The
reduced time is defined as log (t/to), where t is the failure time
and to.5 is the failure time at one-half the liquid nitrogen stress.
From Fig. 15, to.5 is found to be 8.92 x 10 min. at 235,250 psi.
The effect of dividing t by t 0 .5 is to shift the reduced fatigue
curve so that log (t/t .5) is equal to 0.0 for 0-/crN equal to 0.5.
The slopp of the reduced curve, shown in Fig. 16 is -. 031. The
universal fatigue curve obtain(d by Mould and Southwick for soda-
lime-silica glass tested at roonm temperature in distilled water
in(.; having a variety of surface abrasions is shown dotted for
comparison. The slope of the universal fatigue curve is -. 078
which is about 2j times as great as the slope of the static fatigue
data for acid-etched, glass rods. This large difference in slope
60
1.0
0.9
0.8
Q'.7
0.6 -•= o.5 - •
o.4 - •:0.3 -
0.2
0.1
0 L 1 1 L 1 I I I I
-3, -2 -! 0 1 2 3 4 5 6LOG 1 0(t/to 0 5)
Figure 16. Static fatigue of acid-etched, soda-lime-silica
glass at 7h°0 aind 100% relative humidity plotted
in units of reduced stress and time. Dotted
curve represents universal fatigue curve of Mould
and Southwick obtained for abraded soda-lime-
silica glass.

61
indicates that the universal fatigue curve does not appl4 3 the
static fatigue behavior of high strength, acid-etched, soda-lime-
silica glass.
10.3 Comparison of Static Fatigue Data with the Theory of
Charles and Ilillig
The static fatigue thb-ry which best describes the present
experimental data is that of' Charles and H-l2ig. The expression
for the slope of the line passing through the reduced static fatigue
data given by Charles and Hillig is:
{*
dIn t/t V * "-. u (1lh)
d (o-o- ) RT
All terms are as defined in Section 2.5. The activati-a volume for
stress corrosion at 100% relative humidity may be calculated from
the above equation. Br choosing thL value of JT to be 2 x 10⁶ psi,u
and using the temperature of 7h F and the slope ol -74.2 from
the static fatigue date at liOO reiative humidity the activation
volume, V*, is founo to 13.2 cm3/nole. The experimental fatigue
lirit stress, SB is 1 .' x 10 psi (from Table 0) and the molar3 5
voluime V is assuxied to be £0 em . Using the above values of U
and V* in Eqn. 11, r/L can then be calculated to be 1.355 x 10⁹ ergs/cm3
Using the Orowan criteria for failure the crack depth, L, can be
calculated to be 6.25 x ]0 cm. Using this value oi the crack
2depth, r is calculated to be 8ib er'gs/um. The Lypica vaiue ofI'

!
62
'the activation volume, V*, for alkali metal ion diffusion in sili-
Icae glasses was reported by Charles and Hillig5 to be h.9 cm3/mole.
r They calculated V* to be 1 cm3 for abraded soda-lime-silica glass
using the vlope of the universal static fatigue curve of Mould and
Southwick. Then using the data for a point on the universal fa-
tigue curve near the fatigue limit, they calculated r to be approxi-
matey 500 ergs/cm. It should be noted that r is dependent on
the values which are chosen for C-N the strength at liquid nitrogen
temperatures, O-u, the ultimate strength of W:ie material, and L,
the crack depth. There could be as much as an order of magnitude
error in the choice of the crack depth, and C- and 0- could varyu N
by a factor of two. Therefore, the value of r could vary considerably
depending on the choice ol' the above parameters.
4
II

II
I63
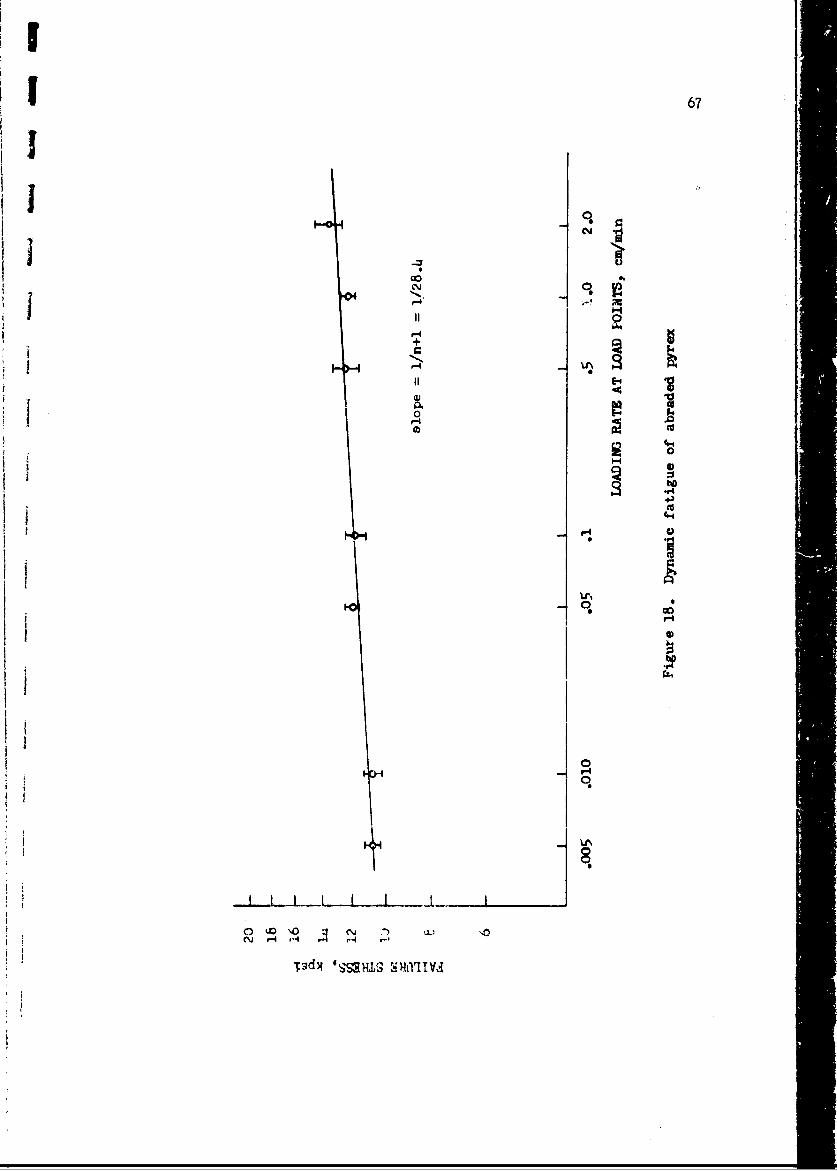
11.0 DYNAMIC iATIGUE RESULTS AND THEORY OF CHARLES
The experimental data from dynamic fatigue tests of fused
J quartz and abraded pyrex are summarized in Tables 7 and 8. Figures
17 and 18 are log-log plots of these results. The straight line
j shz-n in each of thesu figures was calculated by the method of
least squares with the slope au indicated. The correlation coeffi-
Scient was .708 for fused quartz and .-9h for pyrex. As discussed
in Sect. 2.3 Charles 3 derived that under dynamic loading the break-
ing strength of glass should vary with the rate of stress applica-
J tion as follows:
j Oaf = K3 l/n+l (2)
where 0af = macroscopic applied stress at which failure occurs,
S= rate of stress application, n = exponent in Charles' assumed
crack velocity equation and K = constant. Asouming simple beam
theory the stressing rate is proportional to the loading rate at
Sthe load points. Therefore, from Fig. 17 the value of "n" for
abraded fused quartz is 37.8 and from Fig. 18 the value of "n"
for abraded pyrex is 27. 4 .
IIIII

co (n xr-a I
r-4 ON 11Q 0 tl- 8' A.,r0 r-- co 0, co co f-I a%
A 00 0 0 0 0 0
04U 0 H4 CLc a\~ H
cl C\~ N. r- r c-CQ \ H4 (- C) \D t-'"0 r- L'- tý- r- Cc tr-
0J4)
r-4 9.-4~ r- 1 jO
H ~ H " H - M\ .J C
W.41 r- 'A ý (-- LI- Go c
r- .. :4 r4 ý r-t H (N4
Uz U)
(1 -4 H 11 r- r' C
w
U'\
)* 0 H- UN\ C) 0UD Li 0) H U) 0r
.A4C co C)3ý 00

I' ) ~ 4 ~ cv. r-
0- "'4 tr v m. m~a) r4 H - F-4 r-4 r- (4 -4
0 0 H H H H 0~
'LI\ H ~ -4 H H H4
ImI 4 - raf- ~
C'-'j0
4) H H
+)(d * r \ C\j CCH) ' r- - - '
(1) 5.' N 0 H HVN C\ J oo occ0 -4 H- H4 H -
4.tic .dI 0 H U 0 0 8
'a P.
4 ..4 .-
I++).
IO

66
E-~
1-4
H 0
t-.-4
04 r-4 0 h U. - \, .
r-4 r-4 4
Tqdý~~ 0RASrlrT,
67
0.
c~ct
r-4
'-V4
II-
r4.
UD \0 C0r4 -41ý S
Tadx a~jyj I v

II
68
12.0 DISCUSSION-STATlC AND DYNAMIC FATIGUE OF SILICATE Gý' SES
12.1 Dynamic Fatigue
To describe flaw growth under dynamic conditions Charles3
assumed that
nv Kr (i)
x m
where is the velocity of the flaw tip in the direction, 0 l
is the normal tensile stress at tVic flaw tip, and k, n are constants.
He then derived, Kqn. (2), that "n" may be experimentally evaluated
from the slope 6f a log-lc- plot of' failure- stress versus loading
rate. The results of various investigators are Civen in Table 9A.
Wiederhorn 9' 10 using the crack velocity equation deW.eoped5Lfrom reaction rate theory by Charle.; and Hillig derived that
v = v0 exp - (F.* - bK1 )/RT (0)
where v is the crack velocity ,id ",), E* and b are jar.meters which
may be exierimental1y evaluatei by rittini, crawk vehlcity data
to the above equation. KI is the stress intensity factor, propor-
tioneu to stresses at the craýk tip.
It would be tof extreme .,mportance to be able to relate the
fundamentally derived parameters E* and b from Wieterhorn's crack
velocity equation to the empirtcal constant On." determined from
-measuring fractr•t. btrength as a 'unetioti of strev;.in rate. how-
Ivt. the anaayLic:I I joti. 1 ih"ýIt at. 11cv Unt (e 111'.4ndii)

TABLE 9 U
'Cominaribui uf' Cra±ck Výelocity and DyajL aiu tt
A. Dynamic fatigue data
Glass S;urface cond. Reference Ufn"
Soda-lime (Kir, ble R-6) acid-etched hitter6 13.0
3Suda-lime (Cornirig )080O) abraded Charles 16.0
E-las ristine fiber Camieron 27.0
bused quartz (Geni. Elect.) abraded This inv. 37 .8
lyrex (Cornirit, 17"IJ) ~ i braded This izw . 2'( .41
1j. "n" Dertermined from crack velocity raeasureirents of l'iederhorn1 3
Glassn
Soda-li~'ne (Libby-Owezis kord) 16.6
Aluminosilicate ( Corninbý 1:,2)) 2? .h
Fused silica (ýurz~ink; 7940J)3r.1
lyrex kCorning ((thi) 3is1l
* £-KlabS has nominal conqpositioti vYvitht ;ereentý.h SiU 2)
lh.L A12 J39 W1.5 CaJ, 4- .'4,ý .',), It JY 0 ,5 Na2i' + K 2 ,
Fe. ~e2 j 3 ' J-3 12*3
SThis hai.ý nct.ý~;.i4,l rorpoita we:4ht i-ercert KY.J ~0
20.,0 A 1 ,1~ 6.0 Caj) rl2.j Wýp b.0 Hej; 1.0 Naý,which is very
-iimi I-ir to Fo-I 1 ;4si .

I
70
Instead crack velocity measurements may still be correlajed with
dynamic fatigue data since the theory of Charles- assumes that aplot of log v versuis log K1 should be a btraight line with the slope
riving On". This has been done using, Widerhorn's experimentally
determnedJ utres.', corroLnion constant.s and the results are given
in Table 9b. 29 The fit of the velocity-stress intensity data to a
log-log plot was very I-ood, especially at the high velocity end.
Comparisons ol "n" values cumpnutedi from dynamic: fatigue tests
I and "n" values determined from the crn-e, velo.,.Lty data of liederhorn
agree well on both a qualitative and quantitative level. Tne largest
discrepancy was for pyrex glass, 27.)1 versus 3h.l. and these measure-
mente are currently being checked.
12.2 Static Yatigue
Static fatigue curves for acid-etched, soda-lime-silica glass
at 7h F and 50% and 100% relativP humidity, Fig. 15, are very nearly
parallel. The breaking stress decreases at approximately lh,,500
psi per log decade of time and breaking stresses at W0% relative
humidity are 17% higher than those at 100% relative humidity,
This correlates with the work of Otto 1 9 who tested fibers of various
silicate glasses in dry air havine -13'F dewpoint and in air at
5U4 relative Lumidity. Otto's static fqtigue test.; showed breaking
streus decreased at 1,k)00 to ?ovJ-,_) i.si jer Ioý. dievade of time
riog-1J0ide ul" t.mi.,1".rturt, or amsbieon tium ,ilty , e also f\ound, that
in st C lui , ,t i...,.- tt.t•:4 -•,t:t'. . ". tit brek i Ri. trt':sses were
roerl- ly 10% hi,,her in dry 0ir tha,1 .it ',% reli. .... htuMity

71
Static results for acid-etched soda-lime-silica glass may
be normalized in the reduced units of the universal fatigue curve
of Mould and Southwick. This has been done for the 100% relative
humidity results in Section 10.,. The same procedure may be used
for the 50% relative humidity results and from Figure 15 the correspond-
I' inn value of tO.5 is O.1h8 minutes. Using these values the slope of
thc ..-duced curve is -. 031. The intercept is 0.5 as it must be for
[yq universal faLigue curve. Comparison of these rv:.ults with those
of Section 10.2 shows that the static fatigue -I acid-etched, soda-
lime-silica glass at 71fF and "0% and 100% relative humidity may
be represented by a single universal fatigue curve. This curve and
the reduced data points at both humidities is shown i.. Fig. 19.
This agrees with Wiederhorn's formulation of the universal fatigue
I curve, Eqn. 8, wuhich predicts that a universal fatirue curve -is
independent of relative himidity. A slight rearrangement (Eqn. 9)
of Wiederhorn's formulation of the universal curve fatigue also
shows that stati-: f4 ijgue curves determined For a ,:ivon chemical
composition and temperature bvIt at uiffererit relative humidities
j should be parallel as in Fig. 15 when presented in the usal manner
(failure stress vs log time to failure).
Universal fatigue curves may also be determined for E-glass
and fused silica. Data presentea in Fig. 3 on static fatigue of
F-glass and in Fig. 4 for fused silica were read by the present
author from plots in publications of the investigators listed.
A similar procedure to that for acid-etched, soda-lime-silica -lass
wa:j then ustil to obtain the universal fatigue curves. Proctor's

72
U'd
40
4-1
42.
,4 4f3~ 4) o d
U co
4) (
V) r
~~0
4) eA Q)
*r4 0) §ho U
@1i
0 CY
N14 4

73
data for samples tested in liquid nitrogen showed a median failure
2stress of approximately 1200 kg/mm . The corresponding to.5 from
Fig. 14 equals 0.122 seconds. Using these values the slope of the
universal fatigue curve for fused silica is -. 041. The universal
fatigue curve for E-glass was determined using the curve in Fig. 3| 20
marked Hollinger et al. . This curve was chosen since it represeats
the median curve of 6he three investigators of static fatigue in
E-glass. Cameron18 has measured (' N equal to 820,000 psi for E-
glass fibers. From Fig. 3 the correspondin6 vaiue of t is0.5
28.2 seconds. Using these values the slope oi' the universal fatigue
curve for 'glass is -.036.
Universal static fatigue curves as determined above for va-
rious silicate glasses are shown for comparison in Fig. 20. Sur-
j prisingly, Fig. 20 shows :little if any difference in susceptibility
to static fatigue among the three high strength ,vilicate glasses
Sdespite differences in chemicaL composition. This is in contrast
to the results of dynamic tests (Section 12.1). A possible explana-
tion Zor this lies in the difference of crack size for high and low
strength glasses. Charles hae. noted that dissolution of multi-
component silicate glasses, fused silica, and quartz is greatly
enhanced in basic solutions. He albo showed that corrosion of
unstressed soda-lime-silica gLass occurs more rapidly in steam than
in water at the same teperature because great dilution is possible
in water and therefo're p11 buildup i1-; slower than in the corrosion
protiucts of' a lik, ;ample in st.týaj;. Wiederhorn31 hat recently sug-
geted that the effTct of' glas'S C0111I)oSition on corrosion is to
I

to 0 0rl .
w~ 0 -r
HO u0 U) b
to r-4e.
UO'
~4 0il 0,-4 '0
U)~~? +1 02 .- I: 0
r- 0 4 *r4:
75
control the pH at the tip of the crack. One would reason,ýly
expect that the control of pH would be more effective in deep cracks
than in the relatively shallow cracks that would be present in
high strength glass. The expansion of' corrosion products -would
also retard entrance of bulk -water to the interior of a deep crack.
Thus one might ex'ect to see little effect of glass composition
on the static fatigue of' high strength glasses. However, this does
not explain Ritter's6 results that dynamic tests of both high and
low strength soda-lime-silica glass predict the same fatigue sus-
ceptibility. To resolve these questions, additional static fatigue
tests of low strength silicate glasses of differing chemical com-
positions are required to further elucidate the ef.'ect of chemical
composition on static fatigue. Further attention must also be
given to the specific kinetic processei• occurring during| corrosion
at a crack in a *,lass surface.

II 76
.1 13.0 CONCLUSIONS
I (i) n)yramic fatigue data can be compared to fundamental
crack velocity data utilizing Charles' dynamic fatigue theory.
Agreement is good on both a qualitative end quantitative level
for a wide variety of' silicate glasses.
(ii) The static fatigue data for acid-etched, soda-lime-
silica glass does not lie on the universal fatigue curve o" Mould
and Southwick determined for abraded soda-Zime-Kilica glass. The
I acid-etched glass was less susceptible to static fatigue than the
abraded glass.
(iii) Static fatigue curves of acid-etched, soda-lime-silicaglass determined at 71PF in atmospheres of 50 and 100% relative
humidity can be represented by a single universal fatigue curve. These
results are in agreement with the predictions of Wiederhorn on the in-
fluence of relative humidity on the static fatilgue curve.
(iv) There is little difference in the static fatigue suscepti-
bility, as measured from a universal fatigue curve, of high strength
silicate glasses (soda-lime, E-glass, ano fused silica). This could be
due to the nature of the surfac:e crack on these high strength glasses
being relatively shallow which woulu allow the corrosion products be-
ing diluted by the burrounding water so that the gl~s: composition
has little effect on the pH at the crack tip.
II

1, 77
i l4.O FUTURE WMK
1! To further elucidate the effect of composition on low strength
silicate glasses, the static fatigue curves of abradec pyrex and
fused silica should be determined. Once the effect of composition
Son the static fatigue of low strength silicate glasses is understood,
these results can be compared with those of the present study for
j high strength silicate glasses. Present fatigue theory should be
revised to account for the dependence oI fatigue susceptibility
on chemical composition and for the different high and low strength
J behavior. Also, further attention must be given to the specific
kinetic processes occurring during corrosion at a crack in the
I surface of a silicate glass.
I
I
I?
I
I.

JI
| C78
g , REFERENCES
.i. R.E. Mould, "The Strength of Inorganic Glass," in Fundamental
Phenomena in the Materials Sciences, Vol. h, Plenum Press,119-149 (1967).
I 2. J. . Ritter, Jr., "Glass-Material for Deep-Sea SubmersibleVehicles," Glass Ind., 49, 603-608 (1968).
[ 3. R. J. Charles, "Dynamic Fatigue in Glass," J. Appl. Phyc.,29, 1657-1662 (1958).
4. R. J. Charles, "Static Fatigue of Glass, I-I1," J. Appl. Phys.,29, 1949-1560 (1958).
5. W. B. Hillig and R. J. Charles, "SurfaceF, 'itress-DependentSurface Reactions and Strength," in High Strength Materials,Ed. V. F. Zackey, John Wiley and Sons, inc., New York (1965).
I 6. J. E. Ritter, Jr., 'Dynamic Fatigue of Soda-Lime-Silica Glass,*J. Appl. Phys., 40, 340-34h (1969).
7. L. Holland, The Properties of Glass Surfaces, John Wiley andSons, Inc., New York (1964)7.
8. M. Watanabe, R. V. Caporali, and R. E. Mould,"The Effect of Chemical Composition on the Strength andStatic Fatigue of Soda-Lime Glass," Phys. and Chem. of
9 Glasses, 3, 7-27 (1962).
9. S.M. Wiederhorn, "Infiuence of Water Vapor on Crack Propaga-tion in Soda-Lime Glass," J. Am. Ceram. Soc., 50, 407-414(1967).
10. S. M. Wiederhorn and L. H. BoJz, "Stress Corrosion and StaticFatigue of Glass", J. AM. Ceram. Soc., 53 (10), 543-48(1970).
11. R. J. Charles, pp. 1-38 in Progress in Ceramic Science, Vol.l.Edited by J. E. Burke, Pergammon Presb, New York, 1961.
12. W. B. Hillig, pp. 152-194 in Modern Aspects of the VitreousState, Vol. 2. Edited by-7. D_. Mackenzie, Butterworth!n7 Washington, 1. C., 1962.
13. A. A. Griffith, "Phenomenon of Rupture and Flow in Solids,"Ihil. Trans Roy. Soc. (London), 221a, 163 (1920).
!I

if ___79
14j. E. Orowan, "Energy CriteriLa of Fracture, W!Ejjdng J., L4 1575-160S (1955).
15. R. E. Mould and R. D. Southwick. "Strength and Static Fatigueof Abraded Glass Under Controlled Ambrient Conditions,
"Part 1," J. Am. Ceram. Soc., 42, 542-547 (1959);
"Part II,." ibid., 42, 542-507 71959);.Part l�,�161.,-73, 160-167 (1960);
"Part IV," ibid., 4i, 461-491 (1961).
16. E. B. Shand, "Experimental Study of Fracture of Glass; I,Fracture Process, "J. Am. Ceram. Soc., 37, 52-60 (1954);
""I Experimental Data," ibid., 9-72 9 ).
17. C. J. Phillips "Strength and Weakness of Brittle Materials,"Am. Sciertist, 53, 20-51 (1965).
1i. N. M. Cameron, "The Effect of Environmental Treatments on theStrength of E-Glass Fibers," T and AM Report No. 274,University of Illinois, under U. S. Bureau of Naval Wea-pons Contract NOW 64-0178-d (1966).
19. W. H. Otto, "The Effects of Moisture on the Strength of GlassFibers--A Literature Review, Whittaker Corp., under U. S.Naval Research Laboratory Contract Nonr 4522(00) (x) (1965).
20. D. L. Hollinger,, W. G. Kanetzky, and H. T. Plant, "Influenceof Stress Corrosion on Strength of Glass Fibers," FourthBi Monthly Progress Report on U. S. Naval Research Labora-tory Contract No. Nonr h486(0O) (x), General ElectricCompany 19644.
21. G. K. Schmitz and A. G. Metcalfe, "Stress Corrosion of E-GlassFibers," Ind. Eig. Chem. 1rod. Res. Dev., !, 1-8 (1966).
22. J. 0. Morley, P. A. Andrews and i. Whitney, "Strength of FusedSilica," Phys. and Chem. Glasses, 5, 1-10 (1964).
23. B. A. Proctor, I. Whitney, and J. W. Johnson, "The Strength
of Fused Silica," Proc. Roy. Soc., 297a, 53•-557 (1967).
24. B. Proctor, "The Effects of Hydrofluoric Acid Etching on theStrength of Glasses," Phys. and Chem. Glasses, 1, 7-27 (1962).
25. D. L. Vrooman and J. E. Ritter, "Nonlinear Behavior of ThinBeams in Four Point Bending," Am. Ceram. Soc. Bull., 149,T79-93 (1970).
26. R. V. Caporali, "Melting History Effects on the Strength ofLithium-Potassium and Lithium-Sodium Silicate Glass Systems,"Pennsylvania State University, Dept. of Mat. Sci. (1969).
II,L1I

i 27. J.. Ritter and D. L. Vrooman, "Static Fatigue of Acid-Etched
Soda-Lime-Silica Glass Rods," Project Themis Report Noi Themis-UM-69-4 University of Massachusetts under Office .
of Naval Research Contract No. NOOtu-68-A-0146 (1969).
28, . E Riterand A. R. Cooper, Jr., "The Fracture Strength ofI Commercial Soda-Lime-Silica Glass from -100 to 700 C,"Phys. and Chem. Glasses, L4, 76-78 (1963).
I29. S.M. Wiederhorn, private communication, Oct. 1970.
30. R. E. Lowrie, p.280 in Modern Composite Materials, Edited byL. J. Broutman and R. H. Krock, Addison-Wesley, Reading,Mass., (1967).
31. S. M. Wiederhorn, talk at 72nd Annual Meeting American CeramicSociety, Philadelphia, May 1970. Abstract Given in Bull.Am. Ceram. Soc., 49 (14) (1970).
32. C. E. Inglis, "Stresses in a Plate Due to the Yresence ofCracks and Sharp Corners," Trans. Inst. Naval Arch., 5,219-230 (1913).
!I I
I
1
I..-
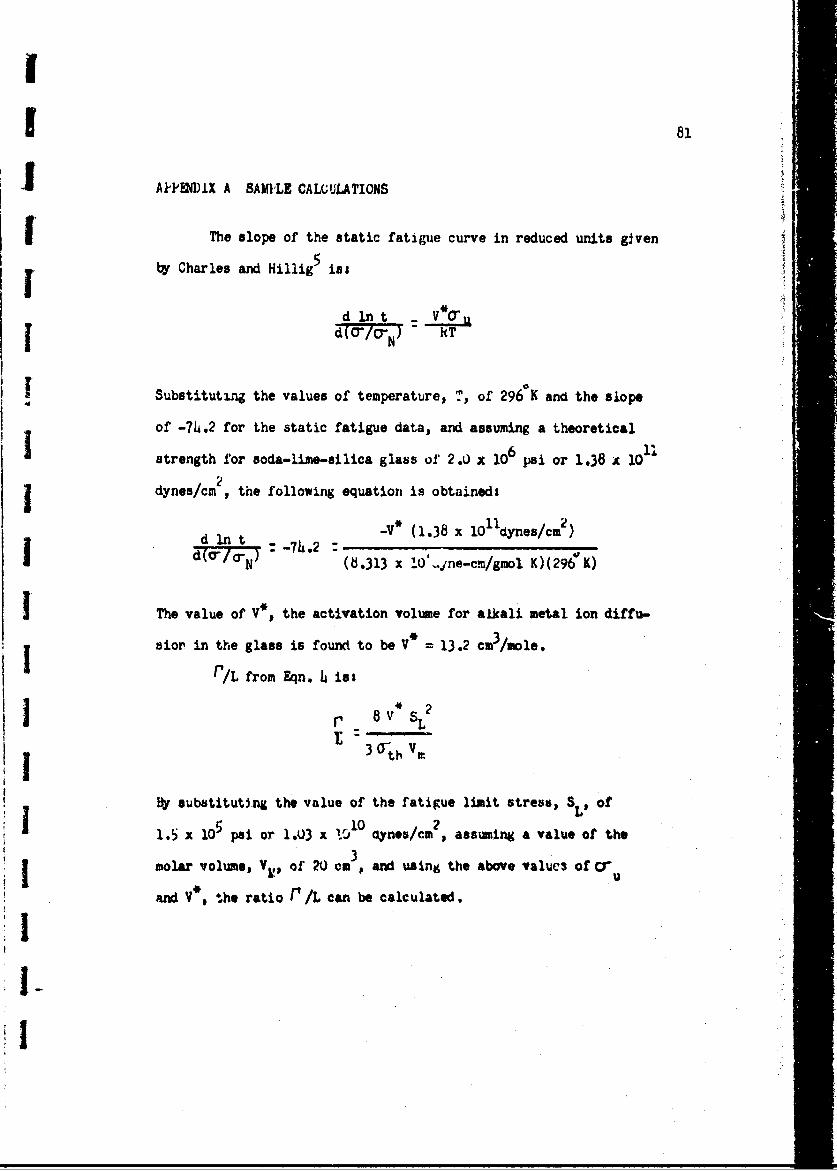
I, 81 i
I APPEDIX A SAM}'LE CALCULATIONS
The slope of the static fatigue curve in reduced units given
by Charles and Hillig isi
I Substituti.n the values of temperature, T, of 2960K and the slope
of -7h.2 for the static fatigue data, and assuming a theoretical
strength for soda-lime-silica glass of 2.0 x 10 6 psi or 1.38 x 10
dynes/cm 2, the following equation is obtained:
d in t -7 -V* (1.38 x 10 1dynes/cm )f d(Ofcn)t :7.d(/-74.2: (8.313 x !0',,.jne-ca/gmol K)(296d K)
I The value of V*, the activation volume for alkali metal ion diffu-
sior in the glass is found to be V= 13.2 cm3/mole.
Sfrom Eqn. 4 is:
I .-2r' 8 v sL
3 a-th Vn
B subatitut~ng the value of the fatigue limit stress, SLI of
1.5 x 10⁵ psi or 1.03 x 1 0 qynes/cm 2 assuming a value of the
molar volume, V,, of 20 cm , and using the above values of 0"u
and V* the ratio r /L can be calculated.
I-I

I
1 82
.1x .3 x1032 2 L
S 8 x 1.32 x 10 lcm3/gmol x 1.06 x 10 dynes /cm
L 3 x 1.38 x /O11dynes/cm2 x 2 x 101 cm3/gmol
I . 9 2.9 31.355 x 10 dynes/cm2 = 1.355 x 10 ergs/cm
By using the Orowan criteria of fracture:
u---2
6 5with - = 2.0 x 10 psi, 0-= 2.0 x 10 psi and e = 2.5 x 10" cm,
the crack depth, L, equals 6.25 Y 10- cm. Using this value of L
the value of r', the surface free energy between the soli2 and the
reaction product, can be calculated to be 8h6 dynes/cm
I
IIII
I
i

I 83
AFPPEDIX B RIFLATICNSHIP OF FAILLP.E STRE1Ic TO STRE•SSNG RATE
I An atterzipt was made to relate failure stress to stressing
rate usirng Wiederhornlsr'io fundamental crack velocity expression
I 3(Eqn. 6) following the general method employed by Charles. Eqn. 6
J may be rewritten as
v = v exp- ( K*- V C ./kT
Where v is the crack velocity and F is the normal tensile stress
at the crack tip. vr, -i and B are parameters which Aay be experi-
mentally evaluated by fitting -rack velkzi.y data.
32I ngl is has showr~ that
Where (y is the macroscopic app.4ie' stres•, I is the depth of thea
crack and f is the radius or cu:rvaLte of the crack Uip. ; is
of' interatomic aimensions mw uay ne assumed constant during crack
grovth. Similarly Orowan -•sing Grifrith's results has shown that
•r =2� a-(Xr/) 2cr afcr
Where ic is the theoretical strenbth of the material in tension,
(y•'e. is the macroscopic applied stress at which failure occurs and
r•. the critical t'*1aw depth for spontaneous crack propagation.
I.-

I ~In a dynafkic test. the applieu stress wray be exp-essed most.
simplyI tt
Where t is time and 6 it stressinc. rate. Also
I --af = tf
Where U- is the macroscopxi appliai stress at which failure
occurs, as previously ciefinea, ana t. is the time to failure.
I Therefore,
SubLstituting the above eguation into the veloc ity equation we obtain
I V dx/dt = v ex. - - 2wtX/(') )/RT] L
This is a nonlinear differential eq atien, ana an analitical solu-
tion is not known at present.
I~I.
.11
-. I
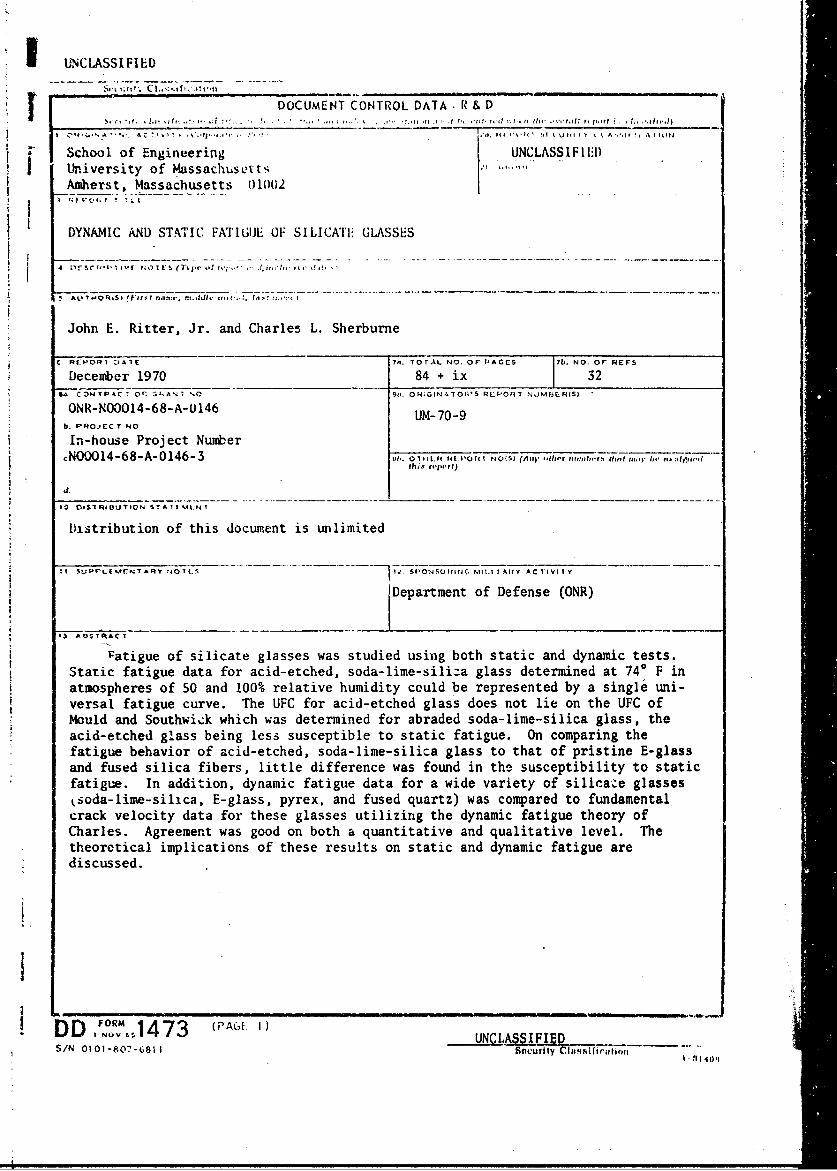
i UNCLASSIFIED
DOCUMENT CONTROL DATA R & D
School of Engineering UNCLASSI F I ED)University of Massachusetts .'
Amherst, Massachusetts 01002
DYNAMIC AND STATIC FAI'IGIJE 01F SILICATII GLASSES
A !I'rs Ie Vt- t.OTI.T (Ti , . J". , ; -h ,
A* AL 7MOR45SJf'm f fau_, _li r"
* John E. Ritter, Jr. and Charles L. Sherburne
REPOR) )AIE 7R. TO r AL NO. OF P-AG ES 17b. NO. or REFS
December 1970 84 + ix 3204 CONT .AC ! 01; ýtA.%-, %0 91.. OHiGIN.ATOlS RLPORT JMBF3R(SO)
ONR-NO0014-68-A-0146 UM- 70-9b- PRO-,CCT NO
In-house Project Number:NO001 4-68-A-0146-3 , .o i, t, ,C' () (A ,, r ,,1,1,...... 'I ..... ,,, ,,,., .
th. |e~f
1- 0#S RIRBUTION STA II MtN
Distribution of this document is unlimited
.!I U 3 Pr-L&M4rPTA Y N4071.E 11Z. O'SOtllIFJC. ,1.1 I.1AllY ACTIVITY
Department of Defense (ONR)
* 13 A-35i(ACT
Fatigue of silicate glasses was studied using both static and dynamic tests.Static fatigue data for acid-etched, soda-lime-siliza glass determined at 740 F inatmospheres of 50 and 100% relative humidity could be represented by a single uni-versal fatigue curve. The UFC for acid-etched glass does not lie on the UFC ofMould and SouthwiLk which was determined for abraded soda-lime-silica glass, theacid-etched glass being less susceptible to static fatigue. On comparing thefatigue behavior of acid-etched, soda-lime-silica glass to that of pristine E-glassand fused silica fibers, little difference was found in the susceptibility to staticfatigue. In addition, dynamic fatigue data for a wide variety of silicate glassesksoda-lime-silica, E-glass, pyrex, and fused quartz) was compared to fundamentalcrack velocity data for these glasses utilizing the dynamic fatigue theory ofCharles. Agreement was good on both a quantitative and qualitative level. Thetheoretical implications of these results on static and dynamic fatigue arediscussed.
FORM ( PAGE 1)DD NOV ",14 7 UNC LAýSSlF IE DS/N 0OI -807-6811 hGfitiE.
% I 1401

I ,UNSC.SIFIDD.So-curitl Clas.sific ation
1 K EY %LINK A LINK D LINK C
1I0 ROL E WT ROLE WT ROLE WT
I Static Fatigue-
Dynamic Fatigue
r Silicate Glasses
Stress Corrosion Susceptibilityrt
DD %ONov1 1473 UNCLA)SSIFIEDwIA


![[Teresa Southwick] Uma Simples Paixão](https://img.pdfslide.net/doc/110x75/55cf9352550346f57b9d4792/teresa-southwick-uma-simples-paixao.jpg)