Embed Size (px)
Citation preview

Page 1
D1 Revision Questions
Using questions from June 2001, January 2002, June 2002
Page 2
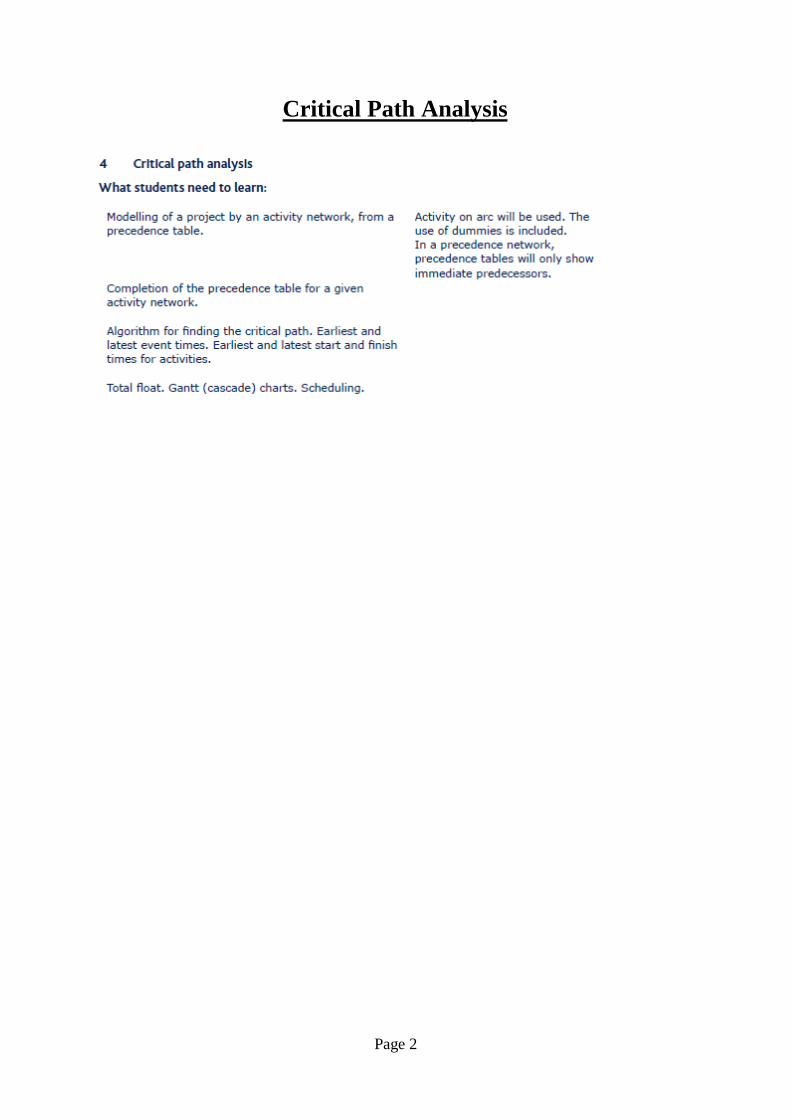
Critical Path Analysis

Page 3
1. The precedence table for activities involved in a small project is shown below
Activity Preceding Activities
A
B
C
D B
E A
F A
G B
H C, D
I E
J E
K F, G, I
L H, J, K
Draw an activity network, using activity on edge and without using dummies, to model this
project. (5)

Page 4
2. Figure 4
A building project is modelled by the activity network shown in Fig. 4. The activities are
represented by the arcs. The number in brackets on each arc gives the time, in hours, taken to
complete the activity. The left box entry at each vertex is the earliest event time and the right
box entry is the latest event time.
(a) Determine the critical activities and state the length of the critical path. (2)
(b) State the total float for each non-critical activity. (3)
(c) On the grid in the answer booklet, draw a cascade (Gantt) chart for the project. (4)
Given that each activity requires one worker,
d) draw up a schedule to determine the minimum number of workers required to complete the
project in the critical time. State the minimum number of workers. (3)
A(3)
1
2
3
4
5
6
7
8
9
25 25
0 0
3 5 11 11
18 22
16 16
7 9
4 4
9 9
B(4)
D(3)
E(4)
F(5)
C(6) G(3)
I(5)
K(5)
L(4)
P(3)
N(9)
H(7)
M(2)
J(2)
Key
Earliest
event time
Latest
event time

Page 5
2(c)
1 2 3 4 5 6 7 8 9 10 11 12 13 14 15 16 17 18 19 20 21 22 23 24 25
2(d)
1 2 3 4 5 6 7 8 9 10 11 12 13 14 15 16 17 18 19 20 21 22 23 24 25

Page 6
3. Figure 3
A project is modelled by the activity network shown in Fig 3. The activities are represented
by the edges. The number in brackets on each edge gives the time, in days, taken to complete
the activity.
(a) Calculate the early time and the late time for each event. Write these in the boxes on the
answer sheet. (4)
(b) Hence determine the critical activities and the length of the critical path. (2)
(c) Obtain the total float for each of the non-critical activities. (3)
(d) On the first grid on the answer sheet, draw a cascade (Gantt) chart showing the
information obtained in parts (b) and (c). (4)
Each activity requires one worker. Only two workers are available.
(e) On the second grid on the answer sheet, draw up a schedule and find the minimum time in
which the 2 workers can complete the project. (4)
4 5
1 2 3 6 A(5) B(4)
C(7)
F(6)
E(7)
G(8)
H(3) D(2)

Page 7
3 (d,e)
0 5 10 15 20 25 30
0 5 10 15 20 25 30

Page 8
Algorithms

Page 9
4. Figure 1
Figure 1 shows 7 locations A, B, C, D, E, F and G which are to be connected by pipelines.
The arcs show the possible routes. The number on each arc gives the cost, in thousands of
pounds, of laying that particular section.
(a) Use Kruskal’s algorithm to obtain a minimum spanning tree for the network, giving the
order in which you selected the arcs. (4)
(b) Draw your minimum spanning tree and find the least cost of the pipelines. (3)
A
B
C
D
E
F
G 54 30
40 35
25
32
50
20 70

Page 10
5. (i)
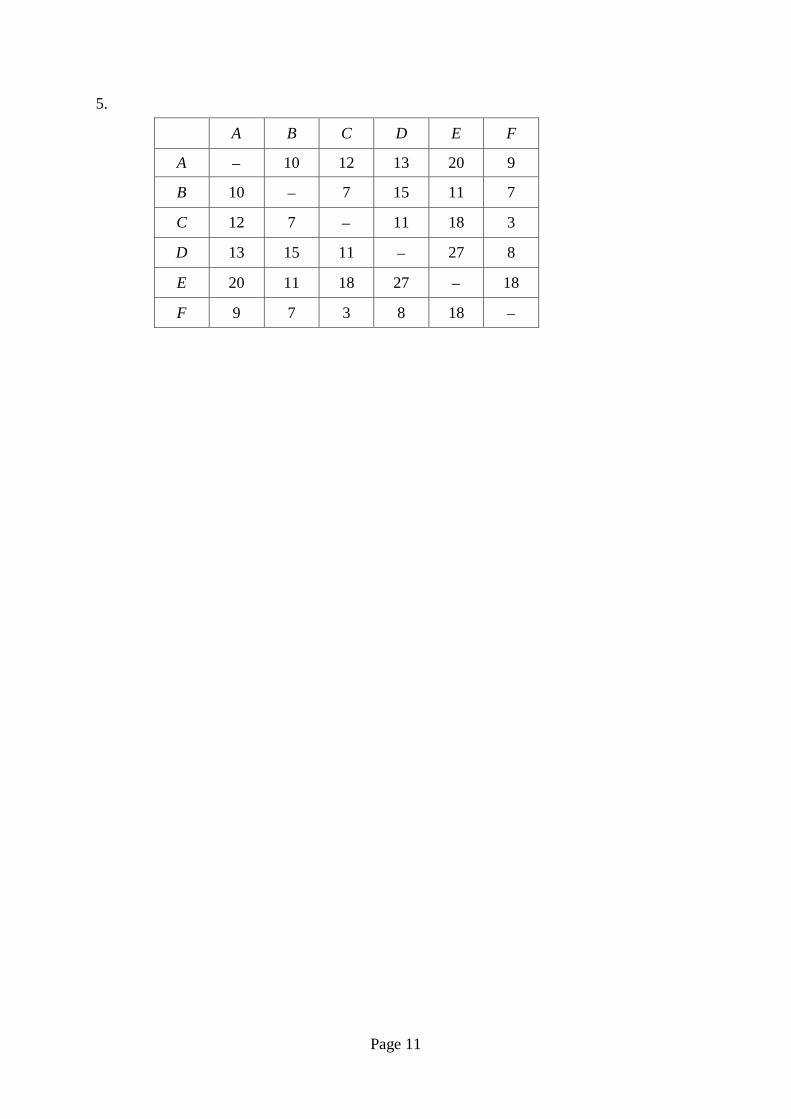
The table shows the distances, in metres, between six nodes A, B, C, D, E, and F of a
network.
(a) Use Prim’s algorithm, starting at A, to solve the minimum connector problem for this
table of distances. Explain your method and indicate the order in which you selected the
edges. (4)
(b) Draw your minimum spanning tree and find its total length. (2)
(c) State whether your minimum spanning tree is unique. Justify your answer. (1)
(ii) A connected network N has seven vertices.
(a) State the number of edges in a minimum spanning tree for N. (1)
A minimum spanning tree for a connected network has n edges.
(b) State the number of vertices in the network. (1)
A B C D E F
A 10 12 13 20 9
B 10 7 15 11 7
C 12 7 11 18 3
D 13 15 11 27 8
E 20 11 18 27 18
F 9 7 3 8 18
Page 11
5.
A B C D E F
A 10 12 13 20 9
B 10 7 15 11 7
C 12 7 11 18 3
D 13 15 11 27 8
E 20 11 18 27 18
F 9 7 3 8 18

Page 12
6.
Figure 3
The weighted network shown in Fig. 3 models the area in which Bill lives. Each vertex
represents a town. The edges represent the roads between the towns. The weights are the
lengths, in km, of the roads.
(a) Use Dijkstra’s algorithm to find the shortest route from Bill’s home at S to T. Complete
all the boxes on the answer sheet and explain clearly how you determined the path of least
weight from your labelling. (8)
Bill decides that on the way to T, he must visit a shop in town E.
(b) Obtain his shortest route now, giving its length and explaining your method clearly(3)
A
B
C
D
E
F
16
23
13
9
8
8
8
12
20
S T
13
6 24
35
11

Page 13
6.
B
C
D
E
F
11
23
13
9
8
8
8
12
20
S T
13
6
24
35
16
A
Order of
labelling
Final
value
Working values
KEY

Page 14
7. Figure 1
Figure 1 shows a network of roads. Erica wishes to travel from A to L as quickly as possible.
The number on each edge gives the time, in minutes, to travel along that road.
(a) Use Dijkstra’s algorithm to find a quickest route from A to L. Complete all the boxes on
the answer sheet and explain clearly how you determined the quickest route from your
labelling. (7)
(b) Show that there is another route which also takes the minimum time (1)
A
4
1
B
6
2
C
6
8
E
4
5
F G H
I J K L
4
7 3 1
2
2 4 1
5
D

Page 15
7. (a)
A B C D
4 6 6
E F G H
4 5 2
I J K L
2 4 1
1 2 8 4
5 7 3 1
KEY
Order of
Labelling
Final
Value
Working Values

Page 16
8. Figure 3
Figure 3 shows the network of paths in a country park. The number on each path gives its
length in km. The vertices A and I represent the two gates in the park and the vertices B, C, D,
E, F, G and H represent places of interest.
(a) Use Dijkstra’s algorithm to find the shortest route from A to I. Show all necessary
working in the boxes in the answer booklet and state your shortest route and its length.
(5)
The park warden wishes to check each of the paths to check for frost damage. She has to
cycle along each path at least once, starting and finishing at A.
(b) (i) Use an appropriate algorithm to find which paths will be covered twice and state
these paths.
(ii) Find a route of minimum length.
(iii) Find the total length of this shortest route.
(5)
5
A (West
Gate)
B
C
D
E
F
G
I (East
Gate)
H
10
12 6
3 3
5
9
2 3 4
15
2
12

Page 17
8. a)
5
A
B
C
D
E
F
G
I
H
10
12 6
3 3
5
9
2 3 4
15
2
12
Page 18
Route Inspection

Page 19
9. Figure 2
Figure 2 shows a new small business park. The vertices A, B, C, D, E, F and G represent the
various buildings and the arcs represent footpaths. The number on an arc gives the length, in
metres, of the path. The management wishes to inspect each path to make sure it is fit for use.
Starting and finishing at A, solve the Route Inspection (Chinese Postman) problem for the
network shown in Fig. 2 and hence determine the minimum distance that needs to be walked
in carrying out this inspection. Make your method and working clear and give a possible
route of minimum length.
(7)
A
B
C D
E
F
G
45
40
62
80
70 38
35
42
28

Page 20
10. Figure 2
C
14 9
12 H
A 4 F 7
21 E 10
17 8
5
B 11 G
6 13
D
Figure 2 models an underground network of pipes that must be inspected for leaks. The nodes
A, B, C, D, E, F, G and H represent entry points to the network. The number on each arc
gives the length, in metres, of the corresponding pipe.
Each pipe must be traversed at least once and the length of the inspection route must be
minimised.
(a) Use the Route Inspection algorithm to find which paths, if any, need to be traversed
twice.
(4)
It is decided to start the inspection at node C. The inspection must still traverse each pipe at
least once but may finish at any node.
(b) Explaining your reasoning briefly, determine the node at which the inspection should
finish if the route is to be minimised. State the length of your route.
(3)

Page 21
Algorithms
Page 22
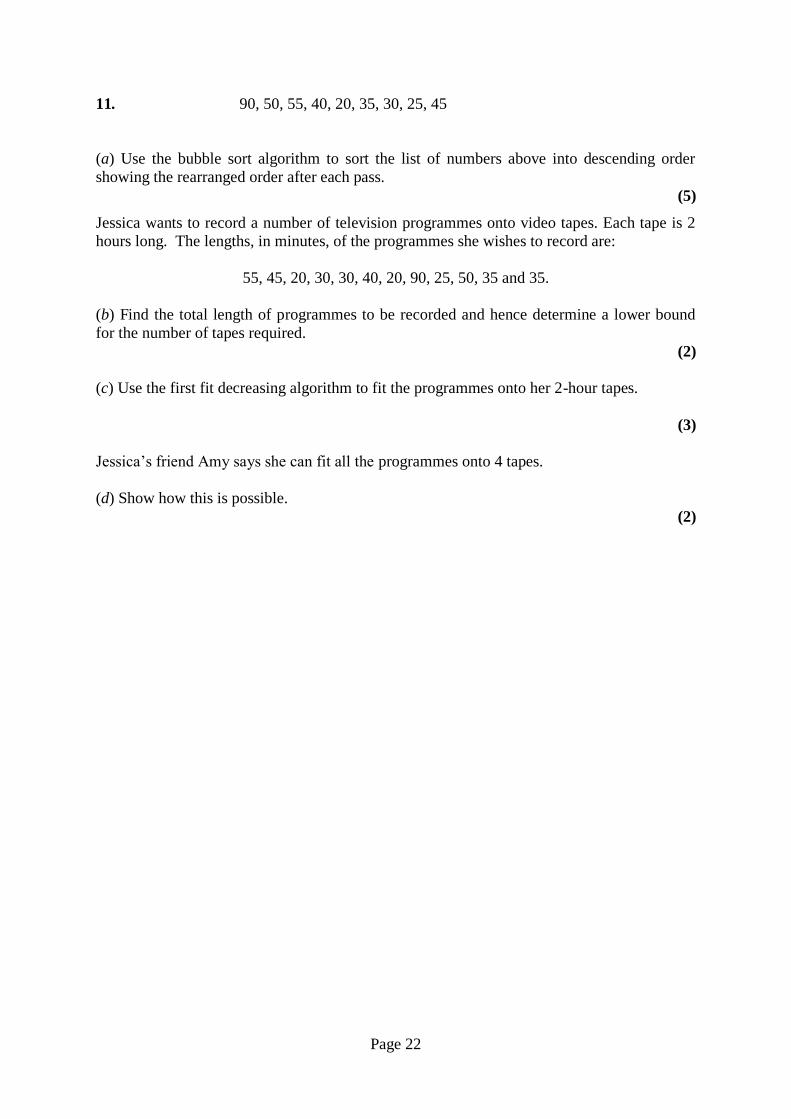
11. 90, 50, 55, 40, 20, 35, 30, 25, 45
(a) Use the bubble sort algorithm to sort the list of numbers above into descending order
showing the rearranged order after each pass.
(5)
Jessica wants to record a number of television programmes onto video tapes. Each tape is 2
hours long. The lengths, in minutes, of the programmes she wishes to record are:
55, 45, 20, 30, 30, 40, 20, 90, 25, 50, 35 and 35.
(b) Find the total length of programmes to be recorded and hence determine a lower bound
for the number of tapes required.
(2)
(c) Use the first fit decreasing algorithm to fit the programmes onto her 2-hour tapes.
(3)
Jessica’s friend Amy says she can fit all the programmes onto 4 tapes.
(d) Show how this is possible.
(2)

Page 23
12. (i) Use the binary search algorithm to try to locate the name SABINE in the following
alphabetical list. Explain each step of the algorithm.
1. ABLE
2. BROWN
3. COOKE
4. DANIEL
5. DOUBLE
6. FEW
7. OSBORNE
8. PAUL
9. SWIFT
10. TURNER
(5) (ii) Find the maximum number of iterations of the binary search algorithm needed to locate a
name in a list of 1000 names.
(2)

Page 24
13.
Ashford 6
Colnbrook 1
Datchet 18
Feltham 12
Halliford 9
Laleham 0
Poyle 5
Staines 13
Wraysbury 14
The table above shows the points obtained by each of the teams in a football league after they
had each played 6 games. The teams are listed in alphabetical order. Carry out a quick sort to
produce a list of teams in descending order of points obtained.
(5)

Page 25
14. An algorithm is described by the flow chart below.
(a) Given that a = 645 and b = 255, complete the table in the answer booklet to show the
results obtained at each step when the algorithm is applied.
(7)
(b) Explain how your solution to part (a) would be different if you had been given that a =
255 and b = 645.
(3)
(c) State what the algorithm achieves. (1)
Start
Read a, b
Let c = a b to 2 d.p.
Let d = largest whole number c
Let e = db
Let f = a e
Is
f =
Let a = b
Let b = f
Write
“answer is” b Sto
p
Yes
No

Page 26
14.
a b c d e f f = 0?

Page 27
Matchings

Page 28
15. Ann, Bryn, Daljit, Gareth and Nickos have all joined a new committee. Each of them is to be
allocated to one of five jobs 1, 2, 3, 4 or 5. The table shows each member’s preferences for
the jobs.
Ann 1 or 2
Bryn 3 or 1
Daljit 2 or 4
Gareth 5 or 3
Nickos 1 or 2
Initially Ann, Bryn, Daljit and Gareth are allocated the first job in their lists shown in the
table.
(a) Draw a bipartite graph to model the preferences shown in the table and indicate, in a
distinctive way, the initial allocation of jobs.
(2) (b) Use the matching improvement algorithm to find a complete matching, showing clearly
your alternating path.
(3) (c) Find a second alternating path from the initial allocation.
(1)

Page 29
16.
3.
Five members of staff 1, 2, 3, 4 and 5 are to be matched to five jobs A, B, C, D and E. A
bipartite graph showing the possible matchings is given in Fig. 1 and an initial matching M is
given in Fig. 2.
There are several distinct alternating paths that can be generated from M. Two such paths are
2 B = 4 E
and 2 A = 3 D = 5 E
(a) Use each of these two alternating paths, in turn, to write down the complete matchings
they generate.
(2)
Using the maximum matching algorithm and the initial matching M,
(b) find two further distinct alternating paths, making your reasoning clear.
(4)
1
2
3
4
5
A
B
C
D
E
Figure 1
1
2
3
4
5
A
B
C
D
E
Figure 2

Page 30
Linear programming

Page 31
17. Two fertilizers are available, a liquid X and a powder Y. A bottle of X contains 5 units of
chemical A, 2 units of chemical B and 1
2 unit of chemical C. A packet of Y contains 1 unit of
A, 2 units of B and 2 units of C. A professional gardener makes her own fertilizer. She
requires at least 10 units of A, at least 12 units of B and at least 6 units of C.
She buys x bottles of X and y packets of Y.
(a) Write down the inequalities which model this situation. (4)
(b) On the grid provided construct and label the feasible region. (3)
A bottle of X costs £2 and a packet of Y costs £3.
(c) Write down an expression, in terms of x and y, for the total cost £T. (1)
(d) Using your graph, obtain the values of x and y that give the minimum value of T. Make
your method clear and calculate the minimum value of T. (4)
(e) Suggest how the situation might be changed so that it could no longer be represented
graphically. (2)
17.
Page 32
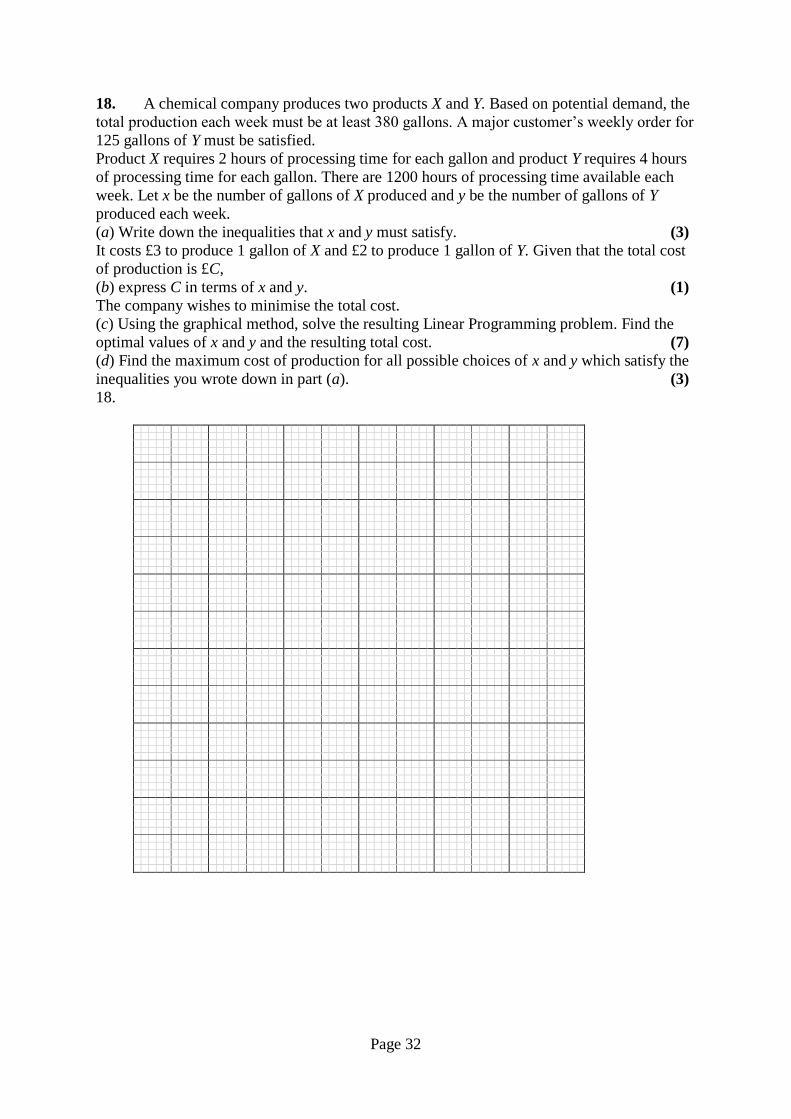
18. A chemical company produces two products X and Y. Based on potential demand, the
total production each week must be at least 380 gallons. A major customer’s weekly order for
125 gallons of Y must be satisfied.
Product X requires 2 hours of processing time for each gallon and product Y requires 4 hours
of processing time for each gallon. There are 1200 hours of processing time available each
week. Let x be the number of gallons of X produced and y be the number of gallons of Y
produced each week.
(a) Write down the inequalities that x and y must satisfy. (3)
It costs £3 to produce 1 gallon of X and £2 to produce 1 gallon of Y. Given that the total cost
of production is £C,
(b) express C in terms of x and y. (1)
The company wishes to minimise the total cost.
(c) Using the graphical method, solve the resulting Linear Programming problem. Find the
optimal values of x and y and the resulting total cost. (7)
(d) Find the maximum cost of production for all possible choices of x and y which satisfy the
inequalities you wrote down in part (a). (3)
18.

Page 33

Page 34
Page 35

Page 36

Page 37

Page 38
Page 39

Page 40

Page 41

Page 42

Page 43

Page 44

Page 45

Page 46