Embed Size (px)
Citation preview

p-medicine – Grant Agreement no. 270089
D12.1 – Architecture and information flow diagrams of the Oncosimulator and the biomechanism models
Page 1 of 86
Deliverable No. 12.1 Architecture and information flow
diagrams of the Oncosimulator and the biomechanism models
Grant Agreement No.: 270089
Deliverable No.: D12.1
Deliverable Name: Architecture and information flow diagrams of the Oncosimulator and the biomechanism models
Contractual Submission Date: 31/07/2011
Actual Submission Date: 29/07/2011
Dissemination Level PU Public X PP Restricted to other programme participants (including the Commission Services) RE Restricted to a group specified by the consortium (including the Commission
Services)
CO Confidential, only for members of the consortium (including the Commission Services)

p-medicine – Grant Agreement no. 270089
D12.1 – Architecture and information flow diagrams of the Oncosimulator and the biomechanism models
Page 2 of 86
COVER AND CONTROL PAGE OF DOCUMENT Project Acronym: p-medicine Project Full Name: From data sharing and integration via VPH models to
personalized medicine
Deliverable No.: D 12.1
Document name: Architecture and information flow diagrams of the Oncosimulator and the biomechanism models
Nature (R, P, D, O)1 R
Dissemination Level (PU, PP, RE, CO)2
PU
Version: 6.0
Actual Submission Date: 29/07/2011
Editor: Institution: E-Mail:
Georgios S. Stamatakos ICCS (Institute of Communication and Computer Systems – National Technical University of Athens) [email protected]
ABSTRACT: This deliverable briefly outlines the basics of the architecture of the Oncosimulator and the biomechanism models that constitute the main objects of the p-medicine project workpackage 12 entitled: “Virtual Physiological Human (VPH) Modelling and the Integrated Oncosimulator”. It also provides the basic information flow across the various modelling modules of the VPH entities. This document is to be viewed only as a gross framework for the development of the detailed algorithms and computer codes of the Oncosimulator and the focused biomechanism models. Detailed descriptions of the algorithms will be included in deliverable D12.2.
The Oncosimulator is at the same time a concept of multilevel integrative cancer biology, a complex algorithmic construct, a biomedical engineering system and eventually a clinical tool which primarily aims at supporting the clinician in the process of optimizing cancer treatment in the patient individualized context through conducting experiments in silico i.e. on the computer. Additionally it is a platform for simulating, investigating, better understanding and exploring the natural phenomenon of cancer, supporting the design and interpretation of clinicogenomic trials and finally training doctors, researchers and interested patients alike. The following tumour types are considered: Wilms tumour (nephroblastoma), acute lymphoblastic leukemia and breast cancer within the context of various clinical trials.
In parallel a number of separate models focusing on various biological mechanisms that determine tumour dynamics at several combinations of biocomplexity levels/scales and are also developed within the framework of the p-medicine project are briefly outlined. The primary goal of the tumour biomechanism focused models is to gain insight into the complex
1 R=Report, P=Prototype, D=Demonstrator, O=Other 2 PU=Public, PP=Restricted to other programme participants (including the Commission Services), RE=Restricted to a group specified by the consortium (including the Commission Services), CO=Confidential, only for members of the consortium (including the Commission Services)

p-medicine – Grant Agreement no. 270089
D12.1 – Architecture and information flow diagrams of the Oncosimulator and the biomechanism models
Page 3 of 86
multiscale phenomenon of cancer and suggest treatment strategies by studying these mechanisms in silico. Each model is designed in such a way that it may be plugged into another biomechanism model and/or into the p-medicine Oncosimulator models. The latter is to be achieved by adopting the “summarize and jump” strategy in conjunction with the VPH toolkit guidelines for model interoperability. Thus the investigational potential of the entire VPH modelling component of p-medicine will be considerably enhanced. The following special molecular level biomechanism focused models related to the tumour types considered are being developed:
i. a molecular level model for inhibitor-kinase, ii. a molecular level model for inhibitor-tubulin, iii. a model of microtubule stability. iv. a DNA-intercalation model, In addition the following cellular level biomechanism models will be developed: v. a model of the proliferative polarity of stem cells as controlled by a p53 signalling network, vi. a model of the interplay of tumour cells and the immune system. It is noted that apart from the simulation of new (in relation to the previous versions of the Oncosimulator) clinical trials concerning acute lymphoblastic leukemia and breast cancer, the modelling of antiangiogenic therapy, the development of a non localized compartmental multiscale model for leukemia treatment and the special biochemical/molecular and cellular biomechanism models to be used in conjunction with the tumour types and clinical trials considered constitute some of the novelties of the p-medicine Oncosimulator.
KEYWORD LIST: In Silico oncology, Oncosimulator, multiscale cancer modelling, cancer simulation, cancer systems biology, Discrete Event Based Cancer Simulation Technique, DEBCaST, systems medicine, personalized medicine, predictive medicine, computational oncology, Wilms tumour, nephroblastoma, acute lymphoblastic leukemia, breast cancer, inhibitor-kinase modelling, inhibitor-tubulin modelling, microtubule stability, DNA intercalation, stem cells, proliferative polarity, tumour-immune system interactions
The research leading to these results has received funding from the European Community's Seventh Framework Programme (FP7/2007-2013) under grant agreement no 270089. The author is solely responsible for its content, it does not represent the opinion of the European Community and the Community is not responsible for any use that might be made of data appearing therein.

p-medicine – Grant Agreement no. 270089
D12.1 – Architecture and information flow diagrams of the Oncosimulator and the biomechanism models
Page 4 of 86
MODIFICATION CONTROL Version Date Status Author
1.0 10/07/2011 Initial Draft Georgios S. Stamatakos, ICCS-NTUA
2.0 13/07/2011 Revision Dimitra D. Dionysiou, ICCS-NTUA
3.0 17/07/2011 Revision Georgios S. Stamatakos, ICCS-NTUA
4.0 22/07/2011 Revision Norbert Graf, USAAR, Katerina Argyri, ICCS-NTUA
5.0 28/07/2011 Revision Dimitra D. Dionysiou, ICCS-NTUA
6.0 29/07/2011 Final Georgios S. Stamatakos, ICCS-NTUA
List of contributors
G. Stamatakos, ICCS-NTUA
D. Dionysiou, ICCS-NTUA
Eleni Georgiadi, ICCS-NTUA
Eleni Kolokotroni, ICCS-NTUA
Eleftherios Ouzounoglou, ICCS-NTUA
Katerina Argyri, ICCS-NTUA
Shunzhou Wan, UCL
Alberto d’ Onofrio, IEO
Norbert Graf, USAAR
Martin Stanulla, CAU
Francesca Buffa, UOXF
Marian Taylor, UOXF

p-medicine – Grant Agreement no. 270089
D12.1 – Architecture and information flow diagrams of the Oncosimulator and the biomechanism models
Page 5 of 86
Contents CONTENTS……………………………………………………………………………………………………… 5 EXECUTIVE SUMMARY………………………………………………………………………………………6 CHAPTER 1: INTRODUCTION……………………………………………………………………………….. 7 CHAPTER 2: STRUCTURE OF THE DELIVERABLE…………………......................................................... 12 CHAPTER 3: THE WILMS TUMOUR (NEPHROBLASTOMA) BRANCH OF THE ONCOSIMULATOR 13 CHAPTER 4: THE ACUTE LYMPHOBLASTIC LEUKEMIA BRANCH OF THE ONCOSIMULATOR… 25 CHAPTER 5: THE BREAST CANCER BRANCH OF THE ONCOSIMULATOR……………………… 59 CHAPTER 6: SPECIAL BIOMECHANISM MODELS AT THE MOLECULAR LEVEL…………………...75 CHAPTER 7: SPECIAL BIOMECHANISM MODELS AT THE CELLULAR LEVEL………………………78 CONCLUSION……………………………………………………………………………………………… …85 Appendix 1 - Abbreviations and acronyms……………………………………………………………………………86

p-medicine – Grant Agreement no. 270089
D12.1 – Architecture and information flow diagrams of the Oncosimulator and the biomechanism models
Page 6 of 86
Executive Summary
This deliverable outlines the basics of the architecture of the Oncosimulator and the special biomechanism models that constitute the main objects of workpackage 12 entitled: “Virtual Physiological Human (VPH) Modelling and the Integrated Oncosimulator”. It also describes the basic information flow across the various modelling modules of the VPH components. The document is to be viewed only as a gross framework for the development of the detailed algorithms and computer codes of the Oncosimulator and the focused biomechanism models. Detailed descriptions of the algorithms will be included in deliverable D12.2.
The Oncosimulator is at the same time a concept of multilevel integrative cancer biology, a complex algorithmic construct, a biomedical-engineering system and eventually a clinical tool which primarily aims at supporting the clinician in the process of optimizing cancer treatment in the patient individualized context through conducting experiments in silico i.e. on the computer. Additionally it is a platform for simulating, investigating better understanding and exploring the natural phenomenon of cancer, supporting the design and interpretation of clinicogenomic trials and finally training doctors, researchers and interested patients alike. The following tumour types are considered: Wilms tumour (nephroblastoma), acute lymphoblastic leukemia and breast cancer within the context of various clinical trials.
In parallel a number of separate models focusing on various biological mechanisms that determine tumour dynamics at several combinations of biocomplexity levels/scales will be developed. The primary goal of the tumour biomechanism focused models is to gain insight into the complex multiscale phenomenon of cancer and suggest treatment strategies by studying these mechanisms in silico. Each model is designed in such a way that it may be plugged into another biomechanism model and/or into the p-medicine Oncosimulator models. The latter is achieved by adopting the “summarize and jump” strategy in conjunction with the VPH toolkit guidelines for model interoperability. Thus the investigational potential of the entire VPH modelling component of p-medicine will be considerably enhanced.
The following biomechanism focused models related to the tumour types considered will be developed:
i. a molecular level model for inhibitor-kinase, ii. a molecular level model for inhibitor-tubulin, iii. a model of microtubule stability. iv. a DNA-intercalation model, In addition the following cellular level biomechanism models will be developed: v. a model of the proliferative polarity of stem cells as controlled by a p53 signalling network,
vi. a model of the interplay of tumour cells and the immune system.
It is noted that apart from the simulation of new (in relation to the previous versions of the Oncosimulator) clinical trials concerning acute lymphoblastic leukemia and breast cancer, the modelling of antiangiogenic therapy, the development of a non localized compartmental multiscale model for leukemia treatment and the special biochemical/molecular and cellular biomechanism models to be used in conjunction with the tumour types and clinical trials considered constitute some of the novelties of the p-medicine Oncosimulator. Furthermore, the exploitation of new nephroblastoma cases is expected to allow a statistically grounded clinical adaptation and validation analysis of the Oncosimulator.
p-medicine – Grant Agreement no. 270089
D12.1 – Architecture and information flow diagrams of the Oncosimulator and the biomechanism models
Page 7 of 86
Chapter 1: Introduction
1.1. Purpose of this document The purpose of the present document is to briefly outline the basics of the architecture of the Oncosimulator and the special biomechanism models referring to both the molecular and the cellular level that constitute the main objects of workpackage 12 entitled: “Virtual Physiological Human (VPH) Modelling and the Integrated Oncosimulator”. It also provides the basic information flow across the various modelling modules of the VPH entities. This document is to be viewed only as a gross framework for the development of the detailed algorithms and computer codes of the Oncosimulator and the focused biomechanism models. Detailed descriptions of the algorithms will be included in deliverable D12.2.
1.2. Introduction to the model development and clinical trial exploitation of WP12
Three multiscale simulation models corresponding to the three tumour types to be addressed i.e.nephroblastoma, breast cancer and acute lymphoblastic leukaemia are being developed. The models make use of multiscale (imaging, histological, molecular, clinical, treatment) data of the patient and focus on tumour response to treatment (chemotherapy, targeted therapy, radiotherapy and combinations). Discrete mathematics serves as the main mathematical tool whereas continuous mathematics is recruited in order to address special facets of cancer treatment and response. The modelling core developed by the In Silico Oncology Group, Institute of Communication and Computer Systems - National Technical University of Athens (ICCS-NTUA) ( www.in-silico-oncology.iccs.ntua.gr ) and extended within the framework of the EC funded ACGT and ContraCancrum projects serves as the development basis of the models. For each solid tumour case a discretization mesh is superimposed upon the anatomic region of interest and the most critical biological and biophysical rules (or “laws”) are applied on each geometrical cell of the mesh at each virtual scan of the region to take place at intervals of one time unit (e.g. 1 h). In the case of leukaemia a non-spatial compartmental model of cells distributed over the various proliferative potential cell categories serves as the basis of the corresponding Oncosimulator model. Cell cycling, symmetric and asymmetric cell division, metabolism, molecular profile, key molecular interactions and survival fraction following treatment represent some of the key rules of the models. The treatment limits imposed by normal tissues will also be taken into account. The development of all models is strictly driven by the corresponding clinical trial protocols. These three models constitute the simulation basis of the p-medicine Oncosimulator and will be clinically adapted/validated using one clinical trial per model.
The p-medicine Oncosimulator models will be quantitatively adapted to clinical reality by exploiting sets of real multiscale biodata including imaging (where applicable), histological, molecular, clinical, and treatment data produced by the clinical trials of the project. Clinical trial data will also be used in order to optimize and validate the simulation codes. To this end the following clinical trials will be used:
i. For the nephroblastoma model: the nephroblastoma SIOP 2001/GPOH clinical trial including the antigen scenario (ACGT version).
ii. For the breast cancer model: the breast cancer bevacizumab-1 and -2 trials.
iii. For the acute lymphoblastic leukaemia model: the ALL BFM 2000 clinical trial.

p-medicine – Grant Agreement no. 270089
D12.1 – Architecture and information flow diagrams of the Oncosimulator and the biomechanism models
Page 8 of 86
1.3. The notion and basic architecture of the Oncosimulator The Oncosimulator is at the same time a concept of multilevel integrative cancer biology, a complex algorithmic construct, a biomedical engineering system and eventually a clinical tool which primarily aims at supporting the clinician in the process of optimizing cancer treatment in the patient individualized context through conducting experiments in silico i.e. on the computer. Additionally it is a platform for simulating, investigating better understanding and exploring the natural phenomenon of cancer, supporting the design and interpretation of clinicogenomic trials and finally training doctors, researchers and interested patients alike [1.1]-[1.8]. From the mathematical standpoint the Oncosimulator is primarily based on discrete mathematics although continuous mathematics is also used. The Discrete Entity Based Cancer Simulation Technique (DEBCaST) [1.6] is extensively used. A broader literature review of multiscale cancer modelling in the context of which the Oncosimulator has emerged is available in [1.8] and [1.9]. A synoptic outline of the clinical utilization of a specific version of the Oncosimulator, as envisaged to take place following an eventually successful completion of its clinical adaptation, optimization and validation process is provided below. First step: Obtain patient’s individual multiscale and inhomogeneous data. Data sets to be collected for each patient include: clinical data (age, sex, weight etc.), eventual previous anti‐tumour treatment history, imaging data (e.g. MRI, CT, PET etc images) (when applicable), histopathological data (e.g. detailed identification of the tumour type, grade and stage, histopathology slide images whenever biopsy is allowed and feasible and/or haematological test data.), molecular data (DNA array data, selected molecular marker values or statuses, serum markers etc.). It is noted that the last two data categories are extracted from biopsy material and/or body fluids.
Second step: Preprocess patient’s data. The data collected are pre‐processed in order to take an adequate form allowing its introduction into the “Tumour and Normal Tissue Response Simulation” module of the Oncosimulator. For example the imaging data are segmented, interpolated, eventually fused and subsequently the anatomic entity/‐ies of interest is/are three-dimensionally reconstructed. This reconstruction will provide the framework for the integration of the rest of data and the execution of the simulation. In parallel the molecular data is processed via molecular interaction networks so as to perturb and individualize the average pharmacodynamic or radiobiological cell survival parameters.

p-medicine – Grant Agreement no. 270089
D12.1 – Architecture and information flow diagrams of the Oncosimulator and the biomechanism models
Page 9 of 86
Fig. 2.1 A synoptic outline of the Oncosimulator [1.6]
Third step: Describe one or more candidate therapeutic scheme(s) and/or schedule(s). The clinician describes a number of candidate therapeutic schemes and/or schedules and/or no treatment (obviously leading to free i.e. non‐inhibited tumour growth), to be simulated in silico i.e. on the computer.

p-medicine – Grant Agreement no. 270089
D12.1 – Architecture and information flow diagrams of the Oncosimulator and the biomechanism models
Page 10 of 86
Fourth step: Run the simulation. The computer code of tumour growth and treatment response is massively executed on distributed grid or cluster computing resources so that several candidate treatment schemes and/or schedules are simulated for numerous combinations of possible tumour parameter values in parallel. Predictions concerning the toxicological compatibility of each candidate treatment scheme are also produced or alternatively estimates of the toxicologically acceptable dosage limits are retrieved from literature.
Fifth step: Visualize the predictions. The expected reaction of the tumour as well as toxicologically relevant side effect estimates for all scenarios simulated are visualized using several techniques ranging from simple graph plotting to four multidimensional rendering.
Sixth step: Evaluate the predictions and decide on the optimal scheme or schedule to be administered to the patient. The clinician carefully evaluates the Oncosimulator’s predictions by making use of their logic, medical education and even qualitative experience. If no serious discrepancies are detected, the predictions support the clinician in taking their final and expectedly optimal decision regarding the actual treatment to be administered to the patient. Seventh step: Apply the theoretically optimal therapeutic scheme or schedule and further optimize the Oncosimulator. The expectedly optimal therapeutic scheme or schedule is administered to the patient. Subsequently, the predictions regarding the finally adopted and applied scheme or schedule are compared with the actual tumour course and a negative feedback signal is generated and used in order to optimize the Oncosimulator.
1.4. The special biomechanism models In parallel a number of separate models focusing on various biological mechanisms that determine tumour dynamics at several various combinations of biocomplexity levels/scales are being developed. The primary goal of the special tumour biomechanism focused models is to gain insight into the complex multiscale phenomenon of cancer and suggest rather generic treatment strategies by studying these mechanisms in silico. Each model will be designed in such a way that it may be plugged into another biomechanism model and/or into the p-medicine Oncosimulator models. The latter will be achieved by adopting the “summarize and jump” strategy in conjunction with the VPH toolkit guidelines for model interoperability. Thus the investigational potential of the entire VPH modelling component of p-medicine will be considerably enhanced.
The following biomechanism focused models related to the tumour types considered will be developed:
i. a molecular level model for inhibitor-kinase, ii. a molecular level model for inhibitor-tubulin, iii. a model of microtubule stability. iv. a DNA-intercalation model, In addition the following cellular level biomechanism models will be developed: v. a model of the proliferative polarity of stem cells as controlled by a p53 signalling network,
vi. a model of the interplay of tumour cells and the immune system.
1.5. Novelty It is noted that apart from the simulation of new (in relation to the previous versions of the Oncosimulator) clinical trials concerning acute lymphoblastic leukemia and breast cancer,

p-medicine – Grant Agreement no. 270089
D12.1 – Architecture and information flow diagrams of the Oncosimulator and the biomechanism models
Page 11 of 86
the modelling of antiangiogenic therapy, the development of a non localized compartmental multiscale model for leukemia treatment and the special biochemical/molecular and cellular biomechanism models to be used in conjunction with the tumour types and clinical trials considered constitute some of the novelties of the p-medicine Oncosimulator. Furthermore, the exploitation of new nephroblastoma cases is expected to allow a statistically grounded clinical adaptation and validation analysis of the Oncosimulator.
1.6. REFERENCES [1.1] Stamatakos, G. S. and Uzunoglu, N. Computer Simulation of Tumour Response to Therapy. Cancer Bioinformatics: from therapy design to treatment Edited by Sylvia Nagl , John Wiley & Sons, Ltd., Chichester,UK,2006
[1.2] Stamatakos G.S., D.D. Dionysiou, N.M. Graf, N.A. Sofra, C. Desmedt, A. Hoppe, N. Uzunoglu and M.Tsiknakis. The Oncosimulator: a multilevel, clinically oriented simulation system of tumor growth and organism response to therapeutic schemes. Towards the clinical evaluation of in silico oncology. Proc 29th Annual Intern Conf IEEE EMBS. Cite Internationale, Lyon, France Aug 2326. SuB07.1: 66286631, 2007
[1.3] D.D. Dionysiou, G.S. Stamatakos, D. Gintides, N. Uzunoglu, K. Kyriaki Critical Parameters Determining Standard Radiotherapy Treatment Outcome for Glioblastoma Multiforme: A Computer Simulation The Open Biomedical Engineering Journal 2, 43-51, 2008
[1.4] G.S.Stamatakos, D.D. Dionysiou Introduction of Hypermatrix and Operator Notation into a Discrete Mathematics Simulation Model of Malignant Tumour Response to Therapeutic Schemes In Vivo. Some Operator Properties Cancer Informatics 7, 239 - 251, 2009
[1.5] Graf, N., A. Hoppe , E. Georgiadi, R. Belleman, C. Desmedt, D. Dionysiou, M. Erdt , J. Jacques, E. Kolokotroni, A. Lunzer, M. Tsiknakis and G. Stamatakos. 2009. "In silico oncology" for clinical decision making in the context of nephroblastoma. Klin Paediatr 221: 141149
[1.6] G. S . Stamatakos, In Silico Oncology Part I: Clinically Oriented Cancer Multilevel Modeling Based on Discrete Event Simulation in Multiscale Cancer Modeling Edited by Tomas Deisboeck and Georgios S . Stamatakos, CRC Press 2011, Pages 407–436, Print ISBN: 978-1-4398-1440-6, eBook ISBN: 978-1-4398-1442-0, DOI: 10.1201/b10407-19, http://www.crcnetbase.com/doi/abs/10.1201/b10407-19 [1.7] N. Graf, Chapter 19. In Silico Oncology Part II: Clinical Requirements Regarding In Silico Oncology, in Multiscale Cancer Modeling, Edited by Tomas Deisboeck and Georgios S . Stamatakos, CRC Press 2011, Pages 437–446, Print ISBN: 978-1-4398-1440-6, eBook ISBN: 978-1-4398-1442-0, DOI: 10.1201/b10407-20 http://www.crcnetbase.com/doi/abs/10.1201/b10407-20
[1.8] G.S.Stamatakos, E.Ch.Georgiadi, N.Graf, E.A.Kolokotroni, and D.D.Dionysiou, "Exploiting Clinical Trial Data Drastically Narrows the Window of Possible Solutions to the Problem of Clinical Adaptation of a Multiscale Cancer Model", PLOS ONE 6(3), e17594, 2011
[1.9] Multiscale Cancer Modeling (book), Edited by Tomas Deisboeck and Georgios S . Stamatakos, CRC Press 2011, Print ISBN: 978-1-4398-1440-6, eBook ISBN: 978-1-4398-1442-0
p-medicine – Grant Agreement no. 270089
D12.1 – Architecture and information flow diagrams of the Oncosimulator and the biomechanism models
Page 12 of 86
Chapter 2: Structure of the Deliverable The deliverable describes the basics of the architecture of the Oncosimulator and the special biomechanism models pertaining to both the molecular and the cellular biocomplexity level. It also provides the basic information flow across the various modelling modules of the VPH entities. Chapter 3 deals with the Wilms tumour branch of the Oncosimulator. Chapter 4 deals with the acute lymphoblastic leukemia branch of the Oncosimulator. Chapter 5 deals with the breast cancer branch of the Oncosimulator. Chapter 6 deals with the following biomechanism models: a molecular level model for inhibitor-kinase, a molecular level model for inhibitor-tubulin, a model of microtubule stability and a DNA-intercalation model. Chapter 7 deals with the following biomechanism models: a model of the proliferative polarity of stem cells as controlled by a p53 signalling network and a model of the interplay of tumour cells and the immune system. Chapter 8 includes a brief discussion and the conclusions.

p-medicine – Grant Agreement no. 270089
D12.1 – Architecture and information flow diagrams of the Oncosimulator and the biomechanism models
Page 13 of 86
Chapter 3: The Wilms Tumour Branch of the Oncosimulator
3.1 The Wilms tumour (nephroblastoma) simulation model 3.1.1 General features The core simulation model of the nephroblastoma (as well as the breast cancer) branch of the Oncosimulator is a predominantly discrete, clinically-oriented multiscale model of solid tumour response to treatment [3.1], [3.2]. In the case of nephroblastoma, preoperative chemotherapy is the simulated form of treatment. A ‘‘top-down’’ simulation approach is adopted [3.3], [3.4]. The simulation method starts from the macroscopic imaging data, representing a high biocomplexity level, and proceeds towards lower biocomplexity levels. When there is a need for an upwards movement in the biocomplexity scales, a summary of the available information pertaining to the previous lower level is made through the utilization of either a single or a small number of parameter value(s). Clinical orientation of the model has been a fundamental guiding principle throughout its development. Available medical data (imaging, histopathological, molecular) can be exploited, in order to strengthen patient-individualized modeling. The model is under continuous refinement in the framework of clinical trials. An ongoing sensitivity analysis in conjunction with the utilization of real clinical trial data considerably supports the process of model validation [3.5]. 3.1.2 Basic algorithmic notions The following five categories (or “equivalence classes”) of cancer cells are considered in the model: stem cells (cells of unlimited mitotic potential), LIMP cells (LImited Mitotic Potential or committed progenitor cells, which can perform a limited number of mitoses before terminal differentiation), terminally differentiated cells, apoptotic cells and necrotic cells. The various cell cycle phases (G1, S, G2, M) and the dormant (G0) phase constitute subclasses in which stem or LIMP cells may reside. Fig. 3.1 depicts the proposed core cytokinetic model, which incorporates several biological phenomena that take place at the cellular level. The following are some of the most crucial ones:
Cycling of proliferating cells through the successive cell cycle phases. Symmetric and asymmetric modes of stem cell division. Terminal differentiation of committed progenitor cells after a number of mitotic
divisions. Transition of proliferating cells to the dormant phase due to inadequate supply of
oxygen and nutrients. Reentering of dormant cells into the active cell cycle due to local restoration of oxygen
and nutrient supply. Cell death through spontaneous apoptosis. Cell death through necrosis (due to prolonged oxygen and nutrients’ shortage). Cell death due to chemotherapy-induced apoptosis.
Table 3.1 presents the corresponding tumour dynamics model parameters.
In order to simulate chemotherapy-induced cell death, lethally hit cells are assumed to enter a rudimentary cell cycle leading to apoptotic death. Cell cycle-specific, cell cycle-non specific, cell cycle phase-specific and cell cycle phase-non specific drugs can be simulated, as detailed in [3.1]. “Marking” of a cell as “hit” by a drug is assumed to take place at the instant of drug administration. However, its actual time of death is dictated by the specific drug’s pharmacokinetics and pharmacodynamics. The numbers of cells hit by the drug are
p-medicine – Grant Agreement no. 270089
D12.1 – Architecture and information flow diagrams of the Oncosimulator and the biomechanism models
Page 14 of 86
computed through the utilization of the cell kill ratio (CKR) parameter (CKR = 1-cell survival fraction), defined as the percentage of lethally hit cells after each drug administration. A diversification of chemotherapeutic resistance between tumour stem and non-stem cells can be easily achieved through the use of different values of the corresponding CKR parameters.
For a relatively short time interval compared to the tumour lifetime (such as the duration of a simulated chemotherapeutic schedule) the various cell category/phase transition rates are considered approximately constant and reflect the means of the actual cell category/phase transition rates over the interval.
3.1.3 Virtual tumour spatiotemporal initialization A three-dimensional cubic mesh discretizing the region of interest is considered. The elementary volume of the mesh is called geometrical cell (GC). Each GC of the tumour accommodates initially a number of biological cells (NBC), which is defined based on typical solid tumour cell densities (e.g. 109 cells/cm3) [3.6], unless more specific information for a particular tumour is available. The cells initially residing within each GC of the mesh are distributed into the five classes and subclasses mentioned above. The technique used for the tumour constitution initialization is critical, in order to avoid latent artificial tumour growth behaviours [3.1], [3.2].
The model supports the division of tumour area into different metabolic regions (e.g. necrotic and proliferative) based on pertinent imaging data and the handling of each region separately. In this case different values of specific model parameters can be assigned to each region.
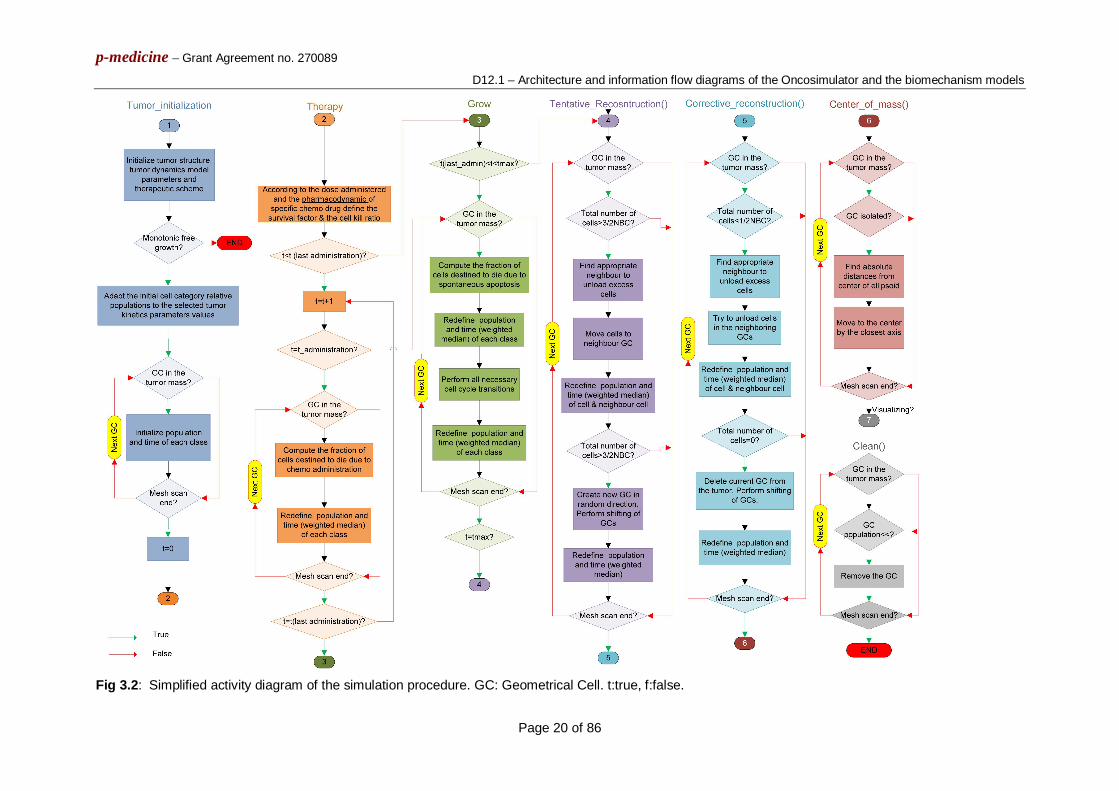
3.1.4 Virtual tumour spatiotemporal evolution At each time step the discretizing mesh is scanned and the basic cytokinetic, metabolic, pharmacokinetic/pharmacodynamic and mechanical rules that govern the spatiotemporal evolution of the tumour are applied. Practically, each complete scan can be viewed as consisting of two mesh scans, as described in [3.1]. Briefly speaking, the first scan aims at updating the state of each GC, by applying the rules of the cytokinetic model of Fig. 3.1. The second scan serves to simulate tumour expansion or shrinkage, based on the principle that, throughout a simulation, the total population of a GC is allowed to fluctuate between a minimum and a maximum value, defined in relation to the initial typical GC cell content. At each time step, checks of each GC total population designate whether the total cell number is above/below the predefined max/min thresholds and, if necessary, specially-designed cell content shifting algorithms “create” or “delete” GCs and thereby lead to tumour expansion or shrinkage, respectively. A simplified activity diagram of the entire simulation procedure is provided in Fig. 3.2.
3.1.5 Chemotherapeutic agents for the treatment of Wilms tumours 3.1.5.1 Vincristine pharmacokinetics and pharmacodynamics The antineoplastic effect of vincristine is basically attributed to its ability to destroy the functionality of cell microtubules, which form the mitotic spindle, by binding to the protein tubulin [3.9]. Failure of the mitotic spindle results in apoptotic cell death at mitosis [3.14]. Vincristine is characterised as a cell cycle specific agent (exerts action on cells traversing the cell cycle) [3.10] and more specifically as an M-phase specific drug [3.9], [3.11]. Therefore, in the simulation model vincristine is assumed to bind at cells at all cycling phases and lead to apoptotic cell death at the end of M phase. It should be noted that vincristine cytotoxicity is known to decrease with increasing tumour cell density (“inoculum effect”) [3.12].

p-medicine – Grant Agreement no. 270089
D12.1 – Architecture and information flow diagrams of the Oncosimulator and the biomechanism models
Page 15 of 86
Following a vincristine intravenous (i.v.) bolus injection of 1.5 mg/m2 the area under curve (AUC) is given according to [3.7] as equal to 6.7mg/L/min. According to [3.8] an experiment was carried out to test whether the arrest in metaphase of cervical carcinoma cells after treatment with various concentrations of vincristine for 6 hours was reversible. Treatment with 16×10-3 μg/ml of vincristine for 6 hours seems to produce an irreversible metaphase arrest and an AUC of 5.76 μg/ml/min =5.76 mg/L/min which is very close to the clinical AUC that has been observed in [3.7]. The metaphase index calculated at 90 min after the removal of the drug (a time period during which it increases) was equal to 240 (cells stuck in metaphase per 1000 cells). This value of 240/1000=0.24 can be considered to reflect the cell kill fraction in the experiment, since mitosis cannot be completed, the cell cycle cannot proceed and death should follow. As the value of 5.76 μg/ml/min for the AUC in this experiment is slightly lower than the clinical AUC value of 6.7 mg/L/min, a cell kill fraction equal to 0.3 could be justified as an initial gross approximation, which is expected to be corrected, if necessary, with the help of clinical data. As a first approximation also the imperfect drug penetration into the tumour is assumed to have been taken into account in this value of 0.3 cell kill fraction.
3.1.5.2 Actinomycin-D (Dactinomycin) pharmacokinetics - pharmocodynamics Actinomycin-D is a cell cycle-nonspecific antitumour antibiotic that binds to double-stranded DNA through intercalation between adjacent guanine-cytosine base pairs [3.10], thereby inhibiting its synthesis and function. It also acts to form toxic oxygen-free radicals, which create DNA strand breaks, inhibiting DNA synthesis and function. In the simulation model actinomycin-D is assumed to bind to cells at all cycling phases and lead to apoptosis at end of S phase. Since recent literature data for dactinomycin pharmacokinetics proved to be rather scarce, a more simplistic approach has been adopted in this case as a first approximation. A cell kill fraction equal to 0.2 has been adopted as a starting point based on the fact that actinomycin- D is considered a less potent cytotoxic drug compared to vincristine, as indicated by lower AUC and higher IC50 values for various tumour and normal cells [3.13],[3.14]. Imperfect drug penetration into the tumour is assumed to have been taken into account when considering this cell kill fraction value.
3.1.5.3 Vincristine and Actinomycin-D combined treatment. In case a vincristine i.v. bolus injection is directly followed by an i.v. bolus injection of actinomycin-D, with no delay in-between, as a first approximation an additive drug effect of vincristine and actinomycin-D can been assumed. This is considered an optimal starting point for simulating the effect of practically concurrently administered drugs (when this is the case). The corresponding cell kill fractions computed according to the pharmacodynamics of each drug are added in order to acquire the total cell kill fraction (cell kill fraction = 1-cell survival fraction) [3.15]. The individual patient’s serum immune response molecular data correlating specific tumour antigens with tumour histology (blastemal, epithelial, stromal cell fractions), which in turn considerably affects chemotherapy responsiveness, have been planned to be used in order to perturb the population based mean cell survival fractions.
3.1.6 Model sensitivity analysis The results of the sensitivity analyses performed up to now have permitted the sorting of
the model’s parameters –and hence of the corresponding biological mechanisms- according to the magnitude of their effect on selected outputs. These are cellular-level biological mechanisms, but are governed by –and thus summarize- various genetic determinants which may diversify the tumour phenotype, prognosis and response to therapy for each particular clinical case. More specifically, all model parameters pertaining to tumour

p-medicine – Grant Agreement no. 270089
D12.1 – Architecture and information flow diagrams of the Oncosimulator and the biomechanism models
Page 16 of 86
dynamics have been studied (Table 3.1). The remaining few model parameters are miscellaneous parameters unrelated to the tumour dynamics. The simulation outcome considered was the tumour volume reduction after chemotherapy treatment, since this is a typical measure of the response to preoperative chemotherapy treatment in the clinical setting [3.16], [3.17]. The sensitivity analysis approach adopted for the sorting of model’s parameters in terms of their effect on the simulation outcome was the consideration of a 5% variation (variation factor h=0.05) around the reference value of each studied model parameter and subsequent inspection of the variation in the output (a detailed explanation of these sensitivity analysis can be found in [3.5]).
As shown in Fig. 3.3, the two biological mechanisms mostly implicated in the result of therapy are:
a. The oxygen and nutrients availability status of the tumour (as expressed mainly by the fraction of cells entering the dormant phase following mitosis - Psleep), and
b. The balance between the symmetric and asymmetric modes of stem cell division, reflecting intrinsic properties of stem cells and/or extrinsic controls from their microenvironment (represented by the fraction of stem cells that divide symmetrically - Psym) Other parameters completing the picture of tumour response to therapy, but with
significantly reduced impact on the selected outcome compared to the previous two, are: c. The cytotoxicity of the chemotherapeutic agents (reflected by their total cell kill ratio –
CKRtotal) d. The cell cycle duration - Tc e. The apoptosis rate of living stem and committed progenitor (LIMP) tumour cells - RA. f. The fraction of the dormant cells having just left the G0 compartment that re-enter the
cell cycle -PG0toG1 (which constitutes a further way through which the oxygenation and nutrients’ availability status of the tumour plays a role in the model).
An additional parametric analysis is presented in Fig. 3.4, involving the previously defined six most critical parameters which largely complete the picture of the tumour’s response to treatment in terms of volume reduction (i.e. Psleep, Psym, CKRtotal, Tc, RA, PG0toG1). The combined effects of a number of parameter dyads on the reduction percentage of a chemotherapeutically treated tumour and on the growth rate constant characterizing its re-growth after the completion of therapy have been studied. The considered parameter dyads are: i) Psym and Psleep, ii) TC and RA, and iii) CKRtotal and PG0toG1.
For tumour regrowth after therapy studies, an exponential free growth pattern has been considered, which in fact approximates a segment of the Gompertzian curve, as explained in [3.1]. The areas that appear in the graphs of figure 4 show only combinations of biologically relevant parameter values leading to tumours that exhibit monotonic behaviour for the case of free growth [3.1], [3.5] and tumours displaying volume reduction after therapy for the case of treatment.
Fig. 3.4A shows the combined effect of Psym and Psleep on the growth rate of the tumour. An intuitive observation is that a tumour is more aggressive (with a higher growth rate constant) for higher values of Psym and lower values of Psleep, which points out the counteracting effect of the two mechanisms. The growth rate “isosurfaces” (here defined as distinct ranges of the growth rate constant values and indicated by distinct gray shades) form parallel stripes, implying that the effect of the combination of the two parameters retains the same character over the entire value space considered.
Fig. 3.4C shows the combined influence of TC and RA. Virtual tumours with prolonged cell cycle duration are less aggressive (with a lower growth rate constant) than tumours with short cell cycle durations. This difference becomes greater for higher values of the spontaneous apoptosis rate. The tumour growth rate “isosurfaces” appear almost parallel to the axis of RA for low values of TC: the influence of spontaneous apoptosis on the growth

p-medicine – Grant Agreement no. 270089
D12.1 – Architecture and information flow diagrams of the Oncosimulator and the biomechanism models
Page 17 of 86
rate of the tumour is much less pronounced than the effect of the cell cycle duration (which is in accordance with the results presented in Fig. 3.3).
In Fig. 3.4E a biologically anticipated finding is that tumours with higher PG0toG1 values have higher growth rate constants. Also, as expected, the drugs’ cell kill ratio has no effect on the tumour free growth rate; therefore, “isosurfaces” parallel to the axis of the CKR parameter appear in this case.
In Fig. 3.4B an isoline of maximum volume reduction is discernible. A sharp decrease in the output is observed when changing the parameter values from those that lead to that maximum reduction, which is characteristic of the pronounced sensitivity of the output on the values of these two parameters, in accordance with the results of Fig.3.3. Parallel “isosurfaces” are another characteristic of the output in this case two.
Fig. 3.4D indicates larger volume reductions for tumours with high values of TC and high values of RA. Finally, as shown in Fig. 3.4F, an increased CKR of the combination of the chemotherapeutic agents (i.e. increased cytotoxicity) leads intuitively to greater tumour volume reductions. The volume reductions are slightly higher for higher values of PG0toG1.
A synopsis of the some of the above findings is available in [3.25].
TABLE 3.1: Definition of tumour dynamics model parameters, reference values and corresponding literature references, and values assigned for the implementation of four virtual tumours. CKRtotal (cell kill ratio total) is not an independent parameter of the model.
Symbol (units) Definition Reference
Value References Tumour
1 (T1) Tumour 2 (T2)
Tumour 3 (T3)
Tumour 4 (T4)
Model parameters studied in published sensitivity analyses
Tc (h) Cell cycle duration 23.0 [3.18] 23.0 40.0 23.0 55.0
TG0 (h) G0 (dormant phase) duration, i.e. time interval before a dormant cell dies through necrosis
96.0 [3.19] 96.0 96.0 96.0 40.0
TN (h) Time needed for necrosis to be completed and its lysis products to be eliminated from the tumour
20.0 [3.20], [3.21], [3.22] 20.0 20.0 20.0 120.0
TA (h) Time needed for apoptosis to be completed and its products to be
6.0 [3.23], [3.24] 6.0 6.0 6.0 6.0

p-medicine – Grant Agreement no. 270089
D12.1 – Architecture and information flow diagrams of the Oncosimulator and the biomechanism models
Page 18 of 86
eliminated from the tumour
RA (h-1) Apoptosis rate of living stem and LIMP tumour cells (fraction of non-differentiated cells dying through apoptosis per hour)
0.001 Derived from TA, based on [3.23], [3.24]
0.001 0.0008 0.001 0.001
RADiff (h-1) Apoptosis rate of differentiated tumour cells per hour
0.003
0.003 0.003 0.003 0.05
RNDiff (h-1) Necrosis rate of differentiated tumour cells per hour
0.001
Derived from TN, based on [3.20], [3.22] 0.001 0.001 0.001 0.05
PG0toG1 The fraction of stem or LIMP cells having just left the G0 compartment that re-enter the cell cycle
0.01
0.01 0.01 0.01 0.01
NLIMP The maximum number of mitoses that a LIMP cell can perform before becoming terminally differentiated
3
3 3 3 3
Psym Fraction of stem cells that perform symmetric division.
0.45
0.71 0.45 0.45 0.76
Psleep Fraction of cells that enter G0 phase following mitosis
0.28
0.40 0.28 0.28 0.36
CKRVCR Cell kill ratio for the specific vincristine dose
0.3 Derived
based on [3.7], [3.8]
0.3 0.3 0.36 0.33

p-medicine – Grant Agreement no. 270089
D12.1 – Architecture and information flow diagrams of the Oncosimulator and the biomechanism models
Page 19 of 86
CKRACT Cell kill ratio for the specific actinomycin-D dose
0.2
Derived based on
[3.13], [3.14] 0.2 0.2 0.34 0.22
CKRTOTAL* Combined cell kill ratio of the two drugs (dependent parameter)
0.5
Additive drug effect considered 0.5 0.5 0.7 0.55
Fig. 3.1: Generic Cytokinetic model for tumour response to chemotherapy. LIMP: Limited Mitotic Potential cells. DIFF: terminally differentiated cells. G1: Gap 1 phase. S: DNA synthesis phase. G2: Gap 2 phase. M: Mitosis phase. G0: dormant phase. Hit: cells lethally hit by chemotherapy. The sliding arrow indicates the point of the cell cycle at which hit cells are led to apoptosis and depends on the drugs’ mechanisms of action.
p-medicine – Grant Agreement no. 270089
D12.1 – Architecture and information flow diagrams of the Oncosimulator and the biomechanism models
Page 20 of 86
Fig 3.2: Simplified activity diagram of the simulation procedure. GC: Geometrical Cell. t:true, f:false.

p-medicine – Grant Agreement no. 270089
D12.1 – Architecture and information flow diagrams of the Oncosimulator and the biomechanism models
Page 21 of 86
Fig. 3.3: Sorting of the model parameters according to their effect on chemotherapy-induced tumour shrinkage. For a definition of the depicted model parameters see Table 3.1. SC: Sorting Criterion (see [3.5] for details).
A B
C D

p-medicine – Grant Agreement no. 270089
D12.1 – Architecture and information flow diagrams of the Oncosimulator and the biomechanism models
Page 22 of 86
E F
Fig. 3.4: Combined effects of selected parameter combinations on tumour free growth rate (first column) and volume reduction after therapy (second column). Different gray shades correspond to distinct ranges of the growth rate constant value or the tumour volume reduction percentage. A, B: Combined effect of Psym and Psleep. C,D: Combined effect of Tc and RA. E,F: Combined effect of CKRtotal and PG0toG1. For a definition of the depicted model parameters see Table 3.1.
3.2 REFERENCES [3.1] Stamatakos GS, Kolokotroni EA, Dionysiou DD, Georgiadi EC, Desmedt C. An advanced discrete state-discrete event multiscale simulation model of the response of a solid tumour to chemotherapy: Mimicking a clinical study. 2010, J Theor Biol , Vol. 266(1), pp. 124-139. [3.2] Georgiadi EC, Stamatakos GS, Graf NM, Kolokotroni EA, Dionysiou DD et al., Multilevel Cancer Modeling in the Clinical Environment: Simulating the Behaviour of Wilms Tumour in the Context of the SIOP 2001/GPOH Clinical Trial and the ACGT Project. in. : Proceedings of the 8th IEEE International Conference on Bioinformatics and Bioengineering. 8-10 Oct 2008. Athens, Greece. CFP08266, ISBN: 978-1-4244-2845-8, Library of Congress: 2008907441, Paper No. BE-2.1.2. [3.3] Stamatakos GS, Dionysiou DD, Graf NM, Sofra NA, Desmedt C et al., The Oncosimulator: a multilevel, clinically oriented simulation system of tumour growth and organism response to therapeutic schemes. Towards the clinical evaluation of in silico oncology. Proceedings of the 29th Annual International Conference of the IEEE EMBS. 23-26Aug 2007. Lyon, France. pp. 6629-6632. . [3.4] Graf N, Hoppe A, Georgiadi E, Belleman R, Desmedt C et al., In Silico Oncology for Clinical Decision Making in the Context of Nephroblastoma. Klinische Paediatrie , Vol. 221, pp. 141-149. [3.5] G.S.Stamatakos, E.Ch.Georgiadi, N.Graf, E.A.Kolokotroni, and D.D.Dionysiou., Exploiting Clinical Trial Data Drastically Narrows the Window of Possible Solutions to the Problem of Clinical Adaptation of a Multiscale Cancer Model. 2011, PLOS ONE. http://www.plosone.org/article/info%3Adoi%2F10.1371%2Fjournal.pone.0017594. [3.6] G. Steel Ed., Basic Clinical Radiobiology. London : Arnold, 2002, pp. 9-10. [3.7] Groninger E, Meeuwsen-de Boer T, Koopmans P, Uges D, Sluiter W et al. , Pharmacokinetics of Vincristine Monotherapy in Childhood Acute Lymphoblastic Leukemia . 2002, Pediatric Research, Vol. 52, pp. 113-118. [3.8] Dahl WN, Oftebro R, Pettersen EO, Brustad T., Inhibitory and cytotoxic effects of Oncovin
p-medicine – Grant Agreement no. 270089
D12.1 – Architecture and information flow diagrams of the Oncosimulator and the biomechanism models
Page 23 of 86
(Vincristine Sulfate) on cells of human line NHIK 3025. 1976, Cancer Res, Vol. 36, pp. 3101-3105. [3.9] Beck WT, Cass CE, Houghton PJ )In: Bast RC, Kufe DW, Pollock RE, Weichelbaum RR, Holland JF, Frei E, editors. Cancer Medicine 5th. Microtubule-targeting anticancer drugs derived from plants and microbes: Vinca alkaloids, taxanes and epothilones. 2000. In: Bast RC, Kufe DW, Pollock RE, Weichelbaum RR, Holland JF, Frei E, editors. Cancer Medicine 5th. [3.10] Salmon SE, Sartorelli AC. Cancer Chemotherapy. 2001. In: Katzung BG, editor. Basic & Clinical Pharmacology. International Edition: Lange Medical Books/McGraw-Hill. 923-1044 pp.. [3.11] Pinkerton CR, McDermott B, Philip T, Biron P, Ardiet C, et al. , Continuous vincristine infusion as part of a high dose chemoradiotherapy regimen: drug kinetics and toxicity. 1988, Cancer Chemother Pharmaco, Vol. 22, pp. 271-274. [3.12] Vincristine saturation of cellular binding sites and its cytotoxic activity in human lymphoblastic leukaemia cells. Kobayashi H, Takemura Y, Holland JF, Ohnuma T. 1998, Biochem Pharmacol, Vol. 55, pp. 1229-1234. [3.13] Sawada K, Noda K, Nakajima H, Shimbara N, Furuichi Y et al. ,Differential cytotoxicity of anticancer agents in pre- and post-immortal lymphoblastoid cell lines. 2005, Biol Pharm Bull, Vol. 28, pp. 1202-1207. [3.14] Veal GJ, Cole M, Errington J, Parry A, Hale J et al. , Pharmacokinetics of Dactinomycin in a pediatric patient population: a United Kingdom Children’s Cancer Study group study. 2005, Clin Cancer Res , Vol. 11(16), pp. 5893-5899. [3.15] W.D.Figg, C.D.Scripture and al., Drug interactions in cancer therapy.. Nat Rev Cancer 6. pp. 546-558, 2006. [3.16] Kaste SC, Dome JS, Babyn PS, Graf NM, Grundy P et al. , Wilms tumour: prognostic factors, staging, therapy and late effects. 2008, Pediatr Radiol, Vol. 38, pp. 2-17. [3.17] Graf N, Turnade MF, De Kraker J. , The role of preoperative chemotherapy in the management of Wilms' tumour: The SIOP studies. 2000, Urologic Clinics of North America, Vol. 27(3), pp. 443-454. [3.18] Revazova ES, Petrova AS. , Cell cycle and proliferative pool of human tumour strains transplanted into athymic mice. 1981, Biull Eksp Biol Med, Vol. 92, pp. 335-337 (In russian). [3.19] . Maseide K, Rofstad EK., Mathematical modeling of chronical hypoxia in tumours considering potential doubling time and hypoxic cell lifetime. 2000, Radiother Oncol, Vol. 54, pp. 171-177. [3.20] Duechting W, Ulmer W, Lehrig R, Ginsberg T, Dedeleit E. , Computer simulation and modeling of tumour spheroids growth and their relevance to optimization of fractionated radiotherapy. 1992, Strahlenther Onkol, Vol. 168(6), pp. 354-360. [3.21] Titz B, Jeraj R. 2008, An imaging-based tumour growth and treatment response model: investigating the effect of tumour oxygenation on radiation therapy response. Phys Med Biol, Vol. 53, pp. 4471-4488. [3.22] Wein LM, Cohen JE, Wu JT. , Dynamic optimization of a linear-quadratic model with incomplete repair and volume-dependent sensitivity and repopulation. 2000, Int J Radiat Oncol Biol Phys, Vol. 47(4), pp. 1073-1083. [3.23] Ribba B, Colin T, Schnell S., A multiscale mathematical model of cancer, and its use in analyzing irradiation therapies. . 2006, Theor Biol Med Model. 3:7. doi:10.1186/1742-4682-3-7. [3.24] Dewey W, Ling CC, Meyn RE., Radiation-induced apoptosis: relevance to radiotherapy. 1995, Int J Radiat Oncol Biol Phys, Vol. 33(4), pp. 781–796.

p-medicine – Grant Agreement no. 270089
D12.1 – Architecture and information flow diagrams of the Oncosimulator and the biomechanism models
Page 24 of 86
[3.25] G.S.Stamatakos, E.Ch.Georgiadi, N.Graf, E.A.Kolokotroni, and D.D.Dionysiou, "Exploiting Clinical Trial Data Drastically Narrows the Window of Possible Solutions to the Problem of Clinical Adaptation of a Multiscale Cancer Model", PLOS ONE 6(3), e17594, 2011

p-medicine – Grant Agreement no. 270089
D12.1 – Architecture and information flow diagrams of the Oncosimulator and the biomechanism models
Page 25 of 86
Chapter 4: The Acute Lymphoblastic Leukemia Branch of the Oncosimulator
4.1 Non-spatial Compartmental Model
4.1.1 Introduction
The non-spatial compartmental model presented here constitutes a modification of previously developed core simulation algorithms and codes of the In Silico Oncology Group (e.g. Stamatakos et al., 2010). The main reason for its development has been the need for simulating the temporal evolution and response to therapy of non solid cancers, such as acute lymphoblastic leukemia in the context of p-medicine. At the same time, this new non-spatial compartmental model can be used for solid tumours as well, when no emphasis is put on the spatial features of a tumour’s evolution.
The new model’s critical features are (a) omission of the simulation of the spatial evolution of the tumour and (b) consideration of more compartments for proliferating cells. In the classical spatial compartmental models (e.g. (Stamatakos et al. 2010), (Stamatakos et al 2011)), the tumour region is treated as a grid (or “mesh”) of “Geometrical Cells” (GCs, the elementary volume of the grid). The morphological rules, which are introduced to govern the deletion or creation of new GCs, result in a shrinkage or expansion of the tumour conformal to its initial shape.
The handling of the spatial features of a tumour’s evolution is a computationally demanding task, particularly so for large tumour sizes. By ignoring these spatial features in the non-spatial algorithm, a more detailed modeling of the cytokinetic properties of the proliferating cells becomes feasible, through the consideration of more proliferating cell compartments. More specifically, the cycling and dormant (if applicable) cancerous cells are distributed in a number of classes/compartments that equals the duration of the relevant cell phase. Each compartment corresponds to a time interval of one hour, as described analytically in the next section.
This handling presents the advantage of eliminating quantization errors related to the existence of only five proliferative cell sub-classes corresponding to the five phases of the cell cycle (G1, S, G2, M), as is the case in the classical spatial compartmental code. On the other hand, the exclusion of the spatial evolution of the tumour does not affect the temporal evolution of the various cancerous cell categories and the total cell population.
Apart from its intuitive usefulness for the simulation of non-solid cancers, the non-spatial compartmental model supports also the simulation of both metabolically homogeneous solid tumours and tumours comprising regions of different metabolic activity (e.g. proliferating, necrotic), as long as the initial volume of each metabolic region is known. The tumour region is not discretized but treated as one or more ‘geometrical cells’ (metabolic compartments) depending on the absence or presence of macroscopically distinguishable areas. The time course of a solid tumour’s volume can be easily derived subsequently by assuming typical cell densities, e.g. 109 biological cells/cm3 (Steel, 2002).
p-medicine – Grant Agreement no. 270089
D12.1 – Architecture and information flow diagrams of the Oncosimulator and the biomechanism models
Page 26 of 86
In the case of hematological neoplasms different compartments (and their sub-compartments) can be considered to distinguish leukemic cells residing in blood or bone marrow.
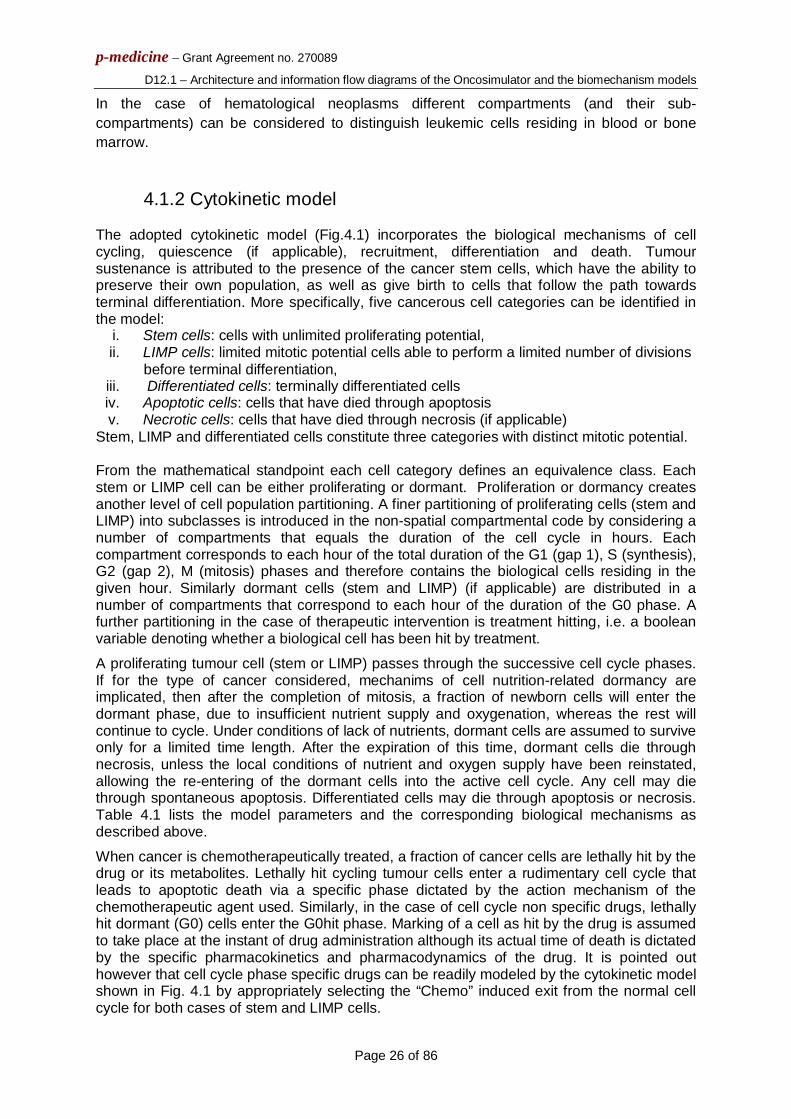
4.1.2 Cytokinetic model
The adopted cytokinetic model (Fig.4.1) incorporates the biological mechanisms of cell cycling, quiescence (if applicable), recruitment, differentiation and death. Tumour sustenance is attributed to the presence of the cancer stem cells, which have the ability to preserve their own population, as well as give birth to cells that follow the path towards terminal differentiation. More specifically, five cancerous cell categories can be identified in the model:
i. Stem cells: cells with unlimited proliferating potential, ii. LIMP cells: limited mitotic potential cells able to perform a limited number of divisions
before terminal differentiation, iii. Differentiated cells: terminally differentiated cells iv. Apoptotic cells: cells that have died through apoptosis v. Necrotic cells: cells that have died through necrosis (if applicable)
Stem, LIMP and differentiated cells constitute three categories with distinct mitotic potential. From the mathematical standpoint each cell category defines an equivalence class. Each stem or LIMP cell can be either proliferating or dormant. Proliferation or dormancy creates another level of cell population partitioning. A finer partitioning of proliferating cells (stem and LIMP) into subclasses is introduced in the non-spatial compartmental code by considering a number of compartments that equals the duration of the cell cycle in hours. Each compartment corresponds to each hour of the total duration of the G1 (gap 1), S (synthesis), G2 (gap 2), M (mitosis) phases and therefore contains the biological cells residing in the given hour. Similarly dormant cells (stem and LIMP) (if applicable) are distributed in a number of compartments that correspond to each hour of the duration of the G0 phase. A further partitioning in the case of therapeutic intervention is treatment hitting, i.e. a boolean variable denoting whether a biological cell has been hit by treatment.
A proliferating tumour cell (stem or LIMP) passes through the successive cell cycle phases. If for the type of cancer considered, mechanims of cell nutrition-related dormancy are implicated, then after the completion of mitosis, a fraction of newborn cells will enter the dormant phase, due to insufficient nutrient supply and oxygenation, whereas the rest will continue to cycle. Under conditions of lack of nutrients, dormant cells are assumed to survive only for a limited time length. After the expiration of this time, dormant cells die through necrosis, unless the local conditions of nutrient and oxygen supply have been reinstated, allowing the re-entering of the dormant cells into the active cell cycle. Any cell may die through spontaneous apoptosis. Differentiated cells may die through apoptosis or necrosis. Table 4.1 lists the model parameters and the corresponding biological mechanisms as described above.
When cancer is chemotherapeutically treated, a fraction of cancer cells are lethally hit by the drug or its metabolites. Lethally hit cycling tumour cells enter a rudimentary cell cycle that leads to apoptotic death via a specific phase dictated by the action mechanism of the chemotherapeutic agent used. Similarly, in the case of cell cycle non specific drugs, lethally hit dormant (G0) cells enter the G0hit phase. Marking of a cell as hit by the drug is assumed to take place at the instant of drug administration although its actual time of death is dictated by the specific pharmacokinetics and pharmacodynamics of the drug. It is pointed out however that cell cycle phase specific drugs can be readily modeled by the cytokinetic model shown in Fig. 4.1 by appropriately selecting the “Chemo” induced exit from the normal cell cycle for both cases of stem and LIMP cells.

p-medicine – Grant Agreement no. 270089
D12.1 – Architecture and information flow diagrams of the Oncosimulator and the biomechanism models
Page 27 of 86
Fig. 4.1: Generic cytokinetic model (cell category / phase transition diagram) for tumour response to chemotherapy. The cell cycle phases are fractionated per hour.Abbreviations: STEM: stem cell. LIMP: LImited Mitotic Potential tumour cell (also called committed or restricted progenitor cell). DIFF: terminally DIFFerentiated tumour cell. G1: Gap 1 cell cycle phase. S: DNA synthesis phase. G2: Gap 2 phase. M: Mitosis phase. G0: dormant, resting phase (if applicable). Chemo: chemotherapeutic treatment. Hit: cells lethally hit by the drug.
4.2 Simulation outline
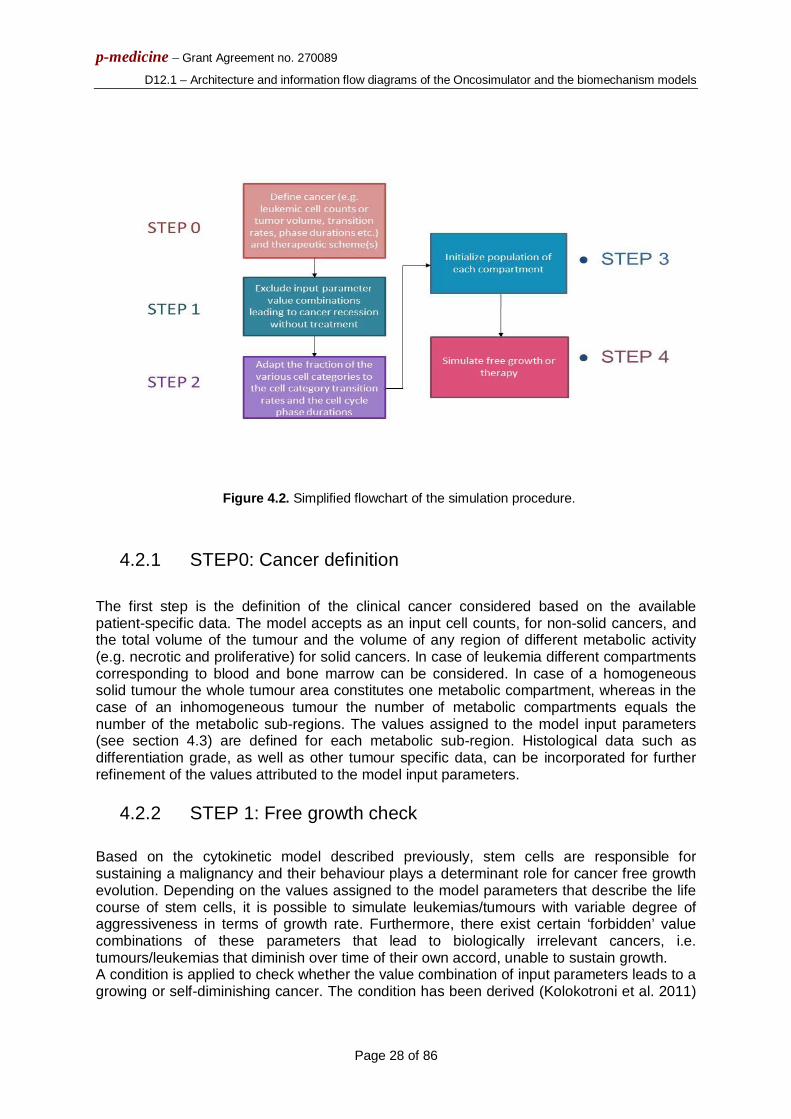
The modeling approach is discrete in time. The model incorporates individualized clinical data such as histopathologic (e.g., type of tumour, grade) and the genetic data (e.g., p53 status, if available). For non-solid tumours, cancer cell counts (populations) can be used. Regarding imaging data for solid tumours (e.g., CT, MRI, PET), the model does not support three dimensional reconstructed images of solid tumours but considers, instead, the tumour volume and the volume of any internal metabolic sub-regions (proliferating, necrotic). Each region is handled independently. A simplified flowchart of the simulation algorithm pertaining to free growth and therapy is depicted in Fig. 4.2 and described below.
p-medicine – Grant Agreement no. 270089
D12.1 – Architecture and information flow diagrams of the Oncosimulator and the biomechanism models
Page 28 of 86
Figure 4.2. Simplified flowchart of the simulation procedure.
4.2.1 STEP0: Cancer definition
The first step is the definition of the clinical cancer considered based on the available patient-specific data. The model accepts as an input cell counts, for non-solid cancers, and the total volume of the tumour and the volume of any region of different metabolic activity (e.g. necrotic and proliferative) for solid cancers. In case of leukemia different compartments corresponding to blood and bone marrow can be considered. In case of a homogeneous solid tumour the whole tumour area constitutes one metabolic compartment, whereas in the case of an inhomogeneous tumour the number of metabolic compartments equals the number of the metabolic sub-regions. The values assigned to the model input parameters (see section 4.3) are defined for each metabolic sub-region. Histological data such as differentiation grade, as well as other tumour specific data, can be incorporated for further refinement of the values attributed to the model input parameters.
4.2.2 STEP 1: Free growth check
Based on the cytokinetic model described previously, stem cells are responsible for sustaining a malignancy and their behaviour plays a determinant role for cancer free growth evolution. Depending on the values assigned to the model parameters that describe the life course of stem cells, it is possible to simulate leukemias/tumours with variable degree of aggressiveness in terms of growth rate. Furthermore, there exist certain ‘forbidden’ value combinations of these parameters that lead to biologically irrelevant cancers, i.e. tumours/leukemias that diminish over time of their own accord, unable to sustain growth. A condition is applied to check whether the value combination of input parameters leads to a growing or self-diminishing cancer. The condition has been derived (Kolokotroni et al. 2011)

p-medicine – Grant Agreement no. 270089
D12.1 – Architecture and information flow diagrams of the Oncosimulator and the biomechanism models
Page 29 of 86
from an analytical treatment of model assumptions following the methodology of (Bertuzzi et al. 1997).
4.2.3 STEP 2: Tumourigenesis
In order to avoid an abnormal free growth behaviour at the beginning of the simulation, an automatic initialization methodology has been developed, according to which the initial relative population (expressed as a fraction of the total cancer cell population) of each equivalence class and its equivalence subclasses is adjusted to the values attributed to the cell category and cell phase transition rates. The technique consists of the following processes. An initial number of stem proliferating cells e.g. 10000 and stem G0 cells (if applicable) e.g. 1000 are distributed throughout the cell cycle and dormant phase respectively. The system is left to evolve according to the cytokinetic model of Fig.4.1 and produce the rest of the cell category populations. The code execution has to continue until equilibrium is reached and the various cell categories population percentages have been stabilized.
4.2.4 STEP 3: Population initialization
The initial biological cells (for solid tumours: residing within each metabolic compartment) are distributed into the five cell categories, i.e. stem, LIMP, differentiated, apoptotic, necrotic (if applicable), based on the fractions calculated during the previous step. The initial distribution of the proliferating and dormant cells throughout the relevant phase is assumed to be an exponential decay of the time they have spent since entering the relevant phase (time is discrete).
4.2.5 STEP 4: Tumour evolution
Each hour the state of each compartment is updated according to the proposed and adopted cytokinetic model of Fig.4.1 as follows. Spontaneous apoptosis induced cell loss from the class of differentiated cells and from each non treatment- and treatment-perturbed cell cycle phase and the G0 phase is calculated for each cell category based on the spontaneous apoptotic rates assumed. The necrotic and apoptotic cells destined to disappear are computed based on the reciprocal of the duration of the relevant phase. The following transitions between the various cell categories may take place: For stem and LIMP cells: Progression through relevant phase, G0G1, G0Necrosis or G0Apoptosis. For differentiated cells: DifferentiatedNecrosis, DifferentiatedApoptosis. For dead cells of any mitotic potential category: ApoptosisCell disappearance, NecrosisCell disappearance. The corresponding rates are parameters of the model (Table 4.1). As far as chemotherapy is concerned, at any time instant corresponding to drug administration, the numbers of proliferating and dormant cells belonging to each hour of the relevant phase and to each one of the stem or LIMP mitotic potential categories that are designated as hit by the drug are computed. The latter is achieved through the utilization of the cell kill ratio (CKR) parameter that corresponds to the drug and dose (per m2 of the
1/1/11
0
010
CATR
GA
GtoGGsleepsleepsym e
TRTPPPP

p-medicine – Grant Agreement no. 270089
D12.1 – Architecture and information flow diagrams of the Oncosimulator and the biomechanism models
Page 30 of 86
patient surface) considered. In terms of the simulation model’s parameters the cell kill ratio is the percentage of LIMP and stem cells hit by the chemotherapeutic agent after each drug administration. The above mentioned cell numbers are added to the corresponding cell numbers of the drug affected equivalence subclasses, designated as “phase” hit. The progression of proliferating and dormant cells throughout the cycling and dormant phase and their removal is dictated by the action mechanism of the chemotherapeutic agent.
4.3 Input parameters
Table 4.1 presents the simulation model’s input parameters and their range of values according to pertinent literature or based on logical assumptions supported by basic science or clinical experience in case of lack of literature data. In the following a description of the model’s parameters related to free growth and their adopted values is provided: (i) Cell cycle duration Based on literature, even though cell cycle duration in cell lines, in vitro, is found equal to around one day, in human tumours may vary considerably, even among tumours of the same histological type. In vivo studies have indicated that cell cycle duration may vary from 15h to more than 100h, with a mean value around 2-3 days (Steel et al., 2002). In the presented model, the duration of mitosis phase is considered constant and equal to 1h (Bast et al., 2000). The rest of the cell cycle phases durations are computed based on (Salmon et al. 2001), after having taken into consideration the above assumption regarding the constant duration of mitosis. More specifically the following equations are used: TG1 = TS = 0.41(Tc-TM), TG2 = 0.18(Tc-TM), TM = 1h. The duration of cell cycle phases is used to determine the time point that hit cells die through apoptosis depending on the action mechanism of the drug. (ii) Duration of G0, duration of apoptosis and necrosis According to literature dormant cells resting in G0 phase can survive under hypoxic conditions for 4-10 days (Maseide et al., 2000). Tumour apoptotic cells are generally considered to be rapidly phagocytosed in vivo (Dewey et al., 1995), contrary to the time-consuming process of necrosis products removal. (iii) Cell category/phase transition rates/fractions The values of these parameters have been selected based on both qualitative or semi-quantitative information and the dictates of the accumulated basic science and clinical experience. Systematic use of clinical trial data is expected to permit a quantitative refinement of the initial assumptions. (v) Number of mitotic divisions that LIMP (committed progenitor) cells undergo before they become terminally differentiated This parameter allows us to simulate tumours of different differentiation degrees.

p-medicine – Grant Agreement no. 270089
D12.1 – Architecture and information flow diagrams of the Oncosimulator and the biomechanism models
Page 31 of 86
Table 4.1: MODEL PARAMETERS
Parameter symbol Description Value References CELL PHASE DURATIONS
Tc[class] class{stem, LIMP†}
Cell cycle duration in hours *
20 h – 96 h Steel et al. 2002
TG0[class] class{stem, LIMP†}
G0 (dormant phase) duration* i.e. time interval before a dormant cell enters necrosis or re-enters cell cycle in hours
96 h – 240 h Maseide et al., 2000
TN
(for solid tumours: TN [region], region{proliferating, necrotic})
Time (in hours) needed for both necrosis to be completed and its lysis products to be removed ‡
(0-several days) Ginsberg T.,1996 (similar value range)
TA
(for solid tumours: TA [region], region{proliferating, necrotic})
Time (in hours) needed for both apoptosis to be completed and its products to be removed ‡
(0 – 25 h) Ginsberg T.,1996 (similar value range) Dewey et al., 1995
CELL CATEGORY/PHASE TRANSITION RATES RA Apoptosis rate of living stem and
LIMP† tumour cells [fraction of cells dying through apoptosis per hour]
0.0 – 1.0 h-1
RNDiff Necrosis rate of differentiated tumour cells [fraction of cell number per hour]
0.0 – 1.0 h-1
RADiff Apoptosis rate of differentiated tumour cells [fraction of cell number per hour]
0.0 – 1.0 h-1
PG0toG1
(For solid tumours: PG0toG1 [region] region{proliferating, necrotic})
Fraction of dormant (stem and LIMP†) cells that have just left dormant phase and re-enter cell cycle ‡
0.0 – 1.0
Psleep
(For solid tumours: Psleep[region] region{proliferating, necrotic})
Fraction of cells entering the G0 phase following mitosis ‡
0.0 – 1.0
Psym
(For solid tumours: Psym[region]
Fraction of stem cells that perform symmetric ‡
0.0 – 1.0

p-medicine – Grant Agreement no. 270089
D12.1 – Architecture and information flow diagrams of the Oncosimulator and the biomechanism models
Page 32 of 86
region{proliferating, necrotic})
MISCELLANEOUS PARAMETERS NLIMP Number of mitoses performed by
LIMP† cells before becoming differentiated
1 - 10
Cell kill factor[class] class{stem, LIMP†}
Factor adapting cell killing probability to stem or LIMP† cells
0.0 – 1.0
For solid tumours: VT Tumour volume in mm^3 depends on
tumour imageable characteristics
For solid tumours: VN Volume of necrotic layer in mm^3 depends on tumour imageable characteristics
DRUG ADMINISTRATION PARAMETERS T1st,combi Time point after initialization (in
days) when the 1st combination drug administration takes place
T2nd, combi Time interval (in days) between 1st and 2nd combination drug administration
depends on chemotherapeutic schedule
T3rd, combi Time interval (in days) between 2nd and 3rd combination drug administration
depends on chemotherapeutic schedule
T4th, combi Time interval (in days) between 3rd and 4th combination drug administration
depends on chemotherapeutic schedule
T5th, combi Time interval (in days) between 4th and 5th combination drug administration (=0 if the chemotherapeutic scheme simulated comprises of less than 5 sessions)
depends on chemotherapeutic schedule
T6th, combi Time interval (in days) between 5th and 6th combination drug administration (=0 if the chemotherapeutic scheme simulated comprises of less than 6 sessions)
depends on chemotherapeutic schedule
T1st,single Time point after initialization (in days) when the 1st single drug administration takes place
depends on chemotherapeutic schedule
T2nd, single Time interval (in days) between 1st and 2nd single drug administration
depends on chemotherapeutic schedule

p-medicine – Grant Agreement no. 270089
D12.1 – Architecture and information flow diagrams of the Oncosimulator and the biomechanism models
Page 33 of 86
T3rd, single Time interval (in days) between 2nd and 3rd single drug administration
depends on chemotherapeutic schedule
T4th, single Time interval (in days) between 3rd and 4th single drug administration
depends on chemotherapeutic schedule
T5th, single Time interval (in days) between 4th and 5th single drug administration (=0 if the chemotherapeutic scheme simulated comprises of less than 5 sessions)
depends on chemotherapeutic schedule
T6th, single Time interval (in days) between 5th and 6th single drug administration (=0 if the chemotherapeutic scheme simulated comprises of less than 6 sessions)
depends on chemotherapeutic schedule
Tstop Execution stop time (in days) after initialization
CKRA Cell kill ratio for drug A 0.0 – 1.0
CKRB Cell kill ratio for drug B 0.0 – 1.0 † A LIMP tumour cell denotes a limited mitotic potential tumour cell (also referred to as LIMP or committed progenitor tumour cell). It leads to a terminally differentiated tumour cell. * Phase durations can be defined separately for the stem and the LIMP tumour cell category. ‡ For spatially inhomogeneous solid tumours it is defined separately for the proliferating and the necrotic region.

p-medicine – Grant Agreement no. 270089
D12.1 – Architecture and information flow diagrams of the Oncosimulator and the biomechanism models
4.4 Proposed utilization of the molecular level data to be made available by the ALL BFM 2000 clinical trials
4.4.1 Scope and principles
This section proposes ways of utilizing the biological knowledge and the molecular / sub-cellular level data to be available in the context of the acute lymphoblastic leukemia (ALL) branch of p-medicine or to be found in literature, in order to integrate them to the multiscale cancer modeling machinery of the Oncosimulator.
Since the molecular profile is one of the main factors leading to the differentiation between cancer patients with the same tumour type, efficiently handling the sub-cellular level of biocomplexity is a sine qua non prerequisite for the achievement of treatment personalization.
Since the Oncosimulator has been structured by adopting primarily the “top-down” modeling strategy, a careful combination with the more traditional “bottom-up” approach widely applied to the molecular level is being developed. A few parameters common in both approaches are used for the achievement of their linking. However, in order to clinically adapt and optimize the composite “top-down” and “bottom-up” system the following scientific areas and tools are being exploited: machine learning methods, bioinformatics and computational systems biology.
4.4.2 Molecular/sub-cellular data in the ALL branch of the Oncosimulator
According to the WP9 description the following molecular level data is expected to be available for various groups of patients:
Group 1: representative cohort of 664 patients:
o status for prognostic relevant chromosomal translocations (ETV6/RUNX1, BCR/ABL, MLL/AF4, E2A/PBX1)
o low-density array of 95 genes previously associated with treatment response and/or outcome.
Group 2: case-control of 50 VHRL and 50 non-VHRL patients o leukemic genome-wide gene expression profiles o Affymetrix 6.0 SNP arrays (leukemic and germline) o leukemic epigenetic profiles
Group 3: cohort of 475 ETV6/RUNX1-positive patients o all of the above except gene expression data (group 1) and genomic data
(group 2) o germline genetic data: Affymetrix 5.0 SNP arrays
Of significant interest is the data referring to the 54 genes that distinguish between resistant and sensitive ALL samples and to 135 clones distinguishing Very High Risk Leukemia (VHRL) patients from the group of prednisone good responders, prednisone poor responders and Minimal Residual Disease (MRD) high‐risk patients (P-medicine description of work,
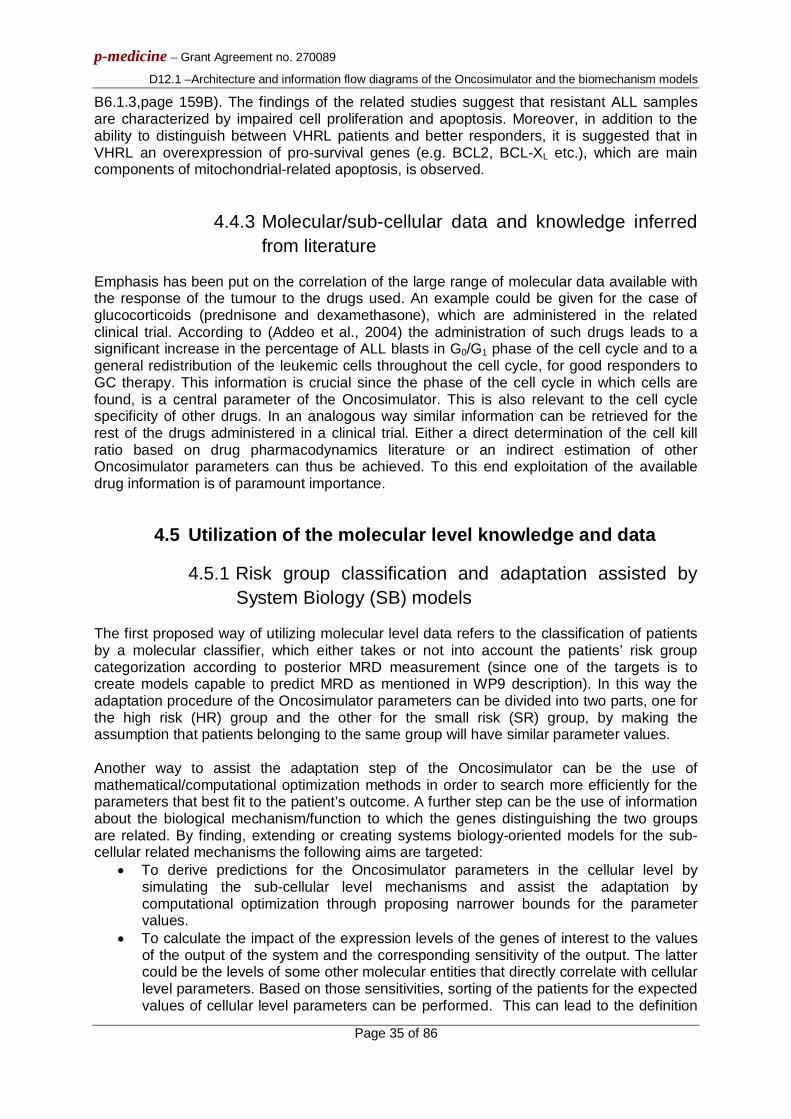
p-medicine – Grant Agreement no. 270089
D12.1 –Architecture and information flow diagrams of the Oncosimulator and the biomechanism models
Page 35 of 86
B6.1.3,page 159B). The findings of the related studies suggest that resistant ALL samples are characterized by impaired cell proliferation and apoptosis. Moreover, in addition to the ability to distinguish between VHRL patients and better responders, it is suggested that in VHRL an overexpression of pro-survival genes (e.g. BCL2, BCL-XL etc.), which are main components of mitochondrial-related apoptosis, is observed.
4.4.3 Molecular/sub-cellular data and knowledge inferred from literature
Emphasis has been put on the correlation of the large range of molecular data available with the response of the tumour to the drugs used. An example could be given for the case of glucocorticoids (prednisone and dexamethasone), which are administered in the related clinical trial. According to (Addeo et al., 2004) the administration of such drugs leads to a significant increase in the percentage of ALL blasts in G0/G1 phase of the cell cycle and to a general redistribution of the leukemic cells throughout the cell cycle, for good responders to GC therapy. This information is crucial since the phase of the cell cycle in which cells are found, is a central parameter of the Oncosimulator. This is also relevant to the cell cycle specificity of other drugs. In an analogous way similar information can be retrieved for the rest of the drugs administered in a clinical trial. Either a direct determination of the cell kill ratio based on drug pharmacodynamics literature or an indirect estimation of other Oncosimulator parameters can thus be achieved. To this end exploitation of the available drug information is of paramount importance.
4.5 Utilization of the molecular level knowledge and data
4.5.1 Risk group classification and adaptation assisted by System Biology (SB) models
The first proposed way of utilizing molecular level data refers to the classification of patients by a molecular classifier, which either takes or not into account the patients’ risk group categorization according to posterior MRD measurement (since one of the targets is to create models capable to predict MRD as mentioned in WP9 description). In this way the adaptation procedure of the Oncosimulator parameters can be divided into two parts, one for the high risk (HR) group and the other for the small risk (SR) group, by making the assumption that patients belonging to the same group will have similar parameter values. Another way to assist the adaptation step of the Oncosimulator can be the use of mathematical/computational optimization methods in order to search more efficiently for the parameters that best fit to the patient’s outcome. A further step can be the use of information about the biological mechanism/function to which the genes distinguishing the two groups are related. By finding, extending or creating systems biology-oriented models for the sub-cellular related mechanisms the following aims are targeted:
To derive predictions for the Oncosimulator parameters in the cellular level by simulating the sub-cellular level mechanisms and assist the adaptation by computational optimization through proposing narrower bounds for the parameter values.
To calculate the impact of the expression levels of the genes of interest to the values of the output of the system and the corresponding sensitivity of the output. The latter could be the levels of some other molecular entities that directly correlate with cellular level parameters. Based on those sensitivities, sorting of the patients for the expected values of cellular level parameters can be performed. This can lead to the definition

p-medicine – Grant Agreement no. 270089
D12.1 –Architecture and information flow diagrams of the Oncosimulator and the biomechanism models
Page 36 of 86
of inequality constraints concerning the values of the same parameters for various patients. If estimation of parameters values for a number of patients is sought, these inequalities may guide the adaptation step to search into narrower and more probable intervals of values of the Oncosimulator parameters.
The above proposed methods are presented in the flow chart graph of Fig.4.3
Fig. 4.3 Risk group classification and adaptation assisted by System Biology (SB) models
4.5.2 Perturbation of reference values
Before being adapted to real patient’s data, the Oncosimulator can also be used in order to simulate cancer scenarios by utilizing reasonable reference values for the cellular level parameters. As before, the sensitivities of the cellular level parameters can be estimated based on the values of the expression levels of a given patient’s genes that are significant for group stratification. By knowing these sensitivities, analogous perturbations about the reference values of the cellular level parameters can be performed, in order to get closer to the specific patient parameters’ values. The above proposed method is graphically presented in Fig. 4.4.

p-medicine – Grant Agreement no. 270089
D12.1 –Architecture and information flow diagrams of the Oncosimulator and the biomechanism models
Page 37 of 86
Fig. 4.4 Perturbation of reference values
4.6 Information on acute lymphoblastic leukemia drug pharmacokinetics and pharmacodynamics to be used by the model
Based on an extensive search of the literature, the properties of the drugs administrated in ALL-BFM 2000 clinical trials, including mechanism of action, cell cycle specificity and pharmacokinetics(PK)/pharmacodynamics(PD) are given in the following sections. During the literature review, significant emphasis was put on extracting knowledge about the PK and PD properties of the drugs based on studies involving children with ALL, in order to take into account the variability in pharmacokinetics between children and the intrinsic characteristics of the specific malignancy. Although this choice decreased the number of studies that could be referenced, it is believed that it ensures the applicability of the information given in the following sections.
The drugs administered in the various phases of the ALL-BFM 2000 Clinical Trial are listed below:
Glycocorticoids o Prednisone (PRED) and Dexamethasone (DEXA)
Methotrexate (MTX) Vicristine (VCR) Daunorubicin Hydrochloride (DNR) Asparaginase (ASP)

p-medicine – Grant Agreement no. 270089
D12.1 –Architecture and information flow diagrams of the Oncosimulator and the biomechanism models
Page 38 of 86
Cyclophosphamide (CPM) Cytarabine (ARA–C) Mercaptopurine (MP) Doxorubicin Hydrochloride (DOX) Thioguanine (TG) Vindesine Ifosfamide Etoposide
The main properties of these drugs are given in Table 4.2.
Table 4.2 Drug Generic Name
Principal Pharmacological Classification
Cell Cycle specificity Primary mechanism of action
PRED Glucocorticoid Cell cycle nonspecific GR receptor agonists DEXA Glucocorticoid Cell cycle nonspecific GR receptor agonists MTX Antimetabolite Cell cycle specific
(active in S-phase) Folic acid reductase inhibitor, DNA synthesis inhibitor
VCR Tubulin Modulator Cell cycle specific (active in M-phase)
Mitosis inhibitor
DNR Antibiotic Cell cycle nonspecific Inhibition of topoisomerase II activity/ Formation of complexes with DNA by intercalation
ASP Antineoplastic Agent Cell cycle nonspecific Conversion of asparagine to aspartic acid and ammonia.
CPM Alkylating Agent Cell cycle nonspecific Cross-linking by quinine bases in DNA double helix strands.
ARA-C Antimetabolite Cell cycle specific (active in S-phase & blocks the progression from G1- to S-phase)
Prevention of purine and pyrimidine incorporation into DNA.
MP Antimetabolite, Purine Analogue
Cell cycle specific (active in S-phase)
Interference with nucleic acid biosynthesis
DOX Antibiotic Cell cycle nonspecific Inhibition of topoisomerase II activity/ Formation of complexes with DNA by intercalation
TG Antimetabolite Cell cycle specific (active in S-phase)
Prevention of purine and pyrimidine incorporation into DNA.
Vindesine Tubulin Modulator Cell cycle specific (active in S-phase)
Mitosis inhibition
Ifosfamide Organophosphate Esters Cell cycle nonspecific Appears to be similar to alkylating agents / Cross-linking by DNA
Etoposide Antineoplastic Agent Cell cycle specific (active in late S- and G2-phase)
Inhibition of topoisomerase II activity/ Formation of complexes with DNA by intercalation
4.6.1 Mechanisms of Action, Cell Cycle Specificity and Pharmacokinetics
4.6.1.1 Glycocorticoids

p-medicine – Grant Agreement no. 270089
D12.1 –Architecture and information flow diagrams of the Oncosimulator and the biomechanism models
Page 39 of 86
Pharmacological Classification (Wishart et al., 2008): Glucocorticoid, Anti-Inflammatory Agent, Antineoplastic Agent, Andrenergic Agent, Hormonal. Mechanism of Action (Inaba and Pui, 2010):
Cytotoxic effects by binding to glucocorticoid receptors in the cytoplasm (GR receptor agonists).
GR receptors can then: o form dimers, translocate to the nucleus and interact with glucocorticoid-
response elements to transactivate gene expression
o remain as monomers and repress the activity of transcription factors such as the activating protein-1 (AP-1) or nuclear factor-κB (NFκB).
Both pathways inhibit cytokine production, change the expression of various oncogenes and induce cell-cycle arrest and apoptosis.
In vivo and in vitro glucocorticoid resistance is an adverse prognostic factor in ALL, and several mechanisms have been reported.
Glucocorticoid exposure induces upregulation of the glucocorticoid receptor in ALL cells and about half of 51 responsive genes identified have been functionally linked to three major pathways:
o Cell proliferation and survival (mitogen-activated protein kinase [MAPK] pathways), NFkB signalling, and
o Glucose metabolism.
Glucocorticoid resistance has been associated with upregulation of the genes involved in glucose metabolism, and increased glucose uptake into the cells.
Glucocorticoids also induce release of calcium ions from the endoplasmic reticulum into the cytosol. The resulting increase in mitochondrial calcium ions induces cytochrome-c release and triggers apoptosis.
Raised expression of the calcium-binding proteins (CBP) S100A8 and S100A9, and of the antiapoptotic B-cell lymphoma 2 (BCL-2) protein family member myeloid cell leukaemia sequence 1 (MCL-1) inhibit signaling mediated by free cytosolic and mitochondrial calcium ions signals, respectively, causing glucocorticoid resistance.
Cell Cycle Specificity: Glucocorticoids are cell cycle nonspecific. However, it has been shown (Smets et al, 1985) that the number of Glucocorticoid Receptors (and therefore the binding sites for Glucocorticoids) depends on the phase of the cell cycle. Specifically, in mouse L1210 and human HL-60 cell lines glucocorticoid (GC) receptors accumulate during G1 phase of the cell cycle. However, in human lymphoblastic leukemia, the per cell receptor number was highest in cells in S and G2 phase.
Moreover, it must be mentioned that after treatment with GCs, a significant increase of ALL blasts in G0/G1 was recorded especially for patients that were good responders to GC therapy (Addeo et al, 2004).
Route of administration (ALL-BFM 2000 clinical trial) (Basso et al., 2009):
PRED: oral-intravenous DEXA: oral
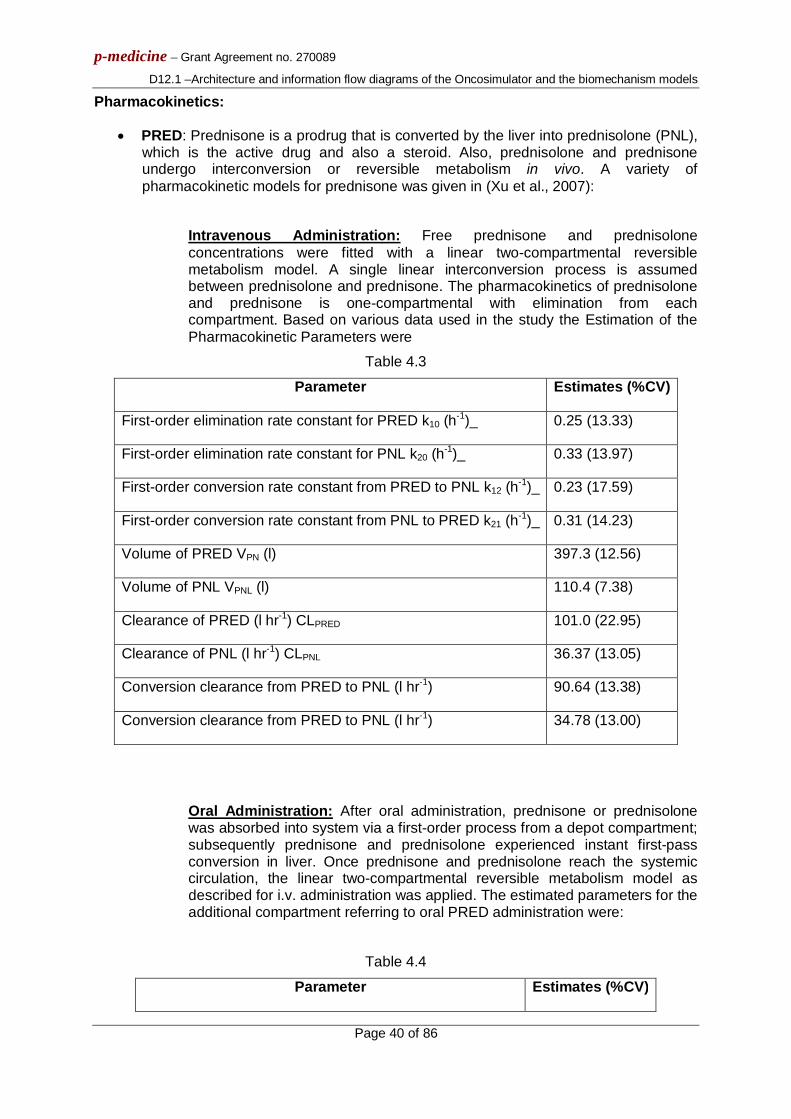
p-medicine – Grant Agreement no. 270089
D12.1 –Architecture and information flow diagrams of the Oncosimulator and the biomechanism models
Page 40 of 86
Pharmacokinetics:
PRED: Prednisone is a prodrug that is converted by the liver into prednisolone (PNL), which is the active drug and also a steroid. Also, prednisolone and prednisone undergo interconversion or reversible metabolism in vivo. A variety of pharmacokinetic models for prednisone was given in (Xu et al., 2007):
Intravenous Administration: Free prednisone and prednisolone concentrations were fitted with a linear two-compartmental reversible metabolism model. A single linear interconversion process is assumed between prednisolone and prednisone. The pharmacokinetics of prednisolone and prednisone is one-compartmental with elimination from each compartment. Based on various data used in the study the Estimation of the Pharmacokinetic Parameters were
Table 4.3
Parameter Estimates (%CV)
First-order elimination rate constant for PRED k10 (h-1)_ 0.25 (13.33)
First-order elimination rate constant for PNL k20 (h-1)_ 0.33 (13.97)
First-order conversion rate constant from PRED to PNL k12 (h-1)_ 0.23 (17.59)
First-order conversion rate constant from PNL to PRED k21 (h-1)_ 0.31 (14.23)
Volume of PRED VPN (l) 397.3 (12.56)
Volume of PNL VPNL (l) 110.4 (7.38)
Clearance of PRED (l hr-1) CLPRED 101.0 (22.95)
Clearance of PNL (l hr-1) CLPNL 36.37 (13.05)
Conversion clearance from PRED to PNL (l hr-1) 90.64 (13.38)
Conversion clearance from PRED to PNL (l hr-1) 34.78 (13.00)
Oral Administration: After oral administration, prednisone or prednisolone was absorbed into system via a first-order process from a depot compartment; subsequently prednisone and prednisolone experienced instant first-pass conversion in liver. Once prednisone and prednisolone reach the systemic circulation, the linear two-compartmental reversible metabolism model as described for i.v. administration was applied. The estimated parameters for the additional compartment referring to oral PRED administration were:
Table 4.4
Parameter Estimates (%CV)
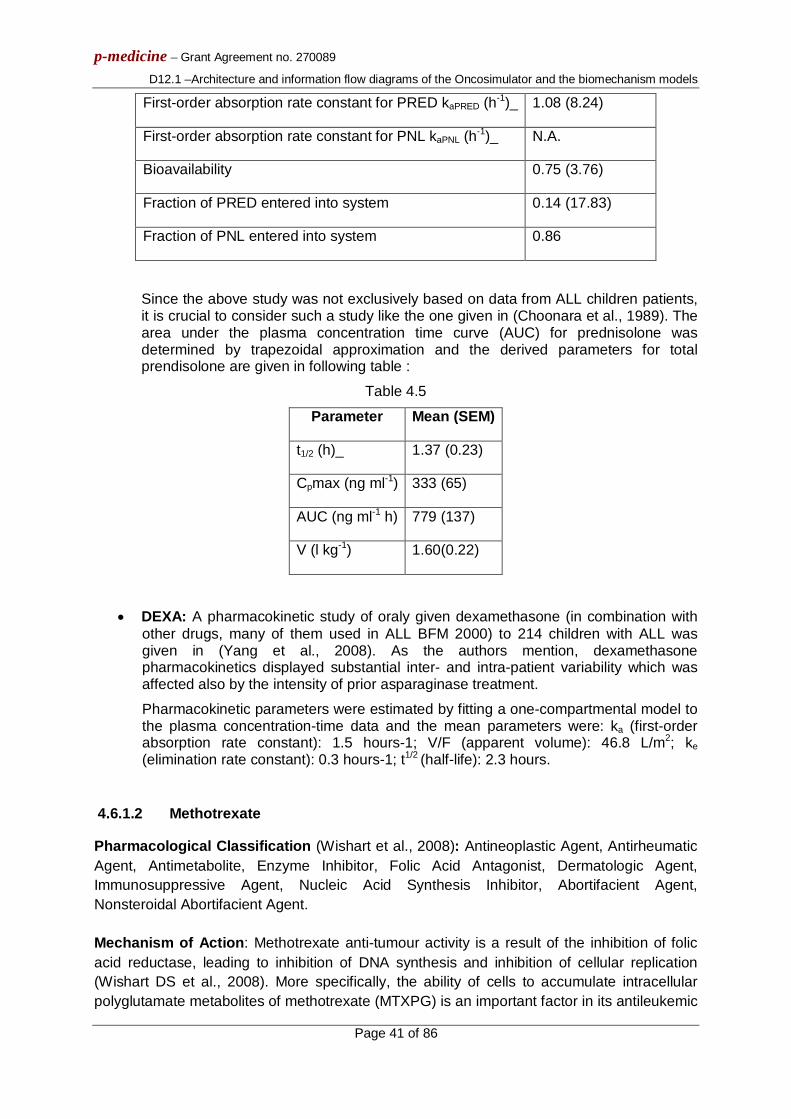
p-medicine – Grant Agreement no. 270089
D12.1 –Architecture and information flow diagrams of the Oncosimulator and the biomechanism models
Page 41 of 86
First-order absorption rate constant for PRED kaPRED (h-1)_ 1.08 (8.24)
First-order absorption rate constant for PNL kaPNL (h-1)_ N.A.
Bioavailability 0.75 (3.76)
Fraction of PRED entered into system 0.14 (17.83)
Fraction of PNL entered into system 0.86
Since the above study was not exclusively based on data from ALL children patients, it is crucial to consider such a study like the one given in (Choonara et al., 1989). The area under the plasma concentration time curve (AUC) for prednisolone was determined by trapezoidal approximation and the derived parameters for total prendisolone are given in following table :
Table 4.5
Parameter Mean (SEM)
t1/2 (h)_ 1.37 (0.23)
Cpmax (ng ml-1) 333 (65)
AUC (ng ml-1 h) 779 (137)
V (l kg-1) 1.60(0.22)
DEXA: A pharmacokinetic study of oraly given dexamethasone (in combination with other drugs, many of them used in ALL BFM 2000) to 214 children with ALL was given in (Yang et al., 2008). As the authors mention, dexamethasone pharmacokinetics displayed substantial inter- and intra-patient variability which was affected also by the intensity of prior asparaginase treatment.
Pharmacokinetic parameters were estimated by fitting a one-compartmental model to the plasma concentration-time data and the mean parameters were: ka (first-order absorption rate constant): 1.5 hours-1; V/F (apparent volume): 46.8 L/m2; ke (elimination rate constant): 0.3 hours-1; t1/2 (half-life): 2.3 hours.
4.6.1.2 Methotrexate
Pharmacological Classification (Wishart et al., 2008): Antineoplastic Agent, Antirheumatic Agent, Antimetabolite, Enzyme Inhibitor, Folic Acid Antagonist, Dermatologic Agent, Immunosuppressive Agent, Nucleic Acid Synthesis Inhibitor, Abortifacient Agent, Nonsteroidal Abortifacient Agent. Mechanism of Action: Methotrexate anti-tumour activity is a result of the inhibition of folic acid reductase, leading to inhibition of DNA synthesis and inhibition of cellular replication (Wishart DS et al., 2008). More specifically, the ability of cells to accumulate intracellular polyglutamate metabolites of methotrexate (MTXPG) is an important factor in its antileukemic

p-medicine – Grant Agreement no. 270089
D12.1 –Architecture and information flow diagrams of the Oncosimulator and the biomechanism models
Page 42 of 86
effects. MTXPG inhibits the folate pathway by competitively inhibiting several important enzymes including: dihydrofolate reductase (DHFR), thymidylate synthase (TS), glycinamide ribonucleotide transformylase (GART), and aminoimidazole carboxamide ribonucleotide transformylase (AICART). This inhibition leads to reduced or blocked TS and de novo purine synthesis (DNPS), which are needed for DNA synthesis. Route of administration (ALL-BFM 2000 clinical trial) (Basso et al., 2009): intrathecal, intrathecal-intravenous, intravenous, oral. Pharmacokinetics:
Intrathecal administration: The pharmacokinetics for this way of administration has been studied in (Lankelma et al., 1980) in 14 children and 8 adults. It is mentioned that two different patterns of concentration were observed which were dependent on the number of previous intrathecal injections. The model used to model this pharmacokinetic behavior of the drug was a two-compartmental open model with first order absorption.
Intravenous administration: By administrating as an intravenous infusion for 24h doses of methotrexate (from 1.5 to 9g), the pharmacokinetics of this drug are described by a two-compartment model in (Ye Min et al., 2009). For the estimation of pharmacokinetic parameters, bayesian estimation methods had been utilized and the resulting parameters were as follows:
Table 4.6 Parameter Value (Inter-individual variability)
clearance CL 7.45 l*h-1 (50.6%)
volume of the central compartment V1 25.9 l (22.5%)
volume of the peripheral compartment V2 9.23 l (97.8%)
intercompartmental clearance Q 0.333 l*h-1(70.4%)
4.6.1.3 Vicristine
Pharmacological Classification (Wishart et al., 2008): Antineoplastic Agent- Phytogenic, Tubulin Modulator. Mechanism of Action (Wishart et al., 2008): The antitumour activity of vincristine is thought to be due primarily to inhibition of mitosis at metaphase through its interaction with tubulin. Vincristine binds to the microtubular proteins of the mitotic spindle, leading to crystallization of the microtubule and mitotic arrest or cell death. Like other vinca alkaloids, vincristine may also interfere with amino acid, cyclic AMP, and glutathione metabolism, calmodulin-dependent Ca2+-transport ATPase activity, cellular respiration, and nucleic acid and lipid biosynthesis.
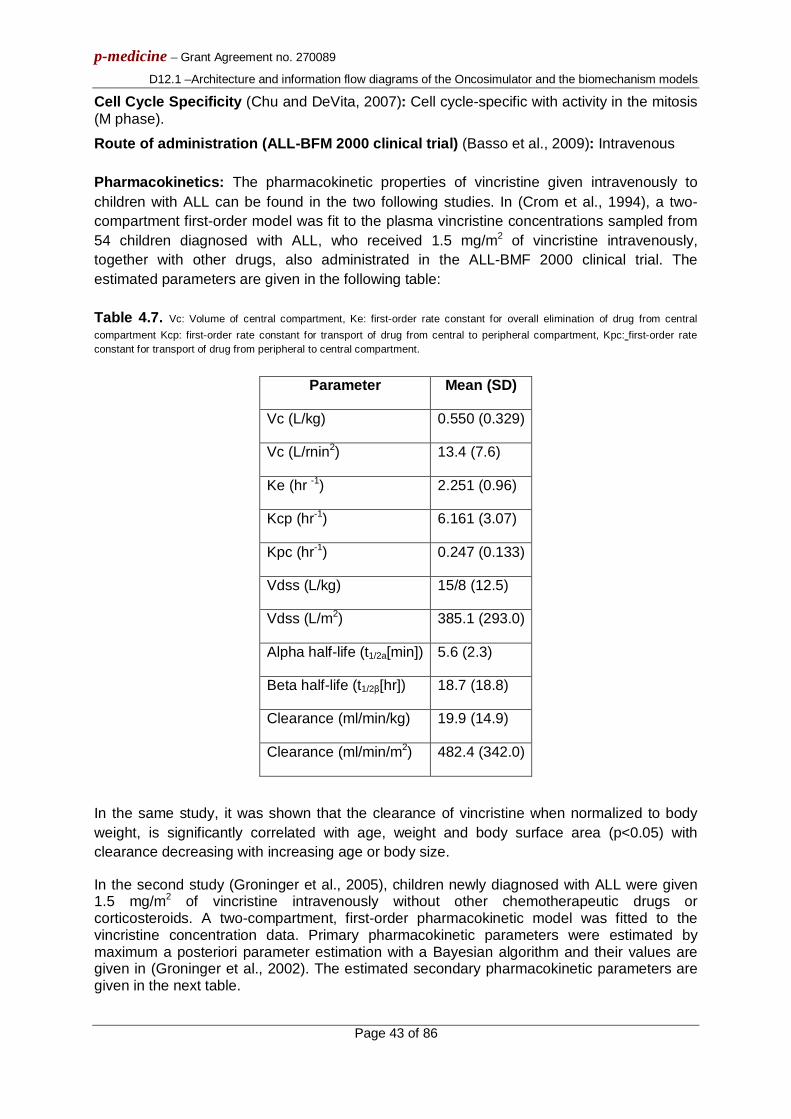
p-medicine – Grant Agreement no. 270089
D12.1 –Architecture and information flow diagrams of the Oncosimulator and the biomechanism models
Page 43 of 86
Cell Cycle Specificity (Chu and DeVita, 2007): Cell cycle-specific with activity in the mitosis (M phase).
Route of administration (ALL-BFM 2000 clinical trial) (Basso et al., 2009): Intravenous Pharmacokinetics: The pharmacokinetic properties of vincristine given intravenously to children with ALL can be found in the two following studies. In (Crom et al., 1994), a two-compartment first-order model was fit to the plasma vincristine concentrations sampled from 54 children diagnosed with ALL, who received 1.5 mg/m2 of vincristine intravenously, together with other drugs, also administrated in the ALL-BMF 2000 clinical trial. The estimated parameters are given in the following table: Table 4.7. Vc: Volume of central compartment, Ke: first-order rate constant for overall elimination of drug from central compartment Kcp: first-order rate constant for transport of drug from central to peripheral compartment, Kpc: first-order rate constant for transport of drug from peripheral to central compartment.
Parameter Mean (SD)
Vc (L/kg) 0.550 (0.329)
Vc (L/rnin2) 13.4 (7.6)
Ke (hr -1) 2.251 (0.96)
Kcp (hr-1) 6.161 (3.07)
Kpc (hr-1) 0.247 (0.133)
Vdss (L/kg) 15/8 (12.5)
Vdss (L/m2) 385.1 (293.0)
Alpha half-life (t1/2a[min]) 5.6 (2.3)
Beta half-life (t1/2β[hr]) 18.7 (18.8)
Clearance (ml/min/kg) 19.9 (14.9)
Clearance (ml/min/m2) 482.4 (342.0)
In the same study, it was shown that the clearance of vincristine when normalized to body weight, is significantly correlated with age, weight and body surface area (p<0.05) with clearance decreasing with increasing age or body size.
In the second study (Groninger et al., 2005), children newly diagnosed with ALL were given 1.5 mg/m2 of vincristine intravenously without other chemotherapeutic drugs or corticosteroids. A two-compartment, first-order pharmacokinetic model was fitted to the vincristine concentration data. Primary pharmacokinetic parameters were estimated by maximum a posteriori parameter estimation with a Bayesian algorithm and their values are given in (Groninger et al., 2002). The estimated secondary pharmacokinetic parameters are given in the next table.
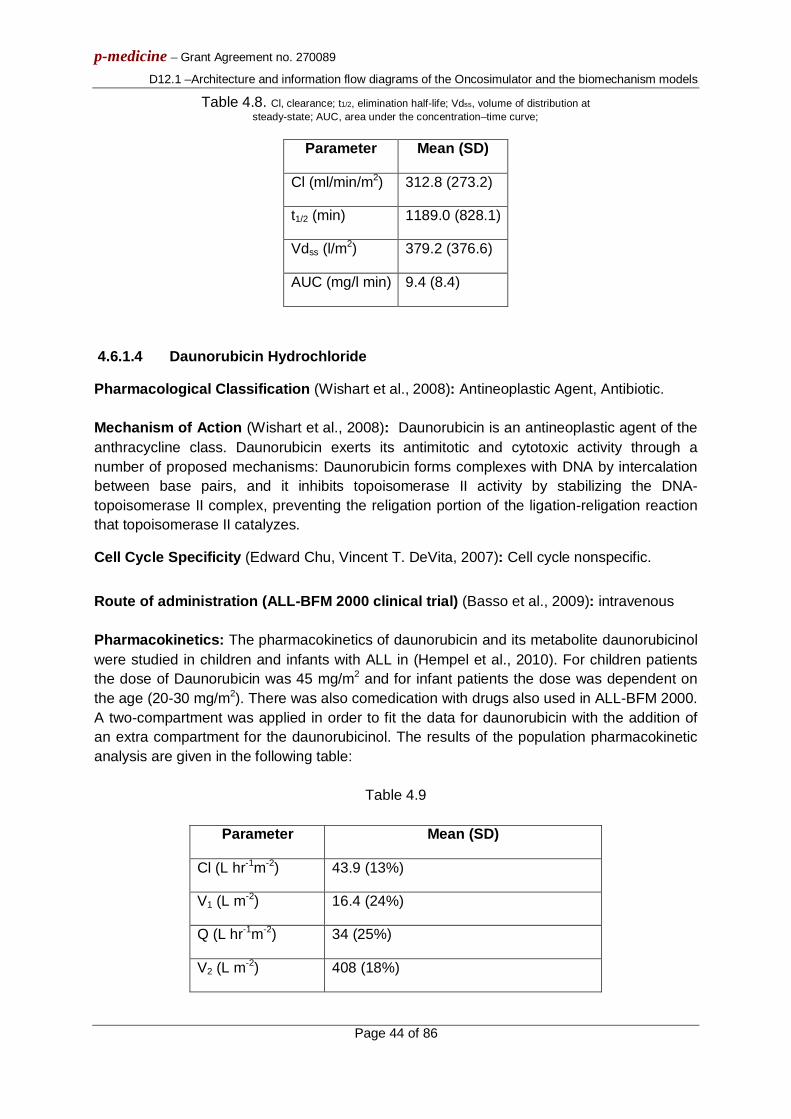
p-medicine – Grant Agreement no. 270089
D12.1 –Architecture and information flow diagrams of the Oncosimulator and the biomechanism models
Page 44 of 86
Table 4.8. Cl, clearance; t1/2, elimination half-life; Vdss, volume of distribution at steady-state; AUC, area under the concentration–time curve;
Parameter Mean (SD)
Cl (ml/min/m2) 312.8 (273.2)
t1/2 (min) 1189.0 (828.1)
Vdss (l/m2) 379.2 (376.6)
AUC (mg/l min) 9.4 (8.4)
4.6.1.4 Daunorubicin Hydrochloride
Pharmacological Classification (Wishart et al., 2008): Antineoplastic Agent, Antibiotic. Mechanism of Action (Wishart et al., 2008): Daunorubicin is an antineoplastic agent of the anthracycline class. Daunorubicin exerts its antimitotic and cytotoxic activity through a number of proposed mechanisms: Daunorubicin forms complexes with DNA by intercalation between base pairs, and it inhibits topoisomerase II activity by stabilizing the DNA-topoisomerase II complex, preventing the religation portion of the ligation-religation reaction that topoisomerase II catalyzes.
Cell Cycle Specificity (Edward Chu, Vincent T. DeVita, 2007): Cell cycle nonspecific.
Route of administration (ALL-BFM 2000 clinical trial) (Basso et al., 2009): intravenous Pharmacokinetics: The pharmacokinetics of daunorubicin and its metabolite daunorubicinol were studied in children and infants with ALL in (Hempel et al., 2010). For children patients the dose of Daunorubicin was 45 mg/m2 and for infant patients the dose was dependent on the age (20-30 mg/m2). There was also comedication with drugs also used in ALL-BFM 2000. A two-compartment was applied in order to fit the data for daunorubicin with the addition of an extra compartment for the daunorubicinol. The results of the population pharmacokinetic analysis are given in the following table:
Table 4.9
Parameter Mean (SD)
Cl (L hr-1m-2) 43.9 (13%)
V1 (L m-2) 16.4 (24%)
Q (L hr-1m-2) 34 (25%)
V2 (L m-2) 408 (18%)

p-medicine – Grant Agreement no. 270089
D12.1 –Architecture and information flow diagrams of the Oncosimulator and the biomechanism models
Page 45 of 86
ClMetabolite(L hr-1m-2) 19.1 (9%)
VMetabolite (Lm-2) 226 (18%)
AUC (μg L-1 hr)
age
<6 months 6-12 months >12 months
1,694(12%) 1,786(15%) 2,194(12%)
4.6.1.5 Asparaginase
Pharmacological Classification (Drugbank, Wishart DS et al., 2008): Antineoplastic Agent Mechanism of Action (Drugbank, Wishart DS et al., 2008): Asparaginase converts asparagine to aspartic acid and ammonia. It facilitates production of oxaloacetate which is needed for general cellular metabolism. Some malignant cells lose the ability to produce asparagine and the loss of exogenous sources of asparagine leads to cell death. In a significant number of patients with acute leukemia, the malignant cells are dependent on an exogenous source of asparagine for survival. Normal cells, however, are able to synthesize asparagine and thus are affected less by the rapid depletion produced by treatment with the enzyme asparaginase.
Cell Cycle Specificity (Chu and DeVita, 2007): Cell cycle nonspecific.
Route of administration (ALL-BFM 2000 clinical trial) (Basso et al., 2009): Intramuscular Pharmacokinetics: The pharmacokinetics of asparaginase was studied in (Albertsen et al., 2001) involving 29 children with newly diagnosed ALL, receiving 30,000 IU/m2 of the drug every day for 10 days during multiagent induction therapy. Of these patients 13 received intravenous therapy and 16 intramuscular therapy. For intramuscular administration, a one-comparmental model with first-order absorption and elimination kinetics was used. The plasma concentration after a single extravascular administration is given as a function of time by the Bateman function. The values for pharmacokinetic parameters ke (elimination rate constant) and Vd (volume of distribution) were adopted from the related model for itravenous administration, also presented in the study, and were 6.4 ± 0.5(h-1
) and 1.19 ± 0.12(l/m2), respectively. The mean elimination rate constant (Kapp) was found to be 0.81 ± 0.05 day-1, which indicates a slower absorption phase compared to i.v. administration. The mean bioavailiability F was estimated to be 27±4.5 %.
4.6.1.6 Cyclophosphamide
Pharmacological Classification (Wishart et al., 2008): Antineoplastic Agent, Antirheumatic Agent, Immunosuppressive Agent, Antineoplastic Agent-Alkylating, Myeloablative Agonist, Mutagen.

p-medicine – Grant Agreement no. 270089
D12.1 –Architecture and information flow diagrams of the Oncosimulator and the biomechanism models
Page 46 of 86
Mechanism of Action (Wishart et al., 2008): Cyclophosphamide is an antineoplastic drug belonging in the class of alkylating agents. Alkylating agents are so named because of their ability to add alkyl groups to many electronegative groups under conditions present in cells. They stop tumour growth by cross-linking guanine bases in DNA double-helix strands - directly attacking DNA. This makes the strands unable to uncoil and separate. As this is necessary in DNA replication, the cells can no longer divide. In addition, these drugs add methyl or other alkyl groups onto molecules where they do not belong, which in turn inhibits their correct utilization by base pairing and causes a miscoding of DNA. Alkylating agents work by three different mechanisms, which achieve the same end result; disruption of DNA function and cell death:
attachment of alkyl groups to DNA bases, resulting in the DNA being fragmented by repair enzymes in their attempt to replace the alkylated bases, preventing DNA synthesis and RNA transcription from the affected DNA,
DNA damage via the formation of cross-links (bonds between atoms in the DNA), which prevent DNA from being separated for synthesis or transcription, and
induction of mispairing of the nucleotides leading to mutations. Cyclophosphamide is inactive in its parent form and has to be activated by the liver cytochrome P450 microsomal system to the cytotoxic metabolites phosphoramide mustard and acrolein (Chu and DeVita, 2007).
Cell Cycle Specificity (Chu and DeVita, 2007): Cell cycle nonspecific. Active in all phases of the cell cycle.
Route of administration (ALL-BFM 2000 clinical trial) (Basso G. et al., 2009): Intravenous Pharmacokinetics: The pharmacokinetic properties of cyclophosphamide have been studied in (Yule et al., 1996), based on samples from 38 children with hematological diseases, including ALL. The concentrations of cyclophosphamide were modeled by a one-compartment open model with first order elimination kinetics assuming a constant rate drug infusion. The disappearance of CPM from plasma was monoexponential in all cases. CPM half-life (t1/2) varied 15-fold (range 1.1-16.8 h, median 3.2 h), clearance (CL) corrected for body surface area (BSA) varied eightfold (range 1.2-10.6 1 h-1 m-2, median 2.91 h-1 m-2) and volume of distribution (V) corrected for weight varied fourfold (range 0.26-1.481 kg-1, median 0.631 kg-1).
4.6.1.7 Cytarabine
Pharmacological Classification (Wishart et al., 2008): Antineoplastic Agent, Antiviral Agent, Antimetabolite, Immunosuppressive Agent, Antimetabolite, Antineoplastic. Mechanism of Action (Wishart et al., 2008): Cytarabine is an antineoplastic anti-metabolite used in the treatment of several forms of leukemia including acute myelogenous leukemia and meningeal leukemia. Anti-metabolites masquerade as purine or pyrimidine - which become the building blocks of DNA. They prevent these substances becoming incorporated

p-medicine – Grant Agreement no. 270089
D12.1 –Architecture and information flow diagrams of the Oncosimulator and the biomechanism models
Page 47 of 86
into DNA during the S phase of the cell cycle, stopping normal development and division. Cytarabine is metabolized intracellularly into its active triphosphate form (cytosine arabinoside triphosphate). This metabolite then damages DNA by multiple mechanisms, including the inhibition of alpha-DNA polymerase, inhibition of DNA repair through an effect on beta-DNA polymerase, and incorporation into DNA. The latter mechanism is probably the most important.
Cell Cycle Specificity (Wishart et al., 2008): It exhibits cell phase specificity, primarily killing cells undergoing DNA synthesis (S-phase) and under certain conditions blocking the progression of cells from the G1 phase to the S-phase.
Route of administration (ALL-BFM 2000 clinical trial) (Basso et al., 2009): Intravenous- subcutaneous, Intravenous (HD ARA-C). Pharmacokinetics: By reclaiming data from a period of 12 years derived by four clinical studies where the patients (age 0.17 to 19 years) were receiving HD ARA-C (3g/m2
every 12h x 8 doses) by 3h infusion, the pharmacokinetics of ARA-C in children with leukemia (ALL or AML) were studied in (Periclou and Avramis, 1996). The model utilized in the study was a two-compartmental model with first-order elimination from the central compartment and the estimated parameters were (where SA stands for Surface Area):
Table 4.10 Parameter Coef. Of Variation
Total Body Clearance:
CL=2.59 x AGE x SA 1/h 83.79%
Intercompartmental clearance:
Q=2.01 x AGR x SA 1/h 12.08%
Volume of distribution of central compartment:
Vd1= 0.48 x AGE x SA l 40.0%
Volume of distribution of peripheral compartment :
Vd1= 38.1 x AGE x SA l 52.4%
Of significant importance are the values of the coefficients of variation which indicate a substantial interindividual variability.
4.6.1.8 Mercaptopurine
Pharmacological Classification (Wishart et al., 2008): Antineoplastic Agent, Antimetabolite, Immunosuppressive Agent, Nucleic Acid Synthesis Inhibitor, Purine analogue, Antimetabolite, Antineoplastic

p-medicine – Grant Agreement no. 270089
D12.1 –Architecture and information flow diagrams of the Oncosimulator and the biomechanism models
Page 48 of 86
Mechanism of Action (Wishart et al., 2008): Mercaptopurine is one of a large series of purine analogues which interfere with nucleic acid biosynthesis and has been found active against human leukemias. It is an analogue of the purine bases adenine and hypoxanthine. It is not known exactly which of any one or more of the biochemical effects of mercaptopurine and its metabolites are directly or predominantly responsible for cell death.
Cell Cycle Specificity (Chu and DeVita, 2007): Cell cycle specific purine analog with activity in the S phase.
Route of administration (ALL-BFM 2000 clinical trial) (Basso et al., 2009): Oral
4.6.1.9 Doxorubicin Hydrochloride
Pharmacological Classification (Wishart et al., 2008): Antineoplastic Agent, Antibiotic Mechanism of Action (Wishart et al., 2008): Doxorubicin exerts its antimitotic and cytotoxic activity through a number of proposed mechanisms of action: it forms complexes with DNA by intercalation between base pairs, and it inhibits topoisomerase II activity by stabilizing the DNA-topoisomerase II complex, preventing the religation portion of the ligation-religation reaction that topoisomerase II catalyzes
Cell Cycle Specificity (Wishart et al., 2008): The anthracyclines are cell cycle-nonspecific.
Route of administration (ALL-BFM 2000 clinical trial) (Basso et al., 2009): Intravenous
Pharmacokinetics: A study of doxorubicin (and its metabolite doxorubicinol) pharmacokinetics based on compartmental pharmacokinetic modeling is given in (Thompson et al., 2009). As the authors mention, the best model for this drug consists of four compartments, three for the parent drug and one for its metabolite, after testing models with varying numbers of compartments. By fitting data derived from 22 children, the estimated pharmacokinetic parameters were:
Table 4.11. Vc:volume of distribution of central compartment, Vp1: volume of distribution of the first peripheral compartment, Vp2 : volume of distribution of the second peripheral compartment, CL: clearance, Q1:intercompartmental clearance between the central compartment and the first peripheral compartment, Q2: is the intercompartmental clearance of doxorubicin between the central compartment and the second peripheral compartment, F : fraction of doxorubicin metabolized to doxorubicinol, V/F: apparent volume of distribution of doxorubicinol, CL/F: apparent clearance of doxorubicinol
Parameter Mean (SD)
Doxorubicin
CL (L/m2/h) 0.550 (0.329)
Vc (L/rn2) 13.4 (7.6)
Q1 (L/m2/h) 2.251 (0.96)
VP1 (L/m2) 6.161 (3.07)
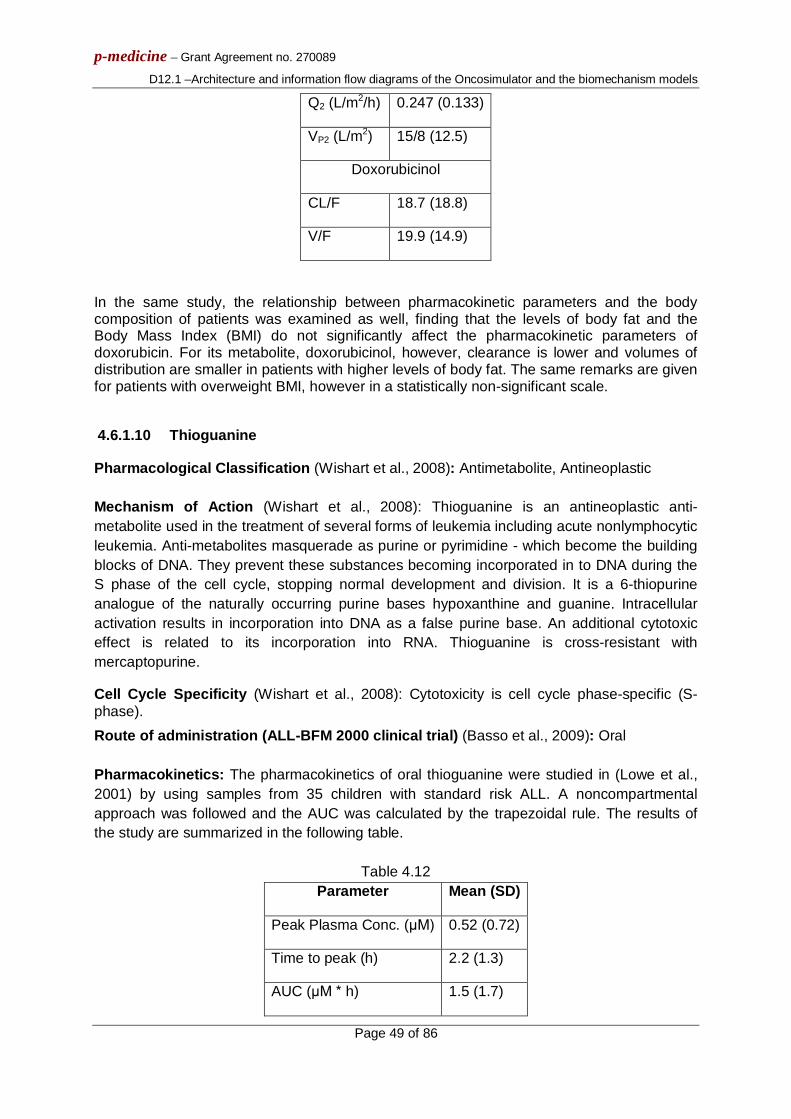
p-medicine – Grant Agreement no. 270089
D12.1 –Architecture and information flow diagrams of the Oncosimulator and the biomechanism models
Page 49 of 86
Q2 (L/m2/h) 0.247 (0.133)
VP2 (L/m2) 15/8 (12.5)
Doxorubicinol
CL/F 18.7 (18.8)
V/F 19.9 (14.9)
In the same study, the relationship between pharmacokinetic parameters and the body composition of patients was examined as well, finding that the levels of body fat and the Body Mass Index (BMI) do not significantly affect the pharmacokinetic parameters of doxorubicin. For its metabolite, doxorubicinol, however, clearance is lower and volumes of distribution are smaller in patients with higher levels of body fat. The same remarks are given for patients with overweight BMI, however in a statistically non-significant scale.
4.6.1.10 Thioguanine
Pharmacological Classification (Wishart et al., 2008): Antimetabolite, Antineoplastic Mechanism of Action (Wishart et al., 2008): Thioguanine is an antineoplastic anti-metabolite used in the treatment of several forms of leukemia including acute nonlymphocytic leukemia. Anti-metabolites masquerade as purine or pyrimidine - which become the building blocks of DNA. They prevent these substances becoming incorporated in to DNA during the S phase of the cell cycle, stopping normal development and division. It is a 6-thiopurine analogue of the naturally occurring purine bases hypoxanthine and guanine. Intracellular activation results in incorporation into DNA as a false purine base. An additional cytotoxic effect is related to its incorporation into RNA. Thioguanine is cross-resistant with mercaptopurine.
Cell Cycle Specificity (Wishart et al., 2008): Cytotoxicity is cell cycle phase-specific (S-phase). Route of administration (ALL-BFM 2000 clinical trial) (Basso et al., 2009): Oral Pharmacokinetics: The pharmacokinetics of oral thioguanine were studied in (Lowe et al., 2001) by using samples from 35 children with standard risk ALL. A noncompartmental approach was followed and the AUC was calculated by the trapezoidal rule. The results of the study are summarized in the following table.
Table 4.12
Parameter Mean (SD)
Peak Plasma Conc. (μΜ) 0.52 (0.72)
Time to peak (h) 2.2 (1.3)
AUC (μΜ * h) 1.5 (1.7)

p-medicine – Grant Agreement no. 270089
D12.1 –Architecture and information flow diagrams of the Oncosimulator and the biomechanism models
Page 50 of 86
Τ1/2 (h) 1.6
4.6.1.11 Vindesine
Pharmacological Classification (Wishart et al., 2008): Antineoplastic Agent- Phytogenic, Tubulin Modulator Mechanism of Action (Wishart et al., 2008): Vindesine acts by causing the arrest of cells in metaphase mitosis through its inhibition of tubulin mitotic functioning.
Cell Cycle Specificity (Wishart et al., 2008): cell-cycle specific for the S phase.
Route of administration (ALL-BFM 2000 clinical trial) (Basso et al., 2009): Intravenous Pharmacokinetics: As demonstrated in (Nelson et al., 1979) the pharmacokinetics of vindesine administrated intravenously, could be modeled by a three-compartment open mammillary model with first order kinetics. The central compartment is assumed to be in equilibrium with the plasma, the second with the hepatobiliary sytem and the third with a deep tissue compartment which is unidentified physiologically. The estimated parameters based on samples from 5 patients with advanced cancer, receiving 1-3 mg/m2 of vindesine are given in the following table:
Table 4.13
Parameter Mean (SD)
t1/2α, h 0.038 (0.017)
t1/2β, h 0.822 (0.273)
t1/2γ, h 24.33 (11.11)
k12, h-1 11.66 (5.07)
k21, h-1 0.818 (0.471)
k13, h-1 9.31 (4.88)
k31, h-1 0.104 (0.036)
k20, h-1 0.550 (0.216)
Vc, %body weight 5.49 (1.80)
V2, %body weight 29.3 (19.2)
V3, %body weight 811 (402)
4.6.1.12 Ifosfamide

p-medicine – Grant Agreement no. 270089
D12.1 –Architecture and information flow diagrams of the Oncosimulator and the biomechanism models
Page 51 of 86
Pharmacological Classification (Wishart et al., 2008): Organophosphate Esters Mechanism of Action (Wishart et al., 2008): The exact mechanism of ifosfamide has not been determined, but it appears to be similar to other alkylating agents. Ifosfamide requires biotransformation in the liver by mixed-function oxidases (cytochrome P450 system) before it becomes active. After metabolic activation, active metabolites of ifosfamide alkylate or bind to many intracellular molecular structures, including nucleic acids. The cytotoxic action is primarily exerted through the alkylation of DNA, by attaching the N-7 position of guanine to its reactive electrophilic groups. The formation of inter and intra strand cross-links in the DNA results in cell death.
Cell Cycle Specificity (Chu and DeVita, 2007): Cell-cycle nonspecific. Active in all phases.
Route of administration (ALL-BFM 2000 clinical trial) (Basso et al., 2009): Intravenous Pharmacokinetics: Several methods have been proposed for the description of the pharmacokinetics of ifosfamide and its metabolites. A two-compartment pharmacokinetic model for describing the pharmacokinetics of ifosfamide was given in (Lind et al., 1989) and in (Allen and Creaven, 1975). Also, a one-compartment pharmacokinetic model has been proved to be superior for 1.5±2.4 g/m2 in 30 min i.v. infusion but not when the dose was 3.8±5 g/m2 (Nelson et al., 1976). Moreover, a model independent approach for describing ifosfamide pharmacokinetics has been proposed (Boddy et al., 1993). However, the above methods were developed to describe concentration-time profiles of infusions of short duration (1±3 h) and did not take into account the effect of the autoinduction on the pharmacokinetics of ifosfamide. A study including the autoinduction and concerning children was given in (Yule et al., 1996).
As described in the review article (Groninger et al., 2004), postinfusion elimination of ifosfamide is mono-exponential with a mean ifosfamide elimination half-life (S.D.) and systemic clearance (S.D.) of 2.1 (0.9) h and 84 (27.7) ml/(min m2), respectively, and the intra- and inter-individual variability is large. Moreover, the mean (range) AUC of isophosphoramide mustard (active metabolite of ifosfamide) studied in a group of 16 children was 1.78 (0.24–3.78) mM/h.
4.6.1.13 Etoposide
Pharmacological Classification (Wishart et al., 2008): Antineoplastic Agents, Phytogenic Mechanism of Action (Wishart et al., 2008): A semisynthetic derivative of podophyllotoxin that exhibits antitumour activity. Etoposide inhibits DNA synthesis by forming a complex with topoisomerase II and DNA. This complex induces breaks in double stranded DNA and prevents repair by topoisomerase II binding. Accumulated breaks in DNA prevent entry into the mitotic phase of cell division, and lead to cell death.
Cell Cycle Specificity (Chu and DeVita, 2007): Cell-cycle specific agent with activity in late S- and G2-phase.

p-medicine – Grant Agreement no. 270089
D12.1 –Architecture and information flow diagrams of the Oncosimulator and the biomechanism models
Page 52 of 86
Route of administration (ALL-BFM 2000 clinical trial) (Basso et al., 2009): Intravenous
Pharmacokinetics: The pharmacokinetics of etoposide in children with ALL were modeled and measured in (Evans et al., 1982). Pharmacokinetic parameters were calculated by both model dependent and compartment model-independent methods. The compartmental model was a standard two-compartment first-order pharmacokinetic model and the calculations were done by the methods given in (Loo and Riegelman, 1970).
The results of the study were:
Table 4.14 Parameter Mean (SD)
Compartmental model-independent
Systemic clearance (ml/min/m2) 5.2 (1.0)
VDss (l/m2) 3.4 (0.7)
Model-dependent
Systemic clearance (ml/min/m2) 5.4 (1.4)
VDc (l/m2) 1.8 (1.1)
Ke (h-1) 0.23 (0.9)
T1/2α (h) 0.9 (0.2)
T1/2β (h) 9.6 (2.7)
4.6.2 Pharmacodynamics 4.6.2.1 In vitro & ex vivo chemosensitivity studies
A significant number of studies testing the chemosensitivity of cell lines or cell samples taken from children with ALL can be found in literature. The issue about the reliability of cell lines in studying ALL is discussed in (Beesley et al., 2006) showing that many cell lines are suitable to study the chemosensitivity in paediatric ALL. In these studies, the main way of exhibiting results is via the LD50 and/or LD70, however for some drugs, dose response curves are given. A table summarizing the drugs which are included in every study is given below. For reasons of simplicity, local indexing of the referenced papers is used in the table below:
(1) (Kaspers et al., 1991) (2) (Pieters et al., 1990) (3) (Styczynski et al., 2000) (4) (Zwaan et al., 2002) (5) (Ramakers-van Woerden et al., 2004)

p-medicine – Grant Agreement no. 270089
D12.1 –Architecture and information flow diagrams of the Oncosimulator and the biomechanism models
Page 53 of 86
(6) (Hongo T et al., 1997) (7) (Galderisi F et al., 2009) (8) (Larsson R. et al., 1992) (9) (Adamson PC et al., 1994)
Drug LD50 LD70 Dose Response Curve
PRED (1) (2) (ad): (3) (4) (5)
(6) (7) (8)*
DEXA (1) (3) (5) (6) (7)
MTX (4) (6)
VCR (1) (2) (3) (4) (5)
(6) (1) (7) (8)*
DNR (1) (2) (3) (4) (5)
(6) (1) (7) (8)*
ASP (1) (2) (3) (4) (5)
(6) (7) (8)*
CPM (ad): (1) (2) (6)
ARA–C (1) (2) (3) (4) (5)
(6) (8)*
MP (1) (3) (5) (9) (8)*
DOX (1) (3) (8)*
TG (1) (2) (3) (4) (5)
(9) (8)*
Vindesine (1)
Ifosfamide (ad): (1) (3) (5)
Etoposide (4) (5) (6) (8)*
ad: active derivatives, *: samples mainly from AML patients
4.6.3 In vitro Chemosensitivity & chemoresistance correlations

p-medicine – Grant Agreement no. 270089
D12.1 –Architecture and information flow diagrams of the Oncosimulator and the biomechanism models
Page 54 of 86
In the above mentioned studies or others referred to the same topics, except for the observation of the response of the cells to the drugs, also the correlation between this in vitro or ex vivo sensitivity and patient’s characteristics or treatment’s outcome is studied. In addition to the methods proposed in the section “Proposed utilization of the molecular level data to be made available by the ALL BFM 2000 clinical trials”, this information could also contribute to the individualization of the Oncosimulator’s parameters for every single patient.
In (Ramakers-van Woerden et al., 2004) the relationship between age, MLL gene rearrangements, proB-lineage, and in vitro drug resistance determined using the MTT assay is analysed. Compared to children aged over 1 year with common/preB ALL, infants were highly resistant to glycocorticoids (for prednisolone (PRED) more than 580-fold) and asparaginase (ASP) (12-fold), but more sensitive to cytarabine (ARA-C) (1.9-fold). No differences were found for vincristine, anthracyclines, thiopurines and ifosfamide.
ProB ALL of all ages had a profile similar to infant ALL when compared with the group of c/preB ALL: relatively more resistant to L-ASP and PRED (and in addition thiopurines), and more sensitive to AraC.
As authors mention, age was not related to cellular drug resistance within the proB ALL group. The translocation t(4;11)(q21;q23)-positive ALL cases were more resistant to PRED (47.4-fold) and ifosfamide (4.4-fold) than those with other 11q23 abnormalities. The expression of P-glycoprotein, multidrug-resistance protein, and lung-resistance protein (LRP) was not higher in infants compared to older c/preB ALL patients, but LRP was higher in proB ALL and MLL-rearranged ALL of all ages.
So, infants with ALL appear to have a distinct in vitro resistance profile with the proB immunophenotype being of importance. The role of MLL cannot be excluded, with the t(4;11) being of special significance, while age appears to play a smaller role.
As it is supported in (Hongo et al., 1997), in vitro drug sensitivity testing can predict induction failure and early relapse of childhood acute lymphoblastic leukemia. By in vitro tests of bone marrow samples from children newly diagnosed with ALL and measurement of the sensitivity to 16 drugs (the majority of them used in ALL-BFM 2000), when patients were classified into three groups according to sensitivity to dexamethasone, prednisolone, L-asparaginase, and vincristine, 3-year event-free survival of the super sensitive group (SS; sensitive to all 4 drugs) was 0.833 (0.690 to 0.976), that of the intermediate sensitive group (IS; sensitive to 2 or 3 drugs) was 0.735 (0.609 to 0.863), and that of the relatively resistant group (RR; sensitive to no drugs or to 1 drug) was 0.541. Also, a relationship between the sensitivity to those drugs and the time of relapse was proved, by showing that the SS and IS patients tend to maintain continuous complete remission and RR patients tend to undergo induction failure and early and late relapse. Finally the above information is directly related to clinical experience since it was shown that sensitivity to the above mentioned drugs influenced the EFS in the standard-risk ALL.
Finally, of significant interest are the findings of (Lönnerholm et al., 2009), where a correlation between in vitro cellular drug sensitivity at diagnosis and minimal residual disease (MRD) at the end of the induction therapy is shown, since MRD is a core factor in ALL-BFM 2000 clinical trial. More specifically, a significant correlation between cellular drug resistance at diagnosis and MRD day 15 for prendisolone, doxorubicin and vicristine was mentioned, but also for other drugs. Moreover, correlation between drug resistanse and MRD day 29 was found for all drugs tested in the study except for etoposide and vicristine.
4.7 REFERENCES

p-medicine – Grant Agreement no. 270089
D12.1 –Architecture and information flow diagrams of the Oncosimulator and the biomechanism models
Page 55 of 86
[4.1] Adamson PC, Poplack DG, Balis FM., The cytotoxicity of thioguanine vs mercaptopurine in acute lymphoblastic leukemia., Leuk Res. 1994 Nov;18(11):805-10.
[4.2] Addeo R, Casale F, Caraglia M, D'Angelo V, Crisci S, Abbruzzese A, Di Tullio MT, Indolfi P., Glucocorticoids Induce G1 Arrest of Lymphoblastic Cells Through Retinoblastoma Protein Rb1 Dephosphorylation in Childhood Acute Lymphoblastic Leukemia In Vivo., Cancer Biol Ther. 2004 May;3(5):470-6.
[4.3] Albertsen BK, Jakobsen P, Schrøder H, Schmiegelow K, Carlsen NT., Pharmacokinetics of Erwinia asparaginase after intravenous and intramuscular administration., Cancer Chemother Pharmacol. 2001 Jul;48(1):77-82.
[4.4] Allen LM, Creaven PJ., Pharmacokinetics of ifosfamide., Clin Pharmacol Ther. 1975 Apr;17(4):492-8.
[4.5] Basso G, Veltroni M, Valsecchi MG, Dworzak MN, Ratei R, Silvestri D, Benetello A, Buldini B, Maglia O, Masera G, Conter V, Arico M, Biondi A, Gaipa G., Risk of relapse of childhood acute lymphoblastic leukemia is predicted by flow cytometric measurement of residual disease on day 15 bone marrow., J Clin Oncol. 2009 Nov 1;27(31):5168-74.
[4.6] Bast RC, Kufe DW, Pollock RE, Weichelbaum RR, Holland JF, Frei E, Cancer Medicine 5th ed. (2000) Decker B.C. Inc, Hamilton, Ontario, Canada. [4.7] Begg AC. ‘Cell proliferation in tumours’. Ιn: Steel GG (Editor), Basic Clinical Radiobiology 2nd ed., Arnold, London, 1997.
[4.8] Beesley AH, Palmer ML, Ford J, Weller RE, Cummings AJ, Freitas JR, Firth MJ, Perera KU, de Klerk NH, Kees UR., , Authenticity and drug resistance in a panel of acute lymphoblastic leukaemia cell lines., Br J Cancer. 2006 Dec 4;95(11):1537-44.
[4.9] Bertuzzi, A., Gandolfi, A., Sinisgalli, C., 1997. Steel's Potential Doubling Time and Its Estimation in Cell Populations Affected by Nonuniform Cell Loss. Mathematical Biosciences 143, 61-89
[4.10] Boddy AV, Yule SM, Wyllie R, Price L, Pearson AD, Idle JR., Pharmacokinetics and metabolism of ifosfamide administered as a continuous infusion in children., Cancer Res. 1993 Aug 15;53(16):3758-64.
[4.11] Choonara I, Wheeldon J, Rayner P, Blackburn M, Lewis I., Pharmacokinetics of prednisolone in children with acute lymphoblastic leukaemia. Cancer Chemother Pharmacol. 1989;23(6):392-4.Edward Chu, Vincent T. DeVita, Physician's Cancer Chemotherapy Drug Manual 2008, ,, Jones and Bartlett Publishers, 1st edition, 2007
[4.12] Chvetsov AV, Palta JJ, Nagata Y. ‘Time-dependent cell disintegration kinetics in lung tumours after irradiation’. Phys Med Biol (2008), 53:2413-2423.
[4.13] Crom WR, de Graaf SS, Synold T, Uges DR, Bloemhof H, Rivera G, Christensen ML, Mahmoud H, Evans WE., Pharmacokinetics of vincristine in children and adolescents with acute lymphocytic leukemia., J Pediatr. 1994 Oct;125(4):642-9.
[4.14] Dewey WC, Ling CC, Meyn RE. ‘Radiation-induced apoptosis: relevance to radiotherapy’. Int J Radiat Oncol Biol Phys (1995), 33(4):781–796. [4.15] Ginsberg T. ‘Modellierung und Simulation der Proliferationsregulation und Strahlentherapie normaler und maligner Gewebe’. Fortschritt-Berichte, VDI Verlag: Duesseldorf, Reihe 17: Biotechnik (1996), 140:103–107.
[4.16] Evans WE, Sinkule JA, Crom WR, Dow L, Look AT, Rivera G., Pharmacokinetics of Teniposide (VM26) and etoposide (VP16-213) in children with cancer., Cancer Chemother Pharmacol. 1982;7(2-3):147-50.

p-medicine – Grant Agreement no. 270089
D12.1 –Architecture and information flow diagrams of the Oncosimulator and the biomechanism models
Page 56 of 86
[4.17] Galderisi F, Stork L, Li J, Mori M, Mongoue-Tchokote S, Huang J., Flow cytometric chemosensitivity assay as a predictive tool of early clinical response in acute lymphoblastic leukemia., Pediatr Blood Cancer. 2009 Oct;53(4):543-50.
[4.18] Groninger E, Meeuwsen-de Boar T, Koopmans P, Uges D, Sluiter W, Veerman A, Kamps W, de Graaf S., Pharmacokinetics of vincristine monotherapy in childhood acute lymphoblastic leukemia., Pediatr Res. 2002 Jul;52(1):113-8.
[4.19] Groninger E, Proost JH, de Graaf SS., Pharmacokinetic studies in children with cancer., Crit Rev Oncol Hematol. 2004 Dec;52(3):173-97.
[4.20] Groninger E, Meeuwsen-de Boer T, Koopmans P, Uges D, Sluiter W, Veerman A, Kamps W, de Graaf S., Vincristine pharmacokinetics and response to vincristine monotherapy in an up-front window study of the Dutch Childhood Leukaemia Study Group (DCLSG)., Eur J Cancer. 2005 Jan;41(1):98-103.
[4.21] Hempel G, Relling MV, de Rossi G, Stary J, De Lorenzo P, Valsecchi MG, Barisone E, Boos J, Pieters R., Pharmacokinetics of Daunorubicin and Daunorubicinol in Infants With Leukemia Treated in the Interfant 99 Protocol., Pediatr Blood Cancer. 2010 Mar;54(3):355-60.
[4.22] Hongo T, Yajima S, Sakurai M, Horikoshi Y, Hanada R., In vitro drug sensitivity testing can predict induction failure and early relapse of childhood acute lymphoblastic leukemia., Blood. 1997 Apr 15;89(8):2959-65.
[4.23] Inaba H, Pui CH. , Glucocorticoid use in acute lymphoblastic leukaemia., Lancet Oncol. 2010 Nov;11(11):1096-106.
[4.24] Kaspers GJ, Pieters R, Van Zantwijk CH, De Laat PA, De Waal FC, Van Wering ER, Veerman AJ., In vitro drug sensitivity of normal peripheral blood lymphocytes and childhood leukaemic cells from bone marrow and peripheral blood., Br J Cancer. 1991 Sep;64(3):469-74.
[4.25] Kolokotroni E.A., Dionysiou D.D., Uzunoglu N.K., Stamatakos G.S., "Studying the growth kinetics of untreated clinical tumours by using an advanced discrete simulation model", Mathematical and Computer Modelling, in press 2011
[4.26] Lankelma J, Lippens RJ, Drenthe-Schonk A, Termond EF, van der Kleijn E., Change in transfer rate of methotrexate from spinal fluid to plasma during intrathecal therapy in children and adults., Clin Pharmacokinet. 1980 Sep-Oct;5(5):465-75.
[4.27] Larsson R, Kristensen J, Sandberg C, Nygren P., Laboratory determination of chemotherapeutic drug resistance in tumour cells from patients with leukemia, using a fluorometric microculture cytotoxicity assay (FMCA)., Int J Cancer. 1992 Jan 21;50(2):177-85.
[4.28] Lind MJ, Margison JM, Cerny T, Thatcher N, Wilkinson PM., Comparative pharmacokinetics and alkylating activity of fractionated intravenous and oral ifosfamide in patients with bronchogenic carcinoma., Cancer Res. 1989 Feb 1;49(3):753-7.
[4.29] Lönnerholm G, Thörn I, Sundström C, Frost BM, Abrahamsson J, Behrendtz M, Heldrup J, Jacobsson S, Li A, Olofsson T, Porwit A, Söderhäll S, Larsson R, Forestier E., In vitro cellular drug sensitivity at diagnosis is correlated to minimal residual disease at end of induction therapy in childhood acute lymphoblastic leukemia., Leuk Res. 2009 Jan;33(1):46-53. Epub 2008 Jul 17
[4.30] Loo JC, Riegelman S., Assessment of pharmacokinetic constants from postinfusion blood curves obtained after I.V. infusion., J Pharm Sci. 1970 Jan;59(1):53-5.
[4.31] Lowe ES, Kitchen BJ, Erdmann G, Stork LC, Bostrom BC, Hutchinson R, Holcenberg J, Reaman GH, Woods W, Franklin J, Widemann BC, Balis FM, Murphy RF, Adamson PC., Plasma pharmacokinetics and cerebrospinal fluid penetration of thioguanine in children with

p-medicine – Grant Agreement no. 270089
D12.1 –Architecture and information flow diagrams of the Oncosimulator and the biomechanism models
Page 57 of 86
acute lymphoblastic leukemia: a collaborative Pediatric Oncology Branch, NCI, and Children's Cancer Group study., Cancer Chemother Pharmacol. 2001 Mar;47(3):199-205. [4.32] Maseide K, Rofstad EK. ‘Mathematical modeling of chronical hypoxia in tumours considering potential doubling time and hypoxic cell lifetime’. Radiother Oncol (2000), 54:171–177.
[4.33] Nelson RL, Allen LM, Creaven PJ., Pharmacokinetics of divided-dose ifosfamide, Clin Pharmacol Ther. 1976 Mar;19(3):365-70.
[4.34] Nelson RL, Dyke RW, Root MA., Clinical pharmacokinetics of vindesine, Cancer Chemother Pharmacol. 1979;2(4):243-46.
[4.35] Periclou AP, Avramis VI., NONMEM population pharmacokinetic studies of cytosine arabinoside after high-dose and after loading bolus followed by continuous infusion of the drug in pediatric patients with leukemias., Cancer Chemother Pharmacol. 1996;39(1-2):42-50.
[4.36] Pieters R, Loonen AH, Huismans DR, Broekema GJ, Dirven MW, Heyenbrok MW, Hählen K, Veerman AJ., In vitro drug sensitivity of cells from children with leukemia using the MTT assay with improved culture conditions., Blood. 1990 Dec 1;76(11):2327-36.
[4.37] Ramakers-van Woerden NL, Beverloo HB, Veerman AJ, Camitta BM, Loonen AH, van Wering ER, Slater RM, Harbott J, den Boer ML, Ludwig WD, Haas OA, Janka-Schaub GE, Pieters R., In vitro drug-resistance profile in infant acute lymphoblastic leukemia in relation to age, MLL rearrangements and immunophenotype., Leukemia. 2004 Mar;18(3):521-9. [4.38] Salmon SE and Sartorelli AC. ‘Cancer Chemotherapy’. In: Katzung BG (Eds.), Basic & Clinical Pharmacology Lange Medical Books/McGraw-Hill: International Edition, 2001. pp. 923-1044.
[4.39] Smets LA, van der Klooster P, Otte A. , Glucocorticoid receptors of normal and leukemic cells: role of proliferation conditions., Leuk Res. 1985;9(2):199-207.
[4.40] Stamatakos G.S., Kolokotroni E.A., Dionysiou D.D., Georgiadi E.C., Desmedt C., An advanced discrete state-discrete event multiscale simulation model of the response of a solid tumour to chemotherapy: Mimicking a clinical study. J Theor Biol. 266(1) (2010) 124–139. [4.41] Stamatakos G.S.,.Georgiadi E.Ch,.Graf N, Kolokotroni E.A., and Dionysiou D.D., "Exploiting Clinical Trial Data Drastically Narrows the Window of Possible Solutions to the Problem of Clinical Adaptation of a Multiscale Cancer Model", PLOS ONE 6(3), e17594 2011
[4.42] Steel G.G. (Editor), Basic Clinical Radiobiology, third ed., Arnold, London, 2002.
[4.43] Styczynski J, Pieters R, Huismans DR, Schuurhuis GJ, Wysocki M, Veerman AJ., In vitro drug resistance profiles of adult versus childhood acute lymphoblastic leukaemia., Br J Haematol. 2000 Sep;110(4):813-8.
[4.44] Thompson PA, Rosner GL, Matthay KK, Moore TB, Bomgaars LR, Ellis KJ, Renbarger J, Berg SL., Impact of body composition on pharmacokinetics of doxorubicin in children: a Glaser Pediatric Research Network study., Cancer Chemother Pharmacol. 2009 Jul;64(2):243-51.
[4.45] Wishart DS, Knox C, Guo AC, Cheng D, Shrivastava S, Tzur D, Gautam B, Hassanali M. , DrugBank: a knowledgebase for drugs, drug actions and drug targets. Nucleic Acids Res. 2008 Jan;36(Database issue):D901-6.
[4.46] Xu J, Winkler J, Derendorf H., A pharmacokinetic/pharmacodynamic approach to predict total prednisolone concentrations in human plasma., J Pharmacokinet Pharmacodyn. 2007 Jun;34(3):355-72.

p-medicine – Grant Agreement no. 270089
D12.1 –Architecture and information flow diagrams of the Oncosimulator and the biomechanism models
Page 58 of 86
[4.47] Yang L, Panetta JC, Cai X, Yang W, Pei D, Cheng C, Kornegay N, Pui CH, Relling MV. , Asparaginase may influence dexamethasone pharmacokinetics in acute lymphoblastic leukemia., J Clin Oncol. 2008 Apr 20;26(12):1932-9.
[4.48] Yule SM, Boddy AV, Cole M, Price L, Wyllie R, Tasso MJ, Pearson AD, Idle JR., Cyclophosphamide pharmacokinetics in children., Br J Clin Pharmacol. 1996 Jan;41(1):13-19.
[4.49] Zwaan CM, Kaspers GJ, Pieters R, Hählen K, Janka-Schaub GE, van Zantwijk CH, Huismans DR, de Vries E, Rots MG, Peters GJ, Jansen G, Creutzig U, Veerman AJ., Different drug sensitivity profiles of acute myeloid and lymphoblastic leukemia and normal peripheral blood mononuclear cells in children with and without Down syndrome., Blood. 2002 Jan 1;99(1):245-51.
p-medicine – Grant Agreement no. 270089
D12.1 –Architecture and information flow diagrams of the Oncosimulator and the biomechanism models
Page 59 of 86
Chapter 5: The Breast Cancer Branch of the Oncosimulator
Since the basic core of the breast cancer branch of the Oncosimulator will be the same as the one of the nephroblastoma branch, although several adaptations will take place, the present chapter focuses on the pharmacokinetics and pharmacodynamics of the breast cancer treatments considered within the framework of workpackage WP12.
5.1 Information on breast cancer drug pharmacokinetics and pharmacodynamics to be used by the breast cancer model A large scale review of the extensive literature concerning the pharmacokinetic and pharmacodynamic properties of the antineoplastic agents of interest has been conducted with the aim of realistically and optimally simulate the drug and drug combination action in the breast cancer branch of the Oncosimulator. When possible, emphasis was put on recent work (published during the last decade) focusing on breast cancer treatment and human cells. It should be noted that this literature review is an ongoing process so as to keep in track with newly published work and to validate conclusions that have been drawn so far. Consequently, further elucidation of mechanisms to be simulated is expected. The treatment schemes administered to breast cancer patients in the context of p-medicine consist of several combinations of the drugs listed below. 5 – Fluorouracil Capecitabine Bevacizumab Trastuzumab Cyclophosphamide Docetaxel Epirubicin Vinorelbine Some basic information on the drugs is briefly presented in Table 5.1 and Table 5.2.

p-medicine – Grant Agreement no. 270089
D12.1 –Architecture and information flow diagrams of the Oncosimulator and the biomechanism models
Page 60 of 86
Table 5.1. Basic information on breast cancer drugs Generic Name Trade
Name Classification Cell Cycle
specificity Primary mechanism of action
5 – Fluorouracil Adrucil Antimetabolite Cell cycle phase specific (S phase)
Pyrimidine antagonist
Capecitabine Xeloda Antimetabolite Cell cycle phase specific (S phase)
5 –FU prodrug
Bevacizumab Avastin Monoclonal Antibody
N/A VEGF inhibitor
Trastuzumab Herceptin Monoclonal Antibody
N/A Inhibition of the proliferation of human tumour cells that overexpress HER2
Cyclophosphamide Endoxan Alkylating Agent
Mostly active in S phase
Attachment of alkyl groups to DNA bases and Formation of cross-links
Docetaxel Taxotere Antimitotic Cell cycle phase specific (G2/M phase)
Antimicrotubule effect
Epirubicin Ellence Antibiotic Maximal cytotoxic effects in S and G2 phase / cell cycle non specific
Inhibition of topoisomerase II / DNA helicase activity
Vinorelbine
Navelbine Antimitotic Cell cycle phase specific (M phase)
Binds to the tubulin of the mitotic microtubules
Table 5.2. Indicative compartmental pharmacokinetic analyses Generic Name one-compartmental
models two-compartmental models three-compartmental
models 5 – Fluorouracil Sandstrom et al, 2006
Muller et al, 1997; Coustere et al, 1991
-
Capecitabine Urien et al, 2005; Siegel-Lakhai et al, 2008
Czejka et al, 2010; Reigner et al, 2001; Siegel-Lakhai et al, 2008
-
Bevacizumab - Ternant et al, 2010; Lu et al, 2008; Shih & Lindley, 2006
-
Trastuzumab - Bruno et al, 2005; Cobleigh et al, 1999; Charoin et al, 2004
-
Cyclophosphamide Chinnaswamy et al, 2011; Zhang et al, 2006; Batey et al, 2002; Chen et al, 1997;
Juma et al, 1981; Hassan et al, 1999; Cohen et al, 1971
-
Docetaxel - Slaviero et al, 2004
Bruno et al, 1997; McLeod et al, 1998; Gustafson et al, 2003

p-medicine – Grant Agreement no. 270089
D12.1 –Architecture and information flow diagrams of the Oncosimulator and the biomechanism models
Page 61 of 86
Epirubicin - Wade et al, 1992
Danesi et al, 2002; Mei et al, 2000; Robert, 1994; Jacobsen et al, 1991
Vinorelbine
- - Nguyen et al, 2002; Deporte-Fety et al, 2004; Gregory & Smith, 2000; Gauvin et al, 2000
5.1.1 5–Fluorouracil 5 – Fluorouracil is a fluorinated pyrimidine antimetabolite widely used for the treatment of various types of cancer (e.g. bladder cancer, breast cancer, colorectal cancer, gastric cancer, head and neck cancer, ovarian cancer, pancreatic cancer, prostate cancer, skin cancer) both as a single agent and as a component of a more complex chemotherapeutic scheme (e.g. fluorouracil – epirubicin - cyclophosphamide regimen (Sandstrom et al, 2006)) for more than four decades now (Grem, 2000). 5-FU is considered to be a cell cycle phase specific (S phase) antineoplastic agent, without any activity when cells reside in G0 or G1 phases (De Angelis et al, 2006; Shah and Schwartz, 2001). Indeed, 5-FU causes DNA damage during S phase via multiple mechanisms (De Angelis et al, 2006; Curtin et al, 1991; Peters et al, 2000) and this damage can occur in all cell cycle phases in proliferating cells (De Angelis et al, 2006; Gottifredi and Prives, 2005; Kastan and Bartek, 2004). Consequently, cells are killed throughout the cell cycle. So far, two main anti-tumour mechanisms have been demonstrated in the case of 5 – FU (Zhang et al, 2008). 5-FU is converted to fluorodeoxyuridine monophosphate (FdUMP) which competes with uracil to bind to thymidylate synthetase. This results in impairment of thymidine production (dTMP) and therefore decreased DNA replication and repair, and ultimately in cytotoxicity (Parker and Cheng, 1990; Longley et al, 2003). Fluorouracil is also an analog of the pyrimidine uracil and thus acts as a pyrimidine antagonist (Dorr and Von Hoff, 1994). Thus, it misincorporates into RNA and DNA in place of uracil or thymine (Zhang et al, 2008). In (Kugawa et al, 2004) an evaluation of human breast cancer cell (cell line MCF-7) death by the chemotherapeutic scheme consisting of cyclophosphamide, doxorubicin and 5-fluorouracil was attempted. 5-FU was shown to induce 60% cell death at a dose equal to 25 μg/ml, by the fourth day following drug treatment. (Choi and Kim, 2009) conducted an experiment with human breast cancer MDA-MB-453 cells and found that 5 – FU had a mediocre dose-dependent anti-proliferative effect (IC50 = 90 μM). In (Ohta et al, 2001), where the cytotoxicity of chemotherapeutic agents is evaluated in six ovarian cancer cell lines, the assay area under curve was calculated as equal to IC50 × 96 h (the period of continuous exposure in the assay). The IC50 value for the six cell lines under study ranged from 10.5 to 135 μg/ml and the peak plasma concentration was 10 μg/ml. Based on the literature review that was thoroughly conducted pharmacokinetic data have been described by both non–compartmental and compartmental (use of one and two – compartmental models) analysis. According to (Sandstrom et al, 2006) a one-compartment model with saturable elimination has adequately described the 5-FU pharmacokinetic data. In (Coustere et al, 1991) a two-compartment model based on linear kinetics was applied for the description of 5-FU disposition kinetics at a dose of 500 mg/m2. The total clearance values for 5-FU (0.81 0.21 I/min) estimated by this model were in agreement with those calculated using a non-compartmental analysis of the same data (Heggie et al, 1987), as well
p-medicine – Grant Agreement no. 270089
D12.1 –Architecture and information flow diagrams of the Oncosimulator and the biomechanism models
Page 62 of 86
as with those previously reported by (Diasio and Harris, 1989) in nine different studies after the administration of an intravenous bolus at several dosages of 5-FU (range between 0.8-1.9 l/min). According to (Muller et al, 1997), 5 – FU pharmacokinetic data was fitted according to a two-compartment model. Mean interstitial 5-FU load, expressed as area under curve (AUC), in breast tumours was 61 ± 11% (means ± SE) of the mean plasma 5-FU load. (Adjei et al, 2002) conducted a non – compartmental analysis and calculated the mean ±SD steady-state plasma concentration and area under the curve (AUC)144-168h for continuous venous infusion of 5 - FU (300 mg/m2 per day for 7 days) as equal to 104 ± 45 ng/ml and 2,350 ± 826 ng·h/ml, respectively. In (Larsson et al, 1996) a study of the pharmacokinetic effects of 5 – FU after 20 min intravenous infusion or a two - minute bolus (push) injection of 5-fluorouracil (500 mg/m2) was conducted. After bolus injection, the AUC was given as equal to 6158 874 μM/l·min, while after short-time infusion it was calculated as equal to 3355 428 μM/l·min (p < 0.01). In (Finch et al, 1979), the mean plasma half – life t1/2 of 5 - FU for patients receiving the 0.5g dose (given by rapid intravenous injection) was 8.2 min and the computed concentration of 5FU at zero time C0 for the group had a mean value equal to 44.1 μg ml-1. The calculated apparent volume of distribution Vd, was found to have a mean value equal to 13.31. The computed AUC showed a 3.1-fold range between 290 and 904 μg min ml-1 (mean = 507). 5.1.2 Capecitabine Capecitabine is an oral fluoropyrimidine prodrug used mainly for the treatment of breast and gastrointestinal cancer. This antimetabolite is converted to 5-FU via thymidine phosphorylase, an enzyme mostly expressed in neoplastic tissue compared with health tissue rendering capecitabine tumour specific (Scientific discussion, EMEA 2005, From: http://www.ema.europa.eu/docs/en_GB/document_library/EPAR_-_Scientific_Discussion/human/000316/WC500058145.pdf, Visited 06/2011). Both normal and tumour cells metabolize 5-FU to 5-fluoro-2’-deoxyuridine monophosphate (FdUMP) and 5-fluorouridine triphosphate (FUTP) (From: http://www.druglib.com/activeingredient/capecitabine/, Visited 06/2011). Once these metabolites are generated, the specific agent has the same mode of action with 5 - FU (Geisler et al, 2007). Capecitabine appears to be phase specific for the G1 and S phases of the cell cycle (From: http://www.merckmanuals.com/professional/print/lexicomp/capecitabine.html, Visited 06/2011). Capecitabine undergoes extensive metabolism in multiple physiological compartments and exhibits particular challenges for predicting pharmacokinetic and pharmacodynamic activity in humans (Blesch et al, 2003). In (Reigner et al, 2001) mean pharmacokinetic parameters of capecitabine have been mainly determined with the use of non-compartmental analyses. After oral administration of 1250 mg/m2, capecitabine was rapidly and extensively absorbed from the gastrointestinal tract [with a time to reach peak concentration (tmax) of 2 hours and peak plasma drug concentration (Cmax) of 3 to 4 mg/l] and had an elimination half-life (t½) ranging from 0.55 to 0.89h. According to (Walko and Lindley, 2005) in adults, capecitabine has a bioavailability of ~100% with a Cmax of 3.9 mg/l, tmax of 1.5 to 2 h, and AUC of 5.96 mg·h/l. According to non-compartmental analysis conducted by (Czejka et al, 2011), mean peak plasma concentrations of capecitabine occurred at about 50 min, those of metabolites (5'DFCR and 5'DFUR) shortly later (range 54-80 min). In (Siegel-Lakhai et al, 2008) a time delay was observed between drug intake and the appearance of capecitabine in plasma. A
p-medicine – Grant Agreement no. 270089
D12.1 –Architecture and information flow diagrams of the Oncosimulator and the biomechanism models
Page 63 of 86
one- and a two-compartment model (with the use of NONMEM software) were fitted to the concentration time profiles in individual patients. Mean AUC was calculated as equal to 7.71 mg·h/l for a dose of 1250 mg·m-2. In (Urien et al, 2005) capecitabine pharmacokinetics was ascribed to a one- compartment model from which 5’-DFCR, 5’-DFUR and 5-FU were sequentially produced. 5.1.3 Bevacizumab Bevacizumab is a recombinant humanized monoclonal antibody (93% human and 7% murine) (Homsi and Daud, 2007). The specific agent binds vascular endothelial growth factor (VEGF), the main mediator of tumour angiogenesis, thereby inhibiting the interaction of VEGF to its receptors (Flt-1 and KDR) on the surface of endothelial cells (From: http://www.medsafe.govt.nz/profs/datasheet/a/Avastininf.pdf, Visited 07/2011). Thus, it inhibits angiogenesis and tumour growth (Manley et al 2002). Since VEGF is thought to play a key - role in the formation of tumour metastases (Saito et al, 1998), anti-VEGF therapy is considered a promising strategy for treating metastatic sites (Gerber and Ferrara, 2005). Various studies have been sought in order to analyze the actual efficacy of bevacizumab treatment (Ferrara and Kerbel, 2005). Bevacizumab is believed to have multiple valuable pharmacodynamics effects upon tumour vasculature:
It induces regression of existing tumour vasculature by limiting blood supply and tumour growth (Marrs and Zubal, 2009). Based on an experiment conducted by (Kim et al, 1993), anti – VEGF therapy has no effect on the proliferation rates of the tumour cells proving this way that primary pharmacodynamic effects of the specific drug are not directly targeted on tumour cells, but on endothelial cell survival and proliferation within the tumour vascular network. Indeed, the absence of growth signals causes the death of endothelial cells by apoptosis and fragment and ultimately, vessel regression (Tobelem 2007; Bergers and Benjamin, 2003). After 7 days of VEGF inhibition vessel density has been shown to decrease by as much as 80% (Inai et al, 2004; Baluk et al, 2005; Yuan et al, 1996). Similar results have come up from a phase I clinical trial, where a single infusion of bevacizumab reduced microvessel density by 29–59% (p<0.05) in rectal cancer patients (Willett et al, 2004) and a phase II trial of bevacizumab in patients with advanced hepatocellular cancer (Zhu et al, 2006).
It inhibits the proliferation of the endothelial cells, causing in this way impairment of further vessel growth (Samant and Shevde, 2011). Indeed, according to (Tobelem, 2007), studies have shown that therapy targeting VEGF inhibition suppresses endothelial cell proliferation and migration, and new vessel growth within 24 h of administration.
It normalizes surviving tumour vasculature, thereby facilitating the delivery of chemotherapeutic agents to the tumour tissue (Lorusso, 2008; Jain, 2008; Dickson et al, 2007). The specific effect is believed to be a very significant one, since a major problem in chemotherapy treatment is the fact that a large percentage of the chemotherapeutic drug is thought to bypass large areas of the tumour (Jain, 1987; Jain, 1988) not being able to access all target areas due to the high abnormality of tumour vessels. Indeed, based on a preclinical study, the combination of bevacizumab with another antineoplastic agent called irinotecan increased by 46% the intratumoral concentration of irinotecan (Wildiers et al, 2003). Moreover, in the recent years the scientific community has determined additional benefits of normalization of tumour vessels such as the fact that vascular normalization enhances radiosensitivity and tumour immunity (Sato, 2011).

p-medicine – Grant Agreement no. 270089
D12.1 –Architecture and information flow diagrams of the Oncosimulator and the biomechanism models
Page 64 of 86
According to (Gerber and Ferrara, 2005) who conducted a review of pharmacodynamic effects of bevacizumab treatment on various human tumour cell lines, studies have shown that monotherapy with bevacizumab resulted in dose – dependent tumour growth inhibition of 20 different human tumour cell lines (13 tumour types) implanted into nude mice and the inhibition was independent of the route of administration or tumour location. In (Marme and Fusenig, 2008), bevacizumab has been found to neutralize all isoforms of human VEGF with a dissociation constant (Kd) of 80 pΜ and to inhibit VEGF – induced proliferation of endothelial cells in vitro and tumour growth in vivo. (Dass et al, 2007) suggest that tumour vascular endothelial cells express specific markers that can be exploited since they proliferate from 50 to 200 times faster than normal cells. According to the same source, one vascular endothelial cell has been found to support up to 100 tumour cells and that is why the destruction of even one single blood vessel can cause the death of a considerable number of tumour cells. Based on the state of the art, the vast majority of pharmacokinetic data has been analysed using two- compartmental methods. In (Lu et al, 2008), an open two-compartment model with first-order elimination best fitted the pharmacokinetic data of bevacizumab. In the final model, estimated clearance and central compartment volume of distribution were 0.207 l/day and 2.39 l for a typical female. Clearance was 26% faster in men than in women. The terminal half-life estimate was 20 days for both men and women. In (Shih and Lindley, 2006) at doses of 0.1 and 10 mg/kg, the Cmax was 2.80 and 284 μg/ml, respectively. The mean clearance of bevacizumab in the dose range from 0.3 to 10 mg/kg was 2.75 to 5.07 ml/kg per day after the first dose. According to the specific source, the best structural model for bevacizumab pharmacokinetics was a two-compartmental model with first-order elimination. The estimated elimination tl/2 of bevacizumab was 20 days. (Ternant et al, 2010) also described bevacizumab concentrations using a two-compartment population pharmacokinetic model with first-order constants. In(http://www.ema.europa.eu/docs/en_GB/document_library/EPAR__Scientific_Discussion/human/000582/WC500029262.pdf, Visited 06/2011) pharmacokinetic data for bevacizumab was analyzed using standard two-compartment and one-compartment methods, while terminal elimination half-life was also determined with the use of non-compartmental methods. According to the same source, pharmacokinetics of bevacizumab proved to be dose independent, except for doses <1 mg/kg and linear over the dose range 1 to 10 mg/kg. The clearance of bevacizumab ranged from 2.75 to 3.65 ml/day/kg while central volume of distribution ranged from 37.9 to 48.6 ml/kg at all doses, which is about the human plasma volume of 43 ml/kg. 5.1.4 Trastuzumab The specific antineoplastic agent that was added in the pharmaceutical armamentarium for the treatment of breast cancer in 1998 is a member of the family of humanized monoclonal antibodies. It exhibits antitumour activity against the human epidermal growth factor receptor 2 protein (HER2) overexpressing human breast tumour cells (20 – 30 % of human breast cancer) (Harries and Smith, 2002). Trastuzumab binds with high affinity to the extracellular domain of HER-2. Although its mechanisms of action are only partially elucidated there is evidence that trastuzumab causes immune–mediated cellular cytotoxicity, inhibition of HER2 shedding, induction of HER2, inhibition of the PI3K pathway, inhibition of angiogenesis and G1 arrest (Valabrega et al, 2007).

p-medicine – Grant Agreement no. 270089
D12.1 –Architecture and information flow diagrams of the Oncosimulator and the biomechanism models
Page 65 of 86
Literature suggests that 2 – compartmental models assuming first-order elimination give the best description of trastuzumab pharmacokinetic data. According to (Cobleigh et al, 2003) trastuzumab concentrations can be predicted by a two-compartment model with an estimated half-life of at least 18 to 27 days. In (Charoin et al, 2004), pharmacokinetic data best fitted to a linear two-compartment pharmacokinetic model with a long half-life, typical of that of IgG immunoglobulins. The central volume of distribution corresponded to the typical human plasma volume and parameter estimates (Cl = 0.226 l/day, V1 = 3.17 l, k12 = 0.0828 day-1, k21 = 0.0486 day-1, AUC0-3wks = 1677 mg∙day/l, Cmax = 104 mg/l, Cmin = 64.9 mg/l) were similar to the ones obtained in a population pharmacokinetic analysis previously performed (Washington et al, 2002). Finally, in (Bruno et al, 2005), a two-compartment linear model adequately described the pharmacokinetic data. Population estimates from the base model for clearance and volume of distribution of the central compartment of trastuzumab were 0.225 l/day, and 2.95 l, respectively. Terminal half life based on the population estimate was 28.5 days. 5.1.5 Cyclophosphamide Cyclophosphamide is an antineoplastic and immunosuppressive agent that undergoes hepatic transformation to form active alkylating metabolites (Sladek, 1988). As a member of the family of alkylating agents, cyclophosphamide is believed to act in three ways: via the attachment of alkyl groups to DNA bases, so as to inhibit DNA synthesis and RNA transcription from the affected DNA, via the formation of cross-links leading to impairment of DNA replication and RNA transcription and via the induction of mispairing of the nucleotides leading to mutations (From http://www.drugbank.ca/drugs/DB00531, Visited 07/2011). According to (Goldstein et al, 2008), in spite of the fact that cyclophosphamide is one of the most commonly used anticancer agents and the fact that DNA interstrand cross-links are considered responsible for its cytotoxicity, the exact mechanism of initiation and execution of cell death still remains unknown to a large extent. Cyclophosphamide has been found to be more effective against rapidly proliferating cells (Ahmed et al, 1984; Swierniak et al, 2009). Indeed, preferential cytotoxic activity of cyclophosphamide against rapidly proliferating lymphocytes has been demonstrated by 1125 UDR labeling of lymphocytes (Turk and Poulter, 1972). It belongs to the category of drugs that, although mostly active in specific phases, kill cells also in other phases of the proliferation cycle. Indeed, cyclophosphamide is considered mostly active in the S phase of the cell cycle (Swierniak et al, 2009), but it can damage DNA during any phase of the cell cycle (Zhang et al, 2006). In (Kugawa et al, 2004) an evaluation of human breast cancer cell (cell line MCF-7) death by a chemotherapeutic scheme consisted of cyclophosphamide, doxorubicin and 5-fluorouracil was conducted. Cyclophophamide was the least cytotoxic of the three drugs, causing only 20% cell death, even at the high concentration of 500 μg/ml. In (Ohta et al, 2001), where the cytotoxicity of various chemotherapeutic agents is evaluated, in six ovarian cancer cell lines, the assay area under curve was calculated using the formula AUC = IC50 × t1/2 × 1.44{1-e-(0.693)(96)/t1/2}, where t1/2 is the in vitro half-life of the drug at 37 0C. The IC50 value for the six cell lines under study ranged from 0.81 to 12.3 μg/ml and the peak plasma concentration was 3.0 μg/ml. Cyclophosphamide proved mostly cytotoxic for serous papillary adenocarcinoma cells comparing to clear cell adenocarcinoma cells. Literature review has revealed that both one- and two–compartmental models have been applied for the description of cyclophosphamide pharmacokinetics.

p-medicine – Grant Agreement no. 270089
D12.1 –Architecture and information flow diagrams of the Oncosimulator and the biomechanism models
Page 66 of 86
In (Zhang et al, 2006), pharmacokinetic parameters of Cyclophosphamide and Ifosfamide were reported. The half life of the elimination phase of cyclophosphamide ranges from 3.2-7.6 hours with total body clearance values of 2.5 to 4.0 l/h/m2. Following intravenous administration, the volume of distribution of cyclophosphamide approximated the total body water volume (30-50 l). At doses of cyclophosphamide used in clinical practice, no dose-dependent pharmacokinetics was revealed. When cyclophosphamide was administered at 4.0 g/m2 over a 90-min infusion in patients with metastatic breast cancer, a one-compartment model with Michaelis-Menten saturable elimination in parallel with first-order renal elimination adequately described the kinetics of cyclophosphamide. Based on the same source, the specific agent is well absorbed and the peak concentration appears 1 hour following oral drug administration. The oral bioavailability of cyclophosphamide is 85-100%, while at higher doses (0.7 g/m2), it has an 87.7% oral bioavailability. According to (Chinnaswamy et al, 2011), a one compartmental model, incorporating a term in surface area for both clearance and volume of distribution, best described cyclophosphamide pharmacokinetics. In (Cohen et al, 1971), the data was described by a two- compartment open model with half life of the elimination phase of the drug ranging between 3 and 11 hours and mean renal clearance equal to 10.7 ml/min. Finally it should be stressed that in adults, there is substantial interpatient variability in the cyclophosphamide area under the curve and an even greater variability in the area under the curve of its metabolites when cyclophosphamide is dosed based on body surface area or weight (McCune et al, 2008). 5.1.6 Docetaxel Docetaxel is an antineoplastic agent belonging to the class of antimitotics. Early in vitro studies revealed that docetaxel has a wide spectrum of antitumour activity (Bissery, 1995). In (Herbst and Khuri, 2003) docetaxel was attributed with multiple effects within a tumour. Several mechanisms of action have been described, among which interference with microtubule synthesis and degradation leading to inhibition of mitosis in cells and inhibition of angiogenesis seem to be the most significant ones (Sweeney et al, 2001). Docetaxel is a cell cycle phase-specific agent causing catastrophic cell cycle arrest in G2/M (Wang et al, 2004). According to (Armand, 2003), it has also been shown to induce tumour cell apoptotic death and to have antiangiogenic and immunostimulating properties. (Hernández-Vargas et al, 2007) conducted an experiment with human breast cancer cell lines exposed to docetaxel and suggested two different mechanisms of mitotic exit according to the drug concentrations: necrosis after induced aberrant mitosis necrosis (at low nanomolar concentrations) and mitotic arrest plus apoptosis (at higher concentrations of docetaxel). Based on the literature review conducted, concentration-time data of docetaxel has been described with the use of non–compartmental analyses and of both two- and three- compartmental models. According to (McLeod et al, 1998) docetaxel pharmacokinetic data was best described by a three-compartment nonlinear model. The final parameter estimates recorded for the nonlinear model are Vc = 2.629 ml/m2, Vmax12 = 11.640 ng/h, Km12 = 1.616 ng/ml, K21 = 1.634 h-1, K13 = 7.66 h-1, K31 = 0.044 h-1, Vmax10 = 1.551 ng/h and Km10 = 28.6 ng/ml. According to (Bruno et al, 1997) phase I trials have shown that docetaxel exhibits linear pharmacokinetics consistent with a three-compartment model. In (Slaviero et al, 2004) a two-compartment pharmacokinetic model was used to describe the docetaxel concentration-time data from 54 patients with advanced cancer. A population pharmacokinetic model has been developed and validated for weekly docetaxel (40 mg·m-2). The mean population estimate for clearance was 28.42 l·h-1, for the volume of distribution

p-medicine – Grant Agreement no. 270089
D12.1 –Architecture and information flow diagrams of the Oncosimulator and the biomechanism models
Page 67 of 86
7.91 l, for k12 = 1.16 h-1 and for k21 = 0.15 h-1. Non-compartmental modeling has also been carried out using Microsoft Excel with standard equations for non-compartmental and system analysis (Wagner, 1993). 5.1.7 Epirubicin Epirubicin is an antracycline derivative of antibiotics intended for breast cancer patients with evidence of axillary node tumour involvement following resection of primary site. Anthracycline mode of action has not been fully elucidated yet. However, epirubicin seems to have both antimitotic and cytotoxic activity (From: http://www.drugbank.ca/drugs/DB00445, Visited 07/2011). According to (Arican and Soy, 2005) cell culture studies indicate that epirubicin rapidly diffuses inside the cell, localises in the nucleus and inhibits synthesis of nucleic acid. IC50 value of epirubicin for HeLa (CCL 2) cells that was taken from human cervical carcinoma was determined as equal to 0.1 μg/ml. Epirubicin is categorized as a cell – cycle non specific drug (Salmon and Santorelli, 2001). In (Hill and Whelan, 1982) epirubicin was shown to cause maximal lethal effects in the S and G2 phases of the cell cycle in murine and human tumour cell lines. After intravenous administration to patients, epirubicin shows a wide dispersion in the tissues (Ulakoglu and Altun, 2004). After bolus intravenous administration, epirubicin undergoes triphasic elimination from the plasma. Its terminal plasma elimination half-life in patients with cancer is 18 to 45 hours. The drug has a large volume of distribution and is concentrated in a variety of normal and cancerous tissues (Coukell and Faulds, 1997). For the description of concentration versus time data of epirubicin both two and three compartmental models have been applied. In (Jacobsen et al, 1991) the pharmacokinetics of the drug after intravenous bolus administration has been described by an open three-compartment model. The same source stresses that pharmacokinetic parameters are subject to considerable interindividual variation, and a given dose may result in highly different AUC values. According to (Robert, 1994) epirubicin pharmacokinetics may be described by a three-compartment model, with half-lives for the initial (alpha), intermediate (beta) and terminal (gamma) elimination phases of 3.2 minutes, 1.2 and 32 hours, respectively. Total plasma clearance is 46 l/h/m2 and volume of distribution at steady-state is 1000 l/m2. The pharmacokinetics of epirubicin appears to be linear for doses up to the maximal tolerated dose of 150 to 180 mg/m2. In (Wade et al, 1992) epirubicin was given as a short-term intravenous infusion over the dose range of 25-100 mg/m2, and a two compartment model was fitted to the data, characterised by the parameters clearance, volume of the central compartment, alpha and beta. Clearance was tested as a linear function of various demographic and/or biochemical features. According to (Mei et al, 2000) the pharmacokinetic parameters of epirubicin after iv bolus administration were Cmax = 12.825 9.901 mg l-1, K12 = 3.1736 0.8991 h-1, K21 = 0.4225 0.2293 h-1, K13 = 4.7345 0.9122 h-1, , K31 = 0.0355 0.0195 h-1, AUC = 2976.2 904.8 ng·h·ml-1, Vd = 69.67 26.55 l·kg-1, CL = 60.3 22.3 l·h-1
. The pharmacokinetics of high dose epirubicin was best described by a typical three-compartment model. 5.1.8 Vinorelbine

p-medicine – Grant Agreement no. 270089
D12.1 –Architecture and information flow diagrams of the Oncosimulator and the biomechanism models
Page 68 of 86
The antimitotic anticancer agent vinorelbine is a semi-synthetic vinca-alkaloid used for the treatment of various types of cancer such as non-small-cell lung cancer and metastatic breast cancer. Vinorelbine is also a radiation-sensitizing agent (Gridelli et al, 2000) and it is considered a cell cycle phase-specific (M phase) agent (Navelbine product monograph, 1998). It binds to tubulin and inhibits microtubule assembly, resulting in cell mitosis disruption and eventual cell death (Vinorelbine CCO Formulary, 2010). It blocks cells at G2/M when present at concentrations close to IC50 (19.10 nmol for human breast cancer cells) while at higher concentrations there is production of polyploidy (Gregory and Smith, 2000). According to (Gasoigne and Taylor, 2009) once the cells arrest in mitosis, they undergo one of the fates explained below: Direct death in mitosis Unequal division to produce aneuploid daughter cells Exit cell cycle without undergoing cell division. In this case either they continue progressing through the cell cycle as tetraploid cells or they arrest in interphase indefinitely or they die in interphase According to existing literature, the majority of vinorelbine data have been analysed using three - compartment methods. In (Deporte-Fety et al., 2004), vinorelbine was administered as infusions of 5–10 min at 15, 20 or 25 mg/m2 to 30 patients. Vinorelbine concentration-time data were best described by a three-compartment open model. Plasma clearance was high and positively related to lean body weight and body surface area or to a combination of height and body weight. Typical population estimates of clearance and central distribution volume were 74.2 l/h and 7.8 l, respectively. In (Nguyen et al., 2002) a linear three-compartment model characterized vinorelbine blood concentrations and the equation was parameterized in terms of total body clearance, central volume of distribution, transfer rate constants, slope of the distribution phase and volume of distribution. This type of structural model was used in order to obtain pharmacokinetic parameters such as terminal half-life or volume of distribution of the terminal phase. According to (Gregory & Smith, 2000) the pharmacokinetic properties of intravenously administered vinorelbine can be described by a three compartment model: after a dose of 30 mg·m–2 intravenous a high initial peak of 5 μmol rapidly decays to about 1 nmol at 2 h. The drug diffuses freely into tissues showing a large volume of distribution and an elimination half-life of 40 h (Marquet et al, 1992). In (Gauvin et al, 2000) vinorelbine was administered by a 10-min continuous infusion at a dose of 20–30 mg/m2 through a central venous catheter. An open three-compartment pharmacokinetic model with a zero order input rate was used to describe the kinetics of vinorelbine. Area under the plasma-concentration time curve (AUC) normalized to a 30 mg/m2 administered dose averaged 0.89 mg/l·h (coefficient of variation = 23.7%). The total plasma clearance averaged 0.93 l/h/kg (0.61–1.83 l/h/kg; coefficient of variation = 38.6%). The elimination half-life was 38.1 ± 5.8 h, V1=30.3 L, C1=61.2 l/h, α=0.426 h-1, β=0.0182 h-1, k21=0.853 h-1, k31=0.0362 h-1
According to another source, a three-compartment open model adequately described vinorelbine pharmacokinetics (Rezai et al, 2011). Body weight and platelet count significantly influenced blood vinorelbine clearance. The final parameter estimates were as follows: CL = 24.9 l/h, V1 = 8.48 l, Q2 = 50.7 l/h, V2 = 1,320 l, Q3 = 66.1 l/h, and V3 = 62.4 l (Qi and Vi denote inter-compartmental clearance and peripheral volume of distribution, respectively).

p-medicine – Grant Agreement no. 270089
D12.1 –Architecture and information flow diagrams of the Oncosimulator and the biomechanism models
Page 69 of 86
5.2 REFERENCES [5.1] Adjei AA, Reid JM, Diasio RB, Sloan JA, Smith DA, Rubin J, Pitot HC, Alberts SR, Goldberg RM, Hanson LJ, Atherton P, Ames MM and Erlichman C: Comparative pharmacokinetic study of continuous venous infusion fluorouracil and oral fluorouracil with eniluracil in patients with advanced solid tumours. J Clin Oncol 20: 1683-1691, 2002 [5.2] Ahmed, A. R., and Hombal, S. M. Cyclophosphamide (Cytoxan): a review on relevant pharmacology and clinical uses. J. Am. Acad. Dermatol., //: 1115-1126,1984. [5.3] Arıcan ÖG, Soy NN (2005). Effects of Epirubicin and Daunorubicin on cell proliferation and cell death in HeLa cells. J. Cell Mol. Biol. 4: 47- 52. [5.4] Armand, J.P, Focus on cellular pharmacology of docetaxel , Bulletin du Cancer (2003) [5.5] Baluk P, Hashizume H, McDonald DM (2005) Cellular abnormalities of blood vessels as targets in cancer. Curr Opin Genet Dev 15:102–111 [5.6] Batey, M.A., Wright, J.G., Azzabi, A., Newell, D.R., Lind, M.J., Calvert, A.H., 2002. Population pharmacokinetics of adjuvant cyclophosphamide, methotrexate and 5-fluorouracil (CMF), Eur. J. Cancer 38, 1081–1089. Bergers G, Benjamin LE (2003) Tumorigenesis and the angiogenic switch. Nat Rev Cancer 3:401–410 [5.7] Bissery MC. Preclinical pharmacology of docetaxel. Eur J Cancer 1995; 31A(Suppl 4): S1–6 [5.8] Blesch, K.S. et al. (2003) Clinical pharmacokinetic/pharmacodynamics and physiologically based pharmacokinetic modeling in new drug development: the capecitabine experience. Invest. New Drugs 21, 195–223 [5.9] Bruno R, Washington CB, Lu JF, Lieberman G, Banken L, Klein P, (2005) Population pharmacokinetics of trastuzumab in patients with HER2+ metastatic breast cancer. Cancer Chemother Pharmacol 56:361–369 [5.10] Bruno R., Riva A., Hille D., Lebecq A., Thomas L. Pharmacokinetic and pharmacodynamic properties of docetaxel: results of Phase I and Phase II trials. Am. J. Health Syst. Pharm., 54 (Suppl. 2): S16-S19, 1997 [5.11] Charoin JE. et al. Population pharmacokinetic analysis of trastuzumab (Herceptin®) following long-term administration using different regimens. PAGE 2004. [5.12] Chen T-L, Kennedy MJ, Anderson LW, Kiraly SB, Black KC, Colvin OM, and Grochow LB (1997) Nonlinear pharmacokinetics of cyclophosphamide and 4-hydroxycyclophosphamide/ aldophosphamide in patients with metastatic breast cancer receiving high-dose chemotherapy followed by autologous bone marrow transplant. Drug Metab Dispos 25:544–551. [5.13] Chinnaswamy Girish, Errington Julie, Foot Annabel, Boddy Alan V., Veal Gareth J., Cole Michael, Pharmacokinetics of cyclophosphamide and its metabolites in paediatric patients receiving high-dose myeloablative therapy, E U RO P E A N J O U R NA L O F C A N C E R, 2011 [5.14] Choi EJ, Kim GH. 5-Fluorouracil combined with apigenin enhances anticancer activity through induction of apoptosis in human breast cancer MDA-MB-453 cells. Oncol Rep. 2009;22:1533–7. [5.15] Coukell A.J., Faulds D., Drugs 53 (1997) 453–482. [5.16] Coustere. C., Mentre. F., Sommadossi, J.-P., Dlasio R.B. & Steimer. J.-L. (1991). A mathematical model of the kinetics of 5-fluorouracil and its metabolites in cancer patients. Cancer Chemother. Pharmacol., 28, 123-129.
p-medicine – Grant Agreement no. 270089
D12.1 –Architecture and information flow diagrams of the Oncosimulator and the biomechanism models
Page 70 of 86
[5.17] Cobleigh M, Frame D. Is trastuzumab every three weeks ready for prime time? J Clin Oncol 2003;21:3900–01. [5.18] Cohen, J. L., Jao, J. Y., and Jusko, W. J. Pharmacokinetics of Cyclophosphamide in Man. Brit. J. Pharmacol., 43: 677-680, 1971. [5.19] Curtin NJ, Harris AL, Aherne GW: Mechanism of cell death following thymidylate synthase inhibition: 2'-deoxyuridine-5'- triphosphate accumulation, DNA damage, and growth inhibition following exposure to CB3717 and dipyridamole. Cancer Res 1991, 51:2346-2352 [5.20] Czejka Martin, Schueller J., Farkouh A., Gruenberger B. and Scheithauer W., Plasma disposition of capecitabine and its metabolites 5′DFCR and 5′DFUR in a standard and dose-intensified monotherapy regimen, Cancer Chemotherapy and Pharmacology Volume 67, Number 3, 613-619, DOI: 10.1007/s00280-010-1363-4, 2011 [5,21] Danesi, R., Innocenti, F., Fogli, S., Gennari, A., Baldini, E., Paolo, A.D., Salvadori, B., Bocci, G., Conte, P.F., Del Tacca, M., 2002. Pharmacokinetics and pharmacody- namics of combination chemotherapy with paclitaxel and epirubicin in breast cancer patients. J. Clin. Pharmacol. 53, 508 518. [5.22] Dass CR, Tran TM, Choong PF. Angiogenesis inhibitors and the need for anti-angiogenic therapeutics. J Dent Res 86: 927-936, 2007. [5.23] De Angelis, P. M.; Svendsrud, D. H.; Kravik, K. L.; Stokke, T. Cellular response to 5- fluorouracil (5-FU) in 5-FU-resistant colon cancer cell lines during treatment and recovery. Mol. Cancer 2006, 5, 20. [5.24] Deporte-Fety R, Simon N, Fumoleau P, Campone M, Kerbrat P, Bonneterre J, Fargeot P, Urien S. Population pharmacokinetics of short intravenous vinorelbine infusions in patients with metastatic breast cancer. Cancer Chemother Pharmacol 2004; 53: 233-238 [5.25] Diasio RB, Harris BE (1989) Clinical pharmacology of 5 fluorouracil. Clin Pharmacokinet 16:215 [5.26] Dickson PV, Hamner JB, Sims TL, et al. Bevacizumab-induced transient remodeling of the vasculature in neuroblastoma xenografts results in improved delivery and efficacy of systemically administered chemotherapy. Clin Cancer Res. 2007;13:3942–3950. [5.27] Dorr RT, Von-Hoff DD. Cancer Chemotherapy Handbook. 2nd ed. Norwalk, Connecticut: Appleton & Lange; 1994. p. 27-28,123. [5.28] Ferrara, N.; Kerbel, R.S. Nature, 2005, 438, 967 [5.29] Finch, R E., M. R Bending, and A. F. Lant. 1979. Plasma levels of 5-fluorouracil after oral and intravenous administration in cancer patients. Br. J. Clin. Pharmacol. 7:613-617. [5.30] Gascoigne KE, Taylor SS (2009) How do anti-mitotic drugs kill cancer cells? J Cell Sci 122:2579–2585 [5.31] Gauvin A, Pinguet F, Culine S, Astre C, Bresolle R Gomeni. Bayesian estimate of vinorelbine pharmacokinetic parameters in elderly patients with advanced metastatic cancer. Clin Cancer Res. 2000;6:2690–2695 [5.32] Gerber H.P., Ferrara N., Pharmacology and pharmacodynamics of bevacizumab as monotherapy or in combination with cytotoxic therapy in preclinical studies, Cancer Res. 65 (2005) 671–680. [5.33] Glaxo Welcome. Navelbine product monograph. Mississauga: Ontario; 29 October 1998 [5.34] Gottifredi V, Prives C: The S phase checkpoint: when the crowd meets at the fork. Semin Cell Dev Biol 2005, 16:355-368.

p-medicine – Grant Agreement no. 270089
D12.1 –Architecture and information flow diagrams of the Oncosimulator and the biomechanism models
Page 71 of 86
[5.35] Goldstein M, Roos W, Kaina B (2008). Apoptotic death induced by the cyclophosphamide analogue mafosfamide in human lymphoblastoid cells: contribution of DNA replication, transcription inhibition.and Chk/p53 signaling. Toxicol Appl Pharmacol 229 (1): 20–32. [5.36] Gregory RK, Smith IE. Vinorelbine a clinical review. Br J Cancer 2000;82:1907±13. [5.37] Grem, J. L. 5-Fluorouracil: forty-plus and still ticking. A review of its preclinical and clinical development. Invest New Drugs 2000, 18, 299-313 [5.38] Gridelli C, Frontini L, Perrone F, Gallo C, Gulisano M, Cigolari S, et al. Gemcitabine plus Vinorelbine in advanced non-small cell lung cancer: a phase II study of three different doses. Gem Vin Investigators. Br J Cancer 2000;83:707–14. [5.39] Gustafson, D. L.; Long, M. E.; Zirrolli, J. A.; Duncan, M. W.; Holden, S. N.; Pierson, A. S.; Eckhardt, S. G. Analysis of docetaxel pharmacokinetics in humans with the inclusion of later sampling time-points afforded by the use of a sensitive tandem LCMS assay, Cancer Chemother Pharmacol (2003) 52: 159–166 DOI 10.1007/s00280-003-0622-z [5.40] Harries M, Smith I. The development and clinical use of trastuzumab (Herceptin) Endocrine-Related Cancer. 2002;9:75–85. [5.41] Hassan, M., Svensson, U.S., Ljungman, P., Bjorkstrand, B., Olsson, H., Bielenstein, M., Abdel-Rehim, M., Nilsson, C., Johansson, M., Karlsson, M.O., 1999. A mechanism-based pharmacokinetic–enzyme endogenous compounds. In: Bioequivalence or Biocomparability of model for cyclophosphamide autoinduction in breast cancer patients. Complex Molecules, September 14–15, Toronto, Canada. Br. J. Clin. Pharmacol. 48, 669–677 [5.42] Heggie GD, Sommadossi PJ, Cross DS, Huster WJ, Diasio RB (1987) Clinical pharmacokinetics of 5-fluorouracil and its metabolites in plasma, urine and bile. Cancer Res 47:2203 [5.43] Herbst, Roy S. and Khuri, Fadlo R., Mode of action of docetaxel – a basis for combination with novel anticancer agents, CANCER TREATMENT REVIEWS 2003; 29: 407–415 [5.44] Hernández-Vargas H, Palacios J, Moreno-Bueno G. Telling cells how to die: docetaxel therapy in cancer cell lines. Cell Cycle 2007; 6: 780-3. [5.45] Hill BT and Whelan RDH. A comparison of the lethal and kinetic effects of doxorubicin and 4’-epidoxorubicin in vitro. Tumouri. 68: 29-37, 1982 [5.46] Homsi, J.; Daud, A.I. Spectrum of Activity and Mechanism of Action of VEGF/PDGF Inhibitors, Cancer Control, 2007, 14, 285. [5.47] Inai T, Mancuso M, Hashizume H et al (2004) Inhibition of vascular endothelial growth factor (VEGF) signaling in cancer causes loss of endothelial fenestrations, regression of tumor vessels, and appearance of basement membrane ghosts. Am J Pathol 165:35–52 [5.48] Jakobsen P, Bastholt L, Dalmark M, et al: A randomized study of epirubicin at four different dose levels in advanced breast cancer. Feasibility of myelotoxicity prediction through single bloodsample measurement. Cancer Chemother Pharmacol 28:465-469, 1991 [5.49] Jain, R.K. (1987) Transport of molecules in the tumour interstitium: a review. Cancer Res. 47(12), 3039-3051. [5.50] Jain, R.K. (1988) Determinants of tumour blood flow: a review. Cancer Res. 48(10), 2641-2658. [5.51] Jain, R., Duda, D., Batchelor, T., Willett, C. (2008). Normalization of Tumour Vasculature and Microenvironment. In: Teicher, B. A. and Ellis L. M. Antiangiogenic Agents in Cancer Therapy Cancer Drug Discovery and Development. Totowa: Springer. p273-281.

p-medicine – Grant Agreement no. 270089
D12.1 –Architecture and information flow diagrams of the Oncosimulator and the biomechanism models
Page 72 of 86
[5.52] Kastan MB, Bartek J: Cell-cycle checkpoints and cancer. Nature 2004, 432:316-323. [5.53] Kim KJ, Li B, Winer J, et al. Inhibition of vascular endothelial growth factor-induced angiogenesis suppresses tumor growth in vivo . Nature 1993;362:841–4. [5.54] Kugawa F., Ueno A., Kawasaki M., Aoki M., Biol. Pharm. Bull., 27, 392—398 (2004). [5.55] Larsson, P.A., Carlsson, G., Gustavsson, B., Graf, W. and Glimelius, B., Different intravenous administration techniques for 5-fluorouracil. Pharmacokinetics and pharmacodynamic effects, Acta Oncol, 35(2), 207-12, 1996. [5.56] Longley, D. B.; Latif, T.; Boyer, J.; Allen, W. L.; Maxwell, P. J.; Johnston, P. G. The interaction of thymidylate synthase expression with p53-regulated signaling pathways in tumour cells. Semin.Oncol. 2003, 30, 3-9. [5.57] Lorusso Vito, Bevacizumab in the treatment of HER2-negative breast cancer, Biologics. 2008 December; 2(4): 813–821. [5.58] Lu Jian-Feng, Rene Bruno, Steve Eppler, William Novotny, Bert Lum, Jacques Gaudreault, Clinical pharmacokinetics of bevacizumab in patients with solid tumours, Cancer Chemother Pharmacol (2008) 62:779–786 [5.59] Manley PW, Martiny-Baron G, Schlaeppi JM, et al. 2002. Therapies directed at vascular endothelial growth factor. Expert Opin Invest Drugs, 11:1715–36. [5.60] D. Marme, N. Fusenig, Tumor Angiogenesis - Basic mechanisms and Cancer Therapy, Springer Verlag 2008 [5.61] Marrs J, Zubal BA, Oncology nursing in a new era: optimizing treatment with bevacizumab, Clin J Oncol Nurs. 2009 Oct;13(5):564-72. [5.62] Marquet P, Lachetre G, Debord J, Eichler B, Bonnaud F and Nicot G (1992) Pharmacokinetics of vinorelbine in man. Eur J Clin Pharmacol 42: 545–547 [5.63] McCune Jeannine S, Salinger David H, Vicini Paolo, Oglesby Celeste, Blough David K. and Park Julie R,Population pharmacokinetics of cyclophosphamide and metabolites in children with neuroblastoma: a report from the children's oncology group, J Clin Pharmacol 49:88 (2009) PMID 18927240 [5.64] McLeod H. L., Kearns C. M., Kuhn J. G., Bruno R. Evaluation of the linearity of docetaxel pharmacokinetics. Cancer Chemother. Pharmacol., 42: 155-159, 1998. [5.65] Mei DONG, Feng yi , Qiang FU, et al Department of Medical Oncology, Cancer Hospital, Chinese Academy of Medical Science, Beijing 100021, P R China Pharmacy Research, PUMC Hospital, Beijing 100730, P R China;Pharmacokinetics and pharmacodynamics study of high dose epirubicin in cancer patients [J];Chinese Journal of Cancer;2000-04 [5.66] Müller M, Mader RM, Steiner B, Steger GG, Jansen B, Gnant M, et al. 5Fluorouracil kinetics in the interstitial tumour space: clinical response in breast cancer patients. Cancer Res 1997;57:2598601. [5.67] Nguyen L, Tranchand B, Puozzo C, et al: Population pharmacokinetics model and limited sampling strategy for intravenous vinorelbine derived from Phase I clinical trials. Br J Clin Pharmacol 53:459–468, 2002 [5.68] Ohta I, Gorai I, Miyamoto Y, Yang J, Zheng JH, Kawata N, Hirahura F et al.: Cyclophosphamide and 5- fluorouracil act synergistically in ovarian clear cell adenocarcinoma cells. Cancer Lett, 2001, 162, 39–48. [5.69] Parker, W. B.; Cheng, Y. C. Metabolism and mechanism of action of 5-fluorouracil. Pharmacol. Ther. 1990, 48, 381-395.

p-medicine – Grant Agreement no. 270089
D12.1 –Architecture and information flow diagrams of the Oncosimulator and the biomechanism models
Page 73 of 86
[5.70] Peters GJ, van Triest B, Backus HH, Kuiper CM, van der Wilt CL, Pinedo HM: Molecular downstream events and induction of thymidylate synthase in mutant and wild-type p53 colon cancer cell lines after treatment with 5-fluorouracil and the thymidylate synthase inhibitor raltitrexed. Eur J Cancer 2000, 36:916-924. [5.71] Reigner B., Blesch K., and Weidekamm E.. Clinical pharmacokinetics of capecitabine. Clin. Pharmacokin. 40:85–104 (2001). [5.72] Rezai K, Urien S, Isambert N, Roche H, Dieras V, Berille J, Bonneterre J, Brain E, Lokiec F, Pharmacokinetic evaluation of the vinorelbine-lapatinib combination in the treatment of breast cancer patients, Cancer Chemother Pharmacol. 2011 Apr 26. [5.73] Robert J. Clinical pharmacokinetics of epirubicin. Clin Pharmacokinet 1994;26:428–38 [5.74] Saito H, Tsujitani S, Ikeguchi M, Maeta M, Kaibara N. Relationship between the expression of vascular endothelial growth factor and the density of dendritic cells in gastric adenocarcinoma tissue. Br J Cancer 1998;78:1573–7. [5.75] Samant RS, Shevde LA, Recent advances in anti-angiogenic therapy of cancer, Oncotarget. 2011 Mar;2(3):122-34. [5.76] Sandstrom M., Lindman H., Nygren P., Johansson M., Bergh J., Karlsson M.O., Population analysis of the pharmacokinetics and the haematological toxicity of the fluorouracil epirubicin cyclophosphamide regimen in breast cancer patients, Cancer Chemother Pharmacol 58 (2) (2006) 143–156. [5.77] Sato, Y., Persistent vascular normalization as an alternative goal of anti-angiogenic cancer therapy, Cancer Sci, July 2011, vol. 102, no. 7, 1253–1256 [5.78] Scientific discussion, EMEA 2005, http://www.ema.europa.eu/docs/en_GB/document_library/EPAR_-_Scientific_Discussion/human/000316/WC500058145.pdf [5.79] Shih T and Lindley C (2006) Bevacizumab: an angiogenesis inhibitor for the treatment of solid malignancies. Clin Ther 28: 1779–1802 [5.80] Siegel-Lakhai WS, Zandvliet AS, Huitema AD, et al. A dose escalation study of indisulam in combination with capecitabine (Xeloda) in patients with solid tumours. Br J Cancer 2008;98(8):1320–6. [5.81] Sladek NE, Metabolism of oxazaphosphorines. Pharmacol Ther 1988; 37: 301-55 [5.82] Slaviero KA, Clarke SJ, McLachlan AJ, et al., (2004) Population pharmacokinetics of weekly docetaxel in patients with advanced cancer. Br J Clin Pharmacol 57:44–53. [5.83] Sweeney CJ, Miller KD, Sissons SE, et al. The antiangiogenic property of docetaxel is synergistic with a recombinant humanized monoclonal antibody against vascular endothelial growth factor or 2-methoxyestradiol but antagonized by endothelial growth factors. Cancer Res 2001; 61: 3369–3372. [5.84] Swierniak A., Kimmel M., Smieja J., Mathematical modeling as a tool for planning anticancer therapy, European Journal of Pharmacology, 625 (2009) 108-121. [5.85] Ternant D, Cιzι N, Lecomte T, Degenne D, Duveau AC, Watier H, Dorval E, Paintaud G., An Enzyme-Linked Immunosorbent Assay to Study Bevacizumab Pharmacokinetics, Therapeutic Drug Monitoring, October 2010 - Volume 32 - Issue 5 - pp 647-652 [5.86] Tobelem G, VEGF: a key therapeutic target for the treatment of cancer-insights into its role and pharmacological inhibition, Targ Oncol, 2007; 2:153–164

p-medicine – Grant Agreement no. 270089
D12.1 –Architecture and information flow diagrams of the Oncosimulator and the biomechanism models
Page 74 of 86
[5.87] Turk JL, Poulter LW: Effects of cyclophosphamide on lymphoid tissue labelled with UDR and CI. Int Arch Allergy Appl Immunol 43:620-629, 1972. [5.88] Ulakoglu G & Altun S (2004) The effects of epirubicin on proliferation and DNA synthesis of Ehrlich ascites carcinoma cells in vitro and in vivo., Biologia, Bratislava 59(6): 727—734. [5.89] Urien S, Rezai K, Lokiec F. Pharmacokinetic modelling of 5- FU production from capecitabine – a population study in 40 adult patients with metastatic cancer. J Pharmacokinet Pharmacodyn 2005;32:817–33. [5.90] Valabrega G, Montemurro F, Aglietta M. Trastuzumab: mechanism of action, resistance and future perspectives in HER2- overexpressing breast cancer. Ann Oncol 2007;1:17. [5.91] Wade JR, Kelman AW, Kerr DJ, Robert J, Whiting B. Variability in the pharmacokinetics of epirubicin: a population analysis. Cancer Chemother Pharmacol. 1992;29(5):391–395. [5.92] Wagner JG (1993) Noncompartmental and system analysis. In: Pharmacokinetics for the pharmaceutical scientist. Technomic Publishing Company, Lancaster, PA, p 83 [5.93] Walko C.M. and Lindley C., Capecitabine: a review, Clin Ther 27 (2005), pp. 23–44 [5.94] Wang Q, Wieder R, All-trans retinoic acid potentiates Taxotere- induced cell death mediated by Jun N-terminal kinase in breast cancer cells. Oncogene 2004, 23:426-433 [5.95] Washington C.B., Lieberman G., Liu P., Fox J.A., Bruno R. A population pharmacokinetic model for trastuzumab following weekly dosing. Clin. Pharmacol. Ther., 71(2), P12 (abstract MPI-30), 2002 [5.96] Wildiers H, Guetens G, De Boeck G et al (2003) Effect of antivascular endothelial growth factor treatment on the intratumoral uptake of CPT-11. Br J Cancer 88:1979–1986 [5.97] Willett CG, Boucher Y, di Tomaso E et al (2004) Direct evidence that the VEGF-specific antibody bevacizumab has antivascular effects in human rectal cancer. Nat Med 10:145–147 [5.98] Yuan F, Chen Y, Dellian M, Safabakhsh N, Ferrara N, Jain RK (1996) Time-dependent vascular regression and permeability changes in established human tumor xenografts induced by an anti-vascular endothelial growth factor/vascular permeability factor antibody. Proc Natl Acad Sci U S A 93:14765–14770 [5.99] Zhang, N.; Yin, Y.; Xu, S.-J.; Chen, W.-S. 5-fluorouracil: mechanisms of resistance and reversal strategies. Molecules 2008, 13, 1551-1569. [5.100] Zhu A, Holalkere N, Norden-Zfoni A, Muzikansky A, Heymach J, Sahani D (2006) Changes in computed tomography perfusion scan parameters and circulating endothelial cells following bevacizumab administration in patients with advanced hepatocellular carcinoma. Eur J Cancer Suppl 4:20 (abstract 54) phase II
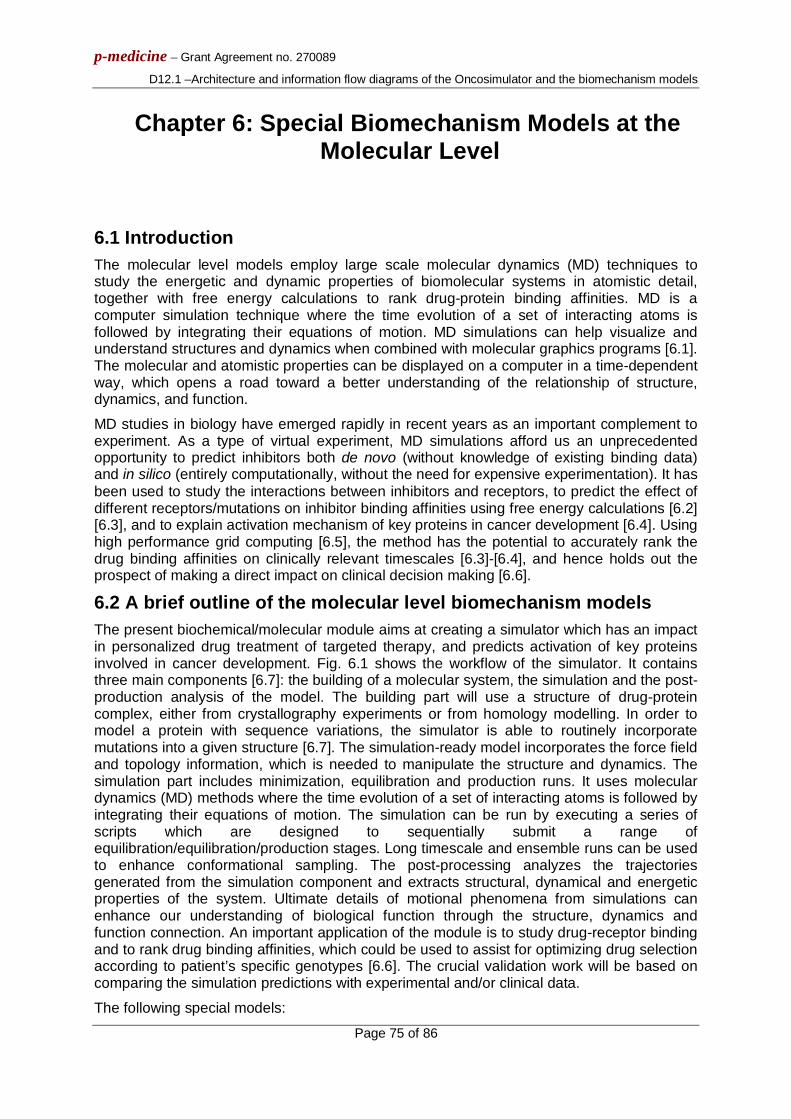
p-medicine – Grant Agreement no. 270089
D12.1 –Architecture and information flow diagrams of the Oncosimulator and the biomechanism models
Page 75 of 86
Chapter 6: Special Biomechanism Models at the Molecular Level
6.1 Introduction
The molecular level models employ large scale molecular dynamics (MD) techniques to study the energetic and dynamic properties of biomolecular systems in atomistic detail, together with free energy calculations to rank drug-protein binding affinities. MD is a computer simulation technique where the time evolution of a set of interacting atoms is followed by integrating their equations of motion. MD simulations can help visualize and understand structures and dynamics when combined with molecular graphics programs [6.1]. The molecular and atomistic properties can be displayed on a computer in a time-dependent way, which opens a road toward a better understanding of the relationship of structure, dynamics, and function.
MD studies in biology have emerged rapidly in recent years as an important complement to experiment. As a type of virtual experiment, MD simulations afford us an unprecedented opportunity to predict inhibitors both de novo (without knowledge of existing binding data) and in silico (entirely computationally, without the need for expensive experimentation). It has been used to study the interactions between inhibitors and receptors, to predict the effect of different receptors/mutations on inhibitor binding affinities using free energy calculations [6.2] [6.3], and to explain activation mechanism of key proteins in cancer development [6.4]. Using high performance grid computing [6.5], the method has the potential to accurately rank the drug binding affinities on clinically relevant timescales [6.3]-[6.4], and hence holds out the prospect of making a direct impact on clinical decision making [6.6].
6.2 A brief outline of the molecular level biomechanism models
The present biochemical/molecular module aims at creating a simulator which has an impact in personalized drug treatment of targeted therapy, and predicts activation of key proteins involved in cancer development. Fig. 6.1 shows the workflow of the simulator. It contains three main components [6.7]: the building of a molecular system, the simulation and the post-production analysis of the model. The building part will use a structure of drug-protein complex, either from crystallography experiments or from homology modelling. In order to model a protein with sequence variations, the simulator is able to routinely incorporate mutations into a given structure [6.7]. The simulation-ready model incorporates the force field and topology information, which is needed to manipulate the structure and dynamics. The simulation part includes minimization, equilibration and production runs. It uses molecular dynamics (MD) methods where the time evolution of a set of interacting atoms is followed by integrating their equations of motion. The simulation can be run by executing a series of scripts which are designed to sequentially submit a range of equilibration/equilibration/production stages. Long timescale and ensemble runs can be used to enhance conformational sampling. The post-processing analyzes the trajectories generated from the simulation component and extracts structural, dynamical and energetic properties of the system. Ultimate details of motional phenomena from simulations can enhance our understanding of biological function through the structure, dynamics and function connection. An important application of the module is to study drug-receptor binding and to rank drug binding affinities, which could be used to assist for optimizing drug selection according to patient’s specific genotypes [6.6]. The crucial validation work will be based on comparing the simulation predictions with experimental and/or clinical data.
The following special models:

p-medicine – Grant Agreement no. 270089
D12.1 –Architecture and information flow diagrams of the Oncosimulator and the biomechanism models
Page 76 of 86
i. a molecular level model for inhibitor-kinase,
ii. a molecular level model for inhibitor-tubulin,
iii. a model of microtubule stability,
iv. a DNA-intercalation model,
are all molecular level simulation models and have the same gross level design and flow diagrams. The inputs for the models are:
the structures of proteins either from protein data bank (PDB, http://www.rcsb.org/pdb) or from homology modeling,
the force field and residue topology file from molecular dynamics simulation packages,
and the mutation status from experiments or clinicians.
The output will be structural, energetic and dynamic properties, which can be compared with experimental and/or clinical output.
Fig. 6.1 Flow diagram of the special biomechanism simulator at the molecular level of biocomplexity

p-medicine – Grant Agreement no. 270089
D12.1 –Architecture and information flow diagrams of the Oncosimulator and the biomechanism models
Page 77 of 86
6.3 REFERENCES
[6.1] S. Wan, P. V. Coveney, D. R. Flower, "Molecular dynamics simulations: bring biomolecular structures alive on a computer", Methods Mol Biol. 409, 321-39, 2007.
[6.2] S. Wan, P. V. Coveney, "Rapid and accurate ranking of binding affinities of epidermal growth factor receptor sequences with selected lung cancer drugs", J. R. Soc. Interface, 8(61), 1114-1127, 2011.
[6.3] I. Stoica, S. K. Sadiq, and P. V. Coveney, "Rapid and Accurate Prediction of Binding Free Energies for Saquinavir-Bound HIV-1 Proteases", J. Am. Chem. Soc. 130(8), 2639-2648, 2008.
[6.4] S. Wan and P. V. Coveney, "Molecular Dynamics Simulation Reveals Structural and Thermodynamic Features of Kinase Activation by Cancer Mutations within the Epidermal Growth Factor Receptor", J. Comput. Chem., (2011), Published Online, DOI: 10.1002/jcc.21866
[6.5] R. S. Saksena, B. Boghosian, L. Fazendeiro, O. A. Kenway, S. Manos, M. D. Mazzeo, S. K. Sadiq, J. L. Suter, D. Wright, and P. V. Coveney, "Real Science at the Petascale", Philosophical Transactions of the Royal Society A, 367(1897), 2557-2571, 2009.
[6.6] S. K. Sadiq, M. D. Mazzeo, S. J. Zasada, S. Manos, I. Stoica, C. V. Gale, S. J. Watson, P. Kellam, S. Brew, and P. V. Coveney, "Patient-specific simulation as a basis for clinical decision-making", Philosophical Transactions of the Royal Society A: Mathematical, Physical and Engineering Sciences, 366(1878), 3199-3219, 2008.
[6.7] S. K. Sadiq, D. Wright, S. J. Watson, S. J. Zasada, I. Stoica, Ileana, and P. V. Coveney, "Automated Molecular Simulation-Based Binding Affinity Calculator for Ligand-Bound HIV-1 Proteases", Journal of Chemical Information and Modeling, 48(9), 1909-1919, 2008.

p-medicine – Grant Agreement no. 270089
D12.1 –Architecture and information flow diagrams of the Oncosimulator and the biomechanism models
Page 78 of 86
Chapter 7: Special Biomechanism Models at the Cellular Level 7.1 Tumour-immune system interplay 7.1.1 Introduction Puzzling outcomes of preclinical studies and clinical trials of immunotherapies might be linked to the general mechanisms that, in the absence of therapies, enable the evasion of tumours from the control of the immune system. Among these, the evolutionary ones are being investigated. We developed preliminary models (Al Taameni et al. 2011, d’Onofrio and Ciancio, 2011) which have provided the basis for the special biomechanism models at the cellular level. 7.1.2 Biological and clinical background Tumour cells (TCs) are characterized by a vast number of genetic and epigenetic events leading to the appearance of specific antigens (e.g. mutated proteins, under/overexpressed normal proteins and many others) triggering reactions by both the innate and adaptive immune system (IS). These observations have provided a theoretical basis to the old empirical hypothesis of immune surveillance, i.e. that the IS may act to eliminate tumours (Ehrlich 1909; Dunn et al, 2004), only recently experimentally and epidemiologically confirmed. Obviously the competitive interaction between TCs and the IS involves a considerable number of events and molecules, and as such it is extremely complex. Thus, the kinetics of the interplay between TCs and IS is strongly non-linear. Moreover, to fully describe the immuno-oncologic dynamics, one has to take into account a range of spatial phenomena. Indeed, the TC-IS interplay is strongly shaped by the spatial mobility of both TCs and IS effectors. Indeed, apart from the random motion of both type of cells, a prominent role is played by chemoattraction of IS effectors towards the TCs. Indeed, chemotactic motion of immune system cells is a landmark of the defense of human body against non-self agents, including tumours, since cells belonging to both innate and adaptive immunity are able to reach their targets thanks to the gradients of various kinds of chemicals, e.g. inflammation-related substances produced by tumour cells. Thus, such chemotaxis is of paramount importance in the interplay between tumours and the immune system, since it allows the control of tumour growth and also the immune surveillance. However, besides temporal and spatial non-linearities, another important point to stress is that the structure of the above-mentioned interactions is also characterized by a series of evolutionary phenomena. As it is well known, the IS is not in all cases able to eliminate a neoplasm, which may escape from IS control. In other cases, a dynamic equilibrium may also be established, such that the tumour may survive in a microscopic dormant state, which is undetectable by diagnostic equipment. This was largely inferred from clinical data, but recently Koebel and colleagues (Koebel et al 2007) were able to experimentally show, through an ad hoc mouse model, that adaptive immunity can mantain occult cancer in an equilibrium state. It is quite intuitive that this equilibrium can be disrupted by sudden events. Indeed, if disease-related impairments of innate and adaptive immune systems, or immuno-suppressive treatments preceding organ transplantations, occur then tumour restart developing. This has been shown both by mouse models and through epidemiologic studies. However, there is a major class of causes of disruption of the equilibrium that are not related to immuno-suppression. Indeed, over a long period of time, the neoplasm may develop multiple

p-medicine – Grant Agreement no. 270089
D12.1 –Architecture and information flow diagrams of the Oncosimulator and the biomechanism models
Page 79 of 86
strategies to circumvent the action of the IS, which may allow it to re-commence growing into clinically apparent tumours, which theoretically can reach their carrying capacity. From an ecological point of view, it might be said that the tumour has adapted itself to survive in a hostile environment, in which the anti-tumour immune response is activated. For example, the tumour may develop mechanisms to spread by reducing its immunogenicity. In other words the immunogenic phenotype of the tumour is 'sculpted' by the interaction with the IS of the host. For this reason, the theory of interaction between a tumour and the IS has been called immuno-editing theory. An impressive body of research is accumulating on the immunoevasive strategies, and many recent works have been devoted to some aspects of this fascinating subject, and to its close relationships on the effectiveness of immunotherapies. 7.1.3 Implications for planning immunotherapies The immunoevasive strategies above illustrated continue to hold also in the case where the dormant state of a tumour has been induced by the reinforcement of the immune system reaction, due to the delivery of an immunotherapy. In this case, the evasion causes a tumour relapse. Thus, it is believed that both the experimental results concerning immunoevasion of tumours and theoretical findings that are proposed might have interesting clinical implications. More generally, the opinion of (Zitvogel et al. 2006) is shared, according to which recent progresses in immuno-oncology has not influenced the way anticancer therapies are conceived and applied in clinics. The preliminary models to be described have to be understood as a detailed modelling of a possible mechanism that might enact tumour cells to evade from the control of adaptive immunity at the population kinetics level. Various specific (and tumour-dependent) strategies deployed by those cells, in order to reach their aim, are phenomenologically described by means of the model of the dependence of the various parameters on the classes of tumour cells. This is only an initial step of a research effort for a more complete description of tumour relapse under immunotherapies in the broader framework of the Oncosimulator. The latter will include the modelling of some specific evasion strategies. Indeed, given the complex network of interplaying between inter-cellular and intra-cellular signalling, and the various temporal scales (from the rapid dynamics of involved intracellular pathways to the relatively slow growth of a tumour to finish with sometimes slow and sometimes fast onset of immunoevasion) as well as the spatial ones (from the cells to visible neoplasms) a more detailed model will have to be multiscale one. The latter will involve a wide range of computational tools spanning from those typical to computational biology and bioinformatics to more classical analytical and numerical methods of statistical mechanics and mathematical physics 7.1.4 Computational background and basics As far as the mathematical description of the tumour and the immune system interaction is concerned, only a limited number of efforts have focused on the spatial aspects of the immunoncological interaction. Chaplain and coworkers (Matzavinos et al 2004) proposed a spatiotemporal model of tumour - cytotoxic T lymphocytes (CTLs) interaction by including spatial motility of both tumour and CTLs effectors, as well as chemotactic motion of immune effectors. They mainly focused on the role of the immune system in determining tumour dormant states by showing through a series of simulations that a dormant state is reached but the tumour cells are spatially distributed in an irregular pattern. Based on the suggestion that the immune system has the ability of sculpting the phenotype of a tumour made by Dunn and co-workers (Dunn et al. 2004), a cell-centered semi-

p-medicine – Grant Agreement no. 270089
D12.1 –Architecture and information flow diagrams of the Oncosimulator and the biomechanism models
Page 80 of 86
mechanistic approach aimed at describing a possible immunologically realistic kinetic mechanism through which the immuno-evasion onsets has been developed. Since there is strong experimental evidence that the type, the density and the location of cytotoxic T lymphocites are predictive of the clinical outcome of some relevant neoplasias and since a long temporal interval is of interest in the present context, the interplay of a neoplasm with CTLs is being dealt with. In the proposed model, it is assumed that tumour cells that survive following the attack of cytotoxic T-lymphocites have a probability of acquiring a phenotype through mutations or even by epigenetic changes that is more resistant to future attacks by CTLs. In turn at each new encounter with a CTL this resistance can further increase and after a finite number of encounters a complete or maximal resistance to specific immunity is acquired. Moreover, specific spatial effects might be linked to immunoevasion of neoplasms. Indeed, recently Vianello and colleagues (Vianello et al 2006) experimentally showed that tumour cells can produce chemicals that act as chemorepellers for CTLs. Those experimental findings will be integrated into the model under development by providing that within the range of features defining the increasingly resistant TC phenotypes an increasing ability of producing such chemorepulsive substances is included. These two bio-theoretical hypotheses, although new, are in line with the general schema of tumour escape from the immune response. Indeed, as stressed in (Stewart and Abrams 2008), tumour cells may escape from immune control through two general paradigms: (a) mechanisms that involve the secretion of soluble factors; (b) mechanisms that are dependent on the contact between the tumour cells and the effectors and that aim at reducing antigen recognition/adhesion and apoptotic resistance. Based on the current experimental knowledge, apart from their mitogenic action the above mentioned factors primarily aim at inducing the emergence of immunosuppressive networks. In the biotheoretical model under development and in line with the animal model proposed by (Vianello et al, 2006) the factors are chemicals repelling CTLs. However, the production of different factors increasing for example the apoptotic rate of CTLs will be included. Within the framework of modelling a biological setting where immuno-evasion of the tumour is not considered, the interplay between tumour cells and tumour infiltrating cytotoxic T lymphocytes in the absence of immunoevasive mechanisms has been modeled (Matzavinos et al 2004). According to them
complexes composed by a tumour cell and a CTL form at a rate k+, which embeds the encounter rate between a tumour cell and a CTL times the probability that the CTL recognizes the TC as a nonself entity
dissolution of complexes leads to a state where both the tumour and the CTL cells are alive with a rate k-
dissolution of complexes leads to a state where either the tumour cell or the immune cell is alive with rates k(1-p) and kp, respectively, where p is the probability that the tumour cell is killed.
The above kinetics are graphically summarized in figure 7.1, where: E denotes the density of alive CTLs, T the density of alive tumour cells, C the density of complexes T-CTL, T* the density of lethally hit tumour cells, E * te denisty of lethally hit CTLs.
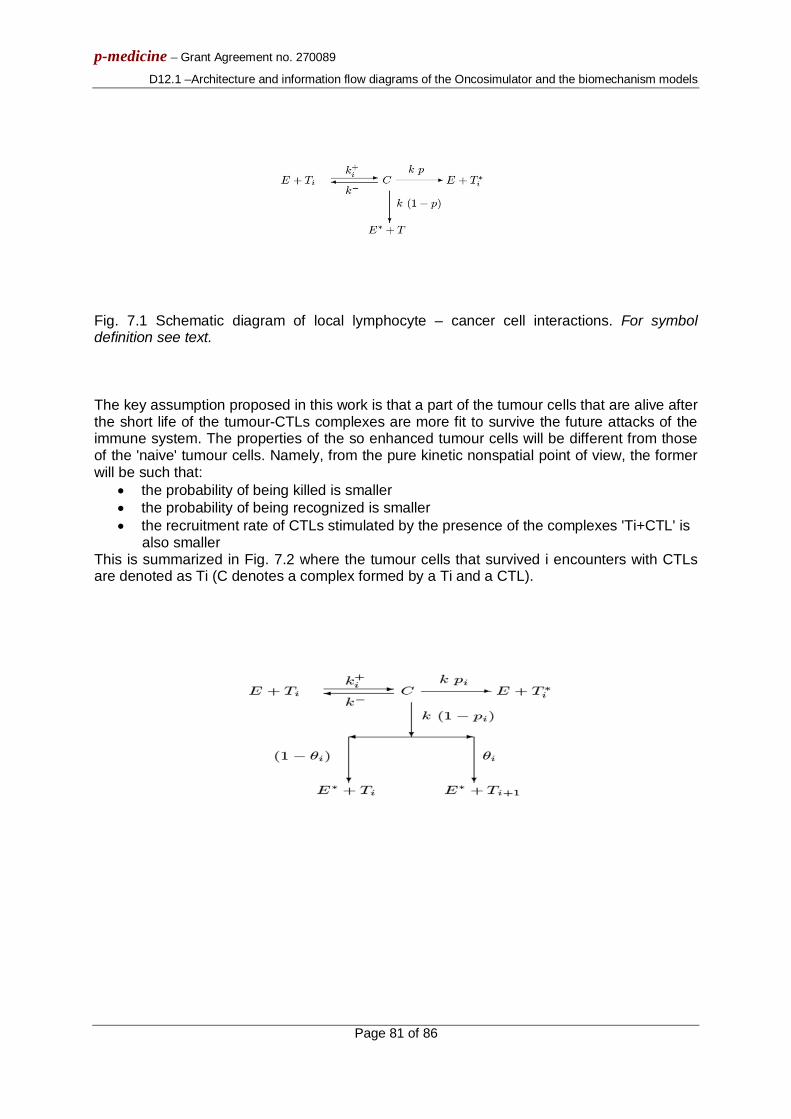
p-medicine – Grant Agreement no. 270089
D12.1 –Architecture and information flow diagrams of the Oncosimulator and the biomechanism models
Page 81 of 86
Fig. 7.1 Schematic diagram of local lymphocyte – cancer cell interactions. For symbol definition see text. The key assumption proposed in this work is that a part of the tumour cells that are alive after the short life of the tumour-CTLs complexes are more fit to survive the future attacks of the immune system. The properties of the so enhanced tumour cells will be different from those of the 'naive' tumour cells. Namely, from the pure kinetic nonspatial point of view, the former will be such that:
the probability of being killed is smaller the probability of being recognized is smaller the recruitment rate of CTLs stimulated by the presence of the complexes 'Ti+CTL' is
also smaller This is summarized in Fig. 7.2 where the tumour cells that survived i encounters with CTLs are denoted as Ti (C denotes a complex formed by a Ti and a CTL).
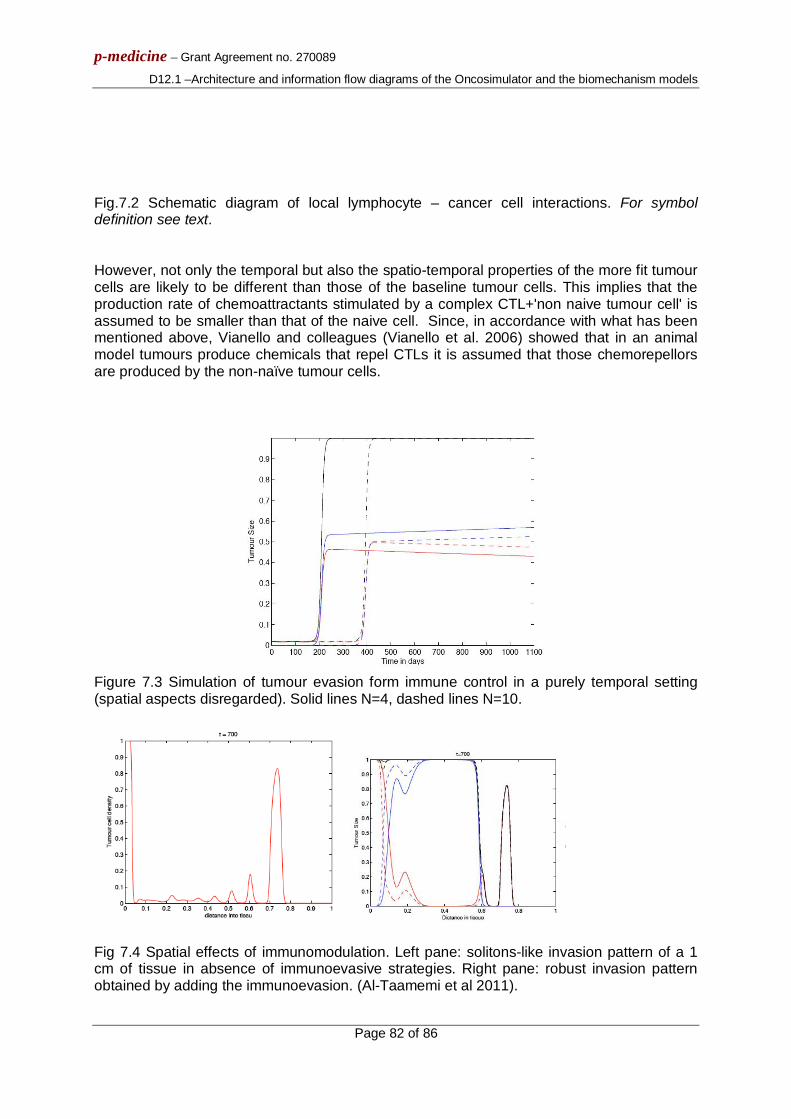
p-medicine – Grant Agreement no. 270089
D12.1 –Architecture and information flow diagrams of the Oncosimulator and the biomechanism models
Page 82 of 86
Fig.7.2 Schematic diagram of local lymphocyte – cancer cell interactions. For symbol definition see text. However, not only the temporal but also the spatio-temporal properties of the more fit tumour cells are likely to be different than those of the baseline tumour cells. This implies that the production rate of chemoattractants stimulated by a complex CTL+'non naive tumour cell' is assumed to be smaller than that of the naive cell. Since, in accordance with what has been mentioned above, Vianello and colleagues (Vianello et al. 2006) showed that in an animal model tumours produce chemicals that repel CTLs it is assumed that those chemorepellors are produced by the non-naïve tumour cells.
Figure 7.3 Simulation of tumour evasion form immune control in a purely temporal setting (spatial aspects disregarded). Solid lines N=4, dashed lines N=10.
Fig 7.4 Spatial effects of immunomodulation. Left pane: solitons-like invasion pattern of a 1 cm of tissue in absence of immunoevasive strategies. Right pane: robust invasion pattern obtained by adding the immunoevasion. (Al-Taamemi et al 2011).

p-medicine – Grant Agreement no. 270089
D12.1 –Architecture and information flow diagrams of the Oncosimulator and the biomechanism models
Page 83 of 86
It is explicitly noted that such increased resistance is genetic or epigenetic. From a kinetic point of view, this is indifferent. However, in order to experimentally validate the hypothesis such a distinction would be of paramount importance. Recently performed simulations suggest that the proposed mechanism is able to mimic various aspects of the dynamics of immunoevasion during the lifespan of a mouse or of another host organism. The differential spatiotemporal contribution to evasion due to (i) the decrease of the probability pi of being lethally hit and (ii) the decrease of the probability that a tumour cell is recognized by a TICTL has also been highlighted. Additionally, a simplified model with a slightly different behaviour where the information acquired by TCs that survived the formation of complexes with CTLs is transferred to other cells of the neoplasm thourgh intercellular signaling has been recently proposed (A. d’Onofrio and A. Ciancio, 2011). Assuming that the diffusion of the signaling factors is small with respect to the dynamics of TCs and CTLs it has been theoretically observed that the evolution of the killing rate p(t) and other key parameters can be modeled as an imitation game. 7.2 Computational model of the role of p53 in governing the polarization of Tumour Stem Cells Gene p53 is of paramount importance because of its role as oncosuppressor. Until recently, it was believed that its main onco-preventive action was due to its role in tightly maintaining the probability of apoptotic cells sufficiently large in order to guarantee, at the population level, the homeostasis of tissues. Other functions of p53 strictly related to aptoptosis involve DNA repair, cell cycle arrest and cell senescence. The downregulation or complete suppression of p53 invariably leads to a decrease of the apoptotic rate and, as a consequence, to tumourigenesis. Recently, at IEO a novel and rather unexpected role for p53 has been shown (Cicalese et al 2009): p53 controls the polarization of stem cells in breast cancer. Breast stem cells with a normal amount of p53 protein normally divide asymmetrically (i.e. the two daughter cells are different, one remaining stem cell, the other being a progenitor cell), whereas stem cells in which p53 has been suppressed tend to divide symmetrically (i.e. both daughter cells are stem cells) and form tumour both in vivo and in vitro. Moreover, it has been shown that cells with low levels of p53 that are treated with the drug Nutlin, which increases the levels of p53 by binding to its inhibitor MDM2, restart dividing asymmetrically. In the framework of p-medicine WP12, computational models of both the basic mechanisms that allow p53 to control the symmetry of the cell division process and of drug-driven restauration of normal p53 levels will be developed. In this initial phase, a review of the extensive literature concerning several possible biophysical mechanisms that may induce the breaking of cellular symmetry (Turing bifurcations, Wave-pinning-like mechanism etc) for both the case of spontaneous and signal-induced breaking is being conducted. As far as treatment with Nutlin is concerned, the possibility of including mechanisms of Nutlin binding to MDM2 in some pre-validated mathematical models that appeared in literature in recent years (Ciliberto et al., 2005; Puszynsky et al, 2009; Hunziker et al., 2010) is being explored. 7.3 REFERENCES

p-medicine – Grant Agreement no. 270089
D12.1 –Architecture and information flow diagrams of the Oncosimulator and the biomechanism models
Page 84 of 86
[7.1] M. Al Taamemi, M. Chaplain and A. d’Onofrio, Evasion of tumors from the control of the immune system: a consequence of a brief encounter ?Submitted to J. Theor. Biol. , 2011 [7.2] A. d’Onofrio and Ciancio, A simple biphysical model of evasion of tumors form immune sruveillance. Submitted to Phys. Rev. E, 2011 [7.3] G.P. Dunn, L.J. Old, R. D. Schreiber, The three Es of immunoediting, Ann. Rev. of Immun. 22 (2004) 322 [7.4] P. Ehrlich, Ueber den jetzigen stand der karzinomforschung, Ned. Tijdschr. Geneeskd. 5 (1909) 273 [7.5] C.M. Koebel, W. Vermi, J. B. Swann, N. Zerafa, S. J. Rodig, L. J. Old, M. J. Smyth and R. D. Schreiber, Adaptive immunity maintains occult cancer in an equilibrium state, Nature 450 (2007) 9003 [7.6] L. Zitvogel, A. Tesniere and G. Kroemer, Cancer despite immunosurveillance: immunoselection and immunosubversion, Nat. Rev. Imm. 6 (2006) 715 [7.7] A. Matzavinos, M. Chaplain and V.A. Kuznetsov, Mathematical modelling of the spatio-temporal response of cytotoxic T-lymphocytes to a solid tumour. Mathematical Medicine and Biology: A Journal of the IMA 21, (2004) 1 [7.8] T.J. Stewart and S.I. Abrams, How tumours escape mass destruction, Oncogene 27, (2008) 5894 [7.9] F. Vianello, N. Papeta, T. Chen, P. Kraft, N. White, W. K. Hart, M. F. Kircher, E. Swart, S. Rhee, G. Pal, D. Irimia, M. Toner, R. Weissleder and M. C. Poznansky, Murine B16 melanomas expressing high levels of the chemokine stromal-derived factor-1/CXCL12 induce tumor-specific Tcell chemorepulsion and escape from immune control, The Journal of Immunology 176, 2902{2914 (2006). [7.10] A Cicalese, G Bonizzi, CE Pasi, M Faretta, S Ronzoni, B Giulini, C Brisken, S Minucci, PP Di Fiore, PG Pelicci, The tumor suppressor p53 regulates polarity of self-renewing divisions in mammary stem cells, Cell (2009) 1083 [7.11] A. Ciliberto, B Novak, JJ Tyson Steady states and oscillations in the p53/Mdm2 network. Cell cycle (2005) 488 [7.12] K. Puszyński, B Hat, T Lipniacki Oscillations and bistability in the stochastic model of p53 regulation, J.Theor. biol. (2008) 452 [7.13] A Hunziker, MH Jensen, S Krishna Stress-specific response of the p53-Mdm2 feedback loop BMC Syst. Biol. (2009) 42.

p-medicine – Grant Agreement no. 270089
D12.1 –Architecture and information flow diagrams of the Oncosimulator and the biomechanism models
Page 85 of 86
Conclusion
In this document an outline of the basics of the architecture of the Oncosimulator and the special molecular and cellular cancer biomechanism models that constitute the main subjects of workpackage 12 entitled: “Virtual Physiological Human (VPH) Modelling and the Integrated Oncosimulator” has been presented. The basic information flow across the various modelling modules of the VPH entities has also been described in the form of text and/or flow digrams. It should be pointed out that the present document is to be viewed only as a gross platform for the development of the detailed algorithms and computer codes of the Oncosimulator and the focused biomechanism models. The detailed algorithms pertaining to each modelling module and system will be the subject of deliverable D12.2. It should be pointed out that apart from the simulation of new (in relation to the previous versions of the Oncosimulator) clinical trials concerning acute lymphoblastic leukemia and breast cancer, the modelling of antiangiogenic therapy, the development of a non localized compartmental multiscale model for leukemia treatment and the special biochemical/molecular and cellular biomechanism models to be used in conjunction with the tumour types and clinical trials considered constitute some of the novelties of the p-medicine Oncosimulator. Furthermore, the exploitation of new nephroblastoma cases is expected to allow a statistically grounded clinical adaptation and validation analysis of the Oncosimulator. Since at this early stage no modelling results have been produced, no quantitative analyses or remarks regarding the entire development and application process can be made. Nevertheless, such type of information will be included in deliverable D12.2.

p-medicine – Grant Agreement no. 270089
D12.1 –Architecture and information flow diagrams of the Oncosimulator and the biomechanism models
Page 86 of 86
Appendix 1 - Abbreviations and acronyms
ACGT Advancing Clinico-Genomic Trials in Cancer [ a European Commission funded project]
ALL Acute Lymphoblastic Leukemia
CAU Christian-Albrechts-Universität zu Kiel
CTL Cytotoxic T Lymphocytes
HR High Risk
ICCS-NTUA
Institute of Communication and Computer Systems – National Technical University of Athens
IEO Istituto Europeo di Oncologia
IS Immune System
MD Molecular Dynamics
MRD Minimal Residual Disease
PDB Protein Data Bank
SB Systems Biology
SR Small Risk
TC Tumour Cell
UCL University College London
UOXF University of Oxford
USAAR University of Saarland
WP workpackage