Embed Size (px)
Citation preview
IMMEDIATE Deliverable Report D2.1 – Version 07 1
DELIVERABLE REPORT
D2.1 Report on OEM designed MEA test protocols
IMMEDIATE
Innovative autoMotive MEa Development
– implementation of Iphe-genie Achievements Targeted at Excellence
EC FP7 FCH JU Project No. 303466
SP1-JTI-FCH.2011.1.5 Next generation European MEAs for transportation applications
Project duration: 01.01.2013 – 31.12.2015 (36 months)
Coordinator: IRD Fuel Cells A/S, Denmark
EC FP7 FCH JU Project No. 303466 – IMMEDIATE
IMMEDIATE Deliverable Report D2.1 – Version 07 2
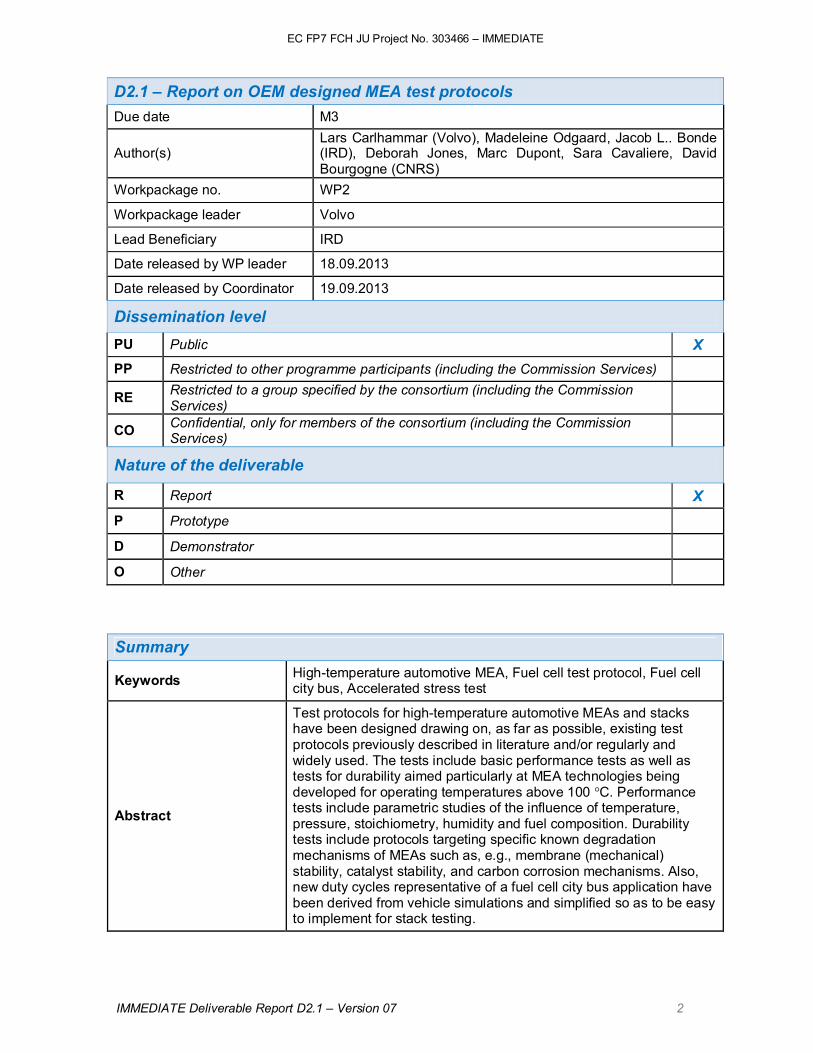
D2.1 – Report on OEM designed MEA test protocols
Due date M3
Author(s) Lars Carlhammar (Volvo), Madeleine Odgaard, Jacob L.. Bonde (IRD), Deborah Jones, Marc Dupont, Sara Cavaliere, David Bourgogne (CNRS)
Workpackage no. WP2
Workpackage leader Volvo
Lead Beneficiary IRD
Date released by WP leader 18.09.2013
Date released by Coordinator 19.09.2013
Dissemination level
PU Public X
PP Restricted to other programme participants (including the Commission Services)
RE Restricted to a group specified by the consortium (including the Commission Services)
CO Confidential, only for members of the consortium (including the Commission Services)
Nature of the deliverable
R Report X
P Prototype
D Demonstrator
O Other
Summary
Keywords High-temperature automotive MEA, Fuel cell test protocol, Fuel cell city bus, Accelerated stress test
Abstract
Test protocols for high-temperature automotive MEAs and stacks have been designed drawing on, as far as possible, existing test protocols previously described in literature and/or regularly and widely used. The tests include basic performance tests as well as tests for durability aimed particularly at MEA technologies being developed for operating temperatures above 100 °C. Performance tests include parametric studies of the influence of temperature, pressure, stoichiometry, humidity and fuel composition. Durability tests include protocols targeting specific known degradation mechanisms of MEAs such as, e.g., membrane (mechanical) stability, catalyst stability, and carbon corrosion mechanisms. Also, new duty cycles representative of a fuel cell city bus application have been derived from vehicle simulations and simplified so as to be easy to implement for stack testing.
EC FP7 FCH JU Project No. 303466 – IMMEDIATE
IMMEDIATE Deliverable Report D2.1 – Version 07 3
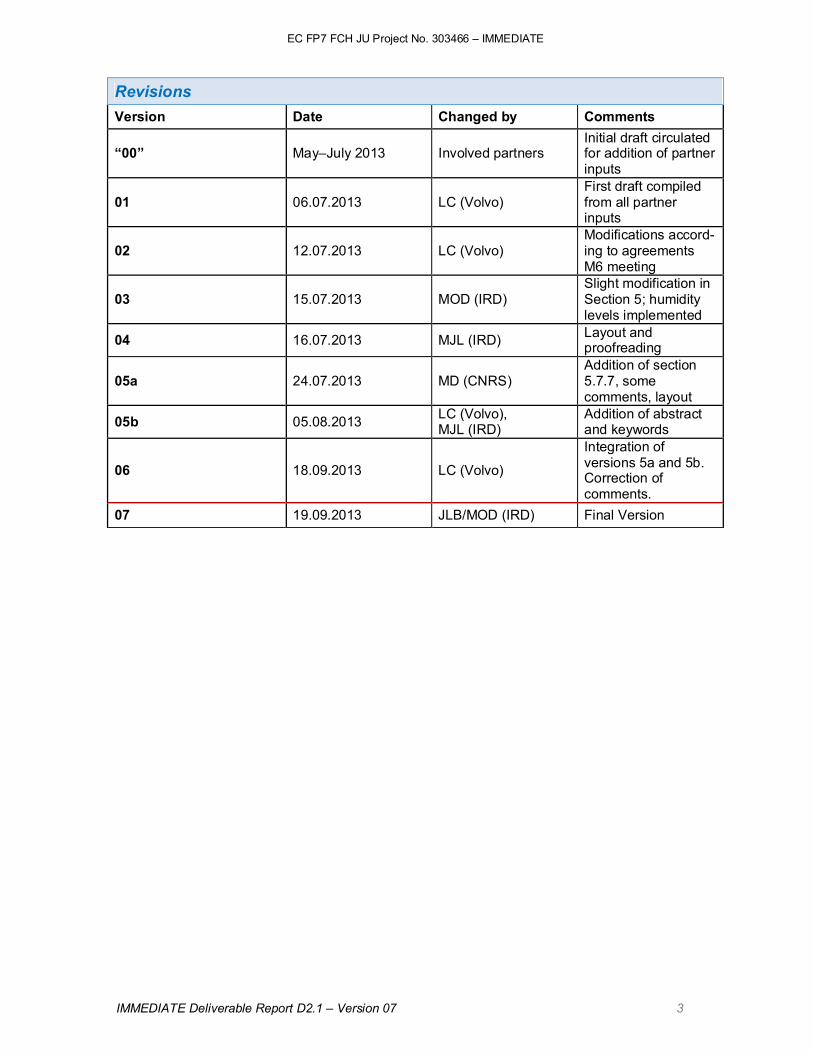
Revisions
Version Date Changed by Comments
“00” May–July 2013 Involved partners Initial draft circulated for addition of partner inputs
01 06.07.2013 LC (Volvo) First draft compiled from all partner inputs
02 12.07.2013 LC (Volvo) Modifications accord-ing to agreements M6 meeting
03 15.07.2013 MOD (IRD) Slight modification in Section 5; humidity levels implemented
04 16.07.2013 MJL (IRD) Layout and proofreading
05a 24.07.2013 MD (CNRS) Addition of section 5.7.7, some comments, layout
05b 05.08.2013 LC (Volvo), MJL (IRD)
Addition of abstract and keywords
06 18.09.2013 LC (Volvo)
Integration of versions 5a and 5b. Correction of comments.
07 19.09.2013 JLB/MOD (IRD) Final Version
EC FP7 FCH JU Project No. 303466 – IMMEDIATE
IMMEDIATE Deliverable Report D2.1 – Version 07 4
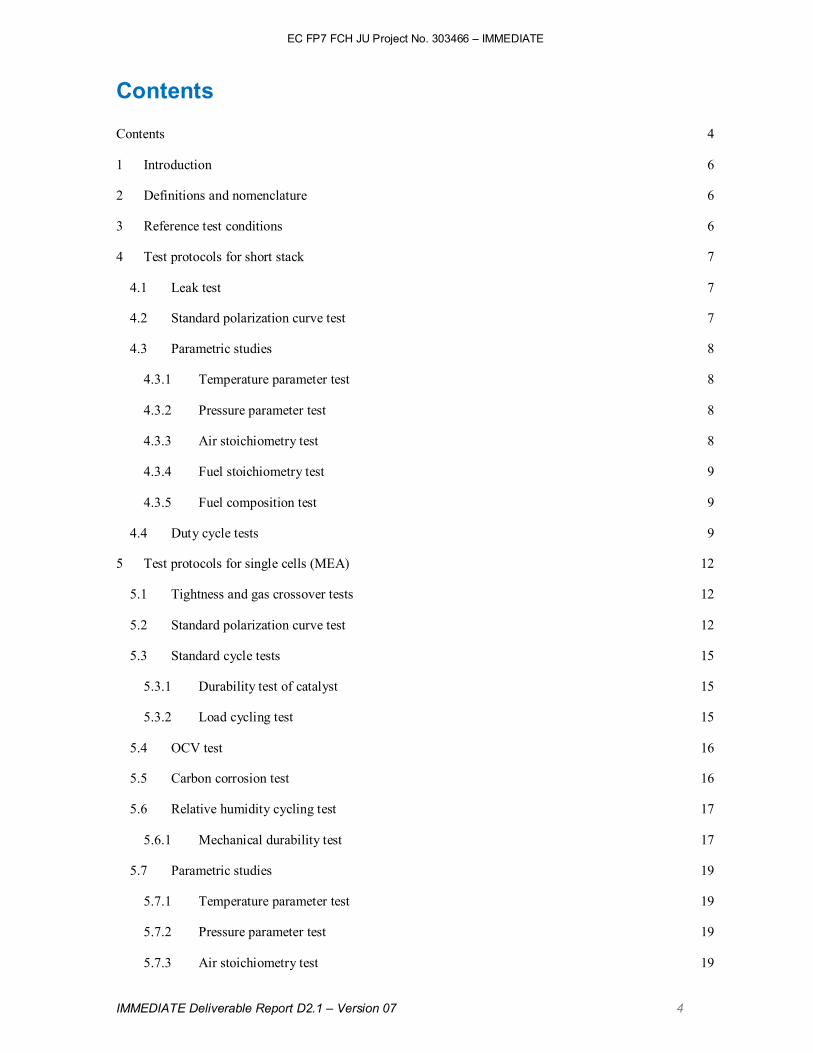
Contents
Contents 4
1 Introduction 6
2 Definitions and nomenclature 6
3 Reference test conditions 6
4 Test protocols for short stack 7
4.1 Leak test 7
4.2 Standard polarization curve test 7
4.3 Parametric studies 8
4.3.1 Temperature parameter test 8
4.3.2 Pressure parameter test 8
4.3.3 Air stoichiometry test 8
4.3.4 Fuel stoichiometry test 9
4.3.5 Fuel composition test 9
4.4 Duty cycle tests 9
5 Test protocols for single cells (MEA) 12
5.1 Tightness and gas crossover tests 12
5.2 Standard polarization curve test 12
5.3 Standard cycle tests 15
5.3.1 Durability test of catalyst 15
5.3.2 Load cycling test 15
5.4 OCV test 16
5.5 Carbon corrosion test 16
5.6 Relative humidity cycling test 17
5.6.1 Mechanical durability test 17
5.7 Parametric studies 19
5.7.1 Temperature parameter test 19
5.7.2 Pressure parameter test 19
5.7.3 Air stoichiometry test 19

EC FP7 FCH JU Project No. 303466 – IMMEDIATE
IMMEDIATE Deliverable Report D2.1 – Version 07 5
5.7.4 Fuel stoichiometry test 19
5.7.5 Fuel composition test 19
5.7.6 Relative humidity test 20
5.7.7 Post-mortem ex-situ MEAs characterization tests 20
6 Bibliography 21
EC FP7 FCH JU Project No. 303466 – IMMEDIATE
IMMEDIATE Deliverable Report D2.1 – Version 07 6
1 Introduction
This document defines the tests to be performed on the single cell MEAs and the 10-cell short stack to
be designed and tested in the IMMEDIATE project. The protocol relies heavily on test protocols
defined elsewhere, particularly those of References (1), (2), (3) and (4) for the short stack tests and
those of References (2), (5), (6) and (7) for the MEA tests.
In parallel to the preparation of this D2.1 report the members of the IMMEDIATE project participate
in the working group organized under JRC and FCH-JU with the subject “Harmonization of PEFC
testing protocols for automotive applications“. The document (2) from the above mentioned working
group is not finalized within the timeframe for submission of the D2.1 report. However, the
IMMEDIATE project will evaluate and adapt all relevant tests proposed and it is anticipated that
some specifics of the tests may need to be revised late in the project.
2 Definitions and nomenclature
Definitions, abbreviations and general nomenclature throughout this document follow that laid out in
References (8), (1) and (9).
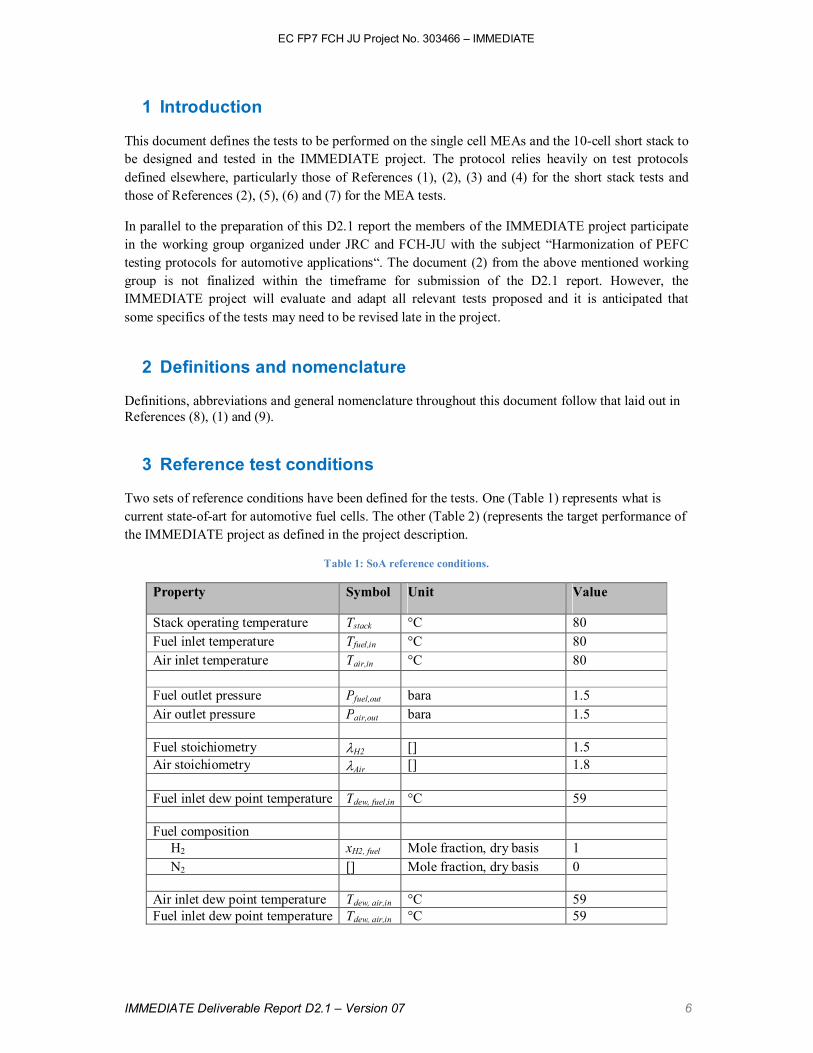
3 Reference test conditions
Two sets of reference conditions have been defined for the tests. One (Table 1) represents what is
current state-of-art for automotive fuel cells. The other (Table 2) (represents the target performance of
the IMMEDIATE project as defined in the project description.
Table 1: SoA reference conditions.
Property Symbol Unit Value
Stack operating temperature Tstack °C 80
Fuel inlet temperature Tfuel,in °C 80
Air inlet temperature Tair,in °C 80
Fuel outlet pressure Pfuel,out bara 1.5
Air outlet pressure Pair,out bara 1.5
Fuel stoichiometry λH2 [] 1.5
Air stoichiometry λAir [] 1.8
Fuel inlet dew point temperature Tdew, fuel,in °C 59
Fuel composition
H2 xH2, fuel Mole fraction, dry basis 1
N2 [] Mole fraction, dry basis 0
Air inlet dew point temperature Tdew, air,in °C 59
Fuel inlet dew point temperature Tdew, air,in °C 59
EC FP7 FCH JU Project No. 303466 – IMMEDIATE
IMMEDIATE Deliverable Report D2.1 – Version 07 7
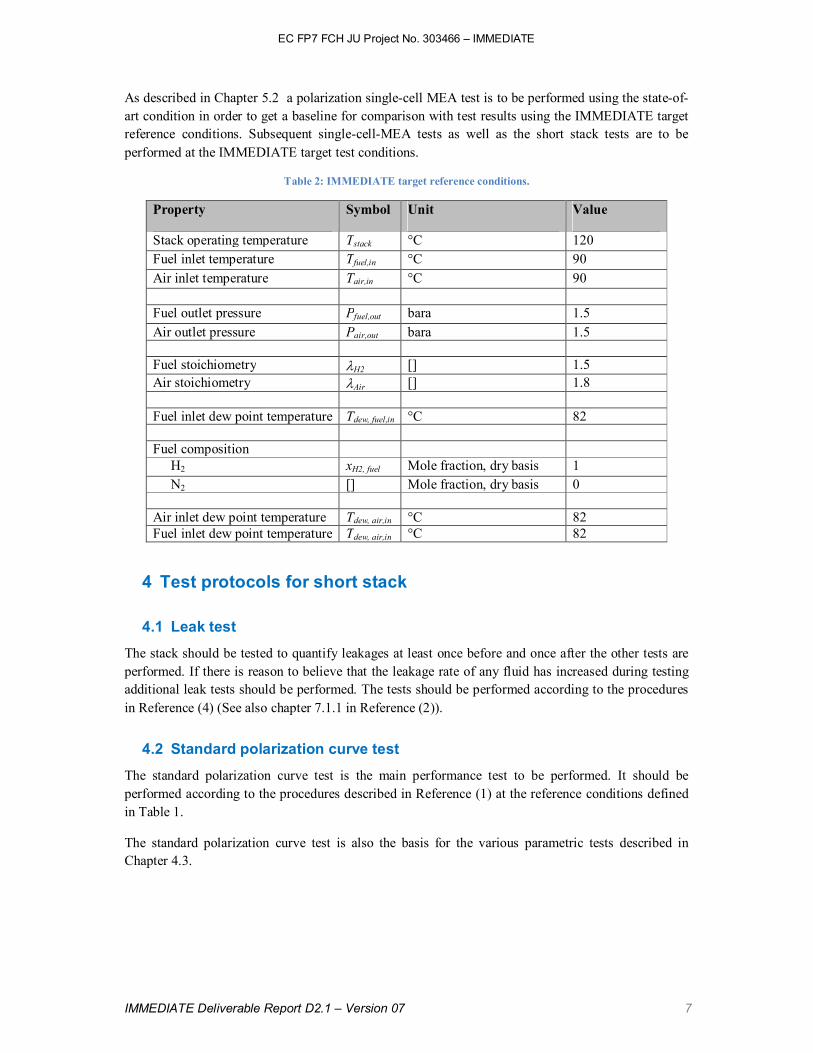
As described in Chapter 5.2 a polarization single-cell MEA test is to be performed using the state-of-
art condition in order to get a baseline for comparison with test results using the IMMEDIATE target
reference conditions. Subsequent single-cell-MEA tests as well as the short stack tests are to be
performed at the IMMEDIATE target test conditions.
Table 2: IMMEDIATE target reference conditions.
Property Symbol Unit Value
Stack operating temperature Tstack °C 120
Fuel inlet temperature Tfuel,in °C 90
Air inlet temperature Tair,in °C 90
Fuel outlet pressure Pfuel,out bara 1.5
Air outlet pressure Pair,out bara 1.5
Fuel stoichiometry λH2 [] 1.5
Air stoichiometry λAir [] 1.8
Fuel inlet dew point temperature Tdew, fuel,in °C 82
Fuel composition
H2 xH2, fuel Mole fraction, dry basis 1
N2 [] Mole fraction, dry basis 0
Air inlet dew point temperature Tdew, air,in °C 82
Fuel inlet dew point temperature Tdew, air,in °C 82
4 Test protocols for short stack
4.1 Leak test
The stack should be tested to quantify leakages at least once before and once after the other tests are
performed. If there is reason to believe that the leakage rate of any fluid has increased during testing
additional leak tests should be performed. The tests should be performed according to the procedures
in Reference (4) (See also chapter 7.1.1 in Reference (2)).
4.2 Standard polarization curve test
The standard polarization curve test is the main performance test to be performed. It should be
performed according to the procedures described in Reference (1) at the reference conditions defined
in Table 1.
The standard polarization curve test is also the basis for the various parametric tests described in
Chapter 4.3.
EC FP7 FCH JU Project No. 303466 – IMMEDIATE
IMMEDIATE Deliverable Report D2.1 – Version 07 8
4.3 Parametric studies
4.3.1 Temperature parameter test
This test is performed in order to quantify the change in performance of the FC when running at a
higher or lower temperature then the nominal. The FC should be tested at the operating conditions
listed in Table 3; parameters not listed should be kept at the reference condition described in Table 2.
For each test point in Table 3, a standard polarization curve test should be performed as described in
Chapter 4.2.
Table 3: Operating conditions for temperature parameter test.
Property Unit Value
Test point
1 2 3 4 5 6 7 8 9
Stack operating temperature °C 70 80 90 100 110 120 130 140 150
Fuel inlet temperature °C 40 50 60 70 80 90 100 110 120
Air inlet temperature °C 40 50 60 70 80 90 100 110 120
Fuel inlet dew point
temperature
°C 32 42 52 62 72 82 92 92 92
Air inlet dew point temperature
°C 32 42 52 62 72 82 92 92 92
4.3.2 Pressure parameter test
The aim of this test is to quantify how the performance of the FC depends on the operating pressure.
The pressure is varied in an interval around the pressure of the reference condition which is benign to
the FC. The pressure difference between anode and cathode compartment is kept constant at the same
level as in the reference condition. The fuel and air pressures to be used in the different test points are
listed in Table 4. Remaining parameters should be kept according to the reference condition defined
in Table 2. For each test point in Table 4, a standard polarization curve test should be performed as
described in Chapter 4.2.
Table 4: Operating conditions for pressure parameter test.
Property Unit Value
Test point
1 2 3 4 5
Fuel outlet pressure bara Open-ended 1.5 2.0 2.5 3.0
Air outlet pressure bara Open-ended 1.5 2.0 2.5 3.0
4.3.3 Air stoichiometry test
Due to the nature of the cathode kinetics and the low oxygen concentration in air a high stoichiometry
of air is usually needed to achieve good cell voltages. At the same time, for a pure hydrogen fuel cell
system, the air compressor constitutes the largest parasitic load in the system. Thus knowledge of the
impact of air stoichiometry on the performance of the fuel cell is important to make a correct system
level optimization of parameters such as the air stoichiometry and pressure. In this test the air
stoichiometry is varied around that specified in the reference condition. The operating parameters for
the different test points are listed in Table 5. Remaining parameters should be kept according to the
EC FP7 FCH JU Project No. 303466 – IMMEDIATE
IMMEDIATE Deliverable Report D2.1 – Version 07 9
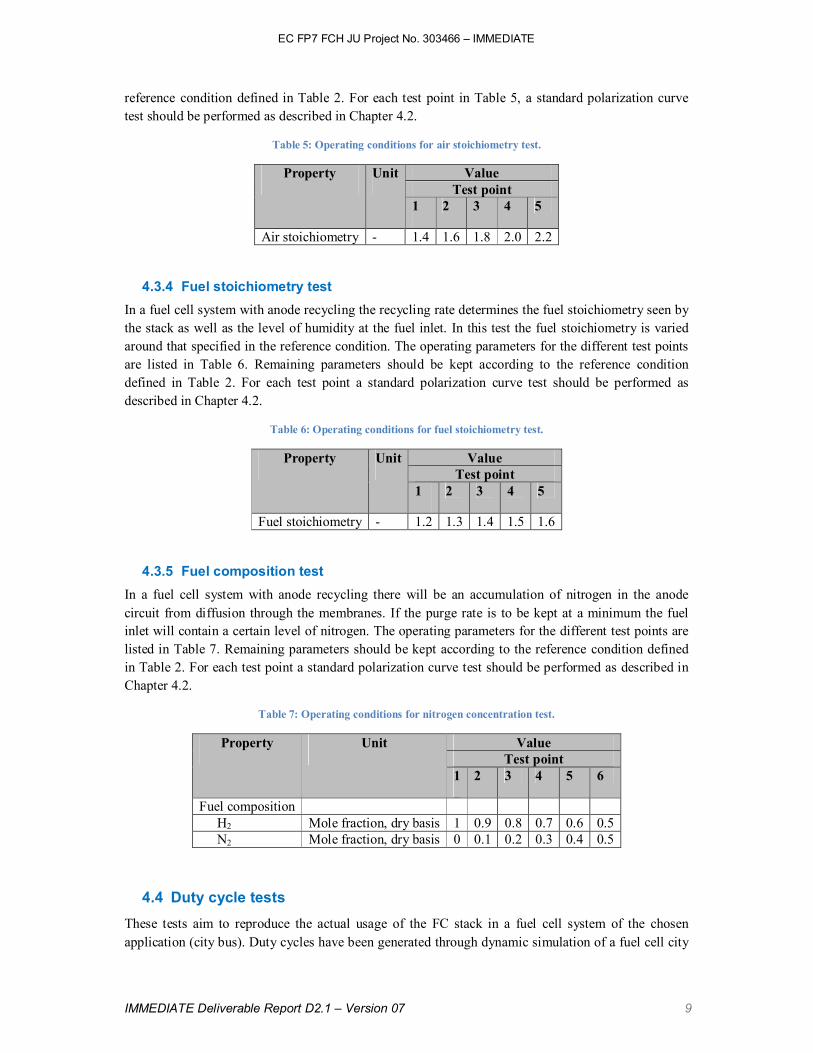
reference condition defined in Table 2. For each test point in Table 5, a standard polarization curve
test should be performed as described in Chapter 4.2.
Table 5: Operating conditions for air stoichiometry test.
Property Unit Value
Test point
1 2 3 4 5
Air stoichiometry - 1.4 1.6 1.8 2.0 2.2
4.3.4 Fuel stoichiometry test
In a fuel cell system with anode recycling the recycling rate determines the fuel stoichiometry seen by
the stack as well as the level of humidity at the fuel inlet. In this test the fuel stoichiometry is varied
around that specified in the reference condition. The operating parameters for the different test points
are listed in Table 6. Remaining parameters should be kept according to the reference condition
defined in Table 2. For each test point a standard polarization curve test should be performed as
described in Chapter 4.2.
Table 6: Operating conditions for fuel stoichiometry test.
Property Unit Value
Test point
1 2 3 4 5
Fuel stoichiometry - 1.2 1.3 1.4 1.5 1.6
4.3.5 Fuel composition test
In a fuel cell system with anode recycling there will be an accumulation of nitrogen in the anode
circuit from diffusion through the membranes. If the purge rate is to be kept at a minimum the fuel
inlet will contain a certain level of nitrogen. The operating parameters for the different test points are
listed in Table 7. Remaining parameters should be kept according to the reference condition defined
in Table 2. For each test point a standard polarization curve test should be performed as described in
Chapter 4.2.
Table 7: Operating conditions for nitrogen concentration test.
Property Unit Value
Test point
1 2 3 4 5 6
Fuel composition
H2 Mole fraction, dry basis 1 0.9 0.8 0.7 0.6 0.5
N2 Mole fraction, dry basis 0 0.1 0.2 0.3 0.4 0.5
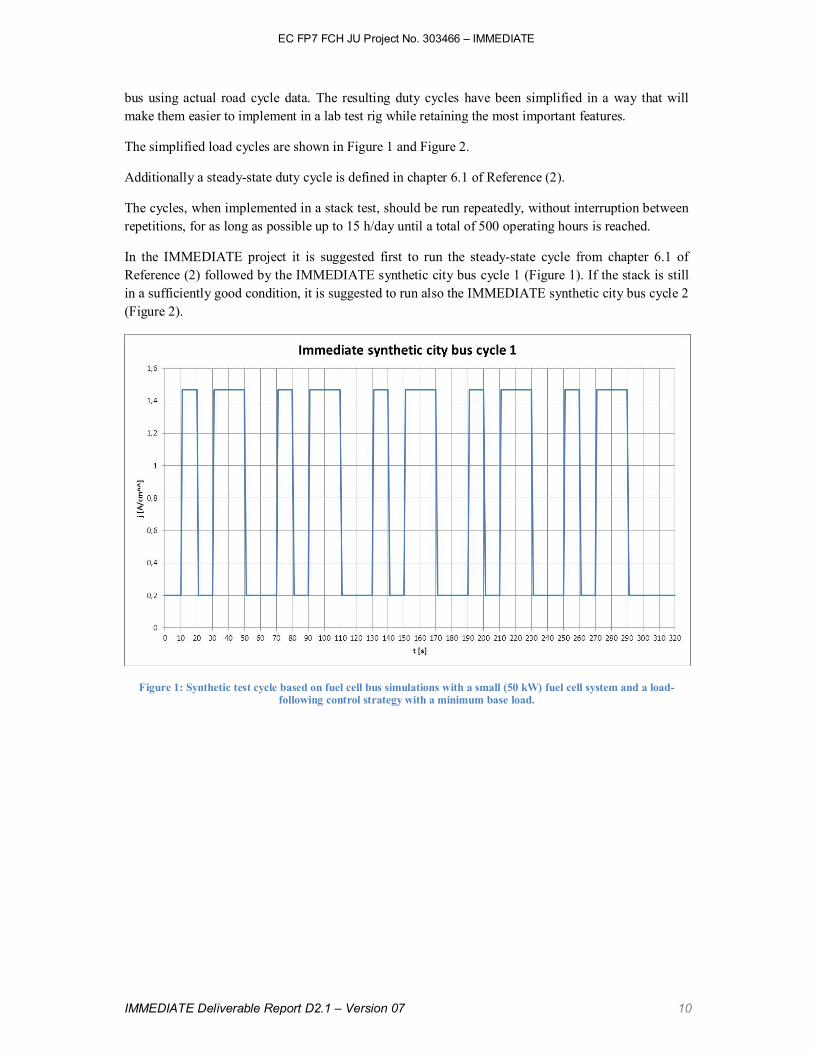
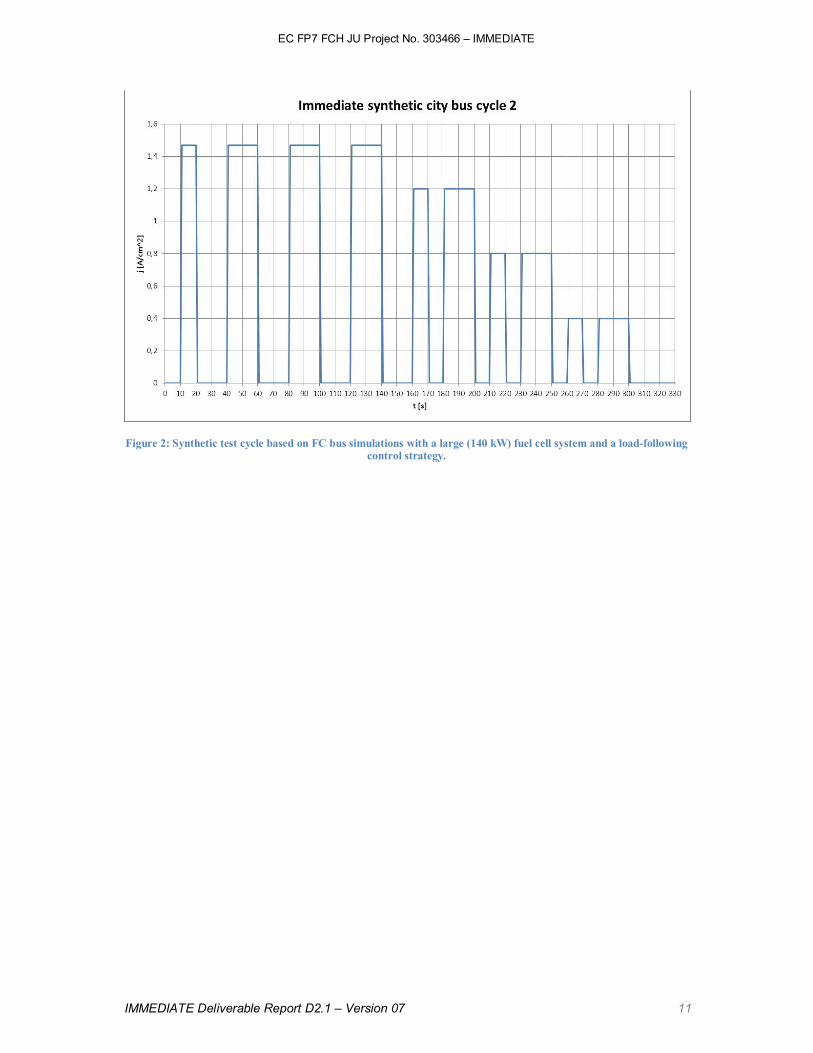
4.4 Duty cycle tests
These tests aim to reproduce the actual usage of the FC stack in a fuel cell system of the chosen
application (city bus). Duty cycles have been generated through dynamic simulation of a fuel cell city
EC FP7 FCH JU Project No. 303466 – IMMEDIATE
IMMEDIATE Deliverable Report D2.1 – Version 07 10
bus using actual road cycle data. The resulting duty cycles have been simplified in a way that will
make them easier to implement in a lab test rig while retaining the most important features.
The simplified load cycles are shown in Figure 1 and Figure 2.
Additionally a steady-state duty cycle is defined in chapter 6.1 of Reference (2).
The cycles, when implemented in a stack test, should be run repeatedly, without interruption between
repetitions, for as long as possible up to 15 h/day until a total of 500 operating hours is reached.
In the IMMEDIATE project it is suggested first to run the steady-state cycle from chapter 6.1 of
Reference (2) followed by the IMMEDIATE synthetic city bus cycle 1 (Figure 1). If the stack is still
in a sufficiently good condition, it is suggested to run also the IMMEDIATE synthetic city bus cycle 2
(Figure 2).
Figure 1: Synthetic test cycle based on fuel cell bus simulations with a small (50 kW) fuel cell system and a load-following control strategy with a minimum base load.
EC FP7 FCH JU Project No. 303466 – IMMEDIATE
IMMEDIATE Deliverable Report D2.1 – Version 07 11
Figure 2: Synthetic test cycle based on FC bus simulations with a large (140 kW) fuel cell system and a load-following control strategy.
EC FP7 FCH JU Project No. 303466 – IMMEDIATE
IMMEDIATE Deliverable Report D2.1 – Version 07 12
5 Test protocols for single cells (MEA)
The present section is intended to describe the evaluation methods for testing single-cell membrane–
electrode assemblies (MEAs) with the approach to assess the performance and durability of the
important components: electrolyte membrane, electrode catalyst and supports. The test protocols are
based on input from:
• FCTT: U.S. Drive Partnership, Fuel Cell Technical Team; Cell Component
Acclerated Stress Test and Polarization Curves protocols for Polymer Electrolyte
Membrane Fuel Cells, Revised August 2011 (5).
• USFCC: US Fuel Cell Council; Accelerated Stess Test (AST) Protocols for PEM
Fuel Cells (6).
• FCCJ: The Fuel Cell Commercialization Conference of Japan; Objectives, R&D
Challenge Topics and Proposed Evaluation methods for Polymer Eletrolyte Fuel
Cells, FCCJ, 2011 (7).
• JTI/FCH-JU: Draft version Generic Test protocol: Automotive PEFC single cell
performance, durability/endurance and accelerating testing (2).
The specific test protocols (AST) and performance metrics will be defined for electrocatalyst, catalyst
supports and membrane/MEA chemical and mechanical stability. The specific conditions and cycles
are intended to evaluate the individual effects and are based on assumptions but widely accepted
mechanisms (5), (10).
5.1 Tightness and gas crossover tests
Refer to section 7.1.1 of the document “Generic Test protocol: Automotive PEFC single cell
performance, durability/endurance and accelerating testing” (2).
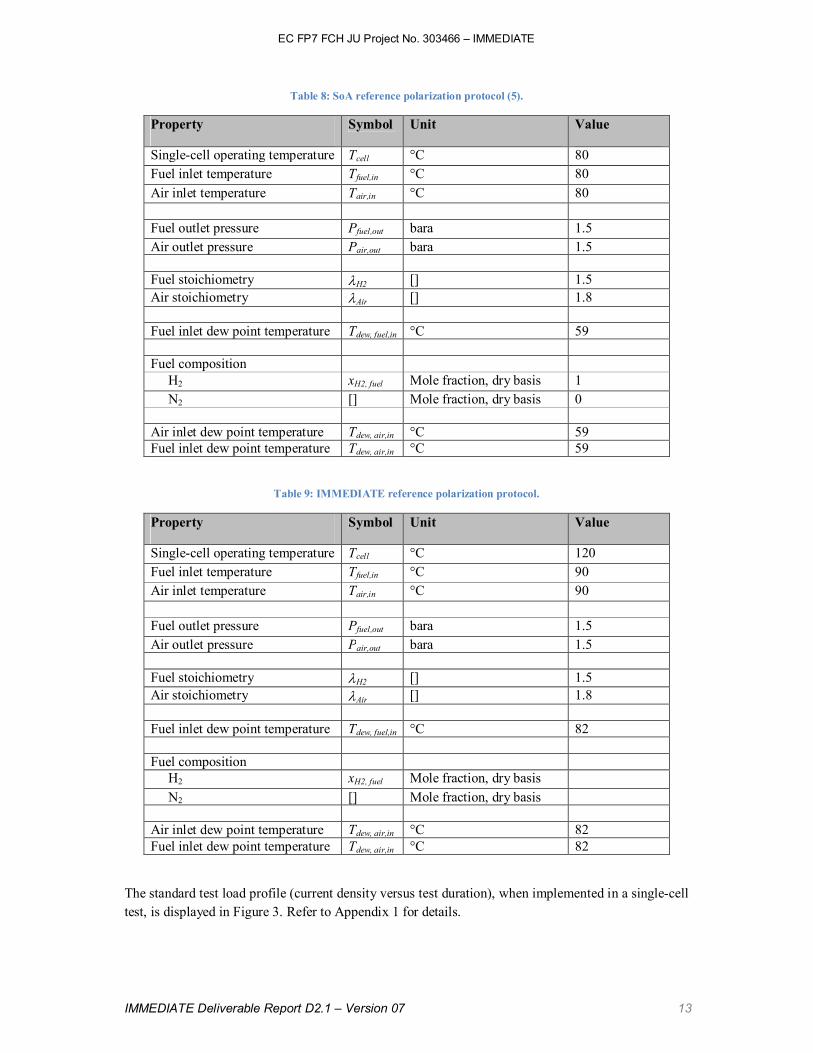
5.2 Standard polarization curve test
In order to enable comparison to the present state-of-art MEA single-cell test for automotive
applications adapted in the global community, a reference polarization curve measured at cell
temperature of 80 °C will be used in the IMMEDIATE project (Table 8). The prime focus of
IMMEDIATE is to develop highly performing MEAs operating at 120 °C. In addition to the SoA
reference test a specific project test protocol is suggested (Table 9). Refer to Appendix 1 for the
individual steps.
Prior to the polarization curve a start-up procedure is to be used to condition the FC for subsequent
tests so as to reasonably minimize variation in test results due to differing initial conditions. Refer to
section 7.1.1 of the document “Generic Test protocol: Automotive PEFC single cell performance,
durability/endurance and accelerating testing” (2).
In addition to performance test the series resistance of the MEA single-cell shall at least be
determined at the specified operating conditions by either monitoring the HFR (high-frequency
resistance) or by EIS (electrochemical impedance spectroscopy).
EC FP7 FCH JU Project No. 303466 – IMMEDIATE
IMMEDIATE Deliverable Report D2.1 – Version 07 13
Table 8: SoA reference polarization protocol (5).
Property Symbol Unit Value
Single-cell operating temperature Tcell °C 80
Fuel inlet temperature Tfuel,in °C 80
Air inlet temperature Tair,in °C 80
Fuel outlet pressure Pfuel,out bara 1.5
Air outlet pressure Pair,out bara 1.5
Fuel stoichiometry λH2 [] 1.5
Air stoichiometry λAir [] 1.8
Fuel inlet dew point temperature Tdew, fuel,in °C 59
Fuel composition
H2 xH2, fuel Mole fraction, dry basis 1
N2 [] Mole fraction, dry basis 0
Air inlet dew point temperature Tdew, air,in °C 59
Fuel inlet dew point temperature Tdew, air,in °C 59
Table 9: IMMEDIATE reference polarization protocol.
Property Symbol Unit Value
Single-cell operating temperature Tcell °C 120
Fuel inlet temperature Tfuel,in °C 90
Air inlet temperature Tair,in °C 90
Fuel outlet pressure Pfuel,out bara 1.5
Air outlet pressure Pair,out bara 1.5
Fuel stoichiometry λH2 [] 1.5
Air stoichiometry λAir [] 1.8
Fuel inlet dew point temperature Tdew, fuel,in °C 82
Fuel composition
H2 xH2, fuel Mole fraction, dry basis
N2 [] Mole fraction, dry basis
Air inlet dew point temperature Tdew, air,in °C 82
Fuel inlet dew point temperature Tdew, air,in °C 82
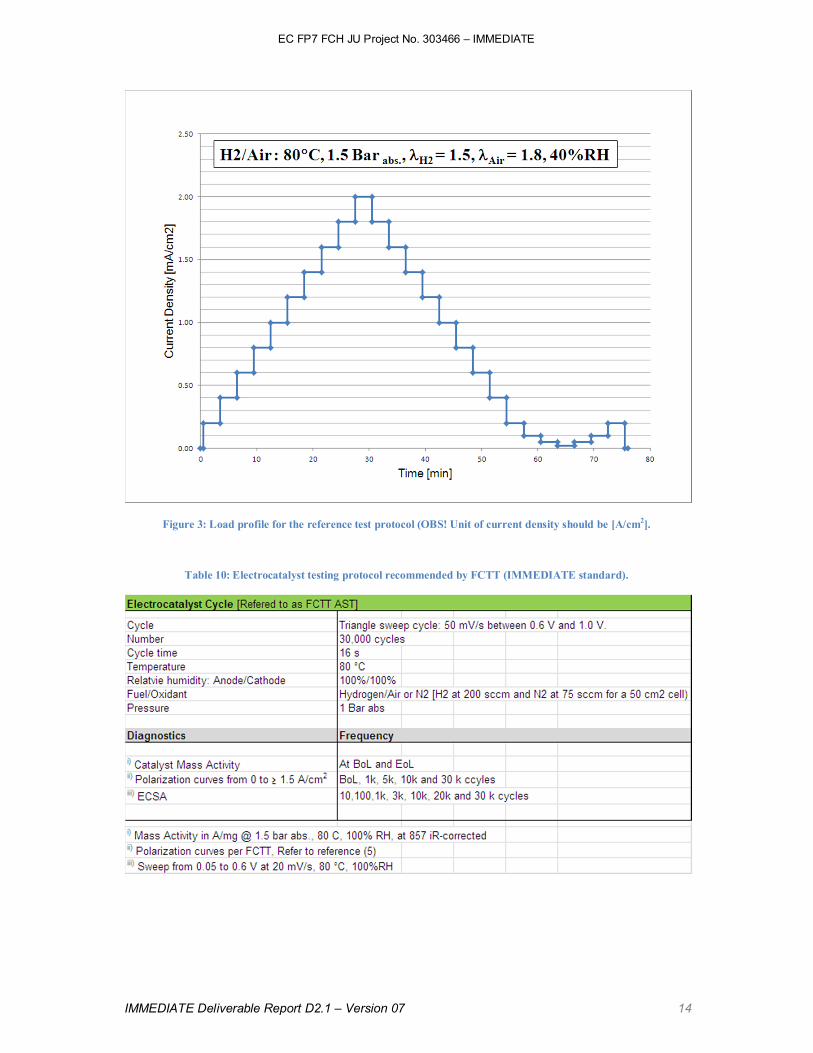
The standard test load profile (current density versus test duration), when implemented in a single-cell
test, is displayed in Figure 3. Refer to Appendix 1 for details.
EC FP7 FCH JU Project No. 303466 – IMMEDIATE
IMMEDIATE Deliverable Report D2.1 – Version 07 14
Figure 3: Load profile for the reference test protocol (OBS! Unit of current density should be [A/cm2].
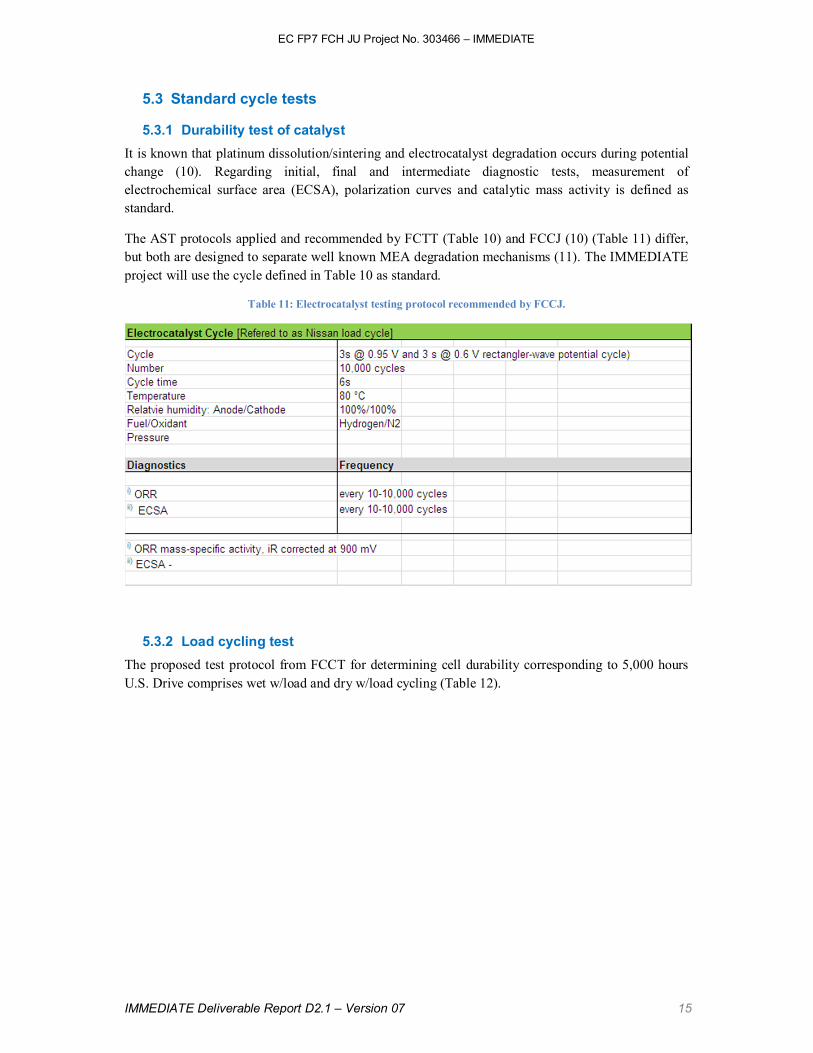
Table 10: Electrocatalyst testing protocol recommended by FCTT (IMMEDIATE standard).
EC FP7 FCH JU Project No. 303466 – IMMEDIATE
IMMEDIATE Deliverable Report D2.1 – Version 07 15
5.3 Standard cycle tests
5.3.1 Durability test of catalyst
It is known that platinum dissolution/sintering and electrocatalyst degradation occurs during potential
change (10). Regarding initial, final and intermediate diagnostic tests, measurement of
electrochemical surface area (ECSA), polarization curves and catalytic mass activity is defined as
standard.
The AST protocols applied and recommended by FCTT (Table 10) and FCCJ (10) (Table 11) differ,
but both are designed to separate well known MEA degradation mechanisms (11). The IMMEDIATE
project will use the cycle defined in Table 10 as standard.
Table 11: Electrocatalyst testing protocol recommended by FCCJ.
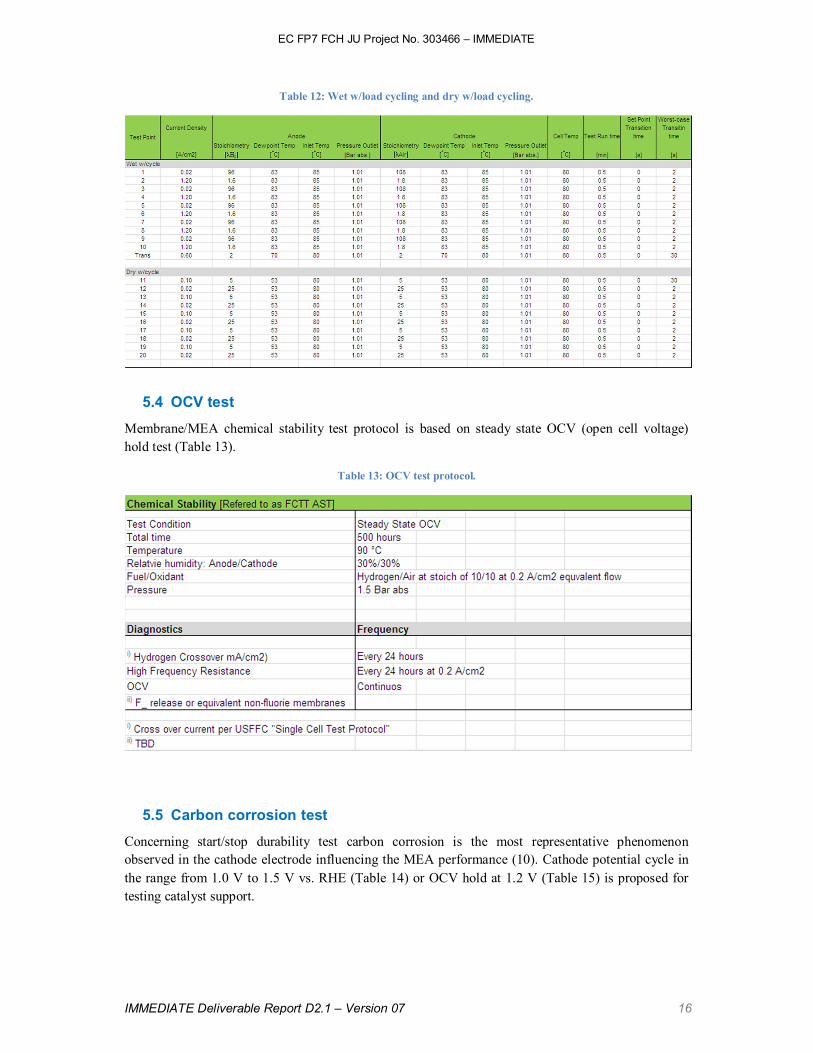
5.3.2 Load cycling test
The proposed test protocol from FCCT for determining cell durability corresponding to 5,000 hours
U.S. Drive comprises wet w/load and dry w/load cycling (Table 12).
EC FP7 FCH JU Project No. 303466 – IMMEDIATE
IMMEDIATE Deliverable Report D2.1 – Version 07 16
Table 12: Wet w/load cycling and dry w/load cycling.
5.4 OCV test
Membrane/MEA chemical stability test protocol is based on steady state OCV (open cell voltage)
hold test (Table 13).
Table 13: OCV test protocol.
5.5 Carbon corrosion test
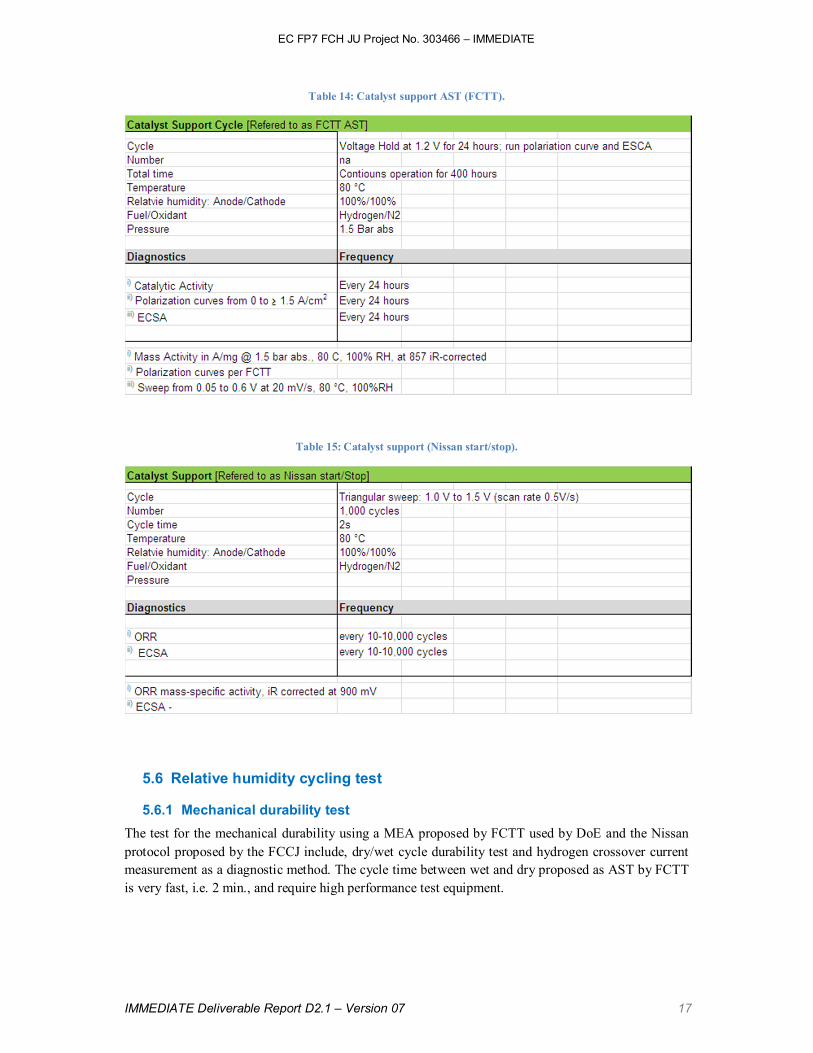
Concerning start/stop durability test carbon corrosion is the most representative phenomenon
observed in the cathode electrode influencing the MEA performance (10). Cathode potential cycle in
the range from 1.0 V to 1.5 V vs. RHE (Table 14) or OCV hold at 1.2 V (Table 15) is proposed for
testing catalyst support.
EC FP7 FCH JU Project No. 303466 – IMMEDIATE
IMMEDIATE Deliverable Report D2.1 – Version 07 17
Table 14: Catalyst support AST (FCTT).
Table 15: Catalyst support (Nissan start/stop).
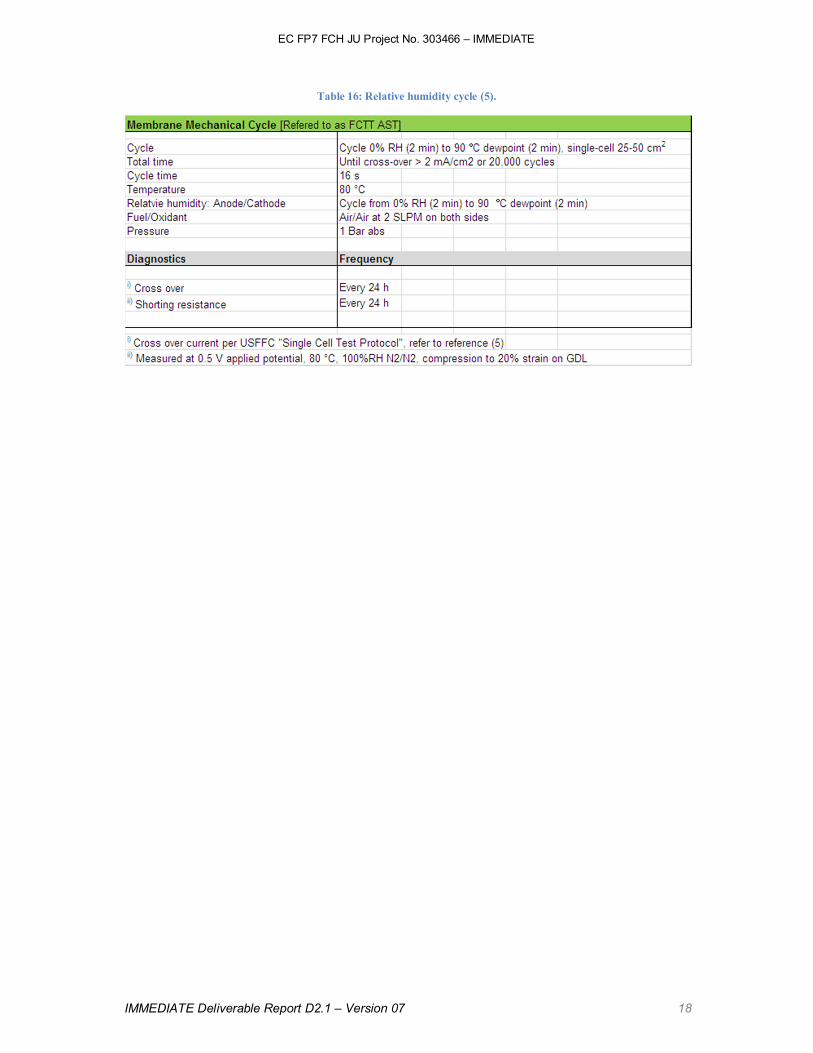
5.6 Relative humidity cycling test
5.6.1 Mechanical durability test
The test for the mechanical durability using a MEA proposed by FCTT used by DoE and the Nissan
protocol proposed by the FCCJ include, dry/wet cycle durability test and hydrogen crossover current
measurement as a diagnostic method. The cycle time between wet and dry proposed as AST by FCTT
is very fast, i.e. 2 min., and require high performance test equipment.
EC FP7 FCH JU Project No. 303466 – IMMEDIATE
IMMEDIATE Deliverable Report D2.1 – Version 07 18
Table 16: Relative humidity cycle (5).
EC FP7 FCH JU Project No. 303466 – IMMEDIATE
IMMEDIATE Deliverable Report D2.1 – Version 07 19
5.7 Parametric studies
The operating environment for the MEA significantly affects the performance of the overall fuel cell
systems. It is desired to design the auxiliary system simple and small; the operating temperature must
be raised for better radiation efficiency of the cooling system; lower humidity must be tolerated in
order to minimize the BoP components; and the lower the operating pressure and fuel/air
stoichiometry, the simpler the air compressor can be designed. Thus knowledge of the impact of the
operating conditions on the MEA performance is important. Various parametric MEA single cell test
will be applied in the project.
5.7.1 Temperature parameter test
The test is performed in order to quantify the change in performance of the MEA when running at a
higher or lower temperature than the nominal temperature defined as target in the IMMEDIATE
project. The MEA single cell should be tested at the same operating conditions as defined for the short
stack and listed in Table 3. Parameters not listed should be kept at the reference condition defined in
Table 9. The tests are performed similarly to the standard polarization test described in Chapter 5.2.
5.7.2 Pressure parameter test
The aim of this test is to quantify how the performance of the MEA depends on the operating
pressure. The pressure is varied in an interval around the pressure of the reference condition which is
benign to the FC. The pressure difference between anode and cathode compartment is kept constant at
the same level as in the reference condition (Table 9). The fuel and air pressures to be used in the
different test points are the same as in the corresponding short stack test and listed in Table 4.
Remaining parameters should be kept according to the reference condition defined in Table 9. The
tests are performed similarly to the standard polarization test described in Chapter 5.2.
5.7.3 Air stoichiometry test
Knowledge of the impact of air stoichiometry on the performance of the MEA is important to make a
correct system level optimization of parameters such as the air flow and pressure. In this test the air
stoichiometry is varied around that specified in the reference condition (Table 9). The operating
parameters for the different test points are the same as for the corresponding test on the short stack
and listed in Table 5. Remaining parameters should be kept according to the reference condition
defined in Table 9. The tests are performed similarly to the standard polarization test described in
Chapter 5.2.
5.7.4 Fuel stoichiometry test
In a fuel cell system with anode recycling the recycling rate determines the fuel stoichiometry seen by
the stack as well as the level of humidity at the fuel inlet. In this test the fuel stoichiometry is varied
around that specified in the reference condition (Table 9). The operating parameters for the different
test points are the same as for the corresponding test on the short stack and listed in Table 6.
Remaining parameters should be kept according to the reference condition of Table 9. The tests are
performed similarly to the standard polarization test described in Chapter 5.2.
5.7.5 Fuel composition test
In a fuel cell system with anode recycling there will be an accumulation of nitrogen in the anode
circuit from diffusion through the membranes. If the purge rate is to be kept at a minimum the fuel
inlet will contain a certain level of nitrogen. The operating parameters for the different test points are
EC FP7 FCH JU Project No. 303466 – IMMEDIATE
IMMEDIATE Deliverable Report D2.1 – Version 07 20
the same as for the corresponding test on the short stack and listed in Table 7. Remaining parameters
should be kept according to the reference condition defined in Table 9. The tests are performed
similarly to the standard polarization test described in Chapter 5.2.
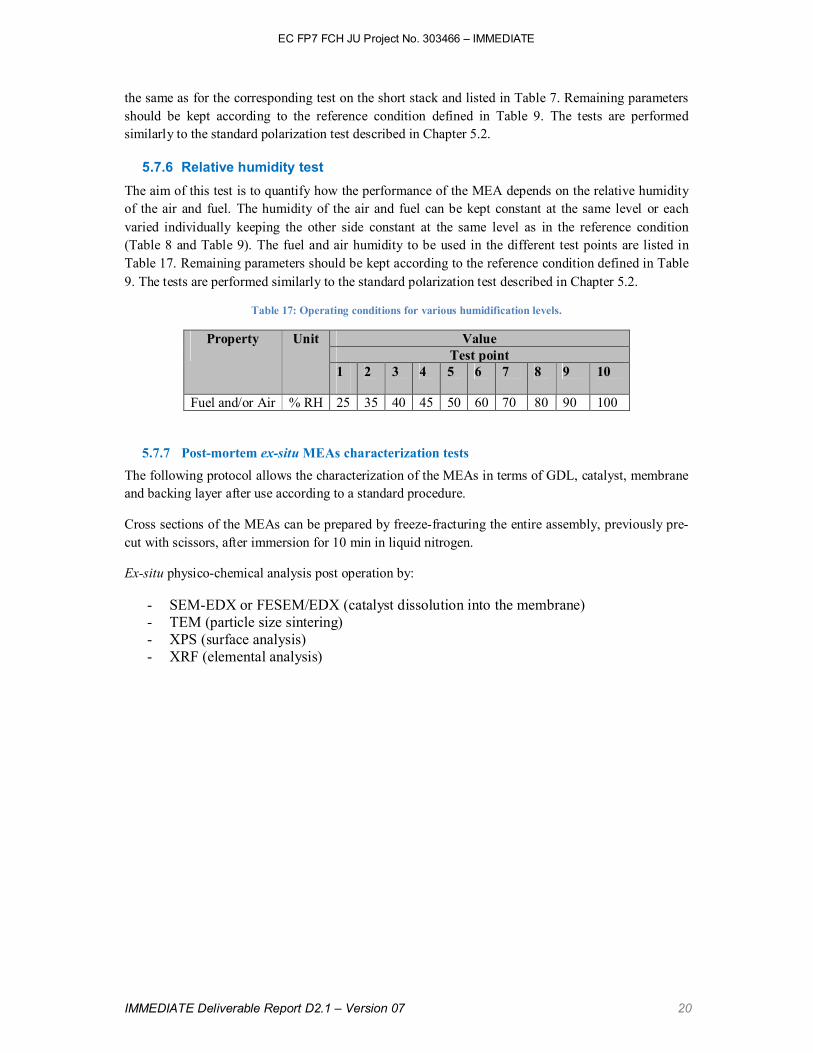
5.7.6 Relative humidity test
The aim of this test is to quantify how the performance of the MEA depends on the relative humidity
of the air and fuel. The humidity of the air and fuel can be kept constant at the same level or each
varied individually keeping the other side constant at the same level as in the reference condition
(Table 8 and Table 9). The fuel and air humidity to be used in the different test points are listed in
Table 17. Remaining parameters should be kept according to the reference condition defined in Table
9. The tests are performed similarly to the standard polarization test described in Chapter 5.2.
Table 17: Operating conditions for various humidification levels.
Property Unit Value
Test point
1 2 3 4 5 6 7 8 9 10
Fuel and/or Air % RH 25 35 40 45 50 60 70 80 90 100
5.7.7 Post-mortem ex-situ MEAs characterization tests
The following protocol allows the characterization of the MEAs in terms of GDL, catalyst, membrane
and backing layer after use according to a standard procedure.
Cross sections of the MEAs can be prepared by freeze-fracturing the entire assembly, previously pre-
cut with scissors, after immersion for 10 min in liquid nitrogen.
Ex-situ physico-chemical analysis post operation by:
- SEM-EDX or FESEM/EDX (catalyst dissolution into the membrane)
- TEM (particle size sintering)
- XPS (surface analysis)
- XRF (elemental analysis)
EC FP7 FCH JU Project No. 303466 – IMMEDIATE
IMMEDIATE Deliverable Report D2.1 – Version 07 21
6 Bibliography
1. Malkow, T, et al., et al. Test Module PEFC ST 5-3; PEFC power stack performance testing
procedure. Measuring voltage and power as function of current density. Polarisation curve test
method. [Online] April 30, 2010. [Cited: May 13, 2013.] http://iet.jrc.ec.europa.eu/fuel-
cells/sites/fuel-cells/files/files/documents/Polarisation_Curve_TestProcedure_ST_5-3.pdf.
2. Malkow, T, et al., et al. Generic test protocol - Automotive PEFC single cell performance,
durability/endurance and accelerated testing. s.l. : JRC, Draft version in preparation.
3. Råberg-Hellsing, Monika, et al., et al. Specification of Test Procedures for Polymer Electrocyte
Fuel Cell Stacks. [Online] June 2004. [Cited: May 13, 2013.] http://www.ika.rwth-
aachen.de/fuero/temp/test/testprocedure_fc-stack.pdf.
4. US Fuel Cell Council. Fuel Cell Leak Testing Requirements and Procedure. 2005. 04-070.
5. FCTT: U.S. Drive Partnership, Fuel Cell Technical Team. Cell Component Accelerated Stress
Test and Polarization Curves protocols for Polymer Electrolyte Membrane Fuel Cells. Revised
August 2011.
6. USFCC: US Fuel Cell Council. Accelerated Stress Test (AST) Protocols for PEM Fuel Cells.
Revised August 2011.
7. Objectives, R&D Challenge Topics and Proposed Evaluation methods for Polymer Electrolyte Fuel
Cells. Iiyama, A, et al., et al. 2011. FCCJ: The Fuel Cell Commercialization Conference of Japan.
8. Malkow, T, et al., et al. Test Module PEFC SC 5-2. Testing the voltage and power as function of
current density. Polarisation curve for a PEFC single cell. [Online] April 30, 2010. [Cited: May 13,
2013.] http://iet.jrc.ec.europa.eu/fuel-cells/sites/fuel-
cells/files/files/documents/Polarisation_curve_TestProcedure.pdf.
9. Tsotridis, G, et al., et al. FCTESTNET Fuel Cells Glossary. s.l. : European Commission Joint
Research Centre, 2006. EUR 22295 EN.
10. ECS Transactions. 2011, Vol. 41, 1, pp. 775-784.
11. Randal, Perry L. V.E.7 Analysis of Durability of MEAS in Automotive PEMFC Applications. s.l. :
DoE Hydrogen and Fuel Cells Program, FY 2012 Annual Progress Report.
EC FP7 FCH JU Project No. 303466 – IMMEDIATE
IMMEDIATE Deliverable Report D2.1 – Version 07 22
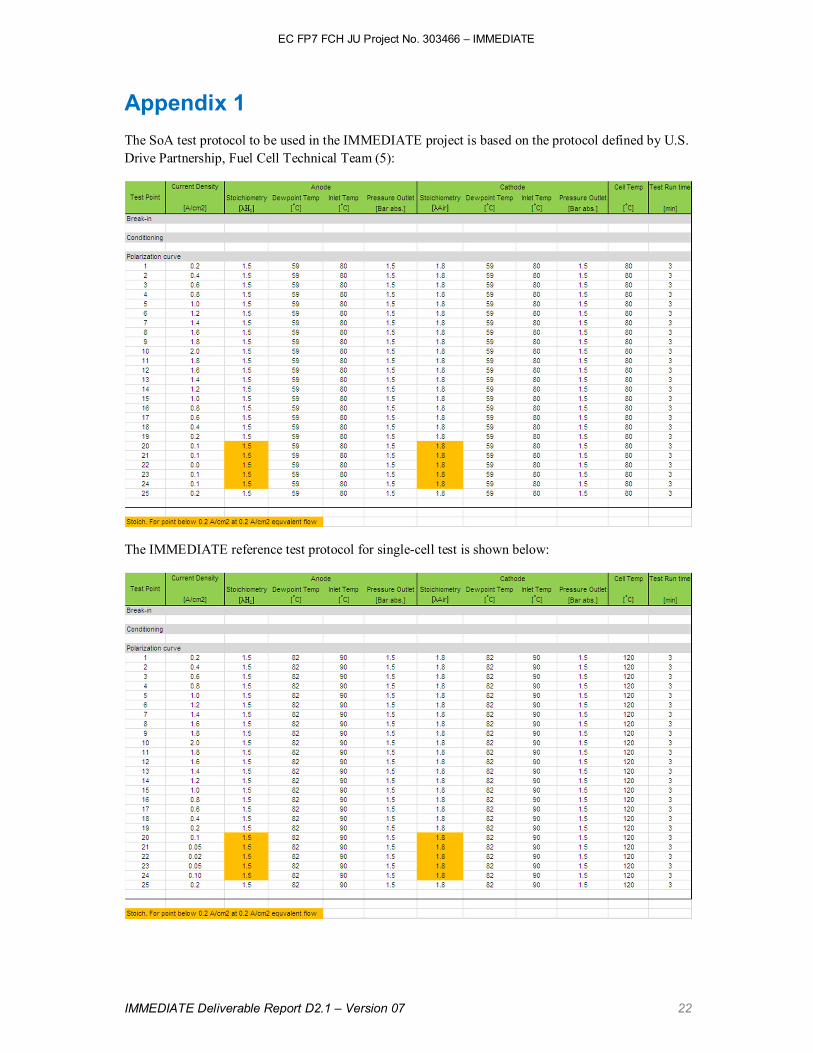
Appendix 1
The SoA test protocol to be used in the IMMEDIATE project is based on the protocol defined by U.S.
Drive Partnership, Fuel Cell Technical Team (5):
The IMMEDIATE reference test protocol for single-cell test is shown below:

EC FP7 FCH JU Project No. 303466 – IMMEDIATE
IMMEDIATE Deliverable Report D2.1 – Version 07 23