Embed Size (px)
Citation preview

Grant Agreement No: 680447 Project acronym: MODER Project title: Mobilization of innovative design tools for refurbishing of buildings at district level Funding scheme: Innovation Action Starting date of project: 1st September 2015 Duration: 36 months
D2.2 – Availability and suitability of technologies
Due date of deliverable: M12
Actual submission date: 07.10.2016
WP 2 Leader: GI ZRMK
Task 2.2 Leader: Ertex Solartechnik GmbH
Dissemination Level
PU/CO Public / Confidential, only for members of the consortium (including the Commission Services)
PU
This project has received funding from the European Union’s Horizon 2020 research and innovation
programme under grant agreement No 680447.
D2.2 – Availability and suitability of technologies 1
Table of Contents
1 Introduction ....................................................................................................................................................... 3 1.1 Publishable summary ................................................................................................................................ 3 1.2 Purpose and target group .......................................................................................................................... 3 1.3 Contribution of partners ............................................................................................................................. 4 1.4 Relation to other tasks/deliverables .......................................................................................................... 4 1.5 Terminology and definitions ...................................................................................................................... 4
2 Assessment of district level technologies ......................................................................................................... 6 2.1 Introduction ................................................................................................................................................ 6
2.1.1 Introduction for the approach for the assessment and comparison of design alternatives and the selection of technology packages ..................................................................................................................... 6 2.1.2 Key performance indicators (KPI) ..................................................................................................... 7 2.1.3 Identifying and selecting potential energy system solutions ........................................................... 10
3 District level technologies ............................................................................................................................... 14 3.1 Heat Technologies .................................................................................................................................. 14
3.1.1 Solar thermal ................................................................................................................................... 14 3.1.2 Geothermal ..................................................................................................................................... 19 3.1.3 Waste-to-energy and biogas ........................................................................................................... 21 3.1.4 Heat from wastewater ..................................................................................................................... 29
3.2 Electricity Generation .............................................................................................................................. 31 3.2.1 Photovoltaics ................................................................................................................................... 31 3.2.2 Wind ................................................................................................................................................ 40 3.2.3 Small hydro ..................................................................................................................................... 46 3.2.4 Geothermal ..................................................................................................................................... 46 3.2.5 Bioenergy ........................................................................................................................................ 46
3.3 Combined Heat and Power ..................................................................................................................... 47 3.3.1 Energy recovery from data centers ................................................................................................. 49
3.4 Cooling Technologies .............................................................................................................................. 50 3.4.1 Solar cooling with photovoltaics (solar electric cooling) .................................................................. 51 3.4.2 Solar cooling with solar thermal ...................................................................................................... 51 3.4.3 Advantages/disadvantages and economic feasibility of cooling technologies ................................ 54
3.5 Energy Storage ....................................................................................................................................... 55 3.5.1 Thermal Energy Storage ................................................................................................................. 55 3.5.2 Electrical energy storage ................................................................................................................ 57 3.5.3 Biogas storage ................................................................................................................................ 63
4 Smart metering and smart grids ...................................................................................................................... 66 4.1 Introduction – definition (what are smart grids) ....................................................................................... 66 4.2 Smart metering ........................................................................................................................................ 66 4.3 Response capabilities and interoperability .............................................................................................. 67 4.4 Distributed architecture ........................................................................................................................... 68 4.5 Smart grid and smart metering as enablers of nearly/net zero energy districts ...................................... 68 4.6 Challenges and availability of smart grid and smart metering technologies............................................ 70 4.7 Energy exchange between buildings ....................................................................................................... 72
5 Case Studies ................................................................................................................................................... 74 5.1 Drake Landing Solar community, Canada ............................................................................................... 74 5.2 Sunstore 4 - CHP, Marstal Denmark ....................................................................................................... 77 5.3 PV panels in Freiburg, Germany ............................................................................................................. 79 5.4 Geoenergy in Unterhaching, Germany .................................................................................................... 83 5.5 Wind turbines in buildings ....................................................................................................................... 84 5.6 Waste management in Östergötland, Sweden ........................................................................................ 86 5.7 DC in Paris, France ................................................................................................................................. 87 5.8 Mine shaft storage in Heerlen, The Netherlands ..................................................................................... 89 5.9 “Power Bank” in Mannheim, Germany .................................................................................................... 92 5.10 Solar district heating in Graz, Austria ...................................................................................................... 93 5.11 First energy self-sufficient apartment building in Brütten, Switzerland .................................................... 94 5.12 BIPV in the railway station Utrecht Centraal, Netherlands ...................................................................... 96
6 Availability and suitability of technologies and technology combinations ....................................................... 98 7 Conclusion .................................................................................................................................................... 101 8 References .................................................................................................................................................... 103
D2.2 – Availability and suitability of technologies 2
History
Version Description Lead author Date
1.1 Draft Ertex Solar 15.09.2016
1.2 Final version for uploading Ertex Solar 07.10.2016
Acknowledgements
The work presented in this document has been conducted in the context of Horizon 2020 programme of the European community project MODER (n° 680447). MODER is a 36-month project that started in September 2015 and is funded by the European Commission as well as by the industrial and research partners. Their support is gratefully appreciated.
The partners in the project are:
Sweco Finland Ltd. (Finland)
VTT Technical Research Centre of Finland Ltd.(Finland)
Fraunhofer Gesellschaft zur Förderung der Angewandten Forschung EV - Fraunhofer Institute for Building Physics IBP (Germany)
Siemens AG (Germany)
REM PRO SIA (Latvia)
Stichting W/E Adviseurs Duurzaam Bouwen - W/E Consultants Sustainable Building (The Netherlands)
Ertex Solartechnik GmbH (Austria)
Gradbeni Institut, ZRMK DOO – GI ZRMK (Slovenia)
Finnenergia Oy (Finland)
Lokalna Energetska Agencija Gorenske Javni Zavod - LEAG (Slovenia).
D2.2 – Availability and suitability of technologies 3
1 Introduction
1.1 Publishable summary
The implementation of renewable energy sources in combination with energy-efficient refurbishment at district level requires a detailed understanding of technology options, their current state, their availability and advantages and drawbacks. In contrast to areas of urban development projects where energy options can be considered nearly unrestricted, not every energy source is suitable in any case in built-up areas with high densities of existing buildings and valuable green areas. Restrictions also arise from existing and envisaged infrastructure, e.g. from district heating systems.
In the context of this work the focus is laid on generally applicable technologies and technology combinations, which should be suitable in most urban regions and refurbishment situations.
This document presents results of
an approach for the assessment and comparison of design alternatives and the selection of technology packages (the MODER approach),
different heat/cold, electricity and biogas (waste-to-energy) generation technologies capable to play a major role in urban district refurbishment,
storage solutions for thermal and electrical energy, hydrogen and for biogas,
smart metering and smart grids as enablers of nearly/net zero energy districts,
several case studies of energy generation and storage solutions, and finally
the evaluation of the technical and geographical availability of technology options and their suitability to be implemented in existing built-up areas.
We started with a detailed research of promising technology options and technology combinations. The results clearly indicate the diversity of solutions for energy generation based on renewable energy sources and storage solutions technically available today. Renewables (especially solar based technologies) prove to be highly suitable for refurbishing urban areas almost everywhere in the inhabited world and especially in Middle and Northern Europe. Thus, a great deployment of renewable energies in urban areas is not related to missing technical solutions or geographical incapability but mainly a matter of legal and economic frameworks and a matter of proper system technologies and crosslinking – an optimal use within urban districts require well-developed energy grids. Smart grids and smart metering turned out to be basic conditions for an appreciable use of renewables.
1.2 Purpose and target group
The purpose of the work was to
discuss key performance indicators of district level technologies,
report district level technologies for heat/cold, electricity and combined heat and power generation and their advantages and drawbacks,
report district level technologies for energy storage solutions,
discuss smart metering and smart grids in the context of district level refurbishment,
represent case studies for different energy solutions and systems, and
to check the availability and suitability of technologies and technology combinations.
The main focus was laid on technologies available in almost any geographical site and existing urban situations. Where ever possible, efficiencies, current energy generation costs and economic aspects (with several significant publications) were mentioned in forefront to deliverable D2.3 and work package 5.
The results will be published as a conference article or journal article.
D2.2 – Availability and suitability of technologies 4
1.3 Contribution of partners
The following partners have contributed to the deliverable:
Dieter Moor, Ertex Solar – author (supported by Markus Kirschner, nfsol),
Teresa Martins, Sweco – reported on District level technologies and Case studies,
Jyri Nieminen, Sweco – reported on District level technologies and Case studies
Tarja Häkkinen, VTT – reported about Assessment of district level technologies and Smart metering and smart grids,
Lee Hyojung, Sweco – reported on European PV market.
1.4 Relation to other tasks/deliverables
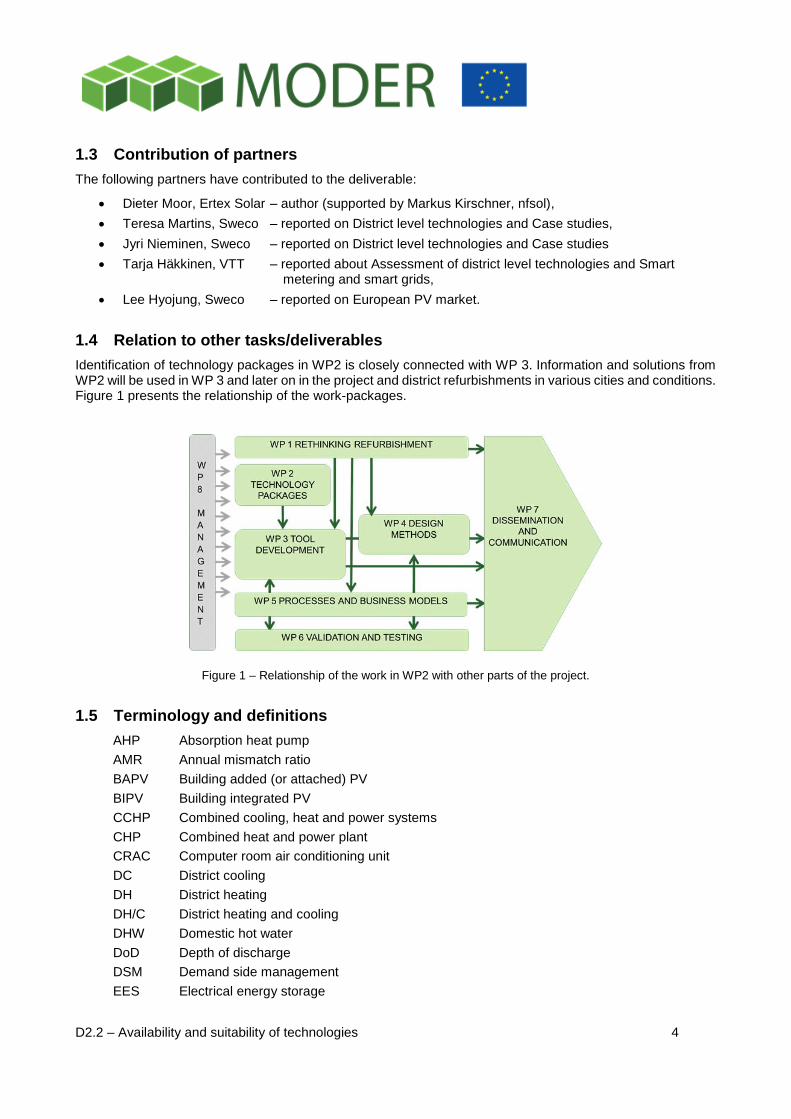
Identification of technology packages in WP2 is closely connected with WP 3. Information and solutions from WP2 will be used in WP 3 and later on in the project and district refurbishments in various cities and conditions. Figure 1 presents the relationship of the work-packages.
Figure 1 – Relationship of the work in WP2 with other parts of the project.
1.5 Terminology and definitions
AHP Absorption heat pump
AMR Annual mismatch ratio
BAPV Building added (or attached) PV
BIPV Building integrated PV
CCHP Combined cooling, heat and power systems
CHP Combined heat and power plant
CRAC Computer room air conditioning unit
DC District cooling
DH District heating
DH/C District heating and cooling
DHW Domestic hot water
DoD Depth of discharge
DSM Demand side management
EES Electrical energy storage
D2.2 – Availability and suitability of technologies 5
FES Flywheel energy storage
GeoDH Geothermal district heating
GHG Greenhouse gas
HAVC Heating, ventilation and air conditioning
LCA Life cycle assessment
LCC Life cycle costing
MHD Maximum hourly deficit
MHS Maximum hourly surplus
OER On-site energy ratio
ORC Organic Rankine Cycle
PV Photovoltaic
RES Renewable energy sources
SHS Sensible heat storage
SWT Small wind turbines
TCS Thermo-chemical storage
TES Thermal energy storage
UTES Underground thermal energy storage
WWTP Wastewater treatment plant
D2.2 – Availability and suitability of technologies 6
2 Assessment of district level technologies
2.1 Introduction
A roadmap to a resource-efficient Europe highlights the building sector as one of the three key sectors for improvements [1]. The Intergovernmental Panel on Climate Change (IPCC) synthesis report also lists buildings as having the greatest estimated economic mitigation potential of all sector-linked solutions investigated [2]. Measures to reduce GHG emissions from buildings include reducing energy consumption of buildings, switching to low-carbon fuels and reducing embodied energy in buildings [3]. Significant part of building related emissions are induced because of the use of fossil fuels along the life cycle of buildings. At the same time other harmful emissions are induced.
Different steering instruments are used to improve the energy-performance and overall sustainability of buildings. These have been studied by several researchers, e.g. [4], [5], [6], [7], [8], [9], [10], [11], [12], [13], [14], [15]. The focus of the past research has been mainly on normative and fiscal instruments (as summarized in [16]).
However, in order to achieve a rapid change towards low-carbon, energy-efficient and sustainable building and refurbishment, a variety of new kind of actions and steering instruments is needed. The focus is moving from international and national governmental level steering to municipal level actions. Due to limitations of normative control and regulatory instruments, the stakeholders’ voluntary commitment to sustainable building is essential and the role of local actions and municipal steering is increasing. Municipal climate strategies are seen as a faster and more effective way to tackle global climate challenges than global climate agreements [17].
Currently, there is a growing interest among municipalities for preparing their own sustainability strategies [18]. For example in Finland, all of the big municipalities with more than 50000 inhabitants (and 43% of the Finnish municipalities in total) have drafted a climate strategy, defined emission reduction goals, and assessed their greenhouse gas emissions [19]. In general, the most ambitious climate policies are found from the biggest municipalities, which have their policies closely integrated to municipal governance [17].
Local action plans for energy performance improvement are one tool for municipalities to drive the building sector towards sustainable building. Municipal strategies and local action plans also emphasize the meaning of district level approaches in the energy-efficient refurbishment of buildings.
An increase in local renewable energy generation in buildings and neighbourhoods is leading to a new situation: there will be shift from national systems with centralized energy supply and one-way distribution towards local systems that utilise hybrid energy sources [20].
2.1.1 Introduction for the approach for the assessment and comparison of design alternatives and the selection of technology packages
This Section describes a draft for MODER energy system design approach. The purpose is to aid in planning for improvements of energy systems and energy-efficiency of buildings on district level. The approach is for identifying, assessing and selecting favourable packages of energy technologies and building refurbishment options when several buildings are refurbished at neighbourhood or district level.
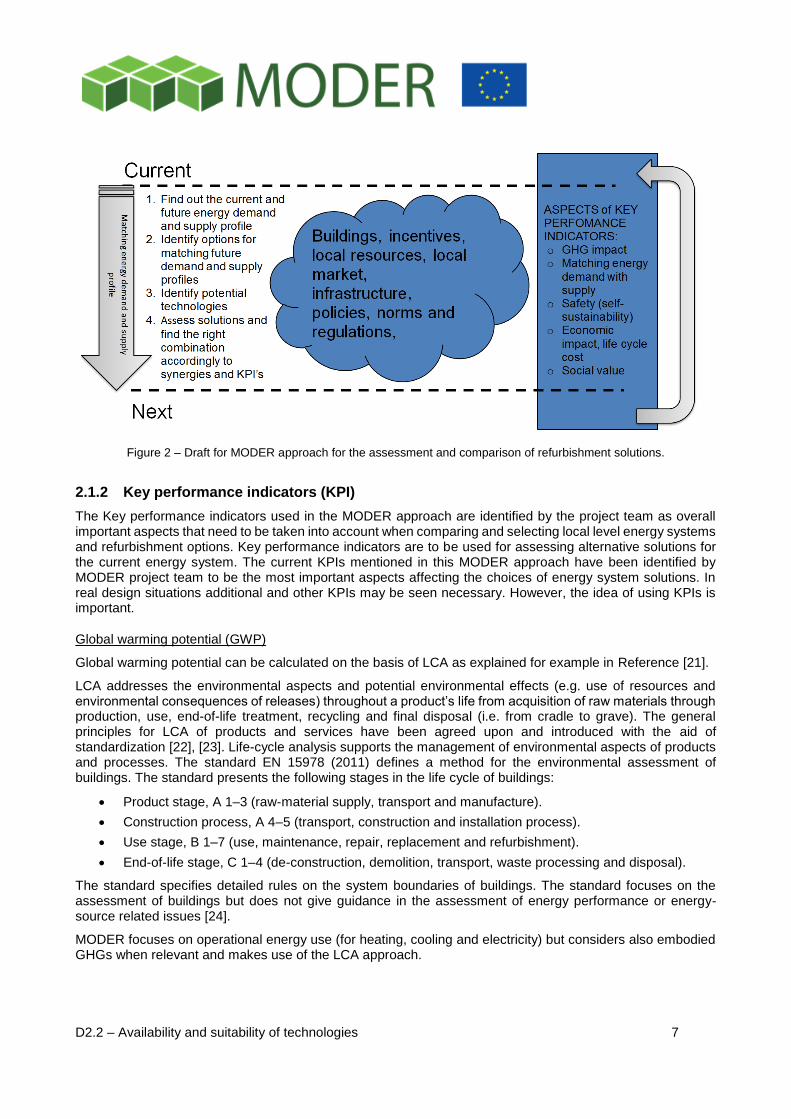
The MODER approach is described in Figure 2. It is based on a four-step analysis for identifying and assessing potential solutions of energy production technologies. Potential solutions (changes) are identified by taking into consideration key issues such as available technologies, local resources, policies etc. The assessment of the solutions is thereafter done in terms of synergies and with the help of key performance indicators.
The MODER approach concerns in general district level solution in a Nordic and Central European climate. The approach is intended for people within the fields of urban planning, energy and construction. It takes into consideration technologies that are technically and economically suitable for the Nordic and Central European environment. In addition, the existing building stock and its potential refurbishment is an important aspect of the approach.
D2.2 – Availability and suitability of technologies 7
Figure 2 – Draft for MODER approach for the assessment and comparison of refurbishment solutions.
2.1.2 Key performance indicators (KPI)
The Key performance indicators used in the MODER approach are identified by the project team as overall important aspects that need to be taken into account when comparing and selecting local level energy systems and refurbishment options. Key performance indicators are to be used for assessing alternative solutions for the current energy system. The current KPIs mentioned in this MODER approach have been identified by MODER project team to be the most important aspects affecting the choices of energy system solutions. In real design situations additional and other KPIs may be seen necessary. However, the idea of using KPIs is important.
Global warming potential (GWP)
Global warming potential can be calculated on the basis of LCA as explained for example in Reference [21].
LCA addresses the environmental aspects and potential environmental effects (e.g. use of resources and environmental consequences of releases) throughout a product’s life from acquisition of raw materials through production, use, end-of-life treatment, recycling and final disposal (i.e. from cradle to grave). The general principles for LCA of products and services have been agreed upon and introduced with the aid of standardization [22], [23]. Life-cycle analysis supports the management of environmental aspects of products and processes. The standard EN 15978 (2011) defines a method for the environmental assessment of buildings. The standard presents the following stages in the life cycle of buildings:
Product stage, A 1–3 (raw-material supply, transport and manufacture).
Construction process, A 4–5 (transport, construction and installation process).
Use stage, B 1–7 (use, maintenance, repair, replacement and refurbishment).
End-of-life stage, C 1–4 (de-construction, demolition, transport, waste processing and disposal).
The standard specifies detailed rules on the system boundaries of buildings. The standard focuses on the assessment of buildings but does not give guidance in the assessment of energy performance or energy-source related issues [24].
MODER focuses on operational energy use (for heating, cooling and electricity) but considers also embodied GHGs when relevant and makes use of the LCA approach.
D2.2 – Availability and suitability of technologies 8
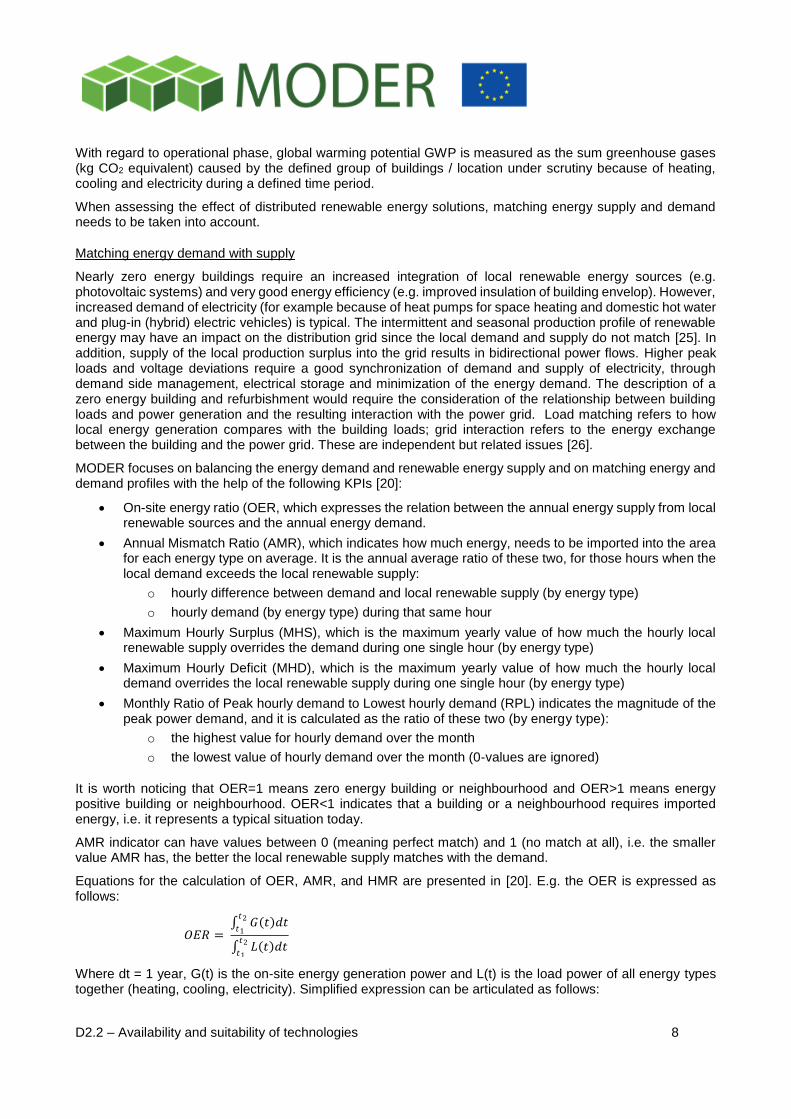
With regard to operational phase, global warming potential GWP is measured as the sum greenhouse gases (kg CO2 equivalent) caused by the defined group of buildings / location under scrutiny because of heating, cooling and electricity during a defined time period.
When assessing the effect of distributed renewable energy solutions, matching energy supply and demand needs to be taken into account.
Matching energy demand with supply
Nearly zero energy buildings require an increased integration of local renewable energy sources (e.g. photovoltaic systems) and very good energy efficiency (e.g. improved insulation of building envelop). However, increased demand of electricity (for example because of heat pumps for space heating and domestic hot water and plug-in (hybrid) electric vehicles) is typical. The intermittent and seasonal production profile of renewable energy may have an impact on the distribution grid since the local demand and supply do not match [25]. In addition, supply of the local production surplus into the grid results in bidirectional power flows. Higher peak loads and voltage deviations require a good synchronization of demand and supply of electricity, through demand side management, electrical storage and minimization of the energy demand. The description of a zero energy building and refurbishment would require the consideration of the relationship between building loads and power generation and the resulting interaction with the power grid. Load matching refers to how local energy generation compares with the building loads; grid interaction refers to the energy exchange between the building and the power grid. These are independent but related issues [26].
MODER focuses on balancing the energy demand and renewable energy supply and on matching energy and demand profiles with the help of the following KPIs [20]:
On-site energy ratio (OER, which expresses the relation between the annual energy supply from local renewable sources and the annual energy demand.
Annual Mismatch Ratio (AMR), which indicates how much energy, needs to be imported into the area for each energy type on average. It is the annual average ratio of these two, for those hours when the local demand exceeds the local renewable supply:
o hourly difference between demand and local renewable supply (by energy type)
o hourly demand (by energy type) during that same hour
Maximum Hourly Surplus (MHS), which is the maximum yearly value of how much the hourly local renewable supply overrides the demand during one single hour (by energy type)
Maximum Hourly Deficit (MHD), which is the maximum yearly value of how much the hourly local demand overrides the local renewable supply during one single hour (by energy type)
Monthly Ratio of Peak hourly demand to Lowest hourly demand (RPL) indicates the magnitude of the peak power demand, and it is calculated as the ratio of these two (by energy type):
o the highest value for hourly demand over the month
o the lowest value of hourly demand over the month (0-values are ignored)
It is worth noticing that OER=1 means zero energy building or neighbourhood and OER>1 means energy positive building or neighbourhood. OER<1 indicates that a building or a neighbourhood requires imported energy, i.e. it represents a typical situation today.
AMR indicator can have values between 0 (meaning perfect match) and 1 (no match at all), i.e. the smaller value AMR has, the better the local renewable supply matches with the demand.
Equations for the calculation of OER, AMR, and HMR are presented in [20]. E.g. the OER is expressed as follows:
𝑂𝐸𝑅 = 𝐺 𝑡 𝑑𝑡
𝑡2
𝑡1
𝐿 𝑡 𝑑𝑡𝑡2
𝑡1
Where dt = 1 year, G(t) is the on-site energy generation power and L(t) is the load power of all energy types together (heating, cooling, electricity). Simplified expression can be articulated as follows:
D2.2 – Availability and suitability of technologies 9
OER = Annual local supply in kWh / Annual demand in kWh.
Safety (self-sustainability)
Energy safety is connected to the share of energy demand that is being supplied within the same area. It is important for services, industry and living comfort in the area.
Energy self-sustainability is related both to environmental effects and safety issues. Many renewable energy technologies provide for local energy production (reduce bought energy or fuel) while have at the same time less effect on the environment as other conventional methods. Some common KIPs related to energy safety are:
Share of locally produced energy of consumption
Local energy sources and expertise
Backup systems
Reliable energy distribution and storage
Secure/secured production
Life-cycle cost
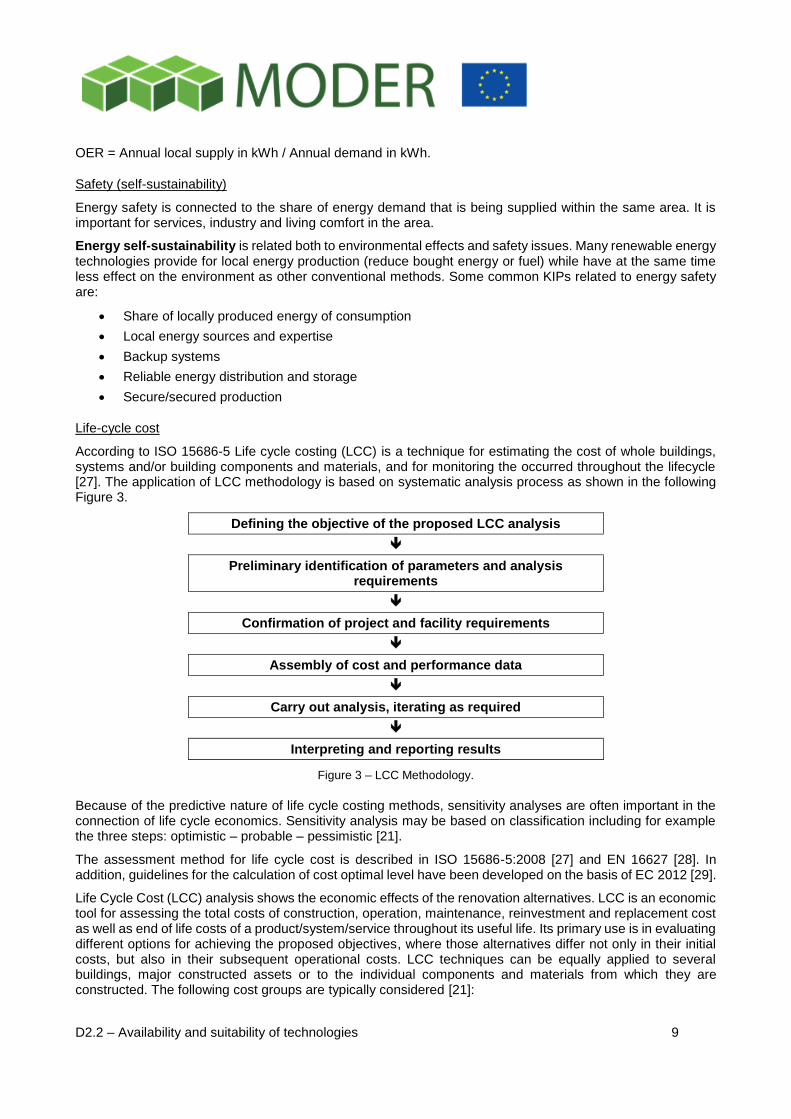
According to ISO 15686-5 Life cycle costing (LCC) is a technique for estimating the cost of whole buildings, systems and/or building components and materials, and for monitoring the occurred throughout the lifecycle [27]. The application of LCC methodology is based on systematic analysis process as shown in the following Figure 3.
Defining the objective of the proposed LCC analysis
Preliminary identification of parameters and analysis requirements
Confirmation of project and facility requirements
Assembly of cost and performance data
Carry out analysis, iterating as required
Interpreting and reporting results
Figure 3 – LCC Methodology.
Because of the predictive nature of life cycle costing methods, sensitivity analyses are often important in the connection of life cycle economics. Sensitivity analysis may be based on classification including for example the three steps: optimistic – probable – pessimistic [21].
The assessment method for life cycle cost is described in ISO 15686-5:2008 [27] and EN 16627 [28]. In addition, guidelines for the calculation of cost optimal level have been developed on the basis of EC 2012 [29].
Life Cycle Cost (LCC) analysis shows the economic effects of the renovation alternatives. LCC is an economic tool for assessing the total costs of construction, operation, maintenance, reinvestment and replacement cost as well as end of life costs of a product/system/service throughout its useful life. Its primary use is in evaluating different options for achieving the proposed objectives, where those alternatives differ not only in their initial costs, but also in their subsequent operational costs. LCC techniques can be equally applied to several buildings, major constructed assets or to the individual components and materials from which they are constructed. The following cost groups are typically considered [21]:
D2.2 – Availability and suitability of technologies 10
Cost of investment;
Cost for annually occurring operation including energy use, maintenance and repair;
Cost for non-annually occurring replacement;
Cost for end of life - demolition, disposal and residual value.
Due to the commonly used assumption that the price increase rate in the energy sector differs from the increase rate in other sectors, the cost for energy are sometimes separated from other regular cost during the use stage.
LCC calculations can be based on the present value equation method, which is the most commonly used calculation method for LCC-calculations in construction. The net present value is the investment costs subtracted from the present value. The values are discounted from year N to today’s value. This value is calculated as follows (as explained in [21]):
𝑆0 = 𝑆𝑛
1 + 𝑝 𝑛
S0 … cost year 0 Sn … sum year n n … year p … nominal rate of return
Operation and maintenance costs include energy costs (for space heating, electricity, hot water distribution and possible cooling) and other costs for maintaining the buildings comfort and functionality on an everyday basis. They also include costs for cleaning and caretaker services. The annual cost is calculated to the present value. The costs from the operation and maintenance are assumed to have a certain cost every year that increases with inflation ”i” according to the equation below, before it is discounted to present value.
𝑆𝑛 = 𝑆0 1 + 𝑖 𝑛
Operation costs are related to energy costs (heating, electricity, DHW) and the maintenance costs contain the yearly costs for maintaining the building and its function.
The costs for reinvestment are non-annual costs. These costs are justified from the necessity for replacement of the different equipment/installation which has the lifetime smaller than time period for analysis. These costs are regarded as annuity costs and spread within the years of replacement by help from the annuity equation:
𝐴 = 𝑆0 ∙𝑝
1 − 1 + 𝑝 −𝑛
This gives a discounted sum yearly added to the calculation within the amount of years for the replacement.
Social value
In addition to energy and life cycle aspects social aspects are considered on the basis of project preferences. There are values resulting from the design of energy system that might be challenging to put as a numeric value. They might affect the attractiveness of the area in terms of comforts, aesthetics, further services and safety:
Attractiveness of area
Comfort
Safety
2.1.3 Identifying and selecting potential energy system solutions
The MODER approach for identifying and selecting potential energy system solution for urban areas include the following steps:
1. Figure out the current and future energy demand and supply profile
2. Options for matching future demand and supply profiles
3. Identify potential technologies
D2.2 – Availability and suitability of technologies 11
4. Assess solutions and find the right combination accordingly to synergies and KPI’s
Figure out the current and future energy demand and supply profile
In order to find potential energy system solution it is important to look at the current situation regarding energy and power demand and energy and power production. Here it is important to point out that the distinction that energy is power (W) demand throughout a certain amount of time (for example Wh). Together these form a so called energy profile (demand/production) from which one might be able to see for instance how the power fluctuation varies with time. The energy profile is important for matching energy demand and supply.
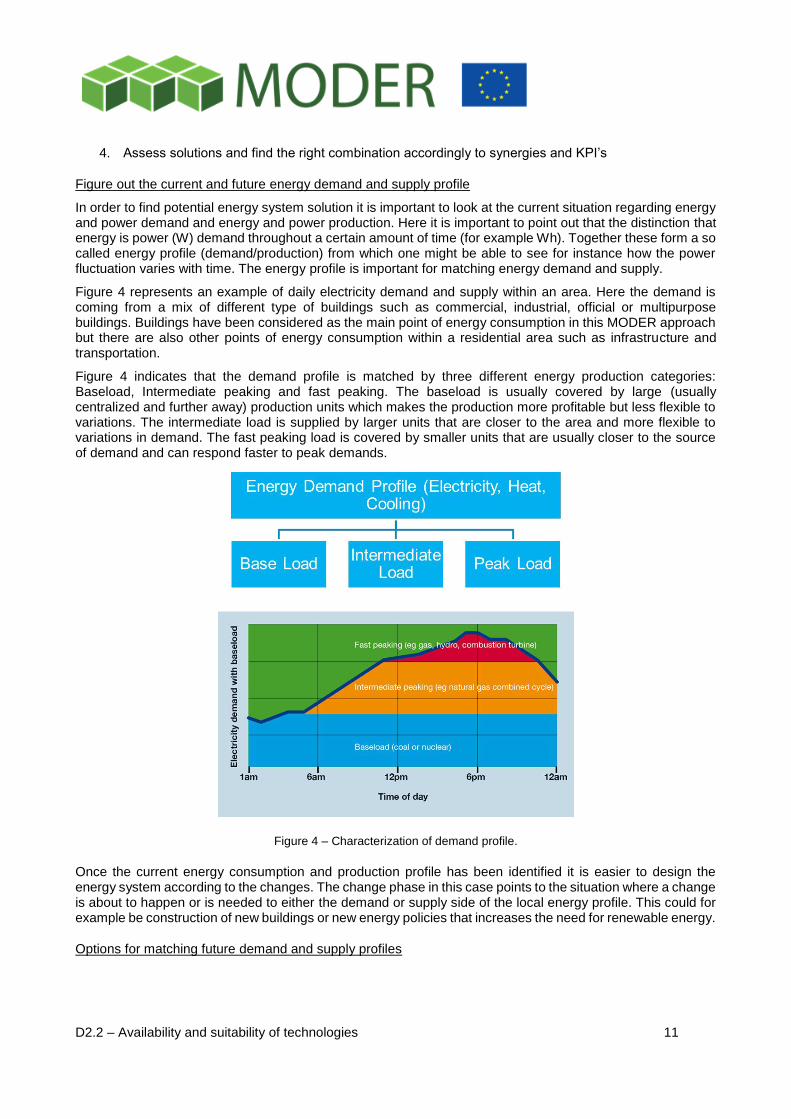
Figure 4 represents an example of daily electricity demand and supply within an area. Here the demand is coming from a mix of different type of buildings such as commercial, industrial, official or multipurpose buildings. Buildings have been considered as the main point of energy consumption in this MODER approach but there are also other points of energy consumption within a residential area such as infrastructure and transportation.
Figure 4 indicates that the demand profile is matched by three different energy production categories: Baseload, Intermediate peaking and fast peaking. The baseload is usually covered by large (usually centralized and further away) production units which makes the production more profitable but less flexible to variations. The intermediate load is supplied by larger units that are closer to the area and more flexible to variations in demand. The fast peaking load is covered by smaller units that are usually closer to the source of demand and can respond faster to peak demands.
Figure 4 – Characterization of demand profile.
Once the current energy consumption and production profile has been identified it is easier to design the energy system according to the changes. The change phase in this case points to the situation where a change is about to happen or is needed to either the demand or supply side of the local energy profile. This could for example be construction of new buildings or new energy policies that increases the need for renewable energy.
Options for matching future demand and supply profiles
D2.2 – Availability and suitability of technologies 12
Since the goal of the MODER approach is to match demand and supply profiles it important to look at the how the upcoming changes will affect these. Hence, the solutions are based on altering the demand or the production side. The usual means for doing this are:
Demand side:
Increasing energy efficiency of buildings and services
Guide user behaviors for better optimization the supply side
Incentives for services and industries for the favor of production
Supply side:
Increase production capacity
Choose production technologies that better match the demand profile and result in better key performance indicator marks
Addition of storage capacity
The demand side is caused mainly by buildings and the activities taking place in them. By increasing energy efficiency of the buildings and activities within the area the overall energy amount can be reduced. This could for example be increasing insulation, switching to less energy intensive appliances and electronics, automated temperature, lighting level and ventilation regulation, etc. Some services or industrial processes could be given incentives/regulated to take place outside of the peak hours in order to attain a more smooth demand curve. The same could be done with the consumer demand by directing their behavior. This is commonly called as demand flexibility
The actions at the supply side are mainly related to adjustment of current production capacity. What brings additional dimension to production is the suitability of different technologies (base, intermediate peaking and fast peaking load), variation of some renewable energy technologies and the dynamics of storage capacity. However, there might not always be a need for adjusting production capacity if other measures would be sufficient according to the goals and KPI’s assessments. One option would also be to supply the energy needed from production outside of the area of analysis which might require extending the current infrastructure (distribution).
It is necessary to point out here that the energy forms considered in this approach are heating cooling and electricity.
Identify potential technologies
Energy production methods and technologies should in general result in high utilization and conversion rates from primary energy sources, result in more use of renewable energy sources, ensure secure energy production, better production-to-demand matching and create businesses and services opportunities. There a several factors affecting the strategy of energy production. The goal should be to supply energy while striving for the best key performance indicators (KPI’s) marks. In this case it would be profitability (energy prices), environmental effects and security (self-sustainability).
Existing energy systems and infrastructures have to be taken into account when improvements are to be made: can they be improved or extended, can they be integrated with a new technology, what kind of synergies would they have with other technologies, how are they affected by changes in energy demand (flexibility and stability)?
The local resources could sometimes be of advantage in terms of the KPI’s. Examples of these could be organic waste from farming and food industry could be used for biofuels production, roofs and other fields clear from obstruction could be used for solar energy, water heating can be used from local rivers or lakes.
(Local) energy policies might either limit or act in favour of certain energy technology solutions. A common incentive would be in form of guaranteed tariffs for suppliers of energy from certain sources of renewable energy.
Buildings (or facilities) are to be viewed as points of energy consumption. Heating and cooling energy demands in buildings are closely related to weather and outside temperature. Electricity use may be caused
D2.2 – Availability and suitability of technologies 13
by heating, cooling and electrical appliances. Gas or other primary energy forms are sometimes used for cooking and heating of hot water. The energy demand profile is varying for different type of buildings.
Assess solutions and find the right combination accordingly to synergies and KPIs
Different RES technologies are of high interest in the context of MODER, primarily
Photovoltaics
Solar thermal
Wind (especially small wind turbines)
Waste-to-Energy in combination with biogas
Energy from wastewater and waste heat from data centers
Combined heat and power plants (CHP)
Cooling technologies using PV or solar thermal
They are available as large-scale solutions suitable for urban districts and are described in detail in the following chapters. Other RES technologies, such as small hydropower and geothermal (especially deep geothermal heat, partially in combination with heat pumps), are available as well but will play a minor role for district level refurbishment of buildings in a general view in our opinion and are thus mentioned much shorter. However, in special situations and geographical locations they may be utilized as well.
Intensive use of RES requires energy storages at different (distribution) levels to allow for a (partial) decoupling of energy supply and demand:
Thermal energy storage
Electrical energy storage (including hydrogen storage and fuel cells)
Biogas storage (mostly rural)
In this document the different energy production technologies are evaluated in terms of availability, suitability and synergies with each other. This evaluation is intended to aid users of the MODER approach. The suitability and possibility of technology combinations for upcoming projects have to incorporate existing or planned distribution technologies and networks, such as district heating and cooling (at different temperature levels), network levels and density of the electric grid. Implementing smart grids and smart meters, however, is considered to be a basic requirement to make use of RES, storage and distribution solutions to a great extent on district level.
D2.2 – Availability and suitability of technologies 14
3 District level technologies
When developed countries started to need and use energy massively, centralized energy systems, owned and managed by governments, appeared as the obvious solutions. This type of energy controlling maintained its hegemony till the beginning of this new millennium due to the unquestionable conviction of its resulting cost savings and improved reliability.
In fact, centralized systems demand a large investment to be implemented but are more economical to maintain. Due to the grid extension, power plants are larger but fewer, being easier to settle them without major obstacles. On the other side, decentralized systems do not present significantly lower costs, individual problems might be multiplied and they may be closer to residential or consumer areas.
On the technical point of view, both systems may suffer any kind of disruption, but in a centralized system it is expected that problems will be solved by the major utility service, which having to deal with all the problems in the grid, it is likely that the responsible entities will have better meanings to manage this situations than in distributed systems. From another point of view, blackout in a centralized system may be big in magnitude, affecting large areas for a long time, while blackouts in decentralized systems have much less impact in terms of area and time [30]. The same happens with energy losses which are much higher in centralised than in distributed systems.
Distributed systems started to be used as solutions in areas that did not have connection to a centralized energy system. However, with the change in energy paradigm, this solution has become a realistic option for non-remote areas, i.e. to be used in urban areas instead of centralised systems. Distributed systems in rural areas typically use renewable energy sources, including small hydro, biomass, biogas, solar, wind, and geothermal power. Consequently, distributed systems enable collection of energy from many sources improving security of supply while lowering environmental impacts. Efficient district heating and cooling (DHC) networks provide clear environmental benefits due to the use of renewable energy sources and their enhanced conversion of energy, DHC networks based on these carbon‐free and natural energy sources can achieve
energy efficiencies five to ten times higher than traditional electricity‐driven equipment.
In addition to the different advantages of distributed systems based on renewable energies they are essential to meet the goals defined during the Climate Change Conference held in Paris in 2015. For instance the government of Austria claimed that electric energy will be generated entirely by renewables by 2030.
Various technologies based on renewable energy sources available to district, buildings or group of buildings, energy supply will now be presented. Some study cases in Chapter 0 illustrate the different possibilities of using these technologies.
3.1 Heat Technologies
3.1.1 Solar thermal
Every hour the sun beams more than enough energy onto Earth to satisfy global energy needs for an entire year – including electricity, traffic, heat and cold. Solar energy is the technology used to harness the sun's energy and make it useable. Solar energy is unlimited and can be used, in principle, at almost any location of inhabited Earth.
Solar District Heating plants, large fields of solar thermal collectors that feed the district heating network with their produced heat, can be installed either on free ground or integrated into building roofs or facades. Typical shares of solar thermal production are up to 20% of the total heat supplied by the district heating systems.
Most of the solar thermal plants in Europe are installed in central or northern countries – Sweden, The Netherlands, Denmark, Germany and Austria, the yearly increase of installations is presently over 30%. Competitive heat prices below 50 €/MWh are reached and this result in good market perspectives for the next years [31].
D2.2 – Availability and suitability of technologies 15
In Germany, final energy consumption reached about 2,426 TWh in 2015: ca. 25% gross electric power consumption, ca. 27% energy consumption for traffic and the rest of about 48% for heat (space heating, hot water, process heat and cold) [32]. Hence, the heat sector is responsible for almost 50% of the final energy consumption – within that space heating takes the major part. Contrary to the transformation of the electricity sector in Germany, which has made great progress during the last years, the energy transition of heat and traffic has not really been addressed yet but offers huge potentials [33].
Heating water using solar collectors can be a viable source of energy that can reduce gas or electricity consumption for heating water by around 50 to 70%, [34].
3.1.1.1 Types of solar thermal collectors
For roof-top and façade applications mainly three different types of collectors are used: unglazed collectors (so-called “pool collectors”), flat plate collectors and evacuated tube collectors. Unglazed collectors are very simple in their construction, have a low efficiency and are therefore cheap – they play an insignificant role in Europe and will not be addressed in this project.
In Europe the installed capacity has reached 49 GW th in 2014 (approx. 68 Mio m2), divided in approx. 84% flat plate collectors and 11% evacuated tube collectors. In 2015, the newly installed collectors can be divided into 76% flat plate collectors and 23% evacuated tube collectors, clearly indicating that evacuated tube collectors are on the rise in Europe [35]. Globally, China has the highest installed capacity and – contrary to Europe – evacuated tube collectors dominate by far.
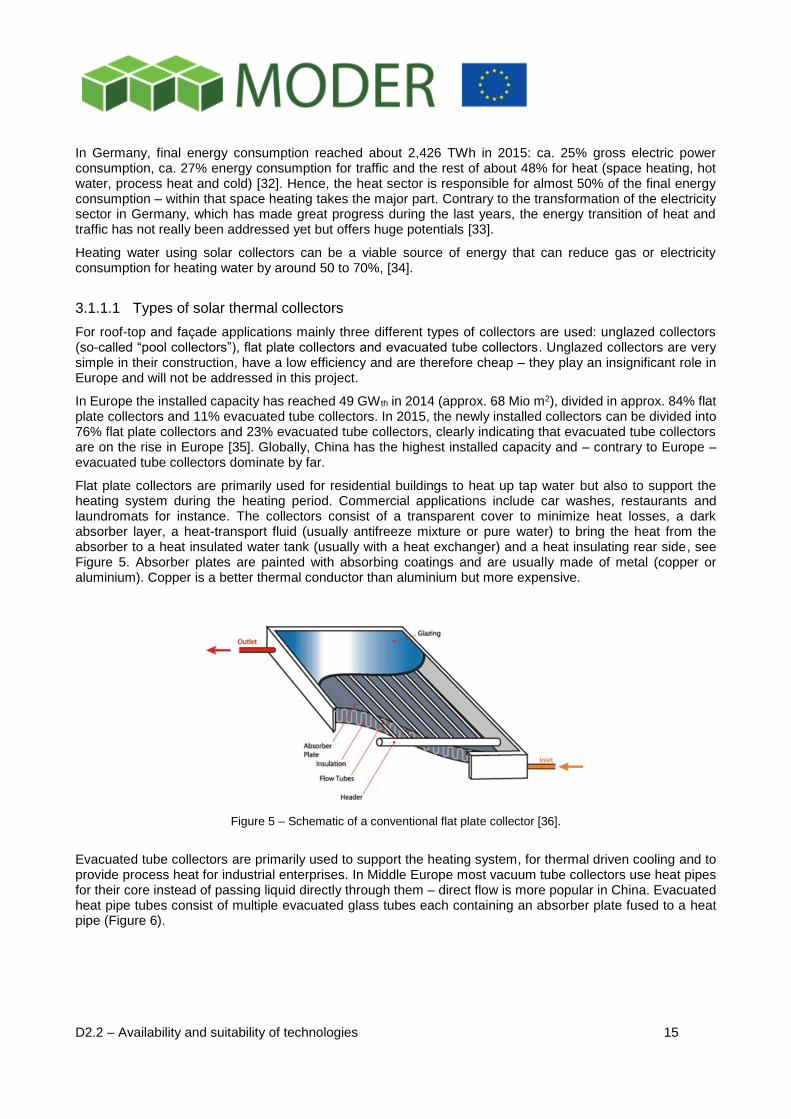
Flat plate collectors are primarily used for residential buildings to heat up tap water but also to support the heating system during the heating period. Commercial applications include car washes, restaurants and laundromats for instance. The collectors consist of a transparent cover to minimize heat losses, a dark absorber layer, a heat-transport fluid (usually antifreeze mixture or pure water) to bring the heat from the absorber to a heat insulated water tank (usually with a heat exchanger) and a heat insulating rear side, see Figure 5. Absorber plates are painted with absorbing coatings and are usually made of metal (copper or aluminium). Copper is a better thermal conductor than aluminium but more expensive.
Figure 5 – Schematic of a conventional flat plate collector [36].
Evacuated tube collectors are primarily used to support the heating system, for thermal driven cooling and to provide process heat for industrial enterprises. In Middle Europe most vacuum tube collectors use heat pipes for their core instead of passing liquid directly through them – direct flow is more popular in China. Evacuated heat pipe tubes consist of multiple evacuated glass tubes each containing an absorber plate fused to a heat pipe (Figure 6).
D2.2 – Availability and suitability of technologies 16
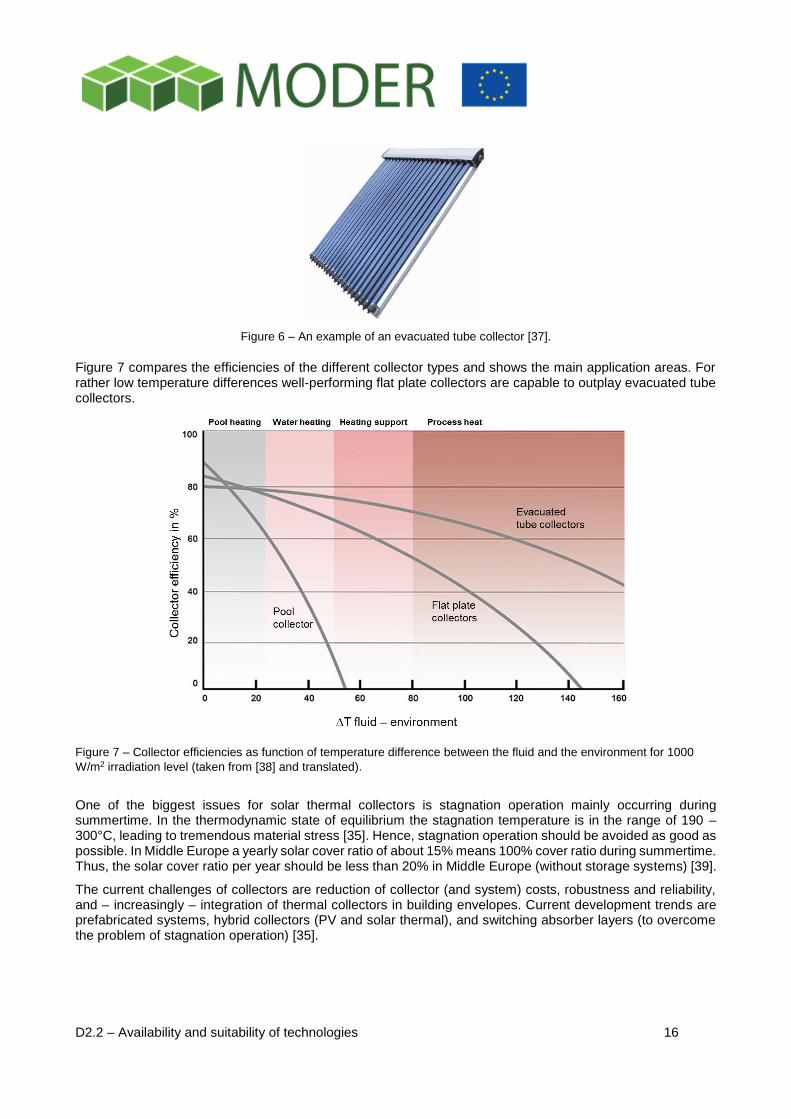
Figure 6 – An example of an evacuated tube collector [37].
Figure 7 compares the efficiencies of the different collector types and shows the main application areas. For rather low temperature differences well-performing flat plate collectors are capable to outplay evacuated tube collectors.
Figure 7 – Collector efficiencies as function of temperature difference between the fluid and the environment for 1000
W/m2 irradiation level (taken from [38] and translated).
One of the biggest issues for solar thermal collectors is stagnation operation mainly occurring during summertime. In the thermodynamic state of equilibrium the stagnation temperature is in the range of 190 – 300°C, leading to tremendous material stress [35]. Hence, stagnation operation should be avoided as good as possible. In Middle Europe a yearly solar cover ratio of about 15% means 100% cover ratio during summertime. Thus, the solar cover ratio per year should be less than 20% in Middle Europe (without storage systems) [39].
The current challenges of collectors are reduction of collector (and system) costs, robustness and reliability, and – increasingly – integration of thermal collectors in building envelopes. Current development trends are prefabricated systems, hybrid collectors (PV and solar thermal), and switching absorber layers (to overcome the problem of stagnation operation) [35].
D2.2 – Availability and suitability of technologies 17
3.1.1.2 Solar thermal plants – a general discussion
The number of newly installed small solar thermal plants, especially on private residential and single buildings, remains static or even drops worldwide, in contrast to big solar farms [33]. The reasons are manifold and can be mainly attributed to economies of scale:
The specific investment costs for collectors and especially heat storage decreases with the system size.
The specific mounting costs decrease with system size.
No or very short time periods of stagnation, resulting in high collector yields in the range of 450 – 500 kWh/m2 in Middle Europe [33].
Economically interesting are “simple” plants of at least 1 MWth and higher with an annual solar coverage of 20% and less. Then, heat generation costs of 25 – 35 €/MWhth for large plants in Middle Europe can be achieved for good locations and well-below 50 €/MWhth in general without subsidies. In terms of generation costs large solar thermal plants are 4 – 6 times more economic than small systems on privately owned houses [40].
Robust and well-known heat costs from the beginning. That is, prices for solar heating are fixed over a period of 25 years.
Rather large solar thermal systems are feasible throughout Europe (even in Sweden) [39]. Solar thermal is mainly used to cover the basic load, for peak load mostly CHP or gas-fired power plants are used [41]. Solar cover ratios of 20% without and up to 50% with thermal storage systems are realistic. Denmark is a pioneer in large-scale projects, in Germany and Austria big projects are in negotiation.
The oil crisis in the 1970s was the origin for a sustainable rethinking in Denmark´s energy policy. The consequences have been derived in a social consensus, the implementation of the necessary measures has been carried out under stable conditions and was unaffected by changes of government for several decades [40]. Fossil energies are charged with a higher tax instead of subsidizing RES. In addition, the grid temperatures in Denmark are much lower than in Austria for instance and are thus advantageous for solar thermal feeding [41]. As a result, the share of citizens served by DH in Denmark reached 62% in 2013 – compared to only 12% in Germany and approx. 23% in Austria [40]. For large scale plants with greater than 500 m2 installed collector area Denmark leads with 577 MW th, followed by Germany and Austria with approximately 30 MWth each [42]. Denmark aims at 50% share in RES in heat and electricity until 2050.
3.1.1.3 Solar thermal plants in refurbishment
Despite the economic advantages of big solar plants, distributed solar thermal collectors can be meaningful especially within built-up areas and refurbishment of buildings. They can be used in small micro grids for instance, using centralized thermal energy storage systems. Often challenging, however, are insufficient static situations of rooftops and – as economic reference values – the currently low gas and oil price. For company or office buildings, department stores, government buildings, and schools the advertising value of visible solar thermal systems is, however, often crucial rather than commercial aspects [41]. In this cases even façade integrated systems have been realized though they are much more expensive. Moreover, small solar thermal plants often receive subsidies from the federal states or the republic.
Refurbishment of neighboring buildings can include individual rooftop or façade integrated (or added) solar thermal collectors, which are summarized to a larger solar plant with shared equipment such as energy storage systems. Surplus energy can be fed into an existing DH system – decentralized feeding into a DH system is technically complex and plays a minor role presently [39] but several projects address this obstacle, for instance the solar district heating project in Graz (see Chapter 5.10). For first rough estimations of energy yields and economic aspects a web-based calculator for centralized and decentralized integration into DH systems can be found at [43]. In the case of cross-building energy exchange a detailed view of the individual components and especially economical and legal aspects is necessary. The heat exchange can be realized either via private lines or via an existing public heat grid. In addition, numerous owners and users make the situation often complex. A systematic analysis of the legal and economic aspects of cross-building energy exchange under consideration of technical relevant restrictions can be found in [44]. In addition, based on the
D2.2 – Availability and suitability of technologies 18
legal analyses, an Austrian-wide standard contract for the heat sector is created and thus serves as a basic conclusion of this study.
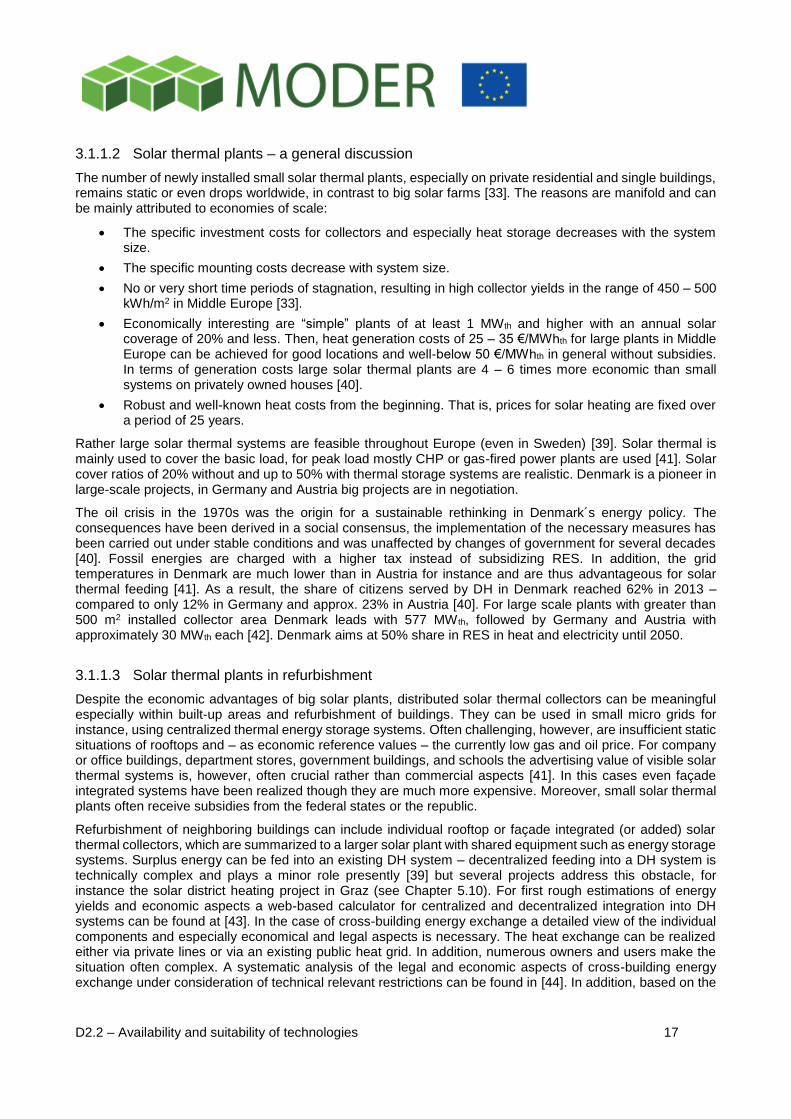
In addition to technical, economical and legal aspects, the aesthetic application of collectors in built-up areas is important for a broad acceptance of the citizens and hence for a large-scale implementation of solar thermal systems (this aspect is very similar to the integration of PV panels in the building envelope). From the architectural view, the solar energy gains can be focused on two areas: on the one hand as a normative-generic standard option, which provides elevated panels on – if available – flat roofs, and for this in general only small design changes are necessary, and on the other hand, the extension of active solar thermal areas in the roof or façade area which intervene directly and profoundly in existing and future appearances. The use of roof panels can be seen as a first option in the urban environment because little shading of the collector occurs. For the integration of façade panels a situation-specific shading analysis should be done in advance. Furthermore, comparative studies and visualization and the integration of all relevant parties into the development process and its iterative decision-making it essential for the achievement of solid designed solutions [45]. Numerous examples of rooftop and façade installations are shown and discussed in detail in the report “Urban solar energy” [45]. For instance, Figure 8 shows two different design studies of thermal collectors integrated in the façade of an existing high-rise apartment building in Graz (Austria).
Figure 8 – Design studies of an apartment house of the 1970s in Graz/Austria – façade integration of flat panel collectors
on the left hand side and evacuated tube collectors on the right hand side [45].
The discussion of solar thermal panels added to roofs or integrated in façades or in the building envelope in general is very similar to the one for photovoltaic panels in Chapter 3.2.1.2: The differentiation between building added and building integrated panels is crucial. Building integrated means that the panels do not only provide solar energy (heat) but also account for weather protection, shading or thermal insulation for instance (multifunctional use of solar thermal panels). In these cases, synergy effects to other building materials and systems arise (see also Chapter 3.2.1.4) leading to a better cost effectiveness and shorter payback periods.
3.1.1.4 Potentials of solar thermal energy
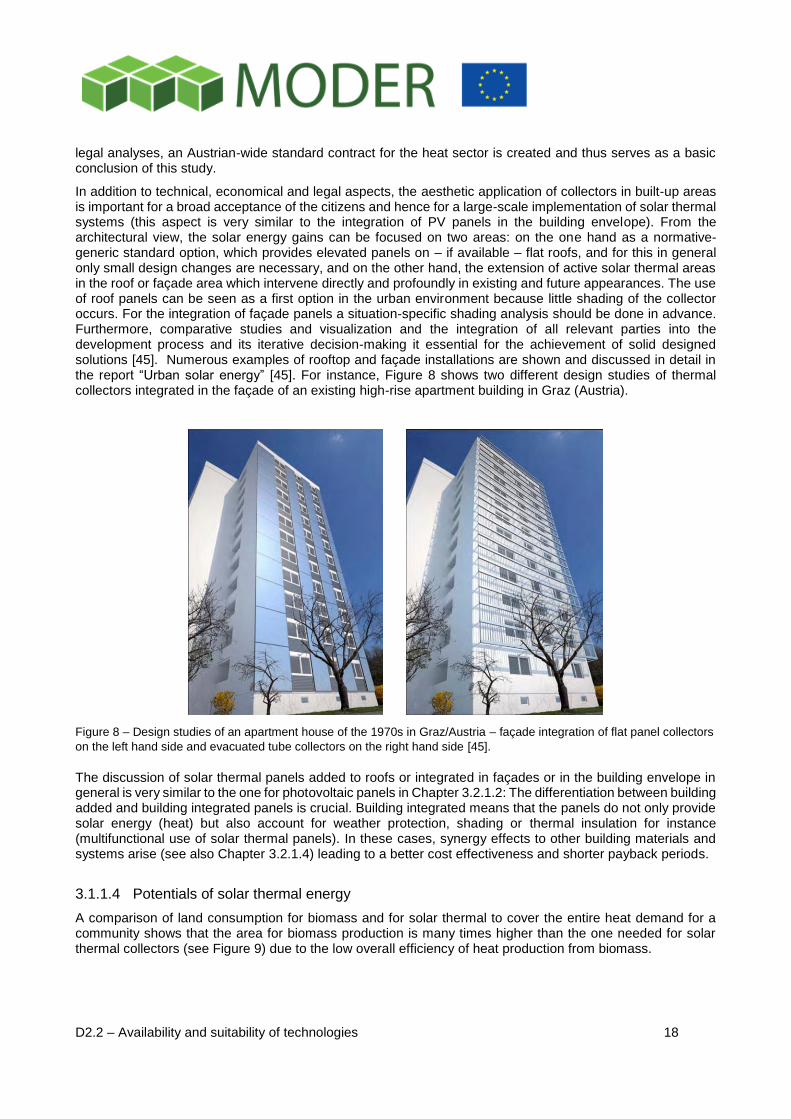
A comparison of land consumption for biomass and for solar thermal to cover the entire heat demand for a community shows that the area for biomass production is many times higher than the one needed for solar thermal collectors (see Figure 9) due to the low overall efficiency of heat production from biomass.
D2.2 – Availability and suitability of technologies 19
Figure 9 – Comparison of land consumption to cover the entire heat demand for a community: on the left hand side with
biomass (green areas), on the right hand side with solar thermal plants (orange fields) (taken from [40], source: Solites).
In urban areas, however, free space is usually strongly limited and should be used for parks and leisure activities rather than for energy production. Hence, the covering of buildings should be energetically activated as good as possible.
The potential of solar thermal energy is closely correlated to the potential of PV (see also Chapter 3.2.1.3). Many cities and regions provide solar potential cadastres with very detailed information. Recently a new solar cadastre for the region Hessen/Germany was put online, showing the potential of both electricity generation as well as solar thermal for heat generation [46]. The integrated cost calculator provides information on payback period and return of investment for solar plants. In 2010 the Vienna magistrate departments MA 41 (City Surveyor), MA 22 (Department of Environmental Protection) and MA 39 (Testing, Inspection and Certification Authority) conducted a comprehensive analysis of the potential for solar energy of rooftops in Vienna and packed the results into a significant cadastre for the entire city [47]. As a result 55% of the roofs are suitable for PV and solar thermal, correlating with a roof area of ca. 29 km2 (!) – Vienna covers about 415 km2 with about 52 km2 roof area. 21 km2 out of the 29 km2 are “very well suitable”, 8 km2 are “well suitable” for solar use. The theoretical solar electricity potential is approximately 4,300 GWhel/year (the total electric power consumption was 8,200 GWhel in 2014 [48]), the theoretical solar thermal potential amounts to about 27,300 GWhth/year – without considering other possibilities of integration, such as façades and noise protection walls.
3.1.2 Geothermal
Geoenergy is energy that is stored in soil, bedrock, groundwater, sediment layers, lake and river or sea water. Geothermal energy is originated from the heat retained within the Earth since the original formation of the planet, from radioactive decay of minerals and from solar energy absorbed at the surface. Most high temperature of geothermal heat is harvested in regions close to tectonic plate boundaries, where volcanic activity rises close to the surface of the Earth. In these areas, ground and groundwater can be found with temperatures higher than the target temperature of the application. However, even cold ground contains heat, below 6 metres the undisturbed ground temperature is consistently at the Mean Annual Air Temperature and it may be extracted with a heat pump.
The technology for ground and bedrock heating has existed for a long time, and several European countries have a long tradition in geothermal district heating. However Europe presents a higher potential that the one is in use. This technology can be used in all territory and more than 25% of the EU population lives in areas directly suitable for Geothermal District Heating. Geothermal can be installed with existing DH systems during extension or renovation, replacing fossil fuels and be built in many regions of Europe at competitive costs.
D2.2 – Availability and suitability of technologies 20
The geothermal energy source is free of cost, but the upfront investments to use it are significant. The higher upfront-costs of geothermal district heating can be compensated by much lower operating costs, but only if a sufficiently low ‘cost of capital’ can be reached.
The main benefits of geothermal heating and cooling are provision of local, baseload and flexible renewable energy, diversification of the energy mix, and protection against volatile and rising fossil fuels prices [49].
Looking at deep geothermal plants (deeper than 400 m and temperatures higher than 60°C) we are faced with large dimensions (in the MWth range), high fixed costs and long realisation processes (e.g. due to ecological audits). The geographic potentials are restricted on certain areas – in Germany for instance mainly in the regions North German Plain, Upper Rhine Rift and Molasse Basin [33]. The ‘hot’ GeoDH markets in Europe are in France (Paris, and renewed activity in the Aquitaine basin), Germany (Munich) and Hungary, but geothermal DH systems can be installed in principal in all European countries. There are also some new District heating schemes that utilise shallow geothermal resources, assisted by large heat pumps [50].
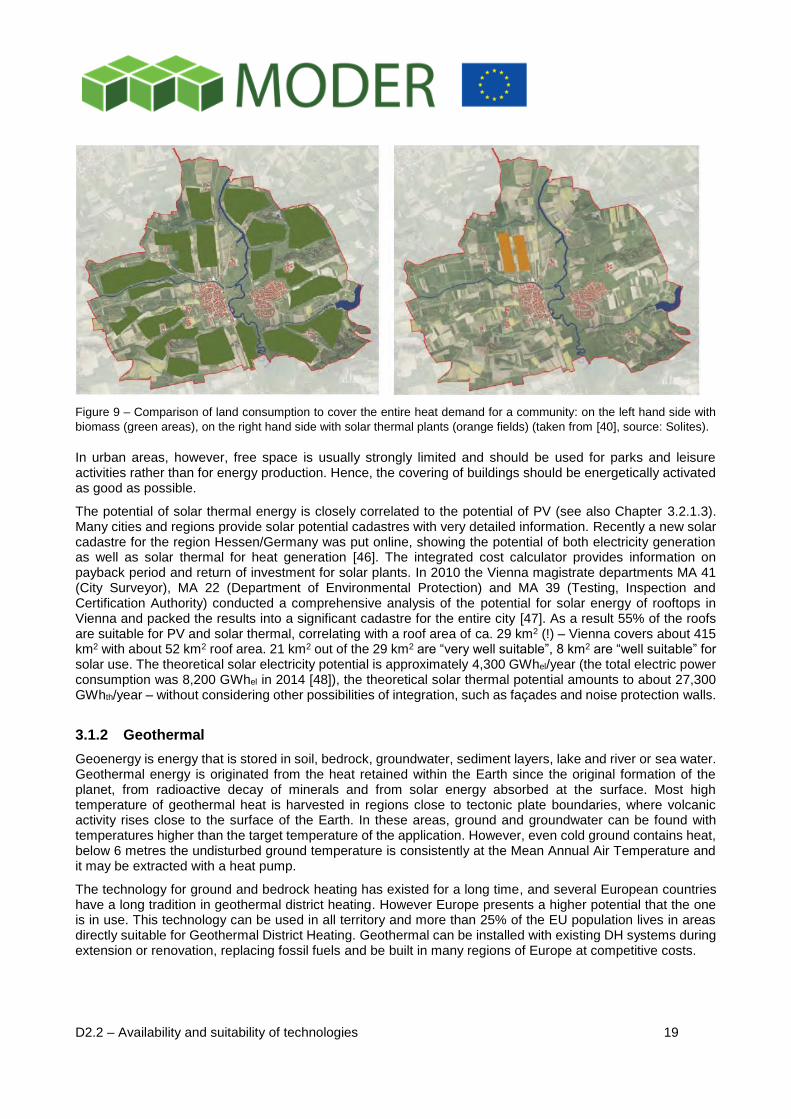
Figure 10 schematically shows the principal of GeoDH system. Following [50], Modern doublet designs of GeoDH systems include two wells drilled in deviation from a single drilling pad. Bottom hole spacing’s are designed to secure a minimum twenty year span, before cooling of the production well occurs. Well depths (deviated) of 2,000 m to 3,500 m are not uncommon; and these are often located in sensitive, densely populated urban environments, therefore requiring heavy duty, silent rigs (up to 350 tons hook loads, diesel electric drive). Systems with lower temperatures are often assisted by heat pumps. In several countries (e.g. Denmark, Germany, Iceland) absorption heat pumps, often combined with geothermal Combined Heat & Power plants (CHP), have been successfully installed and operated. Moreover, the installation of GeoDH systems close to regions with high urban density is economically advantageous, as resources and demand need to be geographically matched as good as possible.
One considerable challenge in the current economic crisis concerns the financing and the development of new heat grid infrastructures. In urban areas also oppositions and citizens´ initiatives against large-scale projects should be taken into consideration. Retrofitting existing district heating systems is an alternative for developing the GeoDH market.
Figure 10 – Schematic of a GeoDH system [50].
D2.2 – Availability and suitability of technologies 21
3.1.3 Waste-to-energy and biogas
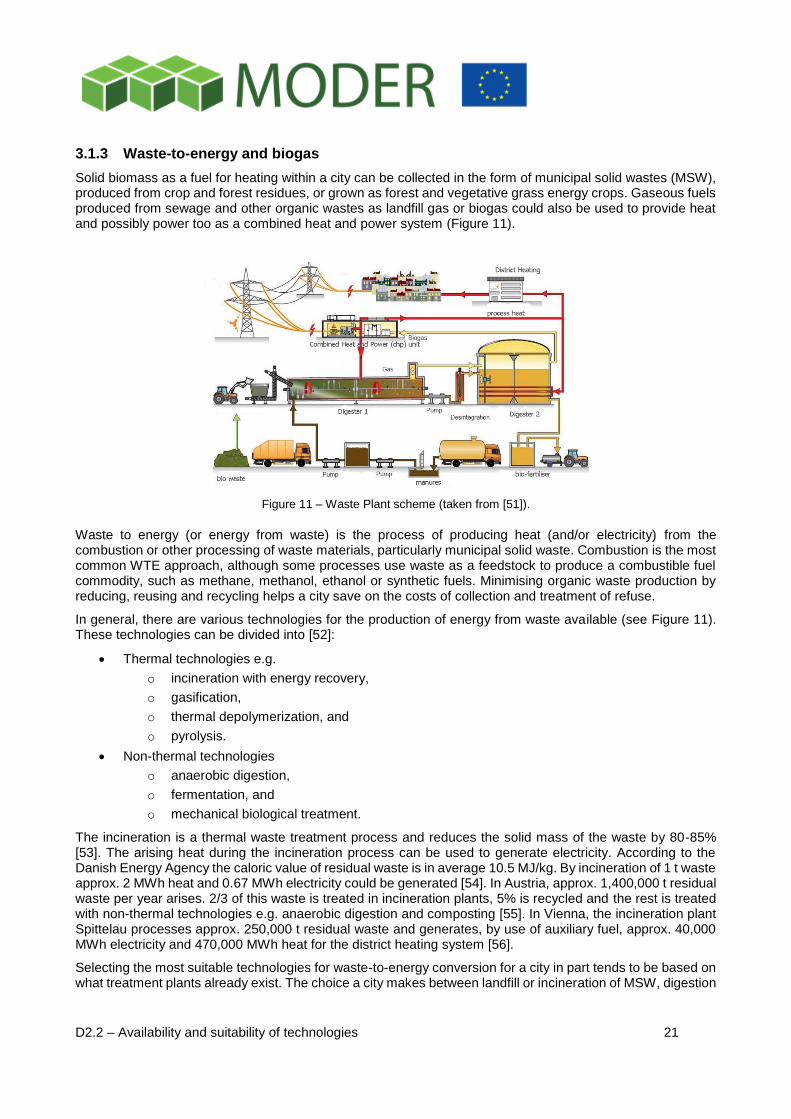
Solid biomass as a fuel for heating within a city can be collected in the form of municipal solid wastes (MSW), produced from crop and forest residues, or grown as forest and vegetative grass energy crops. Gaseous fuels produced from sewage and other organic wastes as landfill gas or biogas could also be used to provide heat and possibly power too as a combined heat and power system (Figure 11).
Figure 11 – Waste Plant scheme (taken from [51]).
Waste to energy (or energy from waste) is the process of producing heat (and/or electricity) from the combustion or other processing of waste materials, particularly municipal solid waste. Combustion is the most common WTE approach, although some processes use waste as a feedstock to produce a combustible fuel commodity, such as methane, methanol, ethanol or synthetic fuels. Minimising organic waste production by reducing, reusing and recycling helps a city save on the costs of collection and treatment of refuse.
In general, there are various technologies for the production of energy from waste available (see Figure 11). These technologies can be divided into [52]:
Thermal technologies e.g.
o incineration with energy recovery,
o gasification,
o thermal depolymerization, and
o pyrolysis.
Non-thermal technologies
o anaerobic digestion,
o fermentation, and
o mechanical biological treatment.
The incineration is a thermal waste treatment process and reduces the solid mass of the waste by 80-85% [53]. The arising heat during the incineration process can be used to generate electricity. According to the Danish Energy Agency the caloric value of residual waste is in average 10.5 MJ/kg. By incineration of 1 t waste approx. 2 MWh heat and 0.67 MWh electricity could be generated [54]. In Austria, approx. 1,400,000 t residual waste per year arises. 2/3 of this waste is treated in incineration plants, 5% is recycled and the rest is treated with non-thermal technologies e.g. anaerobic digestion and composting [55]. In Vienna, the incineration plant Spittelau processes approx. 250,000 t residual waste and generates, by use of auxiliary fuel, approx. 40,000 MWh electricity and 470,000 MWh heat for the district heating system [56].
Selecting the most suitable technologies for waste-to-energy conversion for a city in part tends to be based on what treatment plants already exist. The choice a city makes between landfill or incineration of MSW, digestion
D2.2 – Availability and suitability of technologies 22
or incineration of sewage sludge, recycling for materials or separation for energy is largely site-specific and cost related. Additional biomass could be imported to increase the economy of scale of the waste-to-energy projects and obtain improved energy performance from the overall city waste system.
3.1.3.1 Remarks on landfill gas
Landfill gas site concepts consist in collecting the methane gas produced from decomposing rubbish and using it for practical application. The gas can be combusted directly for useful heat generation on-site or combusted in a gas engine driving a power generator. If injected into a gas pipeline, it first needs to be scrubbed to reach acceptable quality standards.
However, landfill is the least preferable option and should be limited to a minimum. In the EU Directive 1999/31/EC different requirements for the landfill of waste are defined [57]. According to these requirements the landfill of organic components is restricted. Hence, the amount of gas from landfill sites will further decrease in the next decades.
Landfill gas must be treated to remove impurities, condensate, and particulates. Two constituents that may need to be removed are siloxanes and sulfur compounds, which are damaging the equipment and significantly increase maintenance cost. Siloxanes are converted into silicates and micro-crystalline quartz, which contribute to abrasion of the inner surfaces within the combustion engine [58]. The authors of Reference [58] found various silicon compounds in landfill gas in concentrations of up to 50 mg/m3. These concentrations were far beyond the limit of 15 mg/m3 required by several engine manufacturers. Thus, a gas pretreatment is highly recommended – different techniques exist, e.g. by using activated charcoal.
If the collected landfill gas is cleaned it is more or less chemically identical to biogas from sources. It can then be used in the same way as described in Chapter 3.1.3.4. Because the collecting and use of landfill gas has no direct impact to the refurbishing of buildings at district level we do not discuss this issue further in the context of MODER.
3.1.3.2 Feedstock for biogas production in urban areas
In this study, we will describe the streams of industrial waste and municipal waste as input material for biogas plants. The use of agricultural residues would not be useful in (sub-)urban areas. The biogas plant will lead to additional transportations of the residues from the fields to the biogas plant, and the bring-up of the digestate on the fields would be a problem. In Austria, approximately 300 biogas plants are installed. In 55% of the plants the input materials are agricultural residues (like maize or grass silage) followed by bio-waste and food waste (25%) and slurry or manure (20%) [59].
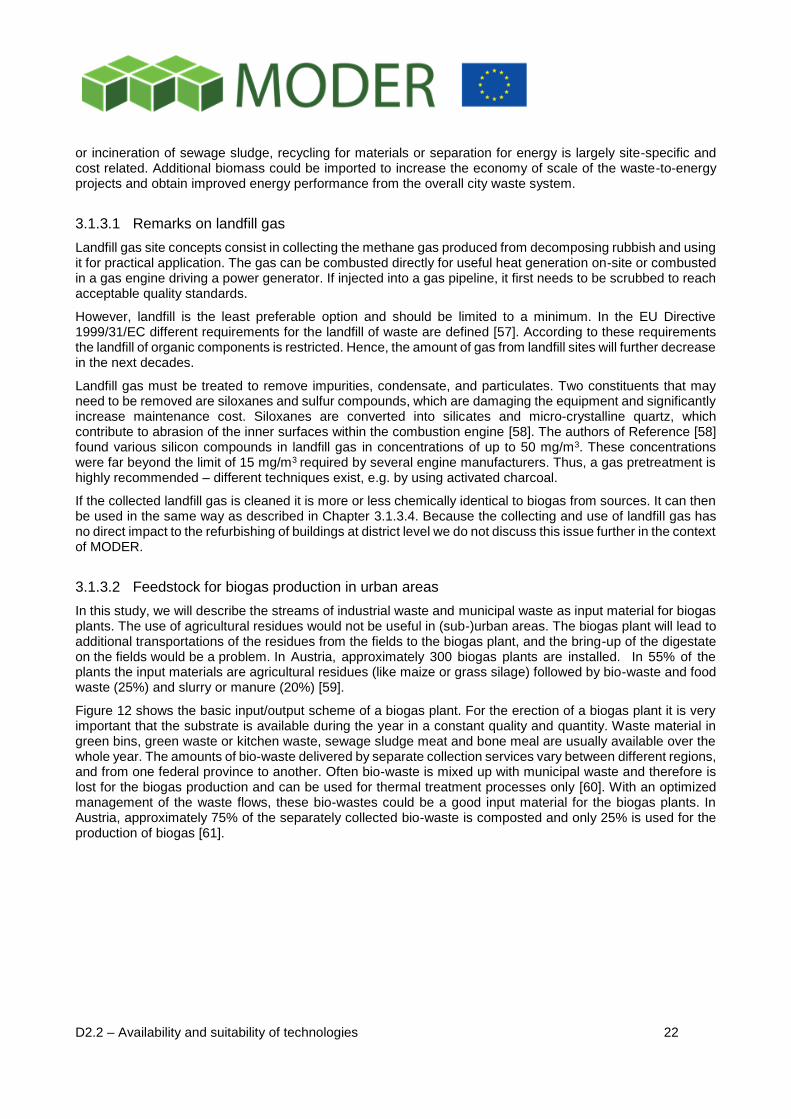
Figure 12 shows the basic input/output scheme of a biogas plant. For the erection of a biogas plant it is very important that the substrate is available during the year in a constant quality and quantity. Waste material in green bins, green waste or kitchen waste, sewage sludge meat and bone meal are usually available over the whole year. The amounts of bio-waste delivered by separate collection services vary between different regions, and from one federal province to another. Often bio-waste is mixed up with municipal waste and therefore is lost for the biogas production and can be used for thermal treatment processes only [60]. With an optimized management of the waste flows, these bio-wastes could be a good input material for the biogas plants. In Austria, approximately 75% of the separately collected bio-waste is composted and only 25% is used for the production of biogas [61].
D2.2 – Availability and suitability of technologies 23
Figure 12 – Basic scheme of a biogas plant [60].
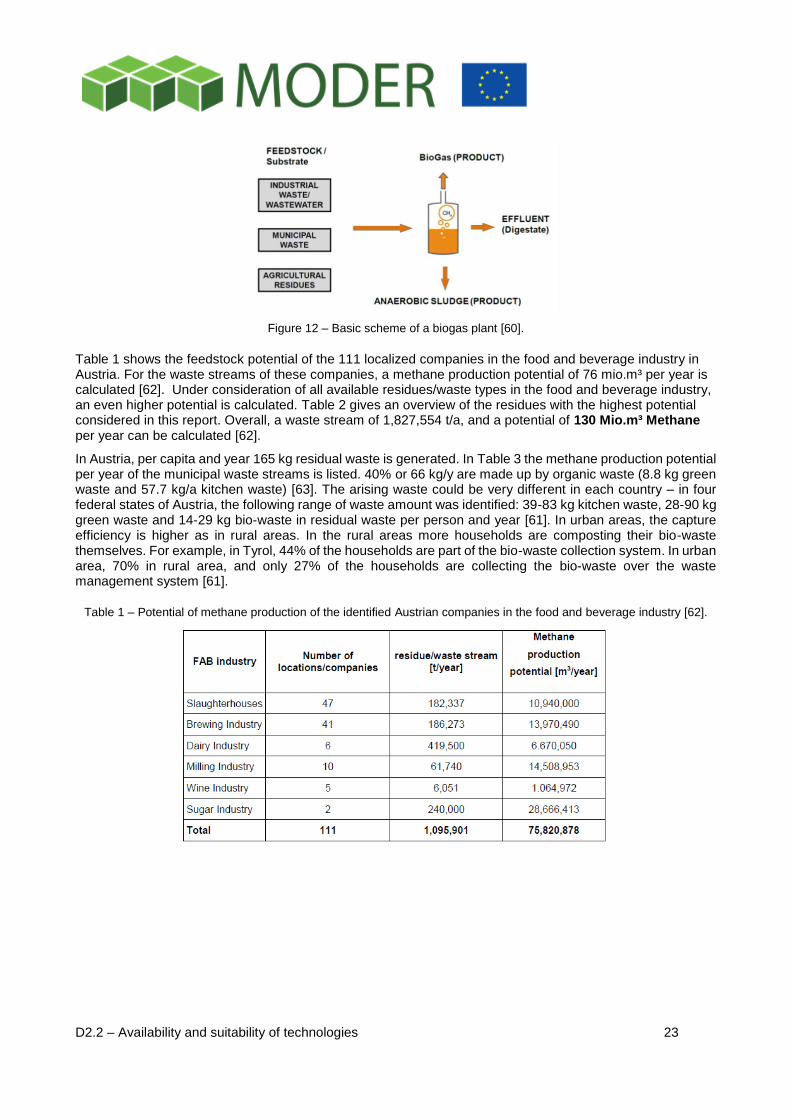
Table 1 shows the feedstock potential of the 111 localized companies in the food and beverage industry in Austria. For the waste streams of these companies, a methane production potential of 76 mio.m³ per year is calculated [62]. Under consideration of all available residues/waste types in the food and beverage industry, an even higher potential is calculated. Table 2 gives an overview of the residues with the highest potential considered in this report. Overall, a waste stream of 1,827,554 t/a, and a potential of 130 Mio.m³ Methane per year can be calculated [62].
In Austria, per capita and year 165 kg residual waste is generated. In Table 3 the methane production potential per year of the municipal waste streams is listed. 40% or 66 kg/y are made up by organic waste (8.8 kg green waste and 57.7 kg/a kitchen waste) [63]. The arising waste could be very different in each country – in four federal states of Austria, the following range of waste amount was identified: 39-83 kg kitchen waste, 28-90 kg green waste and 14-29 kg bio-waste in residual waste per person and year [61]. In urban areas, the capture efficiency is higher as in rural areas. In the rural areas more households are composting their bio-waste themselves. For example, in Tyrol, 44% of the households are part of the bio-waste collection system. In urban area, 70% in rural area, and only 27% of the households are collecting the bio-waste over the waste management system [61].
Table 1 – Potential of methane production of the identified Austrian companies in the food and beverage industry [62].
D2.2 – Availability and suitability of technologies 24
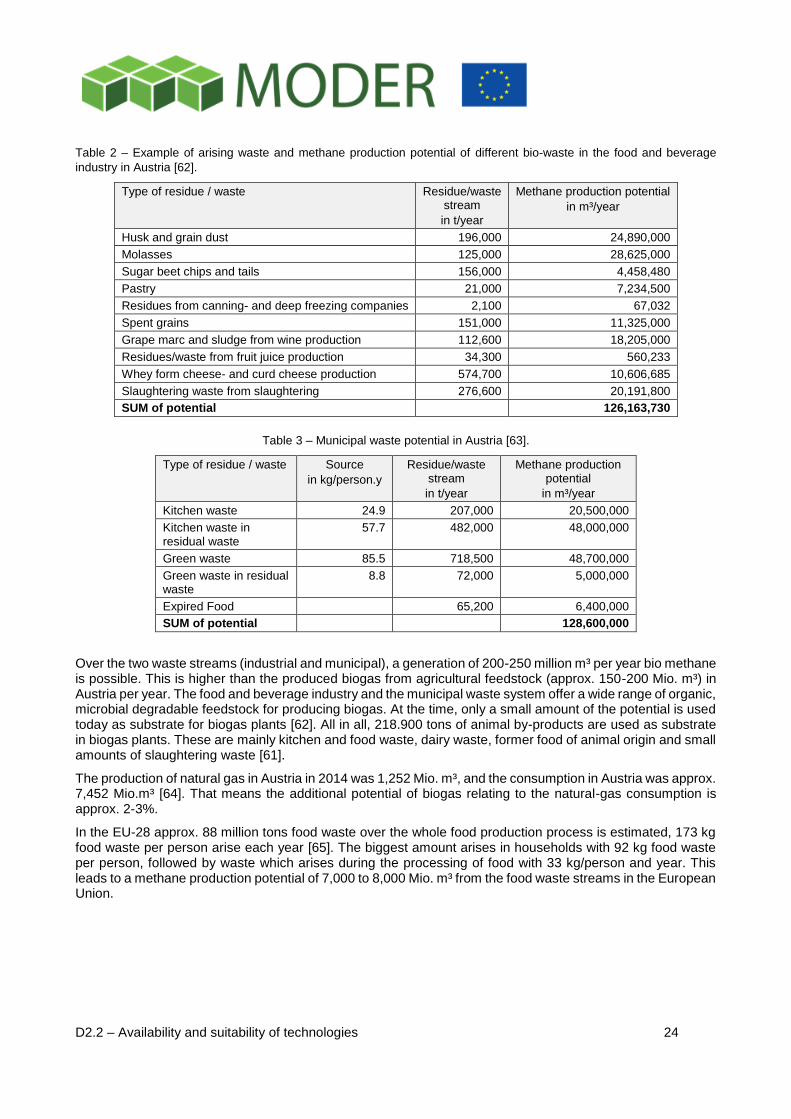
Table 2 – Example of arising waste and methane production potential of different bio-waste in the food and beverage
industry in Austria [62].
Type of residue / waste Residue/waste stream
in t/year
Methane production potential
in m³/year
Husk and grain dust 196,000 24,890,000
Molasses 125,000 28,625,000
Sugar beet chips and tails 156,000 4,458,480
Pastry 21,000 7,234,500
Residues from canning- and deep freezing companies 2,100 67,032
Spent grains 151,000 11,325,000
Grape marc and sludge from wine production 112,600 18,205,000
Residues/waste from fruit juice production 34,300 560,233
Whey form cheese- and curd cheese production 574,700 10,606,685
Slaughtering waste from slaughtering 276,600 20,191,800
SUM of potential 126,163,730
Table 3 – Municipal waste potential in Austria [63].
Type of residue / waste Source
in kg/person.y
Residue/waste stream
in t/year
Methane production potential
in m³/year
Kitchen waste 24.9 207,000 20,500,000
Kitchen waste in residual waste
57.7 482,000 48,000,000
Green waste 85.5 718,500 48,700,000
Green waste in residual waste
8.8 72,000 5,000,000
Expired Food 65,200 6,400,000
SUM of potential 128,600,000
Over the two waste streams (industrial and municipal), a generation of 200-250 million m³ per year bio methane is possible. This is higher than the produced biogas from agricultural feedstock (approx. 150-200 Mio. m³) in Austria per year. The food and beverage industry and the municipal waste system offer a wide range of organic, microbial degradable feedstock for producing biogas. At the time, only a small amount of the potential is used today as substrate for biogas plants [62]. All in all, 218.900 tons of animal by-products are used as substrate in biogas plants. These are mainly kitchen and food waste, dairy waste, former food of animal origin and small amounts of slaughtering waste [61].
The production of natural gas in Austria in 2014 was 1,252 Mio. m³, and the consumption in Austria was approx. 7,452 Mio.m³ [64]. That means the additional potential of biogas relating to the natural-gas consumption is approx. 2-3%.
In the EU-28 approx. 88 million tons food waste over the whole food production process is estimated, 173 kg food waste per person arise each year [65]. The biggest amount arises in households with 92 kg food waste per person, followed by waste which arises during the processing of food with 33 kg/person and year. This leads to a methane production potential of 7,000 to 8,000 Mio. m³ from the food waste streams in the European Union.
D2.2 – Availability and suitability of technologies 25
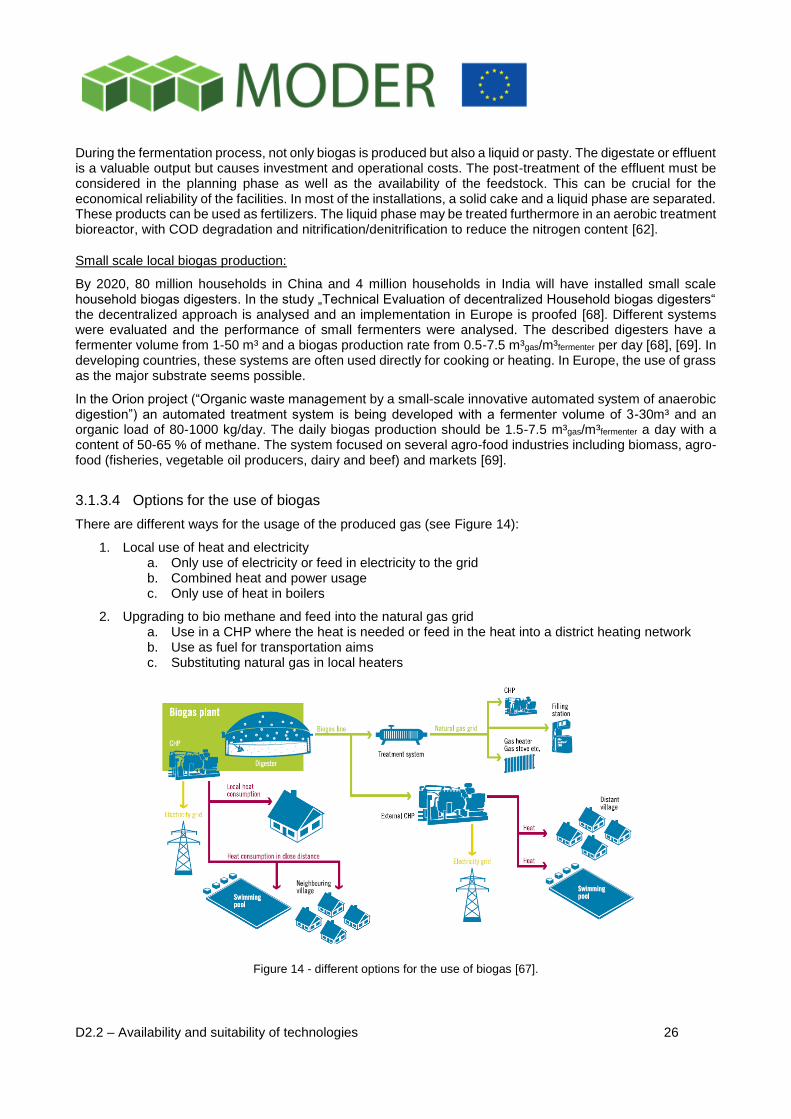
3.1.3.3 Production, treatment and use of biogas
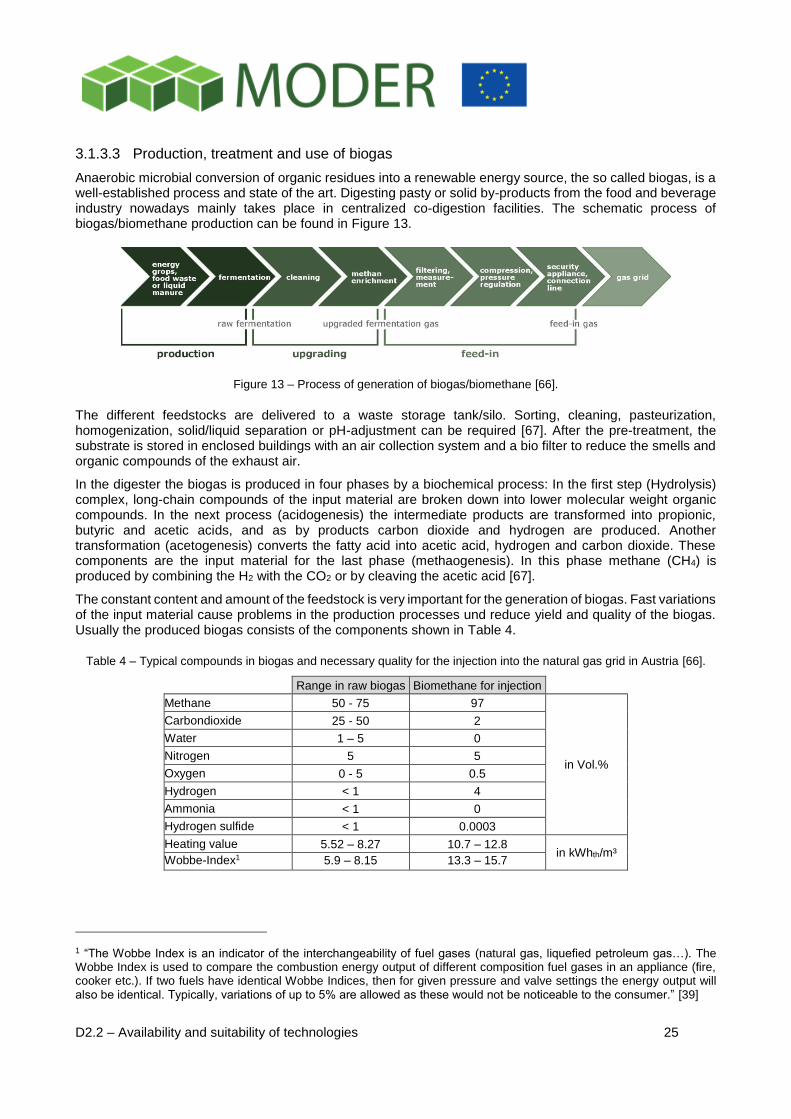
Anaerobic microbial conversion of organic residues into a renewable energy source, the so called biogas, is a well-established process and state of the art. Digesting pasty or solid by-products from the food and beverage industry nowadays mainly takes place in centralized co-digestion facilities. The schematic process of biogas/biomethane production can be found in Figure 13.
Figure 13 – Process of generation of biogas/biomethane [66].
The different feedstocks are delivered to a waste storage tank/silo. Sorting, cleaning, pasteurization, homogenization, solid/liquid separation or pH-adjustment can be required [67]. After the pre-treatment, the substrate is stored in enclosed buildings with an air collection system and a bio filter to reduce the smells and organic compounds of the exhaust air.
In the digester the biogas is produced in four phases by a biochemical process: In the first step (Hydrolysis) complex, long-chain compounds of the input material are broken down into lower molecular weight organic compounds. In the next process (acidogenesis) the intermediate products are transformed into propionic, butyric and acetic acids, and as by products carbon dioxide and hydrogen are produced. Another transformation (acetogenesis) converts the fatty acid into acetic acid, hydrogen and carbon dioxide. These components are the input material for the last phase (methaogenesis). In this phase methane (CH4) is produced by combining the H2 with the CO2 or by cleaving the acetic acid [67].
The constant content and amount of the feedstock is very important for the generation of biogas. Fast variations of the input material cause problems in the production processes und reduce yield and quality of the biogas. Usually the produced biogas consists of the components shown in Table 4.
Table 4 – Typical compounds in biogas and necessary quality for the injection into the natural gas grid in Austria [66].
Range in raw biogas Biomethane for injection
Methane 50 - 75 97
in Vol.%
Carbondioxide 25 - 50 2
Water 1 – 5 0
Nitrogen 5 5
Oxygen 0 - 5 0.5
Hydrogen < 1 4
Ammonia < 1 0
Hydrogen sulfide < 1 0.0003
Heating value 5.52 – 8.27 10.7 – 12.8 in kWhth/m³
Wobbe-Index1 5.9 – 8.15 13.3 – 15.7
1 “The Wobbe Index is an indicator of the interchangeability of fuel gases (natural gas, liquefied petroleum gas…). The Wobbe Index is used to compare the combustion energy output of different composition fuel gases in an appliance (fire, cooker etc.). If two fuels have identical Wobbe Indices, then for given pressure and valve settings the energy output will also be identical. Typically, variations of up to 5% are allowed as these would not be noticeable to the consumer.” [39]
D2.2 – Availability and suitability of technologies 26
During the fermentation process, not only biogas is produced but also a liquid or pasty. The digestate or effluent is a valuable output but causes investment and operational costs. The post-treatment of the effluent must be considered in the planning phase as well as the availability of the feedstock. This can be crucial for the economical reliability of the facilities. In most of the installations, a solid cake and a liquid phase are separated. These products can be used as fertilizers. The liquid phase may be treated furthermore in an aerobic treatment bioreactor, with COD degradation and nitrification/denitrification to reduce the nitrogen content [62].
Small scale local biogas production:
By 2020, 80 million households in China and 4 million households in India will have installed small scale household biogas digesters. In the study „Technical Evaluation of decentralized Household biogas digesters“ the decentralized approach is analysed and an implementation in Europe is proofed [68]. Different systems were evaluated and the performance of small fermenters were analysed. The described digesters have a fermenter volume from 1-50 m³ and a biogas production rate from 0.5-7.5 m³gas/m³fermenter per day [68], [69]. In developing countries, these systems are often used directly for cooking or heating. In Europe, the use of grass as the major substrate seems possible.
In the Orion project (“Organic waste management by a small-scale innovative automated system of anaerobic digestion”) an automated treatment system is being developed with a fermenter volume of 3-30m³ and an organic load of 80-1000 kg/day. The daily biogas production should be 1.5-7.5 m³gas/m³fermenter a day with a content of 50-65 % of methane. The system focused on several agro-food industries including biomass, agro-food (fisheries, vegetable oil producers, dairy and beef) and markets [69].
3.1.3.4 Options for the use of biogas
There are different ways for the usage of the produced gas (see Figure 14):
1. Local use of heat and electricity a. Only use of electricity or feed in electricity to the grid b. Combined heat and power usage c. Only use of heat in boilers
2. Upgrading to bio methane and feed into the natural gas grid a. Use in a CHP where the heat is needed or feed in the heat into a district heating network b. Use as fuel for transportation aims c. Substituting natural gas in local heaters
Figure 14 - different options for the use of biogas [67].
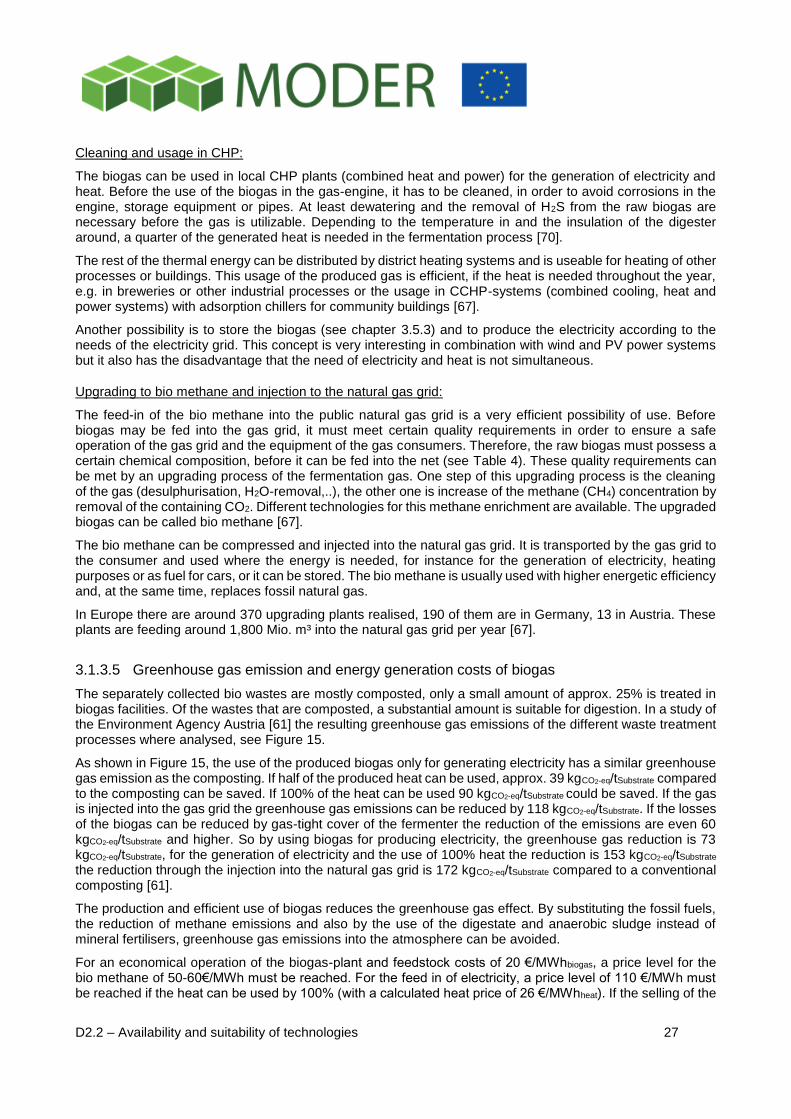
D2.2 – Availability and suitability of technologies 27
Cleaning and usage in CHP:
The biogas can be used in local CHP plants (combined heat and power) for the generation of electricity and heat. Before the use of the biogas in the gas-engine, it has to be cleaned, in order to avoid corrosions in the engine, storage equipment or pipes. At least dewatering and the removal of H2S from the raw biogas are necessary before the gas is utilizable. Depending to the temperature in and the insulation of the digester around, a quarter of the generated heat is needed in the fermentation process [70].
The rest of the thermal energy can be distributed by district heating systems and is useable for heating of other processes or buildings. This usage of the produced gas is efficient, if the heat is needed throughout the year, e.g. in breweries or other industrial processes or the usage in CCHP-systems (combined cooling, heat and power systems) with adsorption chillers for community buildings [67].
Another possibility is to store the biogas (see chapter 3.5.3) and to produce the electricity according to the needs of the electricity grid. This concept is very interesting in combination with wind and PV power systems but it also has the disadvantage that the need of electricity and heat is not simultaneous.
Upgrading to bio methane and injection to the natural gas grid:
The feed-in of the bio methane into the public natural gas grid is a very efficient possibility of use. Before biogas may be fed into the gas grid, it must meet certain quality requirements in order to ensure a safe operation of the gas grid and the equipment of the gas consumers. Therefore, the raw biogas must possess a certain chemical composition, before it can be fed into the net (see Table 4). These quality requirements can be met by an upgrading process of the fermentation gas. One step of this upgrading process is the cleaning of the gas (desulphurisation, H2O-removal,..), the other one is increase of the methane (CH4) concentration by removal of the containing CO2. Different technologies for this methane enrichment are available. The upgraded biogas can be called bio methane [67].
The bio methane can be compressed and injected into the natural gas grid. It is transported by the gas grid to the consumer and used where the energy is needed, for instance for the generation of electricity, heating purposes or as fuel for cars, or it can be stored. The bio methane is usually used with higher energetic efficiency and, at the same time, replaces fossil natural gas.
In Europe there are around 370 upgrading plants realised, 190 of them are in Germany, 13 in Austria. These plants are feeding around 1,800 Mio. m³ into the natural gas grid per year [67].
3.1.3.5 Greenhouse gas emission and energy generation costs of biogas
The separately collected bio wastes are mostly composted, only a small amount of approx. 25% is treated in biogas facilities. Of the wastes that are composted, a substantial amount is suitable for digestion. In a study of the Environment Agency Austria [61] the resulting greenhouse gas emissions of the different waste treatment processes where analysed, see Figure 15.
As shown in Figure 15, the use of the produced biogas only for generating electricity has a similar greenhouse gas emission as the composting. If half of the produced heat can be used, approx. 39 kgCO2-eq/tSubstrate compared to the composting can be saved. If 100% of the heat can be used 90 kgCO2-eq/tSubstrate could be saved. If the gas is injected into the gas grid the greenhouse gas emissions can be reduced by 118 kgCO2-eq/tSubstrate. If the losses of the biogas can be reduced by gas-tight cover of the fermenter the reduction of the emissions are even 60 kgCO2-eq/tSubstrate and higher. So by using biogas for producing electricity, the greenhouse gas reduction is 73 kgCO2-eq/tSubstrate, for the generation of electricity and the use of 100% heat the reduction is 153 kgCO2-eq/tSubstrate the reduction through the injection into the natural gas grid is 172 kgCO2-eq/tSubstrate compared to a conventional composting [61].
The production and efficient use of biogas reduces the greenhouse gas effect. By substituting the fossil fuels, the reduction of methane emissions and also by the use of the digestate and anaerobic sludge instead of mineral fertilisers, greenhouse gas emissions into the atmosphere can be avoided.
For an economical operation of the biogas-plant and feedstock costs of 20 €/MWhbiogas, a price level for the bio methane of 50-60€/MWh must be reached. For the feed in of electricity, a price level of 110 €/MWh must be reached if the heat can be used by 100% (with a calculated heat price of 26 €/MWhheat). If the selling of the
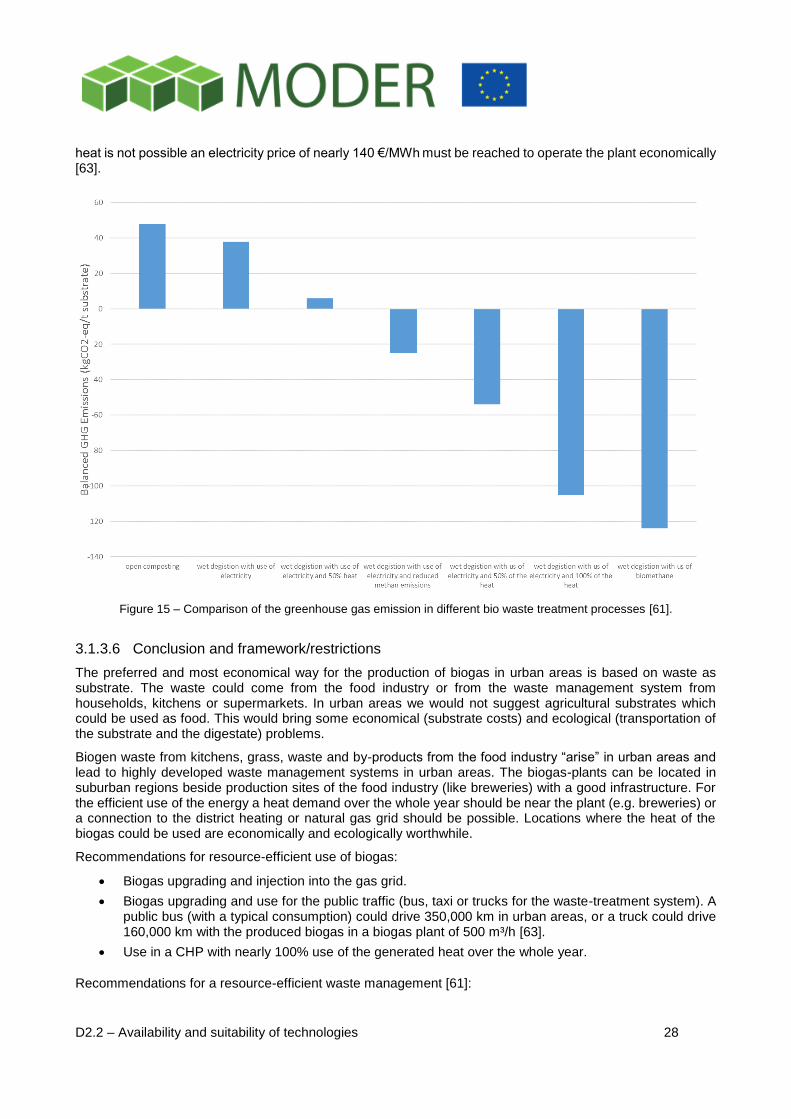
D2.2 – Availability and suitability of technologies 28
heat is not possible an electricity price of nearly 140 €/MWh must be reached to operate the plant economically [63].
Figure 15 – Comparison of the greenhouse gas emission in different bio waste treatment processes [61].
3.1.3.6 Conclusion and framework/restrictions
The preferred and most economical way for the production of biogas in urban areas is based on waste as substrate. The waste could come from the food industry or from the waste management system from households, kitchens or supermarkets. In urban areas we would not suggest agricultural substrates which could be used as food. This would bring some economical (substrate costs) and ecological (transportation of the substrate and the digestate) problems.
Biogen waste from kitchens, grass, waste and by-products from the food industry “arise” in urban areas and lead to highly developed waste management systems in urban areas. The biogas-plants can be located in suburban regions beside production sites of the food industry (like breweries) with a good infrastructure. For the efficient use of the energy a heat demand over the whole year should be near the plant (e.g. breweries) or a connection to the district heating or natural gas grid should be possible. Locations where the heat of the biogas could be used are economically and ecologically worthwhile.
Recommendations for resource-efficient use of biogas:
Biogas upgrading and injection into the gas grid.
Biogas upgrading and use for the public traffic (bus, taxi or trucks for the waste-treatment system). A public bus (with a typical consumption) could drive 350,000 km in urban areas, or a truck could drive 160,000 km with the produced biogas in a biogas plant of 500 m³/h [63].
Use in a CHP with nearly 100% use of the generated heat over the whole year.
Recommendations for a resource-efficient waste management [61]:
D2.2 – Availability and suitability of technologies 29
From the perspective of the greenhouse gas balance, digestion should be the preferred treatment option for bio wastes (composting should only be applied for bio waste if the digestion is not suitable, e.g. low gas formation potential).
Digestate and compost should be used firstly and foremost in agriculture. Therefore, costs for the bringing out of the digestate have to be considered in the planning phase. High water content increases transport costs.
Digestate storage tanks need to be provided with gas-tight cover.
The volumes of separately collected bio waste should be increased.
Legal requirements and guidelines for use should be adapted to force for a resource-efficient use of compost and digestate.
In the planning phase of a biogas plant first of all it is necessary to become acquainted with legislative restrictions, technical rules and guidelines concerning the implementation of substrates in biogas plants as well as handling the effluent and the digestate. In Europe, differences between the single national statutes exist – a few public restrictions mentioned at a glance [62]:
landfill legislation (e.g. in Austria: „Deponieverordnung“) ,
soil protection legislation (e.g. in Austria „Bodenschutzgesetze; Klärschlammgesetze und Klärschlammverordnungen der Bundesländer“; „Richtlinien für sachgerechte Düngung“ (BMLFUW 2006); „Richtlinie für die Anwendung von Kompost aus biogenen Abfällen in der Land-wirtschaft“ (BMLFUW 2010); Richtlinie „Der sachgerechte Einsatz von Biogasgülle und Gärrück-ständen im Acker und Grünland“ (BMLFUW 2007)),
groundwater protection legislation (e.g. in Austria „Wasserrechtsgesetz“ and „Aktionsprogramm Nitrat“),
waste treatment legislation (e.g. in Austria „Kompostverordnung“),
human and animal health rules and sterilization guidelines (e.g. in Austria „Bestimmungen der EU-Bioverordnung“, „AMA Gütesiegelprogramm“, ÖPUL1), and
waste-recovery rules and regulations (guidelines) and the legal definition of anaerobic digestion as a waste treatment or as a recovery process.
According to a report of the FAB-Biogas report there are some barriers for the plant operators [62]:
Problems during the approval process of the plant.
Financial barriers. Not easy to get credit guarantees and small biogas plants are not economically feasible anymore because the technical requirements for small waste biogas plants (up to 10,000 t/a) are similar to the costs of big biogas projects.
Problems during the plant operation. If waste is available, it is delivered to the cheapest waste management company. So maybe the organic waste is not available evenly over the whole year.
Contrary to the situation in developing countries, the energy and waste infrastructure is well developed in Europe and the safety standards are very high. Hence, centralised plants with optimised waste management systems and a delivery of the generated energy to the consumer by electricity, heat or gas networks will be more suitable in Europe than small decentralized plants.
3.1.4 Heat from wastewater
Wastewater is a permanently available resource and contains significant quantities of thermal energy, which remains mostly unused today. Heat from wastewater can be utilized by using heat pumps or heat exchangers to heat buildings and preheat fresh water. In combination with heat pumps wastewater can be used for example as a heat source for larger DH systems as well as for heating systems in single or apartment buildings. Another opportunity is district cooling if the circumstances are right since both the hot and cold side of the heat pump can be used.
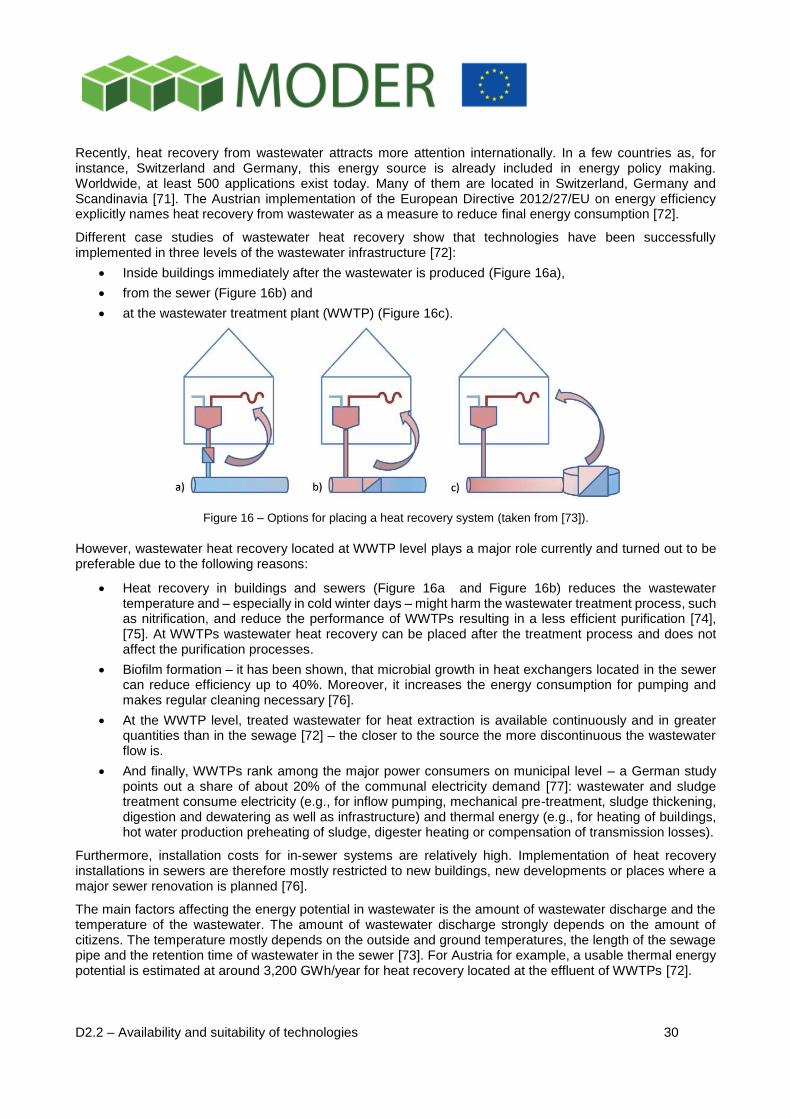
D2.2 – Availability and suitability of technologies 30
Recently, heat recovery from wastewater attracts more attention internationally. In a few countries as, for instance, Switzerland and Germany, this energy source is already included in energy policy making. Worldwide, at least 500 applications exist today. Many of them are located in Switzerland, Germany and Scandinavia [71]. The Austrian implementation of the European Directive 2012/27/EU on energy efficiency explicitly names heat recovery from wastewater as a measure to reduce final energy consumption [72].
Different case studies of wastewater heat recovery show that technologies have been successfully implemented in three levels of the wastewater infrastructure [72]:
Inside buildings immediately after the wastewater is produced (Figure 16a),
from the sewer (Figure 16b) and
at the wastewater treatment plant (WWTP) (Figure 16c).
Figure 16 – Options for placing a heat recovery system (taken from [73]).
However, wastewater heat recovery located at WWTP level plays a major role currently and turned out to be preferable due to the following reasons:
Heat recovery in buildings and sewers (Figure 16a and Figure 16b) reduces the wastewater temperature and – especially in cold winter days – might harm the wastewater treatment process, such as nitrification, and reduce the performance of WWTPs resulting in a less efficient purification [74], [75]. At WWTPs wastewater heat recovery can be placed after the treatment process and does not affect the purification processes.
Biofilm formation – it has been shown, that microbial growth in heat exchangers located in the sewer can reduce efficiency up to 40%. Moreover, it increases the energy consumption for pumping and makes regular cleaning necessary [76].
At the WWTP level, treated wastewater for heat extraction is available continuously and in greater quantities than in the sewage [72] – the closer to the source the more discontinuous the wastewater flow is.
And finally, WWTPs rank among the major power consumers on municipal level – a German study points out a share of about 20% of the communal electricity demand [77]: wastewater and sludge treatment consume electricity (e.g., for inflow pumping, mechanical pre-treatment, sludge thickening, digestion and dewatering as well as infrastructure) and thermal energy (e.g., for heating of buildings, hot water production preheating of sludge, digester heating or compensation of transmission losses).
Furthermore, installation costs for in-sewer systems are relatively high. Implementation of heat recovery installations in sewers are therefore mostly restricted to new buildings, new developments or places where a major sewer renovation is planned [76].
The main factors affecting the energy potential in wastewater is the amount of wastewater discharge and the temperature of the wastewater. The amount of wastewater discharge strongly depends on the amount of citizens. The temperature mostly depends on the outside and ground temperatures, the length of the sewage pipe and the retention time of wastewater in the sewer [73]. For Austria for example, a usable thermal energy potential is estimated at around 3,200 GWh/year for heat recovery located at the effluent of WWTPs [72].
D2.2 – Availability and suitability of technologies 31
For in-sewer heat recovery locations comparable estimations do not exist so far. This location has one major advantage: availability of potential consumers in very close vicinity to the heat source [71] – short transport distances in heat supply systems are essential for economic implementation and operation. However, as mentioned before, the major drawback of this location is the possibility of negative consequences in terms of temperature-sensitive wastewater treatment processes in a WWTP. Thus, for a durable and broadly accepted implementation planning of wastewater heat recovery systems must not only consider issues of energy economy but also pay great attention to wastewater temperature related matters. For this, a much more comprehensive understanding of wastewater temperature development in the sewer than currently given is crucial. To find the locations best suitable for wastewater heat recovery in sewer systems for a given situation, Kretschmer et al. [71] suggested a procedure to evaluate the suitability of a potential heat recovery site integrating both the energy supply requirements and the water pollution control framework.
On the whole, the amount of recovered energy from urban wastewater is still minimal compared to the total energy available, although some successful project examples exist. To make energy recovery from wastewater more attractive and competitive to other RES, several items should be addressed by future research activities, for instance [76]:
Lack of financial knowledge for different situations and geographical sites.
Lack of independent information: most of the successful case studies have been published by the same companies, tending to emphasize positive aspects of the technology.
Lack of information concerning approaches to detect susceptible points to install small-size heat recovery systems.
Lack of suitable modelling tools.
Once answers to the main items could be found, confidence in this technology will increase drastically and energy planners and water authorities (respectively wastewater utilities) can be supported much better in the evaluation process of upcoming projects [71].
3.2 Electricity Generation
3.2.1 Photovoltaics
Conversion of sunlight into electricity in PV cells is one of the three main solar active technologies and the only technology capable to directly convert sunlight into electricity. By the end of 2015, more than 200 GW (namely 227 GW) PV power has been installed, corresponding to 1.3% of the global electricity generation capacity [78]. The installed PV capacities in the different countries are highly diverse, however. PV electricity shares in 2016 are approx. 4% in Europe, 2% in Austria and even 12% in Bavaria [78] – in Germany instantaneous values of the PV power generation covers up to 50% of the total load volume temporarily [79]. And PV is expanding very rapidly due to effective supporting policies and recent dramatic cost reductions. PV is a commercially available and reliable technology with a significant potential for long-term growth in nearly all world regions [80]. At constant expansion rate of PV a totally installed capacity of about 400 GW will be reached in 2020, surpassing the worldwide installed nuclear capacity [81] – because of the much higher full-load hours of nuclear power plants (factor 6 – 8) a comparable amount of electricity generation will not be given yet, though.
PV systems can be used virtually everywhere and buildings offer large areas with which to capture solar radiation to produce electricity that can be either used in the building or fed into the electricity grid. Significant shares of around 10-30% of the total electricity demand of a city could be met by PV systems on buildings providing electricity at the point of use [34].
Even the rather conservative International Energy Agency (IEA) stated in Reference [80]: “Solar PV power is a commercially available and reliable technology with a significant potential for long-term growth in nearly all world regions.“
3.2.1.1 PV Technologies and efficiencies
Today´s PV modules commercially available on the market can be subdivided into
D2.2 – Availability and suitability of technologies 32
crystalline silicon (c-Si) modules (mono- and multi-crystalline cells) and
thin film technologies – they are subdivided into three main groups: 1) amorphous (a-Si) and micromorph silicon (a-Si/μc-Si), 2) Cadmium-Telluride (CdTe), and 3) Copper-Indium-Diselenide (CIS) and Copper-Indium-Gallium-Diselenide (CIGS).
Advanced thin film technologies and some organic cells are emerging technologies and are about to enter the market primarily via niche applications [80]. More detailed information on technologies can also be found in the IEA PVPS Implementing Agreement website [82].
Figure 17 shows the highest efficiencies of solar cells based on different technologies, continuously measured and updated by NREL – The National Renewable Energy Laboratory [83]. Cell efficiencies are provided within different families of semiconductors: (1) multijunction cells, (2) single-junction gallium arsenide cells, (3) crystalline silicon cells, (4) thin-film technologies, and (5) emerging photovoltaics. Some 26 different subcategories are indicated by distinctive coloured symbols. The most recent world record for each technology is highlighted along the right edge in a flag that contains the efficiency and the symbol of the technology. The company or group that fabricated the device for each most-recent record is bolded on the plot.
For PV in urban areas mainly crystalline silicon cells (mono and multi) and thin-film technologies are of interest at the moment. However, due to dramatic cost reductions in the production of crystalline cells in the last years thin-film manufacturers appreciably disappeared from the market. Si-wafer based PV technologies accounted for about 93% of the total PV production in 2015 [84]. The share of multi-crystalline technologies within the crystalline Si-technologies is now about 69% of the total production. In 2015, the market share of all thin film technologies cumulated to approximately 7% of the total annual production.
The record lab cell efficiency is 25.6% for mono-crystalline and 20.8% for multi-crystalline silicon wafer-based technology. The highest lab efficiency in thin film technology is 21.0% for CdTe and 20.5% for CIGS solar cells. In the last 10 years, the efficiency of average commercial wafer-based silicon modules increased from about 12% to 17% (super-mono 21%). At the same time, CdTe module efficiencies increased from 9% to 16% [84]. The record efficiencies in Figure 17 demonstrate the potential for further efficiency increases. Amorphous silicon, once produced in high volumes, de facto does not play a significant role anymore.
On module level typical efficiencies are 15 – 16% for multi-crystalline, 18 – 19% for mono-crystalline, and approx. 13% for CIGS – however, efficiencies for CIGS modules vary strongly and 15 – 16% will be available soon [85]. The highest efficiencies are currently achieved by the company Sunpower: in August 2016 mono-crystalline modules with an efficiency of 24.1% have been announced (“X-Series”) [86].
The space required for 1 kWp installed PV power can be estimated as:
CIGS modules approx. 7.8 m2/kWp,
multi-crystalline modules (typical efficiency 15 – 16%) approx. 6.5 m2/kWp,
mono-crystalline modules (typical efficiency 18 – 19%) approx. 6.1 m2/kWp, and
high-performance mono-crystalline modules approx. 5.4 m2/kWp.
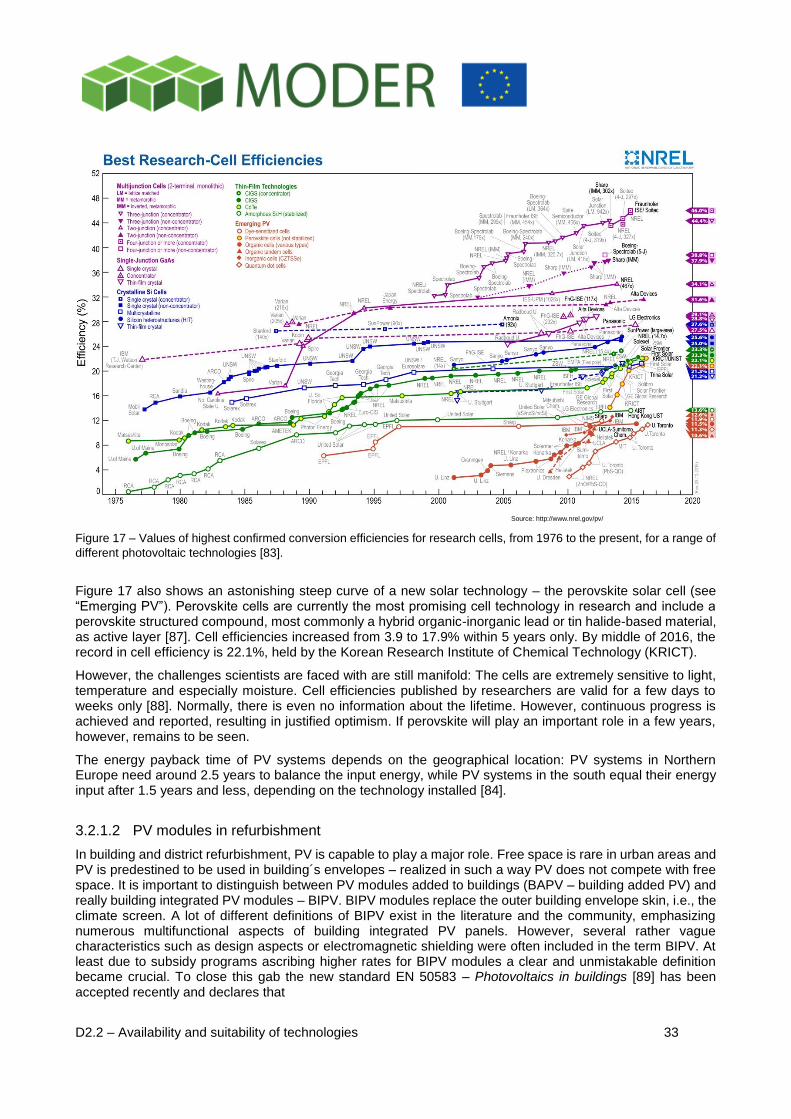
D2.2 – Availability and suitability of technologies 33
Source: http://www.nrel.gov/pv/
Figure 17 – Values of highest confirmed conversion efficiencies for research cells, from 1976 to the present, for a range of
different photovoltaic technologies [83].
Figure 17 also shows an astonishing steep curve of a new solar technology – the perovskite solar cell (see “Emerging PV”). Perovskite cells are currently the most promising cell technology in research and include a perovskite structured compound, most commonly a hybrid organic-inorganic lead or tin halide-based material, as active layer [87]. Cell efficiencies increased from 3.9 to 17.9% within 5 years only. By middle of 2016, the record in cell efficiency is 22.1%, held by the Korean Research Institute of Chemical Technology (KRICT).
However, the challenges scientists are faced with are still manifold: The cells are extremely sensitive to light, temperature and especially moisture. Cell efficiencies published by researchers are valid for a few days to weeks only [88]. Normally, there is even no information about the lifetime. However, continuous progress is achieved and reported, resulting in justified optimism. If perovskite will play an important role in a few years, however, remains to be seen.
The energy payback time of PV systems depends on the geographical location: PV systems in Northern Europe need around 2.5 years to balance the input energy, while PV systems in the south equal their energy input after 1.5 years and less, depending on the technology installed [84].
3.2.1.2 PV modules in refurbishment
In building and district refurbishment, PV is capable to play a major role. Free space is rare in urban areas and PV is predestined to be used in building´s envelopes – realized in such a way PV does not compete with free space. It is important to distinguish between PV modules added to buildings (BAPV – building added PV) and really building integrated PV modules – BIPV. BIPV modules replace the outer building envelope skin, i.e., the climate screen. A lot of different definitions of BIPV exist in the literature and the community, emphasizing numerous multifunctional aspects of building integrated PV panels. However, several rather vague characteristics such as design aspects or electromagnetic shielding were often included in the term BIPV. At least due to subsidy programs ascribing higher rates for BIPV modules a clear and unmistakable definition became crucial. To close this gab the new standard EN 50583 – Photovoltaics in buildings [89] has been accepted recently and declares that
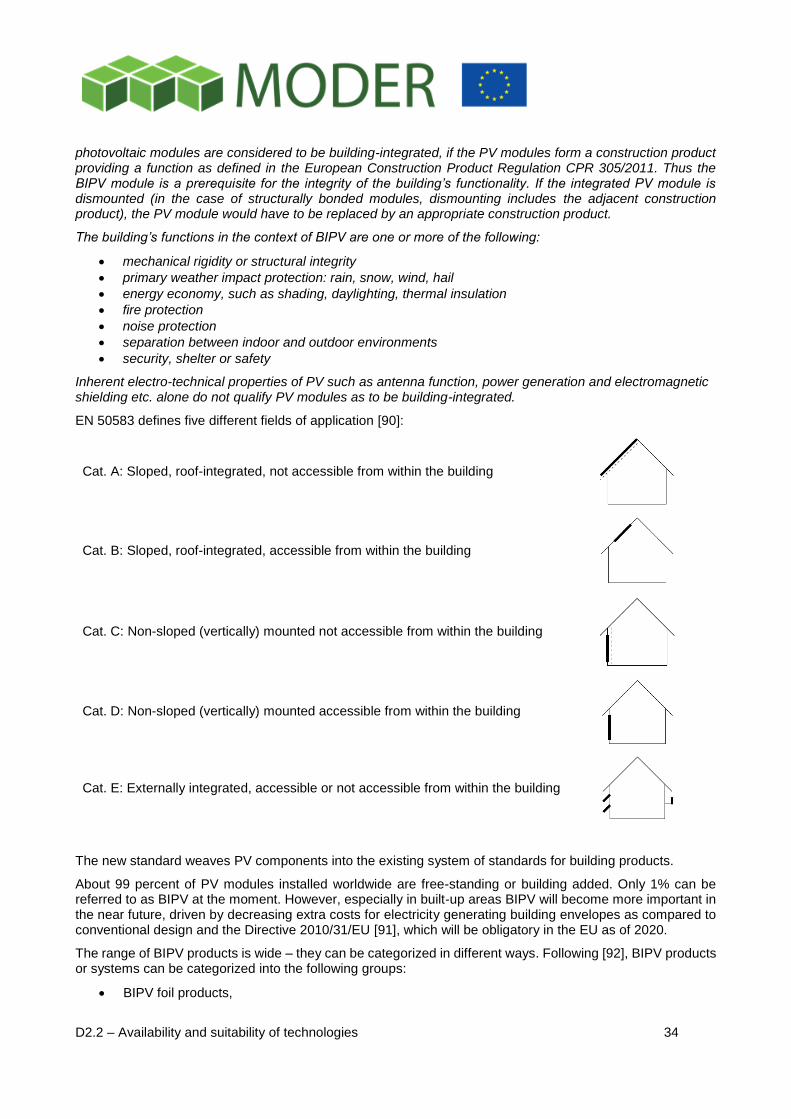
D2.2 – Availability and suitability of technologies 34
photovoltaic modules are considered to be building-integrated, if the PV modules form a construction product providing a function as defined in the European Construction Product Regulation CPR 305/2011. Thus the BIPV module is a prerequisite for the integrity of the building’s functionality. If the integrated PV module is dismounted (in the case of structurally bonded modules, dismounting includes the adjacent construction product), the PV module would have to be replaced by an appropriate construction product.
The building’s functions in the context of BIPV are one or more of the following:
mechanical rigidity or structural integrity
primary weather impact protection: rain, snow, wind, hail
energy economy, such as shading, daylighting, thermal insulation
fire protection
noise protection
separation between indoor and outdoor environments
security, shelter or safety
Inherent electro-technical properties of PV such as antenna function, power generation and electromagnetic shielding etc. alone do not qualify PV modules as to be building-integrated.
EN 50583 defines five different fields of application [90]:
Cat. A: Sloped, roof-integrated, not accessible from within the building
Cat. B: Sloped, roof-integrated, accessible from within the building
Cat. C: Non-sloped (vertically) mounted not accessible from within the building
Cat. D: Non-sloped (vertically) mounted accessible from within the building
Cat. E: Externally integrated, accessible or not accessible from within the building
The new standard weaves PV components into the existing system of standards for building products.
About 99 percent of PV modules installed worldwide are free-standing or building added. Only 1% can be referred to as BIPV at the moment. However, especially in built-up areas BIPV will become more important in the near future, driven by decreasing extra costs for electricity generating building envelopes as compared to conventional design and the Directive 2010/31/EU [91], which will be obligatory in the EU as of 2020.
The range of BIPV products is wide – they can be categorized in different ways. Following [92], BIPV products or systems can be categorized into the following groups:
BIPV foil products,
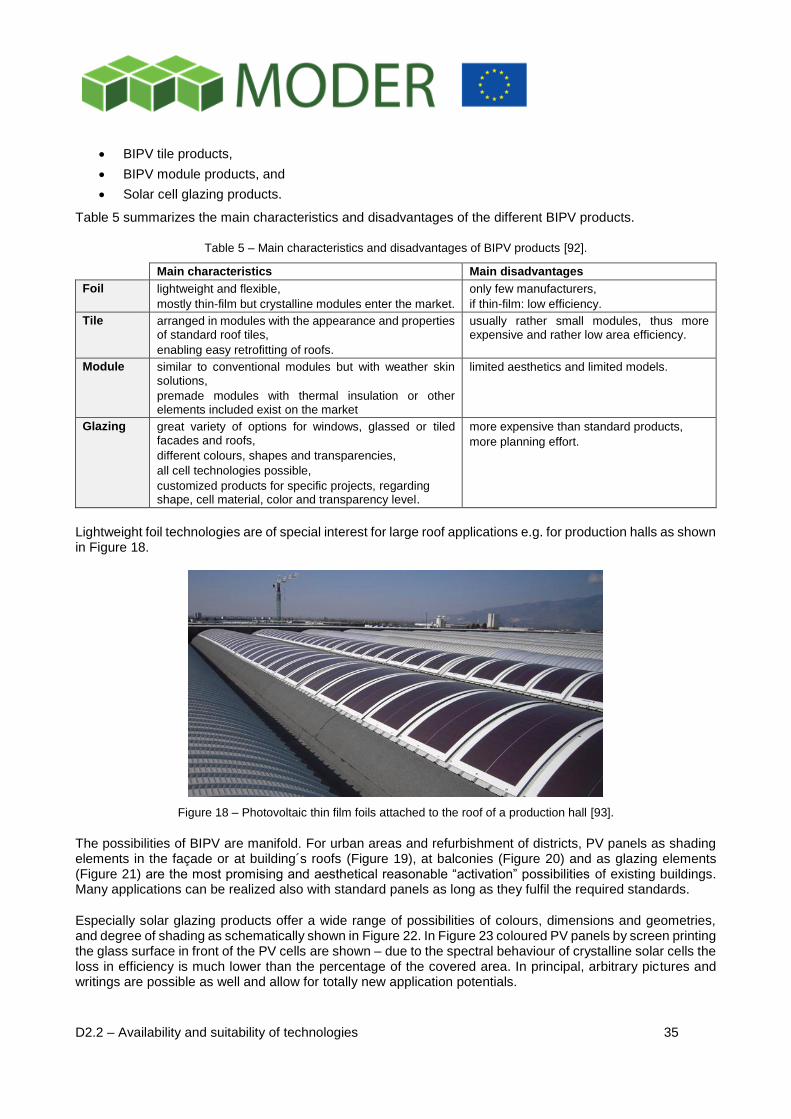
D2.2 – Availability and suitability of technologies 35
BIPV tile products,
BIPV module products, and
Solar cell glazing products.
Table 5 summarizes the main characteristics and disadvantages of the different BIPV products.
Table 5 – Main characteristics and disadvantages of BIPV products [92].
Main characteristics Main disadvantages
Foil lightweight and flexible,
mostly thin-film but crystalline modules enter the market.
only few manufacturers,
if thin-film: low efficiency.
Tile arranged in modules with the appearance and properties of standard roof tiles,
enabling easy retrofitting of roofs.
usually rather small modules, thus more expensive and rather low area efficiency.
Module similar to conventional modules but with weather skin solutions,
premade modules with thermal insulation or other elements included exist on the market
limited aesthetics and limited models.
Glazing great variety of options for windows, glassed or tiled facades and roofs,
different colours, shapes and transparencies,
all cell technologies possible,
customized products for specific projects, regarding shape, cell material, color and transparency level.
more expensive than standard products,
more planning effort.
Lightweight foil technologies are of special interest for large roof applications e.g. for production halls as shown in Figure 18.
Figure 18 – Photovoltaic thin film foils attached to the roof of a production hall [93].
The possibilities of BIPV are manifold. For urban areas and refurbishment of districts, PV panels as shading elements in the façade or at building´s roofs (Figure 19), at balconies (Figure 20) and as glazing elements (Figure 21) are the most promising and aesthetical reasonable “activation” possibilities of existing buildings. Many applications can be realized also with standard panels as long as they fulfil the required standards.
Especially solar glazing products offer a wide range of possibilities of colours, dimensions and geometries, and degree of shading as schematically shown in Figure 22. In Figure 23 coloured PV panels by screen printing the glass surface in front of the PV cells are shown – due to the spectral behaviour of crystalline solar cells the loss in efficiency is much lower than the percentage of the covered area. In principal, arbitrary pictures and writings are possible as well and allow for totally new application potentials.
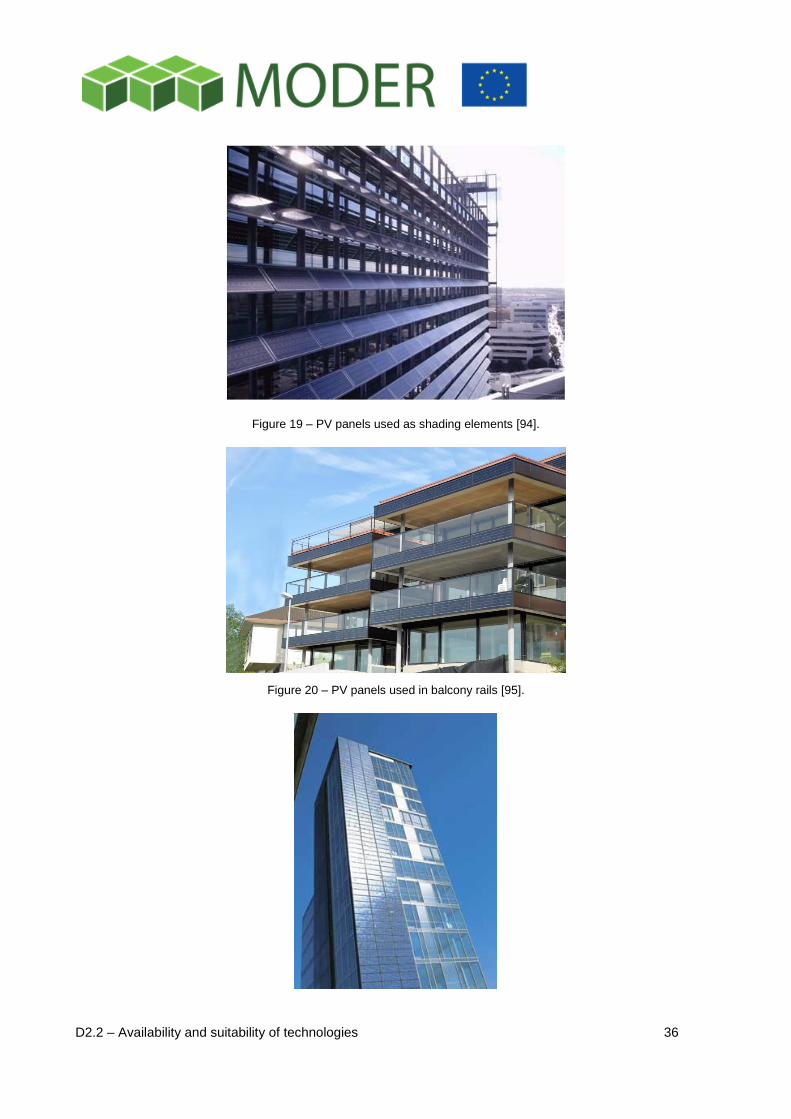
D2.2 – Availability and suitability of technologies 36
Figure 19 – PV panels used as shading elements [94].
Figure 20 – PV panels used in balcony rails [95].
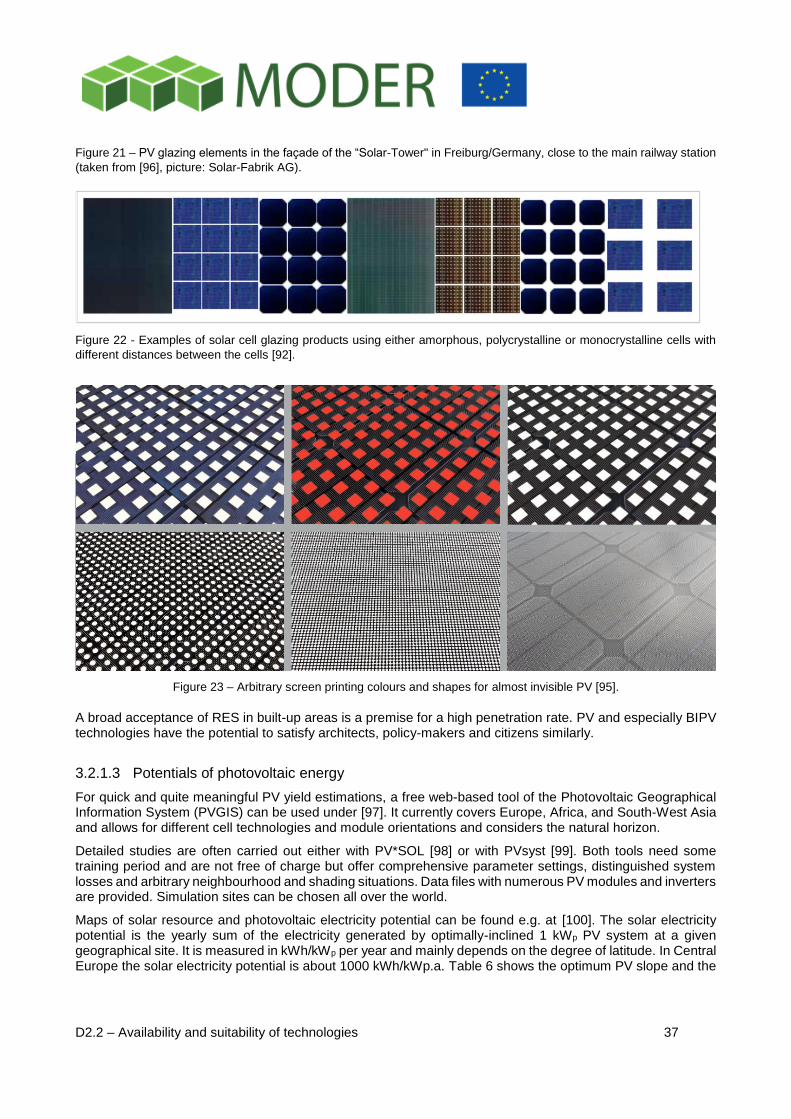
D2.2 – Availability and suitability of technologies 37
Figure 21 – PV glazing elements in the façade of the “Solar-Tower" in Freiburg/Germany, close to the main railway station
(taken from [96], picture: Solar-Fabrik AG).
Figure 22 - Examples of solar cell glazing products using either amorphous, polycrystalline or monocrystalline cells with
different distances between the cells [92].
Figure 23 – Arbitrary screen printing colours and shapes for almost invisible PV [95].
A broad acceptance of RES in built-up areas is a premise for a high penetration rate. PV and especially BIPV technologies have the potential to satisfy architects, policy-makers and citizens similarly.
3.2.1.3 Potentials of photovoltaic energy
For quick and quite meaningful PV yield estimations, a free web-based tool of the Photovoltaic Geographical Information System (PVGIS) can be used under [97]. It currently covers Europe, Africa, and South-West Asia and allows for different cell technologies and module orientations and considers the natural horizon.
Detailed studies are often carried out either with PV*SOL [98] or with PVsyst [99]. Both tools need some training period and are not free of charge but offer comprehensive parameter settings, distinguished system losses and arbitrary neighbourhood and shading situations. Data files with numerous PV modules and inverters are provided. Simulation sites can be chosen all over the world.
Maps of solar resource and photovoltaic electricity potential can be found e.g. at [100]. The solar electricity potential is the yearly sum of the electricity generated by optimally-inclined 1 kWp PV system at a given geographical site. It is measured in kWh/kWp per year and mainly depends on the degree of latitude. In Central Europe the solar electricity potential is about 1000 kWh/kWp.a. Table 6 shows the optimum PV slope and the
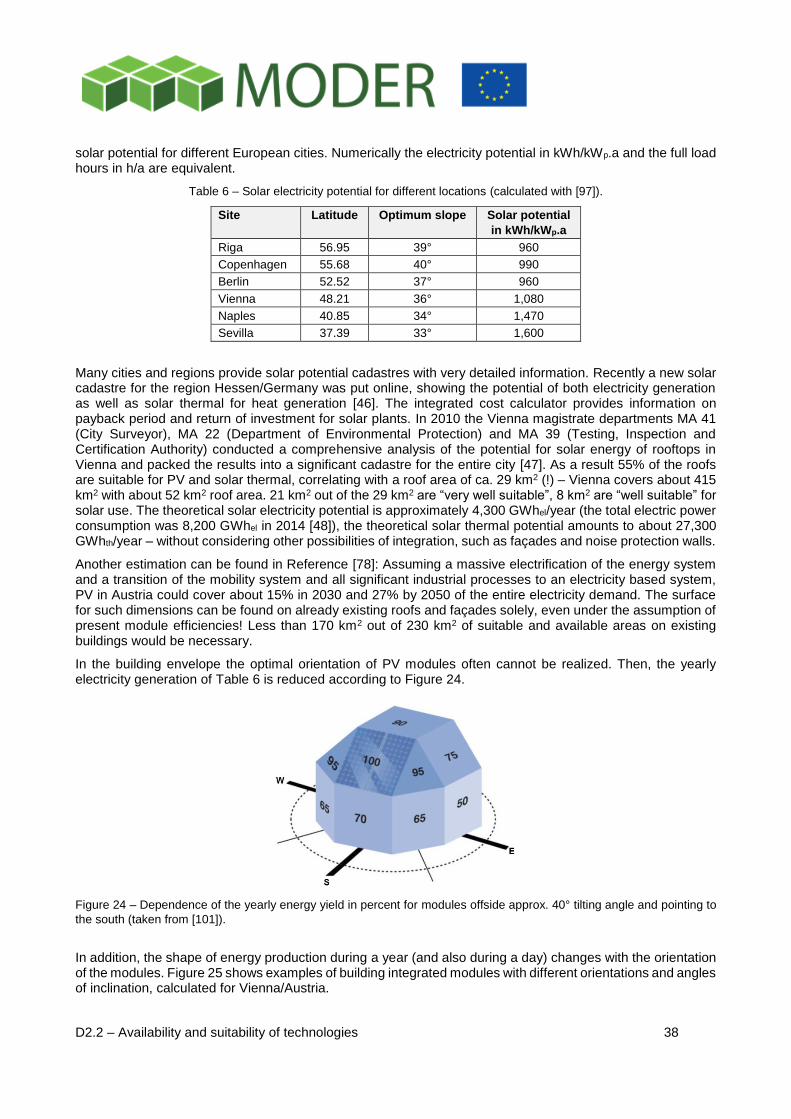
D2.2 – Availability and suitability of technologies 38
solar potential for different European cities. Numerically the electricity potential in kWh/kWp.a and the full load hours in h/a are equivalent.
Table 6 – Solar electricity potential for different locations (calculated with [97]).
Site Latitude Optimum slope Solar potential
in kWh/kWp.a
Riga 56.95 39° 960
Copenhagen 55.68 40° 990
Berlin 52.52 37° 960
Vienna 48.21 36° 1,080
Naples 40.85 34° 1,470
Sevilla 37.39 33° 1,600
Many cities and regions provide solar potential cadastres with very detailed information. Recently a new solar cadastre for the region Hessen/Germany was put online, showing the potential of both electricity generation as well as solar thermal for heat generation [46]. The integrated cost calculator provides information on payback period and return of investment for solar plants. In 2010 the Vienna magistrate departments MA 41 (City Surveyor), MA 22 (Department of Environmental Protection) and MA 39 (Testing, Inspection and Certification Authority) conducted a comprehensive analysis of the potential for solar energy of rooftops in Vienna and packed the results into a significant cadastre for the entire city [47]. As a result 55% of the roofs are suitable for PV and solar thermal, correlating with a roof area of ca. 29 km2 (!) – Vienna covers about 415 km2 with about 52 km2 roof area. 21 km2 out of the 29 km2 are “very well suitable”, 8 km2 are “well suitable” for solar use. The theoretical solar electricity potential is approximately 4,300 GWhel/year (the total electric power consumption was 8,200 GWhel in 2014 [48]), the theoretical solar thermal potential amounts to about 27,300 GWhth/year – without considering other possibilities of integration, such as façades and noise protection walls.
Another estimation can be found in Reference [78]: Assuming a massive electrification of the energy system and a transition of the mobility system and all significant industrial processes to an electricity based system, PV in Austria could cover about 15% in 2030 and 27% by 2050 of the entire electricity demand. The surface for such dimensions can be found on already existing roofs and façades solely, even under the assumption of present module efficiencies! Less than 170 km2 out of 230 km2 of suitable and available areas on existing buildings would be necessary.
In the building envelope the optimal orientation of PV modules often cannot be realized. Then, the yearly electricity generation of Table 6 is reduced according to Figure 24.
Figure 24 – Dependence of the yearly energy yield in percent for modules offside approx. 40° tilting angle and pointing to
the south (taken from [101]).
In addition, the shape of energy production during a year (and also during a day) changes with the orientation of the modules. Figure 25 shows examples of building integrated modules with different orientations and angles of inclination, calculated for Vienna/Austria.
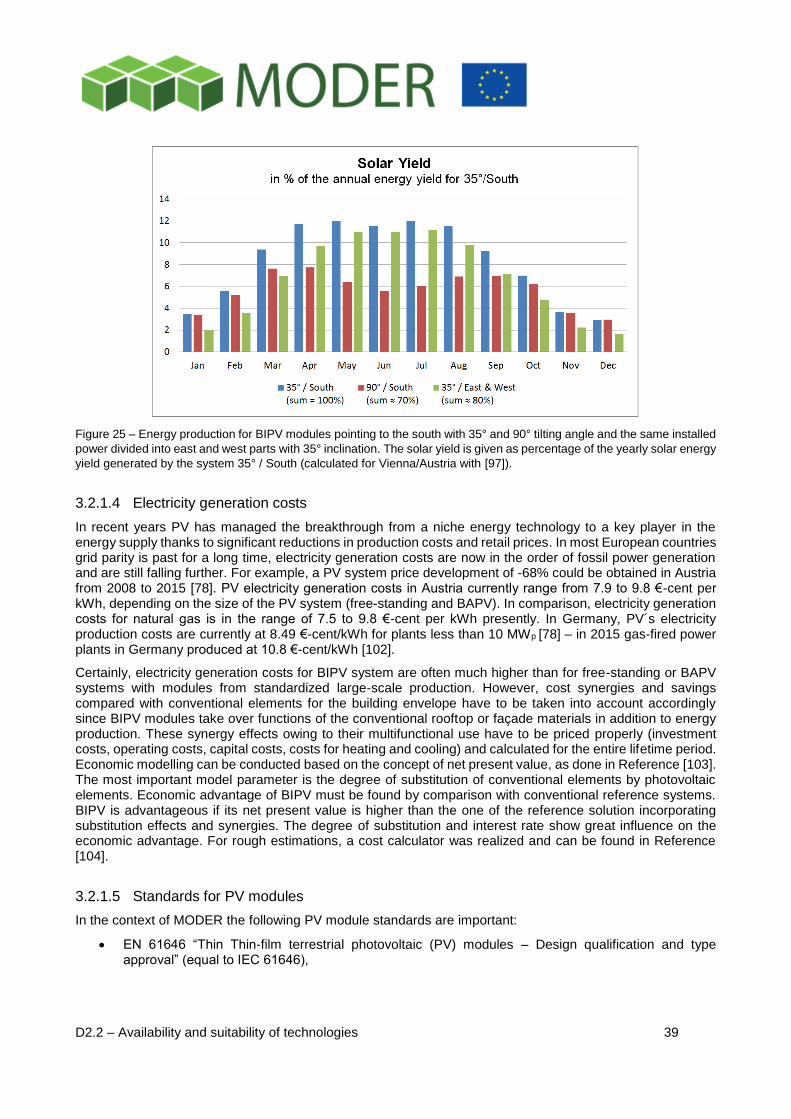
D2.2 – Availability and suitability of technologies 39
Figure 25 – Energy production for BIPV modules pointing to the south with 35° and 90° tilting angle and the same installed
power divided into east and west parts with 35° inclination. The solar yield is given as percentage of the yearly solar energy
yield generated by the system 35° / South (calculated for Vienna/Austria with [97]).
3.2.1.4 Electricity generation costs
In recent years PV has managed the breakthrough from a niche energy technology to a key player in the energy supply thanks to significant reductions in production costs and retail prices. In most European countries grid parity is past for a long time, electricity generation costs are now in the order of fossil power generation and are still falling further. For example, a PV system price development of -68% could be obtained in Austria from 2008 to 2015 [78]. PV electricity generation costs in Austria currently range from 7.9 to 9.8 €-cent per kWh, depending on the size of the PV system (free-standing and BAPV). In comparison, electricity generation costs for natural gas is in the range of 7.5 to 9.8 €-cent per kWh presently. In Germany, PV´s electricity production costs are currently at 8.49 €-cent/kWh for plants less than 10 MWp [78] – in 2015 gas-fired power plants in Germany produced at 10.8 €-cent/kWh [102].
Certainly, electricity generation costs for BIPV system are often much higher than for free-standing or BAPV systems with modules from standardized large-scale production. However, cost synergies and savings compared with conventional elements for the building envelope have to be taken into account accordingly since BIPV modules take over functions of the conventional rooftop or façade materials in addition to energy production. These synergy effects owing to their multifunctional use have to be priced properly (investment costs, operating costs, capital costs, costs for heating and cooling) and calculated for the entire lifetime period. Economic modelling can be conducted based on the concept of net present value, as done in Reference [103]. The most important model parameter is the degree of substitution of conventional elements by photovoltaic elements. Economic advantage of BIPV must be found by comparison with conventional reference systems. BIPV is advantageous if its net present value is higher than the one of the reference solution incorporating substitution effects and synergies. The degree of substitution and interest rate show great influence on the economic advantage. For rough estimations, a cost calculator was realized and can be found in Reference [104].
3.2.1.5 Standards for PV modules
In the context of MODER the following PV module standards are important:
EN 61646 “Thin Thin-film terrestrial photovoltaic (PV) modules – Design qualification and type approval” (equal to IEC 61646),
D2.2 – Availability and suitability of technologies 40
EN 61215 “Crystalline silicon terrestrial photovoltaic (PV) modules – Design qualification and type approval” (equal to IEC 61215),
EN 61730-1 “Photovoltaic (PV) module safety qualification – Part 1: Requirements for construction”,
EN 61730-2 “Photovoltaic (PV) module safety qualification – Part 2: Requirements for testing”,
IEC 61724 “Photovoltaic system performance monitoring – Guidelines for measurement, data exchange and analysis”, and
EN 50583 “Photovoltaics in buildings”. This standard summarizes all relevant standards and regulations for different applications within the building envelope (e.g. overhead glazing).
3.2.2 Wind
The use of wind energy to comply with districts electricity need has not been a priority when compared with other energy sources. In fact, several impediments are pointed regarding the use of this type of production in urban environment. However, wind turbines are – beside photovoltaics – one of the few possibilities to produce eco-friendly electricity in urban areas and to reach the target of NZEBs.
Mounted on or close to buildings we are always talking about small wind turbines (SWTs). For this, we propose the following definition, based on [105]:
Small wind turbines are defined as turbines that are specially designed for built-up areas, and can be located on buildings or on the ground next to buildings. This implies that the turbine has been optimized for the wind regime in the built-up areas and can safely resist wind gusts and turbulences and that the form and size of the turbine has been designed to visually integrate with the surrounding buildings. The capacity of these turbines is between 1 and 20 kW. These small wind turbines are also being referred to as “urban turbines”.
The main obstacle is the security level of using wind turbines inside or close urbanisations. Even if turbine manufacturers claim to have achieved high security standards there is still generalized scepticism among possible customers. Another major problem is the noise that this kind of structures produce, which highly increase acoustic pollution in district environment.
3.2.2.1 Types of wind turbines
Horizontal axis wind turbines (HAWTs):
Currently, HAWTs are the most commonly used type of wind turbines. The propeller-type rotor is mounted on a horizontal axis. The rotor needs to be positioned into the wind direction by means of a tail or active yawing by a yaw motor. HAWTs are sensitive to the changes in wind direction and turbulence which have a negative effect on performance due to the required repositioning of the turbine into the wind flow. The best locations for HAWTs are open areas with smooth air flow and few obstacles. Some HAWTs models are shown in Figure 26.
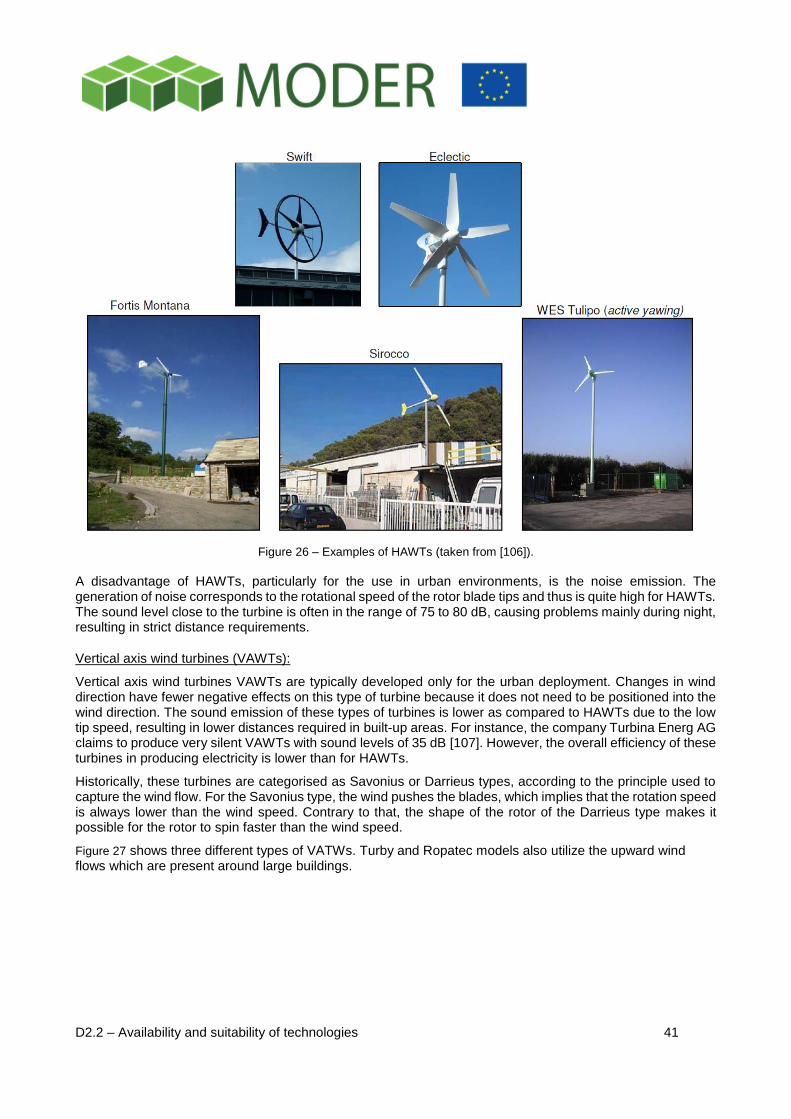
D2.2 – Availability and suitability of technologies 41
Figure 26 – Examples of HAWTs (taken from [106]).
A disadvantage of HAWTs, particularly for the use in urban environments, is the noise emission. The generation of noise corresponds to the rotational speed of the rotor blade tips and thus is quite high for HAWTs. The sound level close to the turbine is often in the range of 75 to 80 dB, causing problems mainly during night, resulting in strict distance requirements.
Vertical axis wind turbines (VAWTs):
Vertical axis wind turbines VAWTs are typically developed only for the urban deployment. Changes in wind direction have fewer negative effects on this type of turbine because it does not need to be positioned into the wind direction. The sound emission of these types of turbines is lower as compared to HAWTs due to the low tip speed, resulting in lower distances required in built-up areas. For instance, the company Turbina Energ AG claims to produce very silent VAWTs with sound levels of 35 dB [107]. However, the overall efficiency of these turbines in producing electricity is lower than for HAWTs.
Historically, these turbines are categorised as Savonius or Darrieus types, according to the principle used to capture the wind flow. For the Savonius type, the wind pushes the blades, which implies that the rotation speed is always lower than the wind speed. Contrary to that, the shape of the rotor of the Darrieus type makes it possible for the rotor to spin faster than the wind speed.
Figure 27 shows three different types of VATWs. Turby and Ropatec models also utilize the upward wind flows which are present around large buildings.
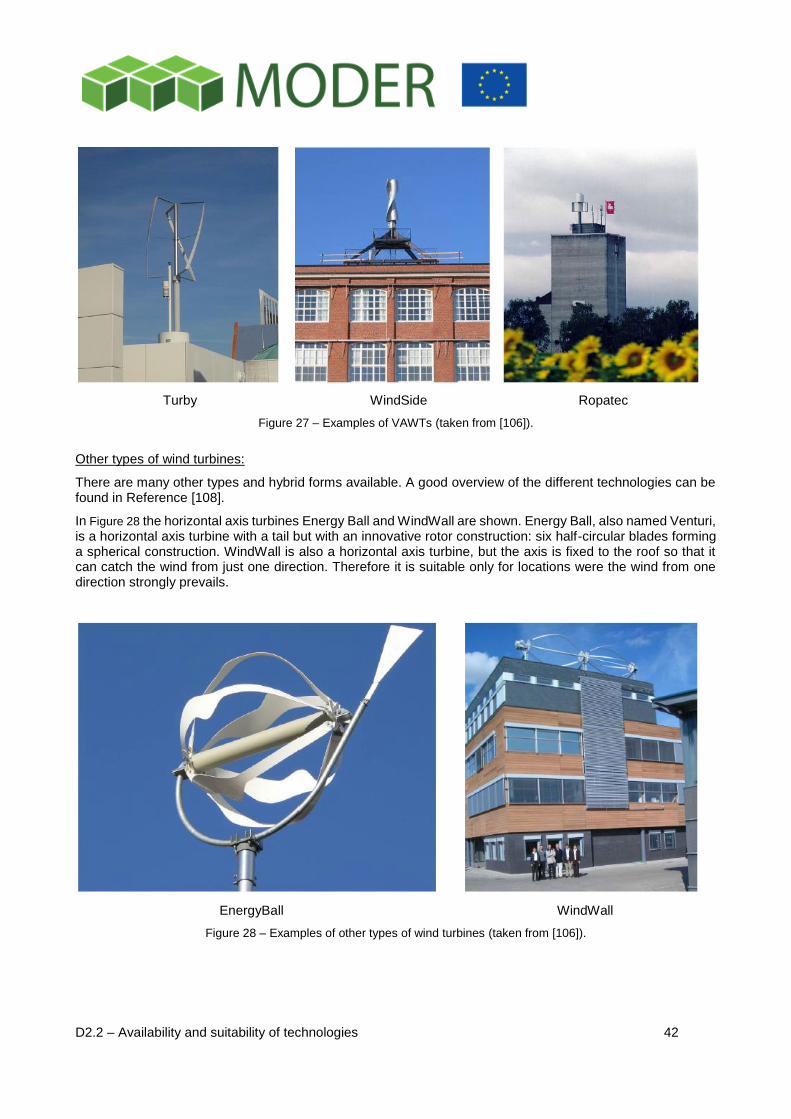
D2.2 – Availability and suitability of technologies 42
Turby WindSide Ropatec
Figure 27 – Examples of VAWTs (taken from [106]).
Other types of wind turbines:
There are many other types and hybrid forms available. A good overview of the different technologies can be found in Reference [108].
In Figure 28 the horizontal axis turbines Energy Ball and WindWall are shown. Energy Ball, also named Venturi, is a horizontal axis turbine with a tail but with an innovative rotor construction: six half-circular blades forming a spherical construction. WindWall is also a horizontal axis turbine, but the axis is fixed to the roof so that it can catch the wind from just one direction. Therefore it is suitable only for locations were the wind from one direction strongly prevails.
EnergyBall WindWall
Figure 28 – Examples of other types of wind turbines (taken from [106]).
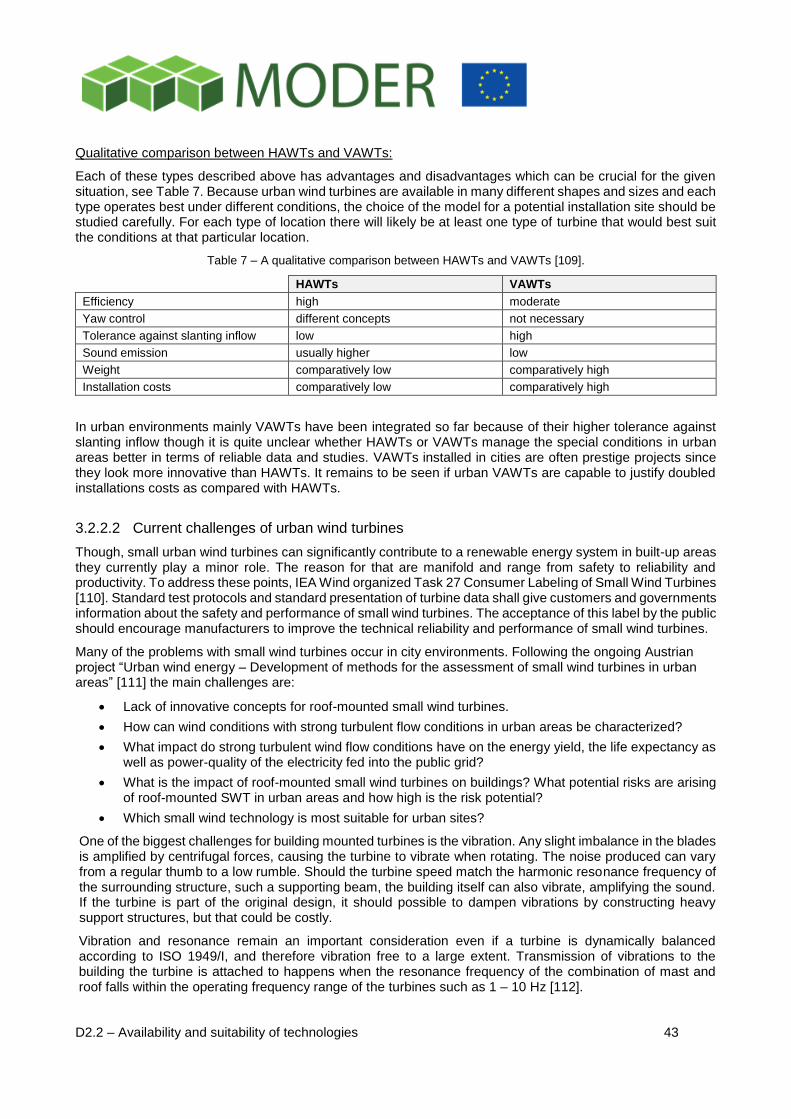
D2.2 – Availability and suitability of technologies 43
Qualitative comparison between HAWTs and VAWTs:
Each of these types described above has advantages and disadvantages which can be crucial for the given situation, see Table 7. Because urban wind turbines are available in many different shapes and sizes and each type operates best under different conditions, the choice of the model for a potential installation site should be studied carefully. For each type of location there will likely be at least one type of turbine that would best suit the conditions at that particular location.
Table 7 – A qualitative comparison between HAWTs and VAWTs [109].
HAWTs VAWTs
Efficiency high moderate
Yaw control different concepts not necessary
Tolerance against slanting inflow low high
Sound emission usually higher low
Weight comparatively low comparatively high
Installation costs comparatively low comparatively high
In urban environments mainly VAWTs have been integrated so far because of their higher tolerance against slanting inflow though it is quite unclear whether HAWTs or VAWTs manage the special conditions in urban areas better in terms of reliable data and studies. VAWTs installed in cities are often prestige projects since they look more innovative than HAWTs. It remains to be seen if urban VAWTs are capable to justify doubled installations costs as compared with HAWTs.
3.2.2.2 Current challenges of urban wind turbines
Though, small urban wind turbines can significantly contribute to a renewable energy system in built-up areas they currently play a minor role. The reason for that are manifold and range from safety to reliability and productivity. To address these points, IEA Wind organized Task 27 Consumer Labeling of Small Wind Turbines [110]. Standard test protocols and standard presentation of turbine data shall give customers and governments information about the safety and performance of small wind turbines. The acceptance of this label by the public should encourage manufacturers to improve the technical reliability and performance of small wind turbines.
Many of the problems with small wind turbines occur in city environments. Following the ongoing Austrian project “Urban wind energy – Development of methods for the assessment of small wind turbines in urban areas” [111] the main challenges are:
Lack of innovative concepts for roof-mounted small wind turbines.
How can wind conditions with strong turbulent flow conditions in urban areas be characterized?
What impact do strong turbulent wind flow conditions have on the energy yield, the life expectancy as well as power-quality of the electricity fed into the public grid?
What is the impact of roof-mounted small wind turbines on buildings? What potential risks are arising of roof-mounted SWT in urban areas and how high is the risk potential?
Which small wind technology is most suitable for urban sites?
One of the biggest challenges for building mounted turbines is the vibration. Any slight imbalance in the blades is amplified by centrifugal forces, causing the turbine to vibrate when rotating. The noise produced can vary from a regular thumb to a low rumble. Should the turbine speed match the harmonic resonance frequency of the surrounding structure, such a supporting beam, the building itself can also vibrate, amplifying the sound. If the turbine is part of the original design, it should possible to dampen vibrations by constructing heavy support structures, but that could be costly.
Vibration and resonance remain an important consideration even if a turbine is dynamically balanced according to ISO 1949/I, and therefore vibration free to a large extent. Transmission of vibrations to the building the turbine is attached to happens when the resonance frequency of the combination of mast and roof falls within the operating frequency range of the turbines such as 1 – 10 Hz [112].
D2.2 – Availability and suitability of technologies 44
In general, each type of wind turbine generates vibrations, which can then be transmitted to the building or can disturb people living or working in the building. Little attention has been paid so far in studies and in the literature to vibrations of urban wind turbines. In addition, companies often trivialize the problem and provide partially unreliable data. Authorization procedures at least in Austria only ask for static reports disregarding the fact that vibration is a dynamic effect. A sufficiently good vibration decoupling is in principal technically possible but produces extra costs in the range of 15% of the total project costs, making the project often economically infeasible [113].
A partial solution to the vibrations problem is the choice of vertical axis wind turbine with helical blades that are attached at both ends to a vertical shaft. They spin whatever the wind direction is and produce less vibration at given rotation speed because the blades do not stick out so far and so exert less pull. To reduce the vibrations still further, installation of smaller turbines may be an option to large ones. Vertical turbines would automatically change speed if they approach the resonance frequencies of any components.
For a wide use of urban SWTs also the problem of dangerous velocities of escaping blade fragments has to be addressed accordingly: Critics point that blades of large turbines weight hundreds of kilograms and tip speeds can exceed 100 km/h. On the other side, urban wind supporters reply that such fears are unfounded. Modern turbines have safety features including speed control and blades that can be pitched edge on into the wind during storms stalling them.
In regions with potential icing of rotor blades during winter time falling growlers pose a risk in densely populated areas to people passing by. Licensing requirements are possible resulting in e.g. obligatory ice sensors or safety distances, like in Vienna: due to possible wind transportation of growlers the safety zone is 1.5 x rotor diameter, including the building height (!) regardless of the type of SWT [113].
In addition to the variety of current problems manufacturer´s data are often unreliable with incorrectly measured power curves and efficiency factors, leading to disappointed customers in the past.
3.2.2.3 Geographical and urban availability of wind
Wind potential cadastres for different regions in Europe exist, e.g. for Austria [114] or for the city of Vienna [115], and show that wind energy can be utilized almost everywhere in Europe. Yield estimations are mainly carried out with the software tool windPRO or Excel based. For urban SWTs measurements at hub height during several months (costs: 2,000 – 3,000 €) are essential to gain realistic simulation data:
In built-up areas strongly localized turbulences mainly affect the behavior and the efficiency of SWTs.
The resolution of wind cadastres is rather rough and does not account for urban turbulence effects – cadastres are only a good starting point for the project.
“Spoiler effect” (wind shadow) of adjacent buildings.
However, power curves are measured at low turbulences – it has not yet been investigated in detail if these data can be mapped to regions with high turbulences such as built-up areas without accepting huge uncertainties.
Every city has typical wind tunnels (roads, rivers, street canyons). Urban wind turbines could be placed e.g. under or on bridges with excellent energy yields. As most low rise city buildings do not have space to install a sufficient number of SWTs and suffer from weak and unreliable winds due to higher buildings in the neighborhood, another possibility is to design additional openings just below the roofline to channel air up through ducts across turbine blades and out onto the roof. By channeling the wind, air turbulences are reduced before meeting the rotor. This technique can be easily combined with photovoltaic panels, as shown in Figure 29.
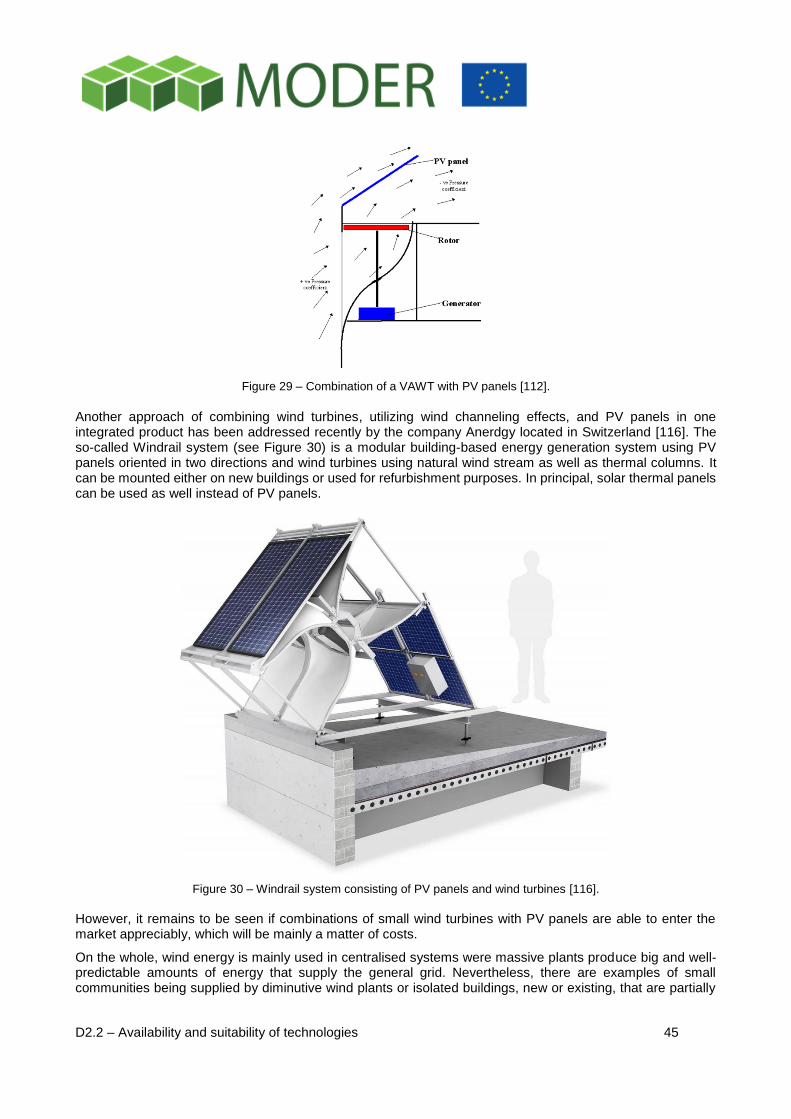
D2.2 – Availability and suitability of technologies 45
Figure 29 – Combination of a VAWT with PV panels [112].
Another approach of combining wind turbines, utilizing wind channeling effects, and PV panels in one integrated product has been addressed recently by the company Anerdgy located in Switzerland [116]. The so-called Windrail system (see Figure 30) is a modular building-based energy generation system using PV panels oriented in two directions and wind turbines using natural wind stream as well as thermal columns. It can be mounted either on new buildings or used for refurbishment purposes. In principal, solar thermal panels can be used as well instead of PV panels.
Figure 30 – Windrail system consisting of PV panels and wind turbines [116]. However, it remains to be seen if combinations of small wind turbines with PV panels are able to enter the market appreciably, which will be mainly a matter of costs.
On the whole, wind energy is mainly used in centralised systems were massive plants produce big and well-predictable amounts of energy that supply the general grid. Nevertheless, there are examples of small communities being supplied by diminutive wind plants or isolated buildings, new or existing, that are partially
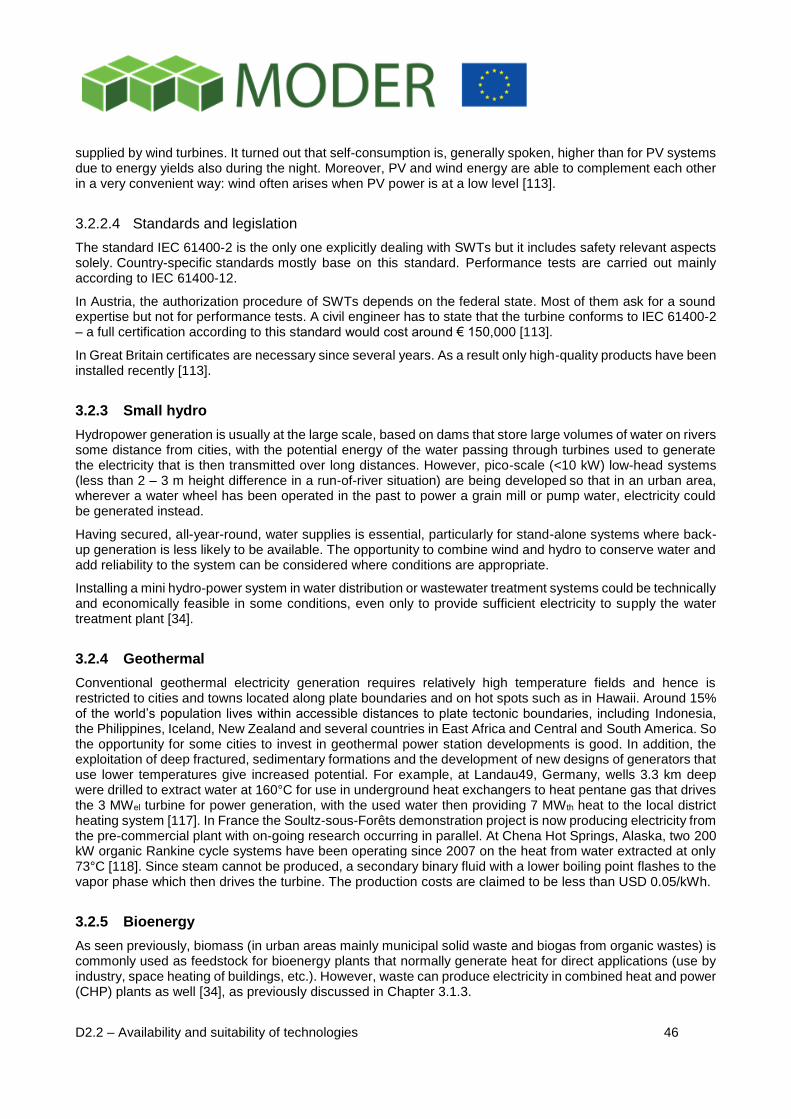
D2.2 – Availability and suitability of technologies 46
supplied by wind turbines. It turned out that self-consumption is, generally spoken, higher than for PV systems due to energy yields also during the night. Moreover, PV and wind energy are able to complement each other in a very convenient way: wind often arises when PV power is at a low level [113].
3.2.2.4 Standards and legislation
The standard IEC 61400-2 is the only one explicitly dealing with SWTs but it includes safety relevant aspects solely. Country-specific standards mostly base on this standard. Performance tests are carried out mainly according to IEC 61400-12.
In Austria, the authorization procedure of SWTs depends on the federal state. Most of them ask for a sound expertise but not for performance tests. A civil engineer has to state that the turbine conforms to IEC 61400-2 – a full certification according to this standard would cost around € 150,000 [113].
In Great Britain certificates are necessary since several years. As a result only high-quality products have been installed recently [113].
3.2.3 Small hydro
Hydropower generation is usually at the large scale, based on dams that store large volumes of water on rivers some distance from cities, with the potential energy of the water passing through turbines used to generate the electricity that is then transmitted over long distances. However, pico-scale (<10 kW) low-head systems (less than 2 – 3 m height difference in a run-of-river situation) are being developed so that in an urban area, wherever a water wheel has been operated in the past to power a grain mill or pump water, electricity could be generated instead.
Having secured, all-year-round, water supplies is essential, particularly for stand-alone systems where back-up generation is less likely to be available. The opportunity to combine wind and hydro to conserve water and add reliability to the system can be considered where conditions are appropriate.
Installing a mini hydro-power system in water distribution or wastewater treatment systems could be technically and economically feasible in some conditions, even only to provide sufficient electricity to supply the water treatment plant [34].
3.2.4 Geothermal
Conventional geothermal electricity generation requires relatively high temperature fields and hence is restricted to cities and towns located along plate boundaries and on hot spots such as in Hawaii. Around 15% of the world’s population lives within accessible distances to plate tectonic boundaries, including Indonesia, the Philippines, Iceland, New Zealand and several countries in East Africa and Central and South America. So the opportunity for some cities to invest in geothermal power station developments is good. In addition, the exploitation of deep fractured, sedimentary formations and the development of new designs of generators that use lower temperatures give increased potential. For example, at Landau49, Germany, wells 3.3 km deep were drilled to extract water at 160°C for use in underground heat exchangers to heat pentane gas that drives the 3 MWel turbine for power generation, with the used water then providing 7 MWth heat to the local district heating system [117]. In France the Soultz-sous-Forêts demonstration project is now producing electricity from the pre-commercial plant with on-going research occurring in parallel. At Chena Hot Springs, Alaska, two 200 kW organic Rankine cycle systems have been operating since 2007 on the heat from water extracted at only 73°C [118]. Since steam cannot be produced, a secondary binary fluid with a lower boiling point flashes to the vapor phase which then drives the turbine. The production costs are claimed to be less than USD 0.05/kWh.
3.2.5 Bioenergy
As seen previously, biomass (in urban areas mainly municipal solid waste and biogas from organic wastes) is commonly used as feedstock for bioenergy plants that normally generate heat for direct applications (use by industry, space heating of buildings, etc.). However, waste can produce electricity in combined heat and power (CHP) plants as well [34], as previously discussed in Chapter 3.1.3.
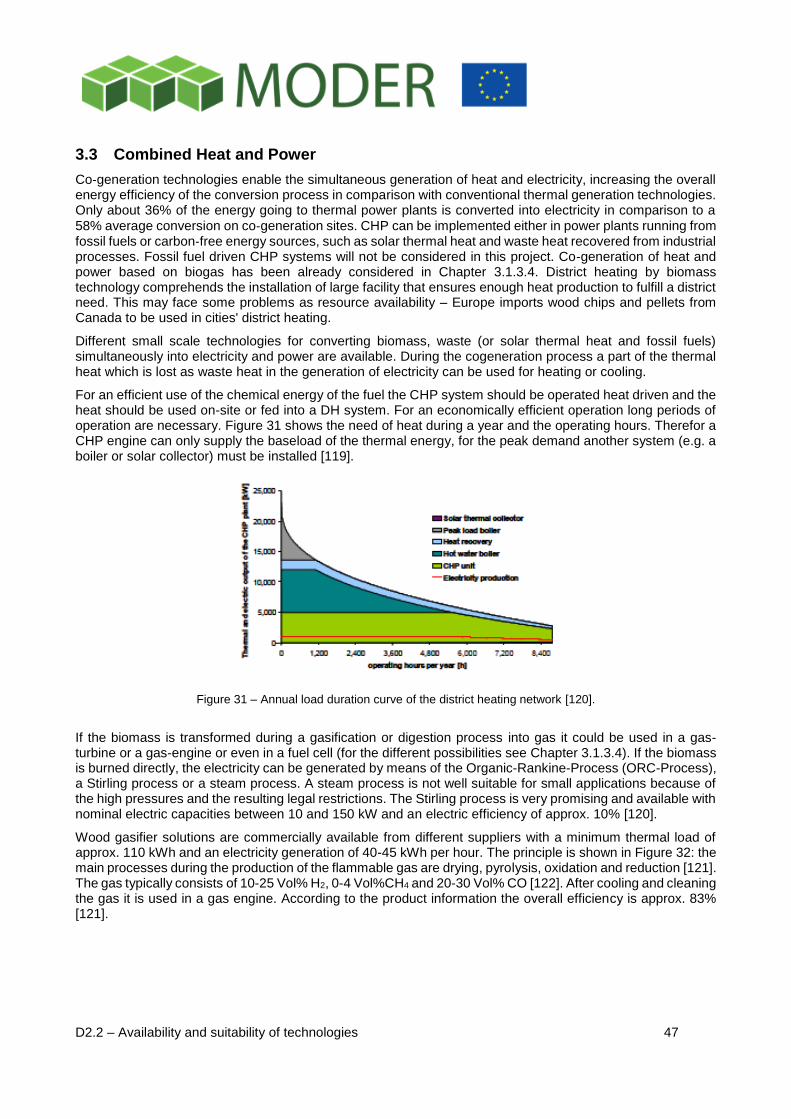
D2.2 – Availability and suitability of technologies 47
3.3 Combined Heat and Power
Co‐generation technologies enable the simultaneous generation of heat and electricity, increasing the overall energy efficiency of the conversion process in comparison with conventional thermal generation technologies. Only about 36% of the energy going to thermal power plants is converted into electricity in comparison to a
58% average conversion on co‐generation sites. CHP can be implemented either in power plants running from fossil fuels or carbon‐free energy sources, such as solar thermal heat and waste heat recovered from industrial processes. Fossil fuel driven CHP systems will not be considered in this project. Co-generation of heat and power based on biogas has been already considered in Chapter 3.1.3.4. District heating by biomass technology comprehends the installation of large facility that ensures enough heat production to fulfill a district need. This may face some problems as resource availability – Europe imports wood chips and pellets from Canada to be used in cities' district heating.
Different small scale technologies for converting biomass, waste (or solar thermal heat and fossil fuels) simultaneously into electricity and power are available. During the cogeneration process a part of the thermal heat which is lost as waste heat in the generation of electricity can be used for heating or cooling.
For an efficient use of the chemical energy of the fuel the CHP system should be operated heat driven and the heat should be used on-site or fed into a DH system. For an economically efficient operation long periods of operation are necessary. Figure 31 shows the need of heat during a year and the operating hours. Therefor a CHP engine can only supply the baseload of the thermal energy, for the peak demand another system (e.g. a boiler or solar collector) must be installed [119].
Figure 31 – Annual load duration curve of the district heating network [120].
If the biomass is transformed during a gasification or digestion process into gas it could be used in a gas-turbine or a gas-engine or even in a fuel cell (for the different possibilities see Chapter 3.1.3.4). If the biomass is burned directly, the electricity can be generated by means of the Organic-Rankine-Process (ORC-Process), a Stirling process or a steam process. A steam process is not well suitable for small applications because of the high pressures and the resulting legal restrictions. The Stirling process is very promising and available with nominal electric capacities between 10 and 150 kW and an electric efficiency of approx. 10% [120].
Wood gasifier solutions are commercially available from different suppliers with a minimum thermal load of approx. 110 kWh and an electricity generation of 40-45 kWh per hour. The principle is shown in Figure 32: the main processes during the production of the flammable gas are drying, pyrolysis, oxidation and reduction [121]. The gas typically consists of 10-25 Vol% H2, 0-4 Vol%CH4 and 20-30 Vol% CO [122]. After cooling and cleaning the gas it is used in a gas engine. According to the product information the overall efficiency is approx. 83% [121].
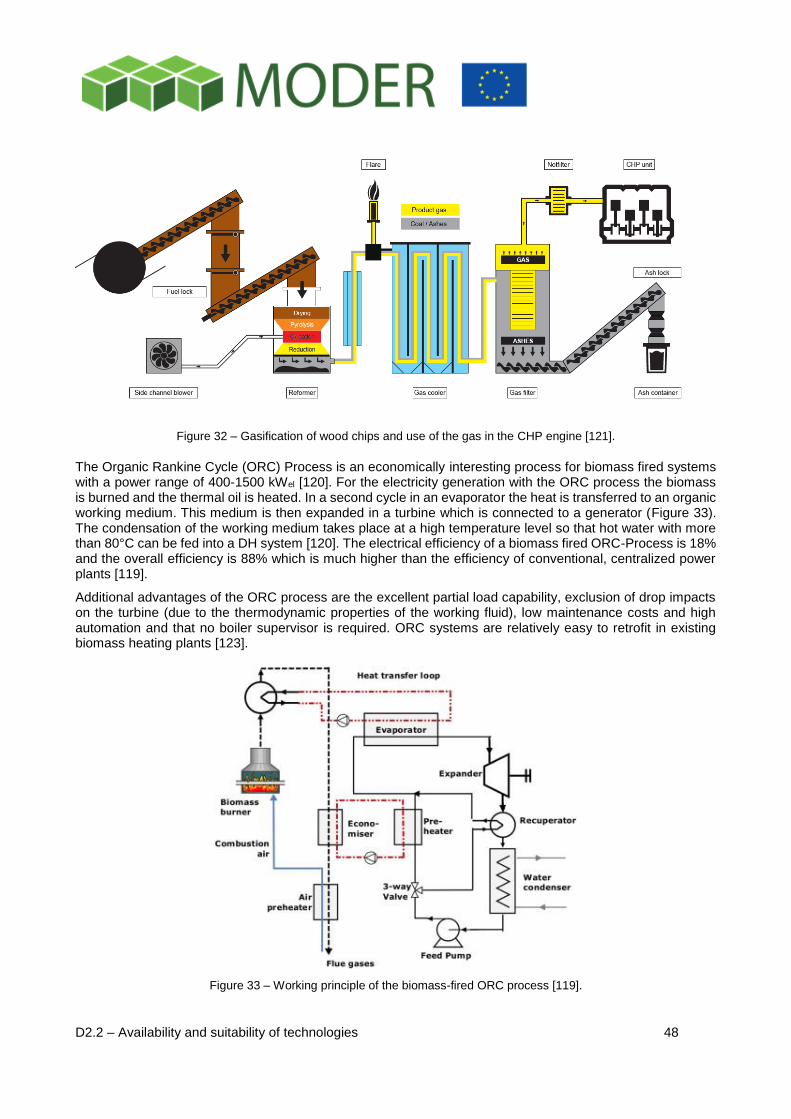
D2.2 – Availability and suitability of technologies 48
Figure 32 – Gasification of wood chips and use of the gas in the CHP engine [121].
The Organic Rankine Cycle (ORC) Process is an economically interesting process for biomass fired systems with a power range of 400-1500 kWel [120]. For the electricity generation with the ORC process the biomass is burned and the thermal oil is heated. In a second cycle in an evaporator the heat is transferred to an organic working medium. This medium is then expanded in a turbine which is connected to a generator (Figure 33). The condensation of the working medium takes place at a high temperature level so that hot water with more than 80°C can be fed into a DH system [120]. The electrical efficiency of a biomass fired ORC-Process is 18% and the overall efficiency is 88% which is much higher than the efficiency of conventional, centralized power plants [119].
Additional advantages of the ORC process are the excellent partial load capability, exclusion of drop impacts on the turbine (due to the thermodynamic properties of the working fluid), low maintenance costs and high automation and that no boiler supervisor is required. ORC systems are relatively easy to retrofit in existing biomass heating plants [123].
Figure 33 – Working principle of the biomass-fired ORC process [119].
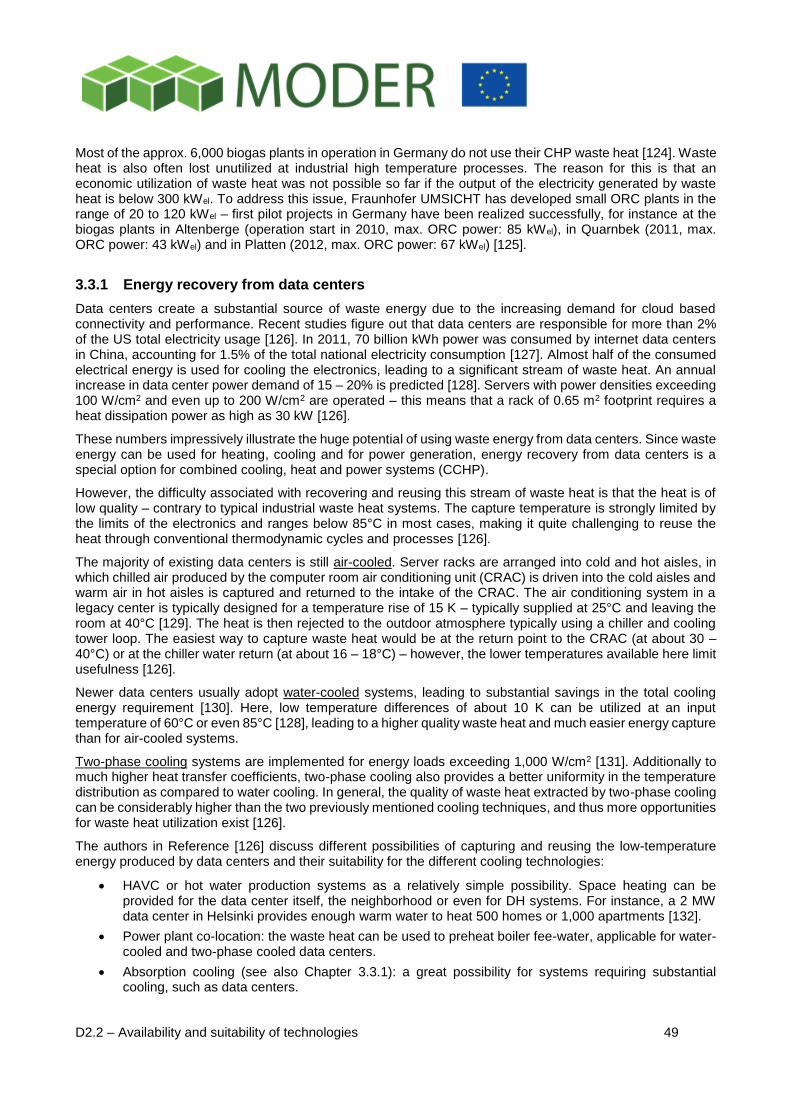
D2.2 – Availability and suitability of technologies 49
Most of the approx. 6,000 biogas plants in operation in Germany do not use their CHP waste heat [124]. Waste heat is also often lost unutilized at industrial high temperature processes. The reason for this is that an economic utilization of waste heat was not possible so far if the output of the electricity generated by waste heat is below 300 kWel. To address this issue, Fraunhofer UMSICHT has developed small ORC plants in the range of 20 to 120 kWel – first pilot projects in Germany have been realized successfully, for instance at the biogas plants in Altenberge (operation start in 2010, max. ORC power: 85 kWel), in Quarnbek (2011, max. ORC power: 43 kWel) and in Platten (2012, max. ORC power: 67 kWel) [125].
3.3.1 Energy recovery from data centers
Data centers create a substantial source of waste energy due to the increasing demand for cloud based connectivity and performance. Recent studies figure out that data centers are responsible for more than 2% of the US total electricity usage [126]. In 2011, 70 billion kWh power was consumed by internet data centers in China, accounting for 1.5% of the total national electricity consumption [127]. Almost half of the consumed electrical energy is used for cooling the electronics, leading to a significant stream of waste heat. An annual increase in data center power demand of 15 – 20% is predicted [128]. Servers with power densities exceeding 100 W/cm2 and even up to 200 W/cm2 are operated – this means that a rack of 0.65 m2 footprint requires a heat dissipation power as high as 30 kW [126].
These numbers impressively illustrate the huge potential of using waste energy from data centers. Since waste energy can be used for heating, cooling and for power generation, energy recovery from data centers is a special option for combined cooling, heat and power systems (CCHP).
However, the difficulty associated with recovering and reusing this stream of waste heat is that the heat is of low quality – contrary to typical industrial waste heat systems. The capture temperature is strongly limited by the limits of the electronics and ranges below 85°C in most cases, making it quite challenging to reuse the heat through conventional thermodynamic cycles and processes [126].
The majority of existing data centers is still air-cooled. Server racks are arranged into cold and hot aisles, in which chilled air produced by the computer room air conditioning unit (CRAC) is driven into the cold aisles and warm air in hot aisles is captured and returned to the intake of the CRAC. The air conditioning system in a legacy center is typically designed for a temperature rise of 15 K – typically supplied at 25°C and leaving the room at 40°C [129]. The heat is then rejected to the outdoor atmosphere typically using a chiller and cooling tower loop. The easiest way to capture waste heat would be at the return point to the CRAC (at about 30 – 40°C) or at the chiller water return (at about 16 – 18°C) – however, the lower temperatures available here limit usefulness [126].
Newer data centers usually adopt water-cooled systems, leading to substantial savings in the total cooling energy requirement [130]. Here, low temperature differences of about 10 K can be utilized at an input temperature of 60°C or even 85°C [128], leading to a higher quality waste heat and much easier energy capture than for air-cooled systems.
Two-phase cooling systems are implemented for energy loads exceeding 1,000 W/cm2 [131]. Additionally to much higher heat transfer coefficients, two-phase cooling also provides a better uniformity in the temperature distribution as compared to water cooling. In general, the quality of waste heat extracted by two-phase cooling can be considerably higher than the two previously mentioned cooling techniques, and thus more opportunities for waste heat utilization exist [126].
The authors in Reference [126] discuss different possibilities of capturing and reusing the low-temperature energy produced by data centers and their suitability for the different cooling technologies:
HAVC or hot water production systems as a relatively simple possibility. Space heating can be provided for the data center itself, the neighborhood or even for DH systems. For instance, a 2 MW data center in Helsinki provides enough warm water to heat 500 homes or 1,000 apartments [132].
Power plant co-location: the waste heat can be used to preheat boiler fee-water, applicable for water-cooled and two-phase cooled data centers.
Absorption cooling (see also Chapter 3.3.1): a great possibility for systems requiring substantial cooling, such as data centers.
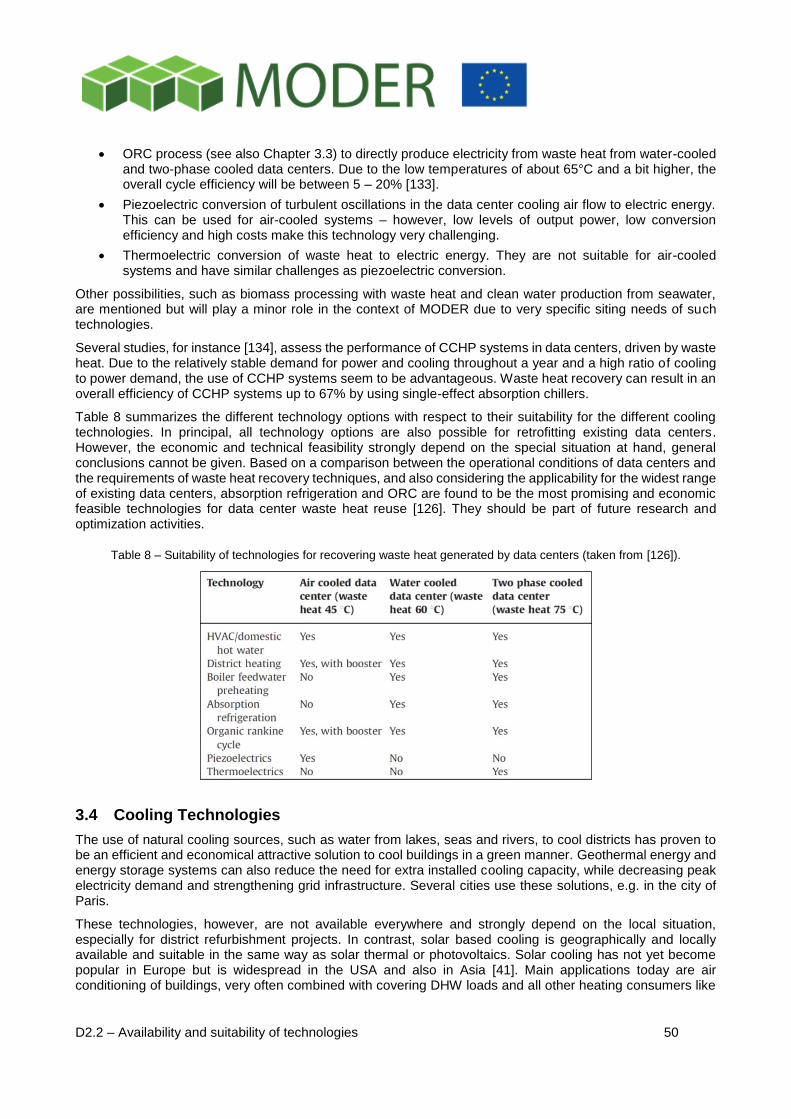
D2.2 – Availability and suitability of technologies 50
ORC process (see also Chapter 3.3) to directly produce electricity from waste heat from water-cooled and two-phase cooled data centers. Due to the low temperatures of about 65°C and a bit higher, the overall cycle efficiency will be between 5 – 20% [133].
Piezoelectric conversion of turbulent oscillations in the data center cooling air flow to electric energy. This can be used for air-cooled systems – however, low levels of output power, low conversion efficiency and high costs make this technology very challenging.
Thermoelectric conversion of waste heat to electric energy. They are not suitable for air-cooled systems and have similar challenges as piezoelectric conversion.
Other possibilities, such as biomass processing with waste heat and clean water production from seawater, are mentioned but will play a minor role in the context of MODER due to very specific siting needs of such technologies.
Several studies, for instance [134], assess the performance of CCHP systems in data centers, driven by waste heat. Due to the relatively stable demand for power and cooling throughout a year and a high ratio of cooling to power demand, the use of CCHP systems seem to be advantageous. Waste heat recovery can result in an overall efficiency of CCHP systems up to 67% by using single-effect absorption chillers.
Table 8 summarizes the different technology options with respect to their suitability for the different cooling technologies. In principal, all technology options are also possible for retrofitting existing data centers. However, the economic and technical feasibility strongly depend on the special situation at hand, general conclusions cannot be given. Based on a comparison between the operational conditions of data centers and the requirements of waste heat recovery techniques, and also considering the applicability for the widest range of existing data centers, absorption refrigeration and ORC are found to be the most promising and economic feasible technologies for data center waste heat reuse [126]. They should be part of future research and optimization activities.
Table 8 – Suitability of technologies for recovering waste heat generated by data centers (taken from [126]).
3.4 Cooling Technologies
The use of natural cooling sources, such as water from lakes, seas and rivers, to cool districts has proven to be an efficient and economical attractive solution to cool buildings in a green manner. Geothermal energy and energy storage systems can also reduce the need for extra installed cooling capacity, while decreasing peak electricity demand and strengthening grid infrastructure. Several cities use these solutions, e.g. in the city of Paris.
These technologies, however, are not available everywhere and strongly depend on the local situation, especially for district refurbishment projects. In contrast, solar based cooling is geographically and locally available and suitable in the same way as solar thermal or photovoltaics. Solar cooling has not yet become popular in Europe but is widespread in the USA and also in Asia [41]. Main applications today are air conditioning of buildings, very often combined with covering DHW loads and all other heating consumers like
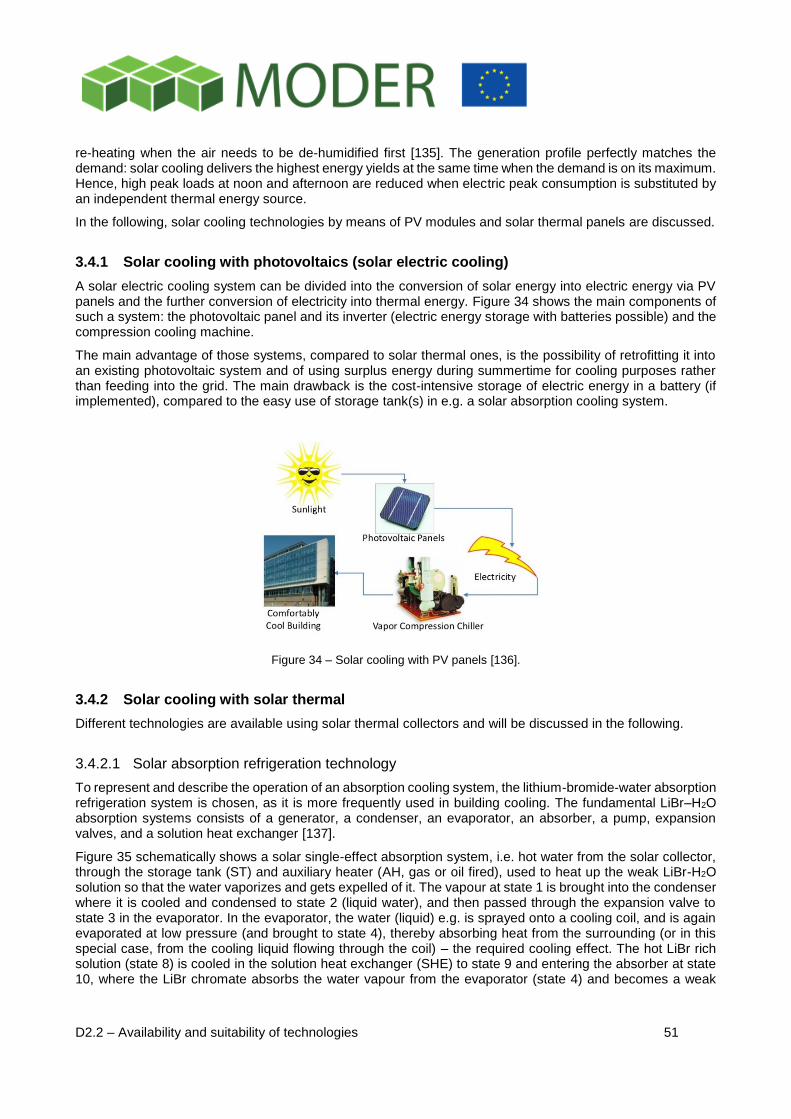
D2.2 – Availability and suitability of technologies 51
re-heating when the air needs to be de-humidified first [135]. The generation profile perfectly matches the demand: solar cooling delivers the highest energy yields at the same time when the demand is on its maximum. Hence, high peak loads at noon and afternoon are reduced when electric peak consumption is substituted by an independent thermal energy source.
In the following, solar cooling technologies by means of PV modules and solar thermal panels are discussed.
3.4.1 Solar cooling with photovoltaics (solar electric cooling)
A solar electric cooling system can be divided into the conversion of solar energy into electric energy via PV panels and the further conversion of electricity into thermal energy. Figure 34 shows the main components of such a system: the photovoltaic panel and its inverter (electric energy storage with batteries possible) and the compression cooling machine.
The main advantage of those systems, compared to solar thermal ones, is the possibility of retrofitting it into an existing photovoltaic system and of using surplus energy during summertime for cooling purposes rather than feeding into the grid. The main drawback is the cost-intensive storage of electric energy in a battery (if implemented), compared to the easy use of storage tank(s) in e.g. a solar absorption cooling system.
Figure 34 – Solar cooling with PV panels [136].
3.4.2 Solar cooling with solar thermal
Different technologies are available using solar thermal collectors and will be discussed in the following.
3.4.2.1 Solar absorption refrigeration technology
To represent and describe the operation of an absorption cooling system, the lithium-bromide-water absorption refrigeration system is chosen, as it is more frequently used in building cooling. The fundamental LiBr–H2O absorption systems consists of a generator, a condenser, an evaporator, an absorber, a pump, expansion valves, and a solution heat exchanger [137].
Figure 35 schematically shows a solar single-effect absorption system, i.e. hot water from the solar collector, through the storage tank (ST) and auxiliary heater (AH, gas or oil fired), used to heat up the weak LiBr-H2O solution so that the water vaporizes and gets expelled of it. The vapour at state 1 is brought into the condenser where it is cooled and condensed to state 2 (liquid water), and then passed through the expansion valve to state 3 in the evaporator. In the evaporator, the water (liquid) e.g. is sprayed onto a cooling coil, and is again evaporated at low pressure (and brought to state 4), thereby absorbing heat from the surrounding (or in this special case, from the cooling liquid flowing through the coil) – the required cooling effect. The hot LiBr rich solution (state 8) is cooled in the solution heat exchanger (SHE) to state 9 and entering the absorber at state 10, where the LiBr chromate absorbs the water vapour from the evaporator (state 4) and becomes a weak
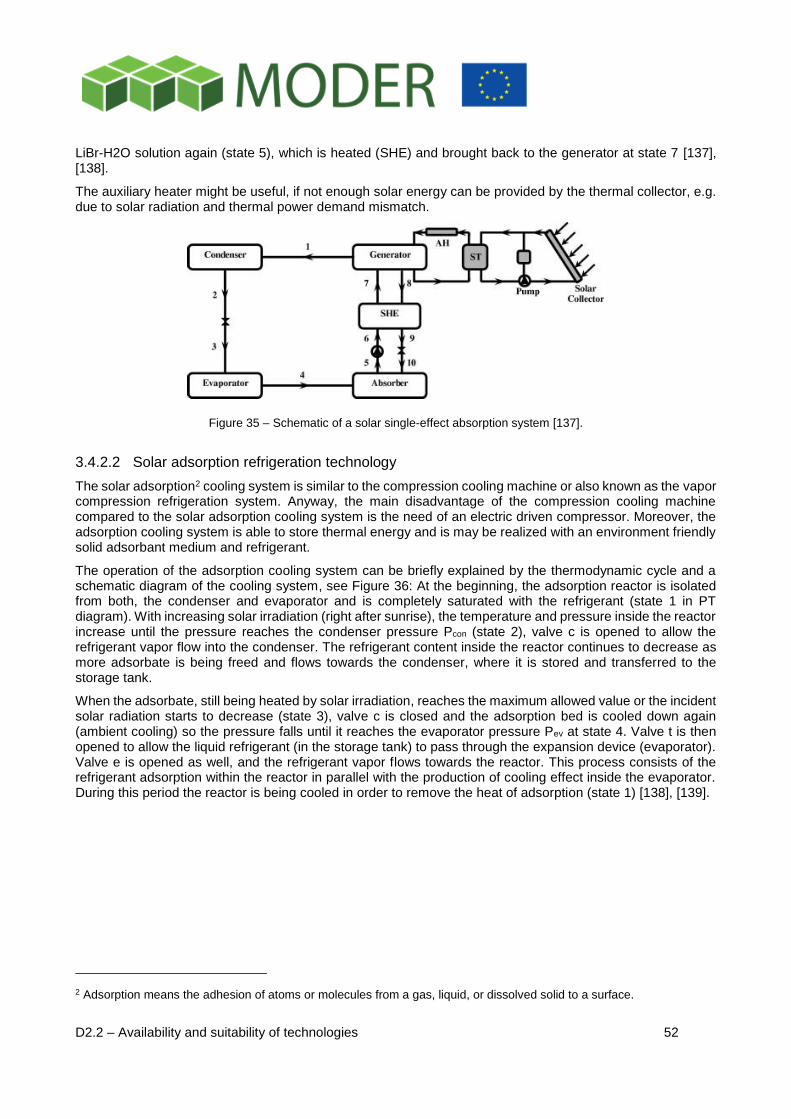
D2.2 – Availability and suitability of technologies 52
LiBr-H2O solution again (state 5), which is heated (SHE) and brought back to the generator at state 7 [137], [138].
The auxiliary heater might be useful, if not enough solar energy can be provided by the thermal collector, e.g. due to solar radiation and thermal power demand mismatch.
Figure 35 – Schematic of a solar single-effect absorption system [137].
3.4.2.2 Solar adsorption refrigeration technology
The solar adsorption2 cooling system is similar to the compression cooling machine or also known as the vapor compression refrigeration system. Anyway, the main disadvantage of the compression cooling machine compared to the solar adsorption cooling system is the need of an electric driven compressor. Moreover, the adsorption cooling system is able to store thermal energy and is may be realized with an environment friendly solid adsorbant medium and refrigerant.
The operation of the adsorption cooling system can be briefly explained by the thermodynamic cycle and a schematic diagram of the cooling system, see Figure 36: At the beginning, the adsorption reactor is isolated from both, the condenser and evaporator and is completely saturated with the refrigerant (state 1 in PT diagram). With increasing solar irradiation (right after sunrise), the temperature and pressure inside the reactor increase until the pressure reaches the condenser pressure Pcon (state 2), valve c is opened to allow the refrigerant vapor flow into the condenser. The refrigerant content inside the reactor continues to decrease as more adsorbate is being freed and flows towards the condenser, where it is stored and transferred to the storage tank.
When the adsorbate, still being heated by solar irradiation, reaches the maximum allowed value or the incident solar radiation starts to decrease (state 3), valve c is closed and the adsorption bed is cooled down again (ambient cooling) so the pressure falls until it reaches the evaporator pressure Pev at state 4. Valve t is then opened to allow the liquid refrigerant (in the storage tank) to pass through the expansion device (evaporator). Valve e is opened as well, and the refrigerant vapor flows towards the reactor. This process consists of the refrigerant adsorption within the reactor in parallel with the production of cooling effect inside the evaporator. During this period the reactor is being cooled in order to remove the heat of adsorption (state 1) [138], [139].
2 Adsorption means the adhesion of atoms or molecules from a gas, liquid, or dissolved solid to a surface.
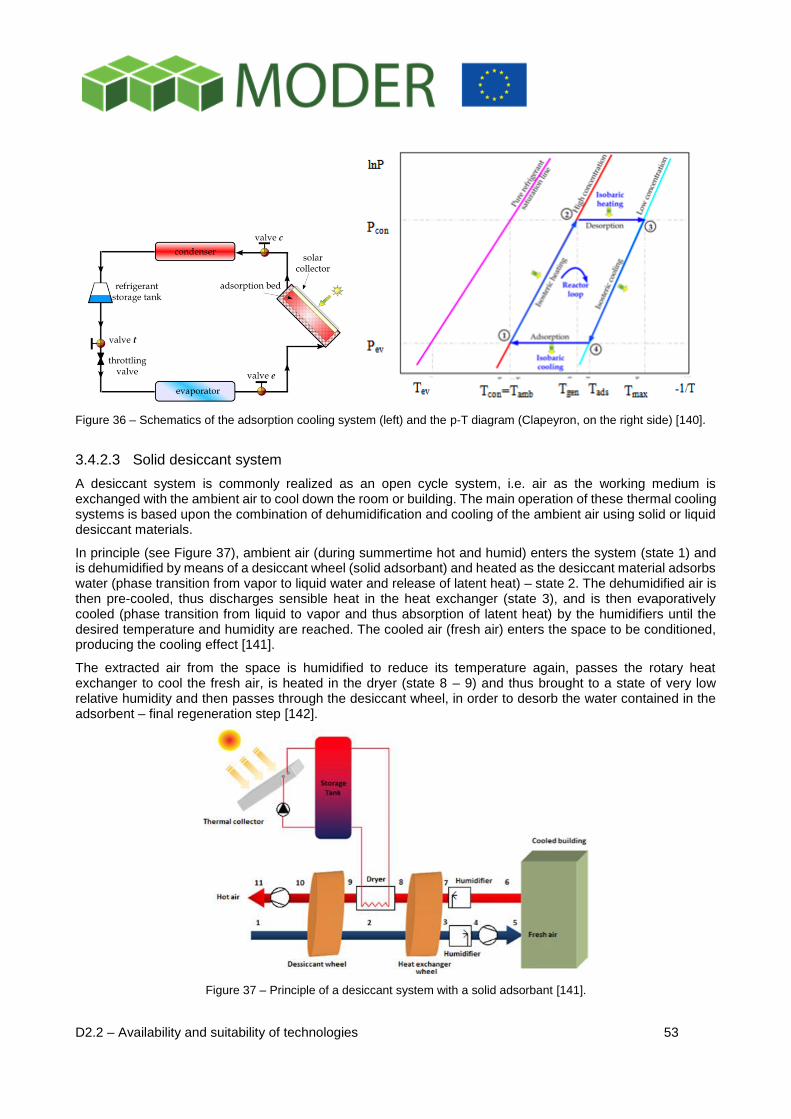
D2.2 – Availability and suitability of technologies 53
Figure 36 – Schematics of the adsorption cooling system (left) and the p-T diagram (Clapeyron, on the right side) [140].
3.4.2.3 Solid desiccant system
A desiccant system is commonly realized as an open cycle system, i.e. air as the working medium is exchanged with the ambient air to cool down the room or building. The main operation of these thermal cooling systems is based upon the combination of dehumidification and cooling of the ambient air using solid or liquid desiccant materials.
In principle (see Figure 37), ambient air (during summertime hot and humid) enters the system (state 1) and is dehumidified by means of a desiccant wheel (solid adsorbant) and heated as the desiccant material adsorbs water (phase transition from vapor to liquid water and release of latent heat) – state 2. The dehumidified air is then pre-cooled, thus discharges sensible heat in the heat exchanger (state 3), and is then evaporatively cooled (phase transition from liquid to vapor and thus absorption of latent heat) by the humidifiers until the desired temperature and humidity are reached. The cooled air (fresh air) enters the space to be conditioned, producing the cooling effect [141].
The extracted air from the space is humidified to reduce its temperature again, passes the rotary heat exchanger to cool the fresh air, is heated in the dryer (state 8 – 9) and thus brought to a state of very low relative humidity and then passes through the desiccant wheel, in order to desorb the water contained in the adsorbent – final regeneration step [142].
Figure 37 – Principle of a desiccant system with a solid adsorbant [141].
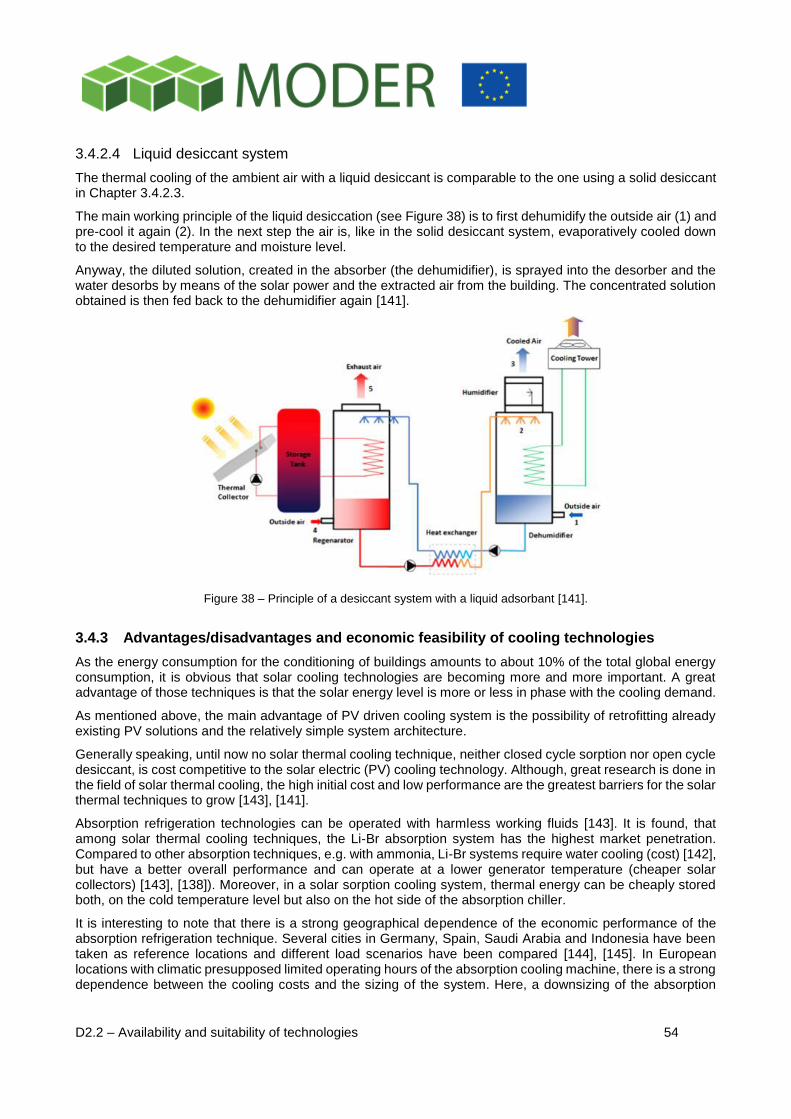
D2.2 – Availability and suitability of technologies 54
3.4.2.4 Liquid desiccant system
The thermal cooling of the ambient air with a liquid desiccant is comparable to the one using a solid desiccant in Chapter 3.4.2.3.
The main working principle of the liquid desiccation (see Figure 38) is to first dehumidify the outside air (1) and pre-cool it again (2). In the next step the air is, like in the solid desiccant system, evaporatively cooled down to the desired temperature and moisture level.
Anyway, the diluted solution, created in the absorber (the dehumidifier), is sprayed into the desorber and the water desorbs by means of the solar power and the extracted air from the building. The concentrated solution obtained is then fed back to the dehumidifier again [141].
Figure 38 – Principle of a desiccant system with a liquid adsorbant [141].
3.4.3 Advantages/disadvantages and economic feasibility of cooling technologies
As the energy consumption for the conditioning of buildings amounts to about 10% of the total global energy consumption, it is obvious that solar cooling technologies are becoming more and more important. A great advantage of those techniques is that the solar energy level is more or less in phase with the cooling demand.
As mentioned above, the main advantage of PV driven cooling system is the possibility of retrofitting already existing PV solutions and the relatively simple system architecture.
Generally speaking, until now no solar thermal cooling technique, neither closed cycle sorption nor open cycle desiccant, is cost competitive to the solar electric (PV) cooling technology. Although, great research is done in the field of solar thermal cooling, the high initial cost and low performance are the greatest barriers for the solar thermal techniques to grow [143], [141].
Absorption refrigeration technologies can be operated with harmless working fluids [143]. It is found, that among solar thermal cooling techniques, the Li-Br absorption system has the highest market penetration. Compared to other absorption techniques, e.g. with ammonia, Li-Br systems require water cooling (cost) [142], but have a better overall performance and can operate at a lower generator temperature (cheaper solar collectors) [143], [138]). Moreover, in a solar sorption cooling system, thermal energy can be cheaply stored both, on the cold temperature level but also on the hot side of the absorption chiller.
It is interesting to note that there is a strong geographical dependence of the economic performance of the absorption refrigeration technique. Several cities in Germany, Spain, Saudi Arabia and Indonesia have been taken as reference locations and different load scenarios have been compared [144], [145]. In European locations with climatic presupposed limited operating hours of the absorption cooling machine, there is a strong dependence between the cooling costs and the sizing of the system. Here, a downsizing of the absorption
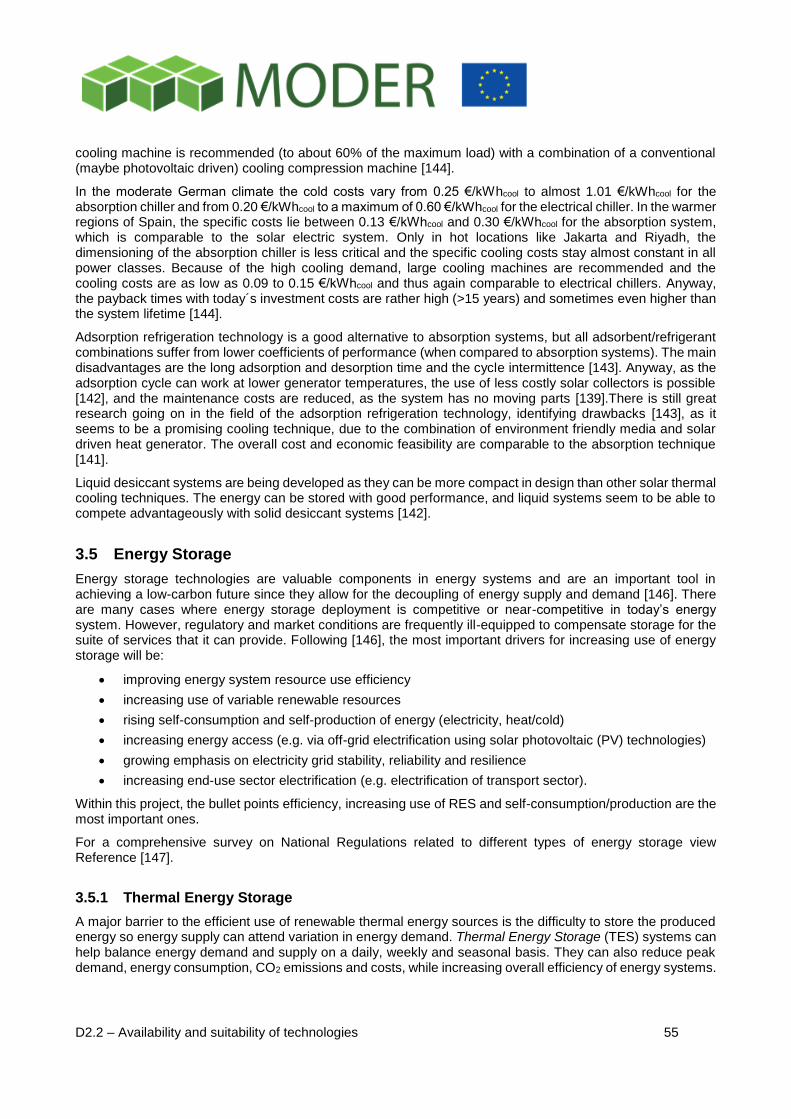
D2.2 – Availability and suitability of technologies 55
cooling machine is recommended (to about 60% of the maximum load) with a combination of a conventional (maybe photovoltaic driven) cooling compression machine [144].
In the moderate German climate the cold costs vary from 0.25 €/kWhcool to almost 1.01 €/kWhcool for the absorption chiller and from 0.20 €/kWhcool to a maximum of 0.60 €/kWhcool for the electrical chiller. In the warmer regions of Spain, the specific costs lie between 0.13 €/kWhcool and 0.30 €/kWhcool for the absorption system, which is comparable to the solar electric system. Only in hot locations like Jakarta and Riyadh, the dimensioning of the absorption chiller is less critical and the specific cooling costs stay almost constant in all power classes. Because of the high cooling demand, large cooling machines are recommended and the cooling costs are as low as 0.09 to 0.15 €/kWhcool and thus again comparable to electrical chillers. Anyway, the payback times with today´s investment costs are rather high (>15 years) and sometimes even higher than the system lifetime [144].
Adsorption refrigeration technology is a good alternative to absorption systems, but all adsorbent/refrigerant combinations suffer from lower coefficients of performance (when compared to absorption systems). The main disadvantages are the long adsorption and desorption time and the cycle intermittence [143]. Anyway, as the adsorption cycle can work at lower generator temperatures, the use of less costly solar collectors is possible [142], and the maintenance costs are reduced, as the system has no moving parts [139].There is still great research going on in the field of the adsorption refrigeration technology, identifying drawbacks [143], as it seems to be a promising cooling technique, due to the combination of environment friendly media and solar driven heat generator. The overall cost and economic feasibility are comparable to the absorption technique [141].
Liquid desiccant systems are being developed as they can be more compact in design than other solar thermal cooling techniques. The energy can be stored with good performance, and liquid systems seem to be able to compete advantageously with solid desiccant systems [142].
3.5 Energy Storage
Energy storage technologies are valuable components in energy systems and are an important tool in achieving a low-carbon future since they allow for the decoupling of energy supply and demand [146]. There are many cases where energy storage deployment is competitive or near-competitive in today’s energy system. However, regulatory and market conditions are frequently ill-equipped to compensate storage for the suite of services that it can provide. Following [146], the most important drivers for increasing use of energy storage will be:
improving energy system resource use efficiency
increasing use of variable renewable resources
rising self-consumption and self-production of energy (electricity, heat/cold)
increasing energy access (e.g. via off-grid electrification using solar photovoltaic (PV) technologies)
growing emphasis on electricity grid stability, reliability and resilience
increasing end-use sector electrification (e.g. electrification of transport sector).
Within this project, the bullet points efficiency, increasing use of RES and self-consumption/production are the most important ones.
For a comprehensive survey on National Regulations related to different types of energy storage view Reference [147].
3.5.1 Thermal Energy Storage
A major barrier to the efficient use of renewable thermal energy sources is the difficulty to store the produced energy so energy supply can attend variation in energy demand. Thermal Energy Storage (TES) systems can help balance energy demand and supply on a daily, weekly and seasonal basis. They can also reduce peak demand, energy consumption, CO2 emissions and costs, while increasing overall efficiency of energy systems.
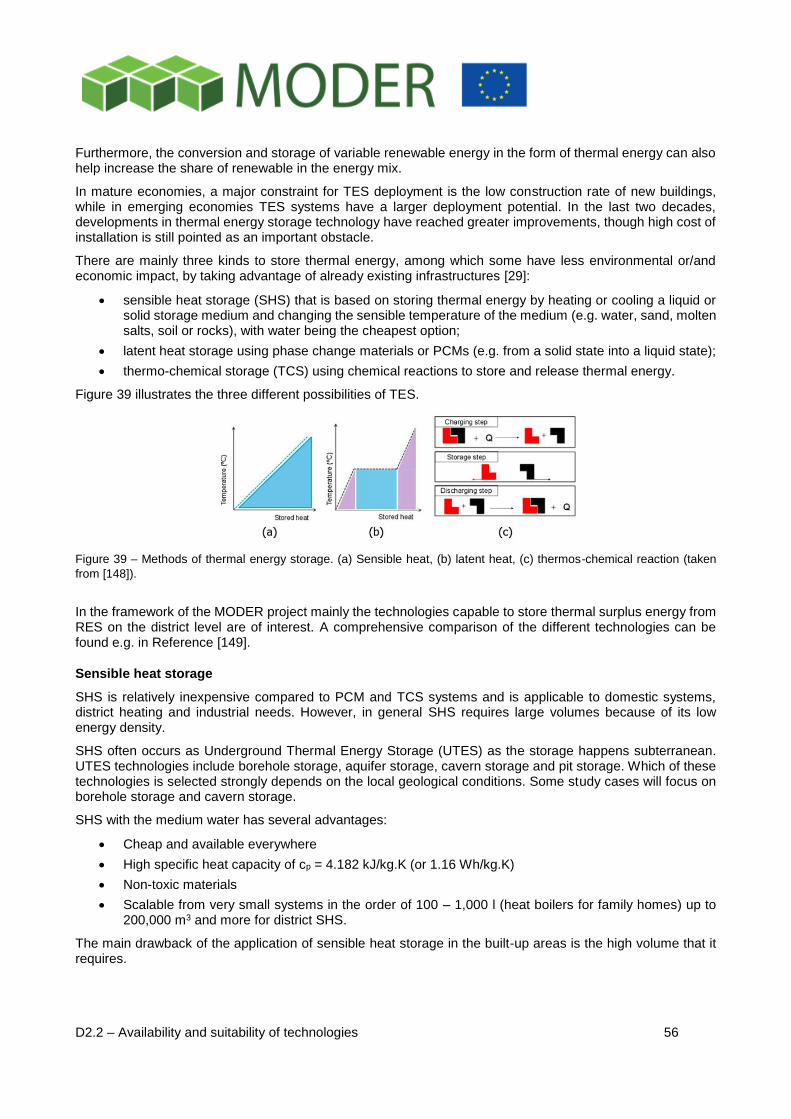
D2.2 – Availability and suitability of technologies 56
Furthermore, the conversion and storage of variable renewable energy in the form of thermal energy can also help increase the share of renewable in the energy mix.
In mature economies, a major constraint for TES deployment is the low construction rate of new buildings, while in emerging economies TES systems have a larger deployment potential. In the last two decades, developments in thermal energy storage technology have reached greater improvements, though high cost of installation is still pointed as an important obstacle.
There are mainly three kinds to store thermal energy, among which some have less environmental or/and economic impact, by taking advantage of already existing infrastructures [29]:
sensible heat storage (SHS) that is based on storing thermal energy by heating or cooling a liquid or solid storage medium and changing the sensible temperature of the medium (e.g. water, sand, molten salts, soil or rocks), with water being the cheapest option;
latent heat storage using phase change materials or PCMs (e.g. from a solid state into a liquid state);
thermo-chemical storage (TCS) using chemical reactions to store and release thermal energy.
Figure 39 illustrates the three different possibilities of TES.
Figure 39 – Methods of thermal energy storage. (a) Sensible heat, (b) latent heat, (c) thermos-chemical reaction (taken
from [148]).
In the framework of the MODER project mainly the technologies capable to store thermal surplus energy from RES on the district level are of interest. A comprehensive comparison of the different technologies can be found e.g. in Reference [149].
Sensible heat storage
SHS is relatively inexpensive compared to PCM and TCS systems and is applicable to domestic systems, district heating and industrial needs. However, in general SHS requires large volumes because of its low energy density.
SHS often occurs as Underground Thermal Energy Storage (UTES) as the storage happens subterranean. UTES technologies include borehole storage, aquifer storage, cavern storage and pit storage. Which of these technologies is selected strongly depends on the local geological conditions. Some study cases will focus on borehole storage and cavern storage.
SHS with the medium water has several advantages:
Cheap and available everywhere
High specific heat capacity of cp = 4.182 kJ/kg.K (or 1.16 Wh/kg.K)
Non-toxic materials
Scalable from very small systems in the order of 100 – 1,000 l (heat boilers for family homes) up to 200,000 m3 and more for district SHS.
The main drawback of the application of sensible heat storage in the built-up areas is the high volume that it requires.
D2.2 – Availability and suitability of technologies 57
Large heat storages are usually realized as pit storages with foils and a swimming cover. The world largest one with 200,000 m3 together with the largest heating plant with 70,000 m2 (49 MWth) were put into operation in Vojens/Denmark in 2015 [150].
Latent heat storage
In principal, latent heat storage can be realized through different phase transitions. However, only solid to liquid and liquid to solid phase changes are practical for PCMs. Although liquid to gas transitions have a higher heat of transformation than solid to liquid transitions, liquid to gas phase changes are impractical for thermal storage because large volumes or high pressures are required to store the materials in their gas phase. Solid to solid phase changes are typically very slow and have a relatively low heat of transformation [151]. Within the human comfort range between 20 to 30°C, some PCMs are very effective. They store 5 to 14 times more heat per unit volume than conventional storage materials such as water, masonry or rock [152].
The incorporation of phase change materials (PCM) in the building sector has been widely investigated by several researchers [153]. PCM are classified as different groups depending on the material nature (paraffin, fatty acids, salt hydrates, etc.). Each material presents their own advantages and limitations, so its selection has to be done based on the application requirements. Paraffins and fatty acids present no subcooling, low hysteresis and are more stable than the salt hydrate which can present segregation after cycling. The main disadvantages of the paraffins and fatty acids are their low thermal conductivity, which might be enhanced using thin encapsulation, maximizing the heat transfer area or using a graphite-matrix. Moreover, the prevention of fire hazards has to be considered when using these materials, therefore recently the addition of fire retardants has been investigated [148].
PCMs in buildings can be directly included in walls, by impregnation in a porous material as gypsum, by using microencapsulation techniques, using a shape-stabilization or slurries of PCM suspended on a thermal fluid [148]. The encapsulation is a key issue for the implementation of these technologies in the buildings and must be designed to avoid leakage and corrosion.
For the purpose of this work where TES on district level in the course of refurbishments are of interest PCMs will presently play a minor role.
Thermo-chemical storage
TCS store and release heat energy by a reversible endothermic/exothermic reaction process (see Figure 39). During the charging process, heat is applied to the material A, resulting in a separation of two parts B + C. The resulting reaction products can be easily separated and stored until the discharge process is required. Then, the two parts B + C are mixed at a suitable pressure and temperature conditions and energy is released [148]. Even though this method is the most energy efficient, they are under developing phase and there are no real applications implemented in the building sector yet [154]. TCS has to overcome important barriers such as corrosion, poor heat and mass transfer performance and materials development. However, the high energy density of these processes and the lack of heat gains or losses during the storage period make this method probably suitable for seasonal storage applications in the future.
3.5.2 Electrical energy storage
In the past, EES has played three main roles [155]:
Reducing electricity costs by storing electricity produced at off-peak times,
improvement of the reliability of the power supply and
to maintain and improve power quality, frequency and voltage.
Presently, EES is expected to solve problems accompanied with high ratios of RES feeding surplus energy into the public grid and hence to reduce electric energy based on fossil or nuclear resources. RES such as PV and wind generators are inherently fluctuating energy sources. In the context of MODER, they additionally represent a virtual power station strongly distributed within built-up areas. However, electricity has to be consumed (or somehow stored) at the same time as it is generated – the varying demand always has to be met by the electricity provided. An imbalance between supply and demand will harm the grid´s stability and

D2.2 – Availability and suitability of technologies 58
quality (in terms of voltage and frequency). By now, it is commonly recognized that high penetrations of RES in the electric energy mix necessitates and has to be accompanied by suitable EES to avoid unused surplus power from RES.
Electricity storage technologies can be grouped into three main time categories:
short-term (seconds to minutes),
long-term (hours to seasons) and
distributed battery storage (suitable for both short- and long-term applications),
based on the types of services they provide [146]. Typical long-term storage technologies are pumped storage hydropower (PSH), compressed air energy storage in underground caverns (CAES) and hydrogen storage. Supercapacitors, superconducting magnetic energy storage technologies and flywheels are typical possibilities of short-term storages. PSH, CAES and some battery technologies are the most mature technologies – however, PSH and CAES are not relevant for refurbishment districts (possibly only in very special cases). Different flow battery technologies, superconducting magnetic energy storage, supercapacitors and other advanced battery technologies are currently at very early stages of development.
Flywheels store electric energy in the form of rotating masses and are realized in large-scale electricity applications, for instance Beacon Power (Stephentown, NY) [156]. They are mainly used for power applications (grid stability) rather than for energy applications. There main advantage is their instantaneous reaction to control signals at a rate that is 100 times faster than traditional generation resources. Flywheels can operate at 100% DoD with no performance degradation over a 20-year lifetime, and can do so for more than 100,000 full cycles. This makes them perfect for supplying short bursts of electricity into the energy system. However, modern flywheel technologies struggle in today’s energy markets due to high costs relative to their market value [146]. For typical energy applications as for MODER, flywheels will play – if any – a minor role.
In principal, energy storage can be integrated at different levels of electricity [147]:
Generation level: Arbitrage, balancing and reserve power, etc.
Transmission level: frequency control, investment deferral
Distribution level: voltage control, capacity support, etc.
Customer level: peak shaving, time of use cost management, etc.
In a future with low-carbon energy systems, storage of electric energy will be needed at all points of the electricity system, resulting in different requirements on the power rating and discharge time - Figure 40 shows the power ranges (in MW) of different energy storage technologies as well as the duration over which they can provide power (seconds to hours). Possible uses for EES technologies include reserve and response services, transmission and distribution grid support and bulk power management [157].
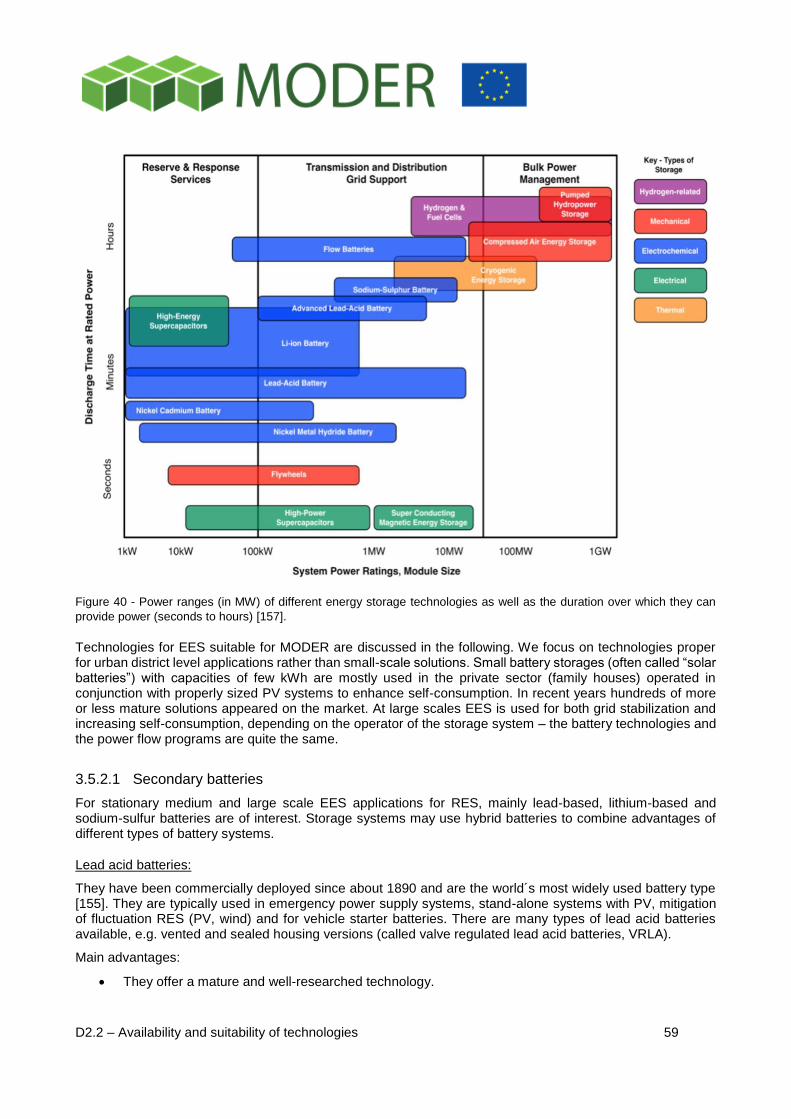
D2.2 – Availability and suitability of technologies 59
Figure 40 - Power ranges (in MW) of different energy storage technologies as well as the duration over which they can
provide power (seconds to hours) [157].
Technologies for EES suitable for MODER are discussed in the following. We focus on technologies proper for urban district level applications rather than small-scale solutions. Small battery storages (often called “solar batteries”) with capacities of few kWh are mostly used in the private sector (family houses) operated in conjunction with properly sized PV systems to enhance self-consumption. In recent years hundreds of more or less mature solutions appeared on the market. At large scales EES is used for both grid stabilization and increasing self-consumption, depending on the operator of the storage system – the battery technologies and the power flow programs are quite the same.
3.5.2.1 Secondary batteries
For stationary medium and large scale EES applications for RES, mainly lead-based, lithium-based and sodium-sulfur batteries are of interest. Storage systems may use hybrid batteries to combine advantages of different types of battery systems.
Lead acid batteries:
They have been commercially deployed since about 1890 and are the world´s most widely used battery type [155]. They are typically used in emergency power supply systems, stand-alone systems with PV, mitigation of fluctuation RES (PV, wind) and for vehicle starter batteries. There are many types of lead acid batteries available, e.g. vented and sealed housing versions (called valve regulated lead acid batteries, VRLA).
Main advantages:
They offer a mature and well-researched technology.

D2.2 – Availability and suitability of technologies 60
Very low cost (ca. 100 €/kWh at high quantities).
Cycle efficiency levels of around 80 – 90%
Easy recyclability
Simple charging technology.
Main disadvantages:
Relatively low circle life of about 1,500 cycles at 80% DoD
The usable capacity decreases when high power is discharged.
Low energy density of about 10 – 40 Wh/kg.
Sodium-sulfur battery:
Sodium-sulfur batteries are constructed from liquid sodium (Na) and sulfur (S) - molten sulfur is the positive electrode and molten sodium the negative one. They have a high energy density, high efficiency of charge and discharge (round trip efficiency of 89 to 92%) and long cycle life, and are fabricated from inexpensive and nontoxic materials [158]. NAS batteries are especially suitable to balance electric energy from RES between day and night. The cell becomes more economical with increasing size.
Main advantages:
High energy density and round-trip efficiency.
Long cycle life (typically 4,500 [155])
Inexpensive materials.
Very low self-discharge
No gas formation during charge and discharge
Main disadvantages:
Heating is required (300 – 350°C). This can be partly compensated when used in high capacity racks (reduced surface to volume ratio) and by applying a good thermal insulation.
Highly corrosive nature of the sodium polysulfides.
Moderate power to capacity ratio (c-rate 1/6).
Risk potential in case of breakage of the solid electrolyte.
Lithium-based batteries:
Lithium-based batteries include lithium-ion, lithium-polymer, lithium-air, lithium-titanate, and lithium-ceramic batteries for instance, depending on the used electrode material. They show in general a high power to capacity ratio (c-rate 1) and high energy densities and are suitable for rather short-time storage of energy (minutes to hours).
For stationary energy storage mainly lithium-ion (LiFePO4) batteries (often called LFP batteries) are used.
Main advantages:
Suitable for very high charge and discharge currents
Due to the design of the battery very high safety against accidents
High cell voltage of 3.2 to 3.3 V [159]
Energy density around 90 Wh/kg (up to 120 Wh/kg)
About 5,000 cycles and more at 50% DoD and about 1,500 at 100% DoD
High charging efficiency of about 90%
Very good availability in large quantities and different designs
D2.2 – Availability and suitability of technologies 61
Main disadvantages:
Balancing electronics necessary
Calendrical lifetime of about 5 years
Still quite expensive
3.5.2.2 Vanadium redox flow battery
The vanadium redox flow battery is a special type of rechargeable flow battery using vanadium ions to store electric energy as chemical potential energy. The vanadium redox battery exploits the ability of vanadium to exist in solution in four different oxidation states, and uses this property to make a battery that has just one electroactive element instead of two [160]. The fundamental difference between conventional batteries and flow cells is that energy is stored as the electrode material in conventional batteries but as the electrolyte in flow cells [161]. The battery system usually comes in a container including all necessary components.
Main advantages:
Nearly zero self-discharge (< 1% per year).
No aging or wearout of the electrolyte or electrodes.
Energy can be stored for a long period – suitable for seasonal balance and shifting.
Power (in kW) and capacity (in kWh) are independently scalable.
The battery does not suffer from being completely discharged even for long (DoD = 100%).
Very Long cycle life.
No memory effect.
The electrolyte is aqueous and inherently safe and non-flammable.
Main disadvantages:
Quite expensive technology (in the order of 700 €/kWh, already including inverters)
Relatively high maintenance costs of about 4% of the purchasing price per year.
Relatively poor energy density (about 25 Wh/kg) – but this is irrelevant in most stationary cases.
Low efficiency of 75%.
3.5.2.3 Hydrogen storage and fuel cells
Hydrogen storage in combination with fuel cells is typically used for long-term energy applications up to seasonal energy shifts. Electric energy (from wind or PV) is converted into hydrogen by electrolysis, stored, and then re-converted into the desired end-use form (e.g. electricity via fuel cells, heat, synthetic natural gas) [146]. When using the stored hydrogen for electricity generation, the fuel cell (also known as regenerative fuel cell) is adopted, being the key technology in hydrogen EES [162], see Figure 41. The overall reaction is: 2H2 + O2 2H2O + energy. Electrical and heat energy are released during the process. Thus, fuel cells are capable to provide heat and power (CHP) and heat, cold and power (CHCP – combined trigeneration). Depending on the choice of fuel and electrolyte, there are six major groups of fuel cells, which are: Alkaline Fuel Cell (AFC), Phosphoric Acid Fuel Cell (PAFC), Solid Oxide Fuel Cell (SOFC), Molten Carbonate Fuel Cell (MCFC), Proton Exchange Membrane Fuel Cell (PEMFC) and Direct Methanol Fuel Cell (DMFC) [163]. Several companies offer electrolyzers on the market, for instance Hydrogenics [164] and Siemens [165].
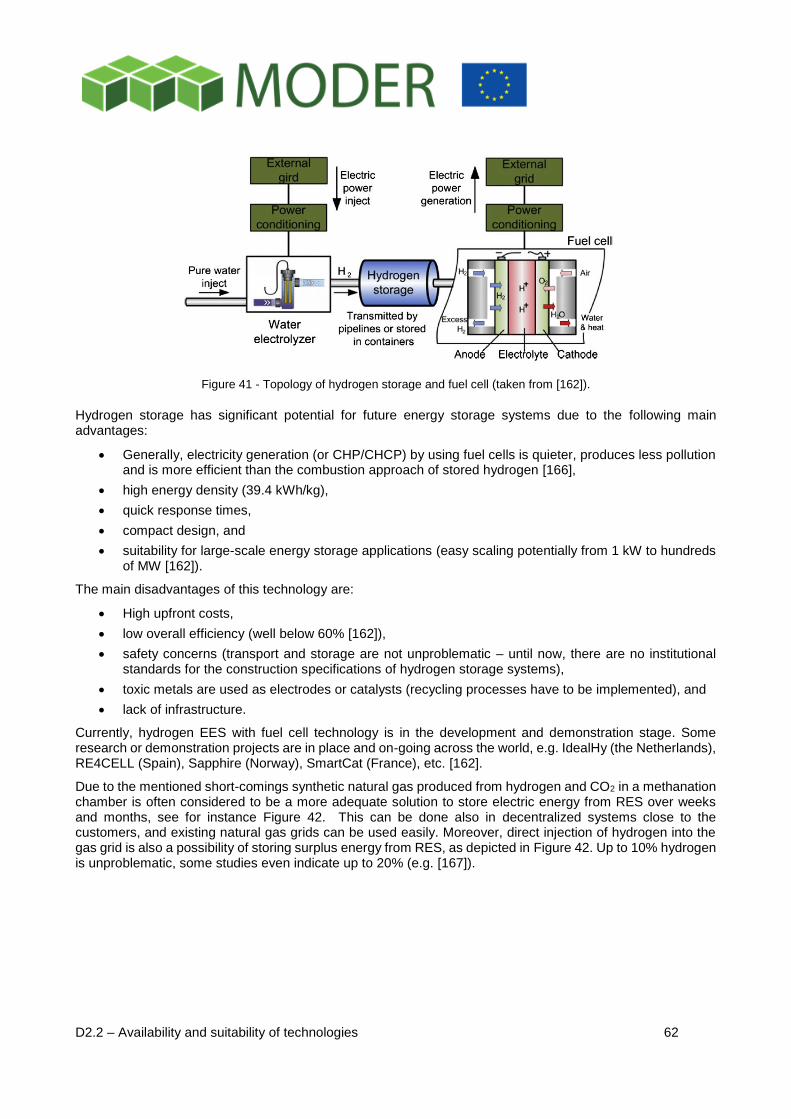
D2.2 – Availability and suitability of technologies 62
Figure 41 - Topology of hydrogen storage and fuel cell (taken from [162]).
Hydrogen storage has significant potential for future energy storage systems due to the following main advantages:
Generally, electricity generation (or CHP/CHCP) by using fuel cells is quieter, produces less pollution and is more efficient than the combustion approach of stored hydrogen [166],
high energy density (39.4 kWh/kg),
quick response times,
compact design, and
suitability for large-scale energy storage applications (easy scaling potentially from 1 kW to hundreds of MW [162]).
The main disadvantages of this technology are:
High upfront costs,
low overall efficiency (well below 60% [162]),
safety concerns (transport and storage are not unproblematic – until now, there are no institutional standards for the construction specifications of hydrogen storage systems),
toxic metals are used as electrodes or catalysts (recycling processes have to be implemented), and
lack of infrastructure.
Currently, hydrogen EES with fuel cell technology is in the development and demonstration stage. Some research or demonstration projects are in place and on-going across the world, e.g. IdealHy (the Netherlands), RE4CELL (Spain), Sapphire (Norway), SmartCat (France), etc. [162].
Due to the mentioned short-comings synthetic natural gas produced from hydrogen and CO2 in a methanation chamber is often considered to be a more adequate solution to store electric energy from RES over weeks and months, see for instance Figure 42. This can be done also in decentralized systems close to the customers, and existing natural gas grids can be used easily. Moreover, direct injection of hydrogen into the gas grid is also a possibility of storing surplus energy from RES, as depicted in Figure 42. Up to 10% hydrogen is unproblematic, some studies even indicate up to 20% (e.g. [167]).
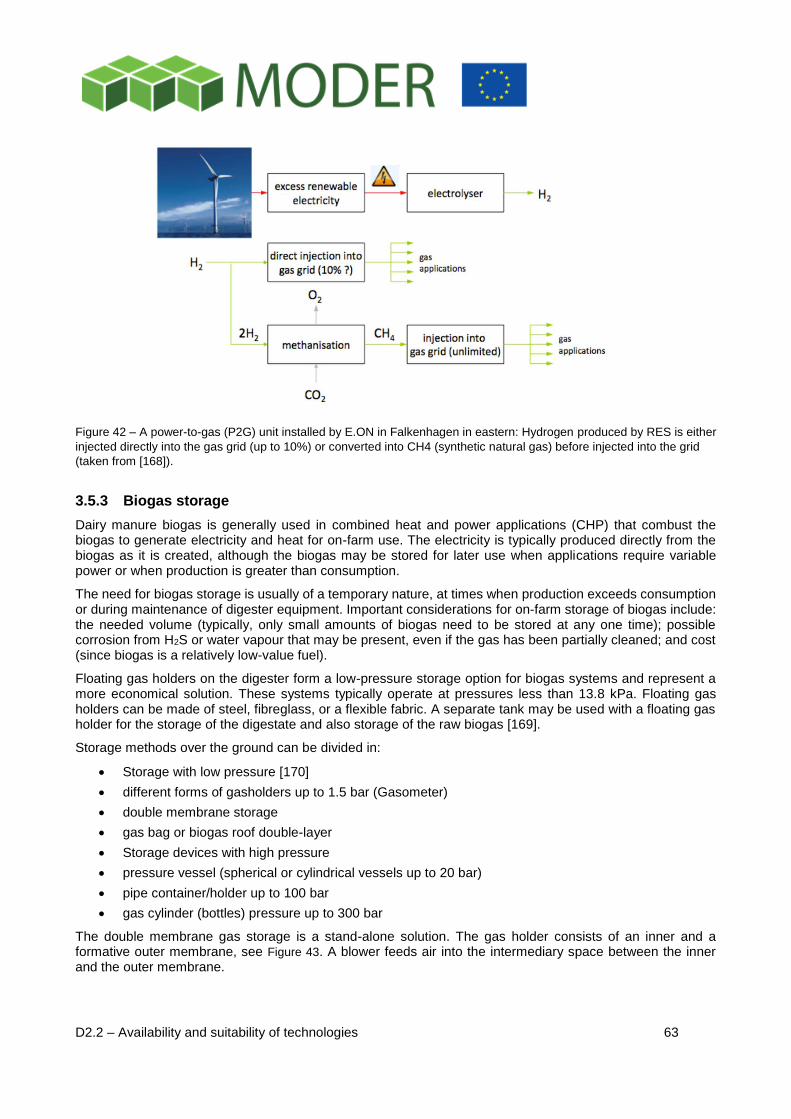
D2.2 – Availability and suitability of technologies 63
Figure 42 – A power-to-gas (P2G) unit installed by E.ON in Falkenhagen in eastern: Hydrogen produced by RES is either
injected directly into the gas grid (up to 10%) or converted into CH4 (synthetic natural gas) before injected into the grid
(taken from [168]).
3.5.3 Biogas storage
Dairy manure biogas is generally used in combined heat and power applications (CHP) that combust the biogas to generate electricity and heat for on-farm use. The electricity is typically produced directly from the biogas as it is created, although the biogas may be stored for later use when applications require variable power or when production is greater than consumption.
The need for biogas storage is usually of a temporary nature, at times when production exceeds consumption or during maintenance of digester equipment. Important considerations for on-farm storage of biogas include: the needed volume (typically, only small amounts of biogas need to be stored at any one time); possible corrosion from H2S or water vapour that may be present, even if the gas has been partially cleaned; and cost (since biogas is a relatively low-value fuel).
Floating gas holders on the digester form a low-pressure storage option for biogas systems and represent a more economical solution. These systems typically operate at pressures less than 13.8 kPa. Floating gas holders can be made of steel, fibreglass, or a flexible fabric. A separate tank may be used with a floating gas holder for the storage of the digestate and also storage of the raw biogas [169].
Storage methods over the ground can be divided in:
Storage with low pressure [170]
different forms of gasholders up to 1.5 bar (Gasometer)
double membrane storage
gas bag or biogas roof double-layer
Storage devices with high pressure
pressure vessel (spherical or cylindrical vessels up to 20 bar)
pipe container/holder up to 100 bar
gas cylinder (bottles) pressure up to 300 bar
The double membrane gas storage is a stand-alone solution. The gas holder consists of an inner and a formative outer membrane, see Figure 43. A blower feeds air into the intermediary space between the inner and the outer membrane.
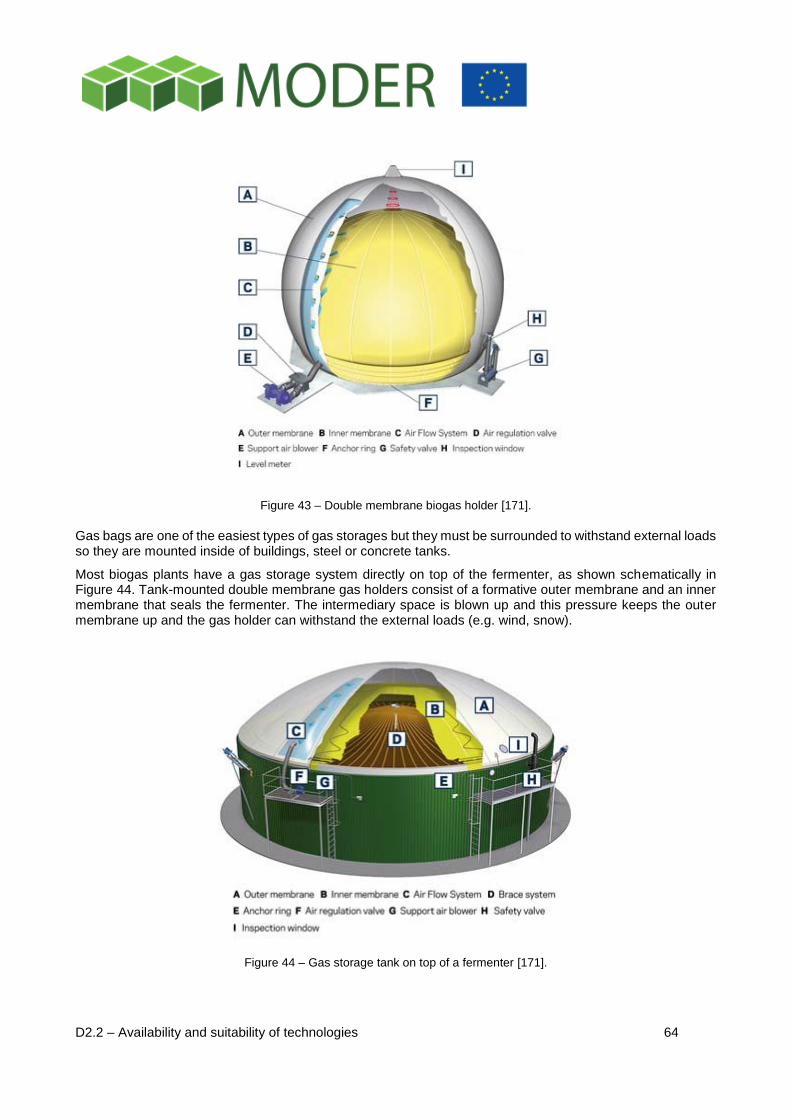
D2.2 – Availability and suitability of technologies 64
Figure 43 – Double membrane biogas holder [171].
Gas bags are one of the easiest types of gas storages but they must be surrounded to withstand external loads so they are mounted inside of buildings, steel or concrete tanks.
Most biogas plants have a gas storage system directly on top of the fermenter, as shown schematically in Figure 44. Tank-mounted double membrane gas holders consist of a formative outer membrane and an inner membrane that seals the fermenter. The intermediary space is blown up and this pressure keeps the outer membrane up and the gas holder can withstand the external loads (e.g. wind, snow).
Figure 44 – Gas storage tank on top of a fermenter [171].

D2.2 – Availability and suitability of technologies 65
Spherical pressure vessels are built with a diameter of approx. 45 m according to the thickness of the wall pressures up to 20 bar are possible [172]. For example the spherical pressure vessel in Wuppertal has a working gas capacity of 270,000 m³ [173].
Pipe holders are placed in approx. 2 m under the ground and have a diameter up to 1.6 m. In these devices an operation pressure of 50 to 100 bar is usual. In Vienna the company Wiener Erdgasspeicher GmbH is operating a natural gas pipe holder with a volume of 15.000 m³. The storage has a maximal operation pressure of 45 bar and a working gas capacity of 600,000 m³ [174].
Usually the storage of natural gas has the following aims: to increase the safety of the gas supply, balancing of the seasonal variations of supply and demand and covering of the peak demand. The big underground storage devices work as seasonal storage to balance the difference between delivery and usage in summertime or wintertime. The storages under the ground are realized in salt formations, aquifer reservoirs and depleted reservoirs [170]. In Austria the underground storage devices are operated by the companies RAG and OMV. The working gas capacity in Austria is 8.2 billion m³. The biggest reservoirs are Puchkirchen/Haag with a working gas capacity of 1,080 million m³ (12.1 TWh thermal) and Aigelsbrunn with a working gas capacity of 100 million m³ (1.1 TWh thermal) [175].
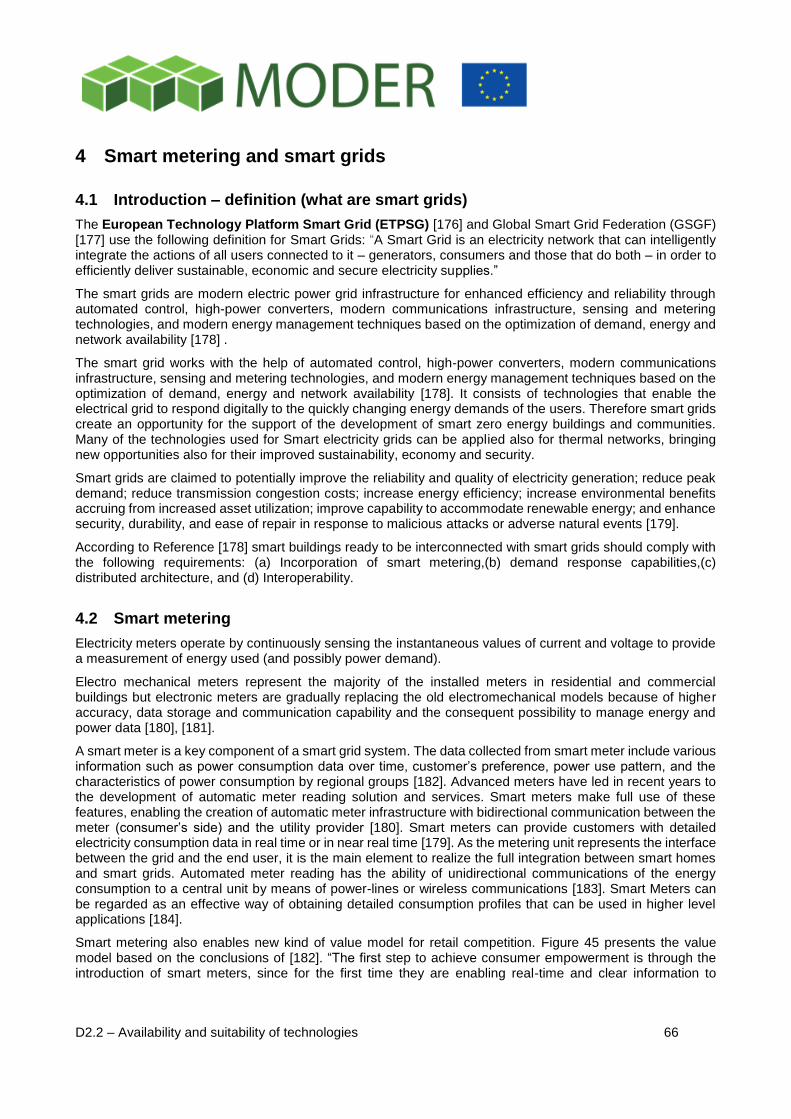
D2.2 – Availability and suitability of technologies 66
4 Smart metering and smart grids
4.1 Introduction – definition (what are smart grids)
The European Technology Platform Smart Grid (ETPSG) [176] and Global Smart Grid Federation (GSGF) [177] use the following definition for Smart Grids: “A Smart Grid is an electricity network that can intelligently integrate the actions of all users connected to it – generators, consumers and those that do both – in order to efficiently deliver sustainable, economic and secure electricity supplies.”
The smart grids are modern electric power grid infrastructure for enhanced efficiency and reliability through automated control, high-power converters, modern communications infrastructure, sensing and metering technologies, and modern energy management techniques based on the optimization of demand, energy and network availability [178] .
The smart grid works with the help of automated control, high-power converters, modern communications infrastructure, sensing and metering technologies, and modern energy management techniques based on the optimization of demand, energy and network availability [178]. It consists of technologies that enable the electrical grid to respond digitally to the quickly changing energy demands of the users. Therefore smart grids create an opportunity for the support of the development of smart zero energy buildings and communities. Many of the technologies used for Smart electricity grids can be applied also for thermal networks, bringing new opportunities also for their improved sustainability, economy and security.
Smart grids are claimed to potentially improve the reliability and quality of electricity generation; reduce peak demand; reduce transmission congestion costs; increase energy efficiency; increase environmental benefits accruing from increased asset utilization; improve capability to accommodate renewable energy; and enhance security, durability, and ease of repair in response to malicious attacks or adverse natural events [179].
According to Reference [178] smart buildings ready to be interconnected with smart grids should comply with the following requirements: (a) Incorporation of smart metering,(b) demand response capabilities,(c) distributed architecture, and (d) Interoperability.
4.2 Smart metering
Electricity meters operate by continuously sensing the instantaneous values of current and voltage to provide a measurement of energy used (and possibly power demand).
Electro mechanical meters represent the majority of the installed meters in residential and commercial buildings but electronic meters are gradually replacing the old electromechanical models because of higher accuracy, data storage and communication capability and the consequent possibility to manage energy and power data [180], [181].
A smart meter is a key component of a smart grid system. The data collected from smart meter include various information such as power consumption data over time, customer’s preference, power use pattern, and the characteristics of power consumption by regional groups [182]. Advanced meters have led in recent years to the development of automatic meter reading solution and services. Smart meters make full use of these features, enabling the creation of automatic meter infrastructure with bidirectional communication between the meter (consumer’s side) and the utility provider [180]. Smart meters can provide customers with detailed electricity consumption data in real time or in near real time [179]. As the metering unit represents the interface between the grid and the end user, it is the main element to realize the full integration between smart homes and smart grids. Automated meter reading has the ability of unidirectional communications of the energy consumption to a central unit by means of power-lines or wireless communications [183]. Smart Meters can be regarded as an effective way of obtaining detailed consumption profiles that can be used in higher level applications [184].
Smart metering also enables new kind of value model for retail competition. Figure 45 presents the value model based on the conclusions of [182]. “The first step to achieve consumer empowerment is through the introduction of smart meters, since for the first time they are enabling real-time and clear information to
D2.2 – Availability and suitability of technologies 67
consumers. This is vital for achieving any change in their consumption behaviour. Smart homes and networks enable flexibility and demand response. Once these are in place, services for consumers can be built [185].
Figure 45 – Retail competition value model based on the conclusions of Reference [182].
4.3 Response capabilities and interoperability
Utilising active demand will become increasingly important in conjunction with introduction of Smart Metering and Smart Grids. Smart Metering will allow a monitoring of the loads and distributed generation units with a higher time resolution while Smart Grids will require distributed intelligence and reactivity from the local loads and generating units [186].
Advanced smart metering systems are required for the operation of the future smart grid. The information provided by these systems is used by the system operator to enhance the energy supply, and several techniques, as load scheduling, demand side management, non-intrusive load monitoring, can be applied for this purpose [184]. Advanced metering networks are of many different designs and could also be used to implement residential demand response including dynamic pricing. Advanced metering infrastructure consists of the communications hardware and software, and the associated system and data management software, that together create a two-way network between advanced meters and utility business systems, enabling collection and distribution of information to customers and other parties, such as the competitive retail supplier or the utility itself [187].
Interoperability can be defined as the ability of products and services to work together and to exchange information during all lifecycle stages without the loss of semantics. With regard to this, standardised representation of information is important. In the case of metering and sensing devices, it refers to the standardized exchange of data so that the components of building energy monitoring and metering system can communicate with each other irrespective of different manufacturers and physical medium [180]. Frameworks including standards and protocols to achieve interoperability between metering, sensing devices and the control system such the framework for Smart grids [187] need to be developed. Such kind of
D2.2 – Availability and suitability of technologies 68
frameworks needs to be developed on building level as well. Also, there is a need to introduce, develop and deploy vendor-independent metering and sensing solutions to increase flexibility [180].
“Interoperability” in general means the ability of products and services to operate together in a multi-vendor and multi-operator environment [188]. The vast amount of different components, technologies and operating systems constituting a smart grid, moving rapidly towards more global “Internet of Things”, creates challenges for interoperability. Currently the interoperability issue may limit the choice of technologies that can be used in connection of a certain operating system, thus creating e.g. serious market barriers. There is an intensive development work going on in this field worldwide, in form of standardisation and building of platforms and components that could operate as intermediators between two systems or components using different standards. The ultimate goal of this development work is however, that in the end, the components and subsystems would speak the same language without need for translators, to achieve optimal speed for information exchange. The relevant points for interoperability also include points like choosing the relevant routing and transportation channels (wires, cables, Internet, WiFi) for the information. To limit the amount of information transported between different systems, it also needs to be decided what information is fundamental for which system, and which systems need to communicate between each other.
Smart metering together with sensors based approaches can also enable energy load forecasting [189]. Jain et al. [189] have demonstrated the applicability of sensor based energy forecasting models to multi-family residential buildings. They demonstrated how data collected from smart meters, building management systems and weather stations can be used to explain the relationships between the energy consumption and various variables such as temperature, solar radiation, time of day and occupancy with the help of specific algorithms.
4.4 Distributed architecture
In a system with distributed architecture, the information processing and storage is distributed over several independent computers connected through networks instead of one, centralized system. In a smart grid this is an essential feature, as it increases the robustness and computing power of the grid management system. The distributed system is less sensitive to faults, and it can in most cases continue operation even when fault occurs in some part of the system, thanks to the islanding opportunities provided by the distributed intelligence [190]. Distributed architecture also allows better scalability for future grids and supports flexible upgrading of the system, as the blocks in the system can be added and/or replaced [191]. In addition, distributed systems support resource sharing, openness, concurrency and transparency [190].
In Reference [179] a framework for a smart grid big data analytics system is proposed. The layered architecture of the proposed smart grid big data analytics framework for improving energy savings in residential buildings includes a smart grid and data collection layer or a data layer, an analytics bench, and a web-based portal.
4.5 Smart grid and smart metering as enablers of nearly/net zero energy districts
Development of smart grids aim at benefitting from distributed generation with respect to reducing the grids primary energy and carbon emission factors, as well as operation costs. Mere satisfaction of an annual balance does not guarantee that the building is designed in a way that minimizes its (energy use related) environmental impact. In particular, Net ZEBs should be designed to work in synergy with the grids and not to put additional stress on their functioning [192].
Nearly zero energy buildings require an increased utilization of local renewable energy sources (for example with the help of photovoltaic systems) in addition to excellent energy efficiency (e.g. with the help of improved insulation and tightness of building envelop). Zero energy buildings – however – may increase the use of electricity because of the need for technologies (such as heat pumps for space heating and domestic hot water). For instance, heat pumps may double the electricity use depending on the existing heating technology and the building energy performance. In addition, the intermittent and seasonal production profile of renewable energy may have an impact on the distribution grid since the local consumption and production do not match [25]. Supply of local production surplus into the grid results in bidirectional power flows. The increased electricity use and renewable electricity production cause the following challenges:
D2.2 – Availability and suitability of technologies 69
Higher peak loads and voltage deviations require a proper synchronization of consumption and production electricity, through demand side management, electrical storage and minimization of the energy consumption.
The description of a zero energy building and refurbishment would require the consideration of the relationship between building loads and power generation and the resulting interaction with the power grid.
Load matching explains how local energy generation compares with the building loads; grid interaction describes the energy exchange between the building and the power grid. These are independent but related issues [26]. If these aspects are not taken into account net ZEBs may have a detrimental effect of the performance of the grid at high penetration levels. This is because they may contribute to increasing peak loads, thus requiring additional generation and transmission capacity from utilities. They may also increase voltage variation in local distribution grids. Thus the development of net zero energy buildings call for the development of smart grids.
Furthermore, buildings are expected to play an important role in the development and operation of future smart energy systems through real-time energy trade, energy demand flexibility, self-generation of electricity, and energy storage capabilities. Shifting the role of buildings from passive consumers to active players in the energy networks, however, may require closer cooperation between the energy and buildings sectors than there is today [193].
In Reference [193] the following features for active buildings are listed:
Smart systems that assist in energy-related decisions
Automation of energy activities
Visualization of energy user
User response to electricity prices
User response to GHG emissions
Self-generation of electricity
Local energy storage
Electric vehicles for energy storage
When smart thermal networks supplement smart electricity grids, this will contribute to the development of fully renewable energy systems [194].
Smart grid and smart meters are a crucial prerequisite for efficient implementation of load balancing and peak management. When the aim is to achieve nearly or net zero energy districts, with increasing share of distributed renewable production, it is essential that energy demand and production can be matched not only by amount, but also on time. In addition to enabling technologies this requires profitable business models to support the implementation of nearly /net zero energy neighbourhoods. One of the key requirements for profitable business models in this context is the existence of smart grids that can support the monitoring, control and advanced protection systems that enable the supervision and operation of bidirectional power flows in a distribution network [195].
In addition to automated load balancing and peak shaving, another relevant use for smart metering and smart grid technologies in connection of zero energy buildings and districts is encouraging the occupants for energy savings and including them in the demand side management (DSM) and peak shaving, thus bringing the buildings and districts even closer to zero energy balance. It requires not only smart metering, but also that the information is provided to the consumers in a useful format that contextualizes the information and motivates the occupants into taking action.
A review study [196] shows that the more accurate and closer to real time information the occupants get about their energy use, the more savings can be achieved (Figure 46). It is important that this information is persistent in order to achieve persistent energy savings. Yet another way of supporting the occupants in energy saving is giving them energy saving tips, most effectively based on the real-time information of their current energy use (e.g. [197] and [198]). In a district level, this effect can be further improved by comparing the individual household’s energy use to the average on the area – based on information gathered by the smart metering
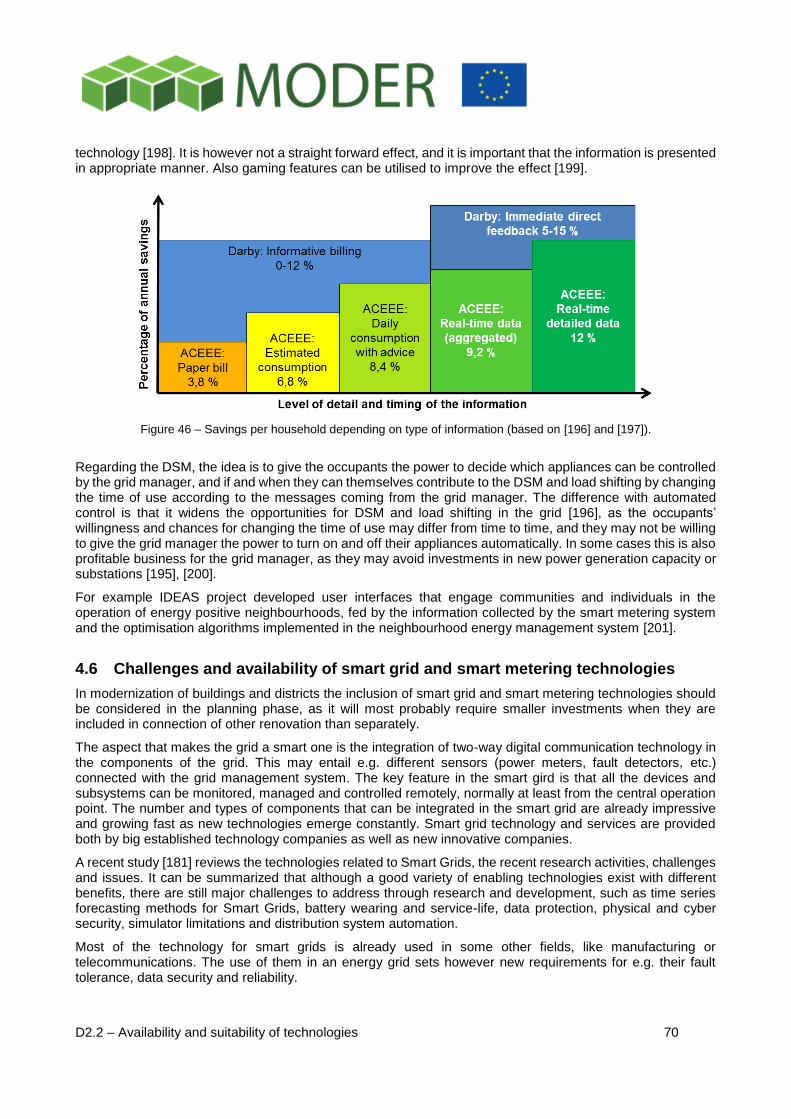
D2.2 – Availability and suitability of technologies 70
technology [198]. It is however not a straight forward effect, and it is important that the information is presented in appropriate manner. Also gaming features can be utilised to improve the effect [199].
Figure 46 – Savings per household depending on type of information (based on [196] and [197]).
Regarding the DSM, the idea is to give the occupants the power to decide which appliances can be controlled by the grid manager, and if and when they can themselves contribute to the DSM and load shifting by changing the time of use according to the messages coming from the grid manager. The difference with automated control is that it widens the opportunities for DSM and load shifting in the grid [196], as the occupants’ willingness and chances for changing the time of use may differ from time to time, and they may not be willing to give the grid manager the power to turn on and off their appliances automatically. In some cases this is also profitable business for the grid manager, as they may avoid investments in new power generation capacity or substations [195], [200].
For example IDEAS project developed user interfaces that engage communities and individuals in the operation of energy positive neighbourhoods, fed by the information collected by the smart metering system and the optimisation algorithms implemented in the neighbourhood energy management system [201].
4.6 Challenges and availability of smart grid and smart metering technologies
In modernization of buildings and districts the inclusion of smart grid and smart metering technologies should be considered in the planning phase, as it will most probably require smaller investments when they are included in connection of other renovation than separately.
The aspect that makes the grid a smart one is the integration of two-way digital communication technology in the components of the grid. This may entail e.g. different sensors (power meters, fault detectors, etc.) connected with the grid management system. The key feature in the smart gird is that all the devices and subsystems can be monitored, managed and controlled remotely, normally at least from the central operation point. The number and types of components that can be integrated in the smart grid are already impressive and growing fast as new technologies emerge constantly. Smart grid technology and services are provided both by big established technology companies as well as new innovative companies.
A recent study [181] reviews the technologies related to Smart Grids, the recent research activities, challenges and issues. It can be summarized that although a good variety of enabling technologies exist with different benefits, there are still major challenges to address through research and development, such as time series forecasting methods for Smart Grids, battery wearing and service-life, data protection, physical and cyber security, simulator limitations and distribution system automation.
Most of the technology for smart grids is already used in some other fields, like manufacturing or telecommunications. The use of them in an energy grid sets however new requirements for e.g. their fault tolerance, data security and reliability.
D2.2 – Availability and suitability of technologies 71
According to Reference [202] there are five fundamental technologies that will drive the Smart Grid:
Integrated communications, connecting components to open architecture for real-time information exchange and control, allowing every part of the grid to both send and receive information and signals.
Sensing and measurement technologies, which support e.g. remote monitoring, time-of-use pricing and demand-side management. Especially the wireless sensor technology is highly relevant for energy monitoring in existing buildings, as it requires less construction works than traditional sensors (e.g. wiring and routes for wires through walls can be avoided).
Advanced components, which make use of the latest developments in superconductivity, storage, power electronics and diagnostics. For instance:
o Superconducting power cables, which enable to reduce line losses and carrying 3-5 times more power than traditional copper-based cable.
o Energy storage technologies are getting new potential in connection with Smart Girds. E.g. the charge-discharge cycles can be optimized based on the measurements and forecasts coming from the Smart Grid, increasing the service-life of the batteries. Also the opportunities to use the thermal mass of the building as storage component will increase with the forecast and simulation capabilities.
o Plug-in Electric Vehicles (PEVs) which can take advantage of lower cost during off-peak periods and can provide grid support during the peak periods.
Advanced control methods, enabling rapid diagnosis and precise solutions appropriate to any event. The advanced control methods can be grouped e.g. as distributed intelligent agents (control systems), analytical tools (software algorithms and high-speed computers) or operational applications (SCADA, substation automation, demand response, etc.).
Improved interfaces and decision support, both for the grid managers and operators as well as for the occupants will improve the quality and efficiency of the human decision-making related to the Smart Grids.
In order to achieve a more flexible energy demand and encourage savings, the Nordic countries have followed a progressive smart grid roll-out policy and become fore-runners in the EU to reach universal coverage of smart electricity. In Finland and in Sweden customers have been entitled to hourly metering of electricity free of charge since couple of years (in Sweden since 2012 [194]).
Gungor et al. [183] characterize three types of smart metering technologies for homes:
In-home technologies include local monitoring and control capabilities. They address the intelligent management of devices available in the smart home, extracting and utilizing both internal and external information; if present, they provide the optimum usage of the locally produced energy, supplying local loads and injecting the surplus on the grid. Alternatively, as a result of a demand-side management strategy, it reduces local consumption for satisfying external power peak demand, thus improving customers’ profits, due to favorable tariffs.
Home-to-grid technologies include measurement capabilities and remote control and monitoring. These are mostly used to interconnect houses and to connect them with grid operators and utilities, thus enabling reciprocal real-time information exchanges. Current research addresses these issues, with SW architectures utilizing agent technology, for service delivery by clusters of smart homes to wholesale market parties and grid operators.
Home/grid-to-enterprise technologies are mainly used to link the information generated within the SH with enterprise services; they support the management of the infrastructure via decision-support functionality that can be used to apply control strategies. A full integration of different devices with other in-home devices and with enterprise systems requires an information bus which, at a high abstraction level, can be implemented using Internet-based technologies and languages.
According to a study conducted in the IDEAS project [195], many EU countries were moving toward the development of ‘active’ or ‘smart’ electricity distribution networks already in 2015. Countries with national implementation plans included Austria, Cyprus, Denmark, Finland, France, Greece, Luxembourg, Norway and Belgium. Another relevant feature for business models related to neighborhood energy management which actively involves the occupants is the prevalence if dynamic tariffs for the purchase and sale of electricity. It
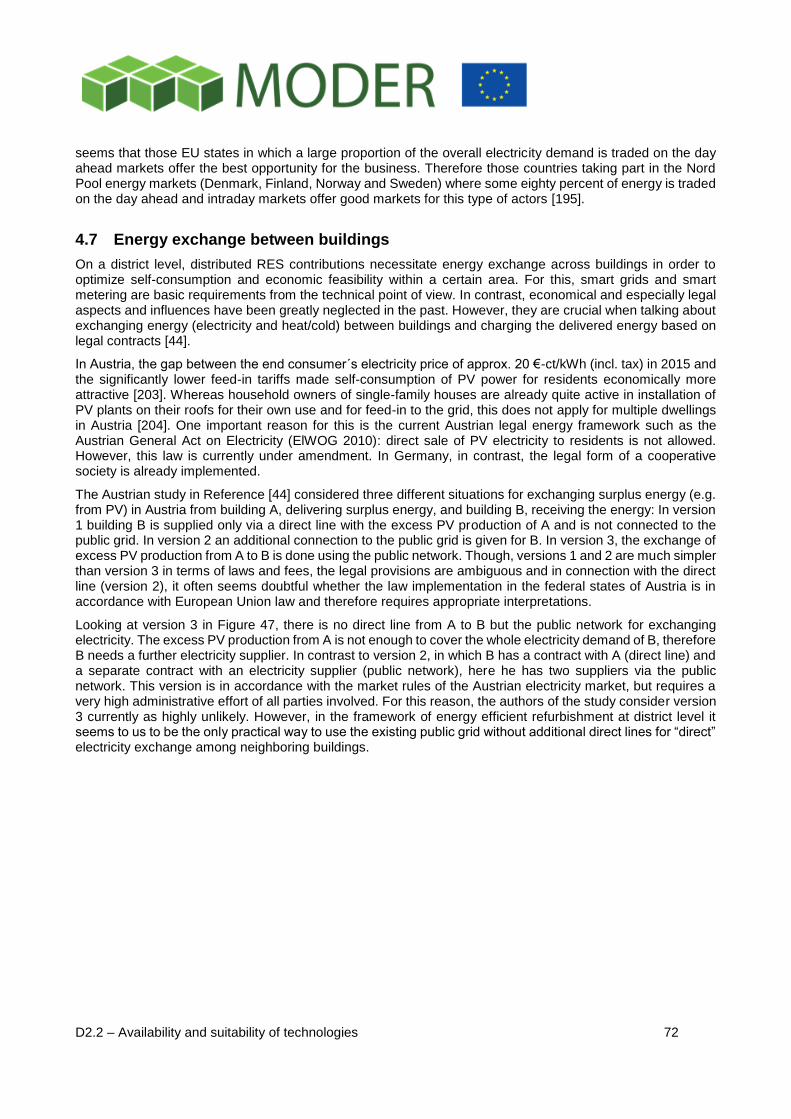
D2.2 – Availability and suitability of technologies 72
seems that those EU states in which a large proportion of the overall electricity demand is traded on the day ahead markets offer the best opportunity for the business. Therefore those countries taking part in the Nord Pool energy markets (Denmark, Finland, Norway and Sweden) where some eighty percent of energy is traded on the day ahead and intraday markets offer good markets for this type of actors [195].
4.7 Energy exchange between buildings
On a district level, distributed RES contributions necessitate energy exchange across buildings in order to optimize self-consumption and economic feasibility within a certain area. For this, smart grids and smart metering are basic requirements from the technical point of view. In contrast, economical and especially legal aspects and influences have been greatly neglected in the past. However, they are crucial when talking about exchanging energy (electricity and heat/cold) between buildings and charging the delivered energy based on legal contracts [44].
In Austria, the gap between the end consumer´s electricity price of approx. 20 €-ct/kWh (incl. tax) in 2015 and the significantly lower feed-in tariffs made self-consumption of PV power for residents economically more attractive [203]. Whereas household owners of single-family houses are already quite active in installation of PV plants on their roofs for their own use and for feed-in to the grid, this does not apply for multiple dwellings in Austria [204]. One important reason for this is the current Austrian legal energy framework such as the Austrian General Act on Electricity (ElWOG 2010): direct sale of PV electricity to residents is not allowed. However, this law is currently under amendment. In Germany, in contrast, the legal form of a cooperative society is already implemented.
The Austrian study in Reference [44] considered three different situations for exchanging surplus energy (e.g. from PV) in Austria from building A, delivering surplus energy, and building B, receiving the energy: In version 1 building B is supplied only via a direct line with the excess PV production of A and is not connected to the public grid. In version 2 an additional connection to the public grid is given for B. In version 3, the exchange of excess PV production from A to B is done using the public network. Though, versions 1 and 2 are much simpler than version 3 in terms of laws and fees, the legal provisions are ambiguous and in connection with the direct line (version 2), it often seems doubtful whether the law implementation in the federal states of Austria is in accordance with European Union law and therefore requires appropriate interpretations.
Looking at version 3 in Figure 47, there is no direct line from A to B but the public network for exchanging electricity. The excess PV production from A is not enough to cover the whole electricity demand of B, therefore B needs a further electricity supplier. In contrast to version 2, in which B has a contract with A (direct line) and a separate contract with an electricity supplier (public network), here he has two suppliers via the public network. This version is in accordance with the market rules of the Austrian electricity market, but requires a very high administrative effort of all parties involved. For this reason, the authors of the study consider version 3 currently as highly unlikely. However, in the framework of energy efficient refurbishment at district level it seems to us to be the only practical way to use the existing public grid without additional direct lines for “direct” electricity exchange among neighboring buildings.
D2.2 – Availability and suitability of technologies 73
Figure 47 – Building A delivers excess PV power to B via the public grid (taken from [44] and modified).
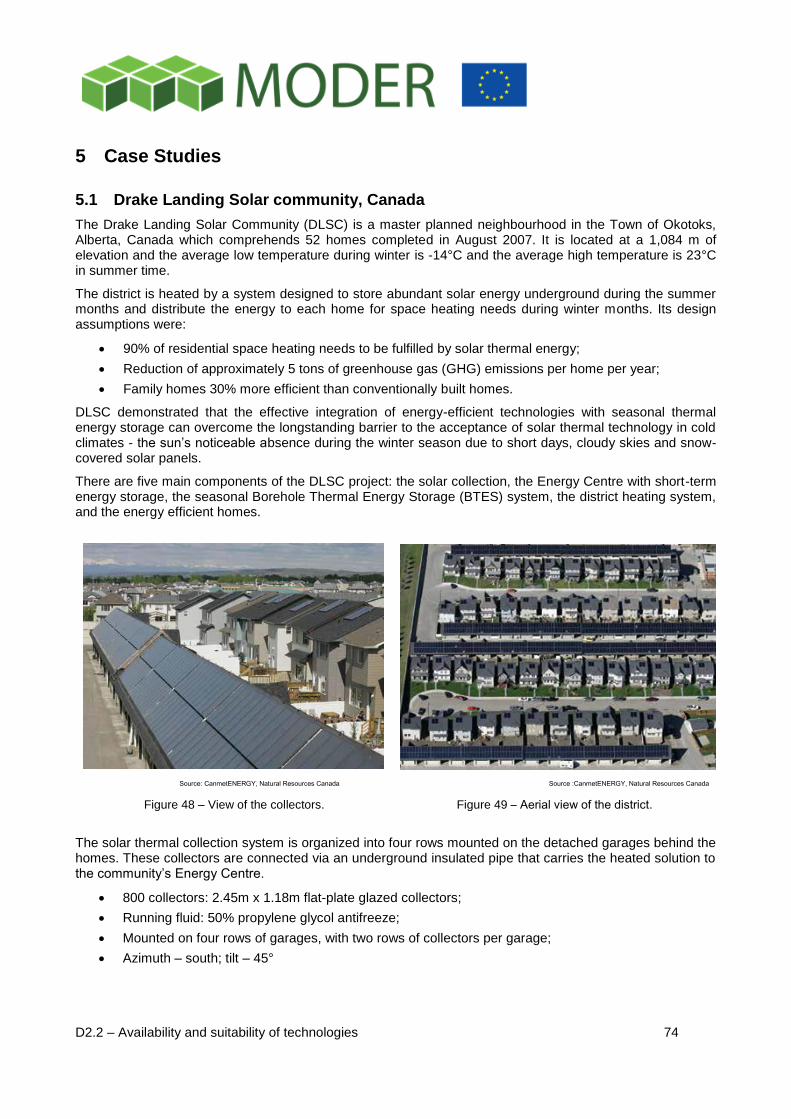
D2.2 – Availability and suitability of technologies 74
5 Case Studies
5.1 Drake Landing Solar community, Canada
The Drake Landing Solar Community (DLSC) is a master planned neighbourhood in the Town of Okotoks, Alberta, Canada which comprehends 52 homes completed in August 2007. It is located at a 1,084 m of elevation and the average low temperature during winter is -14°C and the average high temperature is 23°C in summer time.
The district is heated by a system designed to store abundant solar energy underground during the summer months and distribute the energy to each home for space heating needs during winter months. Its design assumptions were:
90% of residential space heating needs to be fulfilled by solar thermal energy;
Reduction of approximately 5 tons of greenhouse gas (GHG) emissions per home per year;
Family homes 30% more efficient than conventionally built homes.
DLSC demonstrated that the effective integration of energy-efficient technologies with seasonal thermal energy storage can overcome the longstanding barrier to the acceptance of solar thermal technology in cold climates - the sun’s noticeable absence during the winter season due to short days, cloudy skies and snow-covered solar panels.
There are five main components of the DLSC project: the solar collection, the Energy Centre with short-term energy storage, the seasonal Borehole Thermal Energy Storage (BTES) system, the district heating system, and the energy efficient homes.
Source: CanmetENERGY, Natural Resources Canada
Figure 48 – View of the collectors.
Source :CanmetENERGY, Natural Resources Canada
Figure 49 – Aerial view of the district.
The solar thermal collection system is organized into four rows mounted on the detached garages behind the homes. These collectors are connected via an underground insulated pipe that carries the heated solution to the community’s Energy Centre.
800 collectors: 2.45m x 1.18m flat-plate glazed collectors;
Running fluid: 50% propylene glycol antifreeze;
Mounted on four rows of garages, with two rows of collectors per garage;
Azimuth – south; tilt – 45°
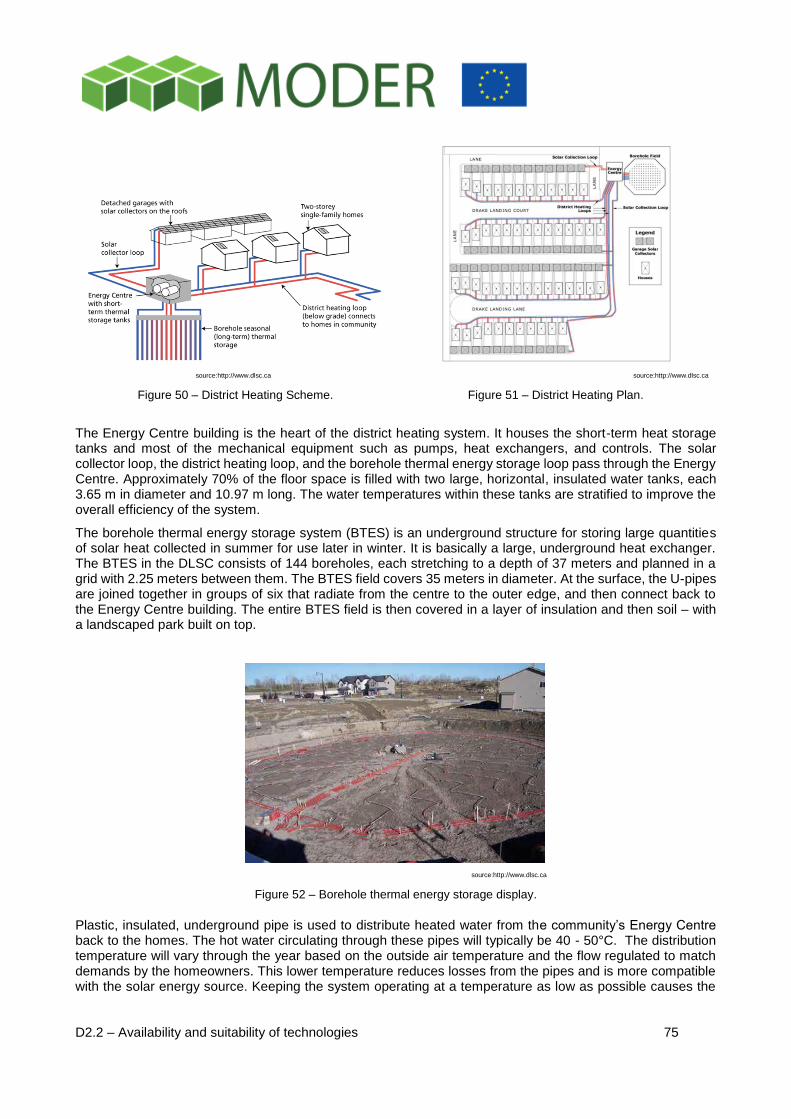
D2.2 – Availability and suitability of technologies 75
source:http://www.dlsc.ca
Figure 50 – District Heating Scheme.
source:http://www.dlsc.ca
Figure 51 – District Heating Plan.
The Energy Centre building is the heart of the district heating system. It houses the short-term heat storage tanks and most of the mechanical equipment such as pumps, heat exchangers, and controls. The solar collector loop, the district heating loop, and the borehole thermal energy storage loop pass through the Energy Centre. Approximately 70% of the floor space is filled with two large, horizontal, insulated water tanks, each 3.65 m in diameter and 10.97 m long. The water temperatures within these tanks are stratified to improve the overall efficiency of the system.
The borehole thermal energy storage system (BTES) is an underground structure for storing large quantities of solar heat collected in summer for use later in winter. It is basically a large, underground heat exchanger. The BTES in the DLSC consists of 144 boreholes, each stretching to a depth of 37 meters and planned in a grid with 2.25 meters between them. The BTES field covers 35 meters in diameter. At the surface, the U-pipes are joined together in groups of six that radiate from the centre to the outer edge, and then connect back to the Energy Centre building. The entire BTES field is then covered in a layer of insulation and then soil – with a landscaped park built on top.
source:http://www.dlsc.ca
Figure 52 – Borehole thermal energy storage display.
Plastic, insulated, underground pipe is used to distribute heated water from the community’s Energy Centre back to the homes. The hot water circulating through these pipes will typically be 40 - 50°C. The distribution temperature will vary through the year based on the outside air temperature and the flow regulated to match demands by the homeowners. This lower temperature reduces losses from the pipes and is more compatible with the solar energy source. Keeping the system operating at a temperature as low as possible causes the
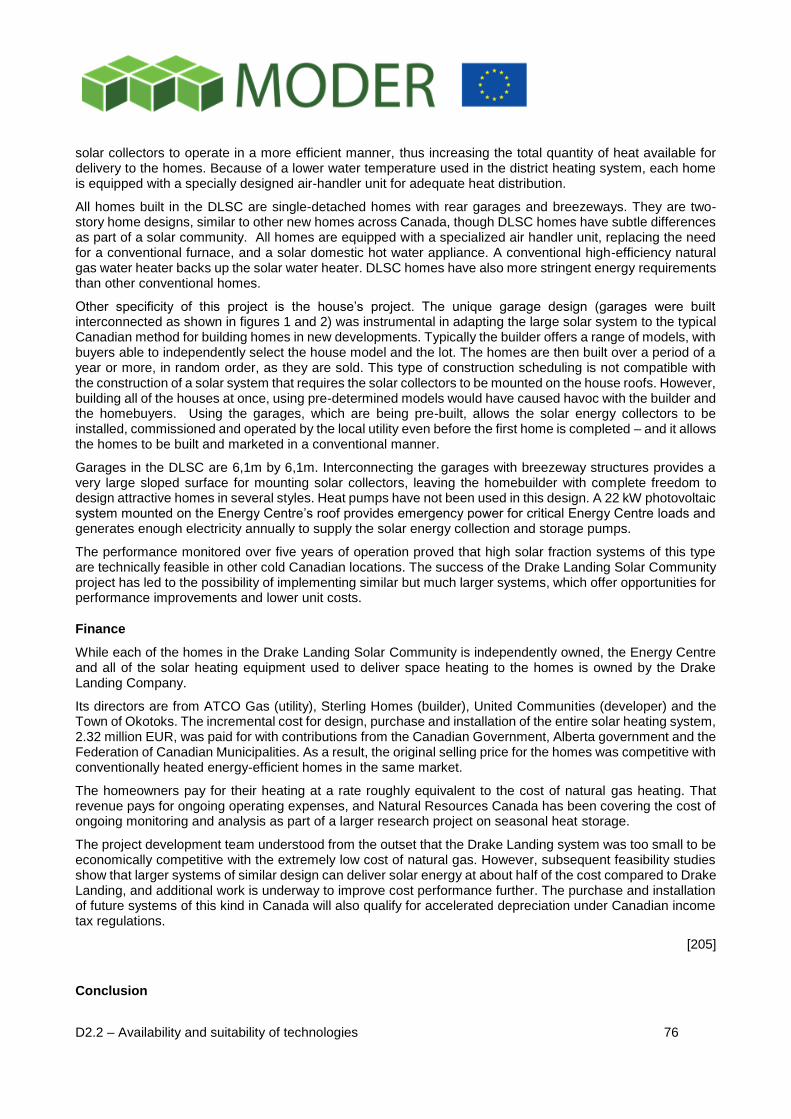
D2.2 – Availability and suitability of technologies 76
solar collectors to operate in a more efficient manner, thus increasing the total quantity of heat available for delivery to the homes. Because of a lower water temperature used in the district heating system, each home is equipped with a specially designed air-handler unit for adequate heat distribution.
All homes built in the DLSC are single-detached homes with rear garages and breezeways. They are two-story home designs, similar to other new homes across Canada, though DLSC homes have subtle differences as part of a solar community. All homes are equipped with a specialized air handler unit, replacing the need for a conventional furnace, and a solar domestic hot water appliance. A conventional high-efficiency natural gas water heater backs up the solar water heater. DLSC homes have also more stringent energy requirements than other conventional homes.
Other specificity of this project is the house’s project. The unique garage design (garages were built interconnected as shown in figures 1 and 2) was instrumental in adapting the large solar system to the typical Canadian method for building homes in new developments. Typically the builder offers a range of models, with buyers able to independently select the house model and the lot. The homes are then built over a period of a year or more, in random order, as they are sold. This type of construction scheduling is not compatible with the construction of a solar system that requires the solar collectors to be mounted on the house roofs. However, building all of the houses at once, using pre-determined models would have caused havoc with the builder and the homebuyers. Using the garages, which are being pre-built, allows the solar energy collectors to be installed, commissioned and operated by the local utility even before the first home is completed – and it allows the homes to be built and marketed in a conventional manner.
Garages in the DLSC are 6,1m by 6,1m. Interconnecting the garages with breezeway structures provides a very large sloped surface for mounting solar collectors, leaving the homebuilder with complete freedom to design attractive homes in several styles. Heat pumps have not been used in this design. A 22 kW photovoltaic system mounted on the Energy Centre’s roof provides emergency power for critical Energy Centre loads and generates enough electricity annually to supply the solar energy collection and storage pumps.
The performance monitored over five years of operation proved that high solar fraction systems of this type are technically feasible in other cold Canadian locations. The success of the Drake Landing Solar Community project has led to the possibility of implementing similar but much larger systems, which offer opportunities for performance improvements and lower unit costs.
Finance
While each of the homes in the Drake Landing Solar Community is independently owned, the Energy Centre and all of the solar heating equipment used to deliver space heating to the homes is owned by the Drake Landing Company.
Its directors are from ATCO Gas (utility), Sterling Homes (builder), United Communities (developer) and the Town of Okotoks. The incremental cost for design, purchase and installation of the entire solar heating system, 2.32 million EUR, was paid for with contributions from the Canadian Government, Alberta government and the Federation of Canadian Municipalities. As a result, the original selling price for the homes was competitive with conventionally heated energy-efficient homes in the same market.
The homeowners pay for their heating at a rate roughly equivalent to the cost of natural gas heating. That revenue pays for ongoing operating expenses, and Natural Resources Canada has been covering the cost of ongoing monitoring and analysis as part of a larger research project on seasonal heat storage.
The project development team understood from the outset that the Drake Landing system was too small to be economically competitive with the extremely low cost of natural gas. However, subsequent feasibility studies show that larger systems of similar design can deliver solar energy at about half of the cost compared to Drake Landing, and additional work is underway to improve cost performance further. The purchase and installation of future systems of this kind in Canada will also qualify for accelerated depreciation under Canadian income tax regulations.
[205]
Conclusion
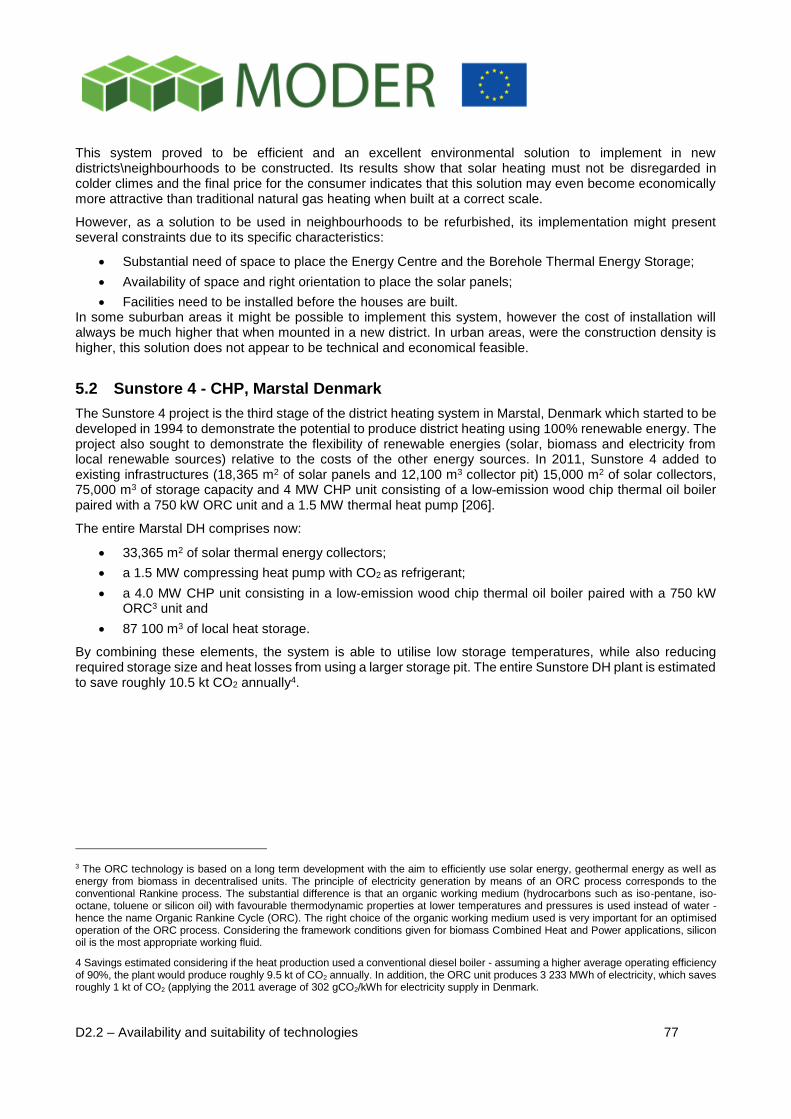
D2.2 – Availability and suitability of technologies 77
This system proved to be efficient and an excellent environmental solution to implement in new districts\neighbourhoods to be constructed. Its results show that solar heating must not be disregarded in colder climes and the final price for the consumer indicates that this solution may even become economically more attractive than traditional natural gas heating when built at a correct scale.
However, as a solution to be used in neighbourhoods to be refurbished, its implementation might present several constraints due to its specific characteristics:
Substantial need of space to place the Energy Centre and the Borehole Thermal Energy Storage;
Availability of space and right orientation to place the solar panels;
Facilities need to be installed before the houses are built. In some suburban areas it might be possible to implement this system, however the cost of installation will always be much higher that when mounted in a new district. In urban areas, were the construction density is higher, this solution does not appear to be technical and economical feasible.
5.2 Sunstore 4 - CHP, Marstal Denmark
The Sunstore 4 project is the third stage of the district heating system in Marstal, Denmark which started to be developed in 1994 to demonstrate the potential to produce district heating using 100% renewable energy. The project also sought to demonstrate the flexibility of renewable energies (solar, biomass and electricity from local renewable sources) relative to the costs of the other energy sources. In 2011, Sunstore 4 added to existing infrastructures (18,365 m2 of solar panels and 12,100 m3 collector pit) 15,000 m2 of solar collectors, 75,000 m3 of storage capacity and 4 MW CHP unit consisting of a low-emission wood chip thermal oil boiler paired with a 750 kW ORC unit and a 1.5 MW thermal heat pump [206].
The entire Marstal DH comprises now:
33,365 m2 of solar thermal energy collectors;
a 1.5 MW compressing heat pump with CO2 as refrigerant;
a 4.0 MW CHP unit consisting in a low‐emission wood chip thermal oil boiler paired with a 750 kW ORC3 unit and
87 100 m3 of local heat storage.
By combining these elements, the system is able to utilise low storage temperatures, while also reducing required storage size and heat losses from using a larger storage pit. The entire Sunstore DH plant is estimated to save roughly 10.5 kt CO2 annually4.
3 The ORC technology is based on a long term development with the aim to efficiently use solar energy, geothermal energy as well as energy from biomass in decentralised units. The principle of electricity generation by means of an ORC process corresponds to the conventional Rankine process. The substantial difference is that an organic working medium (hydrocarbons such as iso-pentane, iso-octane, toluene or silicon oil) with favourable thermodynamic properties at lower temperatures and pressures is used instead of water - hence the name Organic Rankine Cycle (ORC). The right choice of the organic working medium used is very important for an optimised operation of the ORC process. Considering the framework conditions given for biomass Combined Heat and Power applications, silicon oil is the most appropriate working fluid.
4 Savings estimated considering if the heat production used a conventional diesel boiler - assuming a higher average operating efficiency of 90%, the plant would produce roughly 9.5 kt of CO2 annually. In addition, the ORC unit produces 3 233 MWh of electricity, which saves roughly 1 kt of CO2 (applying the 2011 average of 302 gCO2/kWh for electricity supply in Denmark.
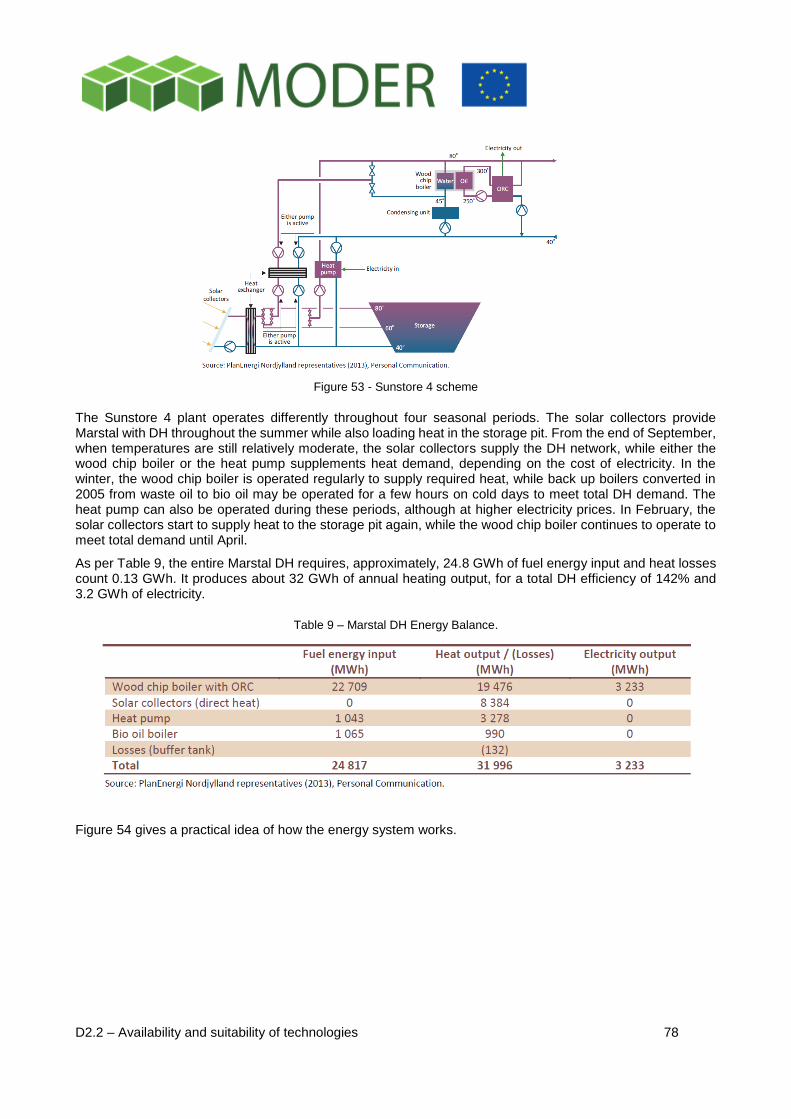
D2.2 – Availability and suitability of technologies 78
Figure 53 - Sunstore 4 scheme
The Sunstore 4 plant operates differently throughout four seasonal periods. The solar collectors provide Marstal with DH throughout the summer while also loading heat in the storage pit. From the end of September, when temperatures are still relatively moderate, the solar collectors supply the DH network, while either the wood chip boiler or the heat pump supplements heat demand, depending on the cost of electricity. In the winter, the wood chip boiler is operated regularly to supply required heat, while back up boilers converted in 2005 from waste oil to bio oil may be operated for a few hours on cold days to meet total DH demand. The heat pump can also be operated during these periods, although at higher electricity prices. In February, the solar collectors start to supply heat to the storage pit again, while the wood chip boiler continues to operate to meet total demand until April.
As per Table 9, the entire Marstal DH requires, approximately, 24.8 GWh of fuel energy input and heat losses count 0.13 GWh. It produces about 32 GWh of annual heating output, for a total DH efficiency of 142% and 3.2 GWh of electricity.
Table 9 – Marstal DH Energy Balance.
Figure 54 gives a practical idea of how the energy system works.
D2.2 – Availability and suitability of technologies 79
Figure 54 – Sankey diagram (in MWh) of Marstal DH production.
The Sunstore 4 plant functions best using low return temperatures. That is, the production of the solar plant under local conditions is approximately 1% higher if the average return temperature is lowered 1°C. The
Marstal DH network, therefore, uses local storages (typically 110‐ to 160‐litre tanks) at consumer substations to absorb incoming (flow) temperatures and to provide low return temperatures (roughly 33°C in winter and as high as 40°C in summer). These consumer substations also minimize required network piping to households and help to reduce network heat losses. The consumers own the substations in the houses and are responsible for their operation. Supply temperatures are regulated according to outdoor temperatures and typically are between 72°C in summer and 76°C in winter.
The Marstal DH network supplies approximately 1,550 buildings, which are mostly single‐family households built prior to 1970. Heat sales in 2012 were roughly 26 500 MWh. Heat losses from network distribution accounted for nearly 5,500 MWh (about 17% of system output). Network piping for Marstal DH can be as much as 30 years old, although it is being continuously upgraded with polyurethane piping with polymer casing. System flows (rates and temperatures) are also monitored regularly, and consumer substations with high return temperatures are visited to manage demand control.
Conclusion
The Sunstore 4 project is an innovative plant that has exceeded expectations and demonstrated that solar
thermal energy with storage can supply year‐round district heat. Sunstore 4 produces heat at roughly EUR 50/MWh to EUR 60/MWh, which is considerably lower than previous DH production prices of EUR 70/MWh from heat produced using bio oil.
Between 2,000 and 4,000 people from Denmark and elsewhere visit the Marstal DH project each year, and similar concepts will be developed in other regions of Europe. While design and implementation will be the same for similar plants in other regions, energy prices for produced heat (or cooling) and electricity will affect the market viability of a similar project. Existing policy and financing support to these technologies will also
influence project economics. If alternatives are cheaper, the Sunstore concept will not be cost‐effective. Interest rates on investments will also affect the feasibility of the Sunstore concept [207].
5.3 PV panels in Freiburg, Germany
Freiburg has long been putting in place the concept of sustainable city. It started with goal for improved energy efficiency, effective generation and greater use of renewable energy sources that was extended to the purpose of reducing its CO2 emissions.
The Schlierberg Solar Estate is probably the best known district in Freiburg as it reunited the features that made it possible to take further on this concept. The area belonged to the French army, having some deserted barracks at the time the city bought it in early 1990s. Schlieberg was then planned to become a model urban district. Several measures regarding mobility concept, sustainable water management, energy-conscious
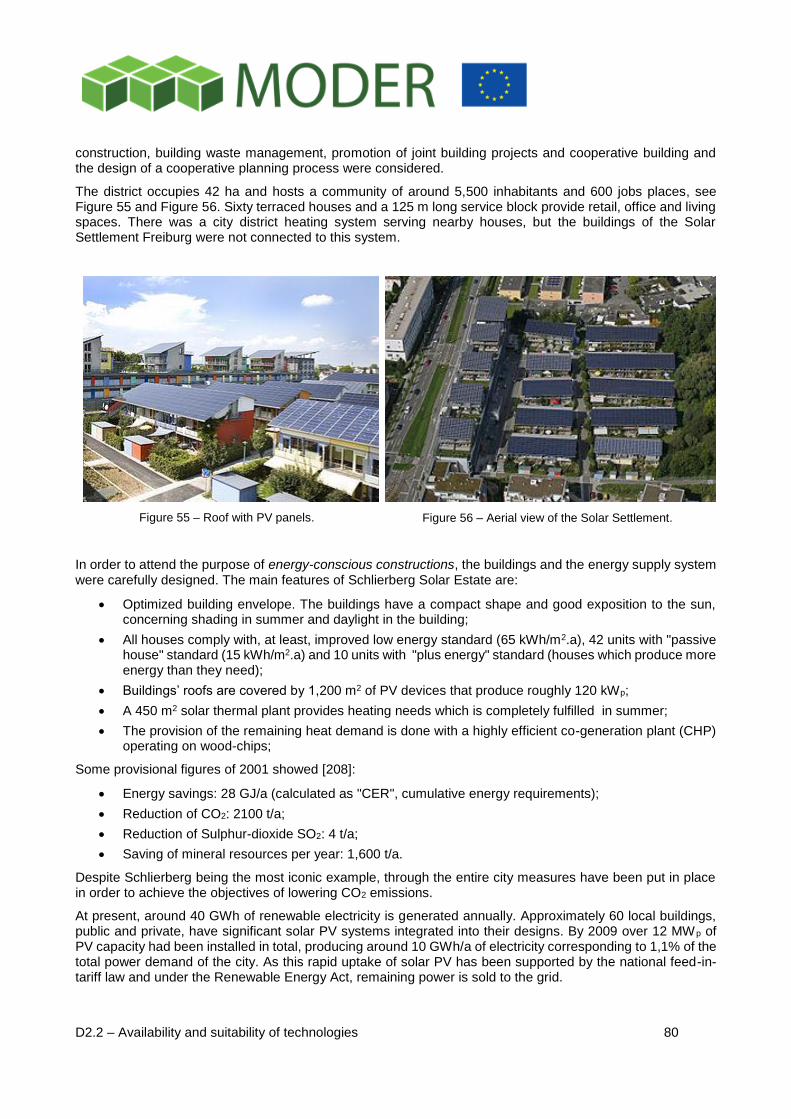
D2.2 – Availability and suitability of technologies 80
construction, building waste management, promotion of joint building projects and cooperative building and the design of a cooperative planning process were considered.
The district occupies 42 ha and hosts a community of around 5,500 inhabitants and 600 jobs places, see Figure 55 and Figure 56. Sixty terraced houses and a 125 m long service block provide retail, office and living spaces. There was a city district heating system serving nearby houses, but the buildings of the Solar Settlement Freiburg were not connected to this system.
Figure 55 – Roof with PV panels.
Figure 56 – Aerial view of the Solar Settlement.
In order to attend the purpose of energy-conscious constructions, the buildings and the energy supply system were carefully designed. The main features of Schlierberg Solar Estate are:
Optimized building envelope. The buildings have a compact shape and good exposition to the sun, concerning shading in summer and daylight in the building;
All houses comply with, at least, improved low energy standard (65 kWh/m2.a), 42 units with "passive house" standard (15 kWh/m2.a) and 10 units with "plus energy" standard (houses which produce more energy than they need);
Buildings’ roofs are covered by 1,200 m2 of PV devices that produce roughly 120 kWp;
A 450 m2 solar thermal plant provides heating needs which is completely fulfilled in summer;
The provision of the remaining heat demand is done with a highly efficient co-generation plant (CHP) operating on wood-chips;
Some provisional figures of 2001 showed [208]:
Energy savings: 28 GJ/a (calculated as "CER", cumulative energy requirements);
Reduction of CO2: 2100 t/a;
Reduction of Sulphur-dioxide SO2: 4 t/a;
Saving of mineral resources per year: 1,600 t/a.
Despite Schlierberg being the most iconic example, through the entire city measures have been put in place in order to achieve the objectives of lowering CO2 emissions.
At present, around 40 GWh of renewable electricity is generated annually. Approximately 60 local buildings, public and private, have significant solar PV systems integrated into their designs. By 2009 over 12 MWp of PV capacity had been installed in total, producing around 10 GWh/a of electricity corresponding to 1,1% of the total power demand of the city. As this rapid uptake of solar PV has been supported by the national feed-in-tariff law and under the Renewable Energy Act, remaining power is sold to the grid.
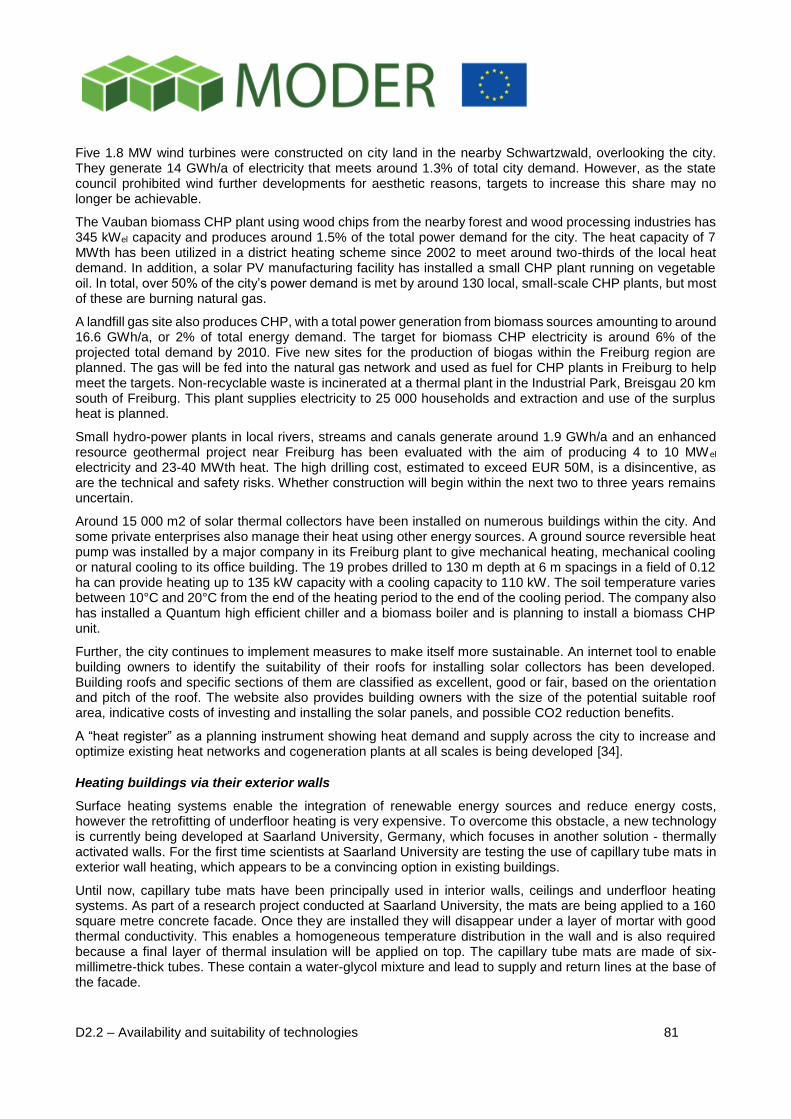
D2.2 – Availability and suitability of technologies 81
Five 1.8 MW wind turbines were constructed on city land in the nearby Schwartzwald, overlooking the city. They generate 14 GWh/a of electricity that meets around 1.3% of total city demand. However, as the state council prohibited wind further developments for aesthetic reasons, targets to increase this share may no longer be achievable.
The Vauban biomass CHP plant using wood chips from the nearby forest and wood processing industries has 345 kWel capacity and produces around 1.5% of the total power demand for the city. The heat capacity of 7 MWth has been utilized in a district heating scheme since 2002 to meet around two-thirds of the local heat demand. In addition, a solar PV manufacturing facility has installed a small CHP plant running on vegetable oil. In total, over 50% of the city’s power demand is met by around 130 local, small-scale CHP plants, but most of these are burning natural gas.
A landfill gas site also produces CHP, with a total power generation from biomass sources amounting to around 16.6 GWh/a, or 2% of total energy demand. The target for biomass CHP electricity is around 6% of the projected total demand by 2010. Five new sites for the production of biogas within the Freiburg region are planned. The gas will be fed into the natural gas network and used as fuel for CHP plants in Freiburg to help meet the targets. Non-recyclable waste is incinerated at a thermal plant in the Industrial Park, Breisgau 20 km south of Freiburg. This plant supplies electricity to 25 000 households and extraction and use of the surplus heat is planned.
Small hydro-power plants in local rivers, streams and canals generate around 1.9 GWh/a and an enhanced resource geothermal project near Freiburg has been evaluated with the aim of producing 4 to 10 MW el electricity and 23-40 MWth heat. The high drilling cost, estimated to exceed EUR 50M, is a disincentive, as are the technical and safety risks. Whether construction will begin within the next two to three years remains uncertain.
Around 15 000 m2 of solar thermal collectors have been installed on numerous buildings within the city. And some private enterprises also manage their heat using other energy sources. A ground source reversible heat pump was installed by a major company in its Freiburg plant to give mechanical heating, mechanical cooling or natural cooling to its office building. The 19 probes drilled to 130 m depth at 6 m spacings in a field of 0.12 ha can provide heating up to 135 kW capacity with a cooling capacity to 110 kW. The soil temperature varies between 10°C and 20°C from the end of the heating period to the end of the cooling period. The company also has installed a Quantum high efficient chiller and a biomass boiler and is planning to install a biomass CHP unit.
Further, the city continues to implement measures to make itself more sustainable. An internet tool to enable building owners to identify the suitability of their roofs for installing solar collectors has been developed. Building roofs and specific sections of them are classified as excellent, good or fair, based on the orientation and pitch of the roof. The website also provides building owners with the size of the potential suitable roof area, indicative costs of investing and installing the solar panels, and possible CO2 reduction benefits.
A “heat register” as a planning instrument showing heat demand and supply across the city to increase and optimize existing heat networks and cogeneration plants at all scales is being developed [34].
Heating buildings via their exterior walls
Surface heating systems enable the integration of renewable energy sources and reduce energy costs, however the retrofitting of underfloor heating is very expensive. To overcome this obstacle, a new technology is currently being developed at Saarland University, Germany, which focuses in another solution - thermally activated walls. For the first time scientists at Saarland University are testing the use of capillary tube mats in exterior wall heating, which appears to be a convincing option in existing buildings.
Until now, capillary tube mats have been principally used in interior walls, ceilings and underfloor heating systems. As part of a research project conducted at Saarland University, the mats are being applied to a 160 square metre concrete facade. Once they are installed they will disappear under a layer of mortar with good thermal conductivity. This enables a homogeneous temperature distribution in the wall and is also required because a final layer of thermal insulation will be applied on top. The capillary tube mats are made of six-millimetre-thick tubes. These contain a water-glycol mixture and lead to supply and return lines at the base of the facade.
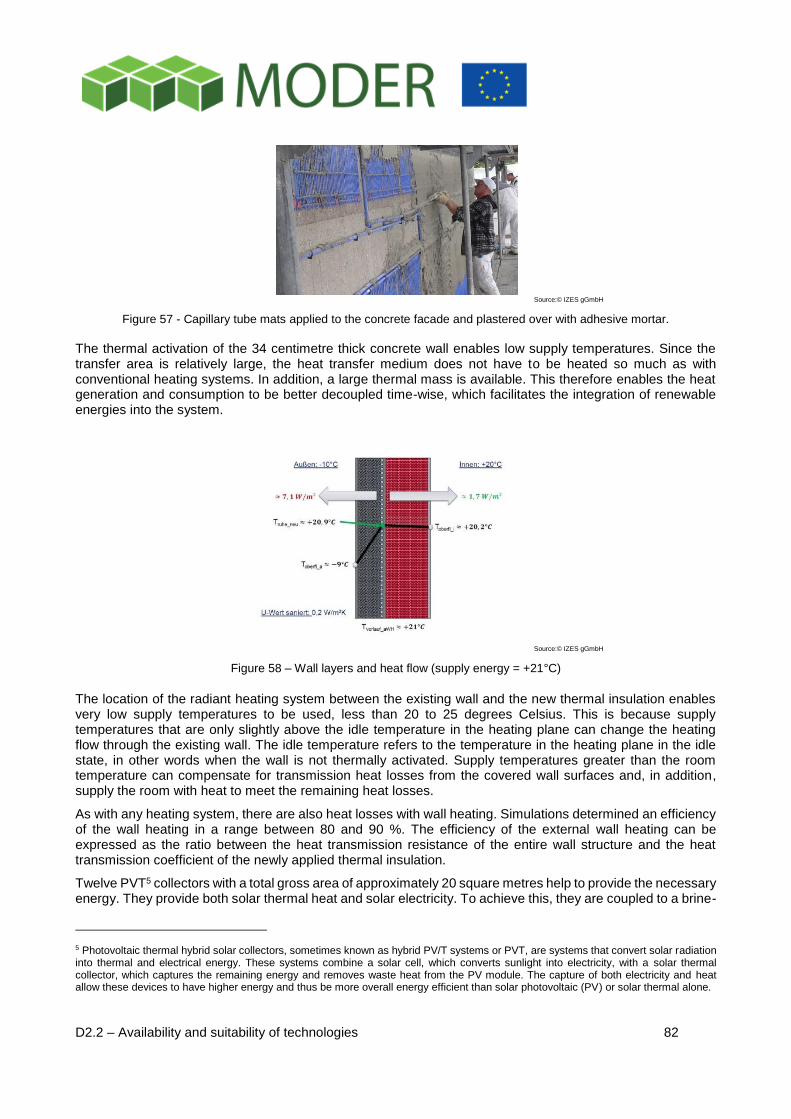
D2.2 – Availability and suitability of technologies 82
Source:© IZES gGmbH
Figure 57 - Capillary tube mats applied to the concrete facade and plastered over with adhesive mortar.
The thermal activation of the 34 centimetre thick concrete wall enables low supply temperatures. Since the transfer area is relatively large, the heat transfer medium does not have to be heated so much as with conventional heating systems. In addition, a large thermal mass is available. This therefore enables the heat generation and consumption to be better decoupled time-wise, which facilitates the integration of renewable energies into the system.
Source:© IZES gGmbH
Figure 58 – Wall layers and heat flow (supply energy = +21°C)
The location of the radiant heating system between the existing wall and the new thermal insulation enables very low supply temperatures to be used, less than 20 to 25 degrees Celsius. This is because supply temperatures that are only slightly above the idle temperature in the heating plane can change the heating flow through the existing wall. The idle temperature refers to the temperature in the heating plane in the idle state, in other words when the wall is not thermally activated. Supply temperatures greater than the room temperature can compensate for transmission heat losses from the covered wall surfaces and, in addition, supply the room with heat to meet the remaining heat losses.
As with any heating system, there are also heat losses with wall heating. Simulations determined an efficiency of the wall heating in a range between 80 and 90 %. The efficiency of the external wall heating can be expressed as the ratio between the heat transmission resistance of the entire wall structure and the heat transmission coefficient of the newly applied thermal insulation.
Twelve PVT5 collectors with a total gross area of approximately 20 square metres help to provide the necessary energy. They provide both solar thermal heat and solar electricity. To achieve this, they are coupled to a brine-
5 Photovoltaic thermal hybrid solar collectors, sometimes known as hybrid PV/T systems or PVT, are systems that convert solar radiation into thermal and electrical energy. These systems combine a solar cell, which converts sunlight into electricity, with a solar thermal collector, which captures the remaining energy and removes waste heat from the PV module. The capture of both electricity and heat allow these devices to have higher energy and thus be more overall energy efficient than solar photovoltaic (PV) or solar thermal alone.
D2.2 – Availability and suitability of technologies 83
water heat pump that is partly electrically driven by the PV system, the rest of the electricity requirement is met by the grid. The heat pump produces heating or cooling energy as required. It draws energy from an ice storage tank that is sunk into the ground next to the building. The storage system regenerates itself partly from the soil, but mainly via the solar thermal system. In terms of the energy efficiency, this combination is ultimately aimed at achieving the highest possible annual performance factors for the system. These depict the ratio between the useful energy for the building heating and the electricity requirement of the system. Therefore, providing precise information about the direct thermal utilisation of the solar thermal energy and the efficiency of the heating provided by the heat pump system is necessary.
A plant room controls and monitors the system on the basis of measurements, whereby it is continuously fed with data from all the important parameters. In addition to values from the temperature sensors in the outer wall, these also include values for the room temperature, humidity and occupancy. Since all the rooms have their own exterior wall heating circuit, they can be individually controlled and regulated. In addition, the entire hydraulic system and the electrical components are also metrologically recorded. The project will be completed in the middle of 2017 [209].
5.4 Geoenergy in Unterhaching, Germany
The German region known as the South German Molasse Basin has large geothermal resources. Hot water at depths of 1 500 to 5 000 m has led some communities to integrate geothermal energy into their local district heating systems. The Unterhaching community, located south of Munich, has been using these geothermal resources in a communal heating network since 2007. With their own energy concept developed a plan to cover at least 50% of the local energy requirements with more efficient systems by 2015.
In 2001 the community council decided to construct a geothermal plant. Two wells in Unterhaching resulted in copious hot water reserves at temperatures above 120 °C. The original usage concept gave a primary role to electricity generation with district heating for municipal buildings assuming a secondary role. The greatly increased prices for fossil fuels and the unexpectedly high temperature and volume of water resulted in a change of project priority, with the main focus becoming the supply of district heating for the community. This resulted in a new district heating network that already covers 25% of the local requirements and is still being expanded. Only the excess heat is channelled into a power station that has been specially designed for low temperature heat.
The grid is supplied with water extracted at a temperature of 122 °C, at a rate of 150 l/s and the geothermal output is up to 38 MW (fossil thermal output is up to 47 MW on peak load). The district heating network had, in 2008, 28 km length, a connected load of 30,4 MW (representing the heating requirements of approx. 3000 households) and an annual heating load of 47000 MWh. Geothermal electricity generation is 3,4 MW (average value) which corresponds to an electrical output of 21,5 Mio. kWh (represents the annual consumption of approx. 6,000 households). Previsions of annual CO2 saving are up to 35000 t (on completion of all expansion measures) with a total investment of approximately 80 million Euros.
The heating network requirements are currently covered over the entire year by geothermal heating. Due to the increasing connected load, and in the case of extremely cold temperatures, the fossil fuel heating plant can be switched into the system at peak load times. This has two 23,5 MW boilers that can be fuelled by crude oil or natural gas. If necessary, this heating plant can also supply the complete needs of the district heating customers. However, a new phase is already underway and following completion of the final construction phase, the district heating network will handle up to 70-80 MW [210].
Bedrock Heating, Finland
In Finland, geoenergy is mostly shallow geoenergy, stored in the first hundred metres of the Earth’s surface. Most of this shallow geoenergy is originated from solar radiation and a smaller proportion consists of geothermal energy from the inner parts of the Earth’s crust. In Finland geoenergy is mainly building-specific, i.e. is mainly used to heat and cool buildings by means of heat pumps. However, experiments for application in district heating have already been made.
The first regional production of bedrock heat for residential areas was implemented in the Nupurinkartano, a single-family house area in Espoo that houses approximately 500 to 600 people. The heat pumps in the area
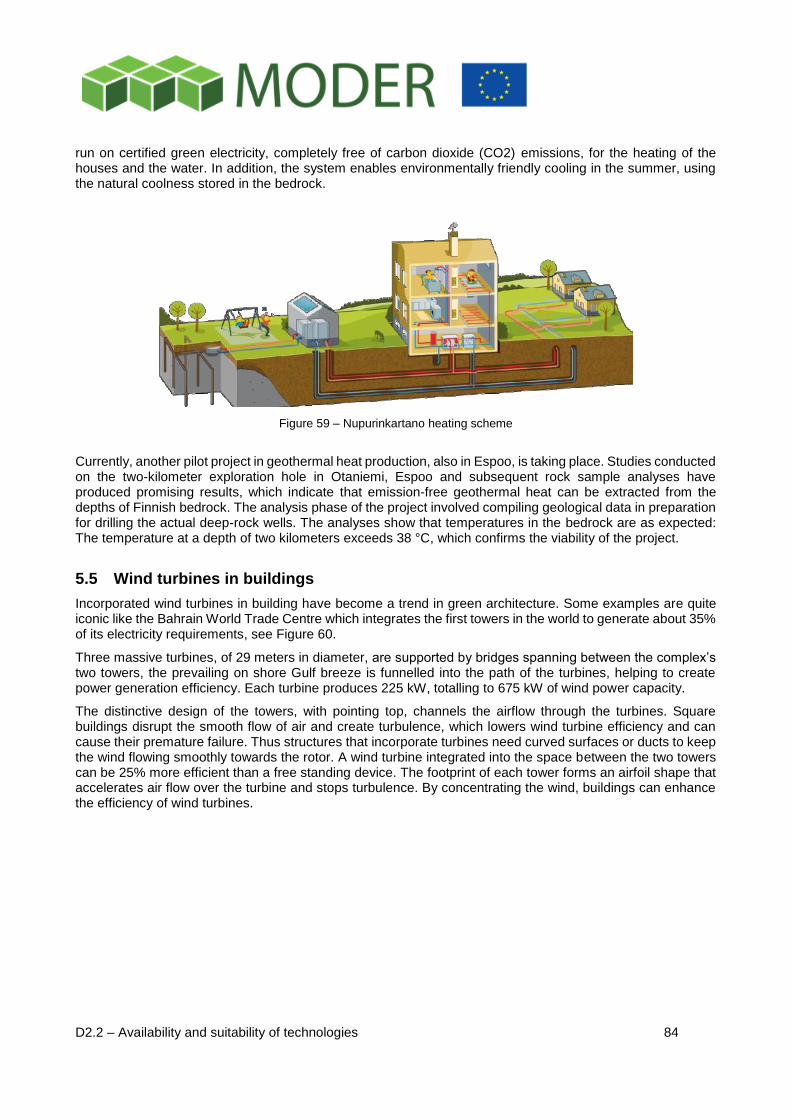
D2.2 – Availability and suitability of technologies 84
run on certified green electricity, completely free of carbon dioxide (CO2) emissions, for the heating of the houses and the water. In addition, the system enables environmentally friendly cooling in the summer, using the natural coolness stored in the bedrock.
Figure 59 – Nupurinkartano heating scheme
Currently, another pilot project in geothermal heat production, also in Espoo, is taking place. Studies conducted on the two-kilometer exploration hole in Otaniemi, Espoo and subsequent rock sample analyses have produced promising results, which indicate that emission-free geothermal heat can be extracted from the depths of Finnish bedrock. The analysis phase of the project involved compiling geological data in preparation for drilling the actual deep-rock wells. The analyses show that temperatures in the bedrock are as expected: The temperature at a depth of two kilometers exceeds 38 °C, which confirms the viability of the project.
5.5 Wind turbines in buildings
Incorporated wind turbines in building have become a trend in green architecture. Some examples are quite iconic like the Bahrain World Trade Centre which integrates the first towers in the world to generate about 35% of its electricity requirements, see Figure 60.
Three massive turbines, of 29 meters in diameter, are supported by bridges spanning between the complex’s two towers, the prevailing on shore Gulf breeze is funnelled into the path of the turbines, helping to create power generation efficiency. Each turbine produces 225 kW, totalling to 675 kW of wind power capacity.
The distinctive design of the towers, with pointing top, channels the airflow through the turbines. Square buildings disrupt the smooth flow of air and create turbulence, which lowers wind turbine efficiency and can cause their premature failure. Thus structures that incorporate turbines need curved surfaces or ducts to keep the wind flowing smoothly towards the rotor. A wind turbine integrated into the space between the two towers can be 25% more efficient than a free standing device. The footprint of each tower forms an airfoil shape that accelerates air flow over the turbine and stops turbulence. By concentrating the wind, buildings can enhance the efficiency of wind turbines.

D2.2 – Availability and suitability of technologies 85
Source:azaharphotography.azp.vze.com©2013
Figure 60 - Bahrain World Trade Centre.
Another solution was presented by researchers at Hong Kong University - a battery of micro wind turbines connected along a horizontal axis, as shown in Figure 61. Micro wind turbines are light, compact of 25 cm rotor diameter and can generate power with wind speeds as low as 2 meters/second. According to tests, turbines arranged within a surface area of one square meter and a wind speed of 5 m/sec generate 131 kWh per year.
source: http://inhabitat.com/micro-wind-turbines-small-size-big-impact/
Figure 61 – Micro wind turbines along horizontal axis.
Aerotecture technology combines vertical air turbines and solar photovoltaics to architectural design into wind turbines designed for urban settings. It is suggested that their helical turbines can be installed on existing rooftops or built into the architecture of new buildings. The Aeroturbines design, developed at the University of Chicago, are advocated to be noise and vibration-free, safe for birds, able to utilize multi-directional and gusting winds, self-regulating with no overspeed protection required, low maintenance and made from low-cost and readily available materials [112].
However, this technology is not available worldwide, but only for a limited area in Chicago.
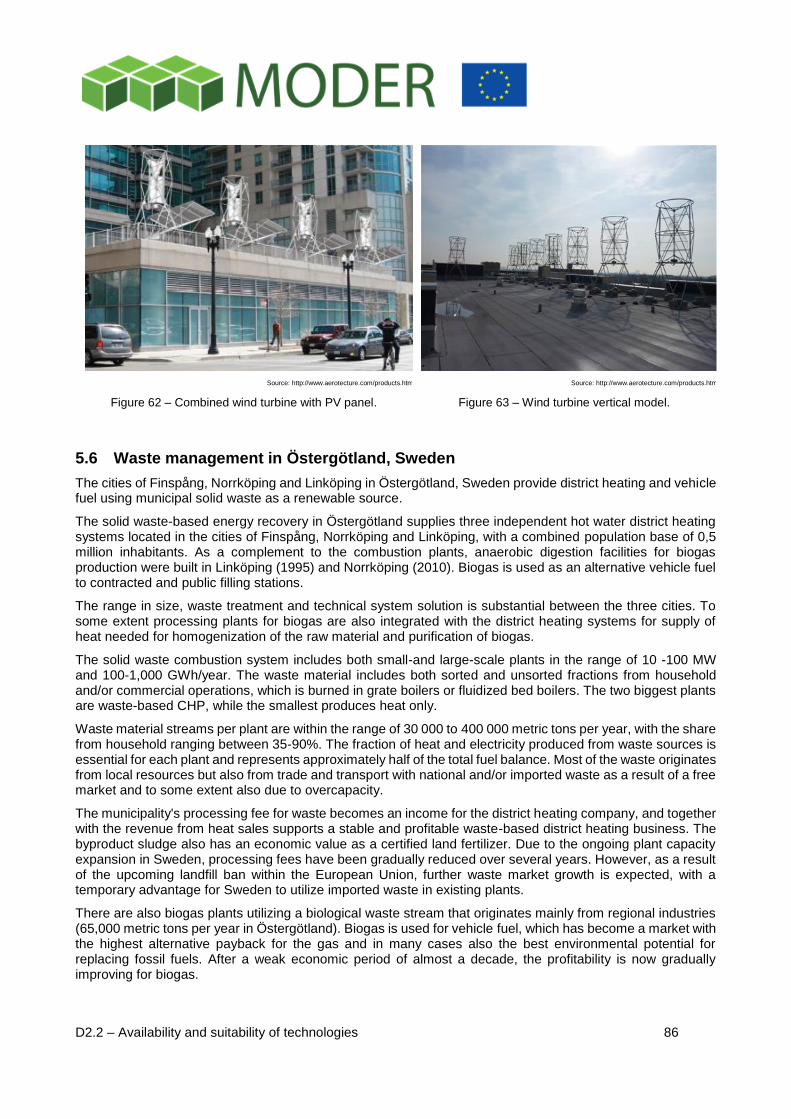
D2.2 – Availability and suitability of technologies 86
Source: http://www.aerotecture.com/products.html
Figure 62 – Combined wind turbine with PV panel.
Source: http://www.aerotecture.com/products.html
Figure 63 – Wind turbine vertical model.
5.6 Waste management in Östergötland, Sweden
The cities of Finspång, Norrköping and Linköping in Östergötland, Sweden provide district heating and vehicle fuel using municipal solid waste as a renewable source.
The solid waste-based energy recovery in Östergötland supplies three independent hot water district heating systems located in the cities of Finspång, Norrköping and Linköping, with a combined population base of 0,5 million inhabitants. As a complement to the combustion plants, anaerobic digestion facilities for biogas production were built in Linköping (1995) and Norrköping (2010). Biogas is used as an alternative vehicle fuel to contracted and public filling stations.
The range in size, waste treatment and technical system solution is substantial between the three cities. To some extent processing plants for biogas are also integrated with the district heating systems for supply of heat needed for homogenization of the raw material and purification of biogas.
The solid waste combustion system includes both small-and large-scale plants in the range of 10 -100 MW and 100-1,000 GWh/year. The waste material includes both sorted and unsorted fractions from household and/or commercial operations, which is burned in grate boilers or fluidized bed boilers. The two biggest plants are waste-based CHP, while the smallest produces heat only.
Waste material streams per plant are within the range of 30 000 to 400 000 metric tons per year, with the share from household ranging between 35-90%. The fraction of heat and electricity produced from waste sources is essential for each plant and represents approximately half of the total fuel balance. Most of the waste originates from local resources but also from trade and transport with national and/or imported waste as a result of a free market and to some extent also due to overcapacity.
The municipality's processing fee for waste becomes an income for the district heating company, and together with the revenue from heat sales supports a stable and profitable waste-based district heating business. The byproduct sludge also has an economic value as a certified land fertilizer. Due to the ongoing plant capacity expansion in Sweden, processing fees have been gradually reduced over several years. However, as a result of the upcoming landfill ban within the European Union, further waste market growth is expected, with a temporary advantage for Sweden to utilize imported waste in existing plants.
There are also biogas plants utilizing a biological waste stream that originates mainly from regional industries (65,000 metric tons per year in Östergötland). Biogas is used for vehicle fuel, which has become a market with the highest alternative payback for the gas and in many cases also the best environmental potential for replacing fossil fuels. After a weak economic period of almost a decade, the profitability is now gradually improving for biogas.
D2.2 – Availability and suitability of technologies 87
Biogas plants in Östergötland have a thermal output equivalent to 30 MW, resulting in a maximum gas production corresponding to 250 GWh/year. Today’s production is just under 50% of the capacity. About half of the current production is used in public transport. All urban buses more than 100 units are driven by biogas. The second half is used by the private/public market through 10 filling stations. Overall the current biogas production replaces about 12,000 m3/year (3.2 million gal.) of liquid fossil fuels.
Sustainable Energy Integration
In a view of sustainability, the Swedish model to recover combustible waste fractions as a district heating resource is well established. The combustion plants are normally located within or in close proximity to major cities, normally beyond the prevailing wind direction.
Several decades ago there were objections to the potential impact of waste plant emissions on humans and nature. Over the years, these risks have been minimized through stringent quality control of waste fractions, improved plant performance and stricter emission requirements. The challenges/concerns today are more about increases in waste generation in general and the additional emissions arising from transportation and the disposal of combustion residuals.
Strategically, the local biogas developments in Östergötland connect to a national program that supports the utilization of biological waste, e.g. developing solutions to convert from fossil fuel dependency for transportation. In fact, transportation is the primary remaining sector to be prioritized for conversion to a renewable fuel basis. In the build-up of the market and infrastructure for renewable energy systems, various governmental investment programs and municipal procurement of renewable services (biogas-based public transportation services) played a vital role. These environmental policy instruments facilitate a sustainable transformation of the Swedish energy system.
Key design interface challenges / solutions
The expansion of solid waste combustion for district heating and biogas production started as a way to manage waste residuals in an environmentally friendly manner without any significant costs. Östergötland was one of the first regions in Sweden to implement new technology for waste incineration and controlled production of biogas for the transportation sector. At the time, there were basically no available technical solutions on the market and hardly any experience worldwide. New technologies were established in a small manageable scale to gradually learn and to make the right decisions for future ongoing efforts.
Locally sourced solid waste was initially burned in hot water grate boilers connected to the district energy system. Over the years, technology solutions have been refined with quality assured waste fractions, new combustion technologies and combined heat and power.
Business development for trading in solid waste has also significantly evolved over the years. Controlled and commercial biogas production must ensure upstream supply of waste substrate and downstream demand for biogas. Expansion of biogas production in Linköping was based on a co-funded facility for primary digestion of slaughterhouse waste. Business set-up ensured a reliable supply of pumpable substrate. The demand for vehicle fuel was secured by the introduction of gas buses in the municipal public transportation system. Today, a broader base of substrate is used all the way from foodservice and household waste to quality-assured waste fractions in the form of distiller's waste and green biomass [211].
5.7 DC in Paris, France
The Bercy cooling plant is an independent extension of the district cooling network in Paris, France. The facility has been developed as a cooling production plant with free cooling capacity using river water from the Seine River. The Bercy project was built over six phases between 1995 and 2009. It consists of seven electrical
centrifugal chillers, four river water pumps, condensing and evaporating circuits, and on‐site generator equipment for emergency and ancillary electricity demand. The plant has a current total generation capacity6 of 44 MW, and it supplies more than 40 clients along 10 km of network. Free cooling at the Bercy plant has
6 Cooling system's ability to remove heat.
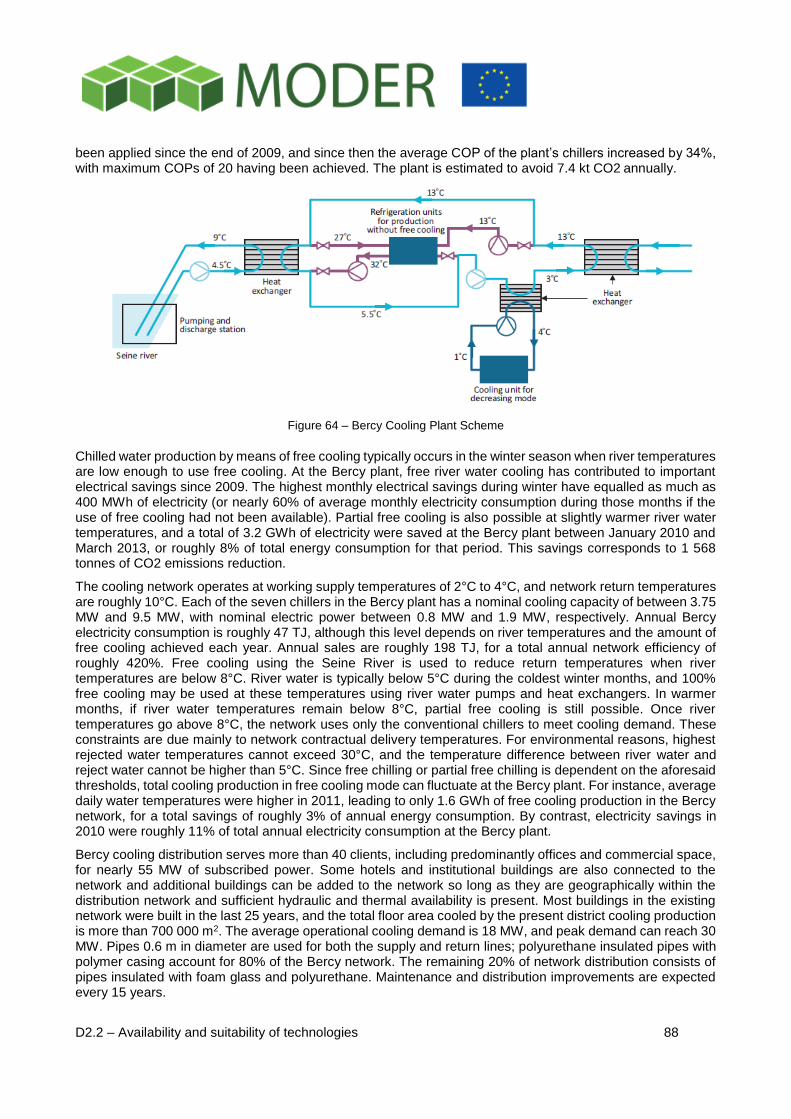
D2.2 – Availability and suitability of technologies 88
been applied since the end of 2009, and since then the average COP of the plant’s chillers increased by 34%, with maximum COPs of 20 having been achieved. The plant is estimated to avoid 7.4 kt CO2 annually.
Figure 64 – Bercy Cooling Plant Scheme
Chilled water production by means of free cooling typically occurs in the winter season when river temperatures are low enough to use free cooling. At the Bercy plant, free river water cooling has contributed to important electrical savings since 2009. The highest monthly electrical savings during winter have equalled as much as 400 MWh of electricity (or nearly 60% of average monthly electricity consumption during those months if the use of free cooling had not been available). Partial free cooling is also possible at slightly warmer river water temperatures, and a total of 3.2 GWh of electricity were saved at the Bercy plant between January 2010 and March 2013, or roughly 8% of total energy consumption for that period. This savings corresponds to 1 568 tonnes of CO2 emissions reduction.
The cooling network operates at working supply temperatures of 2°C to 4°C, and network return temperatures are roughly 10°C. Each of the seven chillers in the Bercy plant has a nominal cooling capacity of between 3.75 MW and 9.5 MW, with nominal electric power between 0.8 MW and 1.9 MW, respectively. Annual Bercy electricity consumption is roughly 47 TJ, although this level depends on river temperatures and the amount of free cooling achieved each year. Annual sales are roughly 198 TJ, for a total annual network efficiency of roughly 420%. Free cooling using the Seine River is used to reduce return temperatures when river temperatures are below 8°C. River water is typically below 5°C during the coldest winter months, and 100% free cooling may be used at these temperatures using river water pumps and heat exchangers. In warmer months, if river water temperatures remain below 8°C, partial free cooling is still possible. Once river temperatures go above 8°C, the network uses only the conventional chillers to meet cooling demand. These constraints are due mainly to network contractual delivery temperatures. For environmental reasons, highest rejected water temperatures cannot exceed 30°C, and the temperature difference between river water and reject water cannot be higher than 5°C. Since free chilling or partial free chilling is dependent on the aforesaid thresholds, total cooling production in free cooling mode can fluctuate at the Bercy plant. For instance, average daily water temperatures were higher in 2011, leading to only 1.6 GWh of free cooling production in the Bercy network, for a total savings of roughly 3% of annual energy consumption. By contrast, electricity savings in 2010 were roughly 11% of total annual electricity consumption at the Bercy plant.
Bercy cooling distribution serves more than 40 clients, including predominantly offices and commercial space, for nearly 55 MW of subscribed power. Some hotels and institutional buildings are also connected to the network and additional buildings can be added to the network so long as they are geographically within the distribution network and sufficient hydraulic and thermal availability is present. Most buildings in the existing network were built in the last 25 years, and the total floor area cooled by the present district cooling production is more than 700 000 m2. The average operational cooling demand is 18 MW, and peak demand can reach 30 MW. Pipes 0.6 m in diameter are used for both the supply and return lines; polyurethane insulated pipes with polymer casing account for 80% of the Bercy network. The remaining 20% of network distribution consists of pipes insulated with foam glass and polyurethane. Maintenance and distribution improvements are expected every 15 years.
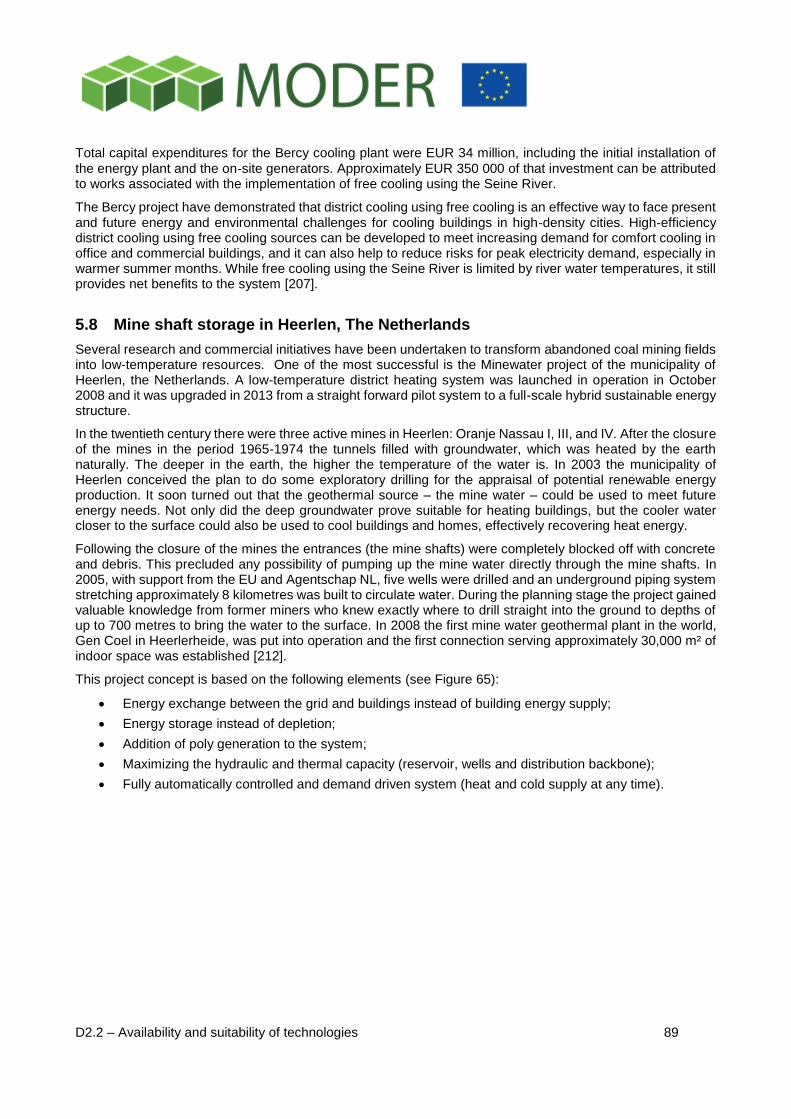
D2.2 – Availability and suitability of technologies 89
Total capital expenditures for the Bercy cooling plant were EUR 34 million, including the initial installation of
the energy plant and the on‐site generators. Approximately EUR 350 000 of that investment can be attributed to works associated with the implementation of free cooling using the Seine River.
The Bercy project have demonstrated that district cooling using free cooling is an effective way to face present and future energy and environmental challenges for cooling buildings in high‐density cities. High‐efficiency district cooling using free cooling sources can be developed to meet increasing demand for comfort cooling in office and commercial buildings, and it can also help to reduce risks for peak electricity demand, especially in warmer summer months. While free cooling using the Seine River is limited by river water temperatures, it still provides net benefits to the system [207].
5.8 Mine shaft storage in Heerlen, The Netherlands
Several research and commercial initiatives have been undertaken to transform abandoned coal mining fields into low-temperature resources. One of the most successful is the Minewater project of the municipality of Heerlen, the Netherlands. A low-temperature district heating system was launched in operation in October 2008 and it was upgraded in 2013 from a straight forward pilot system to a full-scale hybrid sustainable energy structure.
In the twentieth century there were three active mines in Heerlen: Oranje Nassau I, III, and IV. After the closure of the mines in the period 1965-1974 the tunnels filled with groundwater, which was heated by the earth naturally. The deeper in the earth, the higher the temperature of the water is. In 2003 the municipality of Heerlen conceived the plan to do some exploratory drilling for the appraisal of potential renewable energy production. It soon turned out that the geothermal source – the mine water – could be used to meet future energy needs. Not only did the deep groundwater prove suitable for heating buildings, but the cooler water closer to the surface could also be used to cool buildings and homes, effectively recovering heat energy.
Following the closure of the mines the entrances (the mine shafts) were completely blocked off with concrete and debris. This precluded any possibility of pumping up the mine water directly through the mine shafts. In 2005, with support from the EU and Agentschap NL, five wells were drilled and an underground piping system stretching approximately 8 kilometres was built to circulate water. During the planning stage the project gained valuable knowledge from former miners who knew exactly where to drill straight into the ground to depths of up to 700 metres to bring the water to the surface. In 2008 the first mine water geothermal plant in the world, Gen Coel in Heerlerheide, was put into operation and the first connection serving approximately 30,000 m² of indoor space was established [212].
This project concept is based on the following elements (see Figure 65):
Energy exchange between the grid and buildings instead of building energy supply;
Energy storage instead of depletion;
Addition of poly generation to the system;
Maximizing the hydraulic and thermal capacity (reservoir, wells and distribution backbone);
Fully automatically controlled and demand driven system (heat and cold supply at any time).
D2.2 – Availability and suitability of technologies 90
Source: http://inhabitat.com/heerlen-minewater-project/attachment/17493/
Figure 65 – Schematic project concept of mine shaft storage.
Energy exchange
Energy exchange will be realized by the means of:
Local cluster grids for instant energy exchange (heat and cold) between the connected buildings in the cluster.
Application of the existing mine water backbone for energy exchange (heat and cold) between the geographically dispersed cluster grids.
In this way, buildings are no longer only an energy consumers but also an energy suppliers. Buildings extract heat from the cluster grid and supplies it back with cold, which can instantly be uses by other buildings connected to the grid. Another important advantage of cluster networks is that these are closed systems and can be run with clean water. In cluster grids no special materials resistant to the corrosive mine water are needed. Application of cast iron and a provision for simple water treatment are sufficient. This means an important cost reduction of the cluster grid.
Energy storage and regeneration
The extraction wells supply the shortage of heat and cold to the mine water backbone. Surplus of heat and cold will be stored in the mine water reservoir through the hot and cold injection well. Unwanted intermediate return temperatures cause depletion of the mine water reservoir. To eliminate this effect it is necessary that the used return mine water is heated up or cooled down properly to the natural geothermal temperature and brought back to the corresponding hot or cold part of the mine water reservoir.
It is also important that the heat and cold extraction and infiltration has to maintain a sort of energy balance on a yearly basis. In other words it is important that the mine water reservoir is regenerated. Determinative for the correct water return temperatures to the mine water reservoir is the operation of the energy stations of the end-users. They have to ensure that the hot water is cooled down (< 16˚C) and heated up (> 28˚C) sufficiently. This is included as one of the conditions in the contract for end users of mine water.
With this flow pattern practically no exchange between the hot and cold part of the mine water reservoir occurs and in time a hot and cold bubble is built up which enlarges the useful energy storage capacity of the mine water reservoir.
Poly generation
The capacity of the mine water system is finite, so a combination of mine water with other renewable energy sources, such as biomass and/or solar energy and waste heat, is necessary. It is most likely that Minewater will become a hybrid energy structure. Different approaches have been considered: a bio-CHP, a closed
D2.2 – Availability and suitability of technologies 91
greenhouse, waste heat of an additional data center and cooling towers for peak cold demands. All these energy sources are locally situated and will be connected to the nearest cluster grid to supply the entire system.
Maximizing hydraulic and thermal capacity mine water system
Limitations in the mine water system can occur on three levels:
Temperature, flow and storage capacity of the mine water reservoir;
Flow of the mine water wells;
Flow and grid capacity of the mine water backbone.
At this moment the hydraulic capacity is limited by the mine water backbone, especially the hot mine water pipe. All wells are intended to become bidirectional and several measures were taken to maximize the hydraulic capacity of the mine water backbone.
Fully automatic and demand driven
The Minewater system is fully automatic and demand driven with 3 levels of control. Each level works with another independent process control parameter:
MI-Building: Temperature;
MI-Cluster: Flow;
MI-Wells: Pressure.
Financial Support
European Programs were the main subsidies and funding for the Minewater project. With these pilot projects a lot of experience was gained about the financial exploitation, which was the basis for developing a Minewater Corporation that can now offer commercial deals to interested building owners for connecting to the cluster grid. The building owner pays a standing charge for the mine water connection and normally runs his own heat pump installation. This charge is based on the capital and operational costs for the connection to the cluster grid.
Performance/System evaluation
The Minewater project is a smart grid system in heating and cooling with a full scale hybrid sustainable energy structure which provided with mine water a total of 500.000 m2 floor area in 2015. This represents a CO2 emission reduction of 65% on heating and cooling for these connections.
Cluster grids are a thoughtful solution to provide energy exchange between buildings and by poly generation the power of the application of cluster grids and capacity of the mine water grid can be strongly increased.
Cluster grid applications are used in combination with low temperature geothermal sources (mine water) but can be applied in general with other sustainable heat and cold energy sources e.g. waste heat from data centres and closed greenhouses.
Yet, the use of mine shafts as energy storage demands smart cost effective solutions, creative thinking and new use of standard available solutions. Furthermore, technical developments are still necessary to reach fine tuning in cost effective design and operation of the grid installations.
The Minewater Corporation existence proves that heat pump operation with low-ex heat sources can be commercial feasible.
Conclusions
Seasonal heat storage in existing subsurface mine infrastructures (shaft and gallery system) represents a possible innovative and permanent heat supply variant. This solution is a reasonable procedure to be implemented in areas that gather all the necessary characteristics. Thus, it is only possible to practice in areas where mine shafts or other underground galleries exist.
D2.2 – Availability and suitability of technologies 92
Besides the advantages mentioned, other similar developments and researches point important features and problems that this kind of exploitations might have.
One important point is that the mine should fully accessible and, if possible, active. Re-open mines which have already been backfilled becomes extremely expensive. The Minewater project is associated with relatively high costs for the reservoir development with additional boreholes.
If in local cluster grids (connected buildings in a cluster that exchange energy instantaneously between them) no special materials are needed, but the direct use of mine waters demands special materials composition of the heat exchangers. Waters from coal mines are highly mineralized and mixed with partially larger particles.
The seasonal heat storage must have a large volume since large amounts of heat shall be stored. It also has to be operated reliably, constructed cost-effective and be integrated into the existing infrastructures. High demands are made on the materials of the subsurface heat exchangers. They result from high temperature stresses, humidity admission flow and cross sectional stability of the mine infrastructure. Materials and superstructures have to make sure that function is guaranteed over a period of 40 to 50 years.
New thermal storage capacities can be developed in subsurface mining infrastructures. They are needed for the large scale expansion of renewable energies on the heating sector in metropolitan areas. Therefore fundamental understandings for thermal storage of energy in mines have been developed and must be expanded. The specific aim of this applied research project is to realize a prototype plant at the Prosper-Haniel Coal Mine, based on the findings and make an important contribution to the conversion of the energy system of the City of Bottrop. If the technical and economic feasibility can be demonstrated, an extension of the heat storage at Prosper-Haniel to other mines or regions is conceivable. The transferability of this project on numerous locations in Germany and around the world offers a perspective far beyond the targeted pilot project itself.
The project results are useful for other applications: such as cold storage, heat extraction, underground pumped-storage. Numerical subsurface models and the dimensioning of the storage systems simulation tools need to be developed with complex thermal and hydraulic couplings. These software tools can also be used in other projects for underground heat storage as well as in the disciplines of geothermal energy and reservoir modelling. Any use of the knowledge gained about the technical issues, such as the geothermal development of mines and the research for new heat exchangers, pipe materials, filling and insulating materials for increasing the efficiency of future heat storage and geothermal projects is conceivable [213].
5.9 “Power Bank” in Mannheim, Germany
The amount of locally produced energy from RES such as PV systems or CHP systems is steadily increasing. In the project “Power Bank” the company ADS-TEC together with MVV Energie and other partners examine a new approach for the efficient use of electricity from local production [214]. The battery system based on Lithium-ion cells was official opened in Mannheim in December 2014. The Power Bank comes in a 20ft container format with a storage capacity of 100 kWh, which is connected to the low voltage grid of MVV Energie.
Four commercial enterprises and 14 households are connected to the energy storage system and generate electricity from PV and CHP plants – energy not needed immediately flows into the storage. To each participant a virtual quota of the storage is attributed, depending on the nominal power of the RES. The self-produced amount of electricity can thus be stored and used for own consumption later on. All 18 participants were equipped with special measuring equipment consisting of smart meters and Firewall from ADS-TEC. Hence, comprehensive data of energy production and consumptions can be centrally collected and evaluated. By means of a special banking app developed by ADS-TEC all participants are able to monitor "their power" with a tablet computer like an online bank account. The amount of electricity generated, the self-consumption and the amount of electricity that is stored in the battery and is usable again later on is visualized.
Facts about the battery storage system:
20ft container
Lithium ion batteries
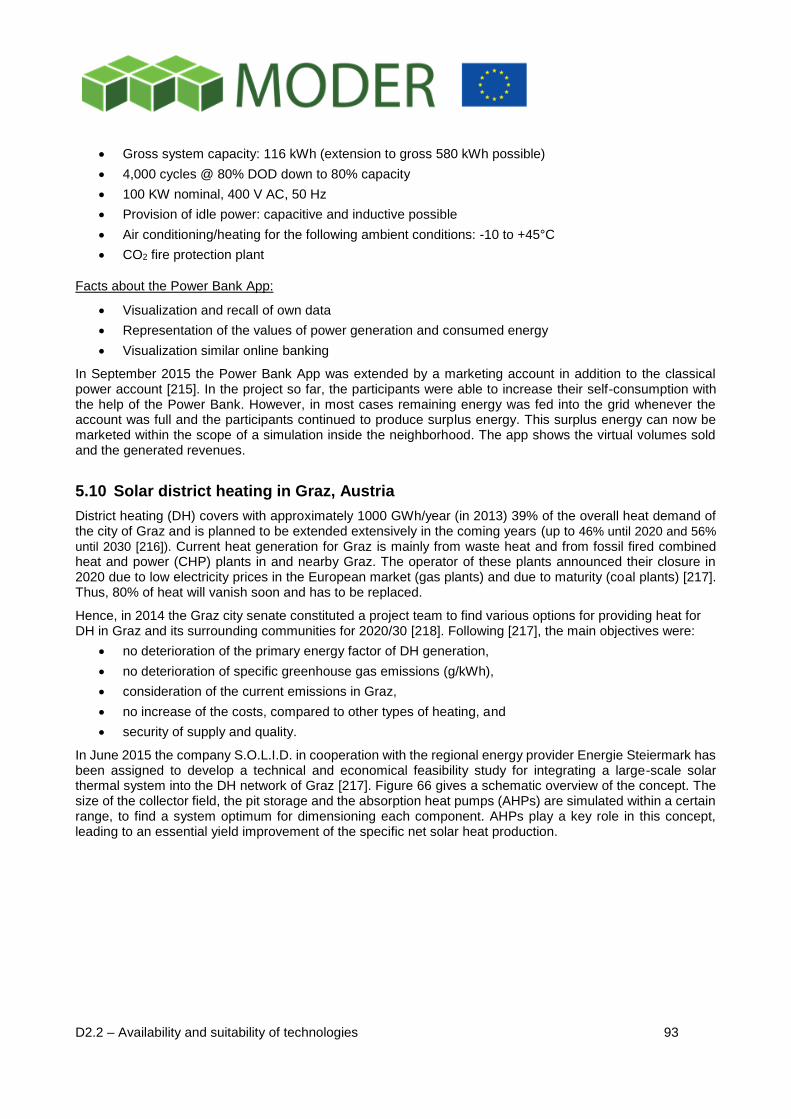
D2.2 – Availability and suitability of technologies 93
Gross system capacity: 116 kWh (extension to gross 580 kWh possible)
4,000 cycles @ 80% DOD down to 80% capacity
100 KW nominal, 400 V AC, 50 Hz
Provision of idle power: capacitive and inductive possible
Air conditioning/heating for the following ambient conditions: -10 to +45°C
CO2 fire protection plant
Facts about the Power Bank App:
Visualization and recall of own data
Representation of the values of power generation and consumed energy
Visualization similar online banking
In September 2015 the Power Bank App was extended by a marketing account in addition to the classical power account [215]. In the project so far, the participants were able to increase their self-consumption with the help of the Power Bank. However, in most cases remaining energy was fed into the grid whenever the account was full and the participants continued to produce surplus energy. This surplus energy can now be marketed within the scope of a simulation inside the neighborhood. The app shows the virtual volumes sold and the generated revenues.
5.10 Solar district heating in Graz, Austria
District heating (DH) covers with approximately 1000 GWh/year (in 2013) 39% of the overall heat demand of the city of Graz and is planned to be extended extensively in the coming years (up to 46% until 2020 and 56%
until 2030 [216]). Current heat generation for Graz is mainly from waste heat and from fossil fired combined heat and power (CHP) plants in and nearby Graz. The operator of these plants announced their closure in 2020 due to low electricity prices in the European market (gas plants) and due to maturity (coal plants) [217]. Thus, 80% of heat will vanish soon and has to be replaced.
Hence, in 2014 the Graz city senate constituted a project team to find various options for providing heat for DH in Graz and its surrounding communities for 2020/30 [218]. Following [217], the main objectives were:
no deterioration of the primary energy factor of DH generation,
no deterioration of specific greenhouse gas emissions (g/kWh),
consideration of the current emissions in Graz,
no increase of the costs, compared to other types of heating, and
security of supply and quality.
In June 2015 the company S.O.L.I.D. in cooperation with the regional energy provider Energie Steiermark has been assigned to develop a technical and economical feasibility study for integrating a large-scale solar thermal system into the DH network of Graz [217]. Figure 66 gives a schematic overview of the concept. The size of the collector field, the pit storage and the absorption heat pumps (AHPs) are simulated within a certain range, to find a system optimum for dimensioning each component. AHPs play a key role in this concept, leading to an essential yield improvement of the specific net solar heat production.
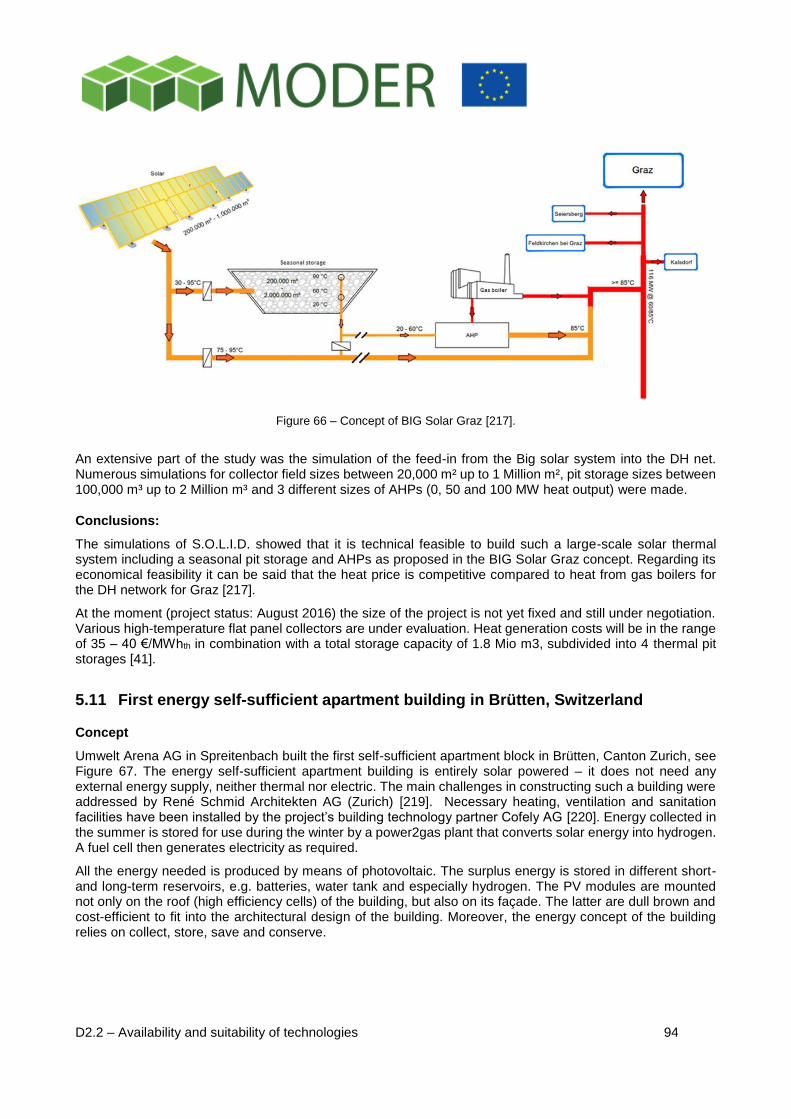
D2.2 – Availability and suitability of technologies 94
Figure 66 – Concept of BIG Solar Graz [217].
An extensive part of the study was the simulation of the feed-in from the Big solar system into the DH net. Numerous simulations for collector field sizes between 20,000 m² up to 1 Million m², pit storage sizes between 100,000 m³ up to 2 Million m³ and 3 different sizes of AHPs (0, 50 and 100 MW heat output) were made.
Conclusions:
The simulations of S.O.L.I.D. showed that it is technical feasible to build such a large-scale solar thermal system including a seasonal pit storage and AHPs as proposed in the BIG Solar Graz concept. Regarding its economical feasibility it can be said that the heat price is competitive compared to heat from gas boilers for the DH network for Graz [217].
At the moment (project status: August 2016) the size of the project is not yet fixed and still under negotiation. Various high-temperature flat panel collectors are under evaluation. Heat generation costs will be in the range of 35 – 40 €/MWhth in combination with a total storage capacity of 1.8 Mio m3, subdivided into 4 thermal pit storages [41].
5.11 First energy self-sufficient apartment building in Brütten, Switzerland
Concept
Umwelt Arena AG in Spreitenbach built the first self-sufficient apartment block in Brütten, Canton Zurich, see Figure 67. The energy self-sufficient apartment building is entirely solar powered – it does not need any external energy supply, neither thermal nor electric. The main challenges in constructing such a building were addressed by René Schmid Architekten AG (Zurich) [219]. Necessary heating, ventilation and sanitation facilities have been installed by the project’s building technology partner Cofely AG [220]. Energy collected in the summer is stored for use during the winter by a power2gas plant that converts solar energy into hydrogen. A fuel cell then generates electricity as required.
All the energy needed is produced by means of photovoltaic. The surplus energy is stored in different short- and long-term reservoirs, e.g. batteries, water tank and especially hydrogen. The PV modules are mounted not only on the roof (high efficiency cells) of the building, but also on its façade. The latter are dull brown and cost-efficient to fit into the architectural design of the building. Moreover, the energy concept of the building relies on collect, store, save and conserve.
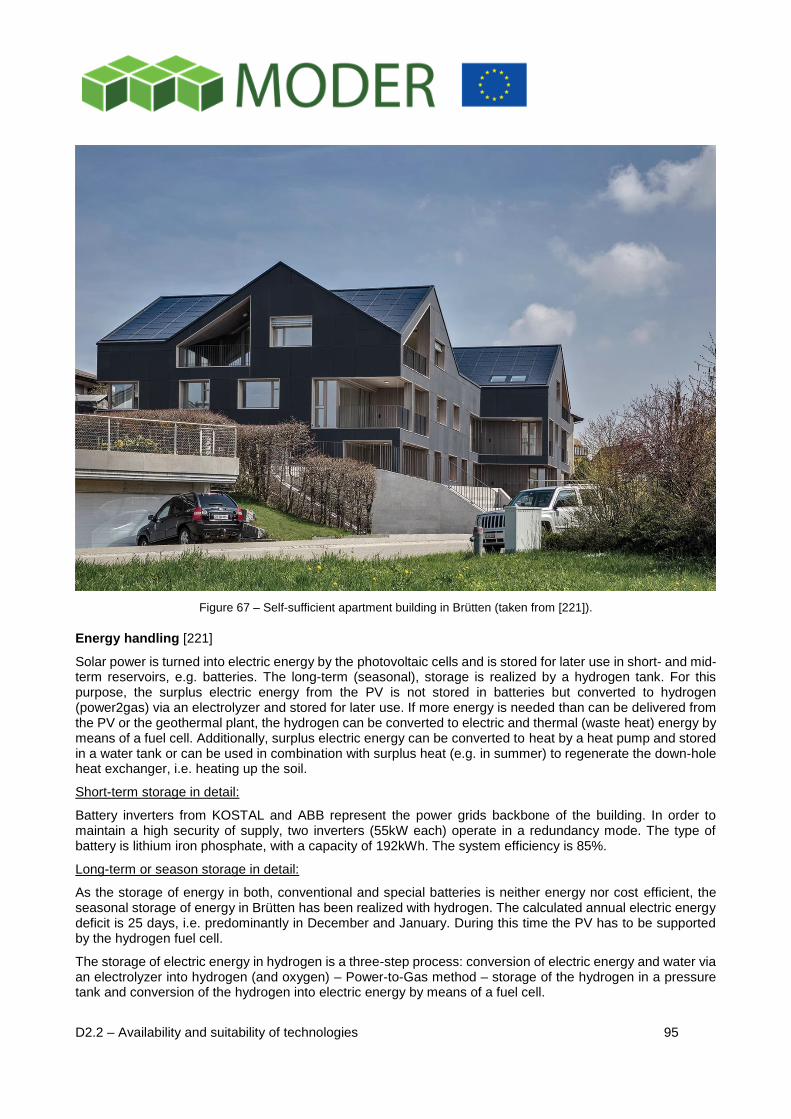
D2.2 – Availability and suitability of technologies 95
Figure 67 – Self-sufficient apartment building in Brütten (taken from [221]).
Energy handling [221]
Solar power is turned into electric energy by the photovoltaic cells and is stored for later use in short- and mid-term reservoirs, e.g. batteries. The long-term (seasonal), storage is realized by a hydrogen tank. For this purpose, the surplus electric energy from the PV is not stored in batteries but converted to hydrogen (power2gas) via an electrolyzer and stored for later use. If more energy is needed than can be delivered from the PV or the geothermal plant, the hydrogen can be converted to electric and thermal (waste heat) energy by means of a fuel cell. Additionally, surplus electric energy can be converted to heat by a heat pump and stored in a water tank or can be used in combination with surplus heat (e.g. in summer) to regenerate the down-hole heat exchanger, i.e. heating up the soil.
Short-term storage in detail:
Battery inverters from KOSTAL and ABB represent the power grids backbone of the building. In order to maintain a high security of supply, two inverters (55kW each) operate in a redundancy mode. The type of battery is lithium iron phosphate, with a capacity of 192kWh. The system efficiency is 85%.
Long-term or season storage in detail:
As the storage of energy in both, conventional and special batteries is neither energy nor cost efficient, the seasonal storage of energy in Brütten has been realized with hydrogen. The calculated annual electric energy deficit is 25 days, i.e. predominantly in December and January. During this time the PV has to be supported by the hydrogen fuel cell.
The storage of electric energy in hydrogen is a three-step process: conversion of electric energy and water via an electrolyzer into hydrogen (and oxygen) – Power-to-Gas method – storage of the hydrogen in a pressure tank and conversion of the hydrogen into electric energy by means of a fuel cell.
D2.2 – Availability and suitability of technologies 96
In Brütten, the electrolyzer works with a proton-exchange-membrane (PEM) and converts the electric energy via an electrochemical process – the electrolysis of water – into hydrogen. The electrolyzer (type: H2m) with a solid electrolyte cell is best suited for fluctuating RES – smooth operation between 0 to 100% and short response time (fraction of seconds). The electrolyzer has to be cooled and thus produces waste heat in addition.
Technical summary electrolyzer:
Provider: Diamond Lite S.A. Producer: Proton OnSite (USA) Type: HOGEN H2/PEM electrolyzer Power (electric): 14.5 kW (consumption) Output: 2 Nm3/h hydrogen (30 bar) Power (thermal): 8 kW @ 35 °C
The hydrogen is directly stored, i.e. without any further compression at 30 bar in underground storage tanks. At this juncture, different pressures or above ground tanks are possible. Decisive are the locations frame conditions. Both the tanks and the pipework are provided with a safety system.
Technical summary underground storage tanks and pipework:
Provider: Messer AG Producer tank: ELKUCH AG Type: special hydrogen tank Volume: 120 m3 Oper. pressure: max. 30 bar Filling pressure: 27.5 bar Tank 1: Length 9.2 m, diameter 2.7 m, weight 17 t, geometrical volume 48,000 l Tank 2: Length 13.5 m, diameter 2.7 m, weight 24 t, geometrical volume 72,000l
The underground storage tanks are made of special hydrogen-prove steel, with a wall thickness of around 2.5 cm. They got an outer plastic coating and an additional cathodic corrosion protection.
Technical summary fuel cell:
Provider: Proton Motor Fuel Cell GmbH Producer: Proton Motor Fuel Cell GmbH Type: PM Cube S 5 Power (electric): 6.2 kW/5.6 kW (continuous) Power (thermal): 5.5 kW (continuous)/60 °C Input pressure: hydrogen @ 2 bar
As the electrolyzer and the fuel cell produce a lot of waste heat, the overall efficiency is only less than around 20% if this heat would not be used to heat, e.g. the building, the water for domestic use, etc.
5.12 BIPV in the railway station Utrecht Centraal, Netherlands
Utrecht Centraal is the central railway station of the city of Utrecht/Netherlands. With sixteen platforms and more than 285,000 passengers per day it is the largest railway station in the Netherlands [222]. With Utrecht being located centrally in the Netherlands, Utrecht Centraal is also the most important railway hub of the country with more than 900 trains leaving this station per day, making it the largest junction station in the Netherlands [223].
Between 2008 and 2016, the station has been reconstructed and refurbished on a grand scale as part of a general reconstruction plan of the Utrecht Station Area focussing on sustainable buildings with low emission, space for bikes, public transport and pedestrians, and last but not least photovoltaic elements on top of the station platforms [224].
These PV modules have been individually designed and produced in laminated safety glass technology – necessary for overhead glazing. The modules are used in a multifunctional manner: in addition to the
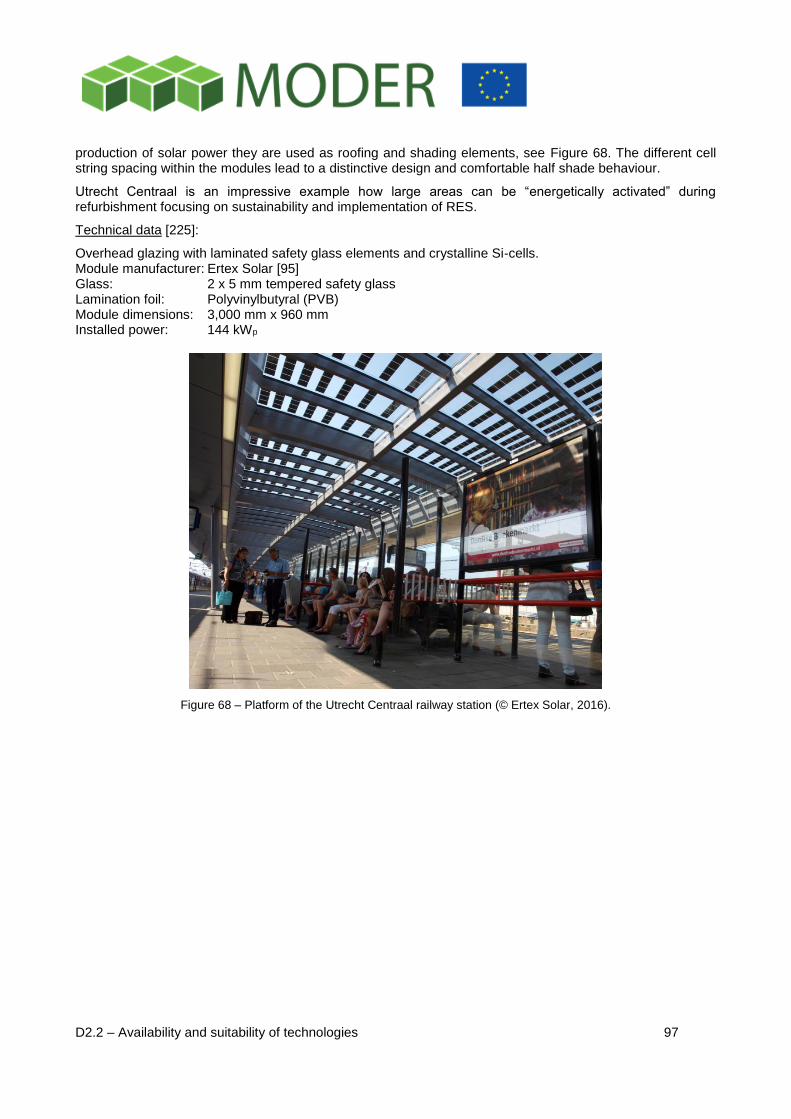
D2.2 – Availability and suitability of technologies 97
production of solar power they are used as roofing and shading elements, see Figure 68. The different cell string spacing within the modules lead to a distinctive design and comfortable half shade behaviour.
Utrecht Centraal is an impressive example how large areas can be “energetically activated” during refurbishment focusing on sustainability and implementation of RES.
Technical data [225]:
Overhead glazing with laminated safety glass elements and crystalline Si-cells. Module manufacturer: Ertex Solar [95] Glass: 2 x 5 mm tempered safety glass Lamination foil: Polyvinylbutyral (PVB) Module dimensions: 3,000 mm x 960 mm Installed power: 144 kWp
Figure 68 – Platform of the Utrecht Centraal railway station (© Ertex Solar, 2016).
D2.2 – Availability and suitability of technologies 98
6 Availability and suitability of technologies and technology combi-nations
The future energy system has to be built on energy technologies with no or very low emissions mainly based on RES combined to well controllable virtual thermal and electrical power systems (i.e. combinations of generation and storage devices). The following bullet points seem to be essential to reach this goal in refurbishment projects of dense urban areas in the context of MODER:
Solar activation of any suitable surface of rooftops, façades, production halls, railway stations, noise protection walls, etc., for the production of solar heat, solar cold and solar electrical power. Free and especially green space is rare and should not be used for energy generation in urban surroundings. Solar activation should be done mainly by using multifunctional solar thermal and photovoltaic elements (building integrated elements) to retrieve synergy effects to other building materials and elements. These active elements can also enable the use of previously overheated flat roofs for leisure purposes for instance.
Replacement of fossil fired heating systems by CHP systems based on RES.
Integration of small wind turbines in the built-up environment at locations where drawbacks of the existing solutions (e.g. vibrations and sound, formation of ice and moving shades) do not matter. This could be done for instance beneath bridges, on production halls, etc.
Introduction or improvement of waste management systems in districts to separate organic from residual waste and production of biogas and bioenergy mainly in rural and suburban areas.
Wherever possible making use of geothermal energy and hydro power.
Wherever possible and meaningful making use of heat from wastewater by implementing in-sewer systems. This will be mainly restricted to cases with major sewer renovations. However, several technology specific questions should be addressed adequately first.
Exploring existing and planned data centers in the considered district as RES for heat, cold and electricity generation.
Energy storage on district level rather than on building level with small storage units.
Interconnection of generation plants and loads by energy grids (mains, DH, DC, gas).
Establishing smart grids for well-balanced energy systems and as door opener for future business models – not only for the electrical grid! Energy generated within a district should be used to a maximum extent within the district itself by intelligent DSM and proper interaction with storage solutions.
Missing energy from outside should be covered by grid-bound energy sources solely.
Table 10 qualitatively summarizes the technical and geographical availability of energy generation and storage technologies and their suitability in urban areas for refurbishment projects. It clearly indicates that
RES technologies and storage solutions are technically available today and
RES technologies (especially solar based technologies) are highly suitable for urban areas in Middle and Northern Europe,
provided that necessary energy grids already exist or will be developed during district refurbishment. Smart grids and smart metering are basic conditions for an appreciable use of RES. Only waste-to-energy plants and biogas storage are technologies suitable for rural and suburban areas rather than for urban space.
As a consequence, great deployment of RES in urban areas is not related to missing technical solutions or geographical incapability but mainly a matter of legal and economic frameworks, as mentioned also in Chapter 4.7, and also a matter of proper system technologies and crosslinking (smart grids). New models are necessary to enable the sale of e.g. electricity to tenants, shared owners or commercial renters on the same or neighbouring real estate sites [226]. As a result of Reference [226], the authors clearly state that comparatively few issues arise from the technical feasibility of the proposed strategies as innovations are paramount.
Table 10 – Availability and suitability of technologies.
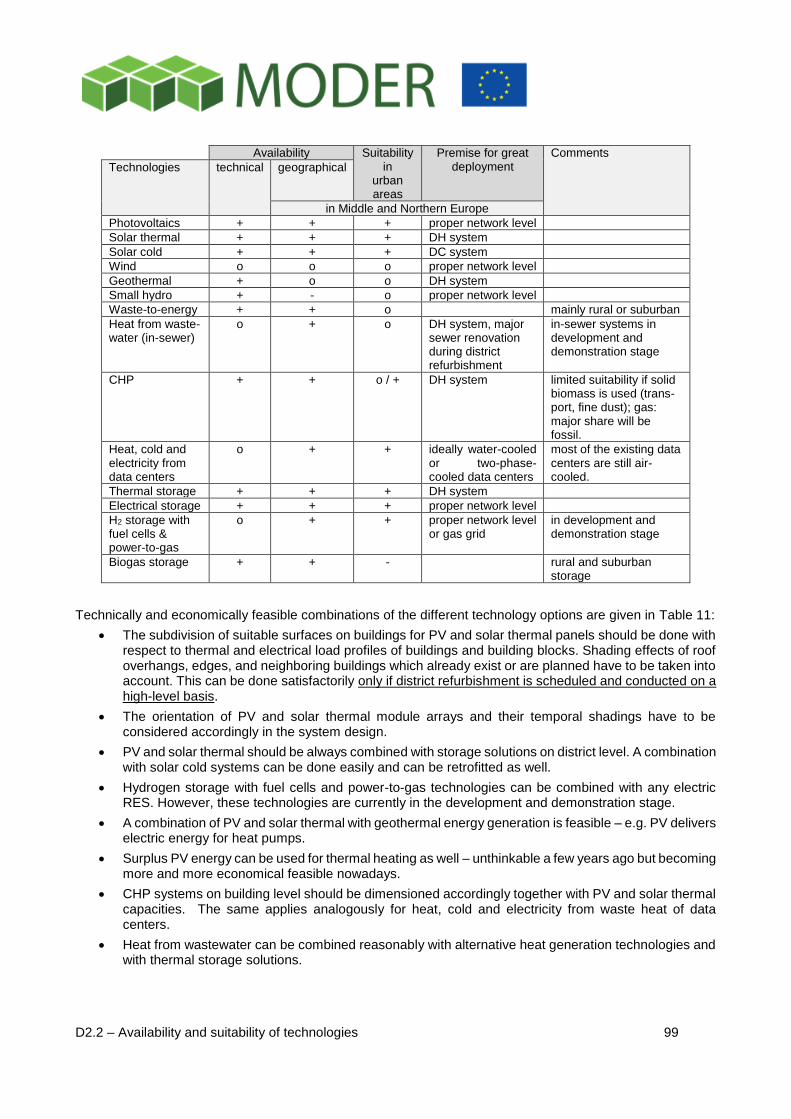
D2.2 – Availability and suitability of technologies 99
Availability Suitability in
urban areas
Premise for great deployment
Comments Technologies
technical geographical
in Middle and Northern Europe
Photovoltaics + + + proper network level
Solar thermal + + + DH system
Solar cold + + + DC system
Wind o o o proper network level
Geothermal + o o DH system
Small hydro + - o proper network level
Waste-to-energy + + o mainly rural or suburban
Heat from waste-water (in-sewer)
o + o DH system, major sewer renovation during district refurbishment
in-sewer systems in development and demonstration stage
CHP + + o / + DH system limited suitability if solid biomass is used (trans-port, fine dust); gas: major share will be fossil.
Heat, cold and electricity from data centers
o + + ideally water-cooled or two-phase-cooled data centers
most of the existing data centers are still air-cooled.
Thermal storage + + + DH system
Electrical storage + + + proper network level
H2 storage with fuel cells & power-to-gas
o + + proper network level or gas grid
in development and demonstration stage
Biogas storage + + - rural and suburban storage
Technically and economically feasible combinations of the different technology options are given in Table 11:
The subdivision of suitable surfaces on buildings for PV and solar thermal panels should be done with respect to thermal and electrical load profiles of buildings and building blocks. Shading effects of roof overhangs, edges, and neighboring buildings which already exist or are planned have to be taken into account. This can be done satisfactorily only if district refurbishment is scheduled and conducted on a high-level basis.
The orientation of PV and solar thermal module arrays and their temporal shadings have to be considered accordingly in the system design.
PV and solar thermal should be always combined with storage solutions on district level. A combination with solar cold systems can be done easily and can be retrofitted as well.
Hydrogen storage with fuel cells and power-to-gas technologies can be combined with any electric RES. However, these technologies are currently in the development and demonstration stage.
A combination of PV and solar thermal with geothermal energy generation is feasible – e.g. PV delivers electric energy for heat pumps.
Surplus PV energy can be used for thermal heating as well – unthinkable a few years ago but becoming more and more economical feasible nowadays.
CHP systems on building level should be dimensioned accordingly together with PV and solar thermal capacities. The same applies analogously for heat, cold and electricity from waste heat of data centers.
Heat from wastewater can be combined reasonably with alternative heat generation technologies and with thermal storage solutions.
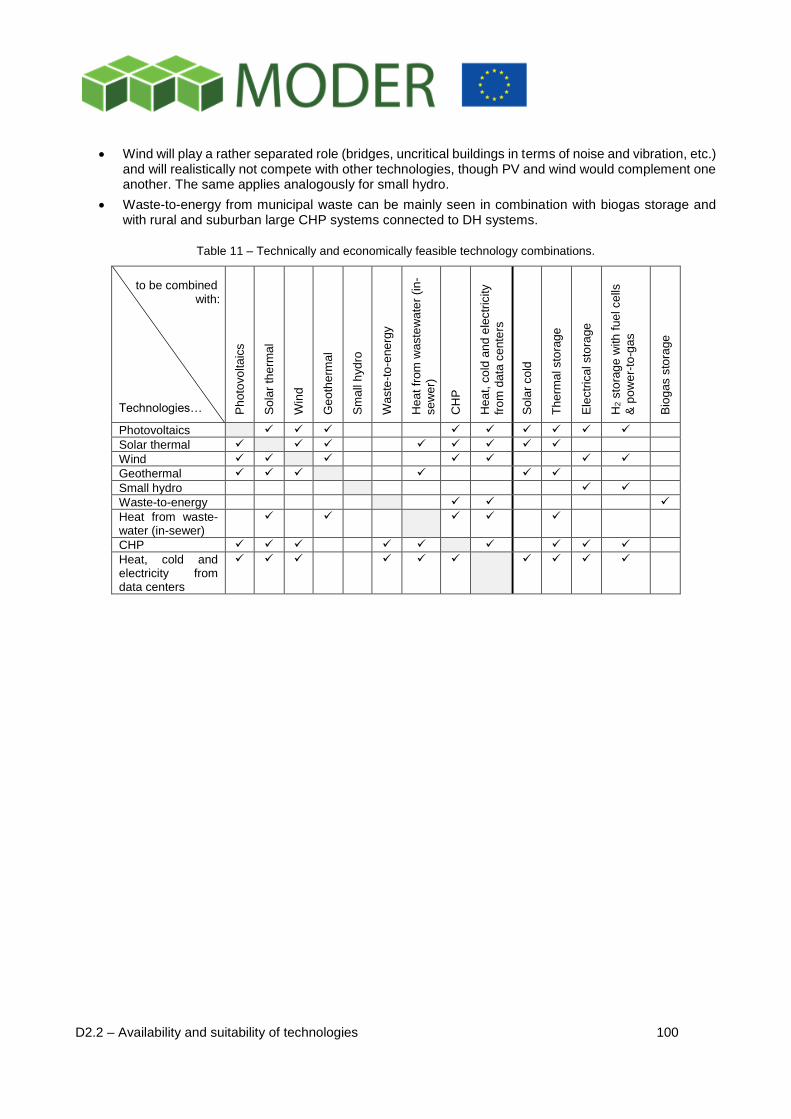
D2.2 – Availability and suitability of technologies 100
Wind will play a rather separated role (bridges, uncritical buildings in terms of noise and vibration, etc.) and will realistically not compete with other technologies, though PV and wind would complement one another. The same applies analogously for small hydro.
Waste-to-energy from municipal waste can be mainly seen in combination with biogas storage and with rural and suburban large CHP systems connected to DH systems.
Table 11 – Technically and economically feasible technology combinations.
to be combined with:
Technologies… Ph
oto
vo
lta
ics
So
lar
the
rma
l
Win
d
Ge
oth
erm
al
Sm
all
hyd
ro
Wa
ste
-to
-ene
rgy
He
at
from
wa
ste
wa
ter
(in
-
se
we
r)
CH
P
He
at,
co
ld a
nd
ele
ctr
icity
fro
m d
ata
ce
nte
rs
So
lar
co
ld
Th
erm
al sto
rag
e
Ele
ctr
ical sto
rage
H2 s
tora
ge
with
fue
l ce
lls
& p
ow
er-
to-g
as
Bio
gas s
tora
ge
Photovoltaics
Solar thermal
Wind
Geothermal
Small hydro
Waste-to-energy
Heat from waste-water (in-sewer)
CHP
Heat, cold and electricity from data centers
D2.2 – Availability and suitability of technologies 101
7 Conclusion
Research on available and suitable energy technologies and related case studies clearly indicated the plurality of energy solutions based on RES in urban areas. However, in contrast to areas of urban development projects where energy options can be considered nearly unrestricted, not all of them are suitable in any case in built-up areas with high densities of existing buildings (possibly partially listed) and valuable green areas.
In the following we want to conclude the findings of this work on refurbishment at urban district level as pointed statements:
We suggested the MODER approach for identifying and selecting potential energy system solutions for urban areas. This approach includes the steps 1) figure out the current and future energy demand and supply profile, 2) options for matching future demand and supply profiles, 3) identify potential technologies, and 4) assess solutions and find the right combination accordingly to synergies and key performance indicators.
The following RES technologies turned out to be of high interest in the context of MODER since they are available today as large-scale solutions suitable for built-up areas: Photovoltaics and solar thermal, wind energy (especially small wind turbines), waste-to-energy and biogas, combined heat and power plants (CHP), heat from wastewater, energy recovery from waste heat generated by big data centers, and cooling technologies combined with PV or solar thermal. Other RES technologies, such as small hydropower and geothermal (especially deep geothermal heat, partially in combination with heat pumps), are available as well. However, in our opinion they will play a minor role for district level refurbishment of buildings in a general view but should be implemented wherever possible and feasible.
Especially direct harvesting of solar energy via solar activation of existing building surfaces with solar thermal and PV modules proves to be particularly suitable for building and district refurbishment:
o Enough solar irradiation is available almost everywhere in the inhabited world.
o Decentralized and centralized systems and integration into energy grids are possible and sizes can be scaled from small to huge dimensions.
o Well-developed technologies are available with the possibility of economical systems without subsidies.
o Modules, especially for PV, exist in a vast variety of dimensions, colors and technical para-meters and can be used as both building added and building integrated panels – the latter with synergy potentials to conventional building materials and predestined for refurbishment of building envelopes. Building integrated solutions should be favored in general to minimize the material usage for refurbishment.
o High acceptance of citizens: no emissions of sound, vibrations or exhaust and no (visible) moving parts, possibility of aesthetical solutions, no consumption of free or green space.
o Combination with solar cooling technologies, heat pumps and CHP systems is possible.
Mounting of PV and solar thermal modules has to be coordinated with the shading situation owing to nearby buildings or planned changes (e.g. future heightening of buildings) – “thinking big” at district level including future modifications of adjacent buildings.
Small wind turbines for urban environments are available and should be placed at locations where the drawbacks (like vibrations, ice fall and moving shades) do not matter, e.g. beneath bridges, on production halls, etc.
Biogas and waste-to-energy plants should be placed in suburban and rural areas (e.g. beside production sites of the food industry, like breweries) with a good infrastructure. The preferred and most economical way for the production of biogas in the context of urban areas is based on organic waste as substrate. Biogen waste from kitchens, grass, waste and by-products from the food industry “arise” in urban areas and require highly developed waste management systems. For a resource-efficient use of biogas we recommend biogas upgrading and injection into the gas grid (or using it for the public traffic, like buses) and the use in CHP plants with the possibility of nearly 100% use of the generated heat over the whole year (e.g. nearby breweries or DH system).
D2.2 – Availability and suitability of technologies 102
Replacement of fossil fired heating systems by heat driven CHP systems based on RES. For rather small CHP systems (e.g. in multiple dwelling buildings) we recommend solutions based on the ORC process due to low maintenance costs, high degree of automation and no need for a boiler supervisor. The connection of buildings to DH systems is preferable, however, since small CHP systems based on solid biomass lead to additional traffic and fine dust.
If major sewer renovations are planned, the use of in-sewer heat recovery system from wastewater should be assessed, including water authorities and wastewater utility operators (such as wastewater treatment plant operators) in the decision process.
Exploration of big existing and planned data centers as renewable energy source for heat, cold and electricity generation and, if possible and reasonable, integration into DH and DC networks.
Fluctuating RES such as solar energy harvesting and wind energy necessitate thermal and electrical storage solutions to decouple energy supply and demand and allow for a high self-consumption of the produced energy. Thermal and especially electrical storage should be realized on district level rather than on building level. Hydrogen storages solutions with fuel cells, direct injection into the gas grid and power-to-gas technologies are upcoming and adequate options for urban areas. Biogas storage technologies are suitable for rural and suburban areas.
Combination of PV, solar thermal/cold, CHP and geothermal wherever possible.
Interconnection of RES plants and loads by energy grids and establishing smart grids for well-balanced energy systems – energy generated within a district should be used to a maximum extent within the district itself by intelligent DSM and proper interaction with storage solutions. Missing energy from outside should be brought to a minimum and covered by grid-bound energy sources solely.
D2.2 – Availability and suitability of technologies 103
8 References
[1] "Roadmap to a Resource Efficient Europe," European Comission, COM(2011) 571.
[2] "Climate Change 2007: Synthesis Report," Contribution of Working Groups I, II and III to the Fourth Assessment. Report of the Intergovernmental Panel on Climate Change. Edited by Core Writing Team, Pachauri, R.K., Reisinger, A. Geneva: IPCC, 2007.
[3] IPCC, "Climate Change 2007: Mitigation of Climate Change," Contribution of Working Group III to the 4th Assessment Report of the Intergovernmental Panel on Climate Change. Edited by Metz, B., Davidson, O.R., Bosch, P.R., Dave, R., Meyer, L.A. Cambridge, 2007, Cambridge International Journal of Sustainable Engineering 13. Downloaded by [VTT] at 05:47 05 August 2014 University Press. http://www.ipcc.ch/publications_and_data/ar4/wg3/en/contents.html.
[4] M. Sunikka-Blank, J. Chen, J. Britnell and D. Dantsiou, "Improving Energy Efficiency of Social Housing Areas: A Case Study of a Retrofit Achieving an “A” Energy Performance Rating in the UK," European Planning Studies, vol. 20, no. 1, 2012.
[5] T. Häkkinen (Ed.), Sustainability and performance assessment and benchmarking of buildings, Final report, 2012. VTT, Espoo.409 p. + app. 49 p. VTT Technology: 72. ISBN 978-951-38-7908-2. URL: http://www.vtt.fi/publications/index.jsp.
[6] T. Häkkinen (Ed.), Sustainable refurbishment of exterior walls and building facades, Final report 2012, Part A - Methods and recommendations. VTT,Espoo.303 p. + app. 40 p. VTT Technology 30. ISBN 978-951-38-7845-0. URL: http://www.vtt.fi/publications/index.jsp.
[7] P. Tuominen, K. Klobut, A. Tolman, A. Adjei and M. de Best-Waldhober, "Energy savings potential in buildings and overcoming market barriers in member states of the European Union.," Energy and Buildings, vol. 51, pp. 48-55, 2012.
[8] J. M. Cansino, M. del P. Pablo-Romero, R. Román and R. Yñiguez, "Promoting renewable energy sources for heating and cooling in EU-27 countries," Energy Policy, vol. 39, no. 6, p. 3803–3812, 2011.
[9] M. Singh, S. Mahapatra and T. J., "An analysis on energy efficiency initiatives in the building stock of Liege, Belgium," Energy Policy, September 2013.
[10] R. McKenna, E. Merkel, D. Fehrenbach, S. Mehne and W. Fichtner, "Energy efficiency in the German residential sector: A bottom-up building-stock-model-based analysis in the context of energy-political targets," Building and Environment, vol. 62, p. 77–88, 2013.
[11] J. Atkinson, T. Jackson and E. Mullings-Smith, "Market influence on the low carbon energy refurbishment of existing multi-residential buildings," Energy policy, vol. 37, p. 2582–2593, 2009.
[12] L. Perez-Lombard, J. Ortiz, R. González and I. R. Maestre, "A review of benchmarking, rating and labelling concepts within the framework of Building energy cerfication schemes," Energy and Buildings, vol. 41, pp. 272 - 278, 2009.
[13] M. Pitt, M. Tucker, M. Riley and J. Longden, "Towards sustainable construction: promotion and best practices," Construction Innovation, vol. 9, pp. 201-224, 2009.
[14] P. Tuominen, J. Forström and J. Honkatuli, "Economic effects of energy efficiency improvements in the Finnish building stock," Energy Policy, vol. 52, pp. 181-189, 2013.
[15] C. McGilligan, M. Sunikka-Blank and S. Natarajan, "Subsidy as an agent to enhance the effectiveness of the energy performance certificate," Energy Policy, vol. 38, no. 3, pp. 1272-1287, 2009.
[16] T. Häkkinen, M. Rekola, M. Ala-juusela and A. Ruuska, "Role of municipal steering in sustainable building and refurbishment , 5-7 October 2016," in SBE16 Tallinn and Helsinki Conference; Build Green and Renovate Deep, Tallinn and Helsinki 12 p., 5-7 October 2016.
[17] J. Hoff and B. Strobel, "A Municipal ‘Climate Revolution’? The Shaping of Municipal Climate Change Policies," The Journal of Transdisciplinary Environmental Studies, vol. 12, no. 1, pp. 3-14, 2013.
[18] K. Sperling, F. Hvelplund and B. Vad Mathiesen, "Centralisation and decentralisation in strategic municipal energy planning in Denmark," Energy Policy, vol. 39, pp. 1338-1351, 2011.
[19] L. Mattsson, Selvitys kuntien ilmastotyöstä. Suomen Kuntaliitto, Helsinki, 2012. [Online]. Available: http://www.kunnat.net/fi/asiantuntijapalvelut/ymparisto/ilmastonmuutos/Documents/Selvitys%20kuntien%20ilmastoty%C3%B6st%C3%A4.pdf. [Accessed 15 September 2014].
[20] M. Ala-Juuselaa, T. Crosbie and M. Hukkalainena, "Defining and operationalising the concept of an energy positive neighbourhood," Energy Conversion and Management, 2016 (in press).
D2.2 – Availability and suitability of technologies 104
[21] NeZeR, "Report on environmental and economic advantages of NZEBR compared to traditional renovation," 2016. [Online]. Available: http://www.nezer-project.eu/download/18.7e136029152c7d48c207e8/1458051463769/D3.1+Report+on+technical+and+social+feasibility+studies_revisedFinal.pdf. [Accessed 29 August 2016].
[22] EN ISO 14040:2006 - Environmental Management. Life Cycle Assessment. Principles and Framework. ISO/TS 207/SC 5, International Organization for Standardization, Geneva, Switzerland.
[23] ISO 14044: 2006 - Environmental Management. Life Cycle Assessment. Requirements and Guidelines.
[24] A. Ruuska and T. Häkkinen, "The significance of various factors for GHG emissions of buildings," International Journal of Sustainable Engineering, no. 10.1080/19397038.2014.934931, 2014.
[25] J. Van Roy et al., "Thermal and Electrical Cover Factors: Definition and Application for Net-Zero Energy Buildings," CLIMA 2013. [Online]. Available: https://lirias.kuleuven.be/bitstream/123456789/403431/1/Paper_JuanVanRoy.pdf. [Accessed 30 August 2016].
[26] J. Salom et al., "Understanding net zero energy buildings: evaluation of load matching and grid integration indicators," Proceedings of building simulation 2011. 12th conf. of Int. Building Performance Simulation Association, Sydney 2011, http://doi.org/ISBN: 9870646565101.
[27] ISO 15686-5:2008 - Buildings and constructed assets. Life-cycle costing.
[28] EN 16627:2014 - Sustainability of construction works - Assessment of economic performance of buildings - Calculation methods.
[29] EC2012, Commission Delegated Regulation (EU) No 244/2012 of 16 January 2012 supplementing Directive 2010/31/EU of the European Parliament and of the Council.
[30] K. Hartunga and T. Kiss, "Time for change! Decentralized wind energy system on the Hungarian market," 2013.
[31] "Solar District Heating," [Online]. Available: http://solar-district-heating.eu. [Accessed 2 August 2016].
[32] FfE - Forschungsstelle für Energiewirtschaft e.V., "Merit Order für ein zukunftsfähiges Energiesystem," in Tagungsband zur FfE-Fachtagung 2015, 2015.
[33] R. Corradini, "Erneuerbare Energien im Wärmesektor - Stärken und Schwächen der Technologien," in Cluster meeting "Solarthermie im Nahwärmenetz", München, 2016.
[34] International Energy Agency, "Cities, Towns & Renewable Energy," IEA Publications, Paris, 2009.
[35] S. Föste, "Solarthermische Kollektoren: Marktübersicht und Enwicklungstrends," in Cluster meeting "Solarthermie im Nahwärmenetz", München, 2016.
[36] "Flat Plate Collector," [Online]. Available: http://gogreenheatsolutions.co.za/?q=project-type/solar-water-heating/flat-plate-collector. [Accessed 2 August 2016].
[37] "Solar Hot Water - Evacuated Tubes," [Online]. Available: http://www.clearchain.com/blog/posts/solar-hot-water-evacuated-tubes-apricus-vs-hills. [Accessed 2 August 2016].
[38] Paradigma Deutschland GmbH, "Vakuum-Röhrenkollektor: Technik und Wirkungsgrade," [Online]. Available: http://www.paradigma.de/vakuum-roehrenkollektor. [Accessed 22 August 2016].
[39] R. Pauschinger, "Konzepte zur Integration solarthermischer Großanlagen in Nah- und Fernwärmesysteme," in Cluster meeting "Solarthermie im Nahwärmenetz", München, 2016.
[40] C. Stadler, "Wir ernten die Sonne," in Cluster meeting "Solarthermie im Nahwärmenetz", München, 2016.
[41] P. Reiter, Interviewee, Solarthermie und Projekt BIG Solar Graz. [Interview]. 17 August 2016.
[42] F. Mauthner, W. Weiss and M. Spörk-Dür, "Solar Heat Worldwide," 2016.
[43] Solites, "SDH Tool," [Online]. Available: www.sdh-online.solites.de. [Accessed 16 August 2016].
[44] K. deBruyn, S. Fritz, M. Furtlehner and P. Hengstschläger, "Gebäudeübergreifender Energieaustausch: Rechtliche und wirtschaftliche Rahmenbedingungen und Einflussfaktoren," bmvit, Vienna, 2015.
[45] M. Amtmann, A. Lechner, T. Mach, T. Selke and B. Unterberger, "Solarenergie Urban - Analyse und Bewertung der energetischen, ökonomischen und architektonischen Qualität urbaner Solarenergiebauten," bmvit, Vienna, 2012.
D2.2 – Availability and suitability of technologies 105
[46] Hessisches Ministerium für Wirtschaft, Energie, Verkehr und Landesentwicklung (HMWEVL), "Energieland Hessen," [Online]. Available: http://www.energieland.hessen.de/solar-kataster. [Accessed 2 September 2016].
[47] "Solarpotenzialkataster," [Online]. Available: https://www.wien.gv.at/stadtentwicklung/stadtvermessung/geodaten/solar/. [Accessed 22 August 2016].
[48] Statistik Austria, "Bilanz der Elektrischen Energie 1970 bis 2014 (Überblick)," 2016.
[49] Agency for geothermal power engineering (sk),Association Française des professionnels de la géothermie (FR),Consorzio per lo Sviluppo delle Aree Geotermiche (IT),European Geothermal Energy Council (EU),Gemeente Heerlen (NL),Grøn Energi (DK),Magyar Földtani és Geofizikai Intézet (HU),Instytut Gospodarki Surowcami Mineralnymi i Energią (PL),Slovensko društvo za daljinsko energetiko (SI),Union of Bulgaria, "www.geodh.eu/wp-content/uploads/2012/07/GeoDH-Report-2014_web.pdf," [Online]. Available: http://geodh.eu/wp-content/uploads/2012/07/GeoDH-Report-2014_web.pdf.
[50] "About Geothermal District Heating | GeoDH," [Online]. Available: http://geodh.eu/about-geothermal-district-heating/. [Accessed 2 September 2016].
[51] "Fabbiogas," [Online]. Available: http://www.fabbiogas.eu/en/home/. [Accessed 8 August 2016].
[52] WIKIPEDIA, "Waste-to-energy," 16 08 2016. [Online]. Available: https://en.wikipedia.org/wiki/Waste-to-energy. [Accessed 29 08 2016].
[53] WIKIPEDIA, "Incineration," 12 08 2016. [Online]. Available: https://en.wikipedia.org/wiki/Incineration. [Accessed 29 08 2016].
[54] RenoSam and Rambell , "State of Green," 2006. [Online]. Available: https://stateofgreen.com/files/download/275. [Accessed 29 08 2016].
[55] Umeltberatung Wien, "Restmüll und Abfalltrennung," 2016. [Online]. Available: http://www.umweltberatung.at/restmuell-und-abfalltrennung. [Accessed 29 08 2016].
[56] WIKIPEDIA, "Müllverbrennungsanlage Spittelau," 17 07 2016. [Online]. Available: https://de.wikipedia.org/wiki/M%C3%BCllverbrennungsanlage_Spittelau. [Accessed 29 08 2016].
[57] "Council Directive 1999/31/EC," on the landfill of waste, 26 April 1999.
[58] M. Schweigkofler and R. Niessner, "Removal of siloxanes in biogases," Journal of Hazardous Materials, vol. B83, p. 183–196, 2001.
[59] “Entwicklung von Biogas in Österreich,” 07 07 2014. [Online]. Available: http://www.klimaaktiv.at/erneuerbare/biogas/EntwicklungBiogasAT.html. [Accessed 25 08 2016].
[60] G. Pesta and K. Niederschweiberer, “Most Promising Branches in the Food and Beverage Industry,” Freising, 2015.
[61] C. Lampert, H. Reisinger and G. Zethner, "Bioabfallstrategie," Ministerium für ein lebenswertes Österreich, Wien, 2014.
[62] FAB Biogas, "BIOGAS PRODUCTION AND BIOGAS POTENTIALS FROM RESIDUES OF THE EUROPEAN FOOD AND BEVERAGE INDUSTRY - Austria".
[63] ARGE ECO.in, "Über die Erschließung des Potenzials biogener Haushaltsabfälle und Grünschnitt zum Zwecke der Verwertung in Biogasanlage zur optimierten energetischen und stofflichen Verwertung.," Bundesministerium für Land- und Forstwirtschaft, Umwelt und Wasserwirtschaft, Wien, 2011.
[64] Bundesministerium für Wissenschaft, Forschung und Wirtschaft, "Energiestatus 2016," bmwfw, Wien, 2016.
[65] A. Stenmarck, C. Jensen, T. Quested and G. Moates, "Estimates of European food waste levels," European commission, Stockholm, 2016.
[66] Hornbachner, Hutter and Moor, "Biogas-Netzeinspeisung," BM VIT, Wien, 2008.
[67] F. Strippel, C. Findeisen, F. Hoffmann, L. Wagner and D. Wilken, "Biowaste to Biogas," Fachverband Biogas e.V., Germany, 2016.
[68] Braun-Unkhoff, "Technical Evaluation of decentralized Houshold biogas digesters.," 23th European Biomass Conference,, Vienna Austria, 2015.
[69] ORION, "ORGANIC WASTE MANAGEMENT BY A SMALL-SCALE INNOVATIVE AUTOMATED SYSTEM OF ANAEROBIC DIGESTION.," [Online]. Available: www.project-orion.eu Zugrif. [Accessed 30 06 2016].
D2.2 – Availability and suitability of technologies 106
[70] Fachagentur Nachwachsende Rohstoffe e. V. (FNR), "Leitfaden Biogas," Fachagentur Nachwachsende Rohstoffe e. V. (FNR), Rostock, 2013.
[71] F. Kretschmer, L. Simperler and T. Ertl, "Analysing wastewater temperature development in a sewer system as a basis for the evaluation of wastewater heat recovery potentials," Energy and Buildings, vol. 128, p. 639–648, 2016.
[72] G. Neugebauer, F. Kretschmer, R. Kollmann, M. Narodoslawsky, T. Ertl and G. Stoeglehner, "Mapping Thermal Energy Resource Potentials from Wastewater Treatment Plants," Sustainability, vol. 7, pp. 12988-13010, 2015.
[73] L. Mikkonen, J. Rämö, R. L. Keiski and E. Pongrácz, "Heat recovery from wastewater: Assessing the potential in northern areas," [Online]. Available: http://nortech.oulu.fi/pdf/Lauri%20article_WaResConf.pdf. [Accessed 4 October 2016].
[74] O. Wanner, V. Panagiotidis, P. Clavadetscher and H. Siegrist, "Effect of heat recovery from raw wastewater on nitrification and nitrogen removal in activated sludge plants," Water Res., vol. 39, p. 4725–4734, 2005.
[75] D. Dürrenmatt and O. Wanner, "A mathematical model to predict the effect of heat recovery on the wastewater temperature in sewers," Water Res., vol. 48, p. 548–558, 2014.
[76] J. A. Elías-Maxil, J. P. van der Hoek, J. Hofman and L. Rietveld, "Energy in the urban water cycle: Actions to reduce the total expenditure of fossil fuels with emphasis on heat reclamation from urban water," RenewableandSustainableEnergyReviews, vol. 808–820, p. 808–820, 2014.
[77] B. Haberkern, W. Maier and U. Schneider, "Steigerung der Energieeffizienz auf Kommunalen Kläranlagen (Enhanced Energy Efficiency in Waste Water Treatment Plants)," Federal Environmental Agency: Dessau-Roßlau, Germany, p. 196–202, 2008.
[78] H. Fechner, C. Mayr, A. Schneider, M. Rennhofer and G. Peharz, "Technologie-Roadmap für Photovoltaik in Österreich," Österreichisches Bundesministerium für Verkehr, Innovation und Technologie (bmvit), 2016.
[79] H. Wirth, "Fraunhofer ISE 2015, Aktuelle Fakten zur Photovoltaik in Deutschland," Fraunhofer ISE, 2015.
[80] International Energy Agency (IEA), "Technology Roadmap - Solar photovoltaic energy," [Online]. Available: https://www.iea.org/publications/freepublications/publication/pv_roadmap.pdf. [Accessed 16 August 2016].
[81] International Energy Agency (IEA), "Renewable Energy - Medium-Term Market Review 2014," [Online]. Available: https://www.iea.org/Textbase/npsum/MTrenew2014sum.pdf. [Accessed 16 August 2016].
[82] "International Enertgy Agency - Photovoltaic Power Systems Programme," [Online]. Available: http://www.iea-pvps.org/. [Accessed 16 August 2016].
[83] [Online]. Available: http://www.nrel.gov/pv/. [Accessed 16 08 2016].
[84] Fraunhofer Institute for Solar Energy Systems (ISE) with support of PSE AG, "Photovoltaics Report," Freiburg, 2016.
[85] PVAustria, MA20 and nfsol, "Photovoltaik-Eigenverbrauchsrechner," [Online]. Available: http://pvaustria.at/sonnenklar_rechner/. [Accessed 2 September 2016].
[86] A. Lohse, "Sunpower erreicht Modulwirkungsgrad von 24,1 Prozent," Photon - Das Solarstrom-Magazin, August 2016.
[87] A. Kreutzmann, "Hoffen auf Perowskite," Photon - Das Solarstrom-Magazin, Oktober 2014.
[88] A. Kreutzmann, "Mit geballter Forschungskraft," Photon - Das Solarstrom-Magazin, July 2016.
[89] EN 50583-2:2016 - Photovoltaics in buildings. BIPV systems, 2016.
[90] C. Erban, "Photovoltaik im Gebäudebereich - neue normative Grundlagen," in 12. Workshop "Photovoltaik-Modultechnik", TÜV Rheinland, Cologne, 2015.
[91] "Directive 2010/31/EU," of the European Parliament and of the Council on the energy performance of buildings , 19 May 2010.
[92] B. P. Jelle, "Building Integrated Photovoltaics: A Concise Description of the Current State of the Art and Possible Research Pathways," Energies, vol. 9, no. 1, 2016.
[93] "How do solar panels work?," [Online]. Available: http://www.altenergy.org/renewables/solar/solartechnolgy.html. [Accessed 10 September 2016].
[94] "BIPV | Lumen Solar LLC News," [Online]. Available: https://lumensolar.wordpress.com/tag/bipv/. [Accessed 2 September 2016].
D2.2 – Availability and suitability of technologies 107
[95] Ertex Solartechnik GmbH, "Gebäudeintegrierte Photovoltaik, Austria - ertex-solar," [Online]. Available: http://www.ertex-solar.at. [Accessed 5 September 2016].
[96] "Solarfassaden: Sonnenenergienutzung in der Senkrechten," [Online]. Available: http://www.solarserver.de/solarmagazin/artikelapril2003.html. [Accessed 2 September 2016].
[97] "PV potential estimation utility," [Online]. Available: http://re.jrc.ec.europa.eu/pvgis/apps4/pvest.php?lang=en&map=europe. [Accessed 22 August 2016].
[98] "Photovoltaic and Solar Software," [Online]. Available: http://www.valentin-software.com/en. [Accessed 22 August 2016].
[99] "PVsyst - Photovoltaic Software," [Online]. Available: http://www.pvsyst.com/en/. [Accessed 22 August 2016].
[100] "Joint Research Centre - Institute for Energy and Transport (IET), European Commission," [Online]. Available: http://re.jrc.ec.europa.eu/pvgis/. [Accessed 22 August 2016].
[101] "Ausrichtung von Solaranlagen," [Online]. Available: http://www.baunetzwissen.de/standardartikel/Solar-Ausrichtung-von-Solaranlagen_165604.html. [Accessed 2 September 2016].
[102] Bloomberg New Energy finance, "Levelised Cost of Electricity Update for the second half of 2015," 2015.
[103] I. Pawel, M. Kirschner and D. Hornbachner, "Ökonomische Transparenz in der GIPV – Konzept, Modell und Oline-Tool," in 26. Sypmosium "Photovoltaische Solarenergie", Bad Staffelstein, 2011.
[104] "Efficiency Calculator," [Online]. Available: http://www.solarfassade.info/en/calculator/. [Accessed 2 September 2016].
[105] "WINEUR - Wind Energy Integration in the Urban Environment," Intelligent Energy – Europe (IEE), EIE/04/130/S07.38591, 2007.
[106] "Wineur Project," [Online]. Available: http://www.urbanwind.net. [Accessed 12 July 2016].
[107] "Turbina.de," [Online]. Available: http://www.turbina.de. [Accessed 12 July 2016].
[108] "Catalogue of European Urban Wind Turbine Manufacturers," [Online]. Available: http://www.urbanwind.net/downloads.html. [Accessed 12 July 2016].
[109] J. Twele, "Empfehlungen zum Einsatz kleiner Windenergieanlagen im urbanen Raum – Ein Leitfaden," HTW Berlin, 2013.
[110] " IEA Wind and Task 27," [Online]. Available: http://www.ieawind.org/task_27_home_page.html. [Accessed 12 July 2016].
[111] Urban wind energy – Development of methods for the assessment of small wind turbines in urban areas, ongoing Austrian project, FFG ID 845184.
[112] M. Ragheb, "Wind Turbines in the Urban Environment," 2014.
[113] K. Leonhartsberger, Interviewee, Wind energy in urban environments. [Interview]. 21 July 2016.
[114] "Windatals Österreich," [Online]. Available: http://www.windatlas.at/. [Accessed 21 July 2016].
[115] "Windpotenzialkataster," [Online]. Available: https://www.wien.gv.at/stadtentwicklung/energieplanung/stadtplan/windkraft/. [Accessed 21 July 2016].
[116] "Windrail home," Anerdgy, [Online]. Available: http://www.anerdgy.com/. [Accessed 4 October 2016].
[117] B. Sanner, "Overview of geothermal energy use and development in Europe (power, heat and cold)," 2008. [Online]. Available: http://www.fenercom.com/pdf/informacion/geoner2008/burkhard-sanner-Overview-of-geothermal-energy-use-and-development-in-europe-geoener-2008.pdf. [Accessed 2 September 2016].
[118] G. Holdman, "The Chena Hot Springs 400kW geothermal power plant: experience gained during," 2008. [Online]. Available: http://citeseerx.ist.psu.edu/viewdoc/download?doi=10.1.1.532.6994&rep=rep1&type=pdf. [Accessed 2 September 2016].
[119] S. Quoilin, M. Van Den Broek and S. Declaye, "Techno-economic survey of Organic Rankine Cycle (ORC) systems," Renewable and Sustainable Energy Reviews, Belgium, 2013.
[120] Obernberger, Carlsen and Biedermann, "STATE-OF-THE-ART AND FUTURE DEVELOPMENTS REGARDING SMALL-SCALE BIOMASS CHP SYSTEMS WITH A SPECIAL FOCUS ON ORC AND STIRLING ENGINE TECHNOLOGIES," International Nordic Bioenergy Conference, 2003.
D2.2 – Availability and suitability of technologies 108
[121] Fröling, “Wood combined heat and power CHP 50,” [Online]. Available: http://www.froeling.com/en/products/waerme-und-strom/neu-holzverstromungsanlage-chp-50.html. [Accessed 12 09 2016].
[122] Rebhan, Energiehandbuch, Berlin: Springer, 2002.
[123] BIOS BIOENERGIESYSTEME GmbH, "Strom aus Biomasse," [Online]. Available: http://www.bios-bioenergy.at/de/strom-aus-biomasse/orc-prozess.html. [Accessed 2 September 2016].
[124] Fraunhofer UMSICHT, "ORC Plants 20-120 KWel," [Online]. Available: http://www.umsicht.fraunhofer.de/content/dam/umsicht/en/documents/energy/orc-plants.pdf. [Accessed 4 October 2016].
[125] "ORC-Prozesse zur Abwärmenutzung an BHKW-Motoren," [Online]. Available: http://www.eneff-stadt.info/fileadmin/media/Veranstaltungen/Dateien/Vortraege_Statusseminar_Dezentrale_Energiesysteme_2012/06a_Althaus_ORC.pdf. [Accessed 4 October 2016].
[126] K. Ebrahimi, G. F. Jones and A. S. Fleischer, "A review of data center cooling technology, operating conditions and the corresponding low-grade waste heat recovery opportunities," Renewable and Sustainable Energy Reviews, vol. 31, p. 622–638, 2014.
[127] P. Zhang, B. Wang, W. Wu, W. Shi and X. Li, "Heat recovery from Internet data centers for space heating based on an integrated air conditioner with thermosyphon," Renewable Energy, vol. 80, pp. 396-406, 2015.
[128] T. Brunschwiler, B. Smith, R. E. and M. B., "Toward zero-emission data centers through direct reuse of thermal energy," IBM J Res Dev, vol. 53, no. 3, pp. 1-13, 2009.
[129] C. D. Patel, "A vision of energy aware computing from chips to data centers," Proceedings of ISMME, Tsuchiura, Japan, Dec 1-3, 2003.
[130] S. Greenberg, E. Mill, B. Tschudi, P. Rumsey and B. Myatt, "Best practice for data centers: learned from benchmarking 22 data centers," Proceedings of 14th ACEEE summer study on energy efficiency in buildings, Pacific Grove (CA, USA), August 13-18, 2006.
[131] M. K. Sung and I. Mudawar, "Single-phase and two-phase hybrid cooling schemes for high-heat-flux thermal management of defense electronics," Proceedings of ITHERM 2008, 11h intersociety conference, pp. 121-131, Orlando (FL, USA), May 28-31, 2008.
[132] "Helsinki data centre to heat homes | Environment | The Guardian," 2010. [Online]. Available: https://www.theguardian.com/environment/2010/jul/20/helsinki-data-centre-heat-homes. [Accessed 5 October 2016].
[133] F. Vélez, J. J. Segovia, M. C. Martín, G. Antolín, F. Chejne and A. Quijano, "A technical, economical and market review of organic Rankine cycles for the conversion of low-grade heat for power generation," Renew Sustain Energy Rev, vol. 16, no. 6, pp. 4175-89, 2012.
[134] D. Xu and M. Qu, "Energy, environmental, and economic evaluation of a CCHP system for a data center based on operational data," Energy and Buildings, vol. 67, p. 176–186, 2013.
[135] S.O.L.I.D. Gesellschaft für Solarinstallation und Design mbH, [Online]. Available: http://www.solid.at. [Accessed 1 September 2016].
[136] S. Ishaya, "Solar Cooling - Methods and Applications," [Online]. Available: https://www.usgbc-ncc.org/storage/documents/Presentations/SVB/2011-7-12_solar_thermal_sargon_ishaya.pdf. [Accessed 8 September 2016].
[137] A. Saleh and M. Mosa, "Optimization study of a single-effect water – lithium bromide absorption refrigeration system powered by flat-plate collector in hot regions," Energy Convers Manage, vol. 87, p. 29–36, 2014.
[138] A. Ghafoor and A. Munir, "Worldwide overview of solar thermal cooling technologies," Renewable Sustainable Energy Review, vol. 43, p. 763–774, 2015, http://dx.doi.org/10.1016/j.rser.2014.11.073.
[139] P. Goyal, P. Baredar, A. Mittal and A. Siddiqui, "Adsorption refrigeration technology – an overview of theory and its solar energy applications," Renewable and Sustainable Energy Reviews, vol. 53, p. 1389–1410, 2016.
[140] H. Z. Hassan, "A solar powered adsorption freezer: A case study for Egypt’s climate," International Journal of Energy Engineering, vol. 3, pp. 21-29, 2013.
[141] A. Allouhi, T. Kousksou, A. Jamil, P. Bruel, Y. Mourad and Y. Zeraouli, "Solar driven cooling system: an updated review," Renewable and Sustainable Energy Reviews, vol. 44, p. 159–181, 2015.
[142] R. Best and W. Rivera, "A review of thermal cooling systems," Applied Thermal Engineering, vol. 75, p. 1162–1175, 2015.
D2.2 – Availability and suitability of technologies 109
[143] K. Bataineha and Y. Taamnehb, "Review and recent improvements of solar sorption cooling systems," Energy and Buildings, vol. 128, pp. 22-37, 2016, http://dx.doi.org/10.1016/j.enbuild.2016.06.075.
[144] U. Eicker, D. Pietruschka, M. Haag and A. Schmitt, "Systematic design and analysis of solar thermal cooling systems in different climates," Renewable Energy, vol. 80, p. 827–836, 2015.
[145] U. Eicker, D. Pietruschka, A. Schmitt and M. Haag, "Comparison of photovoltaic and solar thermal cooling systems for office buildings in different climates," Solar Energy, vol. 118, 2015, http://dx.doi.org/10.1016/j.solener.2015.05.018 [ISSN 0038-092X].
[146] International Energy Agency (IEA), "Technology Roadmap Energy Storage," 2014.
[147] DG ENER Working Paper, "The future role and challenges of Energy Storage," [Online]. Available: https://ec.europa.eu/energy/en/topics/technology-and-innovation/energy-storage. [Accessed 1 September 2016].
[148] A. d. Gracia and L. F. Cabeza, "Phase change materials and thermal energy storage for buildings," Energy and Buildings, vol. 103, p. 414–419, 2015.
[149] IEA-ETSAP , IRENA, "Thermal Energy Storage," 2013. [Online]. Available: https://www.irena.org/DocumentDownloads/Publications/IRENA-ETSAP%20Tech%20Brief%20E17%20Thermal%20Energy%20Storage.pdf. [Accessed 11 September 2016].
[150] State of Green - Denmark, "World largest pit storage in Vojens," [Online]. Available: https://stateofgreen.com/en/profiles/ramboll/solutions/world-largest-thermal-pit-storage-in-vojens. [Accessed 26 August 2016].
[151] "Phase-change Materials," [Online]. Available: https://en.wikipedia.org/wiki/Phase-change_material. [Accessed 29 August 2016].
[152] A. Sharma, V. Tyagi, C. Chen and D. Buddhi, "Review on thermal energy storage with phase change materials and applications," Renewable and Sustainable Energy Reviews, vol. 13 (2), p. 318–345, 2009.
[153] L. Cabeza, A. Castell, C. Barreneche, A. d. Gracia and A. Fernández, "Materials used as PCM in thermal energy storage in buildings: a review," Renewable Sustainable Energy Rev., vol. 15, p. 1675–1695, 2001.
[154] K. N’Tsoukpoe, H. Liu, N. L. Pierrès and L. Luo, "A review on long-term sorption solar energy storage," Renewable Sustainable Energy Rev., vol. 13, p. 2385–2396, 2009.
[155] IEC, "White Paper: Electrical Energy Storage," Switzerland, 2011.
[156] "DOE Global Energy Storage Database," [Online]. Available: http://www.energystorageexchange.org/projects/1. [Accessed 1 September 2016].
[157] " Energy Storage Technologies Explained," [Online]. Available: http://energystoragesense.com/energy-storage-technologies/. [Accessed 8 September 2016].
[158] Z. Wen, Y. Hu, X. Wu, J. Han and Z. Gu, "Main Challenges for High Performance NAS Battery: Materials and Interfaces," Advanced Functional Materials, vol. 23 (8), p. 1005, 2013.
[159] Z. Yang et al., "Electrochemical Energy Storage for Green Grid," Chemical Reviews, vol. 111, no. 5, p. 3577–3613, 2011.
[160] P. Alotto, M. Guarnieri and F. Moro, "Redox Flow Batteries for the storage of renewable energy: a review," Renewable & Sustainable Energy Reviews, vol. 29, p. 325–335, 2014.
[161] [Online]. Available: http://energystorage.org/energy-storage/storage-technology-comparisons/flow-batteries. [Accessed 23 August 2016].
[162] X. Luo, J. Wang, M. Dooner and J. Clarke, "Overview of current development in electrical energy storage technologies and the application potential in power system operation," Applied Energy, vol. 137, p. 511–536, 2015.
[163] S. Mekhilef, R. Saidur and A. Safari, "Comparative study of different fuel cell technologies," Renewable and Sustainable Energy Reviews, vol. 16, no. 1, p. 981–989, 2012.
[164] "Hydrogen Powered Generator by Electrolysis," [Online]. Available: http://www.hydrogenics.com/hydrogen-products-solutions/industrial-hydrogen-generators-by-electrolysis/indoor-installation/hylyzer-1-or-2. [Accessed 1 September 2016].
[165] "Silyzer - Hydrogen Solutions - Siemens," [Online]. Available: http://www.industry.siemens.com/topics/global/de/pem-elektrolyseur/silyzer/seiten/silyzer.aspx. [Accessed 1 September 2016].
[166] A. Ozarslan, "Large-scale hydrogen energy storage in salt caverns," International Journal of Hydrogen Energy, vol. 37, no. 19, p. 14265–14277, 2012.
D2.2 – Availability and suitability of technologies 110
[167] J. Hüttenrauch and G. Müller-Syring, "Zumischung von Wasserstoff zum Erdgas," energie | wasser-praxis, October 2010.
[168] "E.ON power-to-gas unit injects hydrogen into natural gas system for first time," [Online]. Available: http://www.greencarcongress.com/2013/06/eon-20130616.html. [Accessed 1 September 2016].
[169] [Online]. Available: http://www.suscon.org/cowpower/biomethaneSourcebook/Chapter_4.pdf.
[170] Ferbelbauer, "Energiespeicher der Zukunft - Energiespeicher für Erneuerbare Energien als Schlüsseltechnologie für die Zukünftigen Energiesysteme," Joanneum Research, 2012.
[171] SATTLER, "Biogas Storage - Sattler Ceno TOP-TEX GmbH," 2016. [Online]. Available: https://www.sattler-global.com/biogas/en/biogas-storage-1030.jsp. [Accessed 02 09 2016].
[172] "Kugelgasbehälter," Wikipedia, [Online]. Available: https://de.wikipedia.org/wiki/Kugelgasbeh%C3%A4lter. [Accessed 16 August 2016].
[173] WIKIPEDIA, "Kugelgasbehälter (Wuppertal)," 8 06 2016. [Online]. Available: https://de.wikipedia.org/wiki/Kugelgasbeh%C3%A4lter_(Wuppertal). [Accessed 20 08 2016].
[174] WIKIPEDIA, "Röhrenspeicher," 8 06 2016. [Online]. Available: https://de.wikipedia.org/wiki/R%C3%B6hrenspeicher. [Accessed 20 08 2016].
[175] RAG Rohöl- Aufsuchungs AG, "Erdgasspeicher," Salzkammergut Media, Gmunden, 2014.
[176] The European technology platform smart grids, "Smart Grids: strategic deployment document for Europe’s electricity networks of the future," 2010. [Online]. Available: http://doi.org/http://www.smartgrids.eu/documents/SmartGrids_SDD_FINAL_APRIL2010.pdf.
[177] GSGF (Global Smart Grid Federation) , "What is the definition of a Smart Grid?," 2016. [Online]. Available: http://www.globalsmartgridfederation.org/smart-grids/. [Accessed 26 August 2016].
[178] D. Kolokotsa, "The role of smart grids in the building sector.," Energy & Buildings, vol. 116, p. 703–708, 2016, http://doi.org/10.1016/j.enbuild.2015.12.033.
[179] J. Chou and N. Ngo, "Automation in Construction Smart grid data analytics framework for increasing energy savings in residential buildings," Automation in Construction, vol. 1–11, 2016, http://doi.org/10.1016/j.autcon.2016.01.002.
[180] M. Waseem, M. Mourshed, D. Mundow and M. Sisinni, "Building energy metering and environmental monitoring – A state-of-the-art review and directions for future research," Energy & Buildings, vol. 120, pp. 85-102, 2016, http://doi.org/10.1016/j.enbuild.2016.03.059.
[181] M. Lorena and M. Lochinvar, "A review of the development of Smart Grid technologies," Renewable and Sustainable Energy Reviews, vol. 59, p. 710–725, 2016, http://doi.org/10.1016/j.rser.2016.01.011.
[182] M. Bae, H. Kim, E. Kim, A. Y. Chung, H. Kim and J. H. Roh, "Toward electricity retail competition: Survey and case study on technical infrastructure for advanced electricity market system," Applied Energy, vol. 133, p. 252–273, 2014.
[183] V. C. Gungor, D. Sahin, T. Kocak, S. Ergut, C. Buccella, C. Cecati and G. P. Hancke, "Smart Grid and Smart Homes: Key Players and Pilot Projects.," IEEE Industrial Electronics Magazine, vol. 6, no. 4, p. 18–34, 2012.
[184] E. Rodriguez-Diaz, E. J. Palacios-García, M. Savaghebi, J. C. Vasquez, J. M. Guerrero and A. Moreno-Munoz, "Advanced Smart Metering Infrastructure for Future Smart Homes," in IEEE Fifth International Conference on Consumer Electronics - Berlin (ICCE-Berlin), 29-31, 2015, http://doi.org/10.1109/ICCE-Berlin.2015.7391260.
[185] ESMIG, Conclusions from the Sustainable Energy Week 13 - 17 June 2016.
[186] C. Evens, S. Hänninen and F. Pettersson, "Aggregate Consumer’s Flexibility in Consumption and Generation to Create “Active Demand”," 2010. [Online]. Available: http://www.enercities.eu/toolbox/Files/EnerCities_Toolbox_UK.pdf. [Accessed 6 September 2016].
[187] NIST, "Framework and Roadmap for Smart Grid Interoperability Standards," Release 3.0., 2014.
[188] GSGF (Global Smart Grid Federation), "Smart Grid Interoperability," 2014.
[189] R. K. Jain, K. M. Smith, P. J. Culligan and J. E. Taylor, "Forecasting energy consumption of multi-family residential buildings using support vector regression: Investigating the impact of temporal and spatial monitoring granularity on performance accuracy," Applied Energy, vol. 123, p. 168–178, 2014, http://doi.org/10.1016/j.apenergy.2014.02.057.
[190] I. Sommerville, "Distributed Systems Architectures. Software Engineering," 7th edition. Chapter 12, 2004.
D2.2 – Availability and suitability of technologies 111
[191] P. Bilderbeek, "The Four Types of System Architectures," 2013. [Online]. Available: http://www.themetisfiles.com/2013/01/the-four-types-of-system-architectures/. [Accessed 6 September 2016].
[192] I. Sartori, A. Napolitano and K. Voss, "Net zero energy buildings: A consistent definition framework," Energy and Buildings, vol. 48, p. 220–232, 2012, http://doi.org/10.1016/j.enbuild.2012.01.032.
[193] M. Börühan, M. Odlare, P. Stigson and F. Wallin, "Active buildings in smart grids — Exploring the views of the Swedish energy and buildings sectors," Energy & Buildings, vol. 117, p. 185–198, 2016, http://doi.org/10.1016/j.enbuild.2016.02.017.
[194] M. Börühan, M. Odlare, P. Stigson and F. Wallin, "Buildings in the future energy system – Perspectives of the Swedish energy and buildings sectors on current energy challenges," Energy & Buildings, vol. 107, p. 254–263, 2015, http://doi.org/10.1016/j.enbuild.2015.08.027.
[195] T. Crosbie, M. Dawood, M. Short, P. Brassier, R. Decorme, A. Huovila and M. Ala-Juusela, "Generalised business models.," 2015.
[196] K. Ehrhardt-Martinez, K. A. Donnelly and J. A. Laitner, "Advanced Metering Initiatives and Residential Feedback Programs : A Meta-Review for Household Electricity-Saving Opportunities.," 2010.
[197] S. Darby, "THE EFFECTIVENESS OF FEEDBACK ON ENERGY CONSUMPTION - A REVIEW FOR DEFRA OF THE LITERATURE ON METERING, BILLING AND DIRECT DISPLAYS," 2006. [Online]. Available: http://www.eci.ox.ac.uk/research/energy/downloads/smart-metering-report.pdf. [Accessed 4 September 2016].
[198] K. Bäckström, A. Varis, T. Crosbie, M. Dawood, M. Ala-Juusela, M. Ståhlberg and E. Lumb, "Impact report Finnsih demo," Deliverable 5.5 of IDEAS project, 2015.
[199] P. W. DeVries and E. Knol, "SERIOUS GAMING AS A MEANS TO CHANGE ADOLESCENTS ’ ATTITUDES TOWARDS SAVING ENERGY ; PRELIMINARY RESULTS FROM THE ENERCITIES," 1–5, 2011.
[200] P. Bradley, M. Leach and J. Torriti, "A review of current and future costs and benefits of demand response for electricity," 2011. [Online]. Available: https://www.surrey.ac.uk/ces/files/pdf/1011_WP_Bradley_et_al_DemandResponse_3.pdf. [Accessed 6 September 2016].
[201] M. Short, M. Dawood, T. Crosbie, N. Dawood and M. Ala-juusela, "VISUALIZATION TOOLS FOR ENERGY AWARENESS MANAGEMENT IN ENERGY POSITIVE NEIGHBORHOODS," in Proceedings of 14th International Conference on Construction Applications of Virtual Reality 2014 (CONVR 2014), November 16-18, 2014 Sharjah, UAE.
[202] DOE (US Department of Energy), "The SMART GRID : An Introduction," 2016. [Online]. Available: http://energy.gov/oe/downloads/smart-grid-introduction-0. [Accessed 1 September 2016].
[203] S. Woess-Gallasch, W. Aichinger, M. Auer, G. Korpitsch, H. Rest-Hinterseer and D. Steiner, "INNOVATIVE SERVICE AND BUSINESS MODEL FOR PHOTOVOLTAIC POWER PLANTS ON MULTIPLE DWELLINGS IN AUSTRIA FOR SELF-CONSUMPTION," 2014, poster presentation at EUPVSEC2014. [Online]. Available: https://www.joanneum.at/uploads/tx_publicationlibrary/WOG_EUPVSEC2014_Poster_7AV.6.33_Woess.pdf.
[204] K. Giselbrecht et al., "Marktmodelle für GIVP-Mehrparteien-Immobilien im intelligenten, dezentralen Energiesystem," Neue Energien 2020, final report, Vienna, December 2011.
[205] B. Sibbitt, D. Mcclenahan, R. Djebbar and K. Paget, "Groundbreaking Solar - Case Study Drake Landing Solar Community," Copyright 2015 ASHRAE, 2015.
[206] PlanEnergi, "http://www.solarmarstal.dk/media/2854117/summary-technical-description-marstal.pdf," [Online].
[207] International Energy Agency, "Linking Heat and Electricity Systems - Co-generation and District Heating and Cooling Solutions for a Clean Energy Future," IEA Publications, Paris, 2014.
[208] "www.vauban.de," 2013. [Online]. Available: http://www.vauban.de/en/topics/history/276-an-introduction-to-vauban-district.
[209] BINE - Information Service, [Online]. Available: http://www.bine.info/en/topics/renewable-energy-sources/photovoltaics/news/gebaeude-ueber-aussenwand-heizen/.
[210] BINE Information Service, [Online]. Available: http://www.bine.info/fileadmin/content/Publikationen/Englische_Infos/projekt_1009_engl_internetx.pdf.
[211] M. Spurr, T. Sivertsson, E. Moe and M. Lehtmets, "Integrating Renewable Energy & Waste Heat," International Energy Agency District Heating and Cooling, 2014.
[212] "MijnWater - Minewater then," [Online]. Available: http://www.mijnwater.com/minewater-then/?lang=en. [Accessed 2 August 2016].
D2.2 – Availability and suitability of technologies 112
[213] R. Verhoeven, E. Willems, Harcouët-Menou, E. De Boever, L. Hiddes, P. Op't Veld and E. Demollin, "Minewater 2.0 project in Heerlen the Netherlands: transformation of ageothermal mine water pilot project into a full scale hybrid sustainable energy infrastructure for heating and cooling," Elsevier, 2013.
[214] ADS-TEC GmbH, "Inbetriebnahme Quartierspeicher," [Online]. Available: http://www.ads-tec.de/unternehmen/presse/pressemitteilungen/singleview/article/inbetriebnahme-quartierspeicher-strombank-testet-neue-moeglichkeiten-zur-nutzung-erneuerba.html. [Accessed 22 August 2016].
[215] MVV Energie AG, "Projekt Strombank," [Online]. Available: https://www.mvv-energie.de/de/mvv_energie_gruppe/nachhaltigkeit_2/innovationen_1/strombank/aktuelles/strombank_aktuelles.jsp. [Accessed 24 August 2016].
[216] Grazer Energieagentur, "Ausgangsdaten und Rahmenbedingungen Wärmeversorgung Graz 2020 / 2030," 2014.
[217] P. Reiter, H. Poier and C. Holter, "BIG Solar Graz: Solar district heating in Graz – 500,000 m² for 20%," Energy Procedia, no. 91, p. 578 – 584, 2016.
[218] Grazer Energieagentur, "Wärmeversorgung Graz 2020/2030 Optionen für die Wärmebereitstellung fernwärmeversorgter Objekte im," 2014.
[219] "René Schmid Architekten," [Online]. Available: http://reneschmid.ch/. [Accessed 1 September 2016].
[220] "First energy self-sufficient apartment block built," [Online]. Available: https://www.greaterzuricharea.com/fr/detail/first-energy-self-sufficient-apartment-block-built-1/. [Accessed 1 September 2016].
[221] "Energieautarkes MFH Brütten - Umwelt Arena Spreitenbach," [Online]. Available: http://www.umweltarena.ch/uber-uns/energieautarkes-mfh-brutten/. [Accessed 1 September 2016].
[222] "Utrecht - ProRail," [Online]. Available: http://www.prorail.nl/projecten/utrecht. [Accessed 11 September 2016].
[223] Wikipedia, "Utrecht Centraal railway station," [Online]. Available: https://en.wikipedia.org/wiki/Utrecht_Centraal_railway_station. [Accessed 11 September 2016].
[224] "Reasons to build - CU2030," [Online]. Available: http://www.cu2030.nl/page/masterplan. [Accessed 11 September 2016].
[225] D. Moor, Interviewee, Railway station Utrecht Centraal. [Interview]. 28 August 2016.
[226] W. Amann et al., "StromBIZ - GEschäftsmodelle dezentrale Stromerzeugung und Distribution," 2016, https://nachhaltigwirtschaften.at/resources/sdz_pdf/schriftenreihe-2016-20_strombiz.pdf.