Embed Size (px)
Citation preview
www.subsol.org
D2.6 – Guide on using ASR-
Coastal with treated
wastewater for irrigation
SUBSOL has received funding from the European Union’s Horizon 2020
research and innovation programme under grant agreement No 642228
Based on improved ASR-Coastal reference site
in Dinteloord, the Netherlands (TRL8)

www.subsol.org
www.subsol.org
Grant agreement no: 642228
Work Package: WP2.3
Deliverable number: D2.6
Partner responsible: KWR Watercycle Research Institute
Deliverable author(s): Dr. Koen Zuurbier, Teun van Dooren MSc, Steven Ros MSc
Quality assurance: Prof. Dr. Pieter Stuyfzand (KWR), Dr. Klaus Hinsby
Planned delivery date: 28 February 2018
Actual delivery date: 28 August 2018
Revised version: 22 October 2018
Dissemination level: PU
PU = Public
PP = Restricted to other programme participants (including the Commission Services)
RE = Restricted to a group specified by the consortium (including the Commission Services)
CO = Confidential, only for members of the consortium (including the Commission Services)
Title:
Guide on using ASR-Coastal with treated wastewater for
irrigation

www.subsol.org
1
Table of contents
Table of contents ................................................................................................................. 1
Executive Summary ............................................................................................................. 3
1. Introduction ................................................................................................................... 5
1.1. Motivation for waste water reuse and aquifer storage ............................................ 5
1.2. The Dinteloord dilemma: a mismatch between availability and demand ................. 5
1.3. Aims ........................................................................................................................ 6
2. Location ......................................................................................................................... 7
3. Chosen solution: waste water reuse ánd aquifer storage and recovery ........................ 9
4. Guideline for realization of an ASR-Coastal scheme using treated waste water (based
on Dinteloord) .................................................................................................................... 11
4.1. Stepwise approach ............................................................................................... 11
4.2. Detailed activities in every step............................................................................. 12
4.2.1. I. Desk-study and additional sampling [2012] ................................................. 12
4.2.2. II. First assessment of potential recovery efficiency [2012] ............................ 14
4.2.3. III. Exploratory drilling incl. sediment and groundwater analyses [2013] ........ 18
4.2.4. IV. Second assessment of ASR recovery efficiency and hydrological effect
study [2013, 2014] ....................................................................................................... 19
4.2.5. V. Preliminary design and permitting .............................................................. 21
4.2.6. VI. First injection/storage/recovery and pumping test [2015-2016] ................. 21
4.2.7. VII: Advanced water balance and groundwater modelling to define final
operational parameters and assess final performance and effects ............................. 25
4.2.8. VIII: Final design and realisation of the ASR-Coastal scheme ....................... 26
4.2.9. IX: Monitoring and evaluation of the first ASR-cycles ..................................... 29
5. Technical details of the final set-up in Dinteloord ........................................................ 31
5.1.1. Outline of the final water system .................................................................... 31
5.1.2. Automated control unit ................................................................................... 31
5.2. Photographic impression ...................................................................................... 33
6. Organisation with multiple end users on one waste water reuse & ASR-Coastal
Scheme .............................................................................................................................. 35
6.1. Parties involved and their organisation (Dinteloord) ............................................. 35
6.2. Cost coverage....................................................................................................... 36
2
6.3. Distribution and trading of water rights ................................................................. 37
7. Conclusions on the use of ASR-Coastal for water reuse ............................................. 39
7.1. Lessons learned ................................................................................................... 39
7.2. Potential in different settings ................................................................................. 40
References ........................................................................................................................ 41
Appendix 1. Characterization of the target aquifer .......................................................... 43
A1.1. Characterization of the target aquifer ................................................................ 43
A1.2. Characterization of the native groundwater ....................................................... 46
Appendix 2. Results of the small scale pilot: ASR1 ........................................................ 48
A2.1. Infiltration water quality ...................................................................................... 48
A2.2. Water quantity ................................................................................................... 49
A2.3. Model results ..................................................................................................... 52
Appendix 3. Water balance model .................................................................................. 56
A3.1. Water balance model fundamentals .................................................................. 56
A3.2. Data acquisition ................................................................................................. 57
A3.3. Operational boundary conditions ....................................................................... 58
A3.4. Net precipitation data ......................................................................................... 58
A3.5. Greenhouse horticulturalists .............................................................................. 59
A3.6. Current water balance ....................................................................................... 59
A3.7. Future water balance ......................................................................................... 64
A3.8. Discussion ......................................................................................................... 67
Appendix 4. Technical overview of the water system ..................................................... 69
3
Executive Summary
In Dinteloord (The Netherlands), an advanced sustainable freshwater supply was realized
using ASR-Coastal within the Subsol project. The Dinteloord water system consists of
rapid filtration, ultra-filtration (UF) and finally RO-treatment for wastewater from a sugar
factory, an ASR-Coastal well field, and a 5 km distribution loop connecting all water with
the ASR-Coastal scheme that stores and recovers the water between autumn and
spring/summer. The system was officially opened in April 2018 and is currently in
operation.
Important lessons were learned at the site, which can be used as a guide for implementing
ASR-Coastal in combination with effluent reuse elsewhere. They include:
A step-by-step approach: There are various elements that can fail when applying
ASR-Coastal and while reusing (treated) waste water. A careful step-by-step
approach (Chapter 4) with a critical but open view is required toward realisation.
This also involves continuously (every step) informing targeted water users,
authorities, neighbours, and the supplier of the waste water. All aspects such as
technical feasibility, economic viability, and hydrological acceptability should
constantly be assessed in an iterative process.
Demonstrate and communicate: Both water reuse and ASR-Coastal involves
complex processes and technology. A clear demonstration and communication are
vital to inform stakeholders, end users and the public.
Setting up the organisational structure: As shown in Chapter 5, combining reuse
with aquifer storage and recovery for various end users may require a firm
organisational structure with clear roles for each party. In Dinteloord, this structure
was set up by the TOM (’Tuinbouwontwikkelingsmaatschappij’, Dutch for
horticulture development company), which was developing the area and acted as a
director.

4
5
1. Introduction
1.1. Motivation for waste water reuse and aquifer storage
Waste water reuse is recognized as a key solution to deal with water scarcity (European
Commission, 2018). Besides treating the reuse water to a certain desired quality,
management of its availability to meet its demand over time is vital for success. Aquifer
storage and recovery using for instance ASR-coastal (as developed in the Subsol project)
can provide the solution to match availability with demand and to further safeguard water
quality via aquifer passage (Dillon et al., 2006).
1.2. The Dinteloord dilemma: a mismatch between availability
and demand
In Dinteloord (The Netherlands), a modern greenhouse area called ‘Nieuw-Prinsenland’
(260 ha) was realised by the Tuinbouwontwikkelingsmaatschappij (TOM). In this salinizing
coastal area without a significant external freshwater supply, the availability of very high-
quality water (sodium <2.4 mg/l) for greenhouse irrigation during droughts was a major
challenge. Rainwater collected at greenhouse roofs and stored in aboveground basins
formed the basis for the irrigation water supply. However, these basins cannot store
sufficient water to overcome years with prolonged periods of drought, like in the recent dry
Summer of 2018.
Use of ground- and surface water was prohibited because these sources are under
pressure of salinization. A neighbouring sugar factory producing large volumes of waste
water between September and January provided a potential water source. However, this
availability of water is out-of-phase with the projected demand of the greenhouse
horticulturalists (April-August, depending on the moment of drought). How to transfer the
available reuse water to the dynamic time of demand?
6
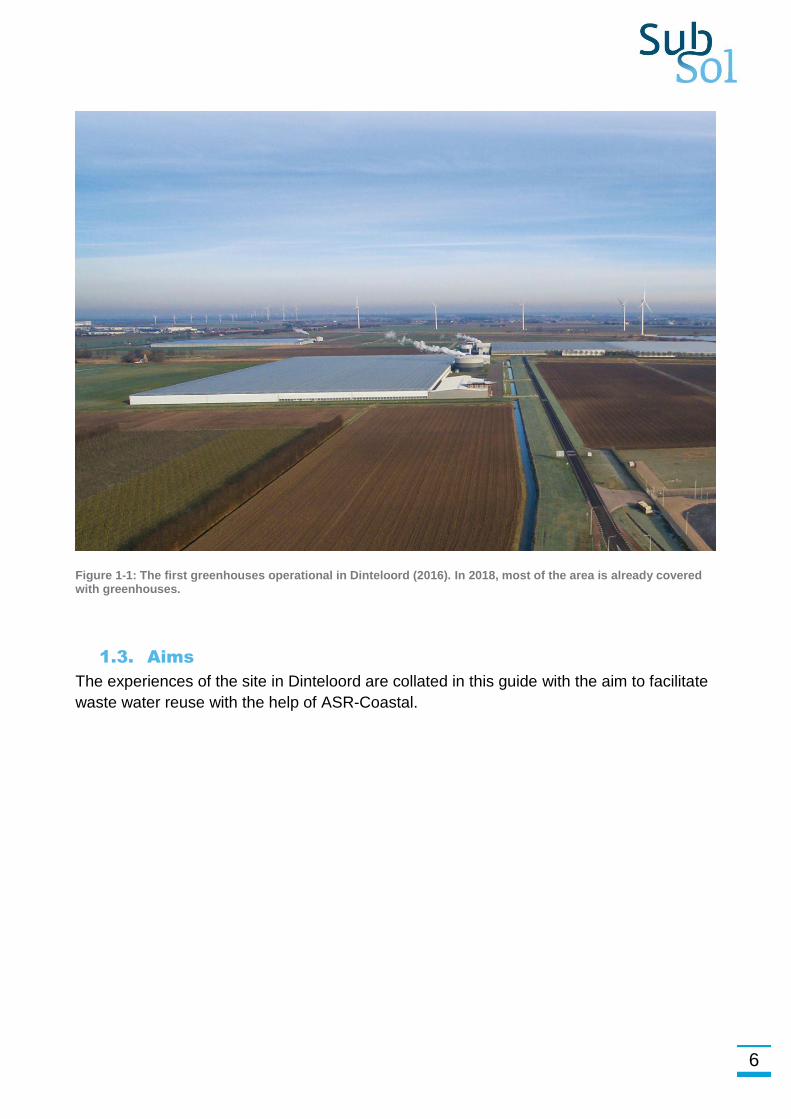
Figure 1-1: The first greenhouses operational in Dinteloord (2016). In 2018, most of the area is already covered with greenhouses.
1.3. Aims
The experiences of the site in Dinteloord are collated in this guide with the aim to facilitate
waste water reuse with the help of ASR-Coastal.
7
2. Location
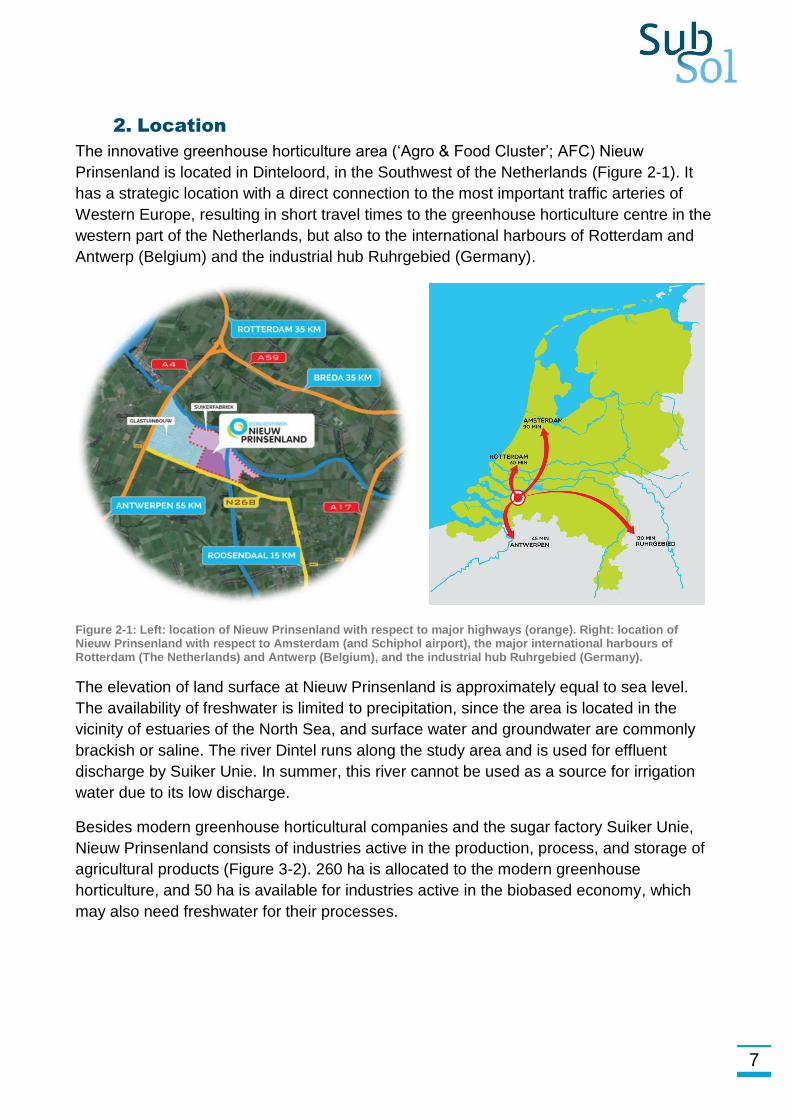
The innovative greenhouse horticulture area (‘Agro & Food Cluster’; AFC) Nieuw
Prinsenland is located in Dinteloord, in the Southwest of the Netherlands (Figure 2-1). It
has a strategic location with a direct connection to the most important traffic arteries of
Western Europe, resulting in short travel times to the greenhouse horticulture centre in the
western part of the Netherlands, but also to the international harbours of Rotterdam and
Antwerp (Belgium) and the industrial hub Ruhrgebied (Germany).
Figure 2-1: Left: location of Nieuw Prinsenland with respect to major highways (orange). Right: location of Nieuw Prinsenland with respect to Amsterdam (and Schiphol airport), the major international harbours of Rotterdam (The Netherlands) and Antwerp (Belgium), and the industrial hub Ruhrgebied (Germany).
The elevation of land surface at Nieuw Prinsenland is approximately equal to sea level.
The availability of freshwater is limited to precipitation, since the area is located in the
vicinity of estuaries of the North Sea, and surface water and groundwater are commonly
brackish or saline. The river Dintel runs along the study area and is used for effluent
discharge by Suiker Unie. In summer, this river cannot be used as a source for irrigation
water due to its low discharge.
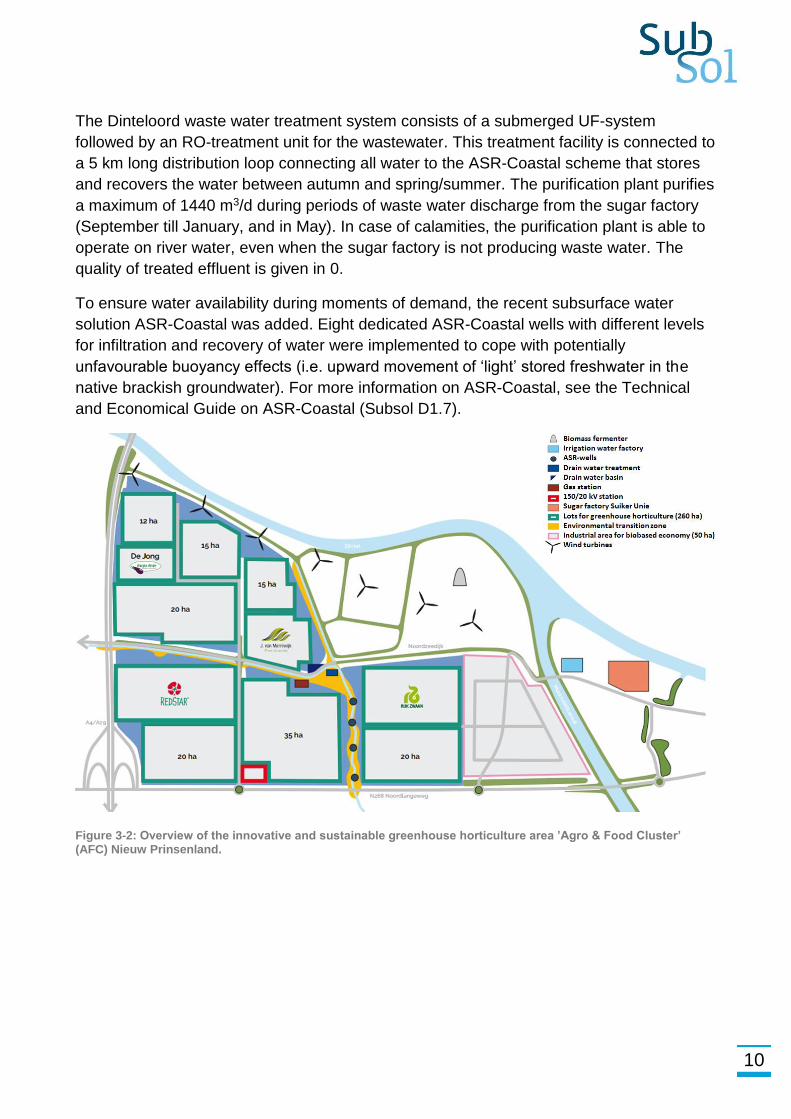
Besides modern greenhouse horticultural companies and the sugar factory Suiker Unie,
Nieuw Prinsenland consists of industries active in the production, process, and storage of
agricultural products (Figure 3-2). 260 ha is allocated to the modern greenhouse
horticulture, and 50 ha is available for industries active in the biobased economy, which
may also need freshwater for their processes.

8
9
3. Chosen solution: waste water reuse ánd aquifer storage
and recovery
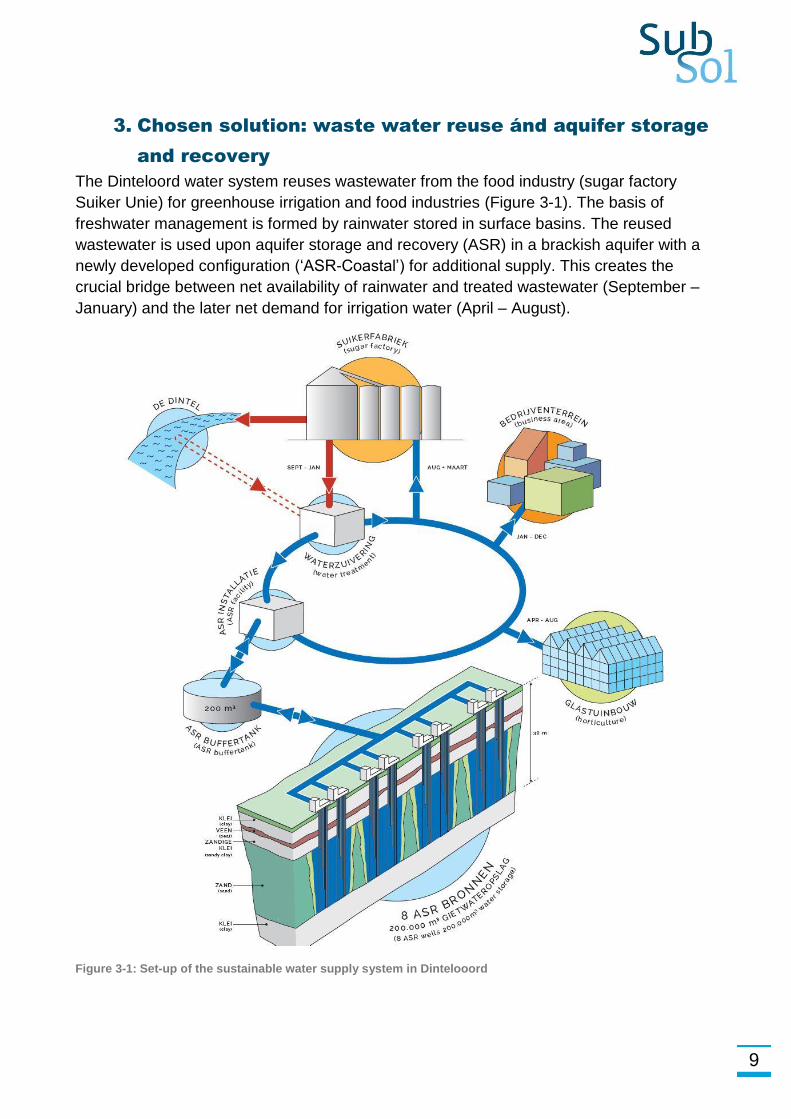
The Dinteloord water system reuses wastewater from the food industry (sugar factory
Suiker Unie) for greenhouse irrigation and food industries (Figure 3-1). The basis of
freshwater management is formed by rainwater stored in surface basins. The reused
wastewater is used upon aquifer storage and recovery (ASR) in a brackish aquifer with a
newly developed configuration (‘ASR-Coastal’) for additional supply. This creates the
crucial bridge between net availability of rainwater and treated wastewater (September –
January) and the later net demand for irrigation water (April – August).
Figure 3-1: Set-up of the sustainable water supply system in Dintelooord
10
The Dinteloord waste water treatment system consists of a submerged UF-system
followed by an RO-treatment unit for the wastewater. This treatment facility is connected to
a 5 km long distribution loop connecting all water to the ASR-Coastal scheme that stores
and recovers the water between autumn and spring/summer. The purification plant purifies
a maximum of 1440 m3/d during periods of waste water discharge from the sugar factory
(September till January, and in May). In case of calamities, the purification plant is able to
operate on river water, even when the sugar factory is not producing waste water. The
quality of treated effluent is given in 0.
To ensure water availability during moments of demand, the recent subsurface water
solution ASR-Coastal was added. Eight dedicated ASR-Coastal wells with different levels
for infiltration and recovery of water were implemented to cope with potentially
unfavourable buoyancy effects (i.e. upward movement of ‘light’ stored freshwater in the
native brackish groundwater). For more information on ASR-Coastal, see the Technical
and Economical Guide on ASR-Coastal (Subsol D1.7).
Figure 3-2: Overview of the innovative and sustainable greenhouse horticulture area ’Agro & Food Cluster’ (AFC) Nieuw Prinsenland.
11
4. Guideline for realization of an ASR-Coastal scheme
using treated waste water (based on Dinteloord)
4.1. Stepwise approach
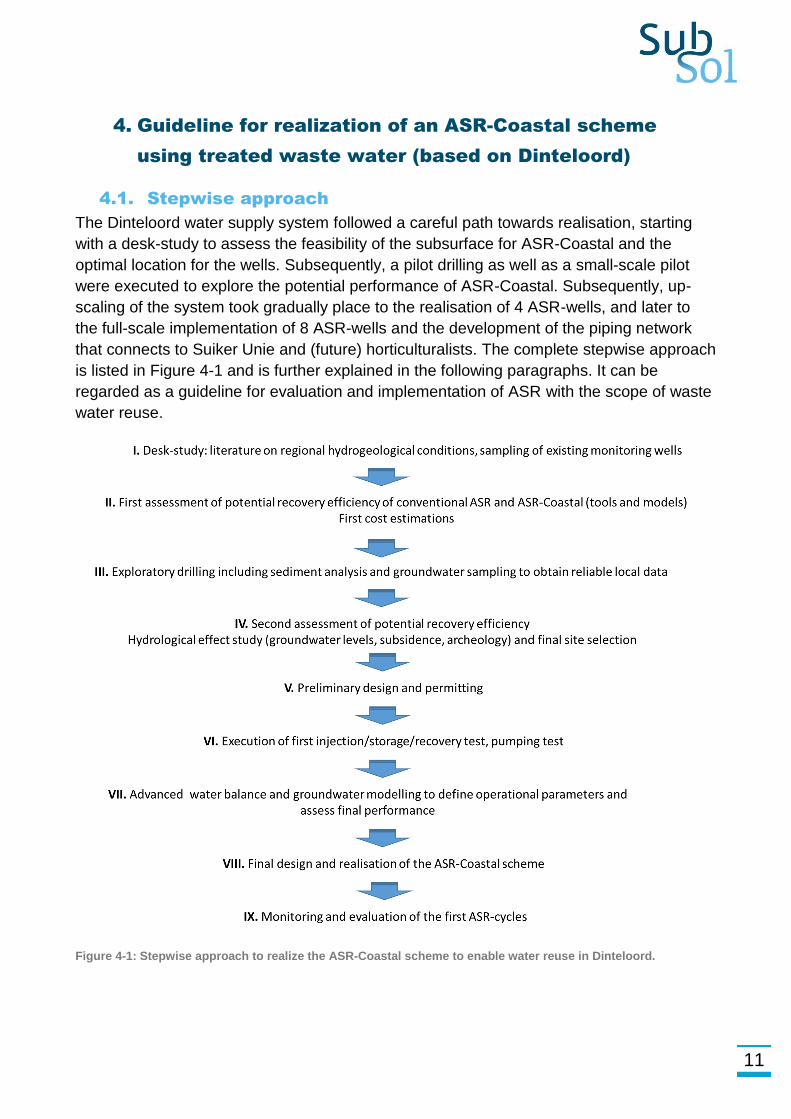
The Dinteloord water supply system followed a careful path towards realisation, starting
with a desk-study to assess the feasibility of the subsurface for ASR-Coastal and the
optimal location for the wells. Subsequently, a pilot drilling as well as a small-scale pilot
were executed to explore the potential performance of ASR-Coastal. Subsequently, up-
scaling of the system took gradually place to the realisation of 4 ASR-wells, and later to
the full-scale implementation of 8 ASR-wells and the development of the piping network
that connects to Suiker Unie and (future) horticulturalists. The complete stepwise approach
is listed in Figure 4-1 and is further explained in the following paragraphs. It can be
regarded as a guideline for evaluation and implementation of ASR with the scope of waste
water reuse.
Figure 4-1: Stepwise approach to realize the ASR-Coastal scheme to enable water reuse in Dinteloord.
12
4.2. Detailed activities in every step
4.2.1. I. Desk-study and additional sampling [2012]
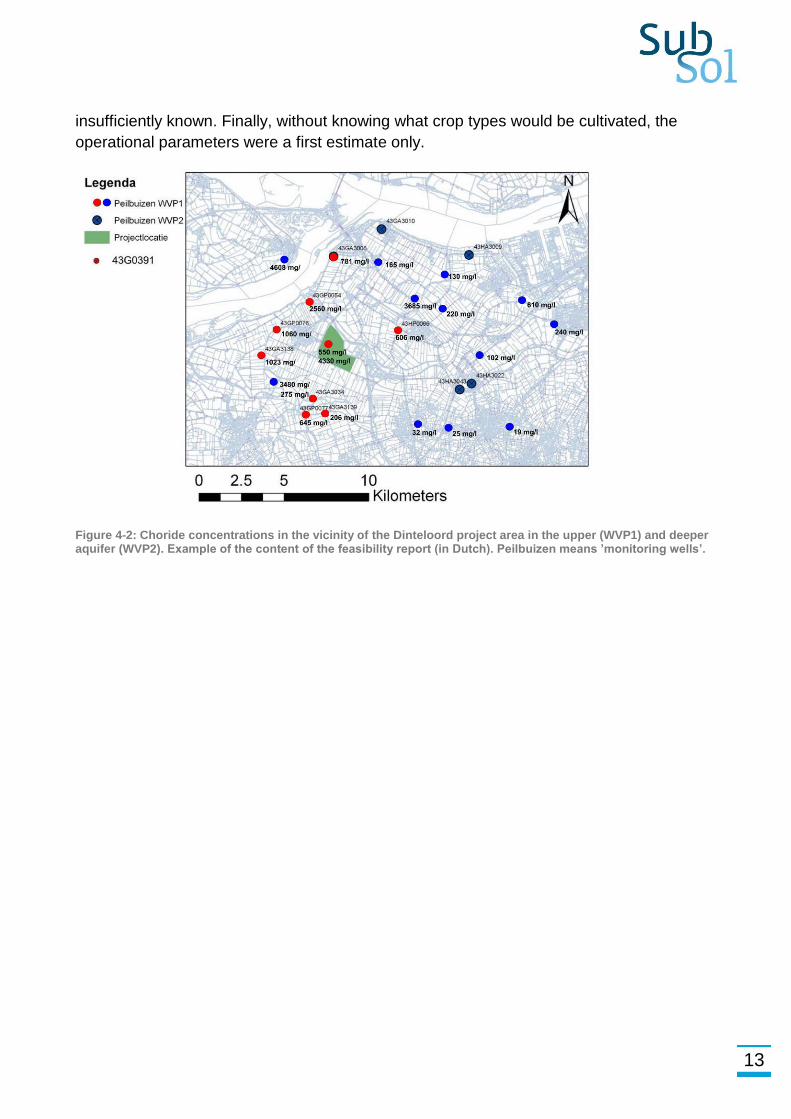
During the desk-study, existing data from earlier drilling and sampling campaigns were
evaluated to characterize the local aquifers and groundwater quality, complemented by
sampling of an available observation well in the study area. Some results are shown in
Figure 4-2 and Figure 4-3, displaying the local chloride concentrations of the ambient
groundwater and a hydrogeological schematisation, respectively. The aim of this phase
was to:
characterize the local aquifers and hydrology (‘conceptual hydrogeological model’)
define typical operational parameters of the ASR system
define the required water quality for infiltration using ASR wells
identify potential data gaps
Hydrogeology
Two potential target aquifers consisting of fine to medium coarse sand were identified
within 100 m depth. Little data was available on deeper aquifers, but they were
presumably more saline and less interesting because of the higher drilling costs. The
regional head data suggest that groundwater flow was virtually absent.
Operational parameters
Based on a simple water balance model, the estimated water use, rainfall availability and
volume of aboveground reservoirs, it was estimated that in the most extreme case:
41 days of shortage would occur
200 m3/h should then be supplied
In total 220 000 m3 should therefore be available
To overcome the shortage with an ASR-system, infiltration would occur with 1440
m3/d during 150 days (Sept-Jan)
Water quality
Since the water in Dinteloord was extensively treated via reverse osmosis, it was clear that
the water would meet the legal targets for chemical composition and the operational
targets with regards to clogging. Risks were however identified: during aquifer residence
the hyperfresh, oxygen-containing infiltration water might lead to mobilisation of clay
particles by freshening, and to dissolution of Fe, Mn, As, Ni, Co, and SO4 by pyrite
oxidation.
Data gaps
Little was known of the chemical composition of the groundwater in the study area. The
available data suggested a transition from saline to brackish to freshwater right within the
study area. The geochemical composition of the potential sand aquifers was also
13
insufficiently known. Finally, without knowing what crop types would be cultivated, the
operational parameters were a first estimate only.
Figure 4-2: Choride concentrations in the vicinity of the Dinteloord project area in the upper (WVP1) and deeper aquifer (WVP2). Example of the content of the feasibility report (in Dutch). Peilbuizen means ’monitoring wells’.
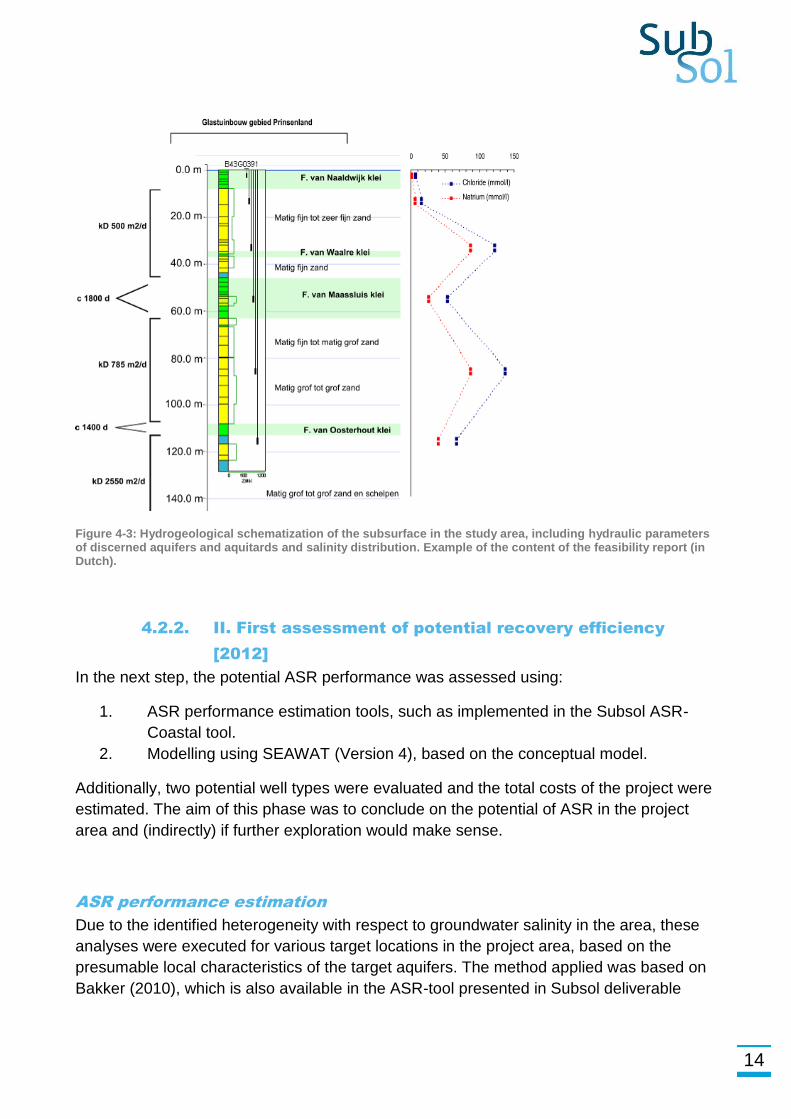
14
Figure 4-3: Hydrogeological schematization of the subsurface in the study area, including hydraulic parameters of discerned aquifers and aquitards and salinity distribution. Example of the content of the feasibility report (in Dutch).
4.2.2. II. First assessment of potential recovery efficiency
[2012]
In the next step, the potential ASR performance was assessed using:
1. ASR performance estimation tools, such as implemented in the Subsol ASR-
Coastal tool.
2. Modelling using SEAWAT (Version 4), based on the conceptual model.
Additionally, two potential well types were evaluated and the total costs of the project were
estimated. The aim of this phase was to conclude on the potential of ASR in the project
area and (indirectly) if further exploration would make sense.
ASR performance estimation
Due to the identified heterogeneity with respect to groundwater salinity in the area, these
analyses were executed for various target locations in the project area, based on the
presumable local characteristics of the target aquifers. The method applied was based on
Bakker (2010), which is also available in the ASR-tool presented in Subsol deliverable
15
D1.7. With this approach, various relevant aquifer and operational parameters that all have
an effect on the ASR performance are combined to assess the ASR performance. It was
found that the upper Aquifer 1 gave the best chances for freshwater recovery (53-61%)
compared to Aquifer 2 (36-41%) and Aquifer 3 (<35%). Aquifer 3 was therefore excluded
from further analysis.
First groundwater modelling
As a next step, groundwater modelling was performed to better assess the potential
freshwater upon aquifer storage. The hypothesis based on the performance estimations
was that from Aquifer 1 more than 50% could be recovered and that Aquifer 2 would
perform worse.
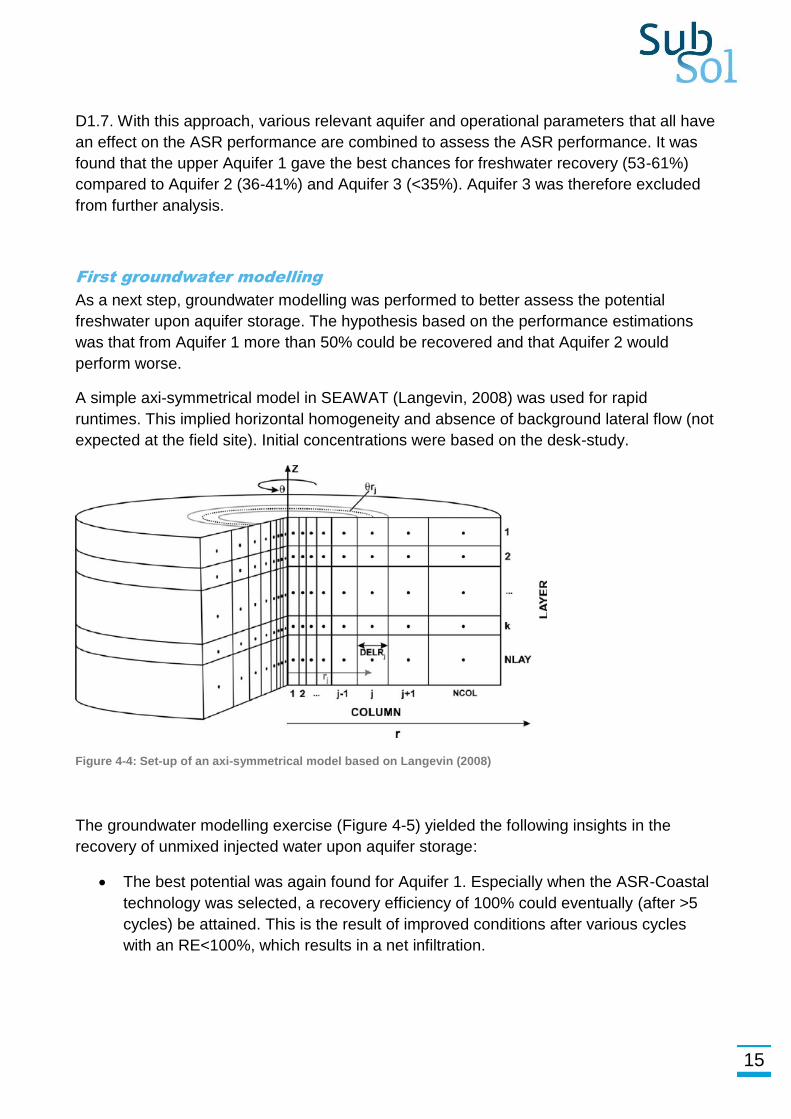
A simple axi-symmetrical model in SEAWAT (Langevin, 2008) was used for rapid
runtimes. This implied horizontal homogeneity and absence of background lateral flow (not
expected at the field site). Initial concentrations were based on the desk-study.
Figure 4-4: Set-up of an axi-symmetrical model based on Langevin (2008)
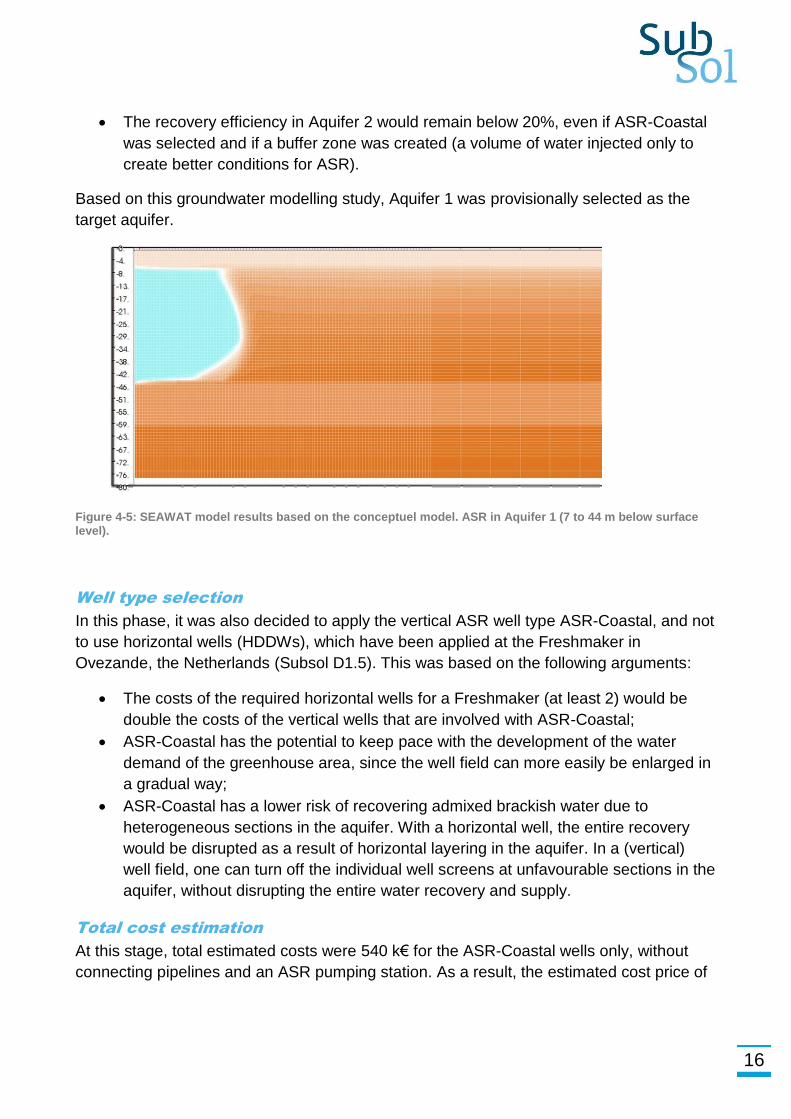
The groundwater modelling exercise (Figure 4-5) yielded the following insights in the
recovery of unmixed injected water upon aquifer storage:
The best potential was again found for Aquifer 1. Especially when the ASR-Coastal
technology was selected, a recovery efficiency of 100% could eventually (after >5
cycles) be attained. This is the result of improved conditions after various cycles
with an RE<100%, which results in a net infiltration.
16
The recovery efficiency in Aquifer 2 would remain below 20%, even if ASR-Coastal
was selected and if a buffer zone was created (a volume of water injected only to
create better conditions for ASR).
Based on this groundwater modelling study, Aquifer 1 was provisionally selected as the
target aquifer.
Figure 4-5: SEAWAT model results based on the conceptuel model. ASR in Aquifer 1 (7 to 44 m below surface level).
Well type selection
In this phase, it was also decided to apply the vertical ASR well type ASR-Coastal, and not
to use horizontal wells (HDDWs), which have been applied at the Freshmaker in
Ovezande, the Netherlands (Subsol D1.5). This was based on the following arguments:
The costs of the required horizontal wells for a Freshmaker (at least 2) would be
double the costs of the vertical wells that are involved with ASR-Coastal;
ASR-Coastal has the potential to keep pace with the development of the water
demand of the greenhouse area, since the well field can more easily be enlarged in
a gradual way;
ASR-Coastal has a lower risk of recovering admixed brackish water due to
heterogeneous sections in the aquifer. With a horizontal well, the entire recovery
would be disrupted as a result of horizontal layering in the aquifer. In a (vertical)
well field, one can turn off the individual well screens at unfavourable sections in the
aquifer, without disrupting the entire water recovery and supply.
Total cost estimation
At this stage, total estimated costs were 540 k€ for the ASR-Coastal wells only, without
connecting pipelines and an ASR pumping station. As a result, the estimated cost price of

17
a cubic meter of water was at least 0.37 euro/m3. Taking the other potential costs into
account, it was decided to proceed with the preparations for ASR-Coastal.
18
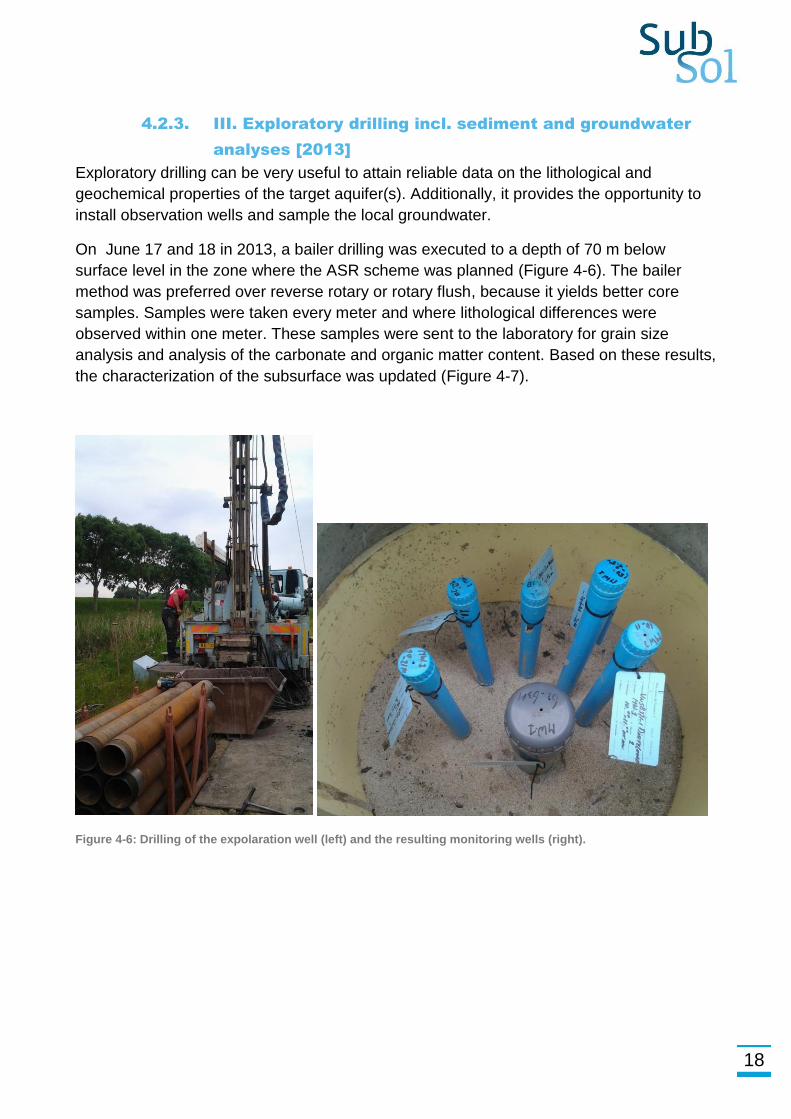
4.2.3. III. Exploratory drilling incl. sediment and groundwater
analyses [2013]
Exploratory drilling can be very useful to attain reliable data on the lithological and
geochemical properties of the target aquifer(s). Additionally, it provides the opportunity to
install observation wells and sample the local groundwater.
On June 17 and 18 in 2013, a bailer drilling was executed to a depth of 70 m below
surface level in the zone where the ASR scheme was planned (Figure 4-6). The bailer
method was preferred over reverse rotary or rotary flush, because it yields better core
samples. Samples were taken every meter and where lithological differences were
observed within one meter. These samples were sent to the laboratory for grain size
analysis and analysis of the carbonate and organic matter content. Based on these results,
the characterization of the subsurface was updated (Figure 4-7).
Figure 4-6: Drilling of the expolaration well (left) and the resulting monitoring wells (right).
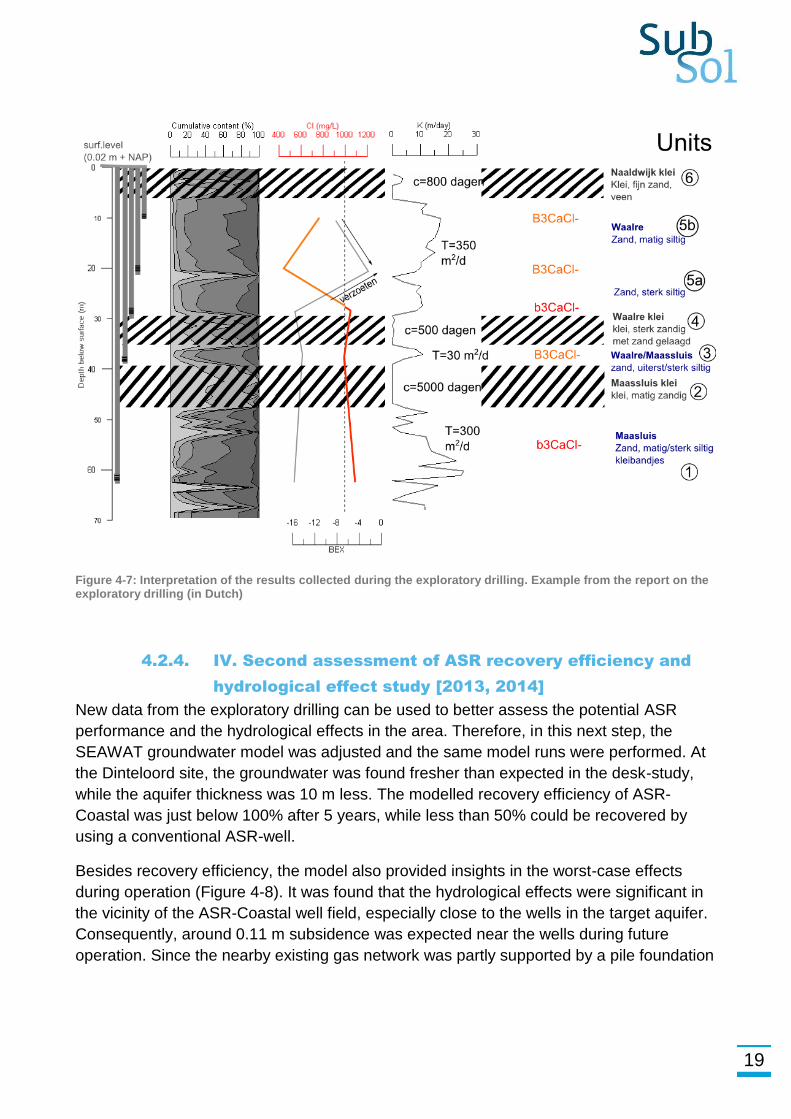
19
Figure 4-7: Interpretation of the results collected during the exploratory drilling. Example from the report on the exploratory drilling (in Dutch)
4.2.4. IV. Second assessment of ASR recovery efficiency and
hydrological effect study [2013, 2014]
New data from the exploratory drilling can be used to better assess the potential ASR
performance and the hydrological effects in the area. Therefore, in this next step, the
SEAWAT groundwater model was adjusted and the same model runs were performed. At
the Dinteloord site, the groundwater was found fresher than expected in the desk-study,
while the aquifer thickness was 10 m less. The modelled recovery efficiency of ASR-
Coastal was just below 100% after 5 years, while less than 50% could be recovered by
using a conventional ASR-well.
Besides recovery efficiency, the model also provided insights in the worst-case effects
during operation (Figure 4-8). It was found that the hydrological effects were significant in
the vicinity of the ASR-Coastal well field, especially close to the wells in the target aquifer.
Consequently, around 0.11 m subsidence was expected near the wells during future
operation. Since the nearby existing gas network was partly supported by a pile foundation
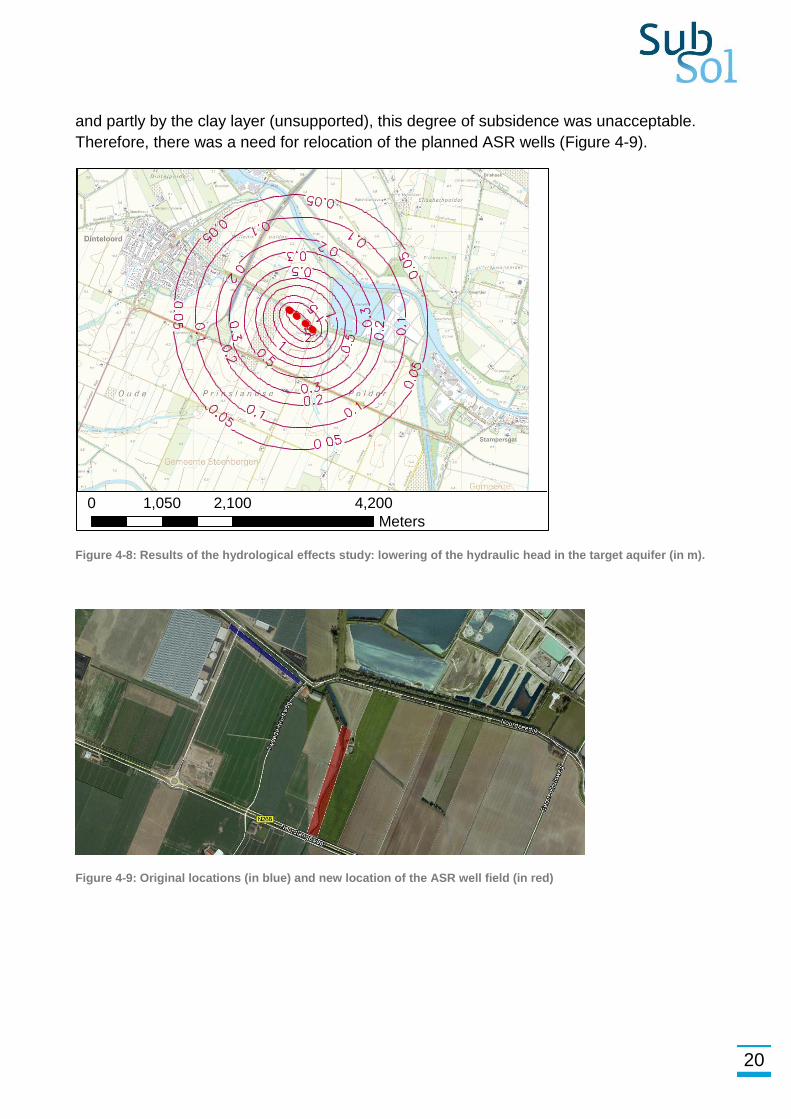
20
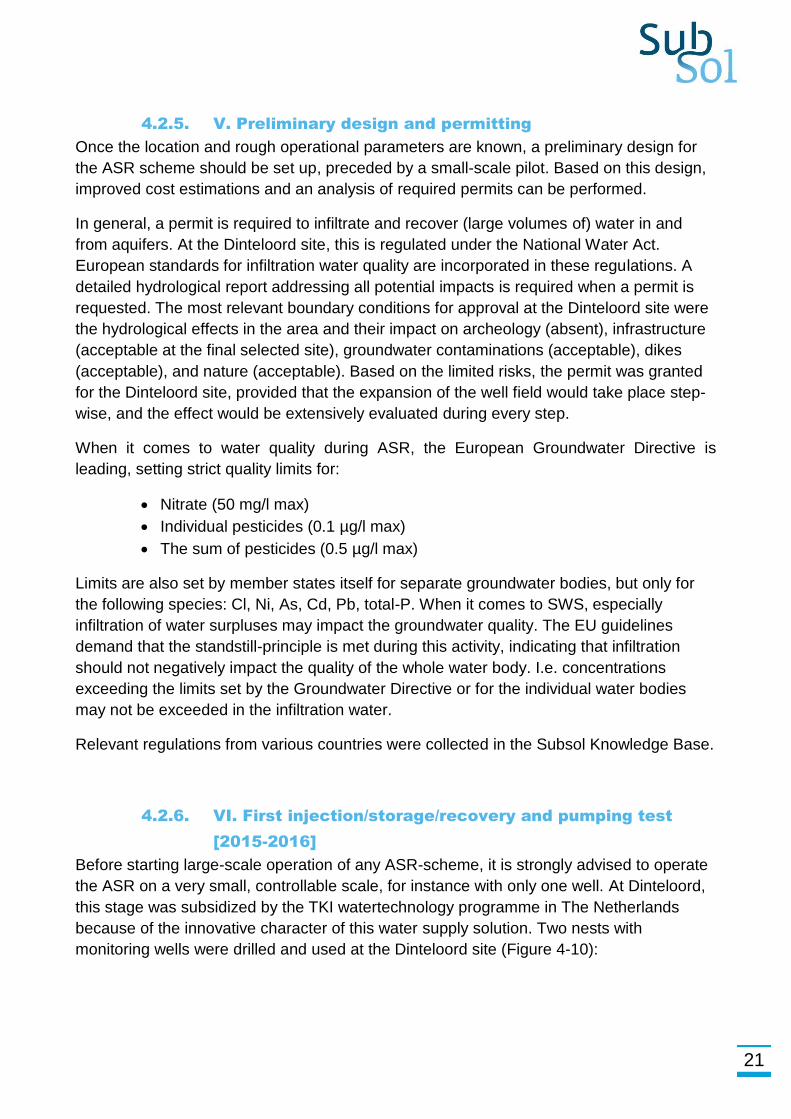
and partly by the clay layer (unsupported), this degree of subsidence was unacceptable.
Therefore, there was a need for relocation of the planned ASR wells (Figure 4-9).
Figure 4-8: Results of the hydrological effects study: lowering of the hydraulic head in the target aquifer (in m).
Figure 4-9: Original locations (in blue) and new location of the ASR well field (in red)
±
Legend
ASR_putten
stijghoogte_verlagingen_strook
0 2,100 4,2001,050
Meters
21
4.2.5. V. Preliminary design and permitting
Once the location and rough operational parameters are known, a preliminary design for
the ASR scheme should be set up, preceded by a small-scale pilot. Based on this design,
improved cost estimations and an analysis of required permits can be performed.
In general, a permit is required to infiltrate and recover (large volumes of) water in and
from aquifers. At the Dinteloord site, this is regulated under the National Water Act.
European standards for infiltration water quality are incorporated in these regulations. A
detailed hydrological report addressing all potential impacts is required when a permit is
requested. The most relevant boundary conditions for approval at the Dinteloord site were
the hydrological effects in the area and their impact on archeology (absent), infrastructure
(acceptable at the final selected site), groundwater contaminations (acceptable), dikes
(acceptable), and nature (acceptable). Based on the limited risks, the permit was granted
for the Dinteloord site, provided that the expansion of the well field would take place step-
wise, and the effect would be extensively evaluated during every step.
When it comes to water quality during ASR, the European Groundwater Directive is
leading, setting strict quality limits for:
Nitrate (50 mg/l max)
Individual pesticides (0.1 µg/l max)
The sum of pesticides (0.5 µg/l max)
Limits are also set by member states itself for separate groundwater bodies, but only for
the following species: Cl, Ni, As, Cd, Pb, total-P. When it comes to SWS, especially
infiltration of water surpluses may impact the groundwater quality. The EU guidelines
demand that the standstill-principle is met during this activity, indicating that infiltration
should not negatively impact the quality of the whole water body. I.e. concentrations
exceeding the limits set by the Groundwater Directive or for the individual water bodies
may not be exceeded in the infiltration water.
Relevant regulations from various countries were collected in the Subsol Knowledge Base.
4.2.6. VI. First injection/storage/recovery and pumping test
[2015-2016]
Before starting large-scale operation of any ASR-scheme, it is strongly advised to operate
the ASR on a very small, controllable scale, for instance with only one well. At Dinteloord,
this stage was subsidized by the TKI watertechnology programme in The Netherlands
because of the innovative character of this water supply solution. Two nests with
monitoring wells were drilled and used at the Dinteloord site (Figure 4-10):
22
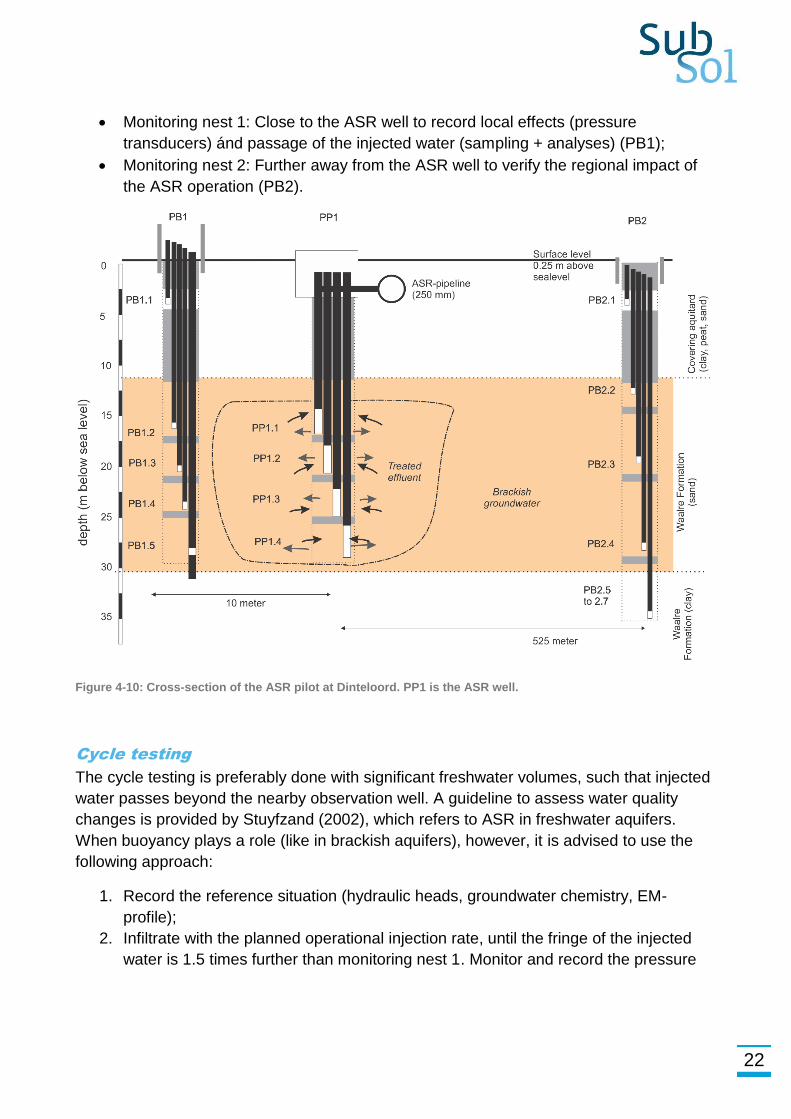
Monitoring nest 1: Close to the ASR well to record local effects (pressure
transducers) ánd passage of the injected water (sampling + analyses) (PB1);
Monitoring nest 2: Further away from the ASR well to verify the regional impact of
the ASR operation (PB2).
Figure 4-10: Cross-section of the ASR pilot at Dinteloord. PP1 is the ASR well.
Cycle testing
The cycle testing is preferably done with significant freshwater volumes, such that injected
water passes beyond the nearby observation well. A guideline to assess water quality
changes is provided by Stuyfzand (2002), which refers to ASR in freshwater aquifers.
When buoyancy plays a role (like in brackish aquifers), however, it is advised to use the
following approach:
1. Record the reference situation (hydraulic heads, groundwater chemistry, EM-
profile);
2. Infiltrate with the planned operational injection rate, until the fringe of the injected
water is 1.5 times further than monitoring nest 1. Monitor and record the pressure
23
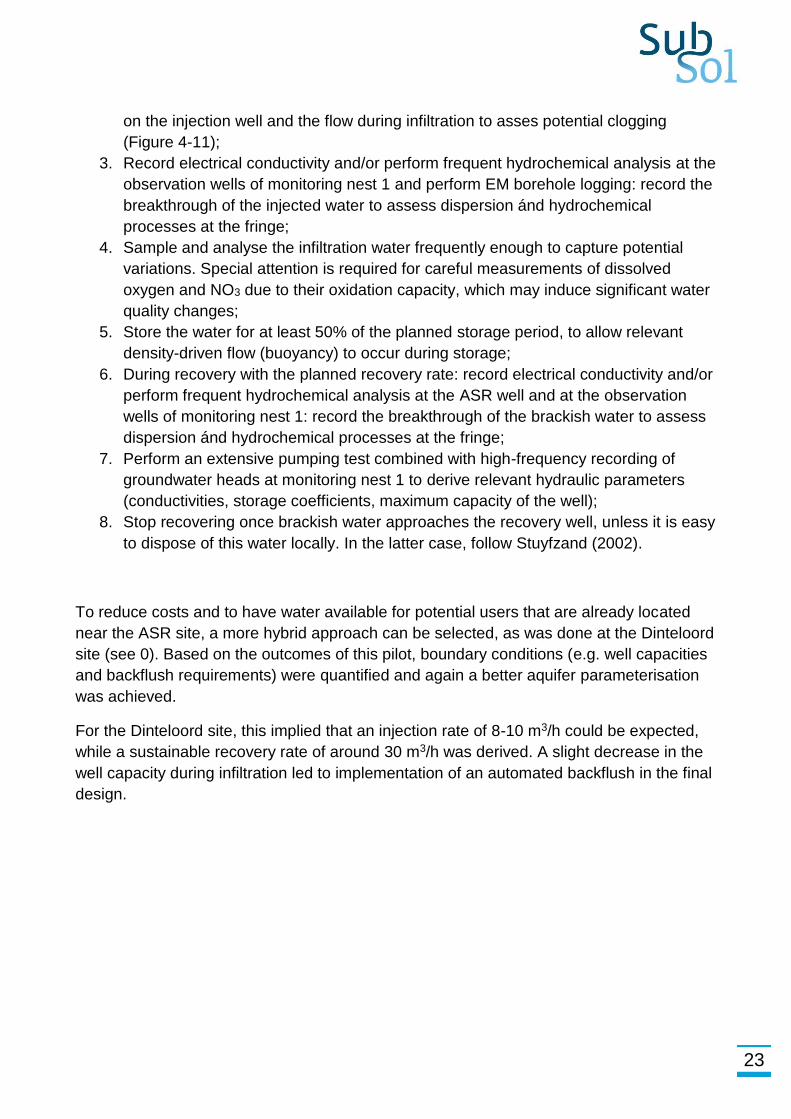
on the injection well and the flow during infiltration to asses potential clogging
(Figure 4-11);
3. Record electrical conductivity and/or perform frequent hydrochemical analysis at the
observation wells of monitoring nest 1 and perform EM borehole logging: record the
breakthrough of the injected water to assess dispersion ánd hydrochemical
processes at the fringe;
4. Sample and analyse the infiltration water frequently enough to capture potential
variations. Special attention is required for careful measurements of dissolved
oxygen and NO3 due to their oxidation capacity, which may induce significant water
quality changes;
5. Store the water for at least 50% of the planned storage period, to allow relevant
density-driven flow (buoyancy) to occur during storage;
6. During recovery with the planned recovery rate: record electrical conductivity and/or
perform frequent hydrochemical analysis at the ASR well and at the observation
wells of monitoring nest 1: record the breakthrough of the brackish water to assess
dispersion ánd hydrochemical processes at the fringe;
7. Perform an extensive pumping test combined with high-frequency recording of
groundwater heads at monitoring nest 1 to derive relevant hydraulic parameters
(conductivities, storage coefficients, maximum capacity of the well);
8. Stop recovering once brackish water approaches the recovery well, unless it is easy
to dispose of this water locally. In the latter case, follow Stuyfzand (2002).
To reduce costs and to have water available for potential users that are already located
near the ASR site, a more hybrid approach can be selected, as was done at the Dinteloord
site (see 0). Based on the outcomes of this pilot, boundary conditions (e.g. well capacities
and backflush requirements) were quantified and again a better aquifer parameterisation
was achieved.
For the Dinteloord site, this implied that an injection rate of 8-10 m3/h could be expected,
while a sustainable recovery rate of around 30 m3/h was derived. A slight decrease in the
well capacity during infiltration led to implementation of an automated backflush in the final
design.
24
Focus on organic micropollutants and pathogens
In Dinteloord, the focus regarding water quality was mainly on macrochemical composition
and heavy metals, which were relevant for the end users. Analysis of organic
micropollutants and pathogens was only performed during recovery to verify the absence
upon RO-treatment and aquifer storage. In earlier stages, during testing of the waste water
treatment, it was already found that these components were absent (below low detection
limits) in the treated water, and thus in the infiltration water.
In many cases of waste water reuse, however, these components are not completely
removed (especially when pretreatment is less efficient compared to RO), which makes
monitoring of the fate of these components during aquifer residence a key issue in the test
cycle.
Figure 4-11: Example of the calculated well capacity (based on measurements) during the test cycle at the Dinteloord site.
25
4.2.7. VII: Advanced water balance and groundwater modelling
to define final operational parameters and assess final
performance and effects
Upon completion of the first test cycle(s) and while having a good overview of the
projected water demand, a final design can be set up. Three important inputs are required
in this phase:
1. The boundary conditions and parameters derived from the pilot.
2. A highly reliable projection of the demanded operational performance of the ASR-
Coastal system, based on a water balance model fed with the temporal water
demand and availability in the area. See Appendix 3 for an example from the
Dinteloord site. Defined should be:
a. The required maximum and average injection rate;
b. The required maximum and average recovery rate;
c. The required Total Storage Volume (TSV).
3. A highly reliable projection of the ASR-Coastal performance, based on a
groundwater model calibrated on the data from the test cycle(s) (step VI). This is
reported in Subsol deliverable D2.5 for the Dinteloord site (Figure 4-12).
Combination of these elements results in:
1. The required total injection volume to attain the TSV (this is more than the TSV
itself, as part of the water is lost due to mixing and buoyancy): how much water
should be infiltrated, given that one does not want to infiltrate more than needed
because of the costs for treatment and infiltration;
2. A functional design of the ASR-Coastal well field (number of wells, distance in
between wells, depths of the well screens).
3. A final assessment of the effects once upscaling is achieved, as is often requested
by the permit;
4. Management of expectations: it might just be that in the first years of operation,
certain elements show slightly elevated concentration above the sometimes strict
limits set, but that this will improve cycle-after-cycle, as is the case in Dinteloord for
sodium, according to model results and field observations.
26
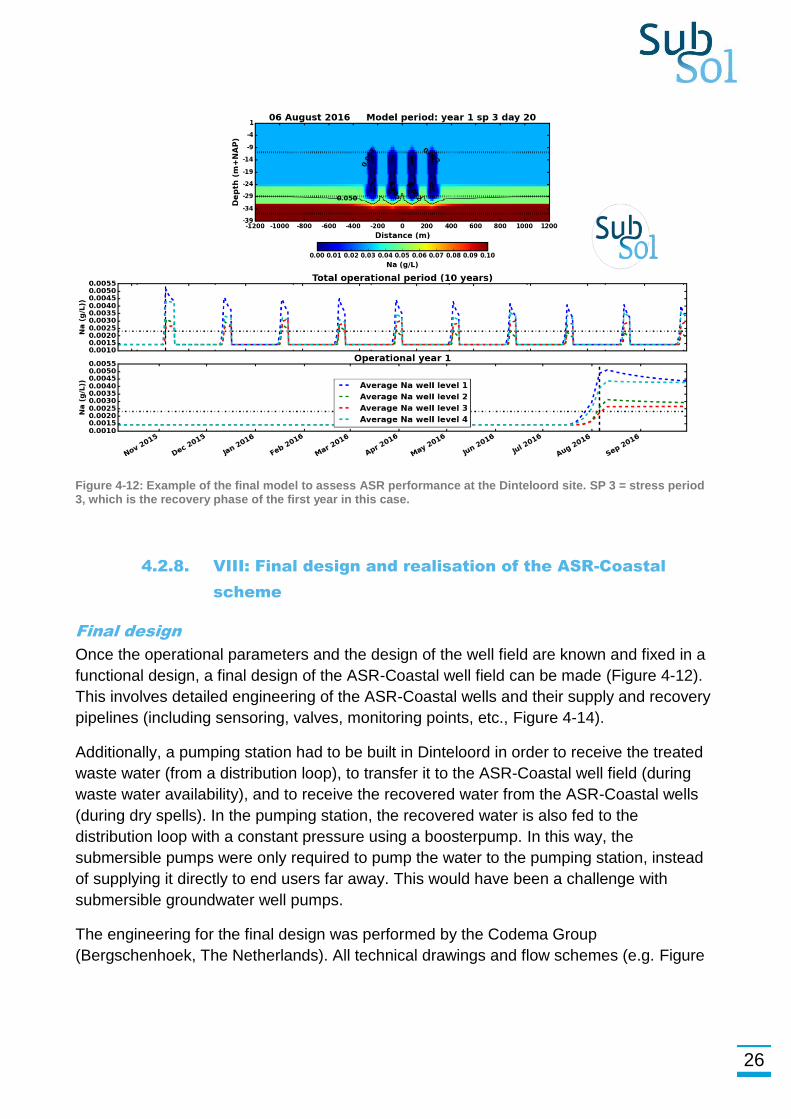
Figure 4-12: Example of the final model to assess ASR performance at the Dinteloord site. SP 3 = stress period 3, which is the recovery phase of the first year in this case.
4.2.8. VIII: Final design and realisation of the ASR-Coastal
scheme
Final design
Once the operational parameters and the design of the well field are known and fixed in a
functional design, a final design of the ASR-Coastal well field can be made (Figure 4-12).
This involves detailed engineering of the ASR-Coastal wells and their supply and recovery
pipelines (including sensoring, valves, monitoring points, etc., Figure 4-14).
Additionally, a pumping station had to be built in Dinteloord in order to receive the treated
waste water (from a distribution loop), to transfer it to the ASR-Coastal well field (during
waste water availability), and to receive the recovered water from the ASR-Coastal wells
(during dry spells). In the pumping station, the recovered water is also fed to the
distribution loop with a constant pressure using a boosterpump. In this way, the
submersible pumps were only required to pump the water to the pumping station, instead
of supplying it directly to end users far away. This would have been a challenge with
submersible groundwater well pumps.
The engineering for the final design was performed by the Codema Group
(Bergschenhoek, The Netherlands). All technical drawings and flow schemes (e.g. Figure
27
4-15) required approval by KWR, acting as a supervising advisor. It is advisable in every
ASR project to have an ASR-expert to perform this role.
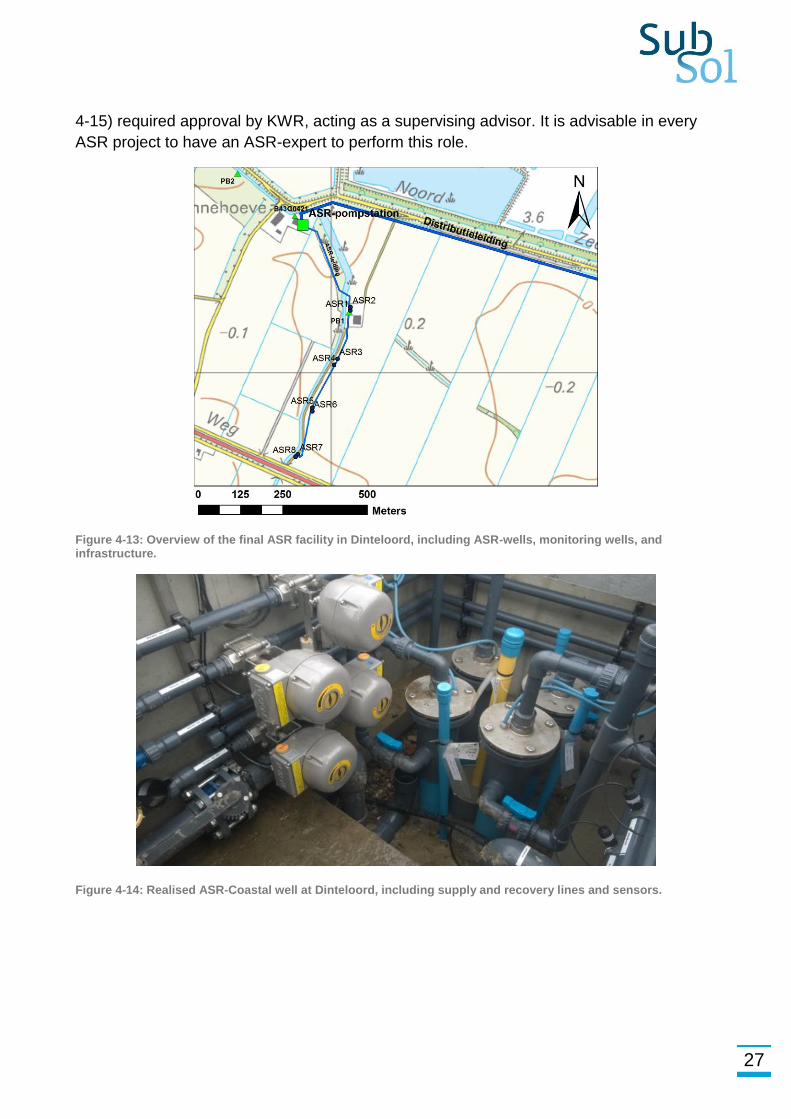
Figure 4-13: Overview of the final ASR facility in Dinteloord, including ASR-wells, monitoring wells, and infrastructure.
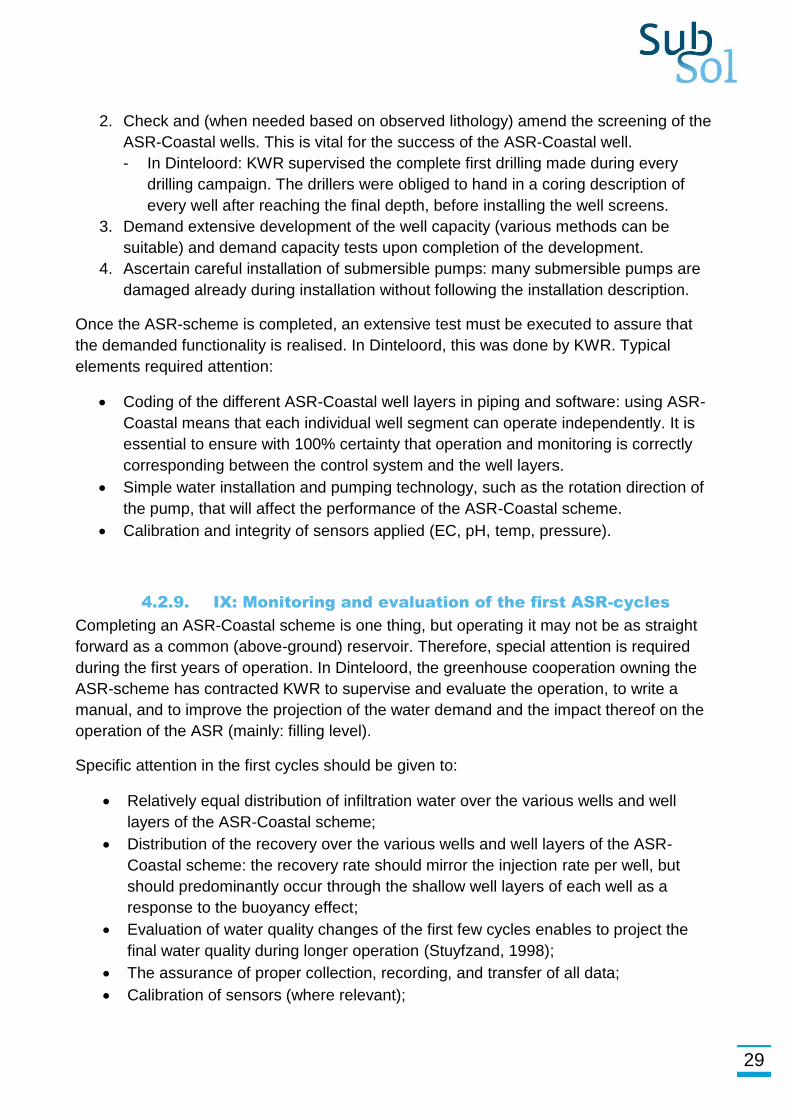
Figure 4-14: Realised ASR-Coastal well at Dinteloord, including supply and recovery lines and sensors.
28
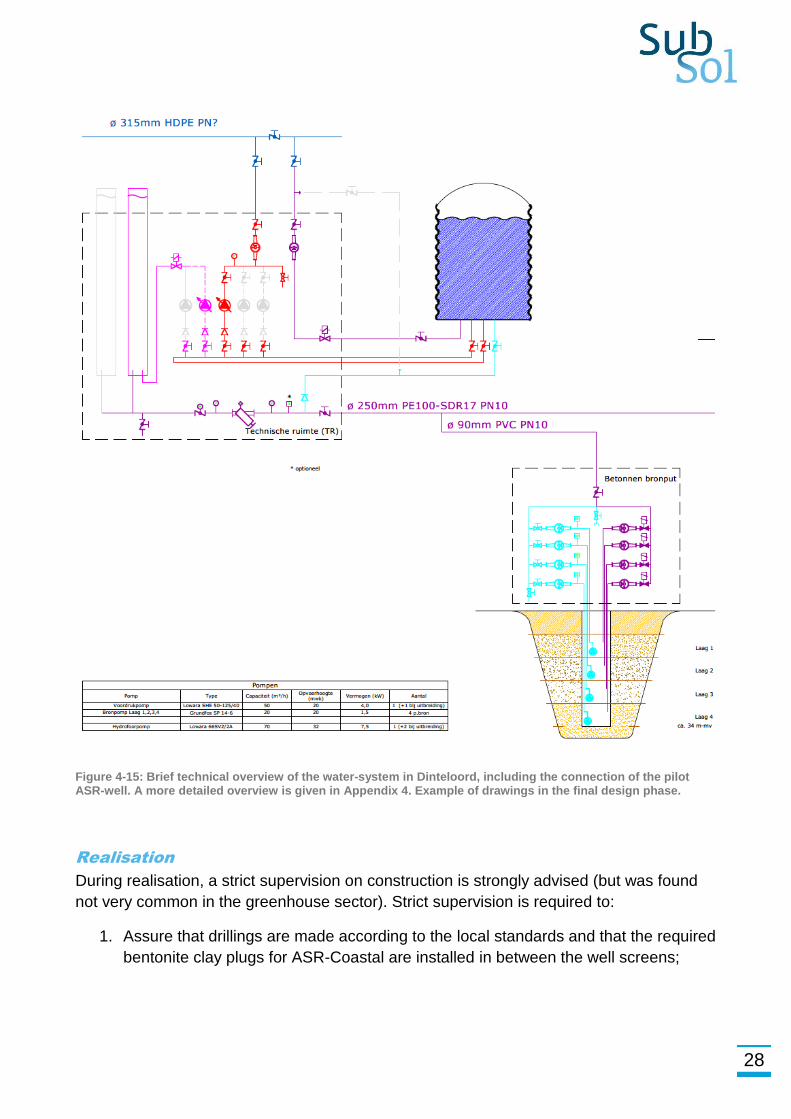
Figure 4-15: Brief technical overview of the water-system in Dinteloord, including the connection of the pilot ASR-well. A more detailed overview is given in Appendix 4. Example of drawings in the final design phase.
Realisation
During realisation, a strict supervision on construction is strongly advised (but was found
not very common in the greenhouse sector). Strict supervision is required to:
1. Assure that drillings are made according to the local standards and that the required
bentonite clay plugs for ASR-Coastal are installed in between the well screens;
29
2. Check and (when needed based on observed lithology) amend the screening of the
ASR-Coastal wells. This is vital for the success of the ASR-Coastal well.
- In Dinteloord: KWR supervised the complete first drilling made during every
drilling campaign. The drillers were obliged to hand in a coring description of
every well after reaching the final depth, before installing the well screens.
3. Demand extensive development of the well capacity (various methods can be
suitable) and demand capacity tests upon completion of the development.
4. Ascertain careful installation of submersible pumps: many submersible pumps are
damaged already during installation without following the installation description.
Once the ASR-scheme is completed, an extensive test must be executed to assure that
the demanded functionality is realised. In Dinteloord, this was done by KWR. Typical
elements required attention:
Coding of the different ASR-Coastal well layers in piping and software: using ASR-
Coastal means that each individual well segment can operate independently. It is
essential to ensure with 100% certainty that operation and monitoring is correctly
corresponding between the control system and the well layers.
Simple water installation and pumping technology, such as the rotation direction of
the pump, that will affect the performance of the ASR-Coastal scheme.
Calibration and integrity of sensors applied (EC, pH, temp, pressure).
4.2.9. IX: Monitoring and evaluation of the first ASR-cycles
Completing an ASR-Coastal scheme is one thing, but operating it may not be as straight
forward as a common (above-ground) reservoir. Therefore, special attention is required
during the first years of operation. In Dinteloord, the greenhouse cooperation owning the
ASR-scheme has contracted KWR to supervise and evaluate the operation, to write a
manual, and to improve the projection of the water demand and the impact thereof on the
operation of the ASR (mainly: filling level).
Specific attention in the first cycles should be given to:
Relatively equal distribution of infiltration water over the various wells and well
layers of the ASR-Coastal scheme;
Distribution of the recovery over the various wells and well layers of the ASR-
Coastal scheme: the recovery rate should mirror the injection rate per well, but
should predominantly occur through the shallow well layers of each well as a
response to the buoyancy effect;
Evaluation of water quality changes of the first few cycles enables to project the
final water quality during longer operation (Stuyfzand, 1998);
The assurance of proper collection, recording, and transfer of all data;
Calibration of sensors (where relevant);

30
Management of malfunctioning elements (sensors, valves, pumps);
Recording of the groundwater levels in the surroundings, as often obliged in the
permit;
Daily liaison with the operator (in Dinteloord: the greenhouse cooperation).
Every year, an extensive evaluation of the operation, effects, and water balance of the
ASR-Coastal scheme is performed for the Dinteloord site. The results are presented to the
Provincial authority (permitting agent) and members of the cooperation.
31
5. Technical details of the final set-up in Dinteloord
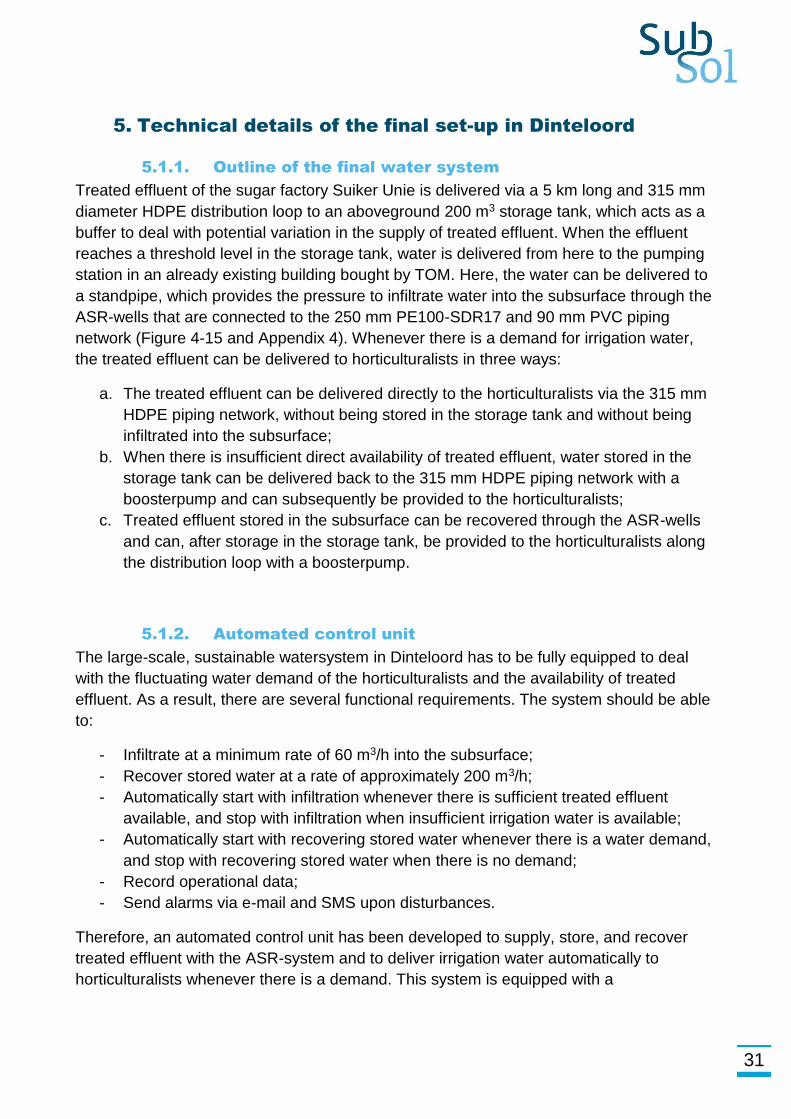
5.1.1. Outline of the final water system
Treated effluent of the sugar factory Suiker Unie is delivered via a 5 km long and 315 mm
diameter HDPE distribution loop to an aboveground 200 m3 storage tank, which acts as a
buffer to deal with potential variation in the supply of treated effluent. When the effluent
reaches a threshold level in the storage tank, water is delivered from here to the pumping
station in an already existing building bought by TOM. Here, the water can be delivered to
a standpipe, which provides the pressure to infiltrate water into the subsurface through the
ASR-wells that are connected to the 250 mm PE100-SDR17 and 90 mm PVC piping
network (Figure 4-15 and Appendix 4). Whenever there is a demand for irrigation water,
the treated effluent can be delivered to horticulturalists in three ways:
a. The treated effluent can be delivered directly to the horticulturalists via the 315 mm
HDPE piping network, without being stored in the storage tank and without being
infiltrated into the subsurface;
b. When there is insufficient direct availability of treated effluent, water stored in the
storage tank can be delivered back to the 315 mm HDPE piping network with a
boosterpump and can subsequently be provided to the horticulturalists;
c. Treated effluent stored in the subsurface can be recovered through the ASR-wells
and can, after storage in the storage tank, be provided to the horticulturalists along
the distribution loop with a boosterpump.
5.1.2. Automated control unit
The large-scale, sustainable watersystem in Dinteloord has to be fully equipped to deal
with the fluctuating water demand of the horticulturalists and the availability of treated
effluent. As a result, there are several functional requirements. The system should be able
to:
- Infiltrate at a minimum rate of 60 m3/h into the subsurface;
- Recover stored water at a rate of approximately 200 m3/h;
- Automatically start with infiltration whenever there is sufficient treated effluent
available, and stop with infiltration when insufficient irrigation water is available;
- Automatically start with recovering stored water whenever there is a water demand,
and stop with recovering stored water when there is no demand;
- Record operational data;
- Send alarms via e-mail and SMS upon disturbances.
Therefore, an automated control unit has been developed to supply, store, and recover
treated effluent with the ASR-system and to deliver irrigation water automatically to
horticulturalists whenever there is a demand. This system is equipped with a
32
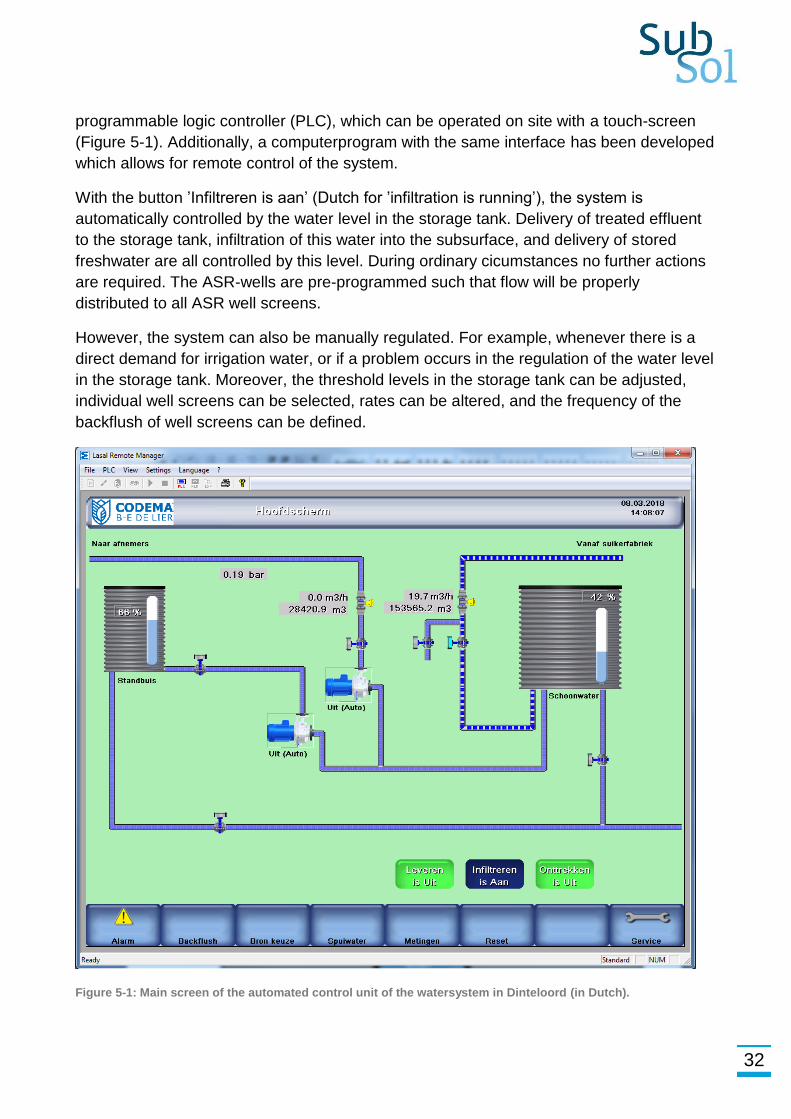
programmable logic controller (PLC), which can be operated on site with a touch-screen
(Figure 5-1). Additionally, a computerprogram with the same interface has been developed
which allows for remote control of the system.
With the button ’Infiltreren is aan’ (Dutch for ’infiltration is running’), the system is
automatically controlled by the water level in the storage tank. Delivery of treated effluent
to the storage tank, infiltration of this water into the subsurface, and delivery of stored
freshwater are all controlled by this level. During ordinary cicumstances no further actions
are required. The ASR-wells are pre-programmed such that flow will be properly
distributed to all ASR well screens.
However, the system can also be manually regulated. For example, whenever there is a
direct demand for irrigation water, or if a problem occurs in the regulation of the water level
in the storage tank. Moreover, the threshold levels in the storage tank can be adjusted,
individual well screens can be selected, rates can be altered, and the frequency of the
backflush of well screens can be defined.
Figure 5-1: Main screen of the automated control unit of the watersystem in Dinteloord (in Dutch).
33
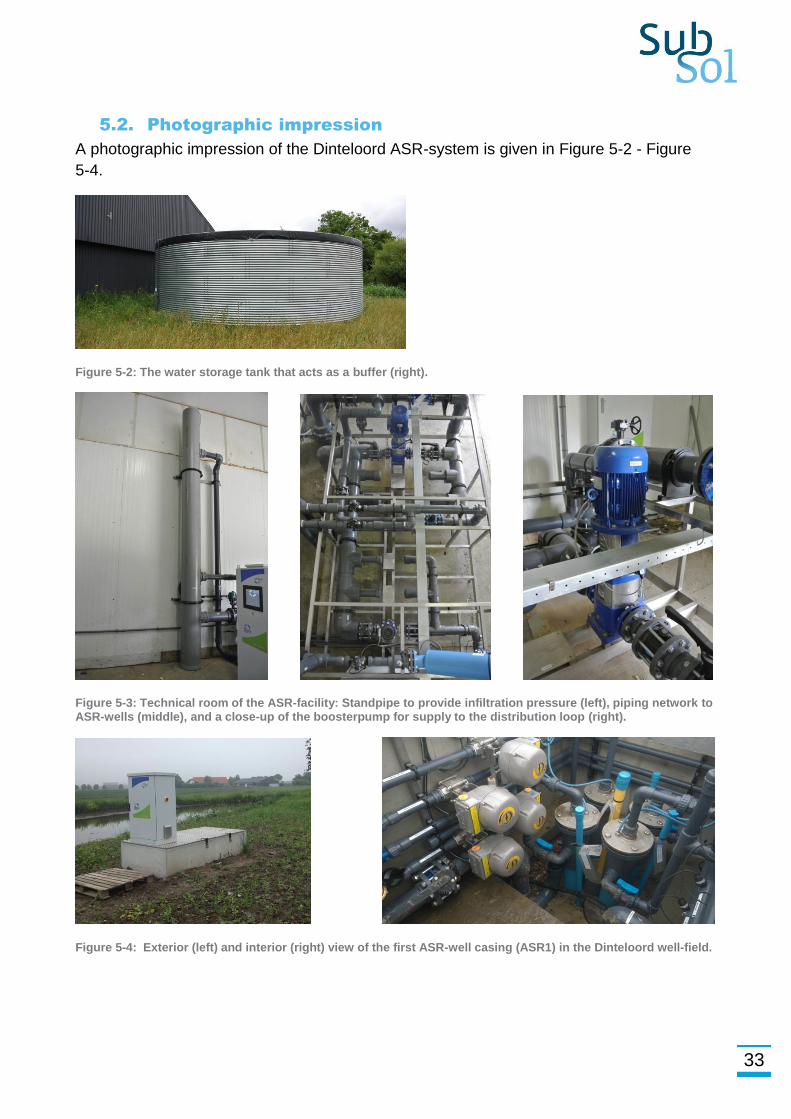
5.2. Photographic impression
A photographic impression of the Dinteloord ASR-system is given in Figure 5-2 - Figure
5-4.
Figure 5-2: The water storage tank that acts as a buffer (right).
Figure 5-3: Technical room of the ASR-facility: Standpipe to provide infiltration pressure (left), piping network to ASR-wells (middle), and a close-up of the boosterpump for supply to the distribution loop (right).
Figure 5-4: Exterior (left) and interior (right) view of the first ASR-well casing (ASR1) in the Dinteloord well-field.

34
35
6. Organisation with multiple end users on one waste
water reuse & ASR-Coastal Scheme
Using waste water from one party for later use (after aquifer storage) by a second party
involves clear agreements between the different parties. The Dinteloord site provides an
interesting example of how such an organisational structure may look like.
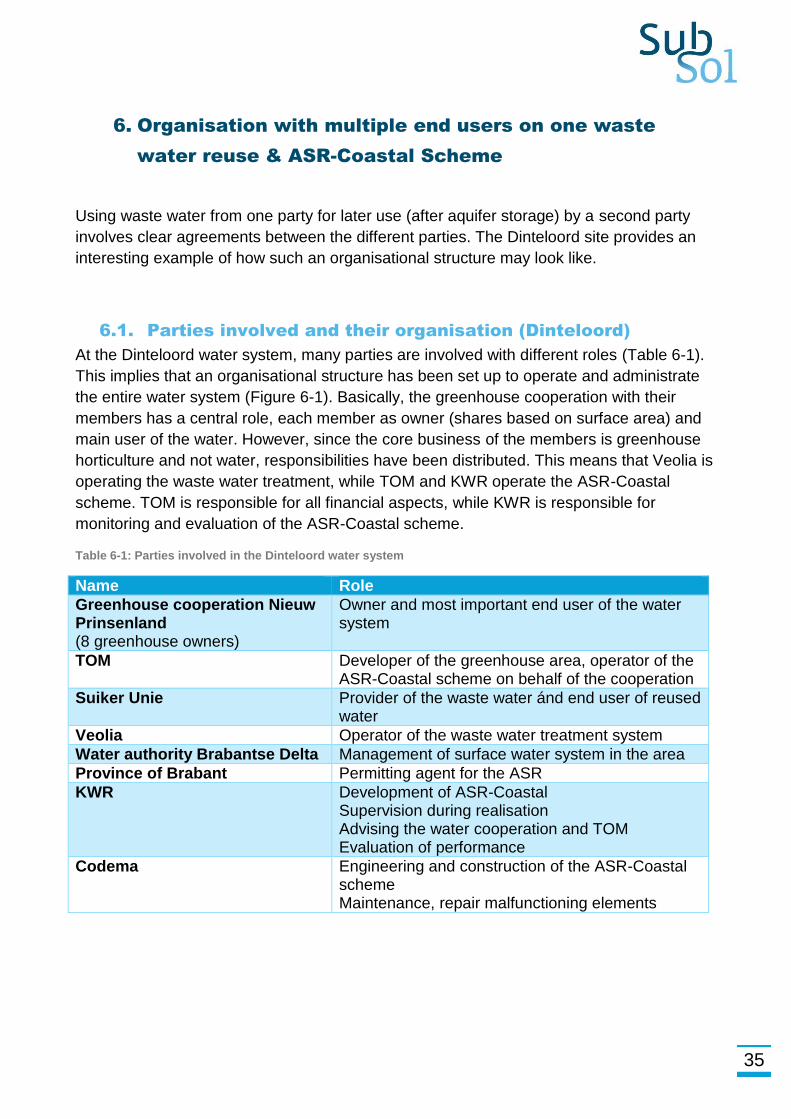
6.1. Parties involved and their organisation (Dinteloord)
At the Dinteloord water system, many parties are involved with different roles (Table 6-1).
This implies that an organisational structure has been set up to operate and administrate
the entire water system (Figure 6-1). Basically, the greenhouse cooperation with their
members has a central role, each member as owner (shares based on surface area) and
main user of the water. However, since the core business of the members is greenhouse
horticulture and not water, responsibilities have been distributed. This means that Veolia is
operating the waste water treatment, while TOM and KWR operate the ASR-Coastal
scheme. TOM is responsible for all financial aspects, while KWR is responsible for
monitoring and evaluation of the ASR-Coastal scheme.
Table 6-1: Parties involved in the Dinteloord water system
Name Role
Greenhouse cooperation Nieuw Prinsenland (8 greenhouse owners)
Owner and most important end user of the water system
TOM Developer of the greenhouse area, operator of the ASR-Coastal scheme on behalf of the cooperation
Suiker Unie Provider of the waste water ánd end user of reused water
Veolia Operator of the waste water treatment system
Water authority Brabantse Delta Management of surface water system in the area
Province of Brabant Permitting agent for the ASR
KWR Development of ASR-Coastal Supervision during realisation Advising the water cooperation and TOM Evaluation of performance
Codema Engineering and construction of the ASR-Coastal scheme Maintenance, repair malfunctioning elements
36
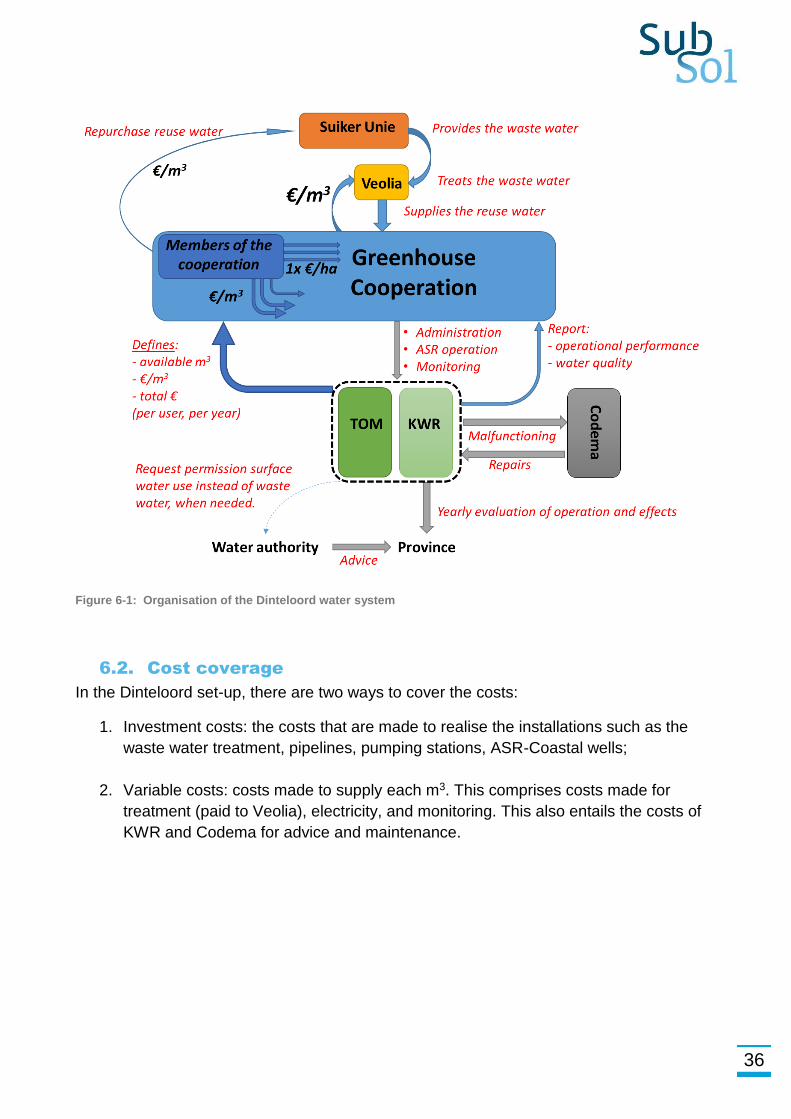
Figure 6-1: Organisation of the Dinteloord water system
6.2. Cost coverage
In the Dinteloord set-up, there are two ways to cover the costs:
1. Investment costs: the costs that are made to realise the installations such as the
waste water treatment, pipelines, pumping stations, ASR-Coastal wells;
2. Variable costs: costs made to supply each m3. This comprises costs made for
treatment (paid to Veolia), electricity, and monitoring. This also entails the costs of
KWR and Codema for advice and maintenance.
37
The variable costs are calculated at the end of every year and may change over the years,
depending on the need for maintenance and the total volume supplied. The users that use
more water will automatically pay more to cover the total costs. The billing is executed by
TOM.
6.3. Distribution and trading of water rights
The ASR-Coastal scheme has a maximum recoverable volume that can be supplied,
which may vary over the years. Each spring, the recoverable freshwater volume is
estimated by KWR, upon which TOM distributes the water volumes over the different
users, based on their surface area. The users have a right to take at least this water
volume. Users having a low water demand, can however transfer their rights to users with
a high water demand. These transfers must be communicated to TOM.
The recovery rate is limited to 200 m3/h, which is 1 m3/h per hectare of greenhouse. This is
therefore the minimum guaranteed supply rate for each user. Again, rates can be
transferred from one user to the other.

38
39
7. Conclusions on the use of ASR-Coastal for water reuse
In this document, the experiences of applying ASR-Coastal for the storage of reused water
for later use are collected as a guiding document. A step-by-step approach toward
implementation is presented, including examples from the Dinteloord ASR-Coastal
scheme.
7.1. Lessons learned
The most important lessons learned for applying ASR-Coastal for water reuse are:
Take it step-by-step
There are various elements that can fail when applying ASR-Coastal or while reusing
(treated) waste water. A careful step-by-step approach (Chapter 4) with a critical but open
view is required toward realisation. Do the homework (desk-studies), verify important
assumptions with field measurements, model early, and validate ánd demonstrate with a
small-scale pilot. This also involves continuously (every step) informing targeted water
users, authorities, neighbours, and the supplier of the waste water. All aspects such as
technical feasibility, economic viability, and hydrological acceptability should constantly be
assessed in an iterative process.
Demonstrate and communicate
Both water reuse and ASR-Coastal involves complex processes and technology. A clear
demonstration and communication are vital to inform stakeholders, end users, the public
and of course the water users. For the Dinteloord case, this involved information panels, a
short informative movie (shot by drone1), a public opening2, and a comprehensive article in
a professional journal with details on the complete set-up3. The water users were
particularly informed by regular meetings with their cooperation. The pTA session
organized within Subsol was very useful to inform and involve a broad range of
stakeholders.
Set-up the organisational structure
As shown in Chapter 5, combining reuse with aquifer storage and recovery for various end
users can require a firm organisational structure with clear roles for each party. In
Dinteloord, this structure was set up by the TOM, which was developing the area and
acted as a director. The TOM is a stable, central organisation with a good overview of all
processes in the area and the ability to assess technical and economic viability based on
information provided by experts. 1 vimeo.com/256952109 2 https://www.alliedwaters.com/news/sugar-beet-reuse-water-used-to-grow-tomatoes/ 3 https://www.h2owaternetwerk.nl/vakartikelen/1488-waterhergebruik-en-berging-met-aquifer-storage-and-recovery-asr-op-tuinbouwlocatie-nieuw-prinsenland
40
7.2. Potential in different settings
At the Dinteloord site, the ASR-Coastal was successful in storing treated waste water for
later reuse. Success at other sites will be strongly dependent on the local hydrogeological
conditions. Use of the ASR-Coastal and Freshmaker Technological and Economical
guides (D1.5 and D1.7 of the Subsol project) can together with the current guide support
end users in evaluating subsurface water solutions in combination with water reuse. In
general, potential of aquifer storage will be dependent on the presence of a suitable
aquifer: permeable and preferably fresh, or otherwise suitable for SWS (see D1.5 and
D1.7). Additionally, the aquifer should be suitable the retain the water. In other words: the
water should not rapidly exfiltrate upon injection. Most viable conditions exist where
aquifers are already depleted (resulting in salinization and declining groundwater levels), in
coastal areas, and in areas with low groundwater levels.
41
References
Antoniou, E. A., Van Breukelen, B. M., Putters, B., & Stuyfzand, P. J. (2012).
Hydrogeochemical patterns, processes and mass transfers during aquifer storage and
recovery (ASR) in an anoxic sandy aquifer. Applied geochemistry, 27(12), 2435-2452.
Dillon, P. et al., 2006. Role of aquifer storage in water reuse. Desalination, 188(1-3): 123-
134.
European Commission, 2018. Proposal for a regulation of the European Parliament and of
the Council on minimum requirements for water reuse.
Bakker, M., 2010. Radial Dupuit interface flow to assess the aquifer storage and recovery
potential of saltwater aquifers. Hydrogeology Journal, 18(1): 107-115.
Dillon, P. et al., 2006. Role of aquifer storage in water reuse. Desalination, 188(1-3): 123-
134.
European Commission, 2018. Proposal for a regulation of the European Parliament and of
the Council on minimum requirements for water reuse.
Langevin, C. D. (2008). "Modeling Axisymmetric Flow and Transport." Ground water 46(4):
579-590.
Stuyfzand, P.J., 1998. Quality changes upon injection into anoxic aquifers in the
Netherlands: Evaluation of 11 experiments In: Peter, J.H. (Ed.), Artificial recharge of
groundwater, Proc. 3rd Intern. Symp. on Artificial Recharge. Balkema, Amsterdam, The
Netherlands, pp. 283-291.
Stuyfzand, P.J., 2002. Optimizing the cycle testing and chemical monitoring program for
new ASR wells by a monitoring expert system in water resources. In: Dillon, P. (Ed.), 4th
Internat.Symp. on Artificial Recharge. Swets & Zeitinger, Lisse, Adelaide, Australia.

42
43
Appendix 1. Characterization of the target aquifer
A1.1. Characterization of the target aquifer
A detailed characterization of the target aquifer was achieved by:
Grain size analysis of samples taken from monitoring well PB1 (Figure 4-13);
Borehole logging using the Robertson DIL-38 Probe in March 23, 2016);
A pumping test performed in April 2016;
Sampling the targeted depth intervals of well screens for geochemical analysis.
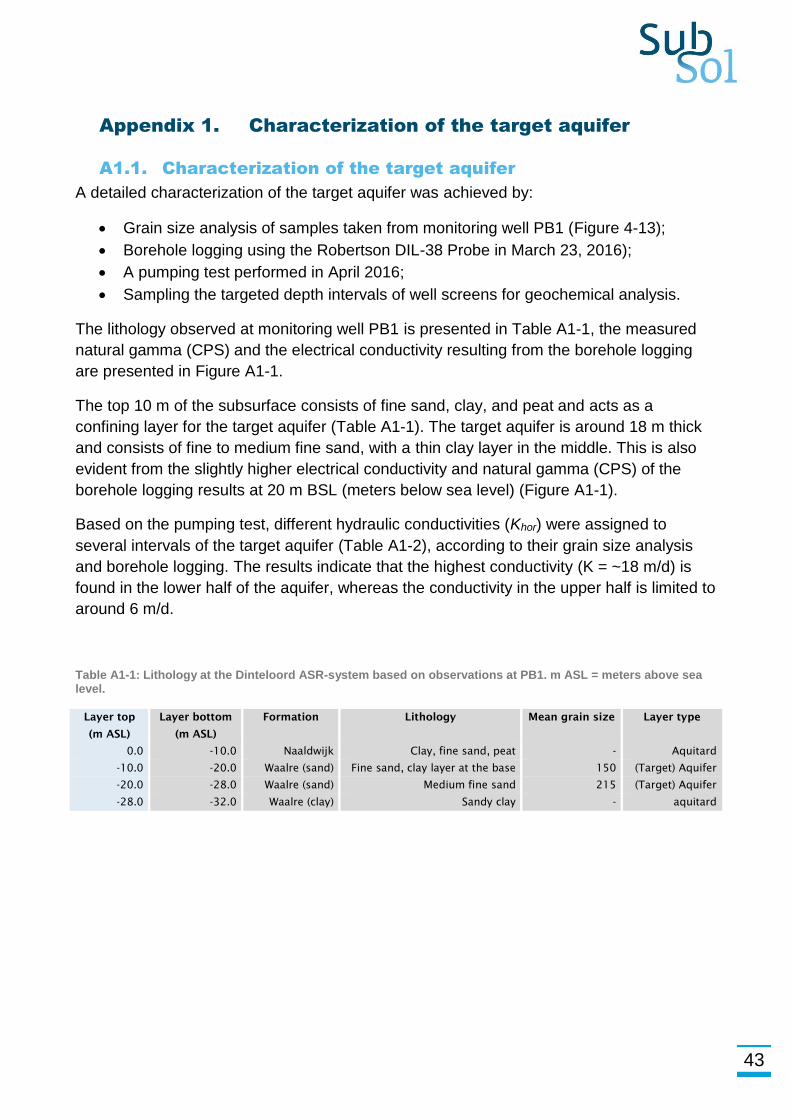
The lithology observed at monitoring well PB1 is presented in Table A1-1, the measured
natural gamma (CPS) and the electrical conductivity resulting from the borehole logging
are presented in Figure A1-1.
The top 10 m of the subsurface consists of fine sand, clay, and peat and acts as a
confining layer for the target aquifer (Table A1-1). The target aquifer is around 18 m thick
and consists of fine to medium fine sand, with a thin clay layer in the middle. This is also
evident from the slightly higher electrical conductivity and natural gamma (CPS) of the
borehole logging results at 20 m BSL (meters below sea level) (Figure A1-1).
Based on the pumping test, different hydraulic conductivities (Khor) were assigned to
several intervals of the target aquifer (Table A1-2), according to their grain size analysis
and borehole logging. The results indicate that the highest conductivity (K = ~18 m/d) is
found in the lower half of the aquifer, whereas the conductivity in the upper half is limited to
around 6 m/d.
Table A1-1: Lithology at the Dinteloord ASR-system based on observations at PB1. m ASL = meters above sea level.
Layer top Layer bottom Formation Lithology Mean grain size Layer type
(m ASL) (m ASL)
0.0 -10.0 Naaldwijk Clay, fine sand, peat - Aquitard
-10.0 -20.0 Waalre (sand) Fine sand, clay layer at the base 150 (Target) Aquifer
-20.0 -28.0 Waalre (sand) Medium fine sand 215 (Target) Aquifer
-28.0 -32.0 Waalre (clay) Sandy clay - aquitard
44
Figure A1-1: Natural gamma log and electrical conductivity at PB1 (Figure 4-13) on March 2016, after the first injection of freshwater. The blue rectangles represent the well screens of the first ASR well. The EC of the formation at the depth of these well screens is 0 mS/m, because treated effluent with a very low EC (<50 µS/cm) was already injected at the time of logging.
Table A1-2: Hydrogeological parameterization based on the pumping test performed at the Dinteloord ASR-site. The depth is given in m BLS, which is an abbreviation for meters below the land surface.
Geological unit
Depth
(m BLS)
Thickness model layer
(m)
Effective porosity
(-)
Khor
(m/d)
Khor / Kvert
(-)
Storativity (S)
(-)
Top layer 0 - 1 1 0.3 5 3 0.1 Phreatic layer 1 - 5 4 0.3 5 3 1.0E-04
Clay cap 5 - 12 7 0.2 0.1 10
1.0E-04
Aquifer 1a 12 - 20 8 0.35 6 1 5.0E-05
Aquitard 1a 20 - 21 1 0.2 0.4 10 1.0E-04
Aquifer 1b 21 - 25 4 0.35 6 3 1.0E-04
Aquitard 1b 25 - 26 1 0.2 3 10 1.0E-04
Aquifer 1c 26 - 30 4 0.35 18 3 1.0E-04
Aquitard 1c 30 - 37 7 0.2 0.14 10 1.0E-04
Aquifer 2 37 - 40 3 0.35 10 3 1.0E-05
Aquitard 2 40 - 50 10 0.2 0.02 10 1.0E-05
Aquifer 3 -49 - -69 20 0.35 15 3 1.0E-06
45
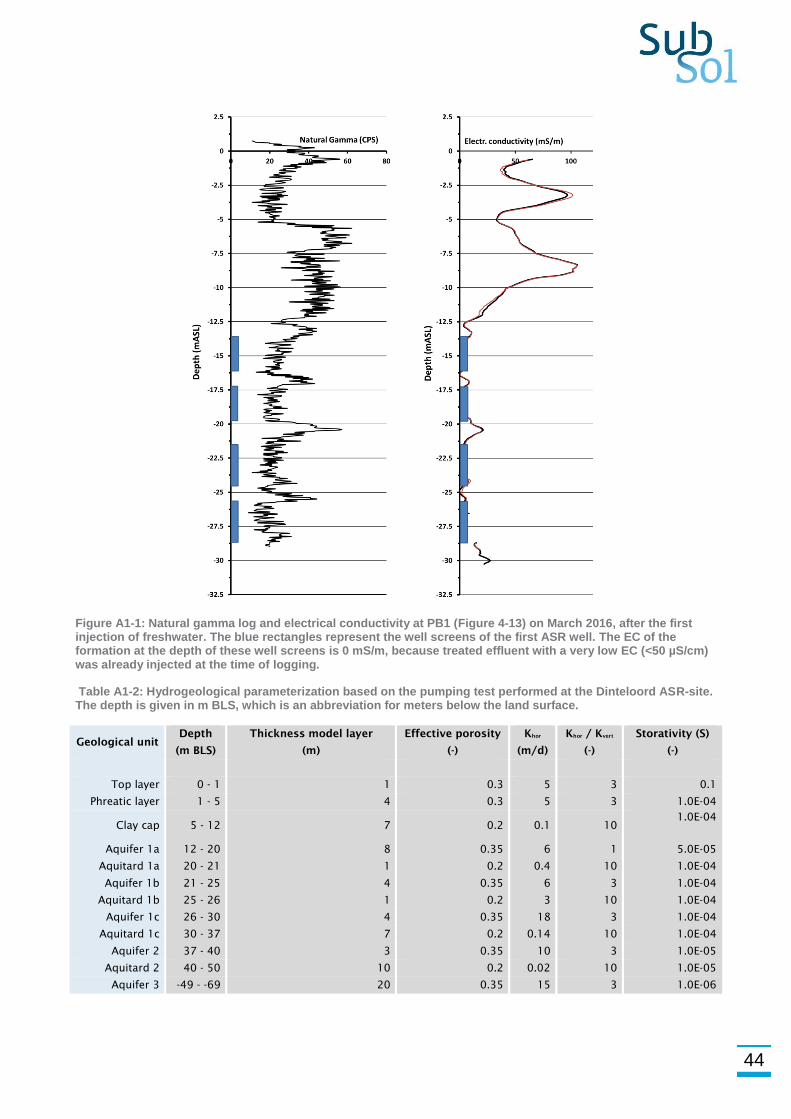
Monitoring well PB1 has been sampled at the targeted intervals of the ASR-screens for
geochemical analysis. The results indicate that the target aquifer will be most reactive
around screen ASR1.2, followed by ASR1.1 (Table A1-3). Here, the highest contents of
Soil Organic Material (SOM), calcite, siderite, and various metals were observed.
However, the highest pyrite content (and probably As content; Zn, Ni and Co seem less
connected with pyrite) was observed at ASR1.4. The high contents of Mg suggest that the
carbonates may be present as dolomite ((Ca,Mg)CO3) or dolomitic limestone, and that Mg
is at least partly silica-bound. Groundwater quality suggests, however, that very low Mg
CaCO3 should be present and thus that most Mg is silica-bound, e.g. as biotite.
Table A1-3: Geochemical results based on mixed samples from PB1 at the depth of the ASR well screens
Interval: ASR1.1 ASR1.2 ASR1.3 ASR1.4
Parameter
Dry residue 105°C (g/g) % 81.0 81.8 80.8 85.0
Loss on ignition 550°C (g/g) % 79.1 80.1 80.2 84.7
Residue 1000°C (g/g) % 78.1 78.8 79.6 84.3
Sodium upon HNO3 destruction mg/kg dw 100 120 88 53
Potassium upon HNO3 destruction mg/kg dw 935 1100 500 250
Calcium upon HNO3 destruction mg/kg dw 3170 6575 2330 465
Magnesium upon HNO3 destruction mg/kg dw 2460 4190 2050 430
Iron upon HNO3 destruction mg/kg dw 15855 28755 6515 4045
Manganese upon HNO3 destruction mg/kg dw 165 380 77 15
Silica upon HNO3 destruction* mg/kg dw 2195 2625 1780 1615
Aluminium upon HNO3 destruction mg/kg dw 6820 7285 2980 1470
Arsenic upon HNO3 destruction mg/kg dw 2.8 3.8 2.1 18
Barium upon HNO3 destruction mg/kg dw 15 16 7.9 4.5
Nickel upon HNO3 destruction mg/kg dw 13 9.3 6.6 4.4
Cobalt upon HNO3 destruction mg/kg dw 4.8 3.7 2.2 4.2
Chromium upon HNO3 destruction mg/kg dw 12 14 7.9 3.2
Titan upon HNO3 destruction mg/kg dw 32 45 43 22
Zinc upon HNO3 destruction mg/kg dw 17 14 9.6 4.7
C % 0.31 1.09 0.18 0.07
S % 0.05 0.06 0.02 0.16
SOM (calculated using C) % 0.62 2.18 0.36 0.14
CaCO3 (calculated using Ca) % 0.79 1.64 0.58 0.12
Pyrite (calculated using S) % 0.09 0.10 0.04 0.30
Mg/Ca (molar ratio) 1.28 1.05 1.45 1.52
K/Al 0.09 0.10 0.12 0.12
* Far too low by incomplete dissolution in HNO3
46
A1.2. Characterization of the native groundwater
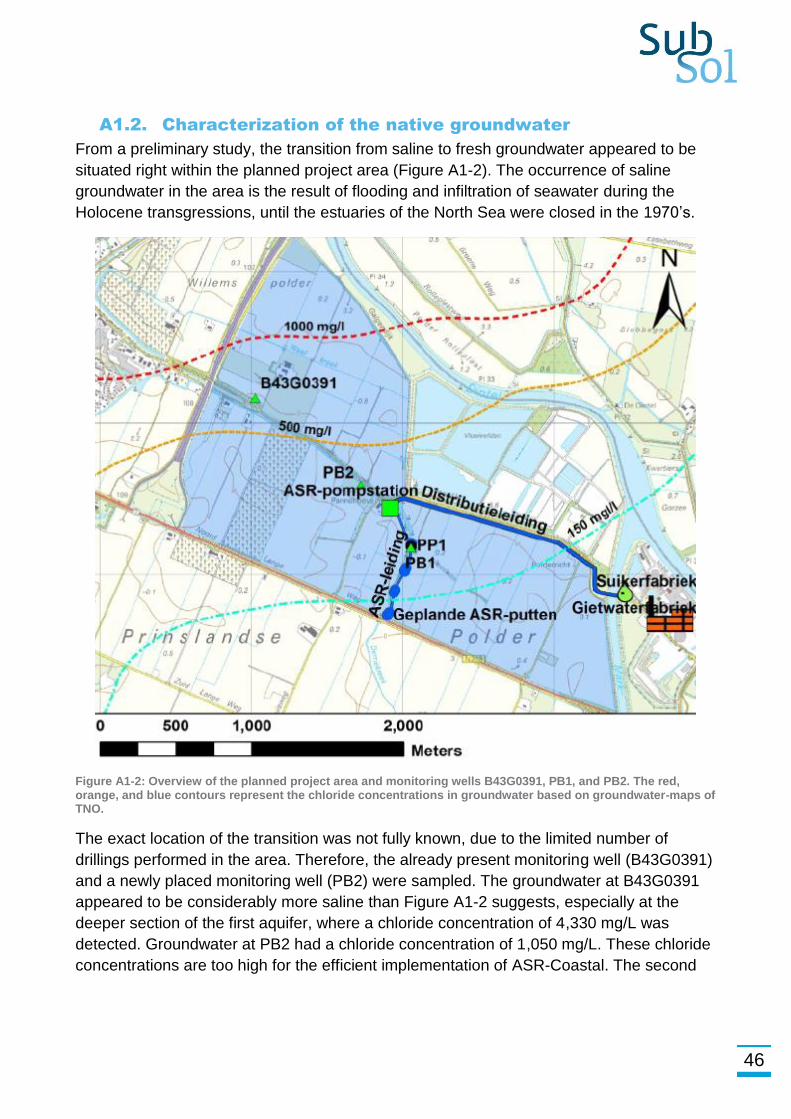
From a preliminary study, the transition from saline to fresh groundwater appeared to be
situated right within the planned project area (Figure A1-2). The occurrence of saline
groundwater in the area is the result of flooding and infiltration of seawater during the
Holocene transgressions, until the estuaries of the North Sea were closed in the 1970’s.
Figure A1-2: Overview of the planned project area and monitoring wells B43G0391, PB1, and PB2. The red, orange, and blue contours represent the chloride concentrations in groundwater based on groundwater-maps of TNO.
The exact location of the transition was not fully known, due to the limited number of
drillings performed in the area. Therefore, the already present monitoring well (B43G0391)
and a newly placed monitoring well (PB2) were sampled. The groundwater at B43G0391
appeared to be considerably more saline than Figure A1-2 suggests, especially at the
deeper section of the first aquifer, where a chloride concentration of 4,330 mg/L was
detected. Groundwater at PB2 had a chloride concentration of 1,050 mg/L. These chloride
concentrations are too high for the efficient implementation of ASR-Coastal. The second
47
aquifer is even more saline and therefore also unsuitable. On top of this, the gas-station
close to PB2 is sensitive to subsidence (Figure 3-2).
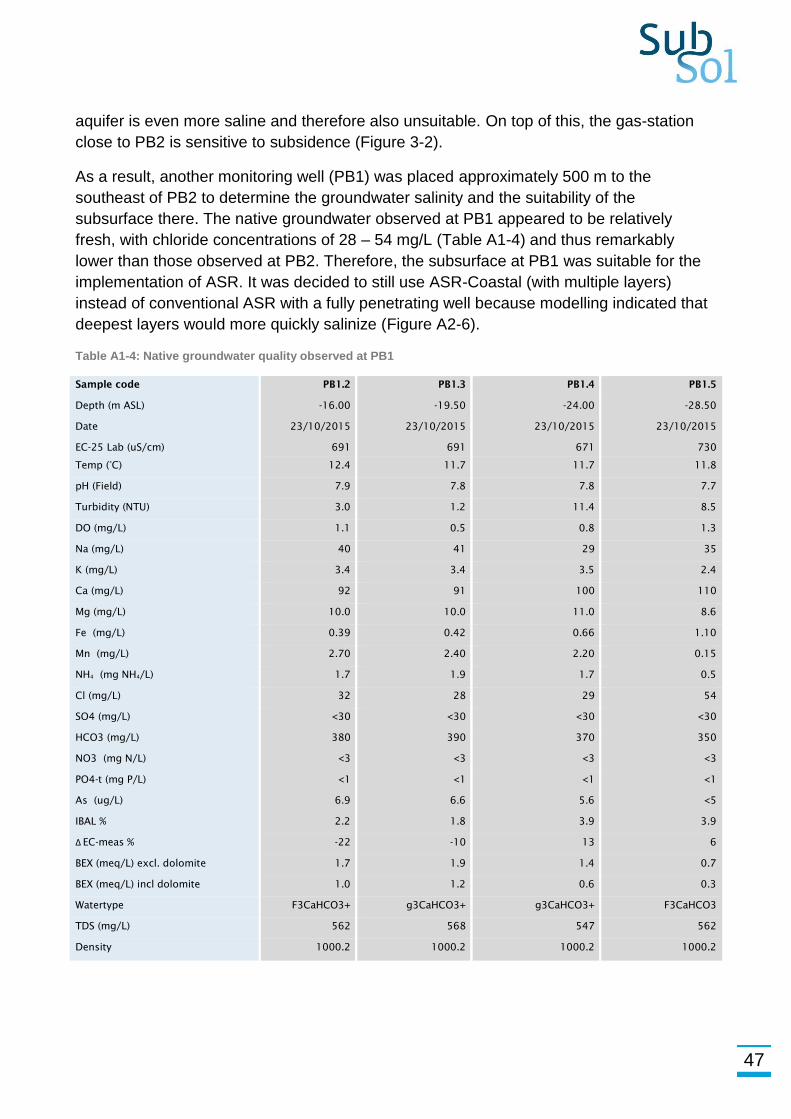
As a result, another monitoring well (PB1) was placed approximately 500 m to the
southeast of PB2 to determine the groundwater salinity and the suitability of the
subsurface there. The native groundwater observed at PB1 appeared to be relatively
fresh, with chloride concentrations of 28 – 54 mg/L (Table A1-4) and thus remarkably
lower than those observed at PB2. Therefore, the subsurface at PB1 was suitable for the
implementation of ASR. It was decided to still use ASR-Coastal (with multiple layers)
instead of conventional ASR with a fully penetrating well because modelling indicated that
deepest layers would more quickly salinize (Figure A2-6).
Table A1-4: Native groundwater quality observed at PB1
Sample code PB1.2 PB1.3 PB1.4 PB1.5
Depth (m ASL) -16.00 -19.50 -24.00 -28.50
Date 23/10/2015 23/10/2015 23/10/2015 23/10/2015
EC-25 Lab (uS/cm) 691 691 671 730
Temp (°C) 12.4 11.7 11.7 11.8
pH (Field) 7.9 7.8 7.8 7.7
Turbidity (NTU) 3.0 1.2 11.4 8.5
DO (mg/L) 1.1 0.5 0.8 1.3
Na (mg/L) 40 41 29 35
K (mg/L) 3.4 3.4 3.5 2.4
Ca (mg/L) 92 91 100 110
Mg (mg/L) 10.0 10.0 11.0 8.6
Fe (mg/L) 0.39 0.42 0.66 1.10
Mn (mg/L) 2.70 2.40 2.20 0.15
NH4 (mg NH4/L) 1.7 1.9 1.7 0.5
Cl (mg/L) 32 28 29 54
SO4 (mg/L) <30 <30 <30 <30
HCO3 (mg/L) 380 390 370 350
NO3 (mg N/L) <3 <3 <3 <3
PO4-t (mg P/L) <1 <1 <1 <1
As (ug/L) 6.9 6.6 5.6 <5
IBAL % 2.2 1.8 3.9 3.9
Δ EC-meas % -22 -10 13 6
BEX (meq/L) excl. dolomite 1.7 1.9 1.4 0.7
BEX (meq/L) incl dolomite 1.0 1.2 0.6 0.3
Watertype F3CaHCO3+ g3CaHCO3+ g3CaHCO3+ F3CaHCO3
TDS (mg/L) 562 568 547 562
Density 1000.2 1000.2 1000.2 1000.2
48
Appendix 2. Results of the small scale pilot: ASR1
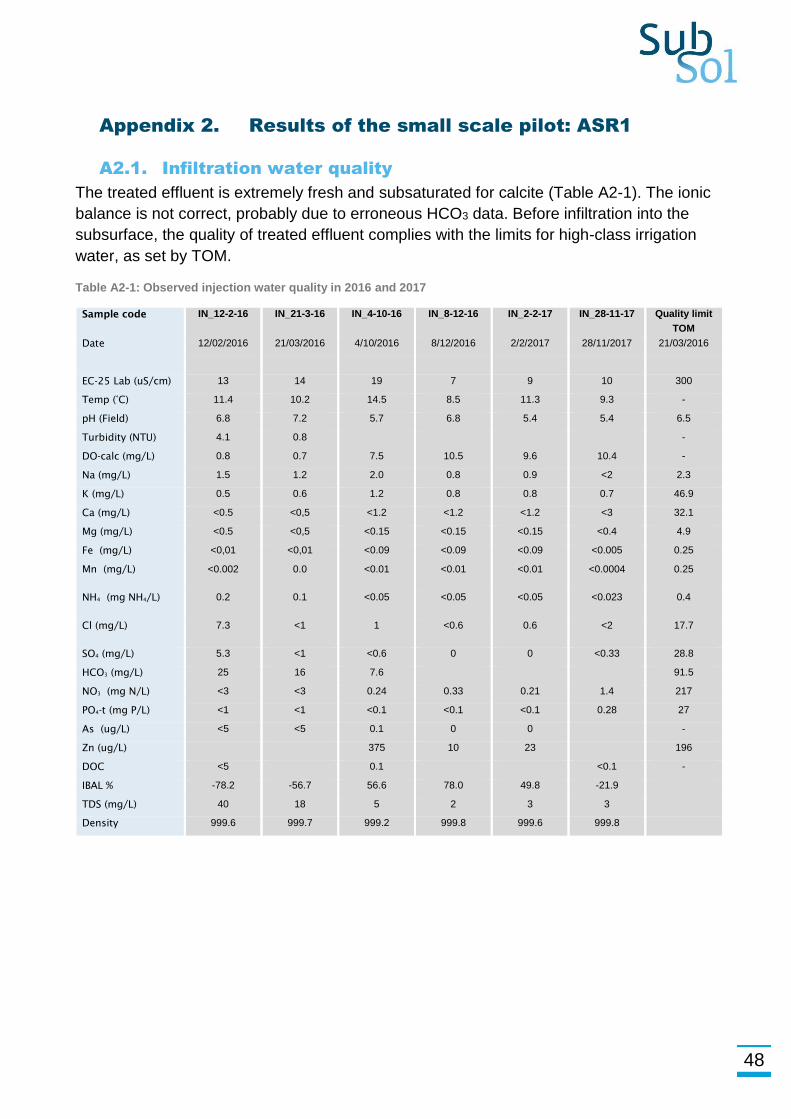
A2.1. Infiltration water quality
The treated effluent is extremely fresh and subsaturated for calcite (Table A2-1). The ionic
balance is not correct, probably due to erroneous HCO3 data. Before infiltration into the
subsurface, the quality of treated effluent complies with the limits for high-class irrigation
water, as set by TOM.
Table A2-1: Observed injection water quality in 2016 and 2017
Sample code IN_12-2-16 IN_21-3-16 IN_4-10-16 IN_8-12-16 IN_2-2-17 IN_28-11-17 Quality limit
TOM
Date 12/02/2016 21/03/2016 4/10/2016 8/12/2016 2/2/2017 28/11/2017 21/03/2016
EC-25 Lab (uS/cm) 13 14 19 7 9 10 300
Temp (°C) 11.4 10.2 14.5 8.5 11.3 9.3 -
pH (Field) 6.8 7.2 5.7 6.8 5.4 5.4 6.5
Turbidity (NTU) 4.1 0.8 -
DO-calc (mg/L) 0.8 0.7 7.5 10.5 9.6 10.4 -
Na (mg/L) 1.5 1.2 2.0 0.8 0.9 <2 2.3
K (mg/L) 0.5 0.6 1.2 0.8 0.8 0.7 46.9
Ca (mg/L) <0.5 <0,5 <1.2 <1.2 <1.2 <3 32.1
Mg (mg/L) <0.5 <0,5 <0.15 <0.15 <0.15 <0.4 4.9
Fe (mg/L) <0,01 <0,01 <0.09 <0.09 <0.09 <0.005 0.25
Mn (mg/L) <0.002 0.0 <0.01 <0.01 <0.01 <0.0004 0.25
NH4 (mg NH4/L) 0.2 0.1 <0.05 <0.05 <0.05 <0.023 0.4
Cl (mg/L) 7.3 <1 1 <0.6 0.6 <2 17.7
SO4 (mg/L) 5.3 <1 <0.6 0 0 <0.33 28.8
HCO3 (mg/L) 25 16 7.6 91.5
NO3 (mg N/L) <3 <3 0.24 0.33 0.21 1.4 217
PO4-t (mg P/L) <1 <1 <0.1 <0.1 <0.1 0.28 27
As (ug/L) <5 <5 0.1 0 0 -
Zn (ug/L) 375 10 23 196
DOC <5 0.1 <0.1 -
IBAL % -78.2 -56.7 56.6 78.0 49.8 -21.9
TDS (mg/L) 40 18 5 2 3 3
Density 999.6 999.7 999.2 999.8 999.6 999.8
49
A2.2. Water quantity
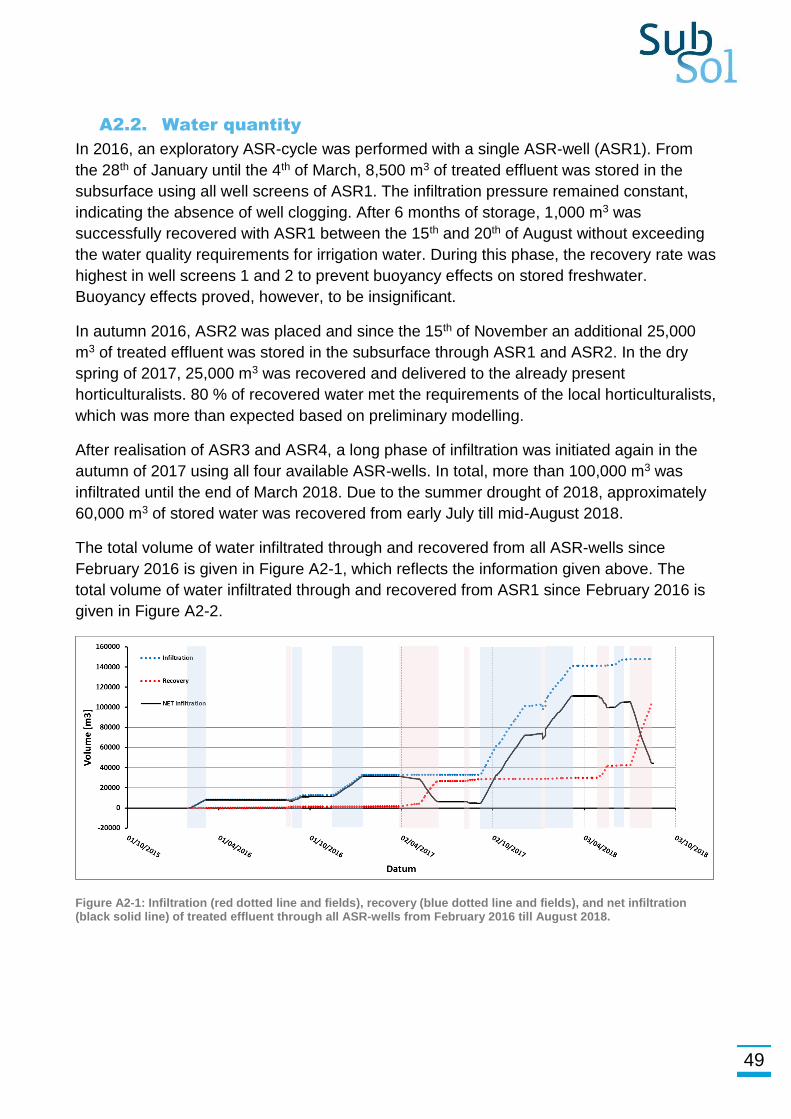
In 2016, an exploratory ASR-cycle was performed with a single ASR-well (ASR1). From
the 28th of January until the 4th of March, 8,500 m3 of treated effluent was stored in the
subsurface using all well screens of ASR1. The infiltration pressure remained constant,
indicating the absence of well clogging. After 6 months of storage, 1,000 m3 was
successfully recovered with ASR1 between the 15th and 20th of August without exceeding
the water quality requirements for irrigation water. During this phase, the recovery rate was
highest in well screens 1 and 2 to prevent buoyancy effects on stored freshwater.
Buoyancy effects proved, however, to be insignificant.
In autumn 2016, ASR2 was placed and since the 15th of November an additional 25,000
m3 of treated effluent was stored in the subsurface through ASR1 and ASR2. In the dry
spring of 2017, 25,000 m3 was recovered and delivered to the already present
horticulturalists. 80 % of recovered water met the requirements of the local horticulturalists,
which was more than expected based on preliminary modelling.
After realisation of ASR3 and ASR4, a long phase of infiltration was initiated again in the
autumn of 2017 using all four available ASR-wells. In total, more than 100,000 m3 was
infiltrated until the end of March 2018. Due to the summer drought of 2018, approximately
60,000 m3 of stored water was recovered from early July till mid-August 2018.
The total volume of water infiltrated through and recovered from all ASR-wells since
February 2016 is given in Figure A2-1, which reflects the information given above. The
total volume of water infiltrated through and recovered from ASR1 since February 2016 is
given in Figure A2-2.
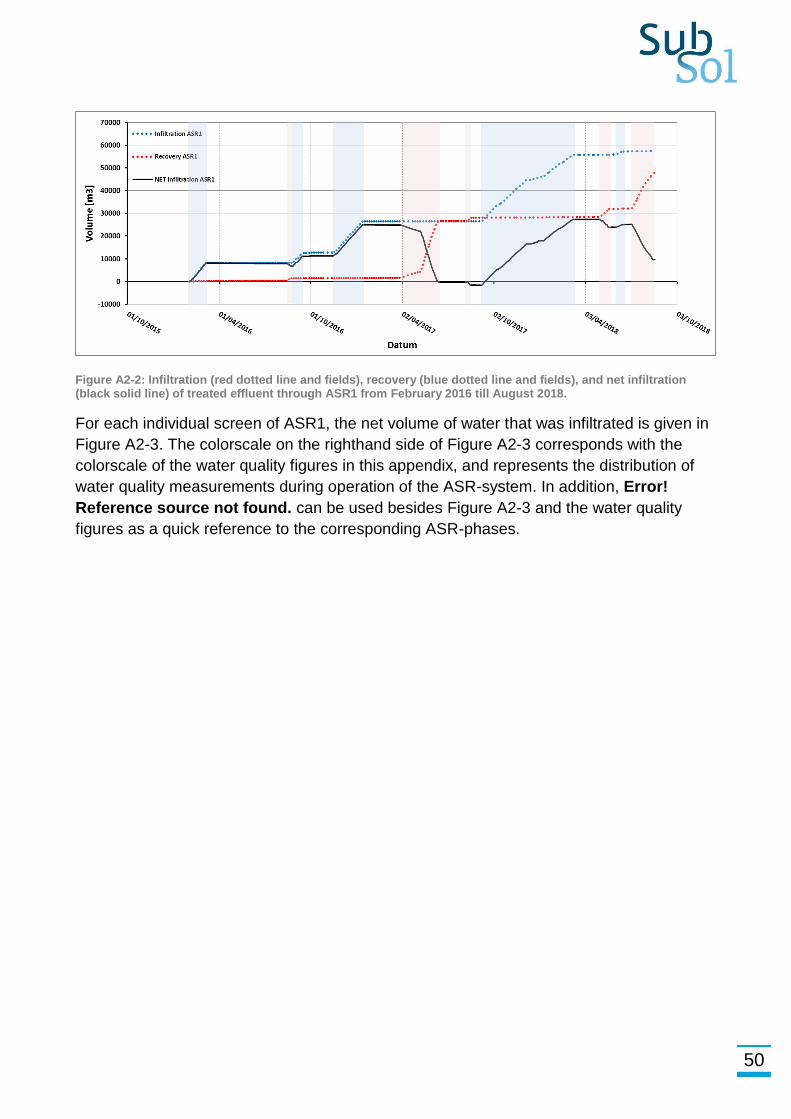
Figure A2-1: Infiltration (red dotted line and fields), recovery (blue dotted line and fields), and net infiltration (black solid line) of treated effluent through all ASR-wells from February 2016 till August 2018.
50
Figure A2-2: Infiltration (red dotted line and fields), recovery (blue dotted line and fields), and net infiltration (black solid line) of treated effluent through ASR1 from February 2016 till August 2018.
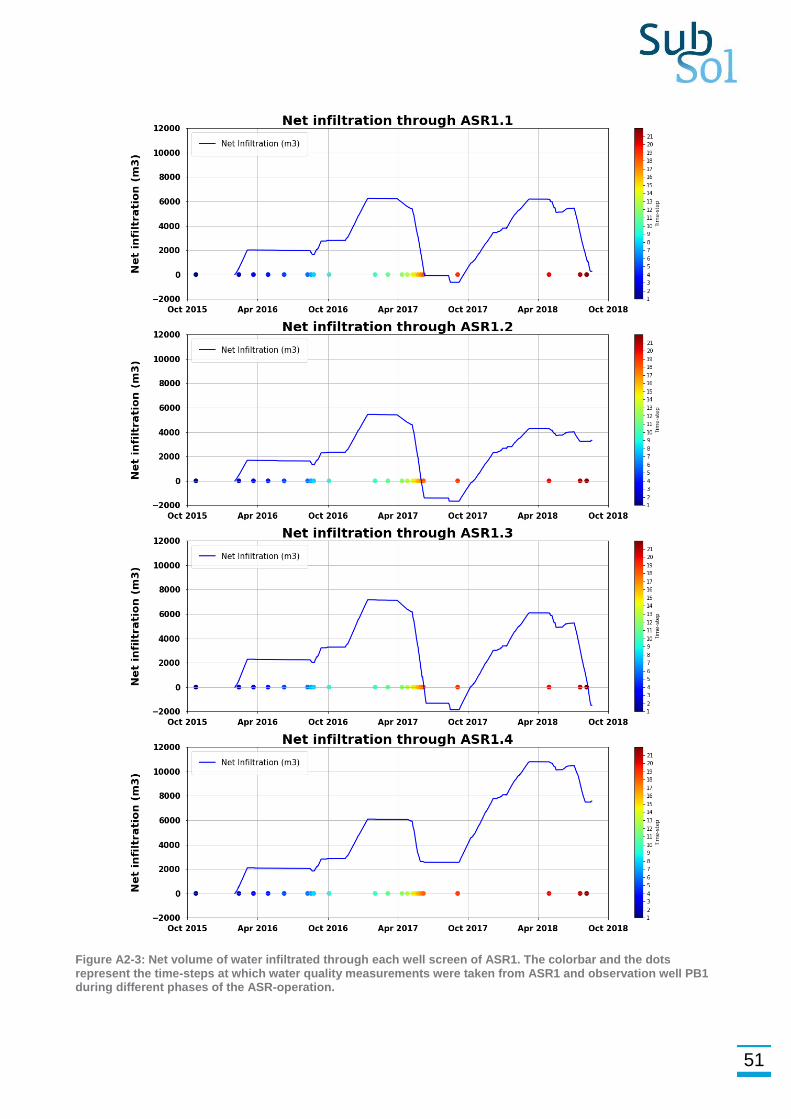
For each individual screen of ASR1, the net volume of water that was infiltrated is given in
Figure A2-3. The colorscale on the righthand side of Figure A2-3 corresponds with the
colorscale of the water quality figures in this appendix, and represents the distribution of
water quality measurements during operation of the ASR-system. In addition, Error!
Reference source not found. can be used besides Figure A2-3 and the water quality
figures as a quick reference to the corresponding ASR-phases.
51
Figure A2-3: Net volume of water infiltrated through each well screen of ASR1. The colorbar and the dots represent the time-steps at which water quality measurements were taken from ASR1 and observation well PB1 during different phases of the ASR-operation.
52
A2.3. Model results
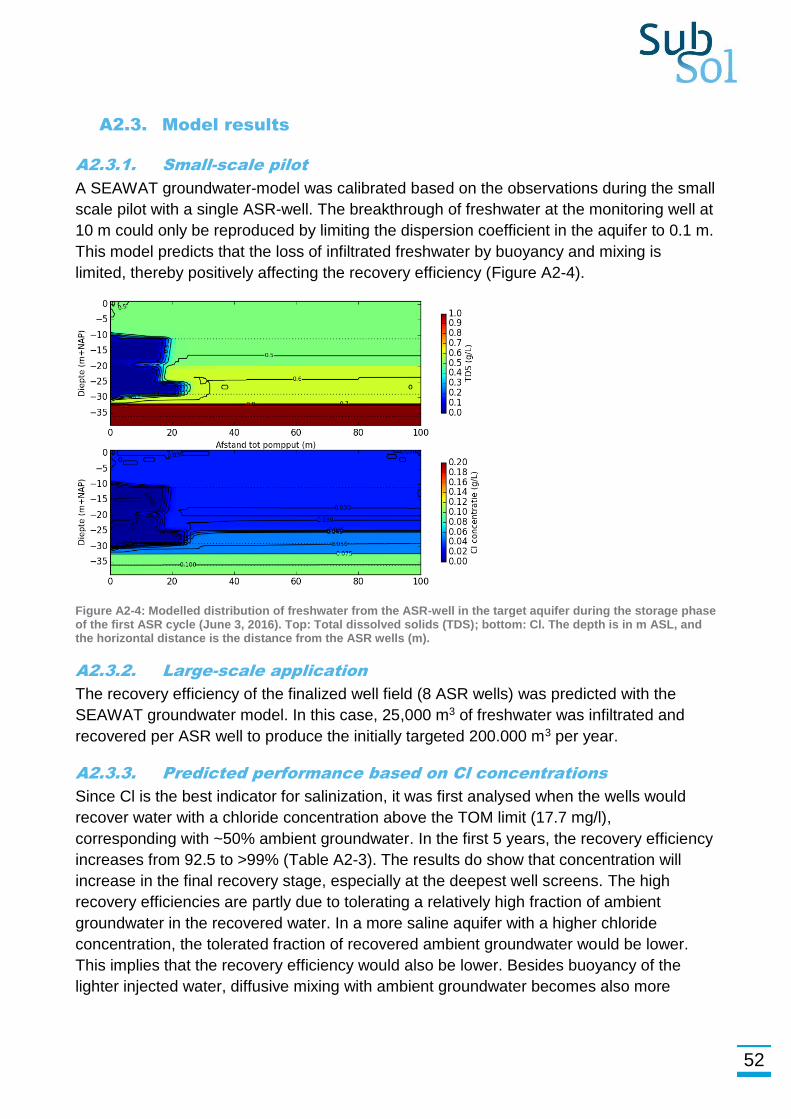
A2.3.1. Small-scale pilot
A SEAWAT groundwater-model was calibrated based on the observations during the small
scale pilot with a single ASR-well. The breakthrough of freshwater at the monitoring well at
10 m could only be reproduced by limiting the dispersion coefficient in the aquifer to 0.1 m.
This model predicts that the loss of infiltrated freshwater by buoyancy and mixing is
limited, thereby positively affecting the recovery efficiency (Figure A2-4).
Figure A2-4: Modelled distribution of freshwater from the ASR-well in the target aquifer during the storage phase of the first ASR cycle (June 3, 2016). Top: Total dissolved solids (TDS); bottom: Cl. The depth is in m ASL, and the horizontal distance is the distance from the ASR wells (m).
A2.3.2. Large-scale application
The recovery efficiency of the finalized well field (8 ASR wells) was predicted with the
SEAWAT groundwater model. In this case, 25,000 m3 of freshwater was infiltrated and
recovered per ASR well to produce the initially targeted 200.000 m3 per year.
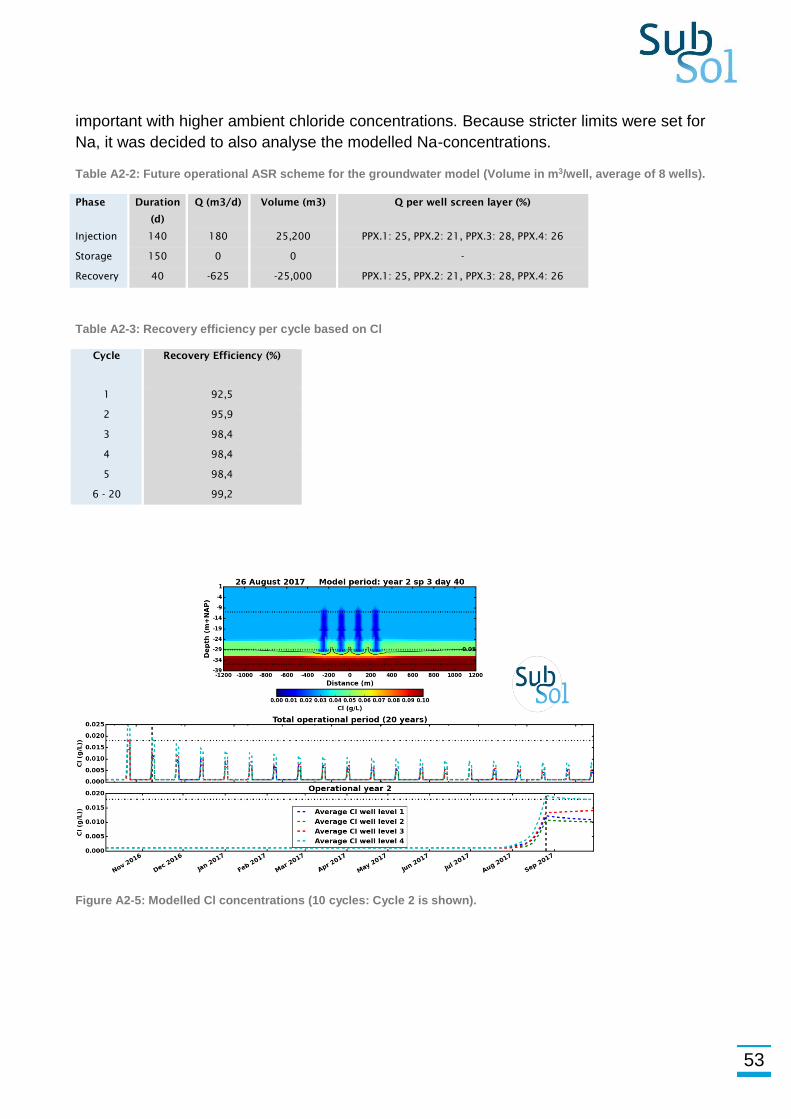
A2.3.3. Predicted performance based on Cl concentrations
Since Cl is the best indicator for salinization, it was first analysed when the wells would
recover water with a chloride concentration above the TOM limit (17.7 mg/l),
corresponding with ~50% ambient groundwater. In the first 5 years, the recovery efficiency
increases from 92.5 to >99% (Table A2-3). The results do show that concentration will
increase in the final recovery stage, especially at the deepest well screens. The high
recovery efficiencies are partly due to tolerating a relatively high fraction of ambient
groundwater in the recovered water. In a more saline aquifer with a higher chloride
concentration, the tolerated fraction of recovered ambient groundwater would be lower.
This implies that the recovery efficiency would also be lower. Besides buoyancy of the
lighter injected water, diffusive mixing with ambient groundwater becomes also more
53
important with higher ambient chloride concentrations. Because stricter limits were set for
Na, it was decided to also analyse the modelled Na-concentrations.
Table A2-2: Future operational ASR scheme for the groundwater model (Volume in m3/well, average of 8 wells).
Phase Duration
(d)
Q (m3/d) Volume (m3) Q per well screen layer (%)
Injection 140 180 25,200 PPX.1: 25, PPX.2: 21, PPX.3: 28, PPX.4: 26
Storage 150 0 0 -
Recovery 40 -625 -25,000 PPX.1: 25, PPX.2: 21, PPX.3: 28, PPX.4: 26
Table A2-3: Recovery efficiency per cycle based on Cl
Cycle
Recovery Efficiency (%)
1
92,5
2
95,9
3
98,4
4
98,4
5
98,4
6 - 20 99,2
Figure A2-5: Modelled Cl concentrations (10 cycles: Cycle 2 is shown).
54
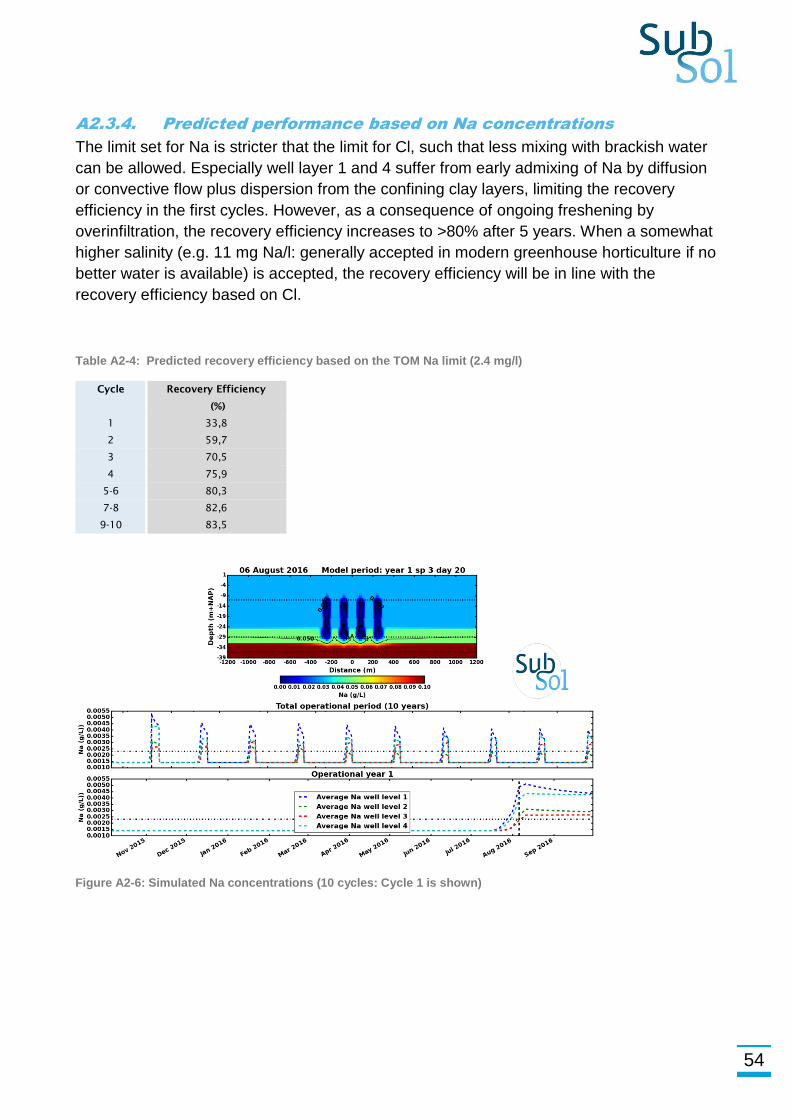
A2.3.4. Predicted performance based on Na concentrations
The limit set for Na is stricter that the limit for Cl, such that less mixing with brackish water
can be allowed. Especially well layer 1 and 4 suffer from early admixing of Na by diffusion
or convective flow plus dispersion from the confining clay layers, limiting the recovery
efficiency in the first cycles. However, as a consequence of ongoing freshening by
overinfiltration, the recovery efficiency increases to >80% after 5 years. When a somewhat
higher salinity (e.g. 11 mg Na/l: generally accepted in modern greenhouse horticulture if no
better water is available) is accepted, the recovery efficiency will be in line with the
recovery efficiency based on Cl.
Table A2-4: Predicted recovery efficiency based on the TOM Na limit (2.4 mg/l)
Cycle Recovery Efficiency
(%)
1
2
33,8
59,7
3 70,5
4 75,9
5-6 80,3
7-8
9-10
82,6
83,5
Figure A2-6: Simulated Na concentrations (10 cycles: Cycle 1 is shown)
55
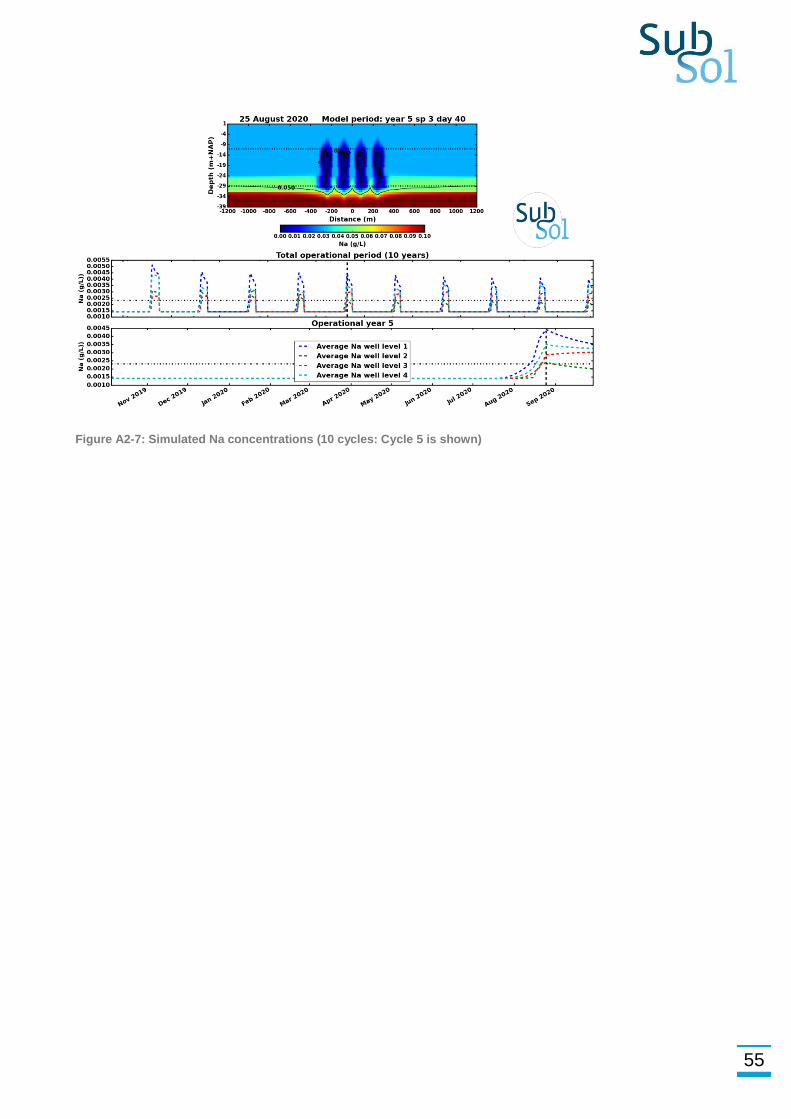
Figure A2-7: Simulated Na concentrations (10 cycles: Cycle 5 is shown)
56
Appendix 3. Water balance model
A3.1. Water balance model fundamentals
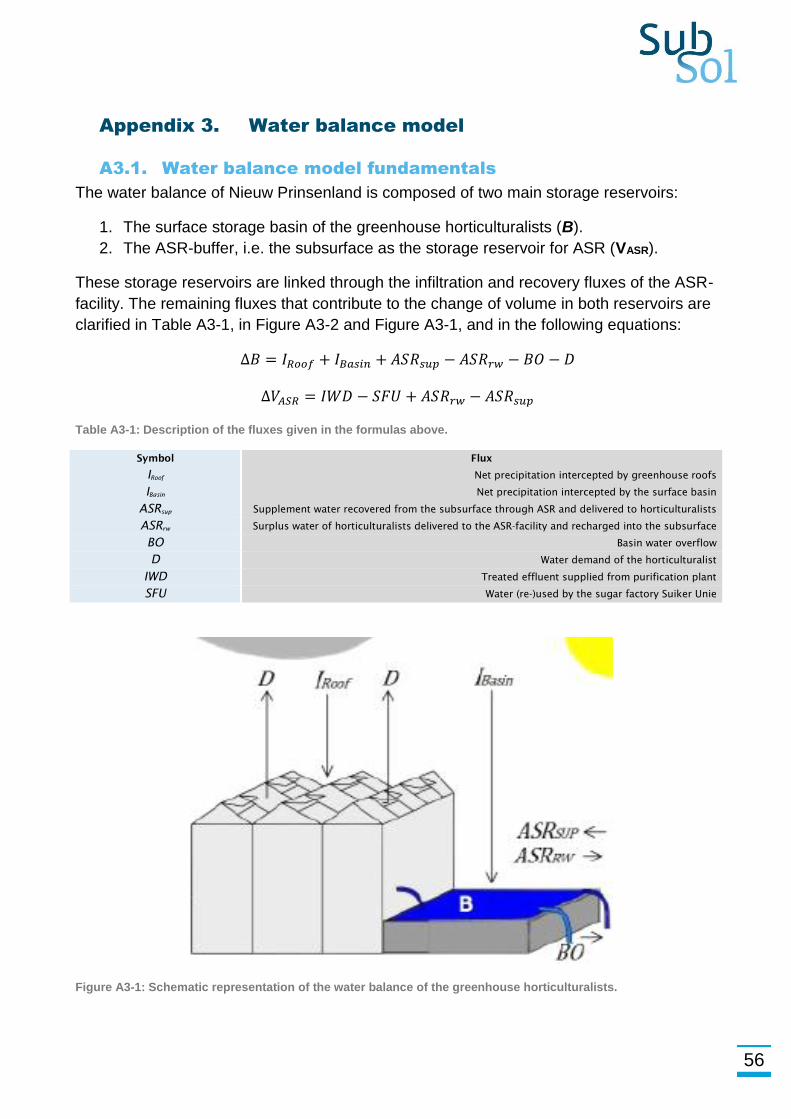
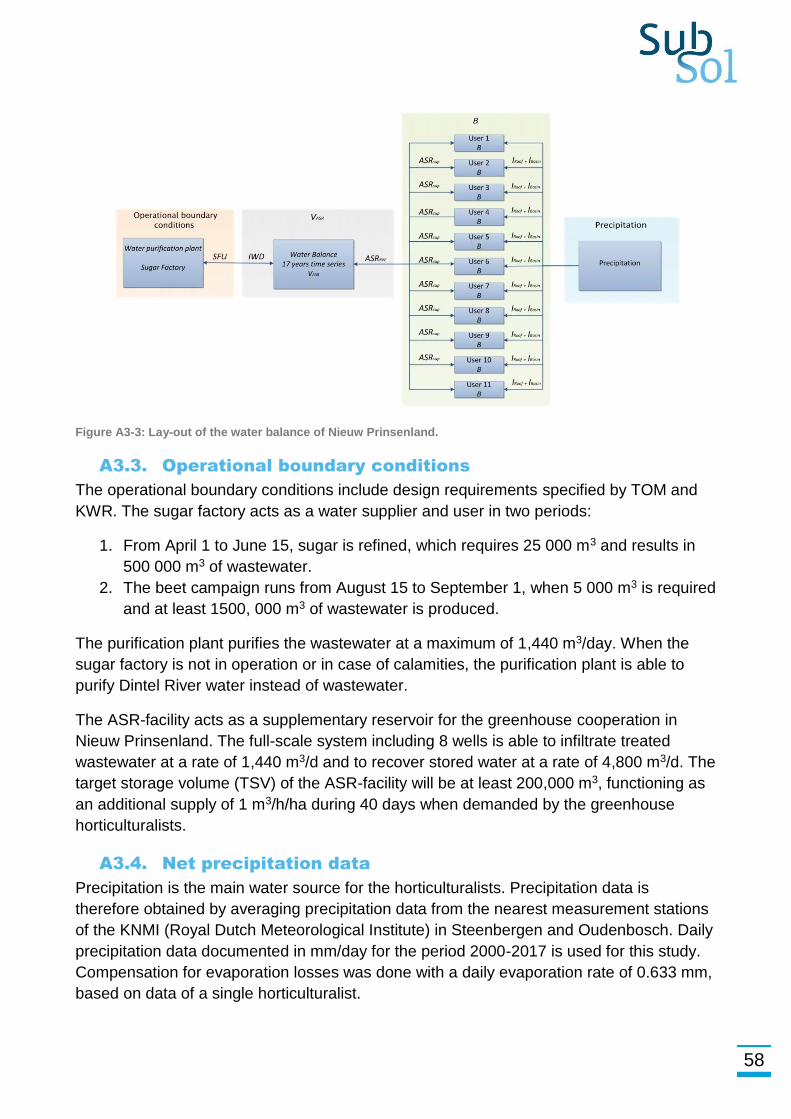
The water balance of Nieuw Prinsenland is composed of two main storage reservoirs:
1. The surface storage basin of the greenhouse horticulturalists (B).
2. The ASR-buffer, i.e. the subsurface as the storage reservoir for ASR (VASR).
These storage reservoirs are linked through the infiltration and recovery fluxes of the ASR-
facility. The remaining fluxes that contribute to the change of volume in both reservoirs are
clarified in Table A3-1, in Figure A3-2 and Figure A3-1, and in the following equations:
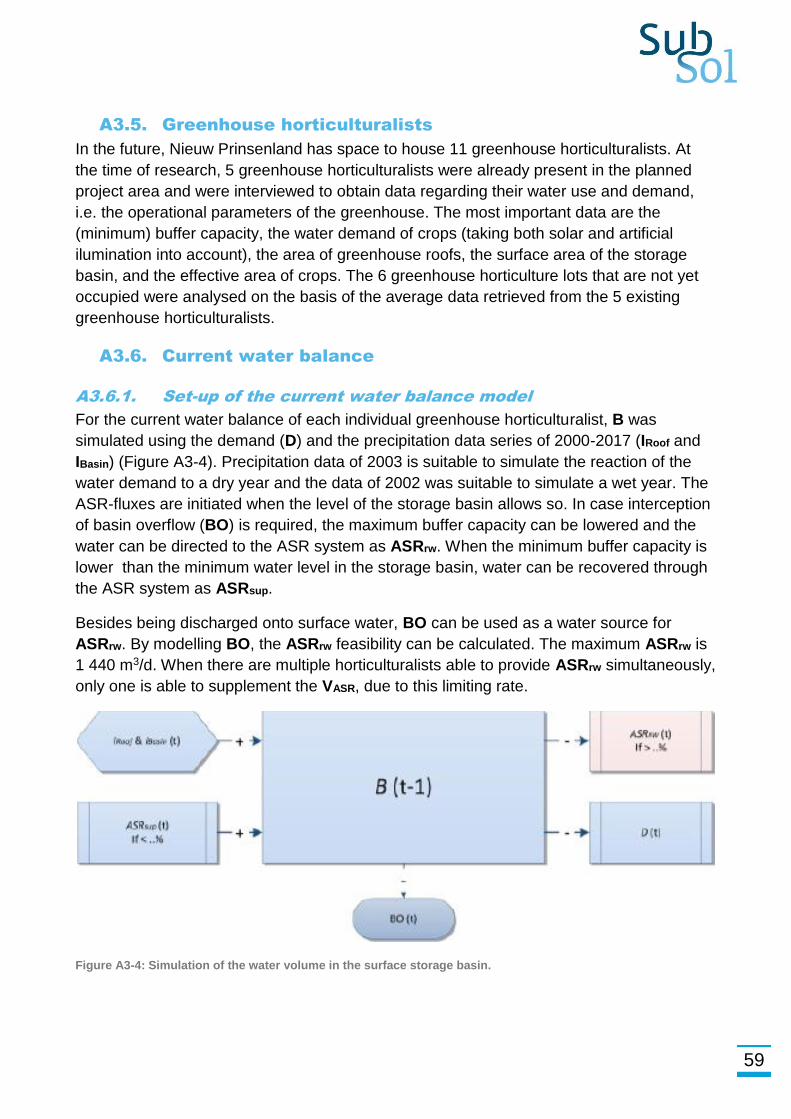
∆𝐵 = 𝐼𝑅𝑜𝑜𝑓 + 𝐼𝐵𝑎𝑠𝑖𝑛 + 𝐴𝑆𝑅𝑠𝑢𝑝 − 𝐴𝑆𝑅𝑟𝑤 − 𝐵𝑂 − 𝐷
∆𝑉𝐴𝑆𝑅 = 𝐼𝑊𝐷 − 𝑆𝐹𝑈 + 𝐴𝑆𝑅𝑟𝑤 − 𝐴𝑆𝑅𝑠𝑢𝑝
Table A3-1: Description of the fluxes given in the formulas above.
Symbol Flux
IRoof Net precipitation intercepted by greenhouse roofs
IBasin Net precipitation intercepted by the surface basin
ASRsup Supplement water recovered from the subsurface through ASR and delivered to horticulturalists
ASRrw Surplus water of horticulturalists delivered to the ASR-facility and recharged into the subsurface
BO Basin water overflow
D Water demand of the horticulturalist
IWD Treated effluent supplied from purification plant
SFU Water (re-)used by the sugar factory Suiker Unie
Figure A3-1: Schematic representation of the water balance of the greenhouse horticulturalists.
57
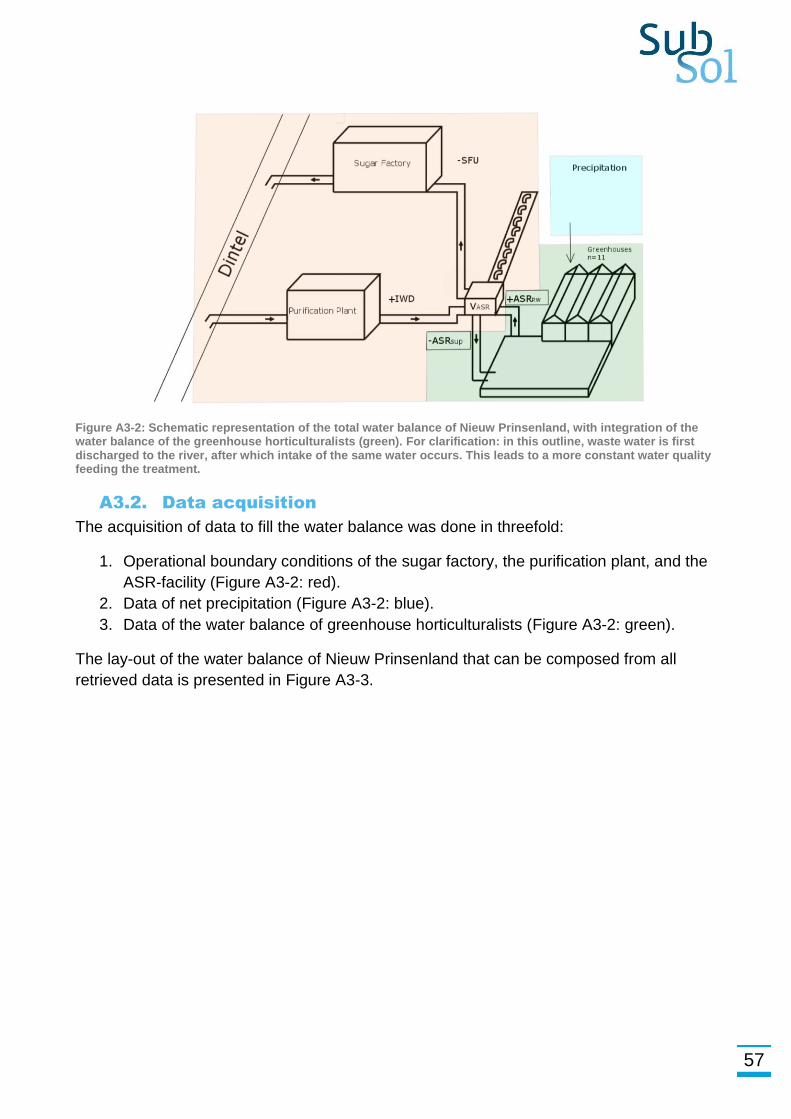
Figure A3-2: Schematic representation of the total water balance of Nieuw Prinsenland, with integration of the water balance of the greenhouse horticulturalists (green). For clarification: in this outline, waste water is first discharged to the river, after which intake of the same water occurs. This leads to a more constant water quality feeding the treatment.
A3.2. Data acquisition
The acquisition of data to fill the water balance was done in threefold:
1. Operational boundary conditions of the sugar factory, the purification plant, and the
ASR-facility (Figure A3-2: red).
2. Data of net precipitation (Figure A3-2: blue).
3. Data of the water balance of greenhouse horticulturalists (Figure A3-2: green).
The lay-out of the water balance of Nieuw Prinsenland that can be composed from all
retrieved data is presented in Figure A3-3.
58
Figure A3-3: Lay-out of the water balance of Nieuw Prinsenland.
A3.3. Operational boundary conditions
The operational boundary conditions include design requirements specified by TOM and
KWR. The sugar factory acts as a water supplier and user in two periods:
1. From April 1 to June 15, sugar is refined, which requires 25 000 m3 and results in
500 000 m3 of wastewater.
2. The beet campaign runs from August 15 to September 1, when 5 000 m3 is required
and at least 1500, 000 m3 of wastewater is produced.
The purification plant purifies the wastewater at a maximum of 1,440 m3/day. When the
sugar factory is not in operation or in case of calamities, the purification plant is able to
purify Dintel River water instead of wastewater.
The ASR-facility acts as a supplementary reservoir for the greenhouse cooperation in
Nieuw Prinsenland. The full-scale system including 8 wells is able to infiltrate treated
wastewater at a rate of 1,440 m3/d and to recover stored water at a rate of 4,800 m3/d. The
target storage volume (TSV) of the ASR-facility will be at least 200,000 m3, functioning as
an additional supply of 1 m3/h/ha during 40 days when demanded by the greenhouse
horticulturalists.
A3.4. Net precipitation data
Precipitation is the main water source for the horticulturalists. Precipitation data is
therefore obtained by averaging precipitation data from the nearest measurement stations
of the KNMI (Royal Dutch Meteorological Institute) in Steenbergen and Oudenbosch. Daily
precipitation data documented in mm/day for the period 2000-2017 is used for this study.
Compensation for evaporation losses was done with a daily evaporation rate of 0.633 mm,
based on data of a single horticulturalist.
59
A3.5. Greenhouse horticulturalists
In the future, Nieuw Prinsenland has space to house 11 greenhouse horticulturalists. At
the time of research, 5 greenhouse horticulturalists were already present in the planned
project area and were interviewed to obtain data regarding their water use and demand,
i.e. the operational parameters of the greenhouse. The most important data are the
(minimum) buffer capacity, the water demand of crops (taking both solar and artificial
ilumination into account), the area of greenhouse roofs, the surface area of the storage
basin, and the effective area of crops. The 6 greenhouse horticulture lots that are not yet
occupied were analysed on the basis of the average data retrieved from the 5 existing
greenhouse horticulturalists.
A3.6. Current water balance
A3.6.1. Set-up of the current water balance model
For the current water balance of each individual greenhouse horticulturalist, B was
simulated using the demand (D) and the precipitation data series of 2000-2017 (IRoof and
IBasin) (Figure A3-4). Precipitation data of 2003 is suitable to simulate the reaction of the
water demand to a dry year and the data of 2002 was suitable to simulate a wet year. The
ASR-fluxes are initiated when the level of the storage basin allows so. In case interception
of basin overflow (BO) is required, the maximum buffer capacity can be lowered and the
water can be directed to the ASR system as ASRrw. When the minimum buffer capacity is
lower than the minimum water level in the storage basin, water can be recovered through
the ASR system as ASRsup.
Besides being discharged onto surface water, BO can be used as a water source for
ASRrw. By modelling BO, the ASRrw feasibility can be calculated. The maximum ASRrw is
1 440 m3/d. When there are multiple horticulturalists able to provide ASRrw simultaneously,
only one is able to supplement the VASR, due to this limiting rate.
Figure A3-4: Simulation of the water volume in the surface storage basin.
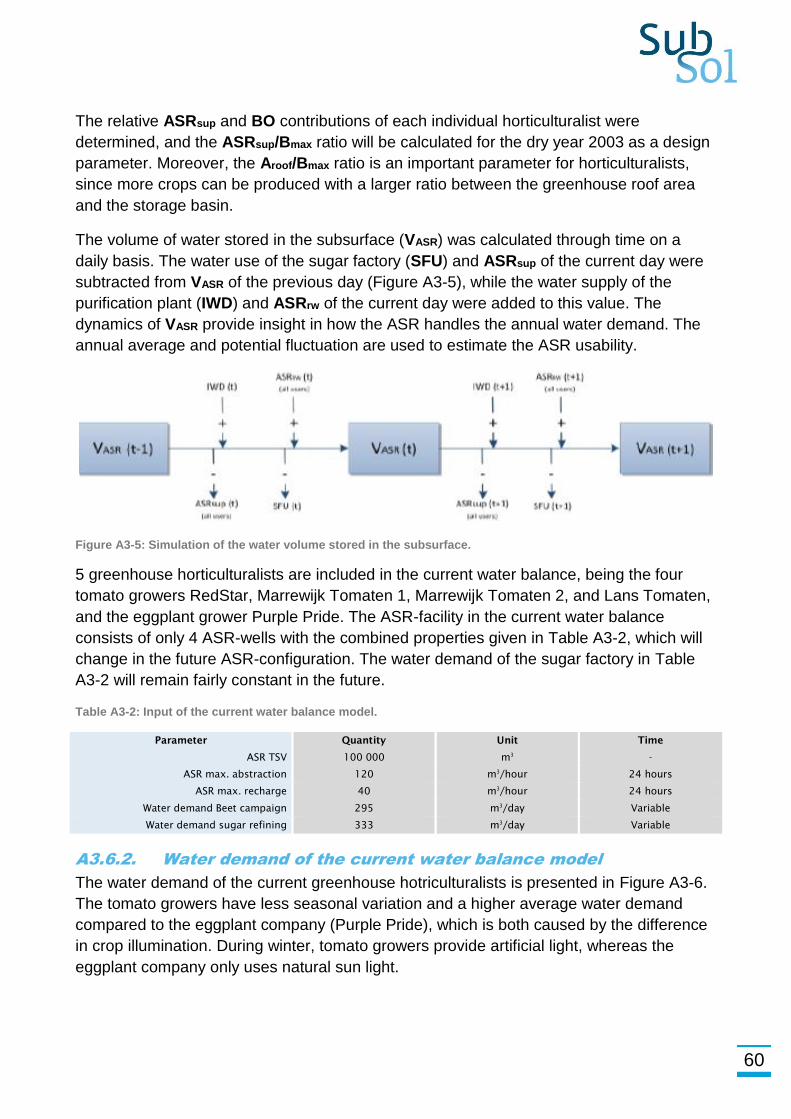
60
The relative ASRsup and BO contributions of each individual horticulturalist were
determined, and the ASRsup/Bmax ratio will be calculated for the dry year 2003 as a design
parameter. Moreover, the Aroof/Bmax ratio is an important parameter for horticulturalists,
since more crops can be produced with a larger ratio between the greenhouse roof area
and the storage basin.
The volume of water stored in the subsurface (VASR) was calculated through time on a
daily basis. The water use of the sugar factory (SFU) and ASRsup of the current day were
subtracted from VASR of the previous day (Figure A3-5), while the water supply of the
purification plant (IWD) and ASRrw of the current day were added to this value. The
dynamics of VASR provide insight in how the ASR handles the annual water demand. The
annual average and potential fluctuation are used to estimate the ASR usability.
Figure A3-5: Simulation of the water volume stored in the subsurface.
5 greenhouse horticulturalists are included in the current water balance, being the four
tomato growers RedStar, Marrewijk Tomaten 1, Marrewijk Tomaten 2, and Lans Tomaten,
and the eggplant grower Purple Pride. The ASR-facility in the current water balance
consists of only 4 ASR-wells with the combined properties given in Table A3-2, which will
change in the future ASR-configuration. The water demand of the sugar factory in Table
A3-2 will remain fairly constant in the future.
Table A3-2: Input of the current water balance model.
Parameter Quantity Unit Time
ASR TSV 100 000 m3
-
ASR max. abstraction 120 m3
/hour 24 hours
ASR max. recharge 40 m3
/hour 24 hours
Water demand Beet campaign 295 m3
/day Variable
Water demand sugar refining 333 m3
/day Variable
A3.6.2. Water demand of the current water balance model
The water demand of the current greenhouse hotriculturalists is presented in Figure A3-6.
The tomato growers have less seasonal variation and a higher average water demand
compared to the eggplant company (Purple Pride), which is both caused by the difference
in crop illumination. During winter, tomato growers provide artificial light, whereas the
eggplant company only uses natural sun light.
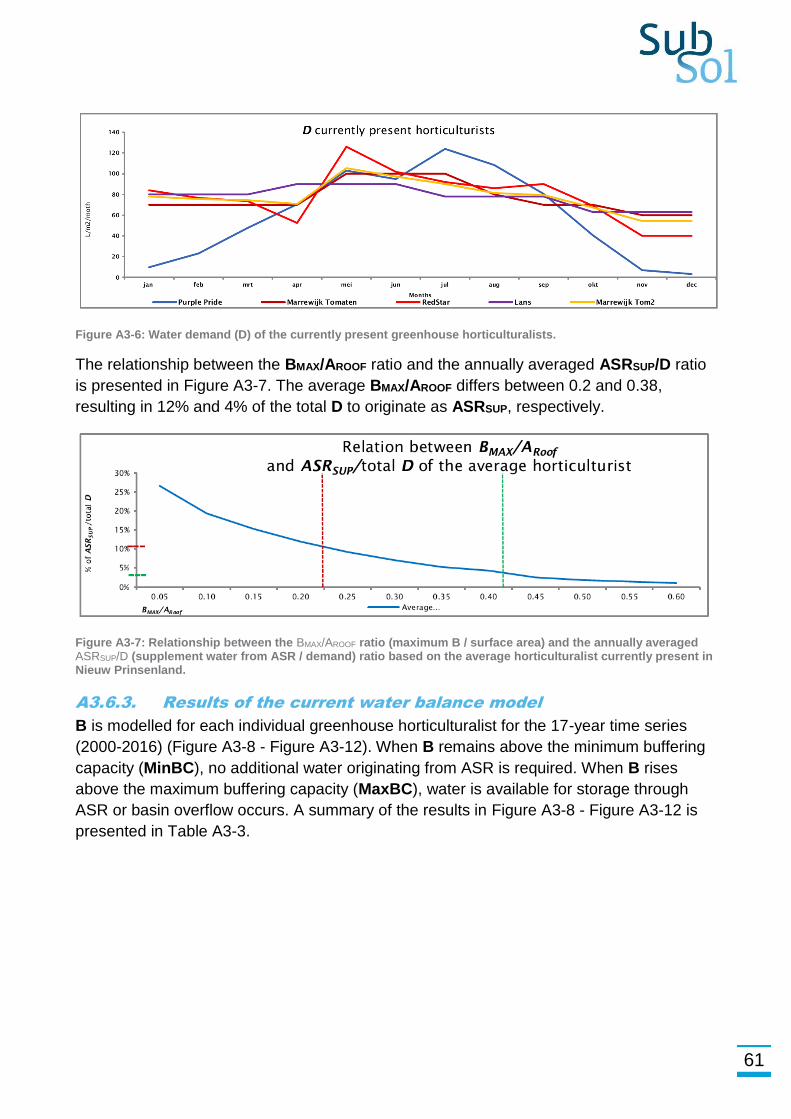
61
Figure A3-6: Water demand (D) of the currently present greenhouse horticulturalists.
The relationship between the BMAX/AROOF ratio and the annually averaged ASRSUP/D ratio
is presented in Figure A3-7. The average BMAX/AROOF differs between 0.2 and 0.38,
resulting in 12% and 4% of the total D to originate as ASRSUP, respectively.
Figure A3-7: Relationship between the BMAX/AROOF ratio (maximum B / surface area) and the annually averaged ASRSUP/D (supplement water from ASR / demand) ratio based on the average horticulturalist currently present in Nieuw Prinsenland.
A3.6.3. Results of the current water balance model
B is modelled for each individual greenhouse horticulturalist for the 17-year time series
(2000-2016) (Figure A3-8 - Figure A3-12). When B remains above the minimum buffering
capacity (MinBC), no additional water originating from ASR is required. When B rises
above the maximum buffering capacity (MaxBC), water is available for storage through
ASR or basin overflow occurs. A summary of the results in Figure A3-8 - Figure A3-12 is
presented in Table A3-3.
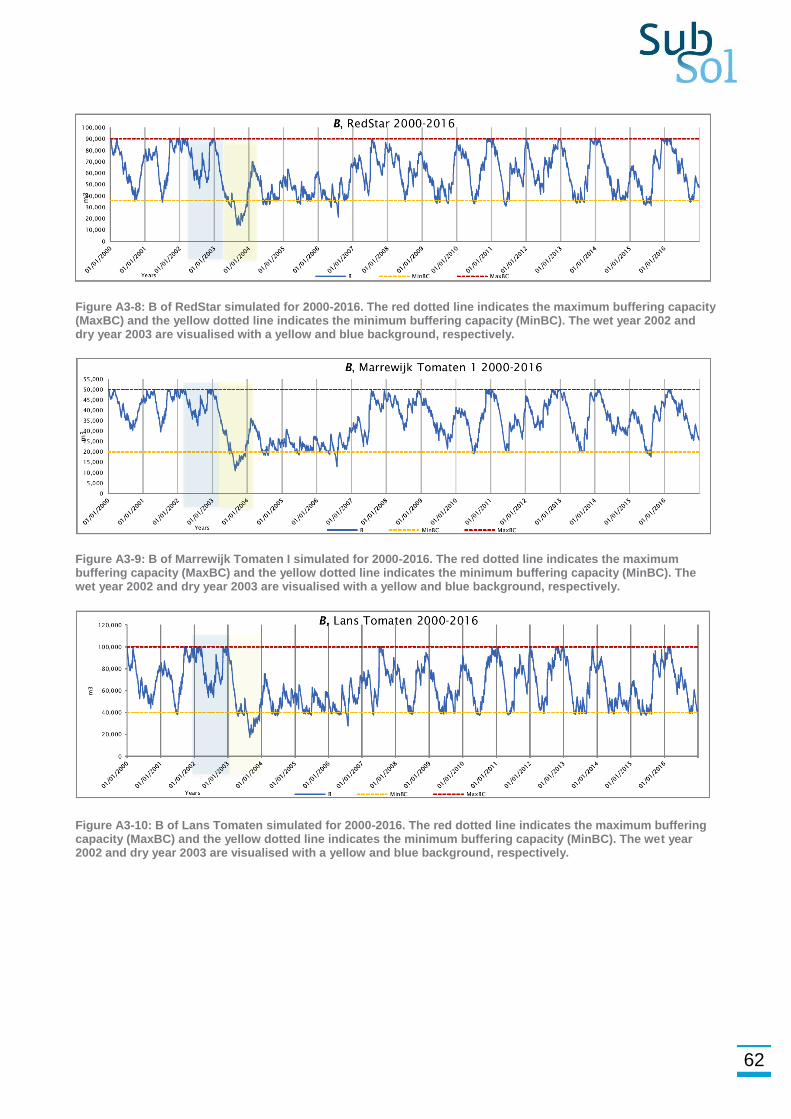
62
Figure A3-8: B of RedStar simulated for 2000-2016. The red dotted line indicates the maximum buffering capacity (MaxBC) and the yellow dotted line indicates the minimum buffering capacity (MinBC). The wet year 2002 and dry year 2003 are visualised with a yellow and blue background, respectively.
Figure A3-9: B of Marrewijk Tomaten I simulated for 2000-2016. The red dotted line indicates the maximum buffering capacity (MaxBC) and the yellow dotted line indicates the minimum buffering capacity (MinBC). The wet year 2002 and dry year 2003 are visualised with a yellow and blue background, respectively.
Figure A3-10: B of Lans Tomaten simulated for 2000-2016. The red dotted line indicates the maximum buffering capacity (MaxBC) and the yellow dotted line indicates the minimum buffering capacity (MinBC). The wet year 2002 and dry year 2003 are visualised with a yellow and blue background, respectively.
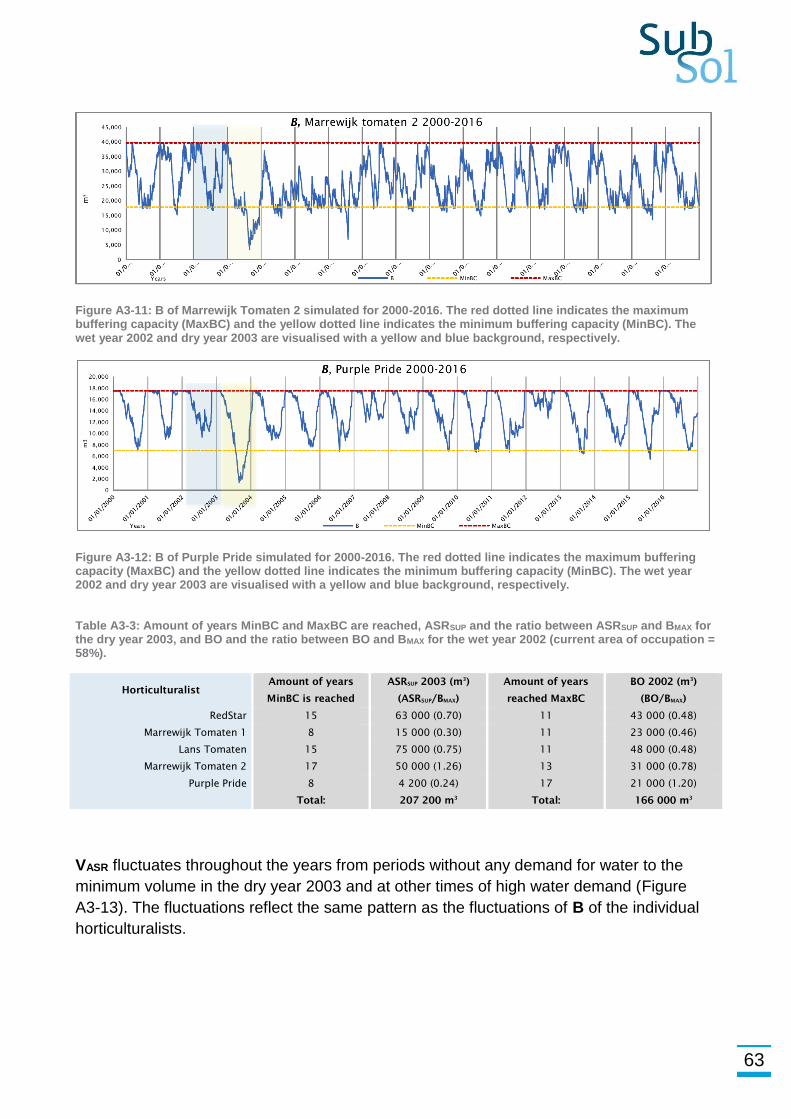
63
Figure A3-11: B of Marrewijk Tomaten 2 simulated for 2000-2016. The red dotted line indicates the maximum buffering capacity (MaxBC) and the yellow dotted line indicates the minimum buffering capacity (MinBC). The wet year 2002 and dry year 2003 are visualised with a yellow and blue background, respectively.
Figure A3-12: B of Purple Pride simulated for 2000-2016. The red dotted line indicates the maximum buffering capacity (MaxBC) and the yellow dotted line indicates the minimum buffering capacity (MinBC). The wet year 2002 and dry year 2003 are visualised with a yellow and blue background, respectively.
Table A3-3: Amount of years MinBC and MaxBC are reached, ASRSUP and the ratio between ASRSUP and BMAX for the dry year 2003, and BO and the ratio between BO and BMAX for the wet year 2002 (current area of occupation = 58%).
Horticulturalist
Amount of years
MinBC is reached
ASRSUP 2003 (m3
)
(ASRSUP/BMAX)
Amount of years
reached MaxBC
BO 2002 (m3
)
(BO/BMAX)
RedStar 15 63 000 (0.70) 11 43 000 (0.48)
Marrewijk Tomaten 1 8 15 000 (0.30) 11 23 000 (0.46)
Lans Tomaten 15 75 000 (0.75) 11 48 000 (0.48)
Marrewijk Tomaten 2 17 50 000 (1.26) 13 31 000 (0.78)
Purple Pride 8 4 200 (0.24) 17 21 000 (1.20)
Total: 207 200 m3
Total: 166 000 m3
VASR fluctuates throughout the years from periods without any demand for water to the
minimum volume in the dry year 2003 and at other times of high water demand (Figure
A3-13). The fluctuations reflect the same pattern as the fluctuations of B of the individual
horticulturalists.
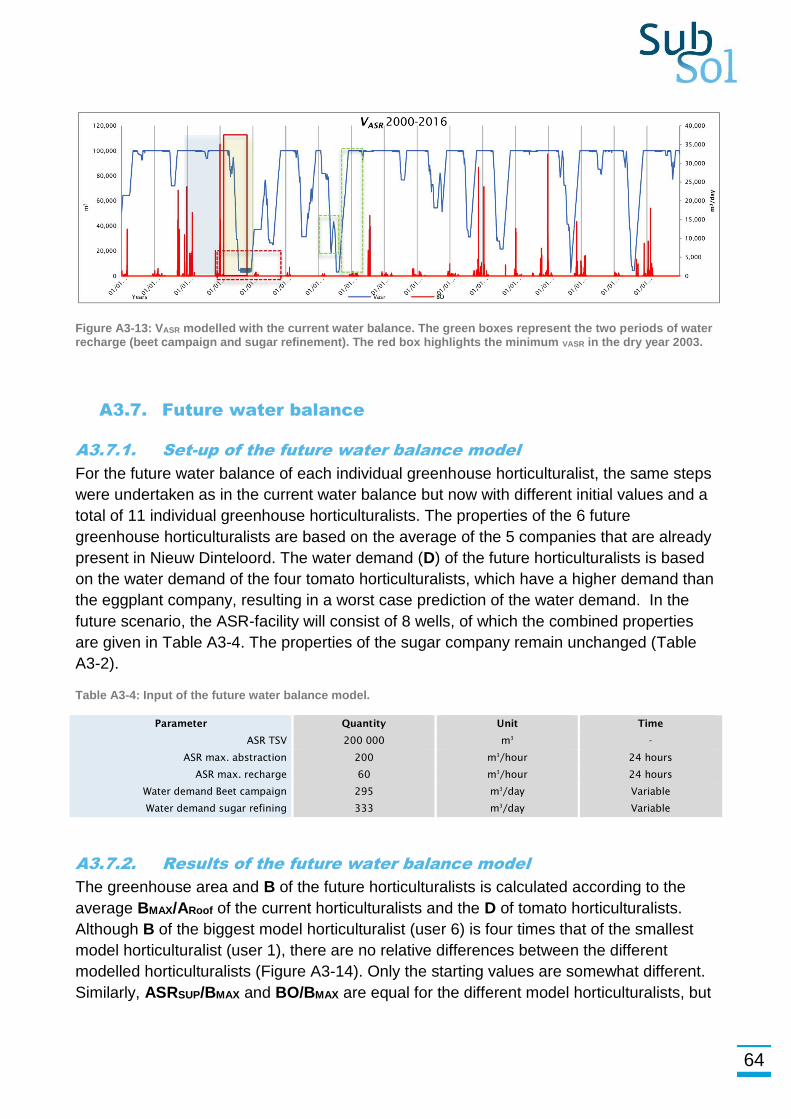
64
Figure A3-13: VASR modelled with the current water balance. The green boxes represent the two periods of water recharge (beet campaign and sugar refinement). The red box highlights the minimum VASR in the dry year 2003.
A3.7. Future water balance
A3.7.1. Set-up of the future water balance model
For the future water balance of each individual greenhouse horticulturalist, the same steps
were undertaken as in the current water balance but now with different initial values and a
total of 11 individual greenhouse horticulturalists. The properties of the 6 future
greenhouse horticulturalists are based on the average of the 5 companies that are already
present in Nieuw Dinteloord. The water demand (D) of the future horticulturalists is based
on the water demand of the four tomato horticulturalists, which have a higher demand than
the eggplant company, resulting in a worst case prediction of the water demand. In the
future scenario, the ASR-facility will consist of 8 wells, of which the combined properties
are given in Table A3-4. The properties of the sugar company remain unchanged (Table
A3-2).
Table A3-4: Input of the future water balance model.
Parameter Quantity Unit Time
ASR TSV 200 000 m3
-
ASR max. abstraction 200 m3
/hour 24 hours
ASR max. recharge 60 m3
/hour 24 hours
Water demand Beet campaign 295 m3
/day Variable
Water demand sugar refining 333 m3
/day Variable
A3.7.2. Results of the future water balance model
The greenhouse area and B of the future horticulturalists is calculated according to the
average BMAX/ARoof of the current horticulturalists and the D of tomato horticulturalists.
Although B of the biggest model horticulturalist (user 6) is four times that of the smallest
model horticulturalist (user 1), there are no relative differences between the different
modelled horticulturalists (Figure A3-14). Only the starting values are somewhat different.
Similarly, ASRSUP/BMAX and BO/BMAX are equal for the different model horticulturalists, but
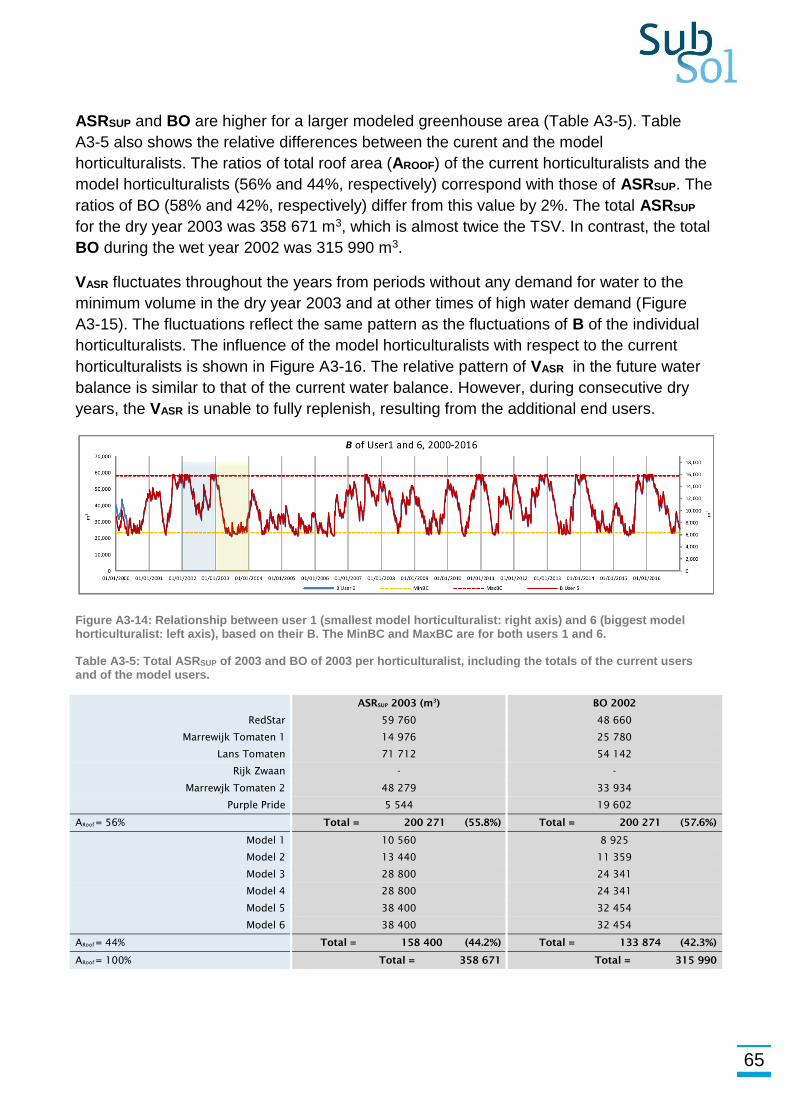
65
ASRSUP and BO are higher for a larger modeled greenhouse area (Table A3-5). Table
A3-5 also shows the relative differences between the curent and the model
horticulturalists. The ratios of total roof area (AROOF) of the current horticulturalists and the
model horticulturalists (56% and 44%, respectively) correspond with those of ASRSUP. The
ratios of BO (58% and 42%, respectively) differ from this value by 2%. The total ASRSUP
for the dry year 2003 was 358 671 m3, which is almost twice the TSV. In contrast, the total
BO during the wet year 2002 was 315 990 m3.
VASR fluctuates throughout the years from periods without any demand for water to the
minimum volume in the dry year 2003 and at other times of high water demand (Figure
A3-15). The fluctuations reflect the same pattern as the fluctuations of B of the individual
horticulturalists. The influence of the model horticulturalists with respect to the current
horticulturalists is shown in Figure A3-16. The relative pattern of VASR in the future water
balance is similar to that of the current water balance. However, during consecutive dry
years, the VASR is unable to fully replenish, resulting from the additional end users.
Figure A3-14: Relationship between user 1 (smallest model horticulturalist: right axis) and 6 (biggest model horticulturalist: left axis), based on their B. The MinBC and MaxBC are for both users 1 and 6.
Table A3-5: Total ASRSUP of 2003 and BO of 2003 per horticulturalist, including the totals of the current users and of the model users.
ASRSUP 2003 (m3
) BO 2002
RedStar 59 760 48 660
Marrewijk Tomaten 1 14 976 25 780
Lans Tomaten 71 712 54 142
Rijk Zwaan - -
Marrewjk Tomaten 2 48 279 33 934
Purple Pride 5 544 19 602
ARoof = 56% Total = 200 271 (55.8%) Total = 200 271 (57.6%)
Model 1 10 560 8 925
Model 2 13 440 11 359
Model 3 28 800 24 341
Model 4 28 800 24 341
Model 5 38 400 32 454
Model 6 38 400 32 454
ARoof = 44% Total = 158 400 (44.2%) Total = 133 874 (42.3%)
ARoof = 100% Total = 358 671 Total = 315 990
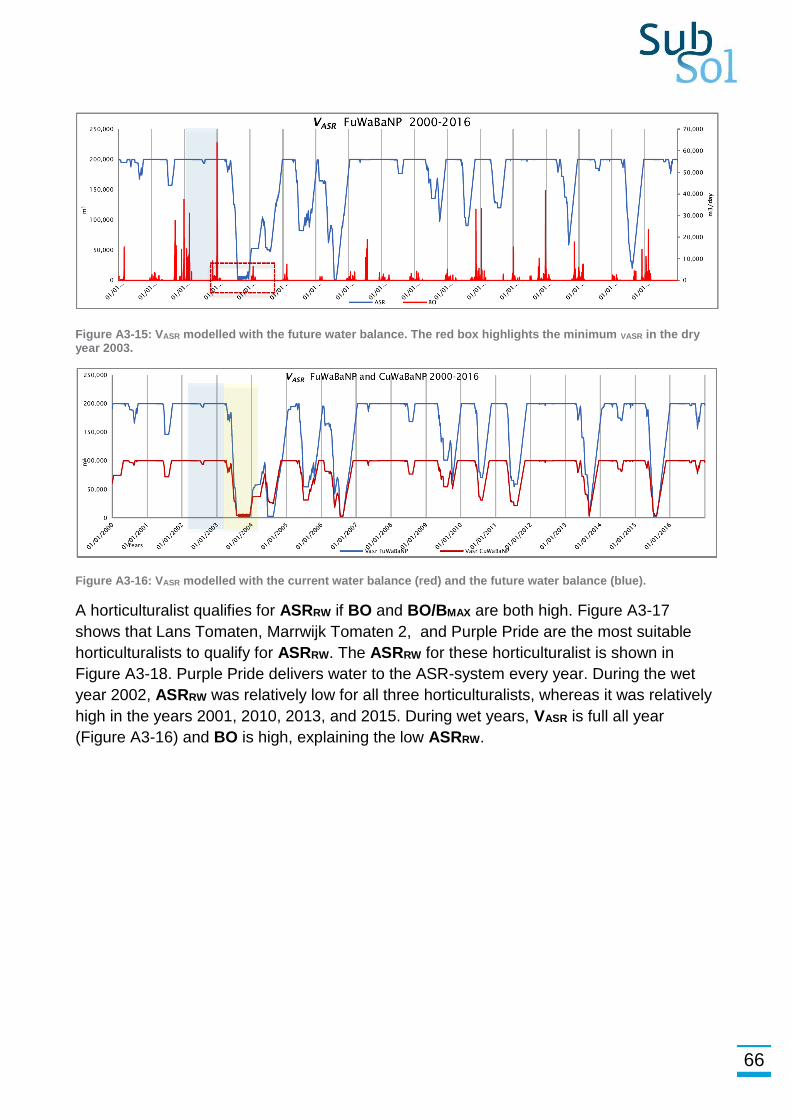
66
Figure A3-15: VASR modelled with the future water balance. The red box highlights the minimum VASR in the dry year 2003.
Figure A3-16: VASR modelled with the current water balance (red) and the future water balance (blue).
A horticulturalist qualifies for ASRRW if BO and BO/BMAX are both high. Figure A3-17
shows that Lans Tomaten, Marrwijk Tomaten 2, and Purple Pride are the most suitable
horticulturalists to qualify for ASRRW. The ASRRW for these horticulturalist is shown in
Figure A3-18. Purple Pride delivers water to the ASR-system every year. During the wet
year 2002, ASRRW was relatively low for all three horticulturalists, whereas it was relatively
high in the years 2001, 2010, 2013, and 2015. During wet years, VASR is full all year
(Figure A3-16) and BO is high, explaining the low ASRRW.
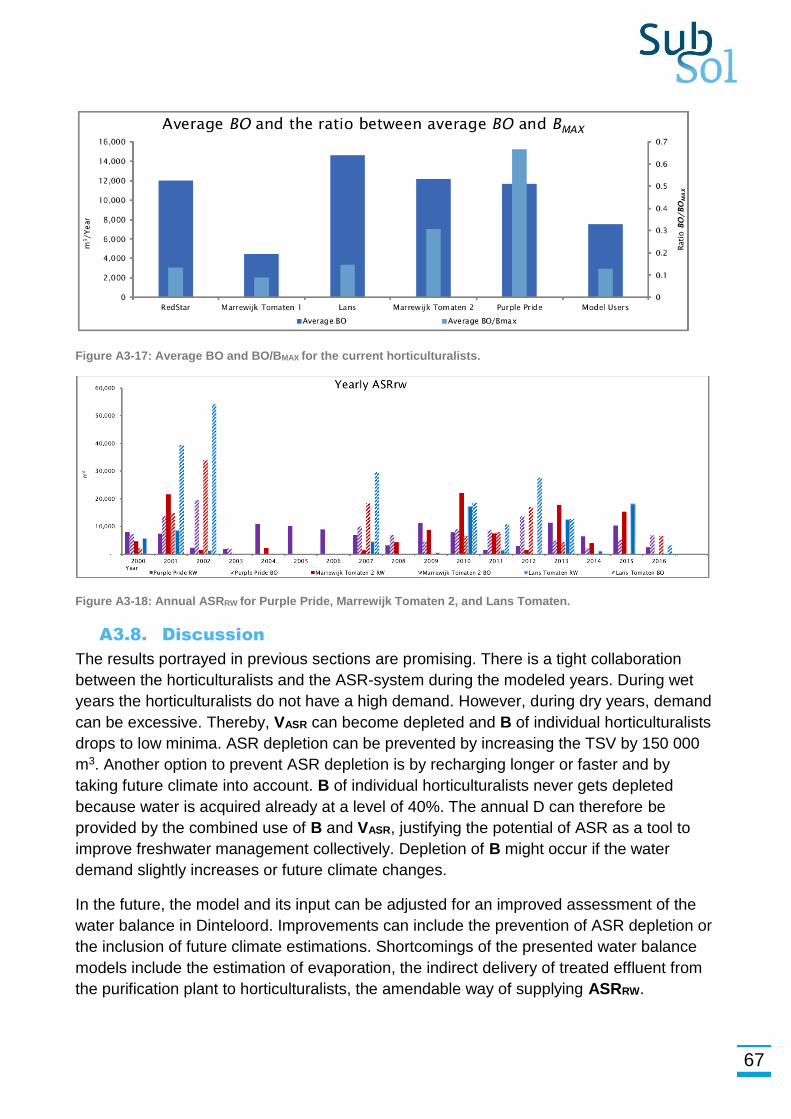
67
Figure A3-17: Average BO and BO/BMAX for the current horticulturalists.
Figure A3-18: Annual ASRRW for Purple Pride, Marrewijk Tomaten 2, and Lans Tomaten.
A3.8. Discussion
The results portrayed in previous sections are promising. There is a tight collaboration
between the horticulturalists and the ASR-system during the modeled years. During wet
years the horticulturalists do not have a high demand. However, during dry years, demand
can be excessive. Thereby, VASR can become depleted and B of individual horticulturalists
drops to low minima. ASR depletion can be prevented by increasing the TSV by 150 000
m3. Another option to prevent ASR depletion is by recharging longer or faster and by
taking future climate into account. B of individual horticulturalists never gets depleted
because water is acquired already at a level of 40%. The annual D can therefore be
provided by the combined use of B and VASR, justifying the potential of ASR as a tool to
improve freshwater management collectively. Depletion of B might occur if the water
demand slightly increases or future climate changes.
In the future, the model and its input can be adjusted for an improved assessment of the
water balance in Dinteloord. Improvements can include the prevention of ASR depletion or
the inclusion of future climate estimations. Shortcomings of the presented water balance
models include the estimation of evaporation, the indirect delivery of treated effluent from
the purification plant to horticulturalists, the amendable way of supplying ASRRW.

68
The future situation with more horticulturalists included in the collective system is less
resilient than the current situation with five end users because of the higher total water
demand. During extremely dry years, B approaches minimum values and ASRSUP can
reach a maximum of 350 000 m3, whereas the average is 125 000 m3.
In general, the current water balance and the future water balance reflect a resilient
cooperation between the individual horticulturalist and the ASR buffer. The risk of
implementation lies in consecutive dry years, possibly resulting in insufficient ASR
replenishment.
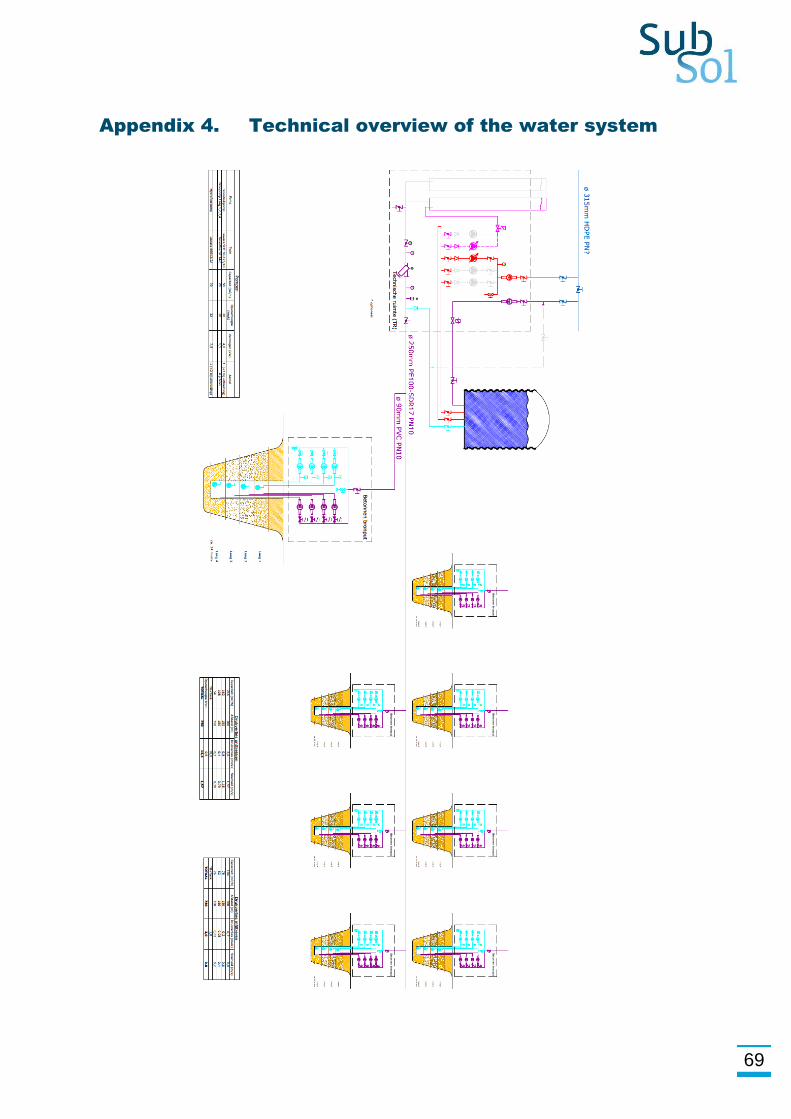
69
Appendix 4. Technical overview of the water system