Embed Size (px)
Citation preview
D3.1 – Stakeholders and market analysis
report
Deliverable No. D3.1 Due Date 31-Jan-2019
Type Report Dissemination Level Public
Version 1.0 Status Release 1
Description State of the art review of the stakeholders and market analysis regarding PIXEL
technologies and solutions. The aim of this deliverable is to provide an insight to
the current and emerging situation of port related solutions focused on the
interoperability between agents (cities, transportation companies, port agencies,
etc.), the communication and storage of data of port activities, exploitation of this
information and optimization of those operations from different points of view
(namely environmentally).
Work Package WP3

Deliverable No 3.1 – Stakeholders and market analysis report
Version 1.0 – 12-FEB-2019 – PIXEL© – Page 2 of 69
Authors Name Partner e-mail
Ignacio Lacalle P01 - UPV [email protected]
José Antonio Clemente P02 - PRO [email protected]
Miguel Ángel Llorente P02 - PRO [email protected]
Joao Costa P03 - XLAB [email protected]
Gilda De Marco P04 - INSIEL [email protected]
Charles Garnier P05 - CATIE [email protected]
Mohamed Idoubella P06 - ORANGE [email protected]
Eleonora Anut P09 - SDAG [email protected]
Tamara Corsano P09 - SDAG [email protected]
Cinzia Ninzatti P09 - SDAG [email protected]
Stella Fassa P10 - ThPA SA [email protected]
Christos Papadopoulos P10 - ThPA SA [email protected]
Maria Pelteki P10 - ThPA SA [email protected]
Eirini Tserga P10 - ThPA SA [email protected]
Eva Vafaki P10 - ThPA SA [email protected]
Athanasios Chaldeakis P11 - PPA [email protected]
Dimitris Spyrou P11 - PPA [email protected]
Stefano Bevilacqua P12 - ASPM [email protected]
Thibault Guillon P13 - GPMB [email protected]
Michel Le Van Kiem P13 - GPMB [email protected]
Leonidas Pitsikas P14 - IPEOPLE [email protected]
Christos Roupas P14 - IPEOPLE [email protected]
Aristos Halatsis P15 – CERTH [email protected]
History Date Version Change
22-Sep-2018 0.1 Creation
01-Oct-2018 0.2 Addition of Research Project’s Review
Addition of Current Market Solutions and Vendor Analysis
15-Oct-2018 0.3 Review and completion of parts by Del. Leader
24-Oct-2018 0.4 Review and comments by Internal Reviewers
28-Jan-2019 0.5 Final version for review
12-Feb-2019 1.0 Official release

Deliverable No 3.1 – Stakeholders and market analysis report
Version 1.0 – 12-FEB-2019 – PIXEL© – Page 3 of 69
Key Data Keywords Market, stakeholders, activities, requirements
Lead Editor Leonidas Pitsikas, P14 IPEOPLE
Internal Reviewer(s) Ignacio Lacalle, P01 UPV
Benjamin Molina, P01 UPV
Joao Pita Costa, P03 XLAB
Charles Garnier, P09 CATIE

Deliverable No 3.1 – Stakeholders and market analysis report
Version 1.0 – 12-FEB-2019 – PIXEL© – Page 4 of 69
Abstract This deliverable has been created in the context of the Work Package 3 (Requirements and Use Cases) of the
H2020-funded project PIXEL (Grant No. 769355).
The aim of this deliverable is to provide an insight to the current and emerging situation of port-related
solutions focused on the interoperability between agents (cities, transportation companies, port agencies, etc.),
the communication and storage of data of port activities, exploitation of this information and optimization of
those operations from different points of view (especially environmentally).
This deliverable identifies the stakeholders (and classifies them in terms of relevance to the project) in the port
industry, describes the market and identifies the gap in it. The most relevant stakeholders to PIXEL are the
Port Authorities, the Carriers and the Passengers. The market PIXEL is aiming is that of the ICT (Information
and Communications Technology) solutions that are addressing the modern needs of ports to become more
efficient, smart and connected. These concepts are further analysed in Section 2.
Combining the ports needs covered by existing ICT solutions with the environmental needs not covered by
these, the PIXEL solution is outlined in Section 2 by mentioning its main aspects:
- The technological part which will comprise of an information hub, an integrated dashboard, the
interface with existing PCS and the PIXEL operational tools.
- The environmental part which will comprise of the Port Environmental Index, the technology to
collect the required data and the relevant environmental impact assessment models that will be
developed.
This deliverable also describes the barriers and enablers (technological, regulatory, business, financial etc.) of
ICT innovations, analyses the competition in the selected market segments and proposes an initial market
assessment of the PIXEL solution. For the implementation of the competition analysis, we compared and
evaluated different aspects of existing relevant solutions that are covering the major stakeholders of the
PIXEL project and are already in the market, such as modern Port Community Systems, Terminal Operating
Systems, Cargo Tracking Solutions etc. By analysing the existing solutions, we identify market trends useful
for the SWOT analysis at the Deliverable No. 9.6 (Draft Exploitation Plan) in which possible PIXEL weak
points to work on, or strengths to evaluate further, will be discussed. However, an initial list of the intended
PIXEL capacities is proposed at the end of Section 3, mentioning attributes such as stability, scalability,
reliability, simplicity, scalability, technical excellence, adaptability etc.
Additionally, our analysis on the current market solutions that are offered by various vendors – which is
presented in Section 3 – indicates that there will be a strong focus on increased supply chain visibility through
IoT based communication infrastructure that will enable an efficient use of resources in ports and to their
stakeholders. The PIXEL solution will not depend on specific ports, making the project outcomes completely
transferable from the four PIXEL participating ports to ports which are not in the consortium. In that note, the
Tasks 9.1 (Communication and impact creation) and 9.3 (Industrial dissemination) will profit from the
collected information to address communication and industrial dissemination appropriately.
Finally, in Section 4 the environmental initiatives in the ports industry are presented. Our research shows that
the current initiatives are mainly based on qualitative and not quantitative assessments of the ports’
environmental performance. PIXEL aims to surpass any biased estimates by offering a transparent and
standardized method of evaluating ports environmental performance based on quantitative data.
This deliverable is a contribution to the effort to roughly position PIXEL in the market, and provide the
necessary context within which the project and its main outputs will operate after the project ends.

Deliverable No 3.1 – Stakeholders and market analysis report
Version 1.0 – 12-FEB-2019 – PIXEL© – Page 5 of 69
Statement of originality This document contains material, which is the copyright of certain PIXEL consortium parties, and may not be
reproduced or copied without permission. This deliverable contains original unpublished work except where
clearly indicated otherwise. Acknowledgement of previously published material and of the work of others has
been made through appropriate citation, quotation or both.
The information contained in this document is the proprietary confidential information of the PIXEL
consortium (including the Commission Services) and may not be disclosed except in accordance with the
consortium agreement.
The commercial use of any information contained in this document may require a license from the proprietor
of that information.
Neither the project consortium as a whole nor a certain party of the consortium warrant that the information
contained in this document is capable of use, nor that use of the information is free from risk, and accepts no
liability for loss or damage suffered by any person using this information.
The information in this document is subject to change without notice.
The content of this report reflects only the authors’ view. The Innovation and Networks Executive Agency
(INEA) is not responsible for any use that may be made of the information it contains.
Deliverable No 3.1 – Stakeholders and market analysis report
Version 1.0 – 12-FEB-2019 – PIXEL© – Page 6 of 69
Table of contents
Table of contents ................................................................................................................................................. 6
List of tables ........................................................................................................................................................ 8
List of figures ...................................................................................................................................................... 9
List of acronyms ................................................................................................................................................ 10
1. About this document .................................................................................................................................. 13
1.1. Deliverable context ............................................................................................................................ 13
1.2. The rationale behind the structure ...................................................................................................... 14
1.2.1. Methodology ............................................................................................................................ 14
2. Targeted market and taxonomy ................................................................................................................. 16
2.1. Ports industry description ................................................................................................................... 16
2.1.1. Port definition .......................................................................................................................... 16
2.1.2. Port types ................................................................................................................................. 17
2.1.3. Port main activities .................................................................................................................. 18
2.1.4. Port stakeholders ...................................................................................................................... 22
2.2. Port challenges and needs .................................................................................................................. 27
2.2.1. An efficient port ....................................................................................................................... 27
2.2.2. An environmentally sustainable port ....................................................................................... 28
2.2.3. A smart & connected port ........................................................................................................ 28
2.2.4. A port creating local value and being socially integrated to the city ....................................... 29
2.2.5. Port ICT drivers ....................................................................................................................... 29
2.2.6. Generic Port challenges and needs covered by present ICT solutions .................................... 30
2.2.7. PIXEL Port Requirements ....................................................................................................... 30
2.2.8. PIXEL Summary definition ..................................................................................................... 32
2.3. Market size and market growth .......................................................................................................... 33
2.3.1. Number of ports in the EU ....................................................................................................... 33
2.3.2. Ports logistics market size ........................................................................................................ 34
2.3.1. Passenger transport market size ............................................................................................... 35
2.3.2. Global port market perspective ................................................................................................ 35
2.4. Segments addressed in PIXEL ........................................................................................................... 36
2.4.1. Port development through ICT ................................................................................................ 36
2.4.2. Classification of ports in terms of ICT .................................................................................... 38
2.4.3. ICT innovations in ports and logistics ..................................................................................... 39
2.5. Main sales channels ........................................................................................................................... 40
3. Competition ............................................................................................................................................... 42
3.1. Barriers to entry ................................................................................................................................. 42
3.2. Main competitors in the selected segments ........................................................................................ 43
3.2.1. Port development through ICT ................................................................................................ 43
Deliverable No 3.1 – Stakeholders and market analysis report
Version 1.0 – 12-FEB-2019 – PIXEL© – Page 7 of 69
3.2.2. Cargo tracking solutions .......................................................................................................... 50
3.2.3. Data management solutions ..................................................................................................... 51
3.2.4. Similar initiatives in the scope of research and innovation projects ........................................ 54
3.3. Market needs addressed in PIXEL, positioning, differentiation and competitive advantages ........... 54
4. Overview of environmental initiatives in the ports industry ..................................................................... 56
4.1. Literature Review ............................................................................................................................... 56
4.1.1. Environmental Indices in other Projects .................................................................................. 57
4.2. Identifying best practice environmental standards ............................................................................. 57
4.2.1. Port governance and management systems .............................................................................. 57
4.2.2. Incentive programs and awards ............................................................................................... 60
4.3. Stakeholder engagement and awareness ............................................................................................ 61
4.3.1. Environmental priorities evolve ............................................................................................... 62
4.3.2. Evolution of port environmental management and sustainability ........................................... 62
4.3.3. Final remarks ........................................................................................................................... 63
5. Conclusion / Future Work ......................................................................................................................... 64
6. References ................................................................................................................................................. 65

Deliverable No 3.1 – Stakeholders and market analysis report
Version 1.0 – 12-FEB-2019 – PIXEL© – Page 8 of 69
List of tables
Table 1. Methodology items .............................................................................................................................. 14 Table 2. Stakeholders’ relativeness to the PIXEL offering ............................................................................... 26 Table 3. ICT solutions addressing port needs .................................................................................................... 30 Table 4. Brief description of the PIXEL ports ................................................................................................... 30 Table 5. Generic port needs reflected also in the PIXEL port pilot cases ......................................................... 31 Table 6. European Solution Providers - Products .............................................................................................. 50 Table 7. Description of other Initiatives of Environmental Indices .................................................................. 57 Table 8. ESPO - Environmental Policy Code .................................................................................................... 61 Table 9. Top 10 environmental priorities of the European port sector over time .............................................. 62

Deliverable No 3.1 – Stakeholders and market analysis report
Version 1.0 – 12-FEB-2019 – PIXEL© – Page 9 of 69
List of figures
Figure 1. Example of the interaction between the different agents (ValenciaportPCS, 2016) .......................... 23 Figure 2. Stakeholders power for the ports participating in the PIXEL project ................................................ 24 Figure 3. Stakeholders’ relevance and interest to a product .............................................................................. 26 Figure 4. PIXEL as an integrated technological and environmental solution ................................................... 33 Figure 5. Ports of the Mediterranean region (MedCruise, 2019) ...................................................................... 35 Figure 6. Five key ICT Innovations for ports and logistics firms ..................................................................... 39 Figure 7. Big Data market size and growth (Columbus, 2018) ......................................................................... 40 Figure 8. PCS System of the port of Rotterdam(Portbase, 2018) ...................................................................... 45 Figure 9. Gateway to a National Single Window (European Port Community Systems Association, 2011) ... 49 Figure 10. Quadrant for Data Management Solutions for Analytics (Gartner, 2018) ....................................... 52 Figure 11. Interoperability need in the market .................................................................................................. 55
Deliverable No 3.1 – Stakeholders and market analysis report
Version 1.0 – 12-FEB-2019 – PIXEL© – Page 10 of 69
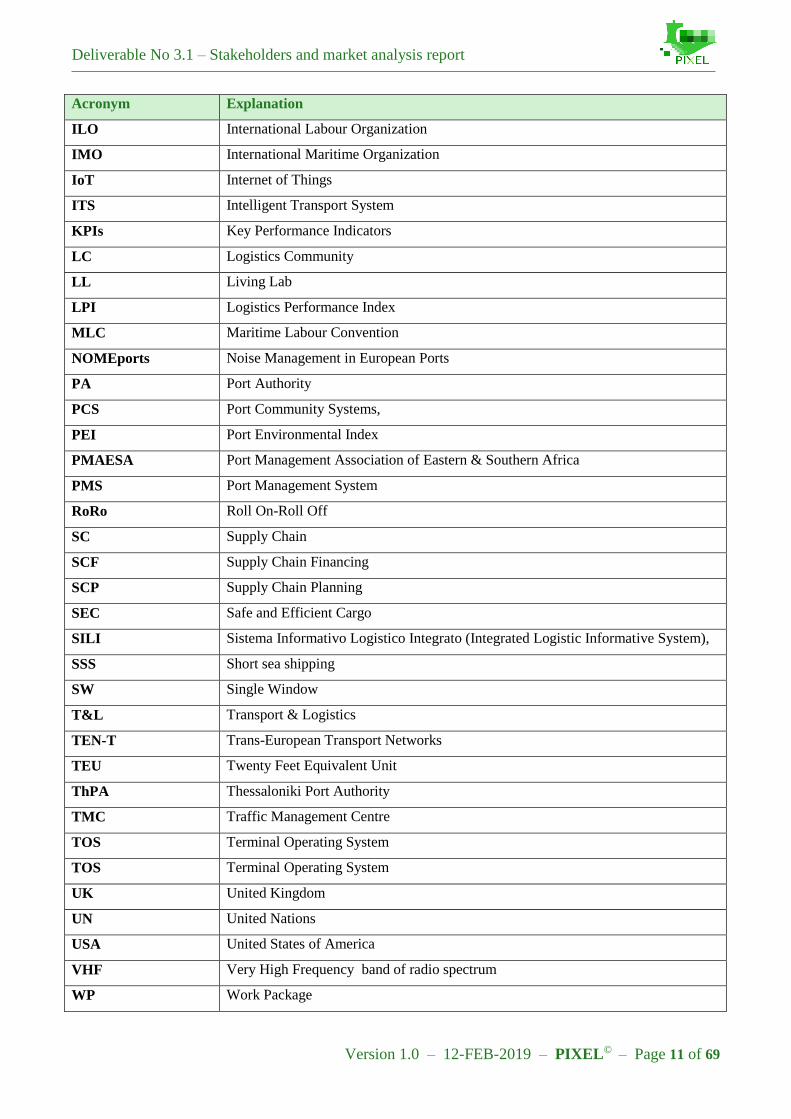
List of acronyms
Acronym Explanation
AGS Automatic Gate System
ADR European Agreement concerning the International Carriage of Dangerous Goods by
Road
AP+ Cargo Community System connected to the VIGIEsip PCS and used in Port of
Bordeaux
APAC Asia-Pacific region
API Application Programming Interface
AQS Air Quality Station
ARPA Regional Agency for the Environmental Protection in Emilia-Romagna Region
ASPM Azienda Speziale Porto di Monfalcone
BTEX Benzene, toluene, and the three xylene isomers
CAGR Compound Annual Growth Rate
CAPA Corrective and Preventive actions
DSDM Dynamic Software Development Method
DSS Deep Sea Shipping
DSS Decision Support System
DTLF Digital Transport and Logistics Forum
EC European Commission
EDI Electronic Data Interchange
EMEA Europe, Middle East and Africa
EMSA European Maritime Safety Agency
ERP Enterprise Resource Planning
ESPO European Sea Ports Organisation
ETA Estimated Time of Arrival
EU European Union
FVG Friuli Venezia Giulia Region
GCS Gate Control System
GHG Greenhouse Gases
GOS Gate Operating System
GPMB Grand Port Maritime de Bordeaux Port of Bordeaux
HMI Human-Machine Interface
HR Human Resources
HRM Human Resources Management
ICT Information and Communication Technology
Deliverable No 3.1 – Stakeholders and market analysis report
Version 1.0 – 12-FEB-2019 – PIXEL© – Page 11 of 69
Acronym Explanation
ILO International Labour Organization
IMO International Maritime Organization
IoT Internet of Things
ITS Intelligent Transport System
KPIs Key Performance Indicators
LC Logistics Community
LL Living Lab
LPI Logistics Performance Index
MLC Maritime Labour Convention
NOMEports Noise Management in European Ports
PA Port Authority
PCS Port Community Systems,
PEI Port Environmental Index
PMAESA Port Management Association of Eastern & Southern Africa
PMS Port Management System
RoRo Roll On-Roll Off
SC Supply Chain
SCF Supply Chain Financing
SCP Supply Chain Planning
SEC Safe and Efficient Cargo
SILI Sistema Informativo Logistico Integrato (Integrated Logistic Informative System),
SSS Short sea shipping
SW Single Window
T&L Transport & Logistics
TEN-T Trans-European Transport Networks
TEU Twenty Feet Equivalent Unit
ThPA Thessaloniki Port Authority
TMC Traffic Management Centre
TOS Terminal Operating System
TOS Terminal Operating System
UK United Kingdom
UN United Nations
USA United States of America
VHF Very High Frequency band of radio spectrum
WP Work Package

Deliverable No 3.1 – Stakeholders and market analysis report
Version 1.0 – 12-FEB-2019 – PIXEL© – Page 12 of 69
Acronym Explanation
WP Work Package
XML eXtensible Markup Language

Deliverable No 3.1 – Stakeholders and market analysis report
Version 1.0 – 12-FEB-2019 – PIXEL© – Page 13 of 69
1. About this document
This market analysis will be based in a comprehensive state of the art review on existing solutions and trends -
where special attention will be paid to vendor specific solutions, existing and proposed standards and research
projects - an analysis of the market of specific elements will take place. It will be comprised of the following
different approaches:
A comparison between the current and emerging situation of port-related solutions that are focused on
the interoperability between agents (cities, transportation companies, port agencies, etc.), the
communication and storage of data of port activities, the exploitation of this information and the
optimization of those operations from different points of view (mostly environmentally).
State of the art review on existing solutions and trends - where special attention will be paid to vendor
specific solutions, existing and proposed standards and research projects - an analysis of the market of
specific elements will take place.
An examination between the various port operations (shipping agents, forwarders, customs agents and
storage terminals) and public authorities (Customs, inspection services, the harbour master and the
Port Authority) involved in maritime goods transport.
A review of the current approaches for addressing and mitigating adverse environmental impacts of
port’s operations.
1.1. Deliverable context
Keywords Lead Editor
Objectives The specific objectives are to analyse the market of current port,
environment and operational data integration and related technological
enablers. More specifically:
To provide a state of the art and market analysis in the areas
targeted in the project, especially on environmental factors and
impact in multi-modal transport models in present-day ports.
To identify ports, agents, stakeholders and different actors
involved in each use-case addressed in other tasks of the project.
To mention legal and regulatory requirements that will be relevant
to PIXEL pilot deployments.
Exploitable results This document does not offer direct exploitable results. Although, the
outcome of this analysis can provide guidelines and characteristics that
can assess to the exploitation of the PIXEL Solution and optimize the
usability and exploitation throughout the duration of the project.
Work plan This deliverable integrates the work done in T3.1 and the first results of
T3.2. It is a crucial document because it will feed WP4, WP5, WP6 and
WP9
Milestones MS2
Deliverables This deliverable precedes the exploitation plan at D9.6 and is developed in
parallel (although independently) with the communication strategy at D9.3
in order to be able to identify the exploitation activities at PIXEL. It will
impact other project activities establishing innovation guidelines to boost
their exploitation potential. Furthermore, the deliverable receives input
from D3.3.
Risks This deliverable includes the analysis of the existing ICT systems which
address similar points as PIXEL. This minimizes the risk of change of the
project requirements due to evolution of relevant technology and market
Deliverable No 3.1 – Stakeholders and market analysis report
Version 1.0 – 12-FEB-2019 – PIXEL© – Page 14 of 69
landscape.
The deliverable also minimises the risk of changes in the market
environment or the user views – thus making the results of the project
obsolete – by making sure that users’ needs and wishes as well as market
trends and changing environment challenges are constantly taken into
account.
1.2. The rationale behind the structure This deliverable has a focus to provide an analysis of the most important players in the industry, to define the
market and its needs and position the project offering accordingly. Since the offering is rather unique, the
competitors are mentioned based on the most relevant offerings, which are analysed in terms of their
competitive advantage.
Section 1 provides information about this document and its interrelation with the other project documents.
Section 2 gives an overview of the main Stakeholders that the PIXEL solution is addressed, the respective
port activities and gives an overview of the current market landscape that PIXEL will operate and compete.
This information is essential to the business development in the context of Task 9.4 (Exploitation and
Business Plan).
Section 3 provides a Market analysis of the vendors that offer competitive solutions to PIXEL and an initial
Market Positioning of PIXEL takes place.
Section 4 identifies international organizations and standards and the PEI concept is introduced and compared
to similar indexes in the current market. In that sense, this Section is a good base for the PEI exploitation as
discussed in Deliverable No. 9.6 (Draft Exploitation Plan). The environmental context is explored, since the
environmental management is what makes the PIXEL offering unique, altogether with the modelling for
prediction and optimization and global data interoperability in port operations.
Section 5 provides a summary of the conclusions and recommendations for future actions from a business
point of view.
The methodology for this report includes a literature review, analysis of relevant solutions, identification of
best practice examples in environmental management and stakeholder consultation to help benchmark current
management approaches and identify opportunities and constraints for implementing the best practice
examples in Europe.
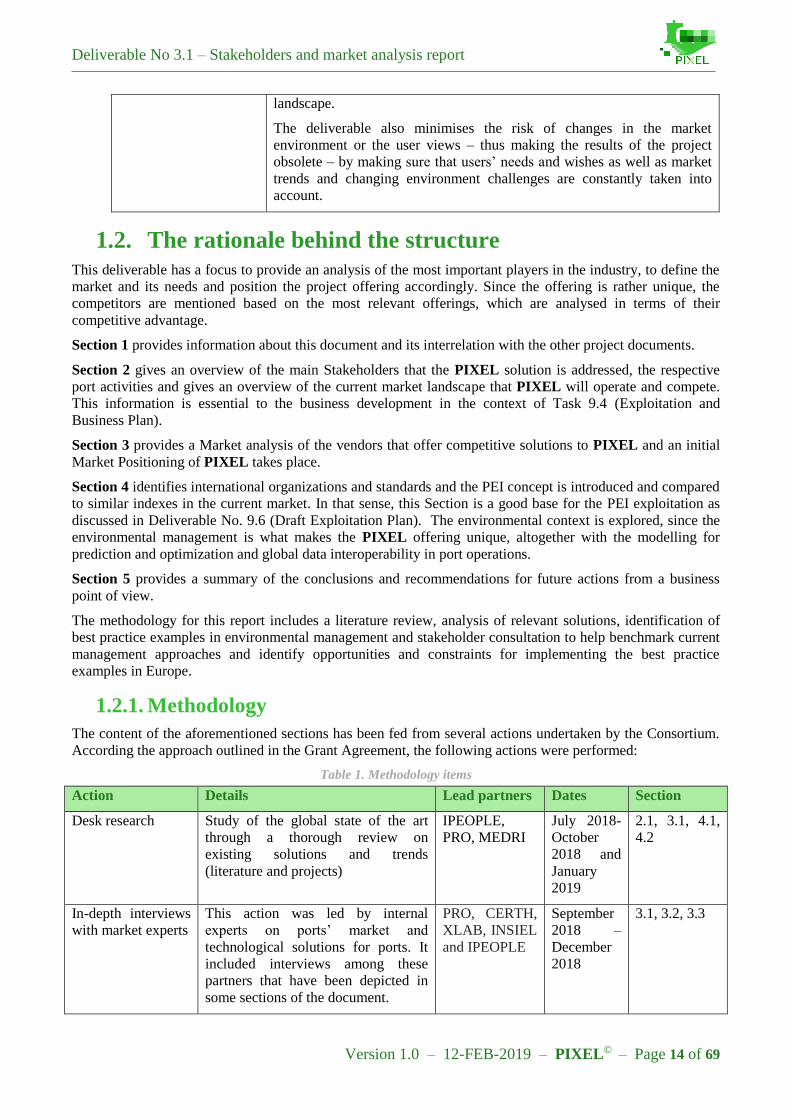
1.2.1. Methodology
The content of the aforementioned sections has been fed from several actions undertaken by the Consortium.
According the approach outlined in the Grant Agreement, the following actions were performed:
Table 1. Methodology items
Action Details Lead partners Dates Section
Desk research Study of the global state of the art
through a thorough review on
existing solutions and trends
(literature and projects)
IPEOPLE,
PRO, MEDRI
July 2018-
October
2018 and
January
2019
2.1, 3.1, 4.1,
4.2
In-depth interviews
with market experts
This action was led by internal
experts on ports’ market and
technological solutions for ports. It
included interviews among these
partners that have been depicted in
some sections of the document.
PRO, CERTH,
XLAB, INSIEL
and IPEOPLE
September
2018 –
December
2018
3.1, 3.2, 3.3

Deliverable No 3.1 – Stakeholders and market analysis report
Version 1.0 – 12-FEB-2019 – PIXEL© – Page 15 of 69
Interviews with
PIXEL stakeholders
and use-case pilots
host partners, users’
surveys and
Workshops
Technical partners performed internal
interviews with the ports within
PIXEL. Sub-actions were
teleconferences and specific timeslots
to conduct agile Workshops in two
PIXEL meetings (Valencia and
Bordeaux)
PRO,
IPEOPLE,
CERTH,
XLAB, MEDRI
and UPV.
Ports: GPMB,
ASPM, PPA
and THPA
July 2018,
September
2018,
November
2018
2.2, 2.3, 2.4
and global
considerations
for 3 and 4.
Market studies &
reports analysis
Analysis of market trends, global
numbers of the sector, current
opportunities, PIXEL’s position in
the whole framework and study of
main concepts and classifications.
PRO,
IPEOPLE,
CERTH
July 2018-
October
2018 and
January
2019
2.3, 2.4
Despite of task T3.1 finalising on month M6 of the project, the Consortium feels necessary to continue some
associated work. Analysing the market, PIXEL’s position and the current status of the art with regards to
ports’ realm must be a continuum to achieve project aims. Market studies & reports analysis, Desk research
and future Innovation potential of PIXEL on ports’ market will be further assessed through task T9.4. Results
on these activities will be delivered within its associated documents.

Deliverable No 3.1 – Stakeholders and market analysis report
Version 1.0 – 12-FEB-2019 – PIXEL© – Page 16 of 69
2. Targeted market and taxonomy
2.1. Ports industry description The importance of the port sector in the development of the global commercial activity is vital. At present it is
considered that more than 90% of the world’s trade is carried by sea (International Maritime Organization,
2019).
This gives a very promising vision of the global marine port and service market with opportunities in services
such as:
Container handling services.
Ship repair and maintenance services.
Navigation services.
Supply chain and logistics solution services.
Mechanical and electrical engineering services.
The global marine port and service market is expected to reach an estimated $87.8 billion by 2023 and it is
forecast to grow at a CAGR of 4.2% from 2018 to 2023 (Lucintel, 2018). The major drivers of growth for this
market are:
High growth of the marine transportation industry.
Surging demand of containerized and bulk cargo.
Rising customer demand.
Expansion of new regional trade hubs.
This converts ports into self-managed entities that handle a large amount of economic resources and whose
agility and reliability is critical for the proper functioning of the global transport chain.
In the following sections, a description of the ports industry is developed: the stakeholders and the main
activities of the ports are identified, in order to later define the addressed needs and the targeted market.
2.1.1. Port definition
A port is a set of multiple infrastructures where not only one type of service is offered, but they are composed
of a network of interrelated activities:
Provision of infrastructures.
Berths.
Handling of merchandise.
Administrative tasks.
Attention to the public.
All these activities and many others, are performed by different agents such as PA.
A PA is the most important agent that we can find in a port. It is responsible for applying the governmental
guidelines in each port. For instance, in the Spanish case, PAs are public bodies dependent on the General
State Administration (in the case of ports of general interest) or the Autonomous Communities (in the case of
other ports). In most cases, the PA are the operators of the port terminal(s).
Europe is one of the regions with the highest port density in the world. It has about 1.200 commercial ports
and some of them, the largest in container traffic.
In ports, we usually distinguish three main areas:

Deliverable No 3.1 – Stakeholders and market analysis report
Version 1.0 – 12-FEB-2019 – PIXEL© – Page 17 of 69
The maritime part accessed by ships.
The terrestrial zone, in which the loading and unloading manoeuvres take place.
The link zone, which connects the port to the land transport means. In some ports this also includes
railway infrastructure linked with the country railway, so that merchandise can be loaded directly to
trains.
In the Marine area we distinguish:
Anchoring area.
Access channels.
Manoeuvring dash.
In the Land Area we distinguish:
Docks.
Storage areas (warehouses, sheds).
Delivery areas (transfer of custody).
Circulation and manoeuvring areas.
Support areas (Workshops, buildings, parking lots).
2.1.2. Port types
There exist several port classifications based on different parameters such as:
By Operations performed: Industrial, Bulk Container, Container, Tourist (Passenger), Commercial,
Oil and Multipurpose. The descriptions of some of them are these:
o Multipurpose: Specialized port facilities for unitary cargo, that have equipment to meet general
and unitary cargo, containers and cargo on wheels (ro-ro), ship booms and cranes, gantry cranes
of 45 tons, mobile cranes on tires, heads for ro-ro, mobile cranes for work on ships of between 10
and 60 tons ramps for ships, portico trucks, large outdoor storage areas, wide concourses and
warehouses.
o Bulk Container: For large-scale vessels docking, so both the navigation channel and the docks are
deep. The cargo can be oil and / or its derivatives, chemical products, sebum, vegetable, oil, etc.
o Container: Specialized terminals to handle cellular container ships with berths that have a depth
of 13 to 15 meters, with gantry cranes of between 45 and 50 tons, patio gantry cranes, large
forklifts, header with platform, station consolidation and deconsolidation similar to multipurpose
terminal.
By Category: We distinguish four large groups:
a. Landlord port (lessor port): Most widespread in Northern Europe and Western Europe model;
it constitutes a mix between public and private orientation. The PA is the owner of the surface
and infrastructures, while the port services and handling of the goods are carried out by
private companies.
b. Public Service Port (Public Operator Port): The owner of the infrastructures and the mobile
equipment is also in charge of the handling of the merchandise. Supply and demand are
harmonized.
c. Private Service Port: The operations are the same as in the Public Service Port, the difference
is that these ports are managed by private companies. These ports are usually restricted to the
public and in many occasions they are at the service of large industrial companies of raw
materials, oil, etc.
d. Tool Port (Autonomous Port): Totally private port.
Deliverable No 3.1 – Stakeholders and market analysis report
Version 1.0 – 12-FEB-2019 – PIXEL© – Page 18 of 69
By Size: The size differentiation is based on the total annual volume and presentation of the goods
handled by the ports. In this way PA are classified in small ports if they handle a total volume of less
than or equal to 10 million tons, followed by medium ports if they are handling less than or equal to
50 million tons and large ports if they handle more than this quantity.
By Region: We find this division present in Europe. Regional differentiation is based on a geo-
governance typology that classifies European PA in five groups:
a. Hanse: Iceland, Norway, Finland, Sweden, Denmark, Germany, Netherlands and Belgium.
b. New Hanse: Estonia, Latvia, Lithuania and Poland.
c. Anglo-Saxon: UK and Ireland
d. Latin: France, Portugal, Spain, Malta, Italy, Greece and Cyprus.
e. New Latin: Slovenia, Croatia, Romania and Bulgaria.
Geographically: The distinction is between fluvial, maritime and dry ports.
o Fluvial: Port installation consisting of docks that extends on the bank of a river taking advantage
of its navigability. The industrial companies take advantage of their characteristics to lower costs
of reception and shipping of goods. Among its functions is:
Transshipment and Merchandise handling.
Industry functions: Intersection, Supply and Organization. In many ports there are industrial
companies that take advantage of the fluvial ways to lower costs of reception and shipping
of goods.
Examples of these kind of ports are: Lisboa, Duisburg, Rotterdam, Sevilla.
o Maritime: Common functions are:
Intersections between maritime and terrestrial traffic.
Headquarters of service companies and logistics center.
At the environmental level, they give special importance to the connections between maritime
and terrestrial transport following sustainable directions.
o Dry Port or Inner Terminal: It is an international terminal located in the interior of the country
(relatively far from the coast) and directly connected through the rail network with one or several
ports origin and/or destination of the traffic to which it is dedicated. Example of this type of port
is the maritime terminal of Zaragoza developed by the port of Barcelona and in operation since
2001.
2.1.3. Port main activities
If we classify ports by activity, as we have seen in the previous division (by operations performed), we find
two predominant groups:
Freight transport: The transport of goods is linked to the economic activity of a country, the greater
the volume of traffic, the greater the activity and vice versa. These traffics are mainly channeled
through ports so their volume can be used as an indicator of the health of a country's economy. Ports
are no longer important for the amount of activities that can be developed in their interior, but for all
those that may be related to them. There are various types of cargo that are shipped around the world.
Types:
a. Import/Export: Ports are an important link in the logistics chain so the level of port efficiency
affects –to a large extent- the country’s competitiveness, since port efficiency results in lower
tariffs for exports which, in turn, favor the competitiveness of country products in international
markets. The economic relevance of ports arises from the fact that most of the foreign trade of a
region is carried out by sea; for instance, about 90% of the international trade of the European
Union is performed by sea (Eurostat, 2016). This figure increases in relation to insular territories
where most goods are traded through the ports. Therefore, in order to keep a competitive position
in those markets, the countries need to work on the factors that affect the efficiency of their ports
and draw continuous comparisons on the degree of efficiency among them and with the ports of

Deliverable No 3.1 – Stakeholders and market analysis report
Version 1.0 – 12-FEB-2019 – PIXEL© – Page 19 of 69
other regions. One of the main challenges for the contemporary harbor industry arises from the
complicated nature of its operations; this is a consequence of the number of different agents
involved in importing and exporting containers and the complex operational interactions between
the different service processes taking place at a port. Another challenge for the harbor industry
comes from the increasingly competitive commercial environment that has arisen in recent years.
Unlike their predecessors, many individual container ports no longer enjoy monopoly control
over the handling of cargoes from within their hinterland (Emeghara, 2012). Individual container
ports are not only concerned with whether they can physically handle cargo, but also whether
they can successfully compete for it (Cullinane, et al., 2003). In a competitive environment where
shipping lines have the choice of using more than just a single port for the facilitation of cargo
movements, a harbor faces the constant risk of losing its customer base (Talley, 2007). To
maintain its competitiveness in such a market, a port has to invest heavily in sophisticated
equipment or in dredging channels to accommodate the most advanced and largest container
ships in order to facilitate cost reductions for the container shipping industry (Wang, et al.,
2005). It is the intense competition which characterizes the container port that has stimulated an
overt interest in the efficiency with which it utilizes its resources (Lu & Wang, 2017).
b. Transshipment: We can find SSS (Short-sea-shipping) or DSS (Deep-sea-shipping). SSS, is the
maritime transport of goods over relatively short distances, as opposed to the intercontinental
cross-ocean deep sea shipping (DSS). In the context of EU transport statistics it is defined as
maritime transport of goods between ports in the EU-28 on the one hand, and ports situated in
geographical Europe, on the Mediterranean and Black Sea on the other hand.
Container handling: Containers, also known as intermodal containers or ISO containers because the
dimensions have been defined by ISO, are the main type of equipment used in intermodal transport by
ship. The three common sizes for containers are:
a. one TEU 20-by-8-foot (6.1m x 2.4m) x 8-foot-6-inch (2.59m)
b. two TEU 40-by-8-foot (12.2m x 2.4m) x 8-foot-6-inch (2.59m)
c. highcube 40-by-8-foot (12.2m x 2.4m) x 9-foot-6-inch (2.90m)
Workflow and sub-activities: In order to make freight transport efficient, products are packed into
collective logistics units which can remain intact throughout the delivery chain. A logistics unit can be
any combination of trade units or other objects put together in a case or on a pallet established for the
purpose of transport or warehousing. Logistics units can be individually identified by a SSCC (Serial
Shipping Container Code) which allows for the exchange of all necessary information using
Electronic Data Interchange messages. The information can then be accessed by for example bar code
scanning or reading RFID tags. Standardized logistics units facilitate the use of mechanical and even
automated devices during handling operations and can enable stackability as well as interoperability
between transport modes. Logistics units are available in many sizes and forms including boxes,
pallets and large and small containers.
Smaller logistics units such as boxes and pallets are often grouped into even larger units and loaded
on trailers and semi-trailers, swap bodies, air freight unit load devices, intermodal shipping containers
and rail freight wagons.
Environmental issues and impact: The major contributors to global CO2 emissions from shipping are
container ships followed by tankers and bulk carriers. In 2017 containers generated 20% of
international emissions, whilst representing 4% of the global fleet. It is stressed that reefer containers
are also responsible for refrigerant emissions (Olmer, et al., 2017).
Environmental control activities: Implementation of environmental legislation is particularly
appropriate in this context.
o Raise awareness in the port and maritime community of need for action
o Initiate studies, strategies and actions to reduce GHG emissions and improve air quality
Deliverable No 3.1 – Stakeholders and market analysis report
Version 1.0 – 12-FEB-2019 – PIXEL© – Page 20 of 69
o Provide a platform for the maritime port sector for the exchange of information thereon
o Make available information on the effects of climate change on the maritime port environment
and measures for its mitigation
The other types of the “by activity” ports classification are:
Bulk handling: Set of goods or materials that are transported without packaging or packaging in large
quantities. This cargo is mainly divided into solid or dry bulk cargo and liquid bulk cargo. Bulks, both
solid and liquid, are usually stored in silos. Bulk transport is carried in appropriate merchant vessels:
bulk carriers, tankers, methane tankers.
Large specialized ports in bulk:
o Port of Rotterdam, Netherlands.
o Port of South Louisiana, New Orleans (USA).
o Port of Musel, Asturias (Spain).
Types of bulk:
i. Solid: Dry Bulk covers five major bulk commodities (iron ore, coal, grain, bauxite and
alumina, phosphate rock), minor bulks (forest products and the like) containerized cargo,
general cargo / break bulk accounts for about 70.2 per cent of global trade (United Nations
Conference on Trade and Development, 2014).
Workflow and sub-activities: It includes any plant or premises, other than a ship, used for
purposes ancillary or incidental to the loading or unloading of bulk dry cargoes. It describes
the operation of loading or unloading of a ship; transfer to, from, or within a terminal area or
ship; or trans-shipment between ships or other modes of transport. This includes intermediate
keeping; i.e. the temporary storage in the port area during their transport. In dry bulk terminals
two unloading methods, FIFO (First In / First Out) and SSF (Small Ships First), are mostly
applied in the berth allocation activities. Furthermore, ship scheduling and discrete berth
allocation takes place in order to minimise ship waiting times and deviation of customer
priority. Other activities include the maintenance activities, extra fees (demurrage) and awards
(despatch) for port administrators in their berth allocation problem in a terminal. The ship
arrival problem focusses on predicting the ship arrival times in order to predict the expected
time at berth. Therefore it is directly linked to the berth allocation problem. Hazard activities
that include activities, occurrence or circumstance of any kind that has the potential to cause
injury to persons, to damage property or pollute the environment including the escape,
spillage, leakage or the loss of containment of any bulk dry cargo.
Environmental issues and impact: Five major bulk commodities (iron ore, coal, grain, bauxite,
and phosphate rock) account for ~ 44% of the total volume of all global transported dry bulk
commodities (United Nations Conference on Trade and Development, 2017). Releases of dry
bulk material into the marine environment occur via accidental releases (e.g., plunges and ship
losses), and operational releases (dumping or discharging of cargo residues after washing of
cargo holds and fugitive emissions). Although bulk carrier losses are more frequent than oil
spills, they are usually undocumented (Grote, et al., 2016). Although nontoxic cargo releases
do not fall under MARPOL Annex V for operational discharges, they may cause localized
negative environmental effects when released in large quantities. Despite that most HME
cargoes are mineral ores and metal concentrates, the classification of hazards to marine
organisms remains unclear. (Sheppard, 2019) Therefore, more studies are required to
understand better the ecological risks to the marine environment from releases of dry bulk
cargoes (Grote, et al., 2016).
Environmental control activities: Measures to prevent or control the impact of a spill will
require a risk assessment. The hierarchy of controls will need to be employed to suit the
containment and clean-up operations. The hierarchy of control is a sequence of options which
offers a number of ways to approach the control of spill hazards. Working down the list to
implement the best measure possible is the aim.
Deliverable No 3.1 – Stakeholders and market analysis report
Version 1.0 – 12-FEB-2019 – PIXEL© – Page 21 of 69
ii. Liquid: Crude oil, petrol, fuel oil, vegetable oils and even wine; all liquid products which are
often transported on big tankers. For the refineries, crude oil is the raw material they need to
produce new goods, such as fuel oil, petrol and kerosene. Hence the importance of this type of
goods.
Workflow and sub-activities: Scheduling of berthing and unloading activities at the terminal
and the scheduling of pumping activities through the pipeline. Models for considering the
uncertainty in oil supply availability due to maritime conditions. Petroleum scheduling
activities that include the selection of crude flows, the allocation of vessels to tanks, the
allocation of tanks to crude distillation units and the calculation of crude compositions.
Environmental issues and impact: Petroleum (including gasoline, diesel, bunker fuel, and
unrefined crude oil) spills remain among the highest publicized and environmentally
damaging disasters worldwide (Walker, et al., 2018). While the transport of oil is responsible
for only 12% of all oil spills worldwide, about two-thirds of those are from marine vessels
(Burgherr, 2007). While all petroleum products are transported as cargo, bunker fuel (No. 6
Fuel) is the main fuel for marine vessels (Anton Paar, 2019). Accidental discharges result from
human error (e.g., groundings) and from technological failure (e.g., explosions). Operational
discharges are intentional caused by neglect or wilful violation of international conventions.
Of the 459 ‘large’ spills (> 700 t) between 1960 and 2016, more than half occurred in the
1970s and only 44 (< 10%) since 2000 (ITOPF, 2017)
Environmental control activities: Despite our capacity and rush to develop technology to
address environmental problems, natural recovery typically remains the best restoration
strategy in all but the most fragile ecosystems. Biological communities tend to re-populate
after pollution levels return to background, yet restoration efforts may interrupt the natural
recovery processes (Walker, et al., 2018). Technology and regulations have proven to be
effective tools in preventing spills as evidenced by the implementation of double-hulled ships
and the single biggest cause of oil spill reductions (Burgherr, 2007). Overall, proactive
international preventative measures in the form of regulations and policies are the most
effective actions to mitigate environmental effects of oil spills, thereby negating clean-ups
(Walker, et al., 2018).
Passenger transport: Refers to the movement of passengers by sea.
Workflow and sub-activities: Transport of passengers and freight over water, whether scheduled or
not. Also includes: Operation of towing or pushing boats, cruise or sightseeing boats, ferries, water
taxis, etc.
o Activities related to water transport of passengers, animals, or freight:
o Operation of terminal facilities such as harbours and piers; operation of waterway locks;
o pilotage and berthing activities; loading and unloading of goods, transhipment (unloading cargo
from one ship and loading it onto another),
o Cargo handling, anchoring services, salvage activities, and lighthouse activities.
Environmental issues and impact: The intensive maritime transport activity implies:
o Port emissions.
o Risks of accidents.
o Acute pollution.
o Abrasion: Damage caused from grounding and anchoring of ships in the sea ground.
o Underwater noise: Maritime traffic is an important source of noise. Excessive noise makes it
harder for whales to communicate with each other or to receive acoustic cues.
o Marine Litter.

Deliverable No 3.1 – Stakeholders and market analysis report
Version 1.0 – 12-FEB-2019 – PIXEL© – Page 22 of 69
o Introduction of synthetic compounds: Biocides (mainly organotin compounds such as tributyltin,
known as TBT) used in antifouling, paints and polycyclic aromatic hydrocarbons (PAHs)
resulting from hydrocarbon oil discharges and accidentals spills.
Environmental control activities:
o Recognition of the environmental aspects
o Environmental Management System continual improvement
o Adoption of best practices
o Natural resources conservation
o Improvement of the environmental performance
o Communication and consultation with the community
2.1.4. Port stakeholders
The port sector is surrounded by the names of large maritime companies and transport companies. Each of
those actors that act along the maritime transport chain is what is known as an agent.
This is a list of the agents that intervene in maritime traffic:
Consignee
Stevedore
Tugboat
Shipping Agent
Shipping Company
Container Terminal
Rail Carrier
Road Transporter
Customs
Inspection Body
Port Authority (PA)
Importer / Exporter
Forwarder
Customs Agent
Within the port we can distinguish operators or agents in two arcs: terrestrial and maritime.
Operators / agents in the terrestrial arc:
o Carriers
o Goods owners
o Passengers / customers
Operators / agents in the maritime arc:
o Entry / Exit and stay of ships concerns to:
Ship owners.
Operators that provide services to ships and vessels (consignees, pilots, tugboats, tugs,
repairers, suppliers, etc.).

Deliverable No 3.1 – Stakeholders and market analysis report
Version 1.0 – 12-FEB-2019 – PIXEL© – Page 23 of 69
Boats owners.
Goods owners.
Passengers.
o Loading / Unloading and Transit / Storage of Goods
Operators that provide services to the merchandise (consignees, freight forwarders, customs
agents, dockers, crane operators, storekeepers, etc.).
Boats owners.
o Boarding / Landing of passengers:
Operators that provide services to passengers (Travel Agents, Ticket vendors, Hoteliers, etc).
Passengers / Clients.
o Fishing discharge / Commercialization:
Operators that provide services to Fisheries (Farms, Marketers, etc.).
Client’s owners of fishing.
Figure 1. Example of the interaction between the different agents (ValenciaportPCS, 2016)
The stakeholders can be categorized according to their importance to the port and their ability to switch to
another port in the vicinity of the port they are already operating. A stakeholders power map is shown in the
below figure – the stakeholders in the upper-left corner of the figure are considered to have the most power to
the ports participating in the PIXEL project.

Deliverable No 3.1 – Stakeholders and market analysis report
Version 1.0 – 12-FEB-2019 – PIXEL© – Page 24 of 69
Figure 2. Stakeholders power for the ports participating in the PIXEL project
2.1.4.1. Transport industry actors
The transport industry spans all actors related to the production and provision of transport services including
transport companies and supplementary businesses. Transport services can be related to services for the actual
physical change of location, fixed location services including storing, packaging and transshipping as well as
services for consultation, organization, brokerage and sales of transport services. The transport chain is
complex and various actors take part in the physical movement of goods and the transmission of information
regarding the cargo.
The goods are transported along nodes where they are handled and often transferred from one mode to another
such as road, rail or sea.
Consigner/Consignee
A consigner - also called shipper, exporter or seller - initiates the transport:
Freight transports are typically initiated as a commercial interaction between a seller and a buyer. In
most cases these parties are also the shipper and the buyer. The consigner is the party which by
contract sends goods from one place to another and the consignee is the party to which the goods are
consigned. The shipper is often the only actor in the transport chain with detailed knowledge of the
cargo. The shipper is responsible for loading, closing and sealing of the cargo container. Shippers and
consignees are the most numerous actors in the transport chain and are characterized by many small
and medium sized enterprises. Depending on what is agreed upon between the seller and the buyer the
ownership and responsibility of the cargo is transferred somewhere in the transport chain. Often
incoterms are used in the contract to make it clear when the ownership of the cargo is transferred from
one party to the other.
Freight forwarders
Deliverable No 3.1 – Stakeholders and market analysis report
Version 1.0 – 12-FEB-2019 – PIXEL© – Page 25 of 69
A freight forwarder picks up the goods and transports it to the port, where it is screened by customs
before it is loaded onto a ship or plane by the terminal operator or ground handlers respectively.
Freight forwarders organize the transport, customs formalities and insurance of goods during transport
on behalf of the shipper. From the shipper's perspective, the freight forwarder is usually responsible
for all aspects of the container transportation from the origin to the destination. Freight forwarders
take care of the pick-up, hub-handling and ground handling of the cargo until it is delivered to the port
where the cargo needs to go through customs clearance before the responsibility of the cargo transfers
to the terminal operator or airport ground handler for further port-handling before the ocean or air
freight. Freight forwarders are usually responsible for the first and last transport leg of the supply
chain with direct contact with shippers and consignees. After delivery and unloading of intermodal
containers, the forwarder dispatches the empty container to the shipper. Freight forwarders have a
hybrid role in the transport chain as they act as carriers to the original consigners and as consigners to
the shipping lines. Freight forwarders are often small or medium sized companies.
Shipping lines
The shipping lines accommodate the transport and reports to the necessary authorities about its arrival
and cargo.
Customs and regulatory authorities
The customs authority in the arrival country checks the cargo before it is delivered by a freight
forwarder to the consignee - also called buyer or importer - who unloads and controls the goods.
Customs and regulatory authorities are not directly involved in the physical transportation of
containers but supervise the cargo and information flow in order to detect unlawful acts that could
harm the security and safety of the supply chain. The supervising role is divided between transport
authorities and customs authorities. Most international freight transports pass through one or several
ports which are natural checkpoints for security measures. Intermodal containers may not enter a port
or customs territory without customs being informed and unless the integrity of each container has
been controlled. Customs are responsible for protecting a country from illegal or dangerous imports
and for collecting truces on imported goods. Transport authorities oversee vehicles, drivers, operators
and operators’ facilities and police theft of goods, illegal immigration and transport of dangerous
goods.
Terminal operators and ground handlers
Terminal operators handle the logistics of containers between ships and other modes of transportation.
Loading and unloading of container ships are mostly done by private companies which are also often
responsible for the terminal operations, infrastructure and IT systems. Containerized port traffic is
today mostly handled by global terminal operators such as COSCO Shipping Ports, China Merchant
Port Holdings, PSA International, Hutchison Ports, APM Terminals and DP World. COSCO Shipping
Ports was the largest container terminal operator in the world in 2016 with a throughput of 97.3
million TEUs, corresponding to a market share of 13 percent. The top 5 container terminal operators
together accounted for more than 50 percent of the total global throughput which reached 748 million
TEUs in 2016 (World Shipping Council, 2018). Merger and acquisition activities have been common
among the terminal operators in the past years, e.g. COSCO merged in early 2016 with China
Shipping to form China COSCO Shipping.
As the cargo moves to the port, the actors involved usually become larger and the transport flow becomes
more concentrated. The opposite is also true whenever the cargo is moved away from the port. The security
concerns in the transport chain are in many cases related to the large number of small and medium companies
operating at the outer bounds of the transport chain. There is no central actor organizing the transport, making
optimization of security efforts difficult.
2.1.4.1. Stakeholders’ relevance and interest to the PIXEL project
The stakeholders described both for the ports and for the transport industry in general have been categorized
in terms of their relevance and their expected interest in the PIXEL project.

Deliverable No 3.1 – Stakeholders and market analysis report
Version 1.0 – 12-FEB-2019 – PIXEL© – Page 26 of 69
Figure 3. Stakeholders’ relevance and interest to a product
The Analysis team is comprised by the members of the PIXEL consortium and the Project Owner who have a
direct interest and contact with the project. As far as the rest of the teams are concerned, each port measures
differently the interest and the relevance of each stakeholder group with the project. For example when a pilot
case does not involve passenger traffic, the passengers are not considered important to the case.
However, since the unified PIXEL product will synthesize the results of all pilot cases into the final product,
the table below summarizes the expected interest and relevance of various stakeholders to the final PIXEL
product.
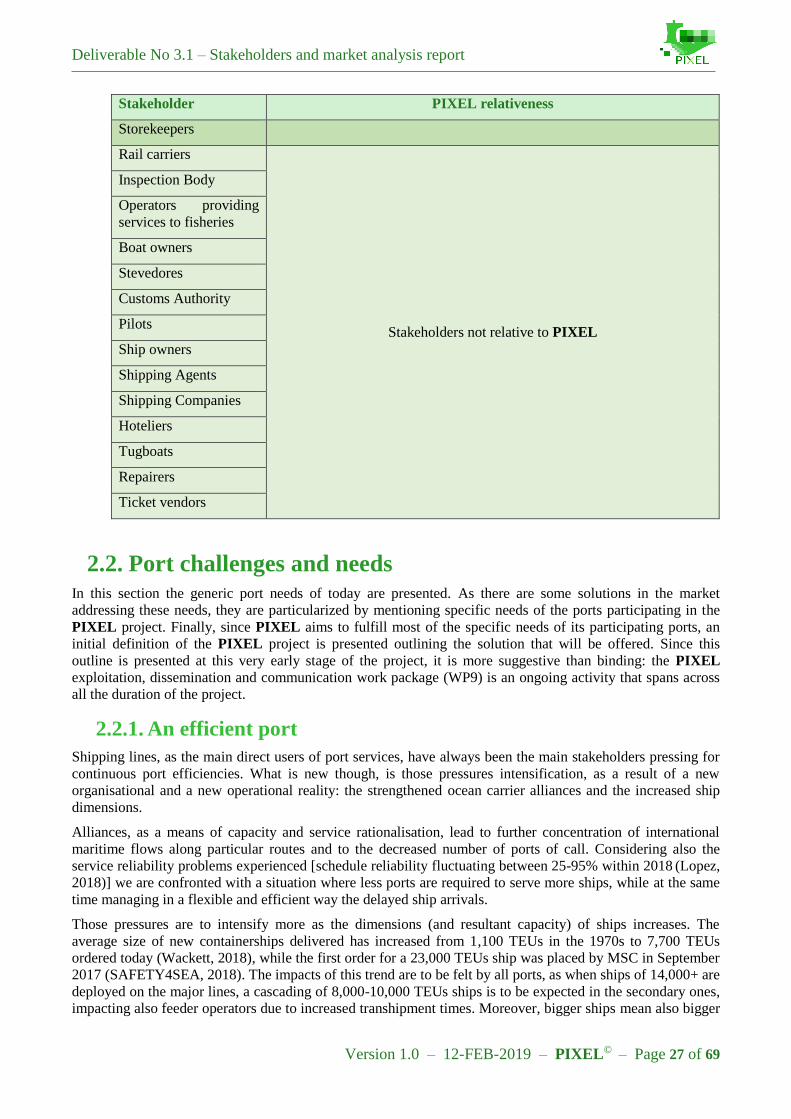
Table 2. Stakeholders’ relativeness to the PIXEL offering
Stakeholder PIXEL relativeness
Passengers
Stakeholders & Systems with direct contact with PIXEL
Port Authority (PA)
Travel Agents
Carriers
Container Terminal
Stakeholders who benefit from PIXEL
Crane operators
Customs agents
Freight forwarders
Importers / Exporters
Road Transporters
Goods owners
Stakeholders who have an influence or interest in PIXEL Dockers
Consignees
Deliverable No 3.1 – Stakeholders and market analysis report
Version 1.0 – 12-FEB-2019 – PIXEL© – Page 27 of 69
Stakeholder PIXEL relativeness
Storekeepers
Rail carriers
Stakeholders not relative to PIXEL
Inspection Body
Operators providing
services to fisheries
Boat owners
Stevedores
Customs Authority
Pilots
Ship owners
Shipping Agents
Shipping Companies
Hoteliers
Tugboats
Repairers
Ticket vendors
2.2. Port challenges and needs In this section the generic port needs of today are presented. As there are some solutions in the market
addressing these needs, they are particularized by mentioning specific needs of the ports participating in the
PIXEL project. Finally, since PIXEL aims to fulfill most of the specific needs of its participating ports, an
initial definition of the PIXEL project is presented outlining the solution that will be offered. Since this
outline is presented at this very early stage of the project, it is more suggestive than binding: the PIXEL
exploitation, dissemination and communication work package (WP9) is an ongoing activity that spans across
all the duration of the project.
2.2.1. An efficient port
Shipping lines, as the main direct users of port services, have always been the main stakeholders pressing for
continuous port efficiencies. What is new though, is those pressures intensification, as a result of a new
organisational and a new operational reality: the strengthened ocean carrier alliances and the increased ship
dimensions.
Alliances, as a means of capacity and service rationalisation, lead to further concentration of international
maritime flows along particular routes and to the decreased number of ports of call. Considering also the
service reliability problems experienced [schedule reliability fluctuating between 25-95% within 2018 (Lopez,
2018)] we are confronted with a situation where less ports are required to serve more ships, while at the same
time managing in a flexible and efficient way the delayed ship arrivals.
Those pressures are to intensify more as the dimensions (and resultant capacity) of ships increases. The
average size of new containerships delivered has increased from 1,100 TEUs in the 1970s to 7,700 TEUs
ordered today (Wackett, 2018), while the first order for a 23,000 TEUs ship was placed by MSC in September
2017 (SAFETY4SEA, 2018). The impacts of this trend are to be felt by all ports, as when ships of 14,000+ are
deployed on the major lines, a cascading of 8,000-10,000 TEUs ships is to be expected in the secondary ones,
impacting also feeder operators due to increased transhipment times. Moreover, bigger ships mean also bigger

Deliverable No 3.1 – Stakeholders and market analysis report
Version 1.0 – 12-FEB-2019 – PIXEL© – Page 28 of 69
volumes unloaded within a small time-window, transferring congestion pressures towards the hinterland
connections (road and rail). Therefore, the efficiency challenge becomes also relevant for medium and small
ports, which will have to address it having by definition more limited resources, capabilities but also more
significant problems in terms of hinterland accessibility. Concerns about the impact of bigger ships on final
delivery schedules have been raised also from the side of large retail importers (Nightingale, 2015). Within
this context, ports are to be faced with a number of needs, among which:
to balance increased congestion with swift cargo transfer to the hinterland
to balance additional capacity requirements due to higher handling peaks with the requirement of high
infrastructure (port equipment, areas, hinterland connections) utilisation.
2.2.2. An environmentally sustainable port
Real life experience shows that for ports to sustain their functions and further develop, environmental
sustainability is a main precondition. This is a case experienced in many ports around the world, sometimes
even through court decisions. Environmental sustainability at the same time is (and will increasingly be in the
future) used as differentiation factor among port operators, strengthening port competitiveness. Such a
differentiation becomes increasingly important also for small and medium ports in which environmental
sustainability can serve as an important element in terms of competition both among ports and among port
gateway regions. In that direction, the increasingly seen targets of shipping lines towards reduced or zero
emissions [e.g. Maersk’s zero CO2 target for 2050 (The Maritime Executive, 2018)] place an additional
pressure on ports to contribute towards more sustainable maritime-port-hinterland supply chains. These issues
result to the following needs for ports:
to use natural resources in a more efficient way in core port activities;
to build the required capabilities for assessing and continuously monitoring the full spectrum of port
environmental impacts;
to provide the required infrastructure for port users to realise environment benefits (e.g. alternative
fuel infrastructure);
to assume the role of promoter of port cities’ circular economy (e.g. industrial heat as a result of
activities in the port area can be used for urban district heating, while urban waste can be used for
energy production in ports).
2.2.3. A smart & connected port
Amply generated information through automatic data capture systems and information sharing, still remains
fragmented in many settings. The first case of fragmentation comes from the information and technological
barriers experienced by the various actors of port-centric supply chains, who do not possess the required
capabilities to efficiently capture operational data, aggregate, homogenise them and integrate multi-actor
processes. Another case of fragmentation is experienced between the more and less technologically developed
port community members. SMEs involved in a port-centric supply chain (e.g. small freight forwarders, road
operators, but also small ports), will need guidance and tools to interconnect their systems and processes to the
ones of other SMEs and also to the ones of the more advanced actors. Fragmentation also exists between
system 'families' with a different core focus. This is the case of regulation compliance systems (e.g. Maritime
Single Windows, SafeSeaNet, and Customs Single Windows) vs efficiency-oriented (e.g. Port Community
Systems, Terminal Operating Systems and Road/Rail Cargo Monitoring Systems). The level of fragmentation
varies between countries, but in the majority of the cases the information transfer between the two families
(where it is electronic and not manual) is unidirectional, with the potential of generating efficiency benefits
out of already existing compulsory reporting systems being missed.
Moreover, as technological gaps are among the main sources of inefficiencies across ports (Merk & Dang,
2012), during the last decade we have witnessed a strong drive towards the automation of port operations
supported by new handling technologies and equipment, information systems (PCSs, TOSs, etc.). It is
estimated that today around 9% of container terminals around the world are either fully or partially automated
(Rodrigue, 2018). At the same time though, to a large extent all this automation is still based on rather
Deliverable No 3.1 – Stakeholders and market analysis report
Version 1.0 – 12-FEB-2019 – PIXEL© – Page 29 of 69
traditional processes within ports and between ports and hinterland means. The use of simulation regarding
port operations and their impacts (in efficiency and environmental sustainability terms) is limited,
undermining the opportunities for smarter decisions that could go beyond the current traditional processes.
Finally, it should not be forgotten that at the core of any technological and process innovation remains the
need to ensure that the right information is not only available but is also secure. Currently, awareness on cyber
security needs and challenges in the maritime sector is low. Cyber threats for the industry are related to ships
and safe navigation, ports, and Terminal Operating Systems. Recent cyber-attacks have put uninterrupted
operations at high risk [e.g., Wannacry ransomware, successful attacks on Maersk (Gronholt-Pedersen, 2017)
and COSCO (Hellenic Shipping News, 2018) shipping lines, etc.], and supported crime [e.g. concealing drug
trafficking inside legitimate cargo through the Port of Antwerp, Belgium (United Nations Conference on
Trade and Development, 2017)]. IMO has responded through a set of voluntary guidelines on cyber-security
practices, and has required from ship-owners and managers until 2021 to incorporate cyber risk management
into ship safety. Taking into account all the above issues, the following challenges for the ports can be
identified:
to employ efficient approaches & technologies for integrating pieces of fragmented port-centric
operations
to generate business benefits out of compulsory reporting applications
to make it easier for SME actors to be integrated in a smart & connected port concept
to address evolving cybersecurity threats.
2.2.4. A port creating local value and being socially integrated to the
city
As historically many ports have served as the core of the development of cities, today most of the European
ports are adjacent or within the city complex. This co-existence requires a fresh look at the spatial diffusion of
their impacts. Well-functioning ports can lead to significant economic and innovation impacts for their wider
region. It has been estimated that one tonne of port throughput is associated with USD100 of economic value
added, while nine out of the 10 world regions with the largest amount of patent applications in shipping are
home to one or more large global ports (Merk, 2010). While negative (mainly environmental) impacts occur at
the port-city area, the positive ones (mainly financial) are split over many regions, some of which quite
distant. To add to this, experience has shown that port authorities, terminal operators, local stakeholders and
governments do not necessarily share the same goals and policy perceptions on tackling this issue. This leaves
ports with the considerable need of 'creating local value' from port operations and being socially-integrated to
their cities. This places a requirement for ports to integrate their overall planning to the planning of the cities
they consist part of, and also to explore opportunities for contributing to the objectives of their region’s smart
specialisation objectives.
2.2.5. Port ICT drivers
In order to face the challenges mentioned in the previous paragraphs, the ports invest more, either directly or
indirectly, in improving their connectivity. This not only affects their tangible connections but also the digital
environment. It is about being more efficient trying to:
Automate processes and operations.
Facilitate communication between the different port agents.
Improved HR.
Risk minimization.
Costs savings.
When it comes to sustainability, the ports have recognized the necessity to carefully consider environmental
issues in their strategic planning and behaviour and to communicate actively with the entire range of their
Deliverable No 3.1 – Stakeholders and market analysis report
Version 1.0 – 12-FEB-2019 – PIXEL© – Page 30 of 69
stakeholders. In order to deal with the national and international regulations the port authorities had to follow
a “learning and doing” approach for the development of green policies (Siu Lee Lam & Notteboom, 2014).
That is the reason for the introduction of new technologies in the port sector. These technologies include the
software, the hardware and the people who will use them and are defined with the term of ICT (Information
and Communications Technology) Port Systems.
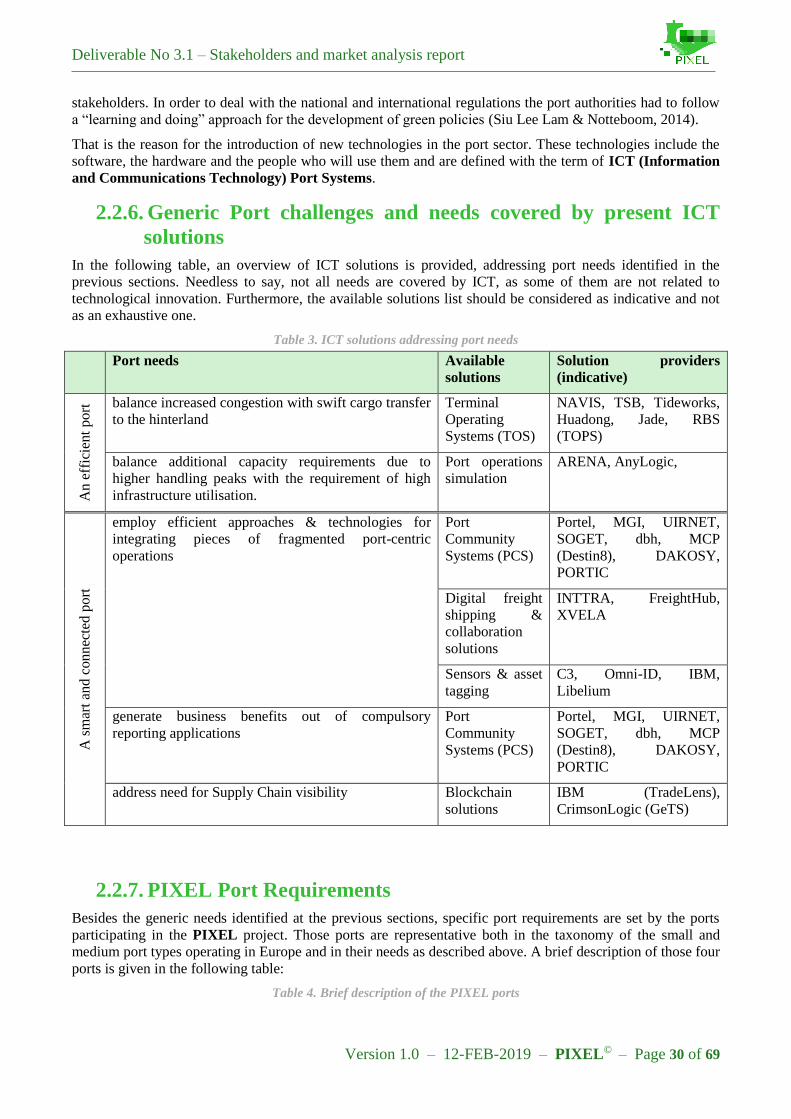
2.2.6. Generic Port challenges and needs covered by present ICT
solutions
In the following table, an overview of ICT solutions is provided, addressing port needs identified in the
previous sections. Needless to say, not all needs are covered by ICT, as some of them are not related to
technological innovation. Furthermore, the available solutions list should be considered as indicative and not
as an exhaustive one.
Table 3. ICT solutions addressing port needs
Port needs Available
solutions
Solution providers
(indicative)
An e
ffic
ient
port
balance increased congestion with swift cargo transfer
to the hinterland
Terminal
Operating
Systems (TOS)
NAVIS, TSB, Tideworks,
Huadong, Jade, RBS
(TOPS)
balance additional capacity requirements due to
higher handling peaks with the requirement of high
infrastructure utilisation.
Port operations
simulation
ARENA, AnyLogic,
A s
mar
t an
d c
onnec
ted p
ort
employ efficient approaches & technologies for
integrating pieces of fragmented port-centric
operations
Port
Community
Systems (PCS)
Portel, MGI, UIRNET,
SOGET, dbh, MCP
(Destin8), DAKOSY,
PORTIC
Digital freight
shipping &
collaboration
solutions
INTTRA, FreightHub,
XVELA
Sensors & asset
tagging
C3, Omni-ID, IBM,
Libelium
generate business benefits out of compulsory
reporting applications
Port
Community
Systems (PCS)
Portel, MGI, UIRNET,
SOGET, dbh, MCP
(Destin8), DAKOSY,
PORTIC
address need for Supply Chain visibility Blockchain
solutions
IBM (TradeLens),
CrimsonLogic (GeTS)
2.2.7. PIXEL Port Requirements
Besides the generic needs identified at the previous sections, specific port requirements are set by the ports
participating in the PIXEL project. Those ports are representative both in the taxonomy of the small and
medium port types operating in Europe and in their needs as described above. A brief description of those four
ports is given in the following table:
Table 4. Brief description of the PIXEL ports
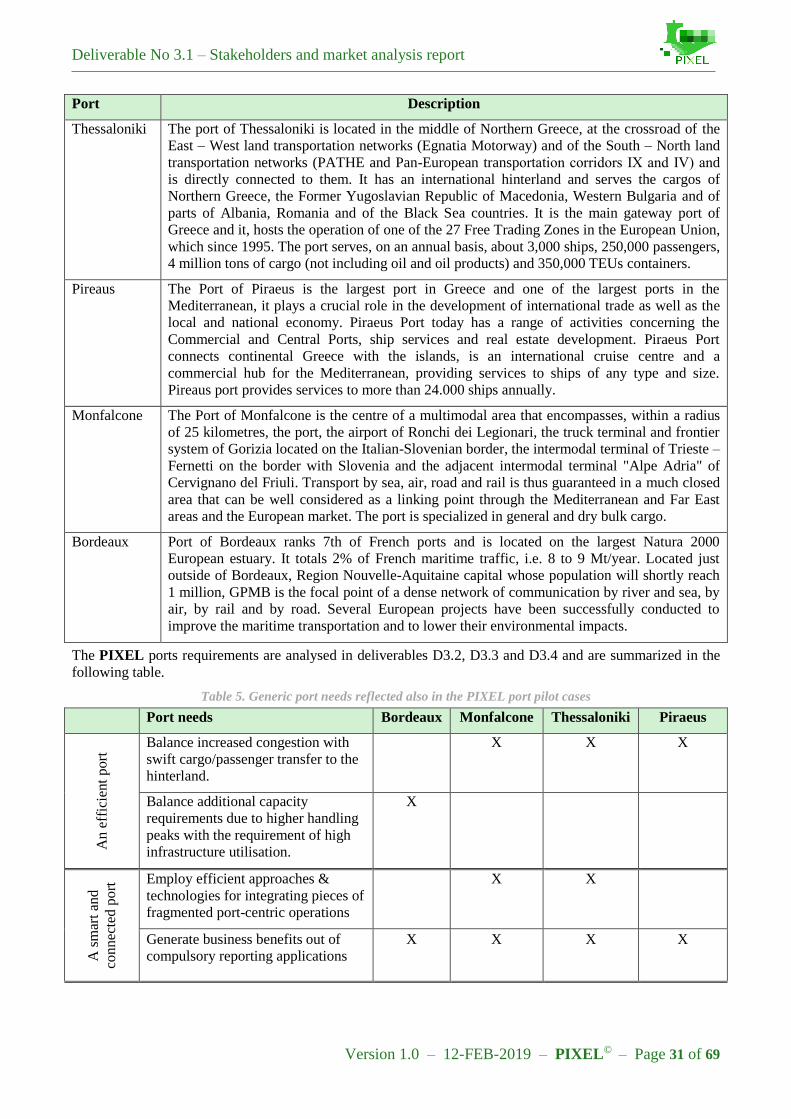
Deliverable No 3.1 – Stakeholders and market analysis report
Version 1.0 – 12-FEB-2019 – PIXEL© – Page 31 of 69
Port Description
Thessaloniki The port of Thessaloniki is located in the middle of Northern Greece, at the crossroad of the
East – West land transportation networks (Egnatia Motorway) and of the South – North land
transportation networks (PATHE and Pan-European transportation corridors ΙΧ and ΙV) and
is directly connected to them. It has an international hinterland and serves the cargos of
Northern Greece, the Former Yugoslavian Republic of Macedonia, Western Bulgaria and of
parts of Albania, Romania and of the Black Sea countries. It is the main gateway port of
Greece and it, hosts the operation of one of the 27 Free Trading Zones in the European Union,
which since 1995. The port serves, on an annual basis, about 3,000 ships, 250,000 passengers,
4 million tons of cargo (not including oil and oil products) and 350,000 TEUs containers.
Pireaus The Port of Piraeus is the largest port in Greece and one of the largest ports in the
Mediterranean, it plays a crucial role in the development of international trade as well as the
local and national economy. Piraeus Port today has a range of activities concerning the
Commercial and Central Ports, ship services and real estate development. Piraeus Port
connects continental Greece with the islands, is an international cruise centre and a
commercial hub for the Mediterranean, providing services to ships of any type and size.
Pireaus port provides services to more than 24.000 ships annually.
Monfalcone The Port of Monfalcone is the centre of a multimodal area that encompasses, within a radius
of 25 kilometres, the port, the airport of Ronchi dei Legionari, the truck terminal and frontier
system of Gorizia located on the Italian-Slovenian border, the intermodal terminal of Trieste –
Fernetti on the border with Slovenia and the adjacent intermodal terminal "Alpe Adria" of
Cervignano del Friuli. Transport by sea, air, road and rail is thus guaranteed in a much closed
area that can be well considered as a linking point through the Mediterranean and Far East
areas and the European market. The port is specialized in general and dry bulk cargo.
Bordeaux Port of Bordeaux ranks 7th of French ports and is located on the largest Natura 2000
European estuary. It totals 2% of French maritime traffic, i.e. 8 to 9 Mt/year. Located just
outside of Bordeaux, Region Nouvelle-Aquitaine capital whose population will shortly reach
1 million, GPMB is the focal point of a dense network of communication by river and sea, by
air, by rail and by road. Several European projects have been successfully conducted to
improve the maritime transportation and to lower their environmental impacts.
The PIXEL ports requirements are analysed in deliverables D3.2, D3.3 and D3.4 and are summarized in the
following table.
Table 5. Generic port needs reflected also in the PIXEL port pilot cases
Port needs Bordeaux Monfalcone Thessaloniki Piraeus
An
eff
icie
nt
port
Balance increased congestion with
swift cargo/passenger transfer to the
hinterland.
X X X
Balance additional capacity
requirements due to higher handling
peaks with the requirement of high
infrastructure utilisation.
X
A s
mar
t an
d
conn
ecte
d p
ort
Employ efficient approaches &
technologies for integrating pieces of
fragmented port-centric operations
X X
Generate business benefits out of
compulsory reporting applications
X X X X
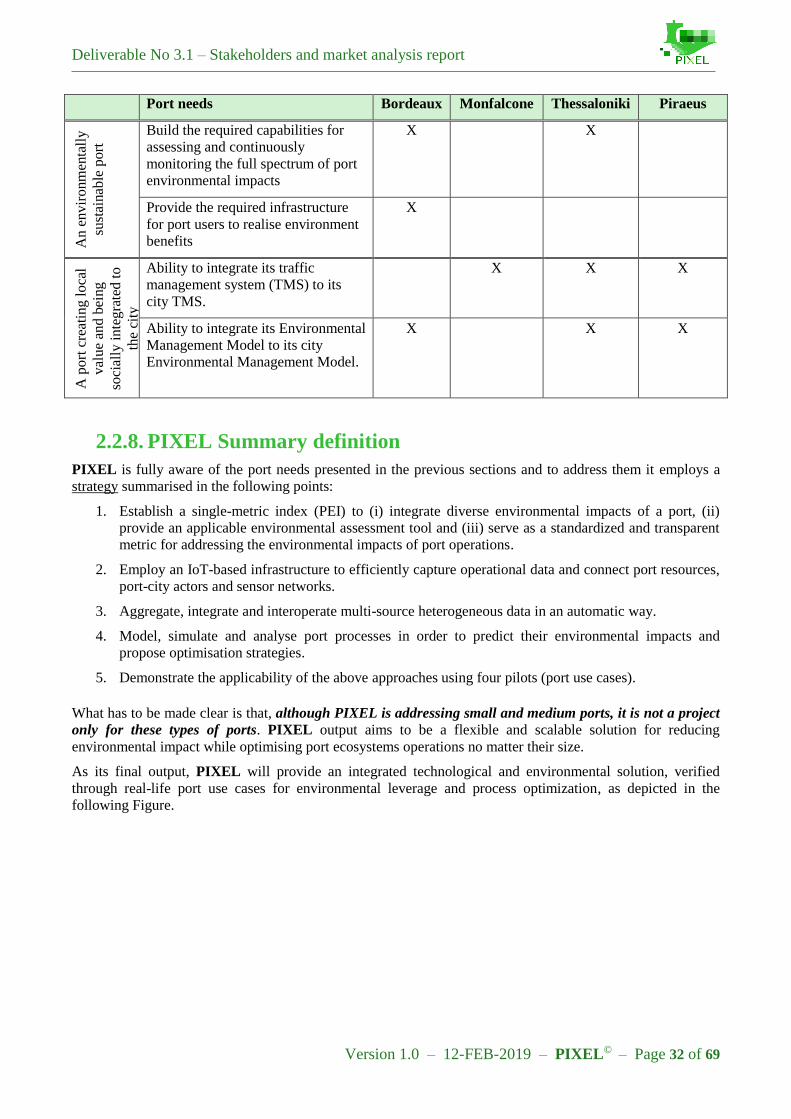
Deliverable No 3.1 – Stakeholders and market analysis report
Version 1.0 – 12-FEB-2019 – PIXEL© – Page 32 of 69
Port needs Bordeaux Monfalcone Thessaloniki Piraeus
An
en
vir
onm
enta
lly
sust
ainab
le p
ort
Build the required capabilities for
assessing and continuously
monitoring the full spectrum of port
environmental impacts
X X
Provide the required infrastructure
for port users to realise environment
benefits
X
A p
ort
cre
atin
g l
oca
l
val
ue
and
bei
ng
soci
ally
in
teg
rate
d t
o
the
city
Ability to integrate its traffic
management system (TMS) to its
city TMS.
X X X
Ability to integrate its Environmental
Management Model to its city
Environmental Management Model.
X X X
2.2.8. PIXEL Summary definition
PIXEL is fully aware of the port needs presented in the previous sections and to address them it employs a
strategy summarised in the following points:
1. Establish a single-metric index (PEI) to (i) integrate diverse environmental impacts of a port, (ii)
provide an applicable environmental assessment tool and (iii) serve as a standardized and transparent
metric for addressing the environmental impacts of port operations.
2. Employ an IoT-based infrastructure to efficiently capture operational data and connect port resources,
port-city actors and sensor networks.
3. Aggregate, integrate and interoperate multi-source heterogeneous data in an automatic way.
4. Model, simulate and analyse port processes in order to predict their environmental impacts and
propose optimisation strategies.
5. Demonstrate the applicability of the above approaches using four pilots (port use cases).
What has to be made clear is that, although PIXEL is addressing small and medium ports, it is not a project
only for these types of ports. PIXEL output aims to be a flexible and scalable solution for reducing
environmental impact while optimising port ecosystems operations no matter their size.
As its final output, PIXEL will provide an integrated technological and environmental solution, verified
through real-life port use cases for environmental leverage and process optimization, as depicted in the
following Figure.

Deliverable No 3.1 – Stakeholders and market analysis report
Version 1.0 – 12-FEB-2019 – PIXEL© – Page 33 of 69
Figure 4. PIXEL as an integrated technological and environmental solution
The PIXEL technological solution, will comprise of:
A universal (widely applicable to European ports) part being the PIXEL Information Hub and
Integrated Dashboard.
A port-specific, to a certain extent, part, being the models, data analysis results and optimisation tools
developed for each one of the project ports.
The PIXEL environmental solution, will consist of:
An environmental metric - the Port Environmental Index (PEI), which integrates the environmental
impacts into a single indicator.
The environmental impact assessment models required as input providers to the PEI.
2.3. Market size and market growth As demonstrated above, the current market that the PIXEL is addressing is the ports market offering an
integrated ICT and IoT solution with advanced capabilities. PIXEL goes beyond the state of the art not only
on translating IoT concept and techniques to the ports’ reality, but incorporating predictive algorithms,
modelling and, finally, a novel approach for a single environmental impact metric.
2.3.1. Number of ports in the EU
The information of this paragraph [3.3.1] has been extracted from (European Commission, 2013). The
highlights of this memo are mentioned:
In the 70,000 km of the coasts of the EU more than 1,200 commercial ports are located. Europe is one
of the regions with the highest port density in the world.
Port activities contribute directly to employment, domestic investment and GDP growth. In the 22
maritime states of the EU, 2,200 port operators currently employ approximately 110,000 port workers.
Deliverable No 3.1 – Stakeholders and market analysis report
Version 1.0 – 12-FEB-2019 – PIXEL© – Page 34 of 69
The European Commission has identified 319 European maritime ports which are essential for the
proper functioning of the internal market and the European economy, of which 83 are part of the main
network.
The efficiency of ports varies considerably in Europe: not all EU ports have the same level of performance
and in recent years there has been a significant gap between the ports that have adapted to the new logistical
and economic requirements and those that have been left behind. Many European ports work very well and
offer high quality services. But a chain is as strong as its weakest link: when some ports do not work well or
suffer a structural decline it affects the functioning of the entire transport network and the economy of Europe.
The differences in performance generate deviations from traffic, longer maritime and land routes and,
finally, more emissions from transport and more congestion to the detriment of citizens and the EU
economy.
They also have negative effects on the commercial opportunities of well-functioning ports, which
can’t promote short sea shipping to regions with low-performing ports.
These differences also undermine the efforts of the EU and its Member States to develop short sea
shipping as a real alternative to land transport between congested areas.
In general, these differences are detrimental to the efficiency and sustainability of the trans-European
transport network and the competitiveness of the European economy as a whole.
2.3.2. Ports logistics market size
The future of the global marine port and service market looks promising. Advances in information and
transportation technology, international trading blocs such as the European Union and the North American
Free Trade Agreement (NAFTA) combined with emerging economies such as China and India are driving the
growth in world trade. Deepened worldwide marketplace integration enables business models based on
international production using global supply chains for distributing manufacturing, sourcing, research, design
and services around the world in order to maximize efficiency and reduce costs in every part of the value
chain. Businesses are increasingly relying on efficient and secure transportation as keys to their success and
the volume of international merchandise trade has grown steadily since 1990, except for the financial crisis in
2008/2009 and a decline in 2015 and 2016. After a quick rebound from the financial crisis, growth levels were
subsequently moderate for a few years followed by a slowdown to a five-year low in 2015 and a further
decrease in 2016.
China was the largest region for merchandise trade in 2016 and accounted for $2.216 trillion of exports (and
$1.74 trillion of imports, European Union was the second largest region, accounting for $1.929 trillion of
exports and $1.895 trillion of imports and USA was in third place, accounting for $1.553 trillion for exports
and $2.361 for imports. The total output of the world was $15.82 trillion for exports and $16.02 trillion for
imports (Central Intelligence Agency, 2019). China, the US, Germany and Japan are top countries worldwide
for merchandise trade, accounting for around 12 percent, 12 percent, 8 percent and 4 percent respectively of
the total import and export value during the year. Developed regions and countries including the EU, the US
and Japan have recorded declining shares in world exports and imports in the past decades. Asian economies
such as the Philippines, Hong Kong and China have in turn increased their participation in the global economy
and play a growing role in international production chains
The major drivers of growth for this market are high growth of the marine transportation industry, surging
demand of containerized and bulk cargo, rising customer demand and expansion of new regional trade hubs.
Emerging trends, which have a direct impact on the dynamics of the marine port and service industry, include
the vessel traffic services, self-unloading bulk carrier technology and marine port privatization.
APAC is expected to remain the largest region due to rising customer demand and expansion of new regional
trade hubs in operation have driven the demand for marine port and service in the APAC region.

Deliverable No 3.1 – Stakeholders and market analysis report
Version 1.0 – 12-FEB-2019 – PIXEL© – Page 35 of 69
2.3.1. Passenger transport market size
Maritime passenger transport is an important form of passenger transport, both for business and pleasure. It is
possible to distinguish two types of data: cruise and non-cruise maritime passengers (ferries).
The features of maritime passenger transport at European level allow us to distinguish two regions:
Mediterranean and Northern Europe.
The following picture shows the ports of the Mediterranean region:
Figure 5. Ports of the Mediterranean region (MedCruise, 2019)
Cruise activities have been growing every year for the last two decades, recording an admirable growth since
then. The global growth rate of the cruise industry has remained stable, despite of economic cycles and
uncertain political climates.
Cruise industry continued to strengthen in 2017 again. The number of single passengers that took a cruise
vacation within year 2017 has risen up to 25.2 million, which means a 4.1% increase compared to the previous
year.
According to the Cruise Industry News Annual Report, a fleet of 329 cruise vessels was deployed worldwide
in 2017, having a passenger capacity of 525 million berths and a fleet of more than 340 cruise vessels is
expected to be deployed in 2018, with a passenger capacity of more than 550,000 berths. The major fleet
renewal has been a core foundation of the continuous growth of this industry. The order book suggests that
this year will be another busy year for cruise ship industry, with ship sizes ranging from 300-passenger vessels
to 4.500-passengers. The number of vessels is expected to continue growing.
Spain is the second European power in number of cruise passengers and several Spanish ports lead the
European rankings and are even among the top 50 ports in the world.
2.3.2. Global port market perspective
Ports and terminal operations market in EMEA: “The ports and terminal operations market in EMEA
is expected to grow at a slow rate during the forecast period because of factors such as Britain exit
referendum from the European Union in 2016, slow economic growth in the African countries, and
low consumer demand in the region”. (Technavio, 2017)
Germany, Netherlands, and the Middle East are the largest revenue generators in EMEA, as they have
several manufacturing industries such as automobiles, food and beverage, and electronic goods. The
expansion of Suez Canal in Egypt has raised the accommodating capacity of the canal. Also, the UAE
and Saudi Arabia are among the major countries which are focusing on technology and automation for
improving port operations.

Deliverable No 3.1 – Stakeholders and market analysis report
Version 1.0 – 12-FEB-2019 – PIXEL© – Page 36 of 69
Ports and terminals operations market in APAC: “APAC occupied nearly 42% of the ports and
terminal operations market in 2016 and is expected to grow substantially due to factors such as a
large number of busiest ports in the region and the presence of technologically advanced countries
and developing economies” (Technavio, 2017).
China, Korea, Singapore, Japan and India are the leading countries in the region for revenue
generation and in terms of the volume of containerized goods handled by these countries’ ports. The
increase in participation of the private sector and good governance are the key drivers for the ports
and terminal operations market in APAC.
Ports and terminal operations market in the Americas: “The ports and terminal operations market in
the Americas is expected to witness a strong growth during the forecast period because of the
increased demand for containerized goods and the increase in international trade”. (Technavio,
2017)
The expansion of the Panama Canal to accommodate large size ship will increase the movement of
Post-Panamax ships. The increase in the volume of goods will also drive ports and terminal operations
in the Americas. Additionally, the strong growth in the economic structure, and the commercial,
healthcare, and manufacturing industries have benefited the growth of this market.
To expand the market and meet in this new stage the challenges of these advances / innovations to port need
to be smart. PIXEL, being an integrated technological and environmental solution, will be addressing the
need of ports to reduce the ports environmental impact while optimising port ecosystems operations. It will
employ efficient approaches & technologies for integrating pieces of fragmented port-centric operations and
will generate business benefits out of compulsory reporting applications thus fulfilling the main requirements
for ports to become smart.
According to (de Langen, et al., 2018) ICT / digital infrastructure is the second investment priority for
European ports, followed by Infrastructure for reducing environment footprint and Energy-related
infrastructure. The first priority is Road transport connection suggesting a need for increased trade and
reduced emissions (e.g. due to reduced congestion) or local pollution (through removing traffic from urban
areas).
The main driver for the investment needs of the ports is the expected growth of trade flows and the third most
important driver is the pollution mitigation. In several use-cases, PIXEL is addressing partially the pollution
mitigation. Through the PEI, PIXEL can contribute to the ports providing a tool for decisions making about
more pollutant activities. This may lead our solution to have a clear direct impact on the market.
The estimate of the size of the investment pipeline of all EU-27 seaports excluding the British ones is at
around €48 billion [or around €5 billion per year during the period 2018 – 2027] of which a total average
between €15million and €30million per port is expected to be routed to ICT / digital infrastructure (de
Langen, et al., 2018).
2.4. Segments addressed in PIXEL
2.4.1. Port development through ICT
Due to the drivers mentioned in the previous paragraphs, ports have been at the forefront of adopting
sophisticated ICT solutions to optimize logistics. In the recent years, fast evolving, rapid advances in social,
mobile, analytics and cloud technologies take computing to the next level (hyper connected systems).
Deloitte (Deloitte, 2015) have selected nine drivers & trends that will shape the future of global ports and
shipping:
1. Globalization, demographic, growth and scarcity of natural resources.
2. Energy transition and bio based economy.
3. Digitalization of logistics: Technology will radically change the way logistics are organized.
a. Logistics are becoming more complex, therefore an increasing need to digitalize the
information streams.
Deliverable No 3.1 – Stakeholders and market analysis report
Version 1.0 – 12-FEB-2019 – PIXEL© – Page 37 of 69
b. Digitalization will allow for optimization of current existing infrastructure, reducing the need
to invest in additional infrastructure.
c. Possibility to eliminate unnecessary (empty) transport.
d. Data analytics and data exchange becoming a new comparative advantage for ports.
e. Self-steering ships will become the standard.
f. The usage of sensors will replace the need for towing.
g. The usage of drones for inspection will increase efficiency.
4. Additive manufacturing (3D printing) – trend with negative impact as it is already enabling some
manufacturers to 'next-shore' and remove the need for shipping at all (Deloitte, 2015).
5. Security: The ability of hackers to remotely control port operations is the new “hole in the fence” of
port security.
a. The use of various control systems and increasing automation in general in the port will
reduce the risk of human errors and automation increases reliability of the system; limiting the
number of delays.
b. Cybersecurity and cyber-resilience are becoming more important as a parallel development to
automation.
c. Be prepared to deal with existing and emerging cyber threats from criminals, terrorists and
enemy nation states that could shut down large pieces of the country’s critical maritime
transportation system.
d. Drug dealers shut down IT security more easily.
e. It is necessary to build a risk-aware culture.
6. Knowledge intensive labor market
7. Further integration of supply chains
8. Increasing scale of transport
9. Sustainability
A central objective of PIXEL is to improve the energy efficiency of the ports, promote the use of clean
energies, improve logistics processes, increase the environmental awareness of all the stakeholders involved
and, in general, contribute to reduce the carbon footprint and the environmental impact of the ports and port-
related activities. Furthermore, PIXEL will provide a reduction on the impact due to climate change and the
environment of port activities, their operational and infrastructural costs, improvement of logistics efficiency
and better integration of the port in the surrounding socio-economic area, including city-port relations and the
smart urban development of Port Cities. Realisation of these activities and achieving this impact also will
entail attention to environmental and climate-related concerns. The overall efficiency is expected to be
increased in the ports where PIXEL work as operational data hub. Service and data interoperability and
exchange among stakeholders will enable the adoption of new procedures and processes, which will clearly
impact on the whole logistics efficiency. For example, the awareness that a vessel is close to berth can activate
preparation activities from each stakeholder (document preparation, port service readiness, truck scheduling,
final delivery estimations, etc.).
PIXEL, taking into account that in a near future there will be trillion devices interconnected with
several/different requirements depending on capacity and power sensors with low functionalities and other
with autonomous operation, the outcomes of the project could serve, in the Port of the Future, in order to
make new services and applications. This will lead to the improvement of the procedures and reduction of
CAPEX and OPEX and with special focus on the mitigation of the environmental impact.
PIXEL via the development of the Information Hub will provide more flexible operations and create
decision-making tools that will be supported by an engine to simulate future generated data, leveraging the
models and algorithms that will be proposed. The tools will apply proper data analytics techniques (machine
Deliverable No 3.1 – Stakeholders and market analysis report
Version 1.0 – 12-FEB-2019 – PIXEL© – Page 38 of 69
learning, complex event processing, anomaly detection, regression analysis, etc.), that will deal with huge
amount of data sources and information volume.
2.4.2. Classification of ports in terms of ICT
The port concept and the role of the Port Authorities (PA) have a direct impact in the way ports are using ICT
technologies today and in the arrangements required in this subject for the future. The United Nations
Conference on Trade and Development (United Nations Conference on Trade and Development - Secretariat,
1992) identified four different generations of ports according to the modernization, specialization and
handling capacity levels (United Nations Conference on Trade and Development - Secretariat, 1999). We will
follow this taxonomy and will categorize the Ports of PIXEL according to this analysis, taking into account
their current operations and on how these ports can evolve after the PIXEL Solution is applied to their
operations.
First generation ports: The characteristics of the ports that fall under this category include:
Facilities, and overall strategy that are concentrated in offering basic port services.
Services to vessels such as sheltered waters, nautical services and cargo handling services through
generic port terminals and generic handling means.
Second generation ports: The characteristics of the ports that fall under this category include:
Specialisation in operations is of growing relevance,
Strategies oriented to the specialisation of terminals (containers, roll-on/roll-off cargo, liquid bulk,
solid bulk)
Use of optimized mechanical equipment for each operation, seeking also improvements in their
management capacities within the port boundary.
Third generation ports: The characteristics of the ports that fall under this category are:
They are enlarging their service scope to transform into effective logistics platforms for trade beyond
the port boundary.
Their strategy and premises are oriented also to serve the logistics chain, creating ancillary services
for logistics activity zones, using integrated systems for data collection, processing and facilitating the
operations among different transport modes.
Fourth‐generation ports: Go beyond the third‐generation considering other new aspects in logistics
management. The characteristics of the ports that fall under this category are characterized:
By diversification and internationalization of their activities,
Automation of activities, strong cooperation between the port community and complementary ports in
view to increase its competitive advantages and transform into a networked port, perfectly integrated
in the logistics chain and in global supply chains where the handling and distribution of information is
a cornerstone..
It must be stated, that (Lee & Lam, 2016), proposed a fifth generation Port, with the introduction of “port
ladder” for customer centric community-focused port. Furthermore, (Kaliszewski, 2018), taking into account
the container vessel growth predictions, proposed by (Notteboom & Rodrigue, 2008) introduced a next port
generation concept, called Sixth Generation Port.
There are many different parameters in order to classify a port in one of the above categories. At a first glance,
the majority of small and medium ports in Europe seem to be second generation ports: although PCS is a first
and important step for a port to be classified as a third generation port, other parameters have to be evaluated
as well.
The PIXEL solution will facilitate the ports within the category they already operate. Furthermore, since one
objective of the PIXEL project is to provide an integrated system for data collection and facilitation of the

Deliverable No 3.1 – Stakeholders and market analysis report
Version 1.0 – 12-FEB-2019 – PIXEL© – Page 39 of 69
operations among different transport modes, PIXEL will assist ports trying to be classified as third generation
ports to strengthen their position.
2.4.3. ICT innovations in ports and logistics
The global trade slowdown has led to a need for investment in information and communications technology
(ICT) by ports and logistics companies. Among the innovations undertaken, the following five stand out since
they include aspects of commercial and logistical processes (DP World / The Economist Intelligence Unit,
2015):
Figure 6. Five key ICT Innovations for ports and logistics firms
1. Robotics and automation. Automation is a fact and is more present since 1990 when the first
automatic stacker cranes were installed in the European Container Terminals in Rotterdam. This
automation involves the use of robots some of which can operate completely autonomously. The
software used allows us to control and optimize the flow of goods through the port (Beresford &
Pettit, 2017).
2. Autonomous vehicles. Their main use in ports is to move containers. However, the development in the
area of autonomous vehicles will affect ports and logistics firms more broadly with the following
developments (DP World / The Economist Intelligence Unit, 2015):
a. Driverless trucks and cars that are already under development.
b. Drone planes.
c. Drone (or “ghost”) ships - these appear to be the most distant of the three types of
autonomous vehicles.
3. IoT and Big Data (The Internet of Things and big data analytics). The increase of robots and
automation processes also increases the amount of data available for processing. Furthermore, the
development of cheap sensors monitoring the activities of the machinery or the state of cargo
increases even more the amount of data. Thus cargo and equipment are becoming increasingly
connected as part of the wider development of the Internet of Things (IoT). The IoT refers to the
growing range of physical objects, or "things" that are connected to a network and that can send and
receive data (DP World / The Economist Intelligence Unit, 2015).
Robotics and automation
Autonomous vehicles
IoT and big data
Simulation and Virtual
Reality
Advanced cybersecurity
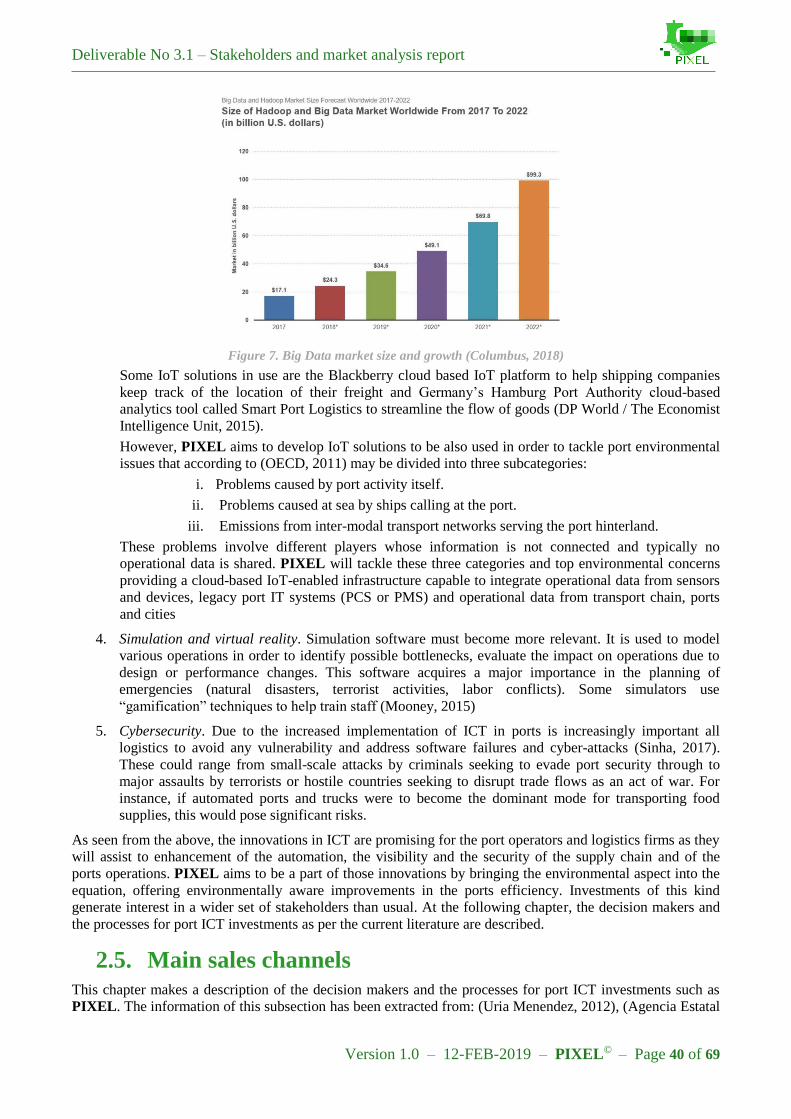
Deliverable No 3.1 – Stakeholders and market analysis report
Version 1.0 – 12-FEB-2019 – PIXEL© – Page 40 of 69
Figure 7. Big Data market size and growth (Columbus, 2018)
Some IoT solutions in use are the Blackberry cloud based IoT platform to help shipping companies
keep track of the location of their freight and Germany’s Hamburg Port Authority cloud-based
analytics tool called Smart Port Logistics to streamline the flow of goods (DP World / The Economist
Intelligence Unit, 2015).
However, PIXEL aims to develop IoT solutions to be also used in order to tackle port environmental
issues that according to (OECD, 2011) may be divided into three subcategories:
i. Problems caused by port activity itself.
ii. Problems caused at sea by ships calling at the port.
iii. Emissions from inter-modal transport networks serving the port hinterland.
These problems involve different players whose information is not connected and typically no
operational data is shared. PIXEL will tackle these three categories and top environmental concerns
providing a cloud-based IoT-enabled infrastructure capable to integrate operational data from sensors
and devices, legacy port IT systems (PCS or PMS) and operational data from transport chain, ports
and cities
4. Simulation and virtual reality. Simulation software must become more relevant. It is used to model
various operations in order to identify possible bottlenecks, evaluate the impact on operations due to
design or performance changes. This software acquires a major importance in the planning of
emergencies (natural disasters, terrorist activities, labor conflicts). Some simulators use
“gamification” techniques to help train staff (Mooney, 2015)
5. Cybersecurity. Due to the increased implementation of ICT in ports is increasingly important all
logistics to avoid any vulnerability and address software failures and cyber-attacks (Sinha, 2017).
These could range from small-scale attacks by criminals seeking to evade port security through to
major assaults by terrorists or hostile countries seeking to disrupt trade flows as an act of war. For
instance, if automated ports and trucks were to become the dominant mode for transporting food
supplies, this would pose significant risks.
As seen from the above, the innovations in ICT are promising for the port operators and logistics firms as they
will assist to enhancement of the automation, the visibility and the security of the supply chain and of the
ports operations. PIXEL aims to be a part of those innovations by bringing the environmental aspect into the
equation, offering environmentally aware improvements in the ports efficiency. Investments of this kind
generate interest in a wider set of stakeholders than usual. At the following chapter, the decision makers and
the processes for port ICT investments as per the current literature are described.
2.5. Main sales channels This chapter makes a description of the decision makers and the processes for port ICT investments such as
PIXEL. The information of this subsection has been extracted from: (Uria Menendez, 2012), (Agencia Estatal
Deliverable No 3.1 – Stakeholders and market analysis report
Version 1.0 – 12-FEB-2019 – PIXEL© – Page 41 of 69
Boletín Oficial del Estado, 2017) and (Puertos del Estado, 2004). The main sales channels within the port
sector are the following:
Direct awarding
Direct awarding is one of the sales channels that occurs in the following cases:
1. Public sector entity for the deployment of its competences.
2. Contest declared deserted.
3. Linear concessions for public use.
Public Tender
The public tender is given in the following cases:
1. General-purpose port services.
2. Terminals for private use (concurrence of applications).
When the PA decides the convocation of a public tender this is normally processed as follows:
o The Board of Directors of the PA will approve the Bidding Terms and Conditions. The List of
Bases will contain, at least the detail about the object and participation requirements, criteria
for its awarding (and among them, commitments of an environmental nature and corporate
social responsibility) and the obligation to provide the provisional guarantee.
o The call for the context must be published in the Official State Gazette and when the value of
the works is equal to or greater than €5,000,000, also in the Official Gazette of the EU. The
deadline for submitting bids may not be less than 30 days.
o The Board of Directors of the PA will decide the contest.
For ICT/digital infrastructure for efficient port and hinterland operations investment, the decision is usually –
but not mandatorily - made in general by the port managing body (de Langen, et al., 2018).
Deliverable No 3.1 – Stakeholders and market analysis report
Version 1.0 – 12-FEB-2019 – PIXEL© – Page 42 of 69
3. Competition
3.1. Barriers to entry Barriers to entry are referring to the barriers to digital innovation from start to implementation, as well as
assessing the impact of facilitators of ICT innovation.
Among the factors that act as a barrier are the following:
The port sector should be more open to disclose cost and benefit information and should conduct more
such analysis.
Too many divergent interests among the stakeholders entail that digital innovation challenges the
ability to cooperate.
Lack of collaboration by other actors.
Entry costs to change infrastructures.
There are conditions that improve the degree of success and the terminal alignment with the right ICT
infrastructure is key to that.
It should be noted that the regulation was not identified as a barrier or as a facilitator.
This information has been extracted from (Carlan, et al., 2017)
More analytically, barriers to entry the market and hindering the achievement of these impacts do exist, and
include the following:
Technological barriers: Information technologies develop rapidly, and it is difficult to foresee their
evolution, which may influence technical design decisions. Acting proactively so as to stay ahead of
the state of the art and deliver a solution that will not sooner than later become obsolete, PIXEL will
be engaged in a continual technology watch effort by monitoring current research in similar projects
and safeguard that the development process will comply with all related standards, will be designed to
be flexible and that new SCP requirements that may arise will be properly and timely gathered and
processed. With regards to interoperability, PIXEL will process a large diverse number of different
data sources, and data models/forms to integrate and make them interoperable with metadata and
mapping standards.
Regulatory barriers: Varying EU states regulations and legal frameworks, with special focus on data
protection legislations, may cause setbacks in a pan-European adoption of the PIXEL approach.
Maritime transport is an inherently global industry. As such, many EU rules (particularly with regards
to safety and the environment) build on standards established by the IMO and the ILO, both specialist
agencies of the UN. IMO Conventions establish and maintain common standards for safety and
security, mainly for international ships. This is done within the framework of United Nations
Convention on the Law of the Sea (or “UNCLOS”), which governs the rights and responsibilities of
flag and coastal States.
In some cases, EU rules are more stringent than their associated international requirements. This
includes instances where provisions are brought into force earlier than is required under international
law, or where requirements relating to international shipping are extended to cover vessels operating
on domestic voyages as well.
The rules of the Internal Market in relation to shipping are outlined in two significant pieces of EU
legislation:
o Regulation 4055/86, which guarantees the rights of Member State nationals to carry
passengers or goods by sea between the port of a Member State and the port of offshore
installation of another Member State (or a non-EU country).
o Regulation 3577/92, which guarantees the rights of EU shipping companies to provide
maritime cabotage services. These are voyages carried out by ships of one state between two

Deliverable No 3.1 – Stakeholders and market analysis report
Version 1.0 – 12-FEB-2019 – PIXEL© – Page 43 of 69
ports (or between an installation and a port), within the territory of another. Shipping
companies based in countries outside the EU, but controlled by EU nationals, may also offer
such services.
These pieces of legislation are complemented by other EU rules which seek to reduce technical
barriers and encourage EU market integration, including rules governing market access for marine
equipment, and the harmonizing of requirements relating to maritime professional qualifications.
The Regulations, Policies and Recommendations will be thoroughly presented in the Deliverable No.
3.4 and they will cover all the relevant port activities (e.g. vessel traffic monitoring, air emissions,
alternative fuels, transport regulations, etc. as well as national regulatory context).
Governmental regulations of data privacy and location present the concern of significant legal and
financial consequences. PIXEL aims to fully comply with all European policies relating to Data
protection, so as to deliver guidelines and suggestions to these organizations, and even though
modifications to the existing regulations and guidelines may signify modifications to the framework's
design and implementation, PIXEL will respect them and incorporate them so that they are fully
addressed. Furthermore, the barriers will be dealt and further analysed in the “Regulation, Policies and
Recommendations” task of WP3 and in the Ethical Monitoring work package and the associated
Deliverable No. 3.4 (Use cases and scenarios manual v2).
Business barriers: Perhaps the most significant barrier is the business barrier posed by the actual
adoption of the PIXEL solution and its value-added services from the European T&L industry. All
related stakeholders in the value chain of PIXEL may be reluctant in adopting the proposed offering.
In order to overcome this barrier, the consortium will organize the PIXEL demonstrators in Use
Cases, showcasing the applicability, the high level of performance and the quality of service of the
proposed solution in different settings and usage scenarios.
Financial barriers: IT integration is costly and may therefore become a barrier to PIXEL solution.
PIXEL technical approach is based on service orientation and on the publish-subscribe paradigm,
resulting in significantly lower costs to integrating existing logistics systems and data, compared to in-
house system development and point-to-point system integration.
Usefulness of planning solution barriers: Many planners do not trust and therefore do not use the
outputs of their planning tools. The main reason for that is that many tools are based on simplistic
algorithms and use planning data of insufficient quality (i.e. outdated or inaccurate) (EY, 2014).
PIXEL improves the quality of planning data by real time connections to the data sources, thereby
improving the quality of the produced plans.
Information sharing barriers: Address institutional barriers arising from preference and vision
conflicts regarding data sharing, cooperation between public and private companies, and conflicts of
multiple interest groups, low trust and cooperation levels and regulatory overburden. These barriers
will be carefully examined at the start of the project and mitigation activities will be planned to
prevent any negative impact to the project.
Cultural barriers to adoption and the 'not invented here' syndrome: The PIXEL solution does
not advocate that the planners should abandon their existing planning systems and adopt new planning
methods and approaches. It amplifies the capability of existing planning tools and thus preserves
existing ICT investments and improves their ROI.
3.2. Main competitors in the selected segments Though the solution providers in the following sections may operate competitively towards the PIXEL
solution, PIXEL aims to integrate them within its value proposition (for example the IoT in Logistics and
PCS solutions will be extended by PIXEL in order to enhance the overall port performance especially in the
energy, port operations and port strategies fields).
3.2.1. Port development through ICT
A key element in the application of ICTs in ports is the interconnection of different actors of the supply chain
that makes possible a better information flow (Navarro, et al., 2011).

Deliverable No 3.1 – Stakeholders and market analysis report
Version 1.0 – 12-FEB-2019 – PIXEL© – Page 44 of 69
Reviewing the ICT market and its actors in the port industry is a challenging task for several reasons:
There are few major players at the international level that develop dedicated solutions for ports.
Mainly due to the complex structure and organization of port use cases as described previously.
ICT Systems have evolved considerably in recent years with the evolution of communication
protocols, the explosion of Internet of Things, or the willingness of the ports to adopt innovation
approaches and promote new initiatives. ICT Systems often include a large number of technological
bricks developed by local actors aware of the local context and specificities (countrywide). These
local particularities make it difficult for the global players to access the market.
Nevertheless, the boom in international trade and transport has brought greater use of ICT in ports. The major
trends that have a bearing on the use of ICTs in trade are:
Production and Trade
Logistics and Supply chain developments.
Multimodal and door –to-door transport
Expanded industry portals and e-commerce
These trends increase the role of ICT in the ports. This has brought a series of concepts / tools that are broadly
defined in the following subsections.
3.2.1.1. PCS (Port Community Systems)
PCS are platforms that connect systems operated by a variety of organizations that constitute a port
community. They are open and neutral systems that facilitate the exchange of documentation in a safe and
intelligent manner between private operators and public entities with the aim of improving the competitive
position of a port.
Among the services that a PCS system can offer, we can find the following:
Port Calls Management
Dangerous Goods Management
Loading and Discharge Orders
Road Transport Management
Rail Transport Management
Cargo Tracking
Goods Declaration
Customs Information
Equipment Status
Departures and Arrivals / Schedule
Bookings
Shipping Instructions
PIXEL will extend the services offered by PCS mainly by introducing also environmental management, i.e. a
Port Environmental Index, Energy Predictive algorithms and interoperability between city and port
environmental models and algorithms. Furthermore, PIXEL will also improve PCS systems by processing the
data directly and not documents. It will deal with the environment in a centralized way and it will integrate
with operational data and not only with logistical documents.
Next we are going to name some PCS of some of the most important European ports:
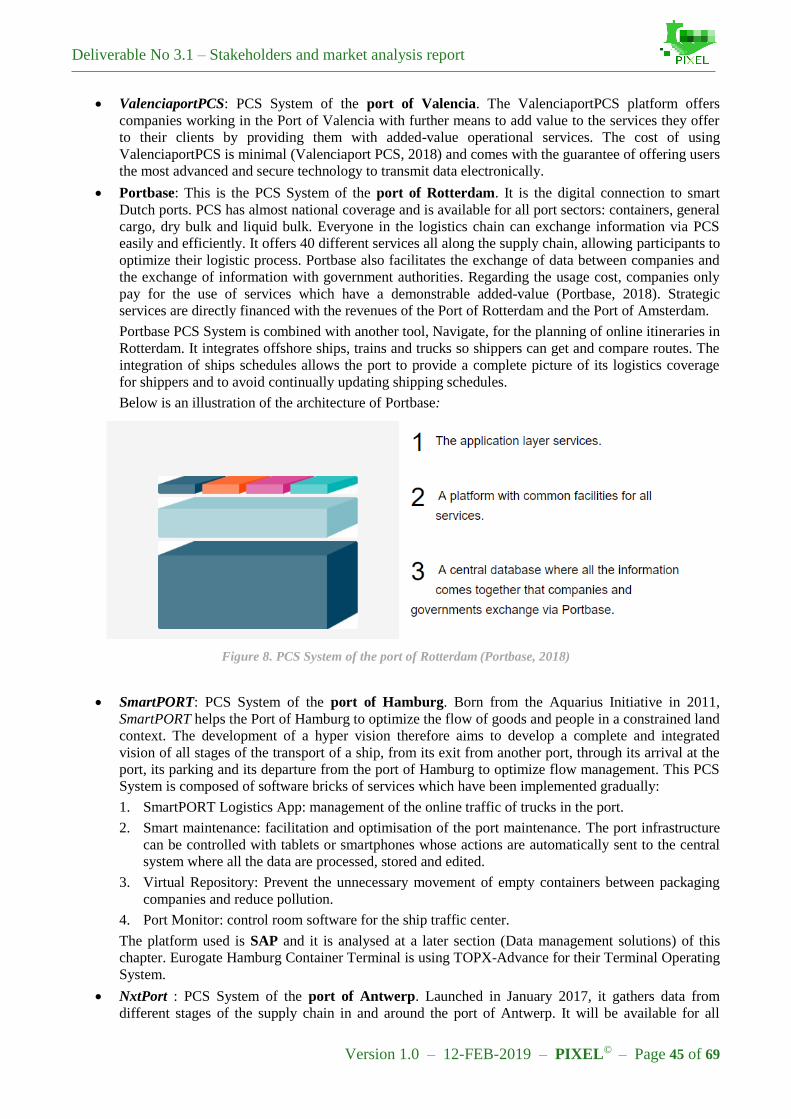
Deliverable No 3.1 – Stakeholders and market analysis report
Version 1.0 – 12-FEB-2019 – PIXEL© – Page 45 of 69
ValenciaportPCS: PCS System of the port of Valencia. The ValenciaportPCS platform offers
companies working in the Port of Valencia with further means to add value to the services they offer
to their clients by providing them with added-value operational services. The cost of using
ValenciaportPCS is minimal (Valenciaport PCS, 2018) and comes with the guarantee of offering users
the most advanced and secure technology to transmit data electronically.
Portbase: This is the PCS System of the port of Rotterdam. It is the digital connection to smart
Dutch ports. PCS has almost national coverage and is available for all port sectors: containers, general
cargo, dry bulk and liquid bulk. Everyone in the logistics chain can exchange information via PCS
easily and efficiently. It offers 40 different services all along the supply chain, allowing participants to
optimize their logistic process. Portbase also facilitates the exchange of data between companies and
the exchange of information with government authorities. Regarding the usage cost, companies only
pay for the use of services which have a demonstrable added-value (Portbase, 2018). Strategic
services are directly financed with the revenues of the Port of Rotterdam and the Port of Amsterdam.
Portbase PCS System is combined with another tool, Navigate, for the planning of online itineraries in
Rotterdam. It integrates offshore ships, trains and trucks so shippers can get and compare routes. The
integration of ships schedules allows the port to provide a complete picture of its logistics coverage
for shippers and to avoid continually updating shipping schedules.
Below is an illustration of the architecture of Portbase:
Figure 8. PCS System of the port of Rotterdam (Portbase, 2018)
SmartPORT: PCS System of the port of Hamburg. Born from the Aquarius Initiative in 2011,
SmartPORT helps the Port of Hamburg to optimize the flow of goods and people in a constrained land
context. The development of a hyper vision therefore aims to develop a complete and integrated
vision of all stages of the transport of a ship, from its exit from another port, through its arrival at the
port, its parking and its departure from the port of Hamburg to optimize flow management. This PCS
System is composed of software bricks of services which have been implemented gradually:
1. SmartPORT Logistics App: management of the online traffic of trucks in the port.
2. Smart maintenance: facilitation and optimisation of the port maintenance. The port infrastructure
can be controlled with tablets or smartphones whose actions are automatically sent to the central
system where all the data are processed, stored and edited.
3. Virtual Repository: Prevent the unnecessary movement of empty containers between packaging
companies and reduce pollution.
4. Port Monitor: control room software for the ship traffic center.
The platform used is SAP and it is analysed at a later section (Data management solutions) of this
chapter. Eurogate Hamburg Container Terminal is using TOPX-Advance for their Terminal Operating
System.
NxtPort : PCS System of the port of Antwerp. Launched in January 2017, it gathers data from
different stages of the supply chain in and around the port of Antwerp. It will be available for all
Deliverable No 3.1 – Stakeholders and market analysis report
Version 1.0 – 12-FEB-2019 – PIXEL© – Page 46 of 69
actors in the supply chain: ship-owners, shippers, terminals, shippers, depots, customs, etc. These can
provide data of their own volition and develop by themselves new applications. NxtPort also is open
and allows software developers to develop new business models.
In 2017, it was announced that “Belgium’s Antwerp Port Authority and the Federal Participation &
Investment Company (FPIM) are set to jointly purchase a stake in NxtPort for €5.25m.” (Ship
technology, 2017).
3.2.1.2. AGS (Automatic Gate System)
System that uses technologies such as image recognition, to automatically identify vehicle license plates, ISO
containers automated to facilitate the interaction of the controller with the control system of the doors. In this
way, the access to the port or to the terminal can be determined very quickly. This System is known also as
GOS (Gate Operating System). An example of AGS is the RFID based system (Choi, et al., 2006) that is
being implemented in port logistics system for next generation in Korea
3.2.1.3. SW (Single Window)
Single Windows systems are used for the electronic handling of documents required by the organization itself,
and by other official bodies as captain of the port or Customs. The ports connect to these systems to meet all
regulatory requirements due to the complexity of border automation and the information management, which
may involve multiple regulatory agencies cross-border. The objective of these systems is to ensure the safe
movement of goods and means of transport across borders. The single window and systems of electronic
returns are becoming mandatory to comply with the regulations and as tools to facilitate trade and transport.
SW examples at European level started with Directive 2002/59/EC. Initially it was in charge of protecting the
seas, improving safety and monitoring ship traffic. More information is available at (Beškovnik, 2015).
3.2.1.4. ITS (Intelligent Transport System)
Set of advanced applications that aim to provide innovative services with respect to different modes of
transport and traffic management. ITS Systems allow users to be better informed so that they can make safer,
more coordinated and smarter use of transport networks. These systems apply a variety of very broad
technologies, such as systems vehicle navigation, traffic signals, variable message signals, systems of
container management, automatic plate recognition, speed cameras, parking guide, information systems, etc.
3.2.1.5. PMS (Port Management System)
A PMS aims to bring together the different existing systems within a port authority as if it were a single
platform. Its task is to coordinate the different departments of the port authority. Having everything
centralized allows a more efficient management of port operations being more efficient the work of higher
quality decisions in less time.
The difference between PCS and PMS is that the PCS is responsible for the exchange of services and
information with the port community, while the PMS is the system that takes care of all the management and
invoicing within the port.
3.2.1.6. TOS (Terminal Operating System)
This is a system dedicated to the management of terminals. The central system includes modules to plan and
control the arrival of ships, control of cargo handling, operations and access control, optimized operations and
management of auxiliary devices. Its software can be used for record keeping and for managing the marine
terminals. Terminal Operating Systems are the most important subset of a Port Community System, or they
can be used stand-alone. It is used by all the actors in a marine terminal, e.g. managers, liners, visitors,
regulators, liners etc.
“Terminal Operating Systems often utilize other technologies such as internet, EDI processing, mobile
computers / mobile devices, wireless LANs, Radio-frequency identification (RFID) and DGPS to efficiently
monitor the flow of products in, out and around the terminal.
Deliverable No 3.1 – Stakeholders and market analysis report
Version 1.0 – 12-FEB-2019 – PIXEL© – Page 47 of 69
Data is either batch synchronization with, or a real-time wireless transmission to a central database. The
database can then provide useful reports about the status of goods, its locations, as well as the CHE container
handling equipment in the terminal.” (RBS - EMEA, 2018)
The most prominent companies providing Terminal Operating Systems solutions in the market and their
respective products are presented below. However, most of them are only offering terminal management
software which they connect to hardware exchanging information by utilizing industry standard formats
(EDIFACT, ANSI X12, csv, etc.).
1. Navis (https://www.navis.com/)
Navis is the leading provider of TOS. It is a part of Cargotec Corporation (Finnish company that
makes cargo-handling machinery for ships, ports, terminals and local distribution).
Product: NAVIS N4
“With more than 340 customers in over 80 countries, Navis is the global standard for terminal
operating systems (TOS). N4 has been implemented at more sites than any other TOS provider,
and no other TOS can match Navis' unique capability to optimize the planning and management
of container and equipment moves at a terminal.” (Navis, 2019)
The obvious advantage of the product is its large customer base: it is the industry standard.
Kalmar (https://www.kalmarglobal.com), also part of Cargotec has teamed up with Navis
providing OneTerminal, the industry's first integrated offering for automated terminals (i.e.
providers of both software and hardware).
2. RBS (http://rbs-tops.com/)
Realtime Business Solutions (RBS) is an Australia-based solution provider founded in 1991. It is
specialized in the container handling industry. They have created the first cloud TOS solution and
their TOS can be used with zero license investment and a pay-per-use (TEU) model. Their
solution has been implemented in around 30 terminals around the world (RBS EMEA, 2019).
Besides TOS, it offers a terminal operations simulation software that the operators are using in
order to fine tune their operations and feed the TOS parameters. In that sense (and taking into
account the Energy Predictive Algorithms of PIXEL) it can be accounted also as a competitor to
PIXEL. RBS is able to cooperate with ISL (company also offering TOS Simulator which is
mentioned below).
Product: TOPX – The Operations System
Advantages (RBS EMEA, 2019):
“It has been designed as a high performance, scalable and reliable graphical solution. It runs on
industry standard servers such as Intel servers with Red Hat Linux. It connects to any SQL
database such as Oracle.”
Among others, the advantage advertised is the Graphical User Interface offered.
3. JADE logistics (https://www.jadelogistics.com/)
JADE logistics is a company that has provided their software to 120 terminals worldwide (Jade
logistics, 2019). Operating since 1993.
Product: Master Terminal
Advantages (JADE logistics, 2019):
“ Single integrated system – real-time view of activity and cargo across your entire port.
A stable solution capable of forming the core of your port’s information systems.
Supports all cargo types and is available for all styles of ports.
Scalable, reliable, and flexible. Master Terminal can be customized
Our implementation and training record is second to none in the industry.

Deliverable No 3.1 – Stakeholders and market analysis report
Version 1.0 – 12-FEB-2019 – PIXEL© – Page 48 of 69
Get excellent support from a company with a proven track record and a wealth of
industry knowledge.
”
4. TGI Maritime Software (https://www.tgims.com/en/)
TGI MS is a software company operating since 1984 with over 80 clients and terminals
worldwide.
Product: Oscar Maritime Software
Advantages (TGI MS, 2019):
“Used on more than 20 Container and Roro terminals worldwide.”
“OSCAR is less complex and more user-friendly than other TOS and Client Support delivers high
quality services.”
The advantage of the system advertised is its simplicity. Similarly to PIXEL pilot-phase offering,
it targets small to medium terminals.
5. HPH (https://www.hph.com/)
Hutchison Ports is port network with “over 30,000 employees, operating ports and terminals in 26
countries in Asia, the Middle East, Africa, Europe, the Americas and Australasia.”
Product: nGen
Advantages (HPH, 2019):
“ The Next Generation Terminal Management System (nGen), developed in 2003 by in-house
terminal expertise and logistics experts enabling Hutchison Ports to increase capacity, service
and profitability. nGen optimises, innovates and collaborates terminals with operations
intelligences, execution and control, reporting and inventory.
nGen, created by Hutchison Ports, surpasses any commercially available terminal-management
system. It is truly scalable across all non-proprietary computer system hardware, from a small
feeder terminal operation to large hub ports. nGen and its development approach have been
awarded with technology excellence awards and certifications in all sectors, such as the CMMI
Level 3, ISO 27001 Security Standard, ITIL v3 IT Service Management, APICTA 2006 Industrial
Applications Winner and ISO 20000 IT Service Management.
To date, there are a total of 23 business units using nGen and it generates over sixty percent of
the group’s total throughput.
”
The advantages of the system advertised are scalability and technical excellence.
6. ISL Applications GmbH (http://www.isl-applications.com)
“Akquinet port consulting GmbH is a subsidiary of the akquinet group in Hamburg/Germany
former known as ISL Applications GmbH.
ISL Applications was founded in 2010 as the commercial part of the internationally recognized
Institute for Shipping Economics and Logistics (ISL). For more than 20 years, ISL has been
specializing in optimization and simulation. Their systems have been utilized worldwide for
optimizing container terminals, harbor planning and analyzing transportation networks.”
Product: Chesscon
The product offering is not a TOS per se, it is a Terminal Operations simulator. As PIXEL aims
also at simulating some port activities, this (and similar) products will be further investigated in
the context of WP4 (Modelling, process analysis and predictive algorithms).
7. Argonaut Systems Limited (http://www.argonautsystems.com/)
Founded in 2007 by a group of Software Architects and Programmers, ASL is providing ERP
minded systems for enterprises in general with a focus on logistics and Terminal Operations.

Deliverable No 3.1 – Stakeholders and market analysis report
Version 1.0 – 12-FEB-2019 – PIXEL© – Page 49 of 69
Products: BELLEROPHON (2.0 and 3.0)
8. TBA (https://www.tba.group/)
TBA group is a new company founded in 2017. It specializes in terminal planning and simulation.
Product: TEAMS (https://www.tba.group/teams/)
9. Infyz (https://www.infyz.com/)
Infyz is also a new company specialized in product development and software consulting services.
Product: Various – specialized for different types of cargo. The offerings are developed on open
source technologies and on web applications.
3.2.1.7. Integration of PCS and National Single Windows
As aforementioned a Port Community System (PCS) provides for the electronic exchange of information
between all port sectors and is acknowledged as the most advanced method for the exchange of information
within a single or national port community infrastructure acting as a Port Single Window.
As a Port Single Window, the full functionality of a PCS can provide all the various sectors and players within
a port community environment with tools specific to them, thus providing a tightly integrated system. It can
encompass exports, imports, transshipments, consolidations, hazardous cargo and maritime statistics
reporting.
Furthermore, Single Window aims at eliminating unnecessary paperwork by using electronic data exchange to
provide an effective, rapid and flexible real-time information system which improves efficiency at all stages of
the process of manifesting through vessel discharge and loading, customs clearance, port health formalities
and delivery in and out of the terminal (Keretho & Pikart, 2013).
The ‘Gateway to a National Single Window’ consists of both community systems (for maritime freight and air
freight) and the central government system. In order to support the objectives of a National Single Window,
the Gateway to a Single Window consists of a purely public section (NSW) and a public-private section
(PCS).
Figure 9. Gateway to a National Single Window (European Port Community Systems Association, 2011)
With the boom in the port sector, more and more different ways of making decisions and investing in
infrastructure more profitable are being studied. In order to achieve this, an increasing number of disciplines
are used, such as:
Modeling and optimization: Generation of scenarios that simulate the operations carried out in the
port. Major company operating in this area: BMT Isis.
(https://navcon.com.br/media/1004871/FL48%20Port%20Simulation%20Tools.pdf).
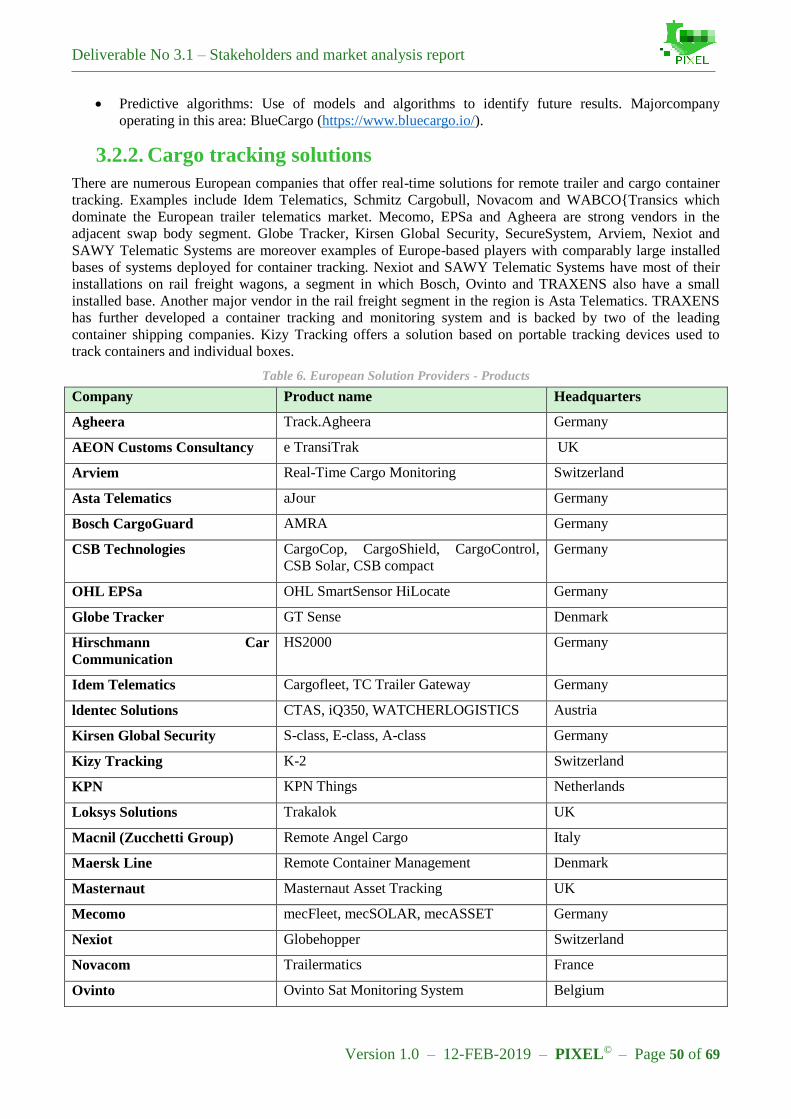
Deliverable No 3.1 – Stakeholders and market analysis report
Version 1.0 – 12-FEB-2019 – PIXEL© – Page 50 of 69
Predictive algorithms: Use of models and algorithms to identify future results. Majorcompany
operating in this area: BlueCargo (https://www.bluecargo.io/).
3.2.2. Cargo tracking solutions
There are numerous European companies that offer real-time solutions for remote trailer and cargo container
tracking. Examples include Idem Telematics, Schmitz Cargobull, Novacom and WABCO{Transics which
dominate the European trailer telematics market. Mecomo, EPSa and Agheera are strong vendors in the
adjacent swap body segment. Globe Tracker, Kirsen Global Security, SecureSystem, Arviem, Nexiot and
SAWY Telematic Systems are moreover examples of Europe-based players with comparably large installed
bases of systems deployed for container tracking. Nexiot and SAWY Telematic Systems have most of their
installations on rail freight wagons, a segment in which Bosch, Ovinto and TRAXENS also have a small
installed base. Another major vendor in the rail freight segment in the region is Asta Telematics. TRAXENS
has further developed a container tracking and monitoring system and is backed by two of the leading
container shipping companies. Kizy Tracking offers a solution based on portable tracking devices used to
track containers and individual boxes.
Table 6. European Solution Providers - Products
Company Product name Headquarters
Agheera Track.Agheera Germany
AEON Customs Consultancy e TransiTrak UK
Arviem Real-Time Cargo Monitoring Switzerland
Asta Telematics aJour Germany
Bosch CargoGuard AMRA Germany
CSB Technologies CargoCop, CargoShield, CargoControl,
CSB Solar, CSB compact
Germany
OHL EPSa OHL SmartSensor HiLocate Germany
Globe Tracker GT Sense Denmark
Hirschmann Car
Communication
HS2000 Germany
Idem Telematics Cargofleet, TC Trailer Gateway Germany
ldentec Solutions CTAS, iQ350, WATCHERLOGISTICS Austria
Kirsen Global Security S-class, E-class, A-class Germany
Kizy Tracking K-2 Switzerland
KPN KPN Things Netherlands
Loksys Solutions Trakalok UK
Macnil (Zucchetti Group) Remote Angel Cargo Italy
Maersk Line Remote Container Management Denmark
Masternaut Masternaut Asset Tracking UK
Mecomo mecFleet, mecSOLAR, mecASSET Germany
Nexiot Globehopper Switzerland
Novacom Trailermatics France
Ovinto Ovinto Sat Monitoring System Belgium

Deliverable No 3.1 – Stakeholders and market analysis report
Version 1.0 – 12-FEB-2019 – PIXEL© – Page 51 of 69
Company Product name Headquarters
RM2 BLOCKPal Switzerland
SAWY Telematic Systems Synergy, FleetTrac, CargoTrac Switzerland
Schmitz Cargobull TrailerConnect, TelematicsOne Germany
SecureSystem SecureSystem Germany
SuccorfishM2M SC3 UK
Sycada m!Trace Netherlands
Transics (WABCO) TX-TRAILERGUARD, TX-GEO Belgium
TRAXENS TRAXENS-BOX S+, TRAXENS-HUB France
Trusted Trusted Visibility Suite, T series, S1 Denmark
Ubidata UBITrailer, UBILogistics, UBIWagon Belgium
Yellowfish Fleetmonitor Sweden
Zenatek Zenatek Tracking System Monaco
3.2.3. Data management solutions
Regarding data management in nowadays ports, the major European and international players in the market
are addressing the ports on transversal issues related to reach a wider audience. The aggregation and analysis
of the data collected, which are at the heart of a Smart Port approach and which are one of the pillars of the
PIXEL project strategy ("aggregate, homogenize, integrate & share multi-source heterogeneous data &
insight" and "model, simulate, optimize port processes and predict environmental impacts"), are addressed
with more complete offers – in the same way as companies – on the European and international market.
We can then look at the market under the "global data platform" axis, which is subject to greater competition
for the PIXEL project. In February 2018, (Gartner, 2018) offered an overview of "Data Management
Solutions for Analytics” (and - by - extension - monitoring and operational optimization), which market is
evolving as the cloud's position solidifies. We define a data management solution for analytics (DMSA) as a
complete software system that supports and manages data collected from various sources (IS, databases,
software, IoT, etc.) DMSAs include specific optimizations to support analytical processing. This includes, but
is not limited to, support for relational processing, non-relational processing (such as graph processing),
machine learning and data visualization. These particular technical concepts will be further developed for
PIXEL in the WP4 (Modelling, process analysis and predictive algorithms).

Deliverable No 3.1 – Stakeholders and market analysis report
Version 1.0 – 12-FEB-2019 – PIXEL© – Page 52 of 69
Figure 10. Quadrant for Data Management Solutions for Analytics (Gartner, 2018)
(Gartner, 2018) identifies 6 current leaders – only one European – in the market. Some of them are already
present in Europe:
1. IBM, which is based in Armonk, New York, U.S., offers stand-alone DBMSs (Db2, Db2 for z/OS,
Informix), appliances (PureData System for Analytics, PureData System for Operational Analytics,
Integrated Analytics System, Db2 Analytics Accelerator), Hadoop solutions (BigInsights), managed
data warehouse cloud services (Db2 Warehouse on Cloud), and private cloud data warehouse
capabilities (Db2 Warehouse). IBM's BigSQL and Fluid Query provide a consolidated access tier to a
wide range of DBMSs and Hadoop. In addition, IBM's DataFirst Method and Watson Data Platform
support further evolution of hybrid cloud and on-premises deployment and management.
Present in Port of Rotterdam:
Partnership with Cisco Kinetic, Cisco Industrial IoT, and IBM Watson IoT cloud and analytic
solutions enabled the development of an intelligent platform for analyzing and reprocessing
data collected on the environment, assets and technologies to maximize value, optimize flows
and increase value for port customers.
Integrated IoT solution, including:
o Secure authentication
o Application of intelligence from the generation of data to allow quick decisions
o Automated connectivity, deployment and sensor management
o Extraction, processing and simplified delivery of data
o Intelligent visualization of data

Deliverable No 3.1 – Stakeholders and market analysis report
Version 1.0 – 12-FEB-2019 – PIXEL© – Page 53 of 69
2. SAP is based in Walldorf, Germany. It offers SAP HANA, an in-memory column-store DBMS that
supports operational and analytical use cases. There is also SAP BW/4HANA, a packaged data
warehouse solution. Both are offered as cloud solutions (for deployment in public and private clouds,
and on SAP Cloud Platform) and as an appliance-like hardware reference architecture. SAP also
offers SAP Cloud Platform Big Data Services, a cloud-based Hadoop distribution and SAP Vora for
Spark and Hadoop processing.
Present in Port of Hamburg:
The SmartPORT logistic initiative of the Port of Hamburg, leverages the SAP HANA cloud
platform. At the beginning of the project, T-System and SAP started working on data from
truck and parking companies so that truck drivers could connect from their Samsung tablets to
receive information directly from the available parking spaces. Subsequently, they extended
the project to other data and stakeholders and also worked on the platform velocity.
Subsequently, the Port of Hamburg has developed its Smart Port Hamburg 2025 plan,
developing logistics around three pillars: infrastructure, traffic flow management and
merchant traffic management. The port authority has also developed a complementary smart
energy plan.
The deployment of this tool would have contributed significantly to an increase in port
activity of + 12% three months after its implementation.
3. Oracle is based in Redwood Shores, California, U.S., provides Oracle Database 12c, Oracle Exadata
Database Machine, Oracle Big Data Appliance, Oracle Big Data Management System, Oracle Big
Data SQL and Oracle Big Data Connectors. In addition, the Oracle Cloud service provides Oracle
Database Cloud Service, Oracle Database Cloud Exadata Service and Oracle Big Data Cloud Service
— a lineup to which Oracle Autonomous Data Warehouse Cloud will be added. Oracle's cloud
portfolio also includes on-premises solutions in the form of Oracle Database Exadata Cloud at
Customer and Oracle Big Data Cloud at Customer.
4. Amazon Web Services (AWS) is a wholly owned subsidiary of Amazon, which is based in Seattle,
Washington, U.S. AWS offers Amazon Redshift, a data warehouse service in the cloud. Amazon
Redshift includes Redshift Spectrum, a serverless, metered query engine that uses the same optimizer
as Amazon Redshift, but queries data in both Amazon Simple Storage Service (S3) and Redshift's
local storage; Amazon S3, a cloud object store; Amazon EMR, a managed Hadoop service; and
Amazon Athena, a serverless, metered query engine for data residing in Amazon S3. Additionally, the
recently announced Amazon Neptune provides graph capabilities.
5. Microsoft, which is based in Redmond, Washington, U.S., offers SQL Server as a software-only
solution with certified configurations. It also offers the Analytics Platform System, an MPP data
warehouse appliance. In addition, it sells Azure SQL Data Warehouse (a fully managed, MPP cloud
data warehouse), Azure HDInsight (a Hadoop distribution based on Hortonworks), Azure Databricks
(an Apache Spark-based analytics platform) and Azure Data Lake (a big data store and analytics
platform) as cloud services.
6. Teradata is based in San Diego, California, U.S. Its offerings include business and analytic
consulting services, the Teradata Analytics Platform built on the Teradata Database, a software-only
DBMS solution; Teradata IntelliFlex and IntelliBase appliances, and a range of cloud data warehouse
solutions (all with MPP). Teradata IntelliCloud is an "as a service" cloud offering available on public
cloud infrastructure (AWS and Microsoft Azure) and the Teradata Cloud (optimized infrastructure).
Support for the LDW comes in the form of Teradata's Unified Data Architecture (UDA). Teradata
QueryGrid (part of the UDA) provides multisystem query support via Teradata's own software, as
well as via open-source Presto. Teradata also offers Aster Analytics and Hadoop support for Cloudera,
Hortonworks and MapR distributions.
However, the PIXEL program stands out as a research and innovation action based on an Open Source
technology [FIWARE – which includes ORION, a CEF Building Block (European Commission, 2018)] and
Deliverable No 3.1 – Stakeholders and market analysis report
Version 1.0 – 12-FEB-2019 – PIXEL© – Page 54 of 69
other open-source available technologies) more suited to small and medium-sized ports for one or more of
these reasons: cost savings, faster return on investment (ROI), access to more bespoke, tailored solutions,
faster innovation, freedom from closed / proprietary lock in Improved business agility, faster decision making,
Greater flexibility to solve business problems, etc. (SAS, 2017).
3.2.4. Similar initiatives in the scope of research and innovation
projects
Several private and government funded international container and cargo tracking technology initiatives have
been launched, aiming to develop solutions to help stakeholders comply with regulations and to increase
security, efficiency and visibility of the global intermodal supply chain. Most of these projects have been
initiated by the European Commission (https://cordis.europa.eu/), but there are also examples of international
industry coalitions that try to develop and create broad technology standards. Such projects cover a variegated
range of topics as their core objective:
Emissions reduction.
Traffic reduction.
Information sharing.
Increased supply chain efficiency.
Decreased supply chain energy demands.
Efforts to analyse this future competition by reviewing existing research projects could not be concluded due
to issues regarding the availability of information: some projects were not concluded, other projects have not
yet publicized their results and some projects’ conclusion was only their contribution as components in other
projects. The review of the existing research will be ongoing during the development of PIXEL and its results
will be used in the related Deliverables No. 9.6, 9.7 and 9.8 (Draft Exploitation Plan and Business and
Exploitation Plan v1 and v2) as PIXEL also intends to use and leverage results from previous projects, related
or not with the ports domain.
3.3. Market needs addressed in PIXEL, positioning,
differentiation and competitive advantages As mentioned in the port challenges and needs, the ports are mainly having the following needs:
1. To increase their efficiency.
2. To become environmentally sustainable.
3. To be “smart” and connected.
4. To create local value and socially integrate in the city.
Terminal Operating Systems and Port Operations Simulators assist the ports to increase their efficiency, while
Port Community Systems assist the ports in being “smart” and connected and to create local value and socially
integrate in the city. However, there are not any widely recognized platforms that operate taking into account
the environmental factor and the interoperability between the port and the surrounding communities’ traffic.
It can be argued that by increasing the efficiency of an operation, the energy consumption per operation is
reduced and so environmental benefits occur. However, there are not any unified indices for the monitoring or
predicting of the environmental performance of the ports.
Furthermore, there is not any solution offering generic connection between the traffic management systems of
ports and cities. So, there is not a standard in the market. When a standard does not exist, a lot of solutions
come into the market aiming at capturing the market. This normally ends up in some compatibilities among
solutions, but also implies serious isolation and vendor-dependent scenarios. In this sense, PIXEL goal is to
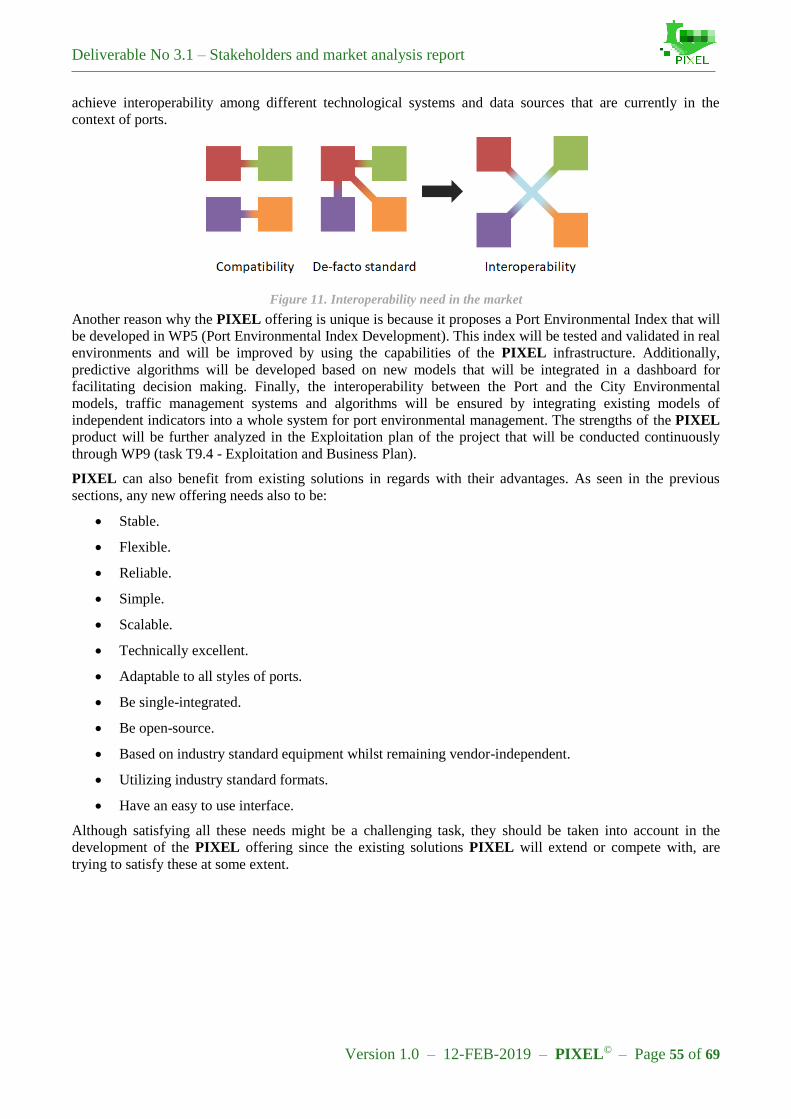
Deliverable No 3.1 – Stakeholders and market analysis report
Version 1.0 – 12-FEB-2019 – PIXEL© – Page 55 of 69
achieve interoperability among different technological systems and data sources that are currently in the
context of ports.
Figure 11. Interoperability need in the market
Another reason why the PIXEL offering is unique is because it proposes a Port Environmental Index that will
be developed in WP5 (Port Environmental Index Development). This index will be tested and validated in real
environments and will be improved by using the capabilities of the PIXEL infrastructure. Additionally,
predictive algorithms will be developed based on new models that will be integrated in a dashboard for
facilitating decision making. Finally, the interoperability between the Port and the City Environmental
models, traffic management systems and algorithms will be ensured by integrating existing models of
independent indicators into a whole system for port environmental management. The strengths of the PIXEL
product will be further analyzed in the Exploitation plan of the project that will be conducted continuously
through WP9 (task T9.4 - Exploitation and Business Plan).
PIXEL can also benefit from existing solutions in regards with their advantages. As seen in the previous
sections, any new offering needs also to be:
Stable.
Flexible.
Reliable.
Simple.
Scalable.
Technically excellent.
Adaptable to all styles of ports.
Be single-integrated.
Be open-source.
Based on industry standard equipment whilst remaining vendor-independent.
Utilizing industry standard formats.
Have an easy to use interface.
Although satisfying all these needs might be a challenging task, they should be taken into account in the
development of the PIXEL offering since the existing solutions PIXEL will extend or compete with, are
trying to satisfy these at some extent.
Deliverable No 3.1 – Stakeholders and market analysis report
Version 1.0 – 12-FEB-2019 – PIXEL© – Page 56 of 69
4. Overview of environmental initiatives in the ports
industry
This report tried to identify the stakeholders and the market PIXEL will be addressing to. The most recent
developments in the technology side have been explored, mainly in the fields of Port Community Systems,
Internet of Things and Terminal Operating Systems and simulators. However, as mentioned in previous
chapters, PIXEL aims to also integrate an environmental solution that will consist of:
An environmental metric - the Port Environmental Index (PEI), which integrates the environmental
impacts into a single indicator.
The environmental impact assessment models required as input providers to the PEI.
This Section identifies international organizations and standards related to environmental management and the
PEI concept is introduced and compared to similar indexes in the current market.
4.1. Literature Review Logistics is one of the most dynamic sectors of the economy, contributing to economic growth and
international competitiveness. Europe is currently the leader in logistics and with the steady growth in freight
volumes throughout Europe, the long-term forecast is 80% growth in freight transport by 2050 (OECD/ITF,
2017). With this predicted growth, the challenge is to raise the efficiency and competitiveness of the logistics
sector while reducing environmental impacts. PIXEL with its four Pilot Cases will have a positive impact on
the socio-economic dimension of the Logistics sector, enabling innovation capable of game changing
capabilities towards more sustainable logistics and increased overall performance of the EU logistics industry.
This increased transportation growth must not contribute to the deterioration of the urban environmental
conditions and worsening the quality of life due to traffic noise and air emissions that have a negative impact
on public health and the environment. Many supply chains have started to integrate green elements in their
business processes, such as procurement, production, manufacturing, materials management, distribution /
marketing and reverse logistics. It is argued that greater supply chain integration can benefit environment
management in operations. With an intelligent orchestration, PIXEL will result overall in transportation
services that have significantly reduced negative impact on human health and the natural environment.
Moreover, PIXEL will help transportation and supply chains move beyond environmental compliance to
implement proactive environmentally-friendly policies. PIXEL supports environmentally friendly modalities
and suggests congestion free, safer, and environmentally friendlier transport routes. Urban logistics in
particular place an additional burden on society in the form of safety risks. Minimising unnecessary urban
deliveries or shifting them to suitable out-of-hours with better planning can reduce safety risks to pedestrians
and drivers due to fewer delivery vehicles on the roads. Lastly, PIXEL might have a beneficial impact on the
economic parameters of citizens and their communities because logistics is traditionally a significant
employer, and as the economy grows, the demand for people to fill key roles might increase, even though
these will not be the traditional roles we see today (e.g. drivers, stevedores) but roles that might be more
relevant to a future setting (software and hardware engineers). This will affect in particular local communities
based near synchromodal centres / hubs both in and out of towns.
Modern Environmental Management Systems have the abilities to strengthen the competitiveness and
environmental credentials of the ports sector, by enabling simultaneously:
Collaborative innovative ICT solutions for future logistics operations.
New levels of accessibility and flexibility in the use of ICT solutions tailor made for different
stakeholder groups (manufacturers, retailers, intermodal operators, SME LSP cities).
Key impact targets of such systems include:
Fewer empty miles - by engaging in collaborative relationships with players further up the supply
chain, companies may be able to eliminate transportation inefficiencies associated with empty
backhauls.
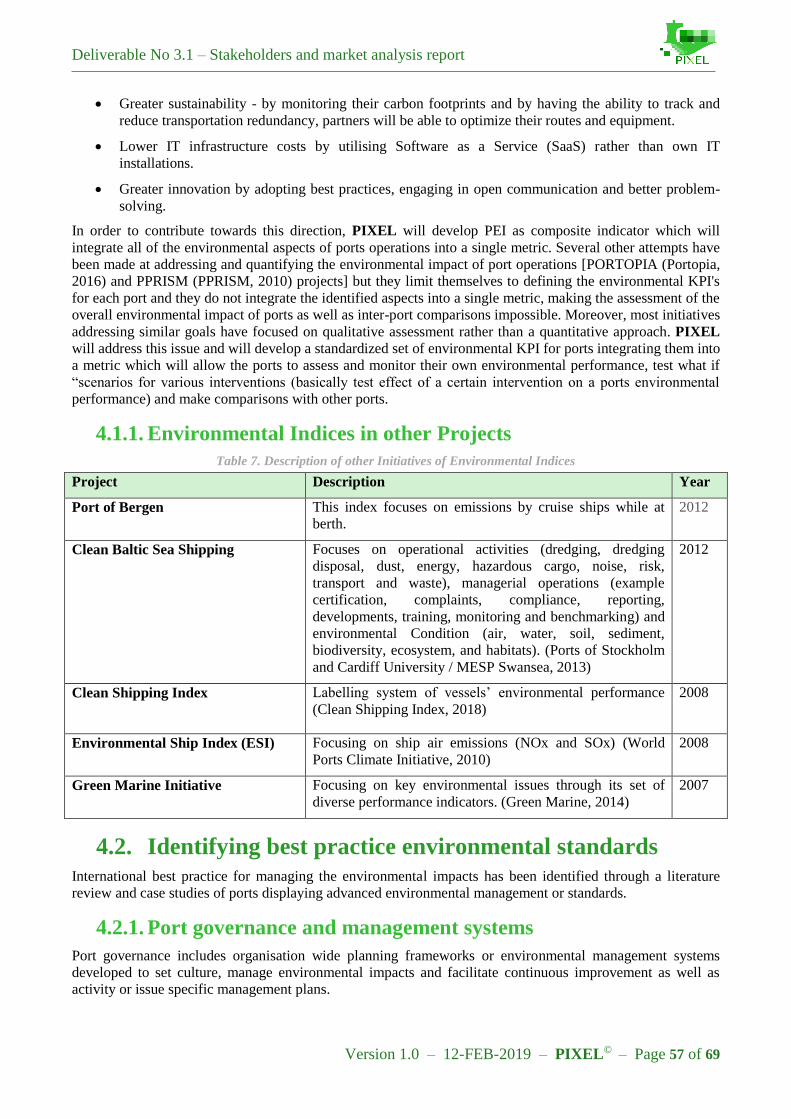
Deliverable No 3.1 – Stakeholders and market analysis report
Version 1.0 – 12-FEB-2019 – PIXEL© – Page 57 of 69
Greater sustainability - by monitoring their carbon footprints and by having the ability to track and
reduce transportation redundancy, partners will be able to optimize their routes and equipment.
Lower IT infrastructure costs by utilising Software as a Service (SaaS) rather than own IT
installations.
Greater innovation by adopting best practices, engaging in open communication and better problem-
solving.
In order to contribute towards this direction, PIXEL will develop PEI as composite indicator which will
integrate all of the environmental aspects of ports operations into a single metric. Several other attempts have
been made at addressing and quantifying the environmental impact of port operations [PORTOPIA (Portopia,
2016) and PPRISM (PPRISM, 2010) projects] but they limit themselves to defining the environmental KPI's
for each port and they do not integrate the identified aspects into a single metric, making the assessment of the
overall environmental impact of ports as well as inter-port comparisons impossible. Moreover, most initiatives
addressing similar goals have focused on qualitative assessment rather than a quantitative approach. PIXEL
will address this issue and will develop a standardized set of environmental KPI for ports integrating them into
a metric which will allow the ports to assess and monitor their own environmental performance, test what if
“scenarios for various interventions (basically test effect of a certain intervention on a ports environmental
performance) and make comparisons with other ports.
4.1.1. Environmental Indices in other Projects
Table 7. Description of other Initiatives of Environmental Indices
Project Description Year
Port of Bergen This index focuses on emissions by cruise ships while at
berth.
2012
Clean Baltic Sea Shipping Focuses on operational activities (dredging, dredging
disposal, dust, energy, hazardous cargo, noise, risk,
transport and waste), managerial operations (example
certification, complaints, compliance, reporting,
developments, training, monitoring and benchmarking) and
environmental Condition (air, water, soil, sediment,
biodiversity, ecosystem, and habitats). (Ports of Stockholm
and Cardiff University / MESP Swansea, 2013)
2012
Clean Shipping Index
Labelling system of vessels’ environmental performance
(Clean Shipping Index, 2018)
2008
Environmental Ship Index (ESI) Focusing on ship air emissions (NOx and SOx) (World
Ports Climate Initiative, 2010)
2008
Green Marine Initiative Focusing on key environmental issues through its set of
diverse performance indicators. (Green Marine, 2014)
2007
4.2. Identifying best practice environmental standards International best practice for managing the environmental impacts has been identified through a literature
review and case studies of ports displaying advanced environmental management or standards.
4.2.1. Port governance and management systems
Port governance includes organisation wide planning frameworks or environmental management systems
developed to set culture, manage environmental impacts and facilitate continuous improvement as well as
activity or issue specific management plans.

Deliverable No 3.1 – Stakeholders and market analysis report
Version 1.0 – 12-FEB-2019 – PIXEL© – Page 58 of 69
Management systems provide a framework to avoid and mitigate impacts and drive continuous improvement.
A number of tools are available internationally to assist ports in mitigating their environmental impact. These
include:
ISO 14001 – The International Standard ISO 14001 Environmental management systems –
requirements with guidance for use (ISO 14001) is recognised internationally as providing a generic
standard for environmental management systems. ISO 14001 is designed to assist organisations to
minimise their impact on the environment, achieve compliance with environmental legal and other
requirements, and to continually improve their environmental performance. These objectives are
facilitated by a ‘plan, do, check, review’ process requiring organisations to identify and manage their
significant environmental aspects. Organisations may choose to become ISO 14001 certified, with a
third party auditor conducting a certification audit followed by periodic surveillance audits.
European Union Eco-Management and Audit Scheme (EMAS) – Similar to ISO 14001, EMAS
provides a structured framework for driving improved environmental performance and is based
around a plan-do, check-act process. EMAS is a voluntary scheme open to both public and private
companies in the EU and is governed by the EMAS Regulation 2009.
EcoPorts and the Port Environmental Review System (PERS) – ESPO offers its member ports a
number of services aimed at improving environmental management. EcoPorts is one of these
(www.ecoports.com) and was developed to encourage sharing of knowledge and experience in
environmental management between port professionals. EcoPorts provides ports with two key tools:
o Self-Diagnosis Method (SDM) – The SDM provides a checklist port authorities can use to
assess their environmental management program and compare it to the port sector and
international standards. When a port completes the SDM it becomes eligible for EcoPort
status. This is considered a reward for contributing data on the performance on environmental
management and for contributing to the up-to-date maintenance of the ESPO European
Benchmark of Performance.
o Port Environmental Review System (PERS) – PERS was developed to assist ports to
implement effective environmental management programs. Implementation of PERS can be
independently certified by Lloyds Register. Additional recognition under the EcoPorts
program is available for ports that achieve PERS certification. 60 ports in the EU are
currently registered with EcoPorts. 17 have hold PERS certification and 27 hold ISO 14001
certification, with five ports holding both certifications (EcoPorts 2013).
Green Marine - Voluntary environmental certification program for the North American marine
industry. It is a transparent and inclusive initiative that addresses key environmental issues through its
performance indicators on the following issues (Green Marine, 2014):
o Aquatic invasive species
o Cargo Residues
o Community impacts
o Dry bulk handling and storage
o Environmental leadership
o Garbage management
o Greenhouse gas emissions
o Oily water
o Pollutant air emissions NOx
o Pollutant air emissions SOx & PM
o Prevention of spills and leakages
o Underwater noise
o Waste management
Deliverable No 3.1 – Stakeholders and market analysis report
Version 1.0 – 12-FEB-2019 – PIXEL© – Page 59 of 69
Participants are ship-owners, ports, terminals, Seaway corporations and shipyards based in Canada and the
United States.
Some international ports have developed policies, procedures or plans to improve governance of
environmental management and manage specific environmental issues or processes. In some cases these
documents may have been developed as part of a broader environmental management system, whilst in others
these documents have been developed in response to a specific issue or legislative requirement. Some
examples of these are provided below:
Ports of Los Angeles and Long Beach – The Ports of Los Angeles and Long Beach, which are
located adjacent to each other, developed the San Pedro Bay Clean Air Action Plan designed to
achieve significant reductions in air pollution and associated health risks by setting emissions
reduction goals and targets, developing strategies to meet these targets, monitoring emissions to assess
progress and then reviewing for continuous improvement. This plan was developed to manage a
specific environmental issue (air quality).
Port of Dover – The Port of Dover’s Sustainable Development Policy states that designs will be
developed with consideration of how they will influence operational users to act in an environmental
responsible manner. Social and environmental concerns will be considered from project inception
stage along with the economic aspects so that the principles of environmental sustainability guide all
project decisions. The Port of Dover also considers the environment as part of its procurement
processes including procurement for construction.
Port of Metro Vancouver – Under the Canada Marine Act, Port Metro Vancouver is responsible for
administration, management and control of land and water in its jurisdiction. In order to administer
these responsibilities, Port Metro Vancouver has established an in house Environmental Assessment
Procedure to review all project proposals involving physical works in the Port’s jurisdiction. The
Project Review Application Form requires a description of in water activities, and a description and
proposed mitigation measures for project environmental implications. As part of this process the Port
may refer projects with particular environmental impacts on to other agencies to review and provide
recommendations on conditions of approval. The Environmental Assessment Procedure review then
informs conditions that the project proponent must adhere to when conducting the project.
Port of Quebec - Since 2001, the MPA’s Environmental Policy (in French), revised in 2010, has set
out the MPA’s environmental principles and values. Its objective is to guide the Montreal Port
Authority in both its current management and in its development planning.
It aims to ensure that the MPA’s activities are planned and executed according to the following
criteria: compliance with the legal framework; concern to minimize the environmental impacts that
may be associated with its activities; and commitment to protect the quality of the environment. It also
plays a key role in applying the Sustainable Development Policy.
The environmental policy covers the following guiding principles:
o Environmental compliance
o Protection of the environment
o Environmental management
o Communication
In some cases, the benefits of implementing environmental management systems in ports include reduced
costs and improved efficiency, reduced environmental impact and liabilities, and improved emergency
response capability. One such example is the Global Environment & Technology Foundation in partnership
with the American Association of Port Authorities and United States Environmental Protection Agency
implemented an EMS Assistance Project to assist 11 ports with EMS training, mentoring and technical
assistance. Participating ports reported performance improvements such as:
58% reduction in waste
47% reduction in storm water constituents
Deliverable No 3.1 – Stakeholders and market analysis report
Version 1.0 – 12-FEB-2019 – PIXEL© – Page 60 of 69
20% reduction in insurance costs (Port of Houston Authority) Completion of a Natural Resources
Assessment and Management Plan, including ecological mapping, to streamline data collection and
reduce delays in approval processes (Port of Portland)
Implementation of a Clean Marina Program (Port of Los Angeles) (Kruse, 2005).
However an EMS is only a tool to drive environmental performance and it does not guarantee outcomes. In
order for systems to be effective, the organisation needs to understand the environmental risks, legislation and
management practices available and to provide sufficient resources for implementation.
The ESPO and the EcoPorts Foundation conducted a periodic review of environmental benchmark
performance of ports in the ESPO in 2009. This review indicated that progress has been made in
environmental management and systems, but 71% of ports still experience difficulties in implementation.
Challenges included the number of authorities and stakeholders involved, expense, lack of awareness of good
practice, status given to environmental issues and information and guidance related to legislation.
Adoption of port wide environmental management systems and, where required, management plans for
specific issues, projects or activities, is standard practice in Australian ports, with most Australian ports
publishing details of their approach to environmental management on their websites.
4.2.2. Incentive programs and awards
A number of ports have adopted incentive programs to drive improvements in environmental performance and
to influence other organisations, such as shipping companies and tenants, towards improved practices. Awards
and recognition for good environmental performance include:
ESPO Annual Award on Societal Integration of Ports - This award promotes innovation projects
in European port authorities that develop co-operative synergies with cities, especially in the city or
wider community in which they are located.
Environmental Ship Index (ESI) - The ESI was developed as part of the World Port Climate
Initiative aimed at reducing greenhouse gas emissions. The ESI is used to identify ships that perform
better in reducing air emissions than required by the current emission standards of the IMO. Ports may
choose to reward ships that participate in the ESI, with 24 ports internationally currently listed as
providing incentives.
Green Award Foundation - The Green Award Foundation is a neutral, non-profit organisation
established on the initiative of the Port of Rotterdam and provides international recognition for extra
clean, extra safe seagoing vessels, which are more than welcome in any seaport.
International Institute of Sustainable Seaports (I2S2) - I2S2 was developed in partnership with the
American Associated of Port Authorities and is a non-profit centre of excellence designed to promote
sustainable practices by port authorities, their tenants and members of the international community.
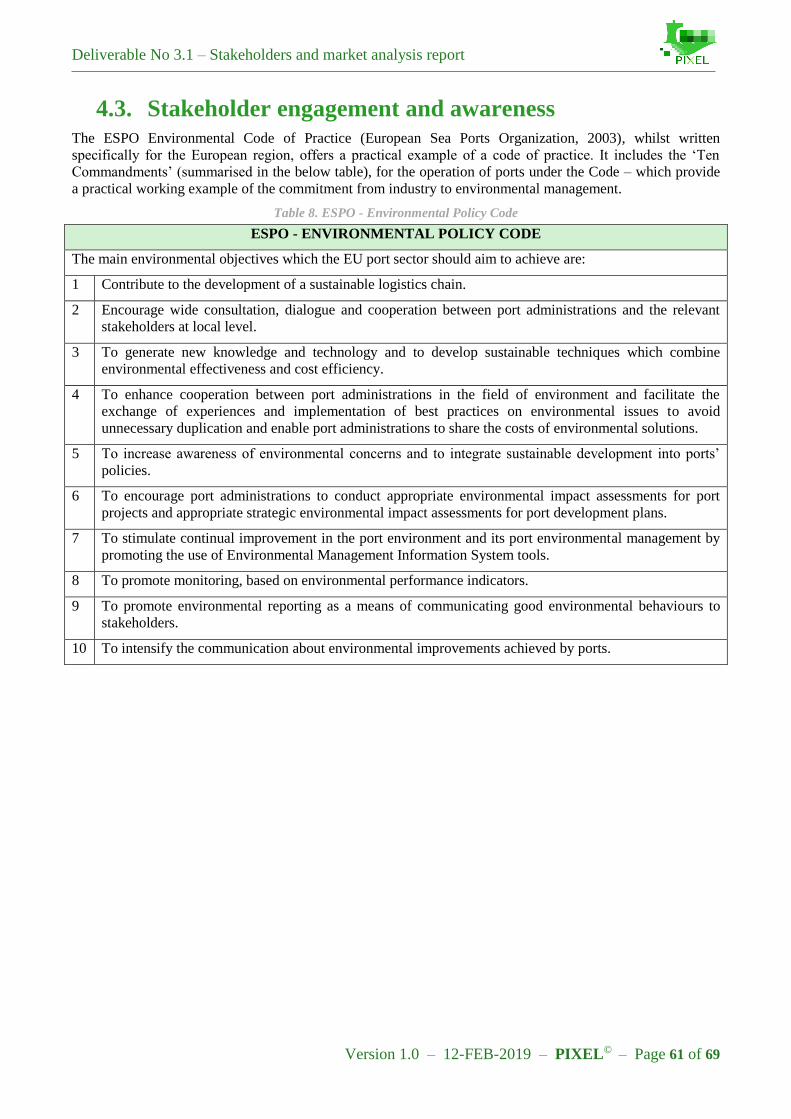
Deliverable No 3.1 – Stakeholders and market analysis report
Version 1.0 – 12-FEB-2019 – PIXEL© – Page 61 of 69
4.3. Stakeholder engagement and awareness The ESPO Environmental Code of Practice (European Sea Ports Organization, 2003), whilst written
specifically for the European region, offers a practical example of a code of practice. It includes the ‘Ten
Commandments’ (summarised in the below table), for the operation of ports under the Code – which provide
a practical working example of the commitment from industry to environmental management.
Table 8. ESPO - Environmental Policy Code
ESPO - ENVIRONMENTAL POLICY CODE
The main environmental objectives which the EU port sector should aim to achieve are:
1 Contribute to the development of a sustainable logistics chain.
2 Encourage wide consultation, dialogue and cooperation between port administrations and the relevant
stakeholders at local level.
3 To generate new knowledge and technology and to develop sustainable techniques which combine
environmental effectiveness and cost efficiency.
4 To enhance cooperation between port administrations in the field of environment and facilitate the
exchange of experiences and implementation of best practices on environmental issues to avoid
unnecessary duplication and enable port administrations to share the costs of environmental solutions.
5 To increase awareness of environmental concerns and to integrate sustainable development into ports’
policies.
6 To encourage port administrations to conduct appropriate environmental impact assessments for port
projects and appropriate strategic environmental impact assessments for port development plans.
7 To stimulate continual improvement in the port environment and its port environmental management by
promoting the use of Environmental Management Information System tools.
8 To promote monitoring, based on environmental performance indicators.
9 To promote environmental reporting as a means of communicating good environmental behaviours to
stakeholders.
10 To intensify the communication about environmental improvements achieved by ports.

Deliverable No 3.1 – Stakeholders and market analysis report
Version 1.0 – 12-FEB-2019 – PIXEL© – Page 62 of 69
4.3.1. Environmental priorities evolve
The ESPO / EcoPorts Port Environmental Review 2016 (European Sea Ports Organisation / EcoPorts
Foundation, 2016) identified the issues which were most significant for EU ports in the field of environment
and demonstrated the sector’s performance in terms of environmental management. The review up-dated the
results of the previous similar exercises of 1996 and 2004, and assessed the progress that has been achieved
over the years. Furthermore, the review re-established a European benchmark of environmental performance,
against which individual ports were also able to evaluate their own environmental management in relation to
some fundamental questions. 122 ports from 20 European Maritime States participated in this survey.
The table below (EcoPorts | ESPO, 2018) presents the top 10 environmental priorities for 2009 together with
the ones from the similar exercises that took place in 1996 and 2004 so that the variations over time can be
demonstrated. Environmental issues that consistently appear over time are mapped with the same colour.
Table 9. Top 10 environmental priorities of the European port sector over time
1996 2004 2009 2018
1 Port development
(water) Garbage / Port waste Noise Air quality
2 Water quality Dredging: operations Air quality Energy consumption
3 Dredging disposal Dredging disposal Garbage / Port waste Noise
4 Dredging: operations Dust Dredging: operations Relationship with local
community
5 Dust Noise Dredging: disposal Ship waste
6 Port development (land) Air quality Relationship with local
community
Port development (land
related)
7 Contaminated land Hazardous cargo Energy consumption Climate change
8 Habitat loss/degradation Bunkering Dust Water quality
9 Traffic volume Port development (land) Port development
(water) Dredging operations
10 Industrial effluent Ship discharge (bilge) Port development (land) Garbage / Port waste
Air quality is identified as the current top environmental priority by the European port sector as a whole,
followed by energy consumption. The significance of air quality clearly signals the priority given to issues
related to the health of people working or living around ports, and it is in line with the European political
agenda. Energy consumption is a priority in line with the 2020 Energy strategy which identifies acceleration
of investment into efficient buildings and transport as one of the five top priorities. The European Noise
Directive is considered to be one of the main triggering factors for the high priority on noise within the ports
environmental agenda.
Some environmental issues, namely dredging operations and port development, appear consistently within the
top 10 priorities in Europe over the last 22 years. Those highly prioritised environmental issues for a large
majority of European ports form a basis for environmental collaboration in the port sector. The entry of the
relationship with the local community signifies the importance of the impact of port operations into the local
communities.
4.3.2. Evolution of port environmental management and
sustainability
“Sustainable development is development that meets the needs of the present without compromising the ability
of future generations to meet their own needs (Brundtland, 1987). Three aspects of sustainability are
recognized by (Oniszczuk-Jastrząbek, et al., 2018): the social aspect that is related to contribution to direct

Deliverable No 3.1 – Stakeholders and market analysis report
Version 1.0 – 12-FEB-2019 – PIXEL© – Page 63 of 69
and indirect employment and the interaction and relationship between the port and the city, the economic
aspect which focuses on the return on investment and the efficiency of the port and the stakeholders operating
in it and the environmental aspect which relates to environmental performance and management.
As seen in table 8 of sub section 4.3.1 the environmental priorities vary during the years. A great deal of
variance of environmental priorities also exists between different ports. The environmental priorities of each
port depend on the specific location and the characteristics of each port area. Furthermore, the port authority
of each port may not be responsible for the environmental management of activities of operators of the
logistics chain although the ports can act as facilitators of procedures and of communication between the
different parties of such a chain (Bichou & Gray, 2004). By using quantifiable data from four different ports
PIXEL aims to address a wide set of environmental issues, not only focused on the needs of one specific port
as specified in one set of regulations, but by measuring and indexing a transparent set of environmental
indicators.
4.3.3. Final remarks
The analysis performed in Section 4 points out that the current environmental initiatives of small and medium
sized ports in the EU and abroad are mainly based on qualitative assessments of the ports’ environmental
performance: quantitative environmental targets are very loosely defined or completely missing. The
methodological approaches are mainly based on self-evaluation procedures which have an exceptionally high
risk of significantly biasing the outcomes and conclusions reached. In addition, problems in implementation of
various environmental management systems - tools used to mitigate the negative impacts of ports on health
and the natural environment including the well-known ISO14001 standard - are rampant, with 71% of ports
reporting difficulties in deploying such initiatives. As a result, based on current approaches, no meaningful
conclusion can be reached with respect to a port’s true environmental performance nor different ports can be
compared and/or ranked according to their environmental attributes.
The Port Environmental Index (PEI) proposed under PIXEL will address all the issues mentioned above. The
methodological approach used to calculate the index will be based on quantitative data with the majority
gathered automatically through sensors. Thus, biased estimates of environmental performance will be
dramatically reduced. The set of environmental indicators used to estimate the environmental performance
will be transparent and standardized thus making it possible to have a coherent environmental database which
will allow for a meaningful analysis and comparisons between ports with respect to their environmental
performance. Finally, all identified significant environmental aspects of port’s operation will be integrated in a
single composite indicator which will reflect the port’s overall environmental performance. We strongly
believe that, if successful, PEI will provide a paradigm shift in monitoring the environmental performance of
ports, especially if the problem of collecting data in real-time through sensors will be effectively solved.
Deliverable No 3.1 – Stakeholders and market analysis report
Version 1.0 – 12-FEB-2019 – PIXEL© – Page 64 of 69
5. Conclusion / Future Work
This deliverable presents an analysis of the Port Systems and the logistics and transportation market in Europe
in terms of, among others, environmental dimension, economic figures, operations, mode performance, type
of cargo transported, modal split, main corridors and cost break-down. This report is a contribution to the
effort to roughly position PIXEL in these markets, and provide the necessary context within which the project
and its main outputs will operate after the projects end. It aims at providing the reader with all the necessary
information to fully assess the magnitude and importance of the transport and logistics and freight
transportation market and provide all the details that differentiate each mode from the others.
The following conclusions are drawn from the international ports and associated logistics context:
1. International trade is steadily growing during the last three decades.
2. Ports play and will continue to play major role in the international trade.
3. The European ports plan to face the challenge of increased volumes by increasing their efficiency and
their connection with the hinterland.
4. One of the main solutions European ports are planning to invest is ICT Systems.
5. Simultaneously, the European ports place high value in the environmental impact of their activities.
6. There are models and tools able to measure the ports’ environmental performance, but not by using
unified indices, nor by taking into account the interoperability of the ports and their cities.
7. There are solutions in the market able to increase the ports’ efficiency. However, these solutions are
not focusing on the environmental management of the ports.
Our research has revealed the similarities and differences among the PIXEL consortium ports’ (Port of
Bordeaux, Port of Piraeus, Port of Thessaloniki and Port of Monfalcone) status and approaches about green
port development. In general, the port authorities and public regulators of those four ports are active in using
the three categories of port management tools to enhance the environmental performance of the respective
port. We observe that the ports are particularly mature in exercising environmental standard regulations,
which reveals that the enforcement approach is more prevalent. It is understandable as policy makers wish to
achieve a greener status in a controllable period, especially in view of scrutiny in environmental regulatory
compliance and public criticism from the international community. However, encouragement to go beyond the
minimum environmental standard requires incentives and support from the government.
As a future work, it is suggested that:
1. The most powerful and relevant stakeholders to be surveyed regarding their exact requirements from
the PIXEL proposal.
2. Existing solutions and projects to be showcased and their similarities with PIXEL to be revealed in
order to be exploited. Possible synergies to be sought.
3. Existing solutions and projects to be further explored (in cooperation with the stakeholders) in terms
of their real competitive advantage.
4. Industry standards to be explored in order for PIXEL to be compatible with these.
5. The regulatory context to be explored in depth especially with regards to the privacy, environmental
and transportation framework.
6. The concrete and final PIXEL offering to be based upon the requirements and competitive advantages
set in the previous bullets.
Deliverable No 3.1 – Stakeholders and market analysis report
Version 1.0 – 12-FEB-2019 – PIXEL© – Page 65 of 69
6. References
Agencia Estatal Boletín Oficial del Estado, 2017. Documento BOE-A-2017-5270. [Online]
Available at: https://www.boe.es/buscar/doc.php?id=BOE-A-2017-5270
Anton Paar, 2019. Viscosity of Bunker Oil - Marine Fuel Oil. [Online]
Available at: https://wiki.anton-paar.com/en/bunker-oil-marine-fuel-oil/
[Accessed January 2019].
Beresford, A. & Pettit, S., 2017. International Freight Transport: Cases, Structures and Prospects. London:
Kogan Page Ltd..
Beškovnik, B., 2015. Introducing electronic maritime single window by port communities in the Adriatic
region. Transport Problems , December, pp. 25-33.
Bichou, K. & Gray, R., 2004. A Logistics and Supply Chain Management Approach to Port Performance
Measurement. Maritime Policy & Management, January.pp. 47-67.
Brundtland, G. H., 1987. Report of the World Commission on Environment and Development: Our Common
Future, s.l.: World Commission on Environment and Development (WCED).
Burgherr, P., 2007. In-depth analysis of accidental oil spills from tankers in the context of global spill trends
from all sources. Journal of Hazardous Materials, pp. 140(1-2):245-56.
Carlan, V., Sys, C., Vanelslander, T. & Roumboutsos, A., 2017. Digital innovation in the port sector: Barriers
and facilitators. Competition and Regulation in Network Industries, 17 October.pp. 71-93.
Central Intelligence Agency, 2019. World - The Wrold Factbook - Central Intelligence Agency. [Online]
Available at: https://www.cia.gov/library/publications/the-world-factbook/geos/xx.html
[Accessed January 2019].
Choi, H. R. et al., 2006. An automated gate system based on RFID technology. Athens, s.n., pp. 251-257.
Clean Shipping Index, 2018. methodology - Clean Shipping Index. [Online]
Available at: https://cleanshippingindex.com/methodology/
[Accessed December 2018].
Columbus, L., 2018. 10 Charts That Will Change Your Perspective Of Big Data's Growth. [Online]
Available at: https://www.forbes.com/sites/louiscolumbus/2018/05/23/10-charts-that-will-change-your-
perspective-of-big-datas-growth/
[Accessed December 2018].
Cullinane, K., Wang, T.-F. & Song, D.-W., 2003. Container Port production efficiency: A Comparative Study
of DEA and FDH Approaches. Journal of the Eastern Asia Society for Transportation Studies, pp. 698-713.
de Langen, P., Turro, M., Fontanet, M. & Caballe, J., 2018. The Infrastructure Investment needs and
Financing Challenge of European Ports, s.l.: European Seaports Organization.
Deloitte, 2015. Global Trends to 2030 - Impact on Ports Industry, Rotterdam: Deloitte.
DP World / The Economist Intelligence Unit, 2015. A turning point: The potential role of ICT innovations in
ports and logistics, s.l.: DP World.
EcoPorts | ESPO, 2018. Top 10 Environmental Priorities of EU Ports 2018 - EcoPorts | ESPO. [Online]
Available at: https://www.ecoports.com/publications/top-10-environmental-priorities-of-eu-ports-2018
[Accessed December 2018].
Emeghara, C. G., 2012. Measurement of delay factors in container ports of a developing economy: a study of
Lagos container terminal, Nigeria. International Journal of Development and Management Review
(INJODEMAR), pp. 145-158.
European Commission, 2013. Europe's Seaports 2030: Challenges Ahead, s.l.: European Commission.

Deliverable No 3.1 – Stakeholders and market analysis report
Version 1.0 – 12-FEB-2019 – PIXEL© – Page 66 of 69
European Commission, 2018. Orion Context Broker. [Online]
Available at: https://ec.europa.eu/cefdigital/wiki/display/CEFDIGITAL/Orion+Context+Broker
[Accessed December 2018].
European Port Community Systems Association, 2011. The role of Port Community Systems in the
development of the Single Window, s.l.: European Port Community Systems Association EEIG.
European Sea Ports Organisation / EcoPorts Foundation, 2016. ESPO / EcoPorts Port Environmental Review,
s.l.: ESPO / EPF.
European Sea Ports Organization, 2003. Environmental Code of Practice, s.l.: ESPO.
Eurostat, 2016. Half of EU trade in goods is carried by sea , s.l.: Eurostat Press Office.
EY, 2014. Big data - Changing the way businesses compete and operate, s.l.: EYGM.
Gartner, 2018. Magic Quadrant for Data Management Solutions for Analytics. [Online]
Available at: https://www.gartner.com/doc/3855698/magic-quadrant-data-management-solutions
Green Marine, 2014. Green Marine. [Online]
Available at: https://www.green-marine.org/
[Accessed December 2018].
Gronholt-Pedersen, J., 2017. Maersk says global IT breakdown caused by cyber attack. [Online]
Available at: https://www.reuters.com/article/us-cyber-attack-maersk-idUSKBN19I1NO
[Accessed December 2018].
Grote, M., Mazurek, N., Grabsch, C. & Zeilinger, J., 2016. Dry bulk cargo shipping — An overlooked threat
to the marine environment?. Marine Pollution Bulletin, pp. 511-519.
Hellenic Shipping News, 2018. Naval Dome: Cosco’s Cyber-Attack a Very Worrying Incident. [Online]
Available at: https://www.hellenicshippingnews.com/naval-dome-coscos-cyber-attack-a-very-worrying-
incident/
[Accessed December 2018].
HPH, 2019. Technology | Hutchinson Ports. [Online]
Available at: https://hutchisonports.com/en/innovation/technology/
[Accessed January 2019].
International Maritime Organization, 2019. IMO profile. [Online]
Available at: https://business.un.org/en/entities/13
[Accessed January 2019].
ITOPF, 2017. Oil tanker spill statistics 2016, s.l.: The International Tanker Owners Pollution Federation
Limited.
JADE logistics, 2019. Master Terminal - Terminal Operating System (TOS) | Jade Logistics. [Online]
Available at: https://www.jadelogistics.com/products/master-terminal/
[Accessed January 2019].
Jade logistics, 2019. Master Terminal. Solve complex logistics and cargo challenges the easy way.. [Online]
Available at: https://www.jadelogistics.com/wp-content/uploads/2018/06/jade-logistics-master-terminal-tos-
brochure-english.pdf
Kaliszewski, A., 2018. Fifth and sixth generation ports (5GP, 6GP) - evolution of economic and social roles
of ports. [Online]
Available at:
https://www.researchgate.net/publication/324497972_FIFTH_AND_SIXTH_GENERATION_PORTS_5GP_
6GP_-_EVOLUTION_OF_ECONOMIC_AND_SOCIAL_ROLES_OF_PORTS
[Accessed December 2018].
Keretho, S. & Pikart, M., 2013. Trends for collaboration in international trade: Building a common Single
Window Environment, Geneva: Joint United Nations Regional Commission Approach to Trade Facilitation.

Deliverable No 3.1 – Stakeholders and market analysis report
Version 1.0 – 12-FEB-2019 – PIXEL© – Page 67 of 69
Lee, P. T.-W. & Lam, J. S. L., 2016. Developing the Fifth Generation Ports Model. In: Dynamic Shipping and
Port Development in the Globalized Economy. London: Palgrave Macmillan.
Lopez, E., 2018. Ocean carrier reliability rebounds after record lows in early 2018. [Online]
Available at: https://www.supplychaindive.com/news/ocean-carrier-reliability-May-2018-upswing/527711/
[Accessed December 2018].
Lu, B. & Wang, S., 2017. Container Port Production and Management. Beijing: Science Press.
Lucintel, 2018. Global Marine Port and Service Market by service and region 2018-2023| Lucintel. [Online]
Available at: https://www.lucintel.com/marine-port-and-service-
market.aspx?gclid=Cj0KCQiA7IDiBRCLARIsABIPohjrTxjOjanMCTK9ZeRRuOgZUi7WDms12qk6VT6Ja
GBzsNKtu2IYgjIaAkmQEALw_wcB
[Accessed December 2018].
MedCruise, 2019. MedCruise | The Association of Mediterannean Cruise Ports. [Online]
Available at: http://www.medcruise.com/
[Accessed January 2019].
Merk, O., 2010. The Competitiveness of Global Port-Cities: Synthesis Report, s.l.: OECD.
Merk, O. & Dang, T.-T., 2012. Efficiency of World Ports in Container and Bulk Cargo (oil, coal, ores and
grain), Paris: OECD Publishing.
Mooney, T., 2015. DP World: Automation, innovation to define ports sector as growth slows, s.l.: DP World.
Navarro, C. et al., 2011. Multimodal Innovation for Sustainable Maritime & Hinterland Transport - Best
Practice Guide on Single Windows, e-Maritime and Port Community System, s.l.: Port Integration.
Navis, 2019. N4 Terminal Operating System. [Online]
Available at: https://www.navis.com/en/products/terminal-solutions/n4-terminal-operating-system/
[Accessed January 2019].
Nightingale, L., 2015. Tesco raises concern over bigger boxships. [Online]
Available at: https://lloydslist.maritimeintelligence.informa.com/LL017225/Tesco-raises-concern-over-
bigger-boxships
[Accessed December 2018].
Notteboom, T. & Rodrigue, J.-P., 2008. The future of containerization: Perspectives from maritime and inland
freight distribution. GeoJournal, February, Volume 74, pp. 7-22.
OECD/ITF, 2017. ITF Transport Outlook 2017, Paris: OECD Publishing.
OECD, 2011. Environmental Impacts of International Shipping: The Role of ports. s.l.:OECD Publishing.
Olmer, N. et al., 2017. Greenhouse gas emissions from global shipping, 2013-2015, s.l.: The International
Council on clean transportation.
Oniszczuk-Jastrząbek, A., Pawlowska, B. & Czermanski, E., 2018. Polish sea ports and the Green Port
concept. SHS Web of Conferences.
Portbase, 2018. How it works - Portbase. [Online]
Available at: https://www.portbase.com/en/port-community-system/
[Accessed December 2018].
Portbase, 2018. Pricing - Portbase. [Online]
Available at: https://www.portbase.com/en/port-community-system/pricing/
[Accessed January 2019].
Portopia, 2016. portopia. [Online]
Available at: http://www.portopia.eu/
[Accessed December 2018].
Ports of Stockholm and Cardiff University / MESP Swansea, 2013. Environmental Port Index - Integrating
port and shipping interests, Swansea: Clean Baltic Sea Shipping.
Deliverable No 3.1 – Stakeholders and market analysis report
Version 1.0 – 12-FEB-2019 – PIXEL© – Page 68 of 69
PPRISM, 2010. PPRISM - Home. [Online]
Available at: http://pprism.espo.be/
[Accessed December 2018].
Puertos del Estado, 2004. Actualizacion de la metodologia de Analisis y Evaluacion Economico-Financiera de
los Proyectos de Inversion del Sistema Portuario de Interes General - Anejos D, E, F, G, H, I. [Online]
Available at: http://www.puertos.es/Lists/Licitaciones/Attachments/237/anejosmemoriapags45-124.pdf
RBS - EMEA, 2018. Container Terminal Operating System. [Online]
Available at: https://www.rbs-emea.com/glossary/container-terminal-operating-system-tos/
RBS EMEA, 2019. References | RBS EMEA. [Online]
Available at: https://www.rbs-emea.com/references-customers/
[Accessed January 2019].
RBS EMEA, 2019. TOPS Advance | RBS EMEA. [Online]
Available at: https://www.rbs-emea.com/products/tops-advance/
[Accessed January 2019].
Rodrigue, J.-P., 2018. The geography of port terminal automation. [Online]
Available at: https://www.porteconomics.eu/2018/10/08/the-geography-of-port-terminal-automation/
[Accessed December 2018].
SAFETY4SEA, 2018. MSC mega container ships to feature 23,000 TEUs. [Online]
Available at: https://safety4sea.com/msc-mega-container-ships-to-feature-23000-teus/
[Accessed December 2018].
SAS, 2017. Open Source vs Proprietary: What organisations need to know, s.l.: SAS.
Sheppard, C., 2019. World Seas: An Environmental Evaluation: Volume III: Ecological Issues and
environmental impacts. s.l.:Elsevier.
Ship technology, 2017. Antwerp Port Authority and FPIM to buy stake in NxtPort. [Online]
Available at: https://www.ship-technology.com/news/antwerp-port-authority-fpim-buy-stake-nxtport/
[Accessed January 2019].
Sinha, R., 2017. The future trends and the role of Information and communication technology (ICT) in Port &
Logistics Operations. [Online]
Available at: https://www.linkedin.com/pulse/future-trends-role-information-communication-technology-
ranjan-sinha
Siu Lee Lam, J. & Notteboom, T., 2014. The Greening of Ports: A Comparison of Port Management Tools
Used by Leading Ports in Asia and Europe. Transport Reviews.
Talley, W. K., 2007. Port performance: an economics perspective. In: Devolution, Port Governance and Port
Performance - Research in Transportation Economics, Volume 17. s.l.: Elsevier Ltd, pp. 499-516.
Technavio, 2017. Global Ports and Terminal Operations Market - Size, Projections, Drivers, Trends,
Vendors, and Analysis Through 2021, s.l.: Technavio.
TGI MS, 2019. TGI Maritime Software – Smart solutions for SMTs. [Online]
Available at: https://www.tgims.com/en/#nos-produits
[Accessed January 2019].
The Maritime Executive, 2018. Maersk Sets Net Zero CO2 Emission Target by 2050. [Online]
Available at: https://www.maritime-executive.com/article/maersk-sets-net-zero-co2-emission-target-by-2050
[Accessed December 2018].
United Nations Conference on Trade and Development - Secretariat, 1992. Port marketing and the challenge
of the third generation port, s.l.: UNCTAD.
United Nations Conference on Trade and Development - Secretariat, 1999. Technical note: Fourth-generation
port. Ports Newsletter No. 19, November, pp. 9-12.
Deliverable No 3.1 – Stakeholders and market analysis report
Version 1.0 – 12-FEB-2019 – PIXEL© – Page 69 of 69
United Nations Conference on Trade and Development, 2014. Review of Maritime Transport, s.l.: United
Nations Conference on Trade and Development.
United Nations Conference on Trade and Development, 2017. Review of Maritime Transport, s.l.: United
Nations Publication.
Uria Menendez, 2012. Guía sobre Legislación Portuaria. [Online]
Available at:
https://www.uria.com/documentos/publicaciones/3794/documento/guia_Portuaria_UM.pdf?id=4576
[Accessed December 2018].
Valenciaport PCS, 2018. VALENCIAPORTPCS.NET TARIFFS. [Online]
Available at: https://www.valenciaportpcs.com/media/1123/tariffs_valenciaportpcs.pdf
[Accessed January 2019].
ValenciaportPCS, 2016. Community | ValenciaportPCS. [Online]
Available at: https://www.valenciaportpcs.com/en/community/
[Accessed December 2018].
Wackett, M., 2018. Global fleet capacity to bulge as more containerships are delivered in 2018. [Online]
Available at: https://theloadstar.co.uk/global-fleet-capacity-bulge-containerships-delivered-2018/
[Accessed December 2018].
Walker, T. R. et al., 2018. Environmental Effects of Marine Transportation. In: World Seas: An
Environmental Evaluation. s.l.:Elsevier, pp. 505-530.
Wang, T.-F., Cullinane, K. & Song, D.-W., 2005. Container Port Production and Economic Efficiency. New
York: Palgrave Macmillan.
World Ports Climate Initiative, 2010. Environmental Ship Index (ESI) - An Instrument to measure ships' air
emission performance, s.l.: s.n.
World Shipping Council, 2018. Top 50 World Container Ports. [Online]
Available at: http://www.worldshipping.org/about-the-industry/global-trade/top-50-world-container-ports
[Accessed December 2018].