Embed Size (px)
Citation preview

ACT ELEGANCY, Project No 271498, has received funding from DETEC (CH), FZJ/PtJ (DE), RVO (NL), Gassnova (NO), BEIS (UK), Gassco AS and Statoil Petroleum AS, and is cofunded by the European Commission under the Horizon 2020 programme, ACT Grant Agreement No 691712.
Grant Agreement Number: 271498
Action acronym: ELEGANCY
Action full title: Enabling a Low-Carbon Economy via Hydrogen and CCS
Type of action: ERA-Net ACT project
Starting date of the action: 2017-09-01 Duration: 36 months
D3.2.1 Interim report detailing the regulatory, fiscal, and macro-
economic background for each case study
Date: 2018-04-30
Organization name of lead participant for this deliverable: First Climate (Switzerland) AG
ACT ELEGANCY, Project No 271498, has received funding from DETEC (CH), FZJ/PtJ (DE), RVO (NL), Gassnova (NO), BEIS (UK), Gassco AS and Statoil Petroleum AS, and is cofunded by the European
Commission under the Horizon 2020 programme, ACT Grant Agreement No 691712.
Dissemination Level PU Public X CO Confidential , only for members of the consortium (including the Commission Services)


Page iii
Deliverable number: D3.2.1 Deliverable title: Interim report detailing the regulatory, fiscal, and macro-economic
background for each case study Work package: WP3 Business case development for H2-CCS integrated chains Lead participant: University of Oslo
Authors Name Organisation E-mail Mischa Repmann* First Climate [email protected] Jonathan Schwieger First Climate [email protected] Catherine Banet** University of Oslo [email protected] Ward Goldthorpe*** Sustainable Decisions [email protected] Lionel Avignon Sustainable Decisions [email protected] *Lead author, **Lead author Regulatory work, ***Lead author business parameters & opportunities, market failures
Keywords Business case development framework; Case study parameters; Regulatory background; Market background; Business drivers; Market failures; Macroeconomic and fiscal indicators
Abstract This interim report presents the work status of the Business Case Development work under the ELEGANCY project. It introduces the overall methodology that is characterized by a number of steps to i) define the scope of the H2-CCS chain subject to a particular ELEGANCY case study, ii) perform a focussed market background review and gap analysis, iii) identify business and investment risk and corresponding risk mitigation strategies, and iv) develop business models. Steps i) and ii) are covered in this interim report.
First, service options and end-user markets within the H2-CCS integrated chain are identified and characterized. Then the regulatory and market background is provided for each of the five case study countries. Markets of relevance for the case study scopes were assessed using spreadsheet tools to collect inputs from ELEGANCY partners and external stakeholders on existing businesses, major R&D activities, key players, on the strength of a selection of business drivers in promoting the existing markets, as well as on the prevalence of market failures in a given country context. Lastly, the multiple inputs received to the spreadsheet tools for the various countries are merged into a ‘consolidated expert opinion’ versions and key trends/takeaways are extracted. The results are presented by drawing cross-sector and cross-country comparisons.

Page v
TABLE OF CONTENTS
Page
ABBREVIATIONS ......................................................................................................................... 1
1 INTRODUCTION ................................................................................................................... 3
1.1 The ELEGANCY Project ............................................................................................. 3
1.2 ELEGANCY WP3: Objectives and Focus of the Report ............................................. 4
2 METHODOLOGY .................................................................................................................. 6
2.1 Overview ...................................................................................................................... 6
2.2 H2-CCS Chain Parameters ............................................................................................ 8
2.3 Regulatory Background Assessment ............................................................................ 9
2.4 Market Background Assessment ................................................................................ 11
2.5 Market Failure Assessment ........................................................................................ 13
2.6 Information sources, Interfaces, Update ..................................................................... 15
3 H2-CCS BUSINESS OPTIONS ............................................................................................ 17
3.1 Background on Hydrogen and CCUS ........................................................................ 17
3.2 Flow Sheet and Business Tree .................................................................................... 19
3.3 Hydrogen Infrastructure Services: Markets and Opportunities .................................. 24
3.4 CCS Infrastructure Services: Markets and Opportunities .......................................... 25
3.5 Hydrogen Utilization: Markets and Opportunities ..................................................... 26
3.6 CO2 Utilization: Markets and opportunities ............................................................... 37
4 BACKGROUND AT INTERNATIONAL AND EU LEVEL ............................................. 43
4.1 Generic Case Study Parameters .................................................................................. 43
4.2 Regulatory Background: International Level ............................................................. 50
4.3 Regulatory Background: EU Level ............................................................................ 57
5 NATIONAL BACKGROUND: INTRODUCTION ............................................................. 66
6 THE NETHERLANDS ......................................................................................................... 68
6.1 Dutch case study parameters ...................................................................................... 68
6.2 Regulatory Background: National Level .................................................................... 70
6.3 Market Background .................................................................................................... 71
7 SWITZERLAND ................................................................................................................... 78

Page vi
7.1 Swiss case study parameters ....................................................................................... 79
7.2 Regulatory Background: National Level .................................................................... 81
7.3 Market Background .................................................................................................... 82
8 UNITED KINGDOM ............................................................................................................ 91
8.1 UK case study parameters .......................................................................................... 91
8.2 Regulatory Background: National Level .................................................................... 93
8.3 Market Background .................................................................................................... 93
9 GERMANY ......................................................................................................................... 101
9.1 German case study parameters ................................................................................. 102
9.2 Regulatory Background: National Level .................................................................. 102
9.3 Market Background .................................................................................................. 103
10 NORWAY ........................................................................................................................... 111
10.1 Norwegian case study parameters ............................................................................ 111
10.2 Regulatory Background: National Level .................................................................. 112
10.3 Market Background .................................................................................................. 113
11 CONCLUSIONS ................................................ ERROR! BOOKMARK NOT DEFINED. APPENDIX ................................................................................................................................. 122
A ADDITONAL INFORMATION ON DATA SOURCES ................................................... 122
A.1 Compilation of Case Study Parameters .................................................................... 122
A.2 Participants Workshop 1&2 ..................................................................................... 123
A.3 List of Legislation and Literature for Regulatory Assessment ................................. 124
A.4 Data Gathering Tools ............................................................................................... 126
A.5 Respondents to Tools ............................................................................................... 126
B COUNTRY CONTEXT DATA SHEETS .......................................................................... 127
B.1 The Netherlands ........................................................................................................ 127
B.2 Switzerland ............................................................................................................... 130
B.3 The United Kingdom ................................................................................................ 134
B.4 Germany ................................................................................................................... 137
B.5 Norway ..................................................................................................................... 140

Page 1
ABBREVIATIONS
AFC Alkaline Fuel Cell
APU Auxiliary Power Unit
BEV Battery Electric Vehicle
C&I Commercial and Industrial
CCS Carbon Capture and Storage
CCUS Carbon Capture, Utilization and Storage
CER Certified Emissions Reduction
CDM Clean Development Mechanism
CH4 Methane
CHP Combined Heat and Power
CNG Compressed Natural Gas
CO2 Carbon Dioxide
CPG CO2 Plume Geothermal
DME Dimethyl Ether
DMFC Direct Methanol Fuel Cell
EC European Commission
ECBM Enhanced Coal Bed Methane recovery
ECT Energy Charter Treaty
EGR Enhanced Gas Recovery
EOR Enhanced Oil Recovery
ETS Emission Trading Scheme
EV Electric Vehicle
FC Fuel Cell
FCEB Fuel Cell Electric Bus
FCEV Fuel Cell Electric Vehicle
FID Final Investment Decision
GoO Guarantees of Origin
gridE Grid Electricity
GT Gas Turbine
GTR Global Technical Regulation
H2 Hydrogen

Page 2
HFC Hydrogen Fuel Cell
HFC(E)V Hydrogen Fuel Cell (Electric) Vehicle
HRS Hydrogen Refuelling Station
IGCC Integrated Gasification Combined Cycle power plant
IPCC Intergovernmental Panel on Climate Change
ISO International Organization for Standardization
JRC Joint Research Centre (EC)
LCA Life Cycle Analysis
MCFC Molten Carbonate Fuel Cell
NDC Nationally Determined Contribution
NG Natural Gas
OME Oxymethylene Dimethyl Ether
P2G Power to Gas
P2L Power to Liquids
P2X Power to X (X = gaseous or liquid energy carrier)
PAFC Phosphoric Acid Fuel Cell
PCC Precipitated Calcium Carbonate
PCI Project of Common Interest (EU)
PEMFC Proton Exchange Membrane Fuel Cell
PoR Port of Rotterdam
RE Renewable Energy/Electricity
SMR Steam Methane Reforming
SOFC Solid Oxide Fuel Cell
TFEU Treaty on the Functioning of the European Union
UNECE United Nations Economic Commission for Europe
UNFCCC United Framework Convention on Climate Change
VPSA Vacuum Pressure Swing Adsorption
WGS Water Gas Shift reaction
WP Work Package
WTO World Trade Organisation
ZEP Zero Emission Platform
Page 3
1 INTRODUCTION 1.1 The ELEGANCY Project Delivering large-scale CCS chains in Europe requires more than technology development and cost reductions, as has been demonstrated by the Norwegian Carbon Capture Mongstad project1 and most recently by the UK commercialization programme2. Policymakers have yet to reduce the investment barriers preventing companies entering the sector, and there is a now a recognised need for business models comprising practical commercial structures and agreements between the various participants in CCS constituent projects. Such business models need to be supported by appropriate policy and funding mechanisms. Better and more cost effective equipment, processes and engineering will inevitably lower costs across the CCS chain and deliver economies of scale in clusters and networks. However, the speed of CCS deployment required to meet climate targets and decarbonize the economy is not going to be delivered solely through market forces and technology innovation.
Previous research studies3,4,5 and large scale initiatives by the industry6,7,8 have primarily been focused on investment and delivery of CCS for power generation, while much less attention has been paid to the practical implementation of CCS in other sectors such as industry, heat and transport. Among the latter are the on-going Tees Valley initiative in the UK9, the Norwegian industrial CCS studies and the Port of Rotterdam climate initiative10. A common conclusion from all this work is that under current regulatory and policy frameworks across Europe, significant market barriers and market failures exist that discourage and prevent investment in the constituent CO2 capture, transport and storage projects that make up the CCS infrastructure chain.
The ELEGANCY project is dedicated to the novel concept of using H2-CCS integrated chains as a means of increasing the business value proposition for CCS infrastructure deployment. Apart from research on particular technological elements (work packages WP1 and WP2) and techno-economical modelling (work package WP4), the project includes business case development work (work package 3) and societal research. The latter – alongside outputs and methods from WP1-4 – is applied to five case studies that are tailored to the needs and context of the five participating countries Germany, the Netherlands, Norway, Switzerland, and the UK (work package WP5).
1 www.tcmda.com/en/ 2 Dixon, P., & Mitchel, T. (2016). Lessons learned - Lessons and evidence derived from I CCS programmes, 2008-2015. London, UK: Carbon Capture and Storage Association. Retrieved from http://www.ccsassociation.org/press-centre/reports-and-publications/ 3 Goldthorpe, W., Ahmad, S., Eldering, L., Sannes, O., Baker, A., Grosvenor, D., .Dean, T. (2016). A need unsatisfied - Blueprint for enabling investment in CO2 storage. London, UK: Deloitte/The Crown Estate. 4 Hare, P., Davies, G., & Murray, S. (2013). Options to incentivise UK CO2 transport and storage. Oxford, UK: Pöyry/The Crown Estate. 5 ZEP. (2014). Business models for commercial CO2 transport and storage. Bruxelles, Luxembourg: Zero Emissions Platform. 6 Heap, R. (2016). Potential Role of H2 in the UK Energy System. London, UK: Energy Research Partnership. 7 MPE. (2016). Feasibility study for full-scale CCS in Norway. Ministry of Petroleum and Energy. 8 Sadler, D., Cargill, A., Crowther, M., Rennie, A., Watt, J., Burton, S., & Haines, M. (2016). H21 Leeds City Gate Report. Leeds, UK. 9 www.teessidecollective.co.uk/teesside-collective-blueprint-for-industrial-ccs-in-the-uk/ 10 van Engelenburg, B., & Noothou, P. (2013). The ‘Six Commandments’ for regional CCS developers. Greenhouse Gas Science & Technology, 3, 427-30.

Page 4
1.2 ELEGANCY WP3: Objectives and Focus of the Report For optimal chain integration, there is a need for combined work on regulatory, commercial and technology issues. New risks and issues will come into play when the CCS chain is interfaced with a demand driven H2 network. Within ELEGANCY, WP3 investigates the regulatory, commercial, financial and business innovation needed to make H2-CCS chains investible ahead of sufficiently high carbon prices that would drive investment choices. More specifically, WP3 will investigate the macro-economic level, i.e. the current market and regulatory situation, as well as the elements that will eventually make up viable business models, i.e. suitable commercial structures, responsibilities and allocation of risk, risk mitigation strategies as well as incentive mechanisms. Special attention will be paid to the contractual handling of performance obligations and liabilities, to the role of public private partnerships in stimulating investors’ appetite, as well as to the role of carbon pricing mechanisms and carbon finance approaches.
WP3 has the following Main Objective:
To develop a business case framework that comprises
• assessment tools for the legal, market, and risk environment, as well as • a suite of optional elements for business model selection and the development of a
corresponding business case;
with the intention for users to apply this framework
• within ELEGANCY in the WP5 case studies, and • beyond ELEGANCY in any other European country exploring the H2-CCS chain for
business opportunities.
Three Sub-Objectives are defined as follows:
1. Assess the regulatory background relevant to integrated H2-CCS chains with focus on the five case study countries.
2. Assess the macro-economic, market and fiscal background relevant to integrated H2-CCS chains with focus on the five case study countries.
3. Develop business models and business case templates that identify value, responsibilities and allocation of risk through the integrated chain and between the public and private sectors.
The present interim report, Deliverable D3.2.1, covers Sub-Objective 1 and 2 and presents the work carried out up to now by the partners in WP3. This includes the Deliverable D3.1.1-Regulatory background assessment, compiled by the University of Oslo, as well as intermediate deliverables to the UK funding authorities prepared by Sustainable Decisions, namely a first appraisal of business options, a set of H2-CCS value chain parameters, and work to assess market failures.
Chapter 2 introduces the methodological approach for the mapping of business options and parameters, as well as for the assessment of the regulatory and market background and market failures – including the data gathering tools that were designed for the purpose of these assessments.
Chapter 3 provides the system overview for H2-CCS chains and a compilation of business options within the chains.

Page 5
Chapter 4 presents a set of generic parameters relevant for the H2-CCS chain and its interface with the larger energy system, as well as the assessment of the regulatory and market background as of today from a general, pan-European perspective.
Chapter 5 presents case study parameters as well as the regulatory and market background as of today for each of the five case study countries.
Chapter 6 wraps up the findings and their implications for the further steps in the development of the Business Case Framework under WP3.

Page 6
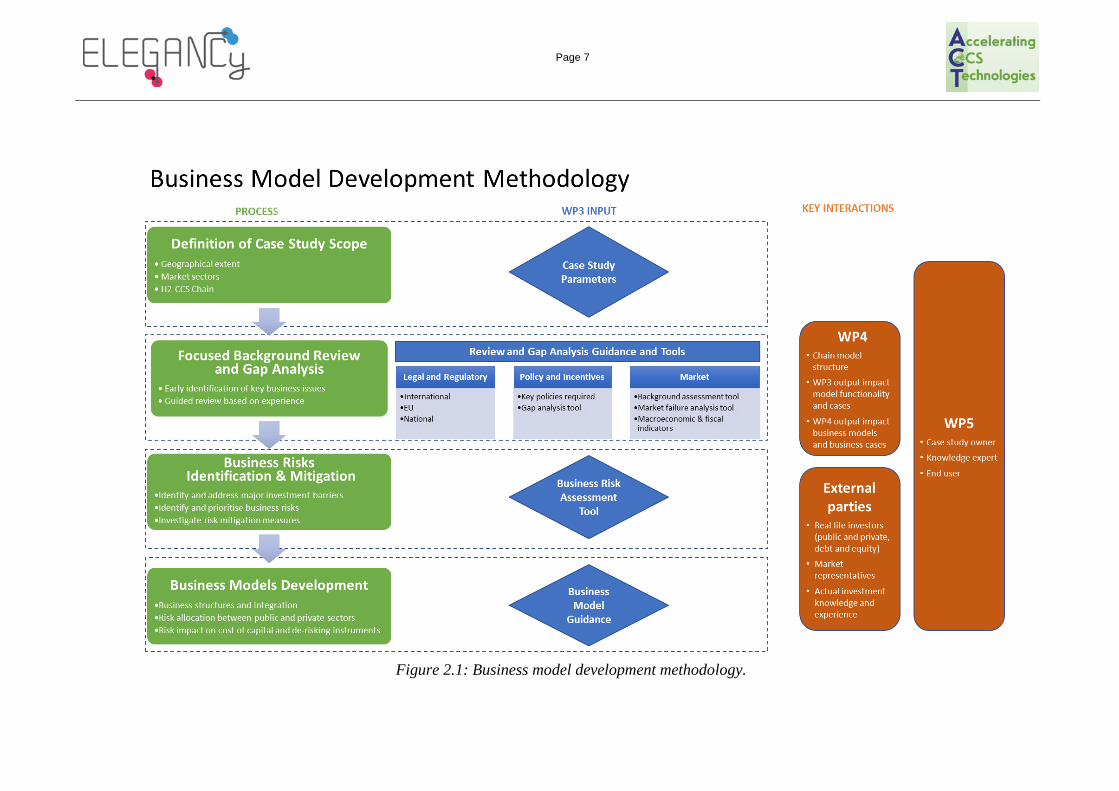
2 METHODOLOGY 2.1 Overview The overall methodology developed and applied by WP3 to select business models and assess potential business cases for H2-CCS opportunities is presented in Figure 2.1. The process is divided into a number of distinct steps:
Step 1: Definition of the scope of the particular H2-CCS chain for the relevant case study
The process commences with an initial focus on defining the case study scope with respect to the specific H2-CCS chain technical sub-components, business segments, and associated market sectors of main interest, the geographical extent (including industrial hubs, production facilities, storage areas, end-users, cross-border interactions, etc.), and market potential.
The WP3 partners have created a standardised framework for any case study lead organisation to use in this first step that matches the needs of the scope definition exercise described above. This framework comprises an extensive set of potentially relevant generic H2-CCS chain parameters and particular case study parameters, the technology elements and market sectors illustrated in a flow sheet, and a comprehensive categorization of H2-CCS business options in the form of an overview table, hereinafter called the H2-CCS chain business tree. This framework and analysis is to be used side-by-side with the scenarios and quantitative estimates of market potentials undertaken in WP5 Task 5.1 – Interfaces.
Step 2: Focussed market background review and gap analysis
The purpose of this second step is to guide an overall assessment of the market background for any case study in preparation for the third step of understanding investability and handling of business risks.
A set of spreadsheet tools has been designed and produced, based on the project development experience gained over a number of years in countries such as Netherlands, Norway and UK, to facilitate a simple high-level analysis of the major drivers for each of the H2-CCS chain market sectors and business segments. The market background includes the legal and regulatory environment, the market fundamentals and drivers, as well as the a first appraisal of the applicable market failures. An additional tool has been designed to support a systematic analysis of the policy status and financial support mechanisms prevalent in the geographical extent of interest for a given case study.
Step 3: Business and investment risk identification and mitigation
Step 4: Business model development
The latter two steps in the overall methodology are part of and described in more detail in WP3’s deliverable D3.3.1.
Page 7
Figure 2.1: Business model development methodology.

Page 8
2.2 H2-CCS Chain Parameters The compilation of H2-CCS chain parameters has been undertaken as a desktop study based on expert knowledge of the physical and commercial development and operation of value chain systems and infrastructure. This knowledge has been applied to a number of public and private sector reports related to hydrogen technologies and market development, and to CCS project and infrastructure delivery in the case study countries.
A useful list of publicly available reports is included in Table A.1 in Appendix A. This collection is not exhaustive but provides an entry point into a substantial amount of contemporary literature related to hydrogen and CCS that provides a useful backdrop for understanding the selection of case study parameters reported here.
Insights into important parameters for CCS delivery have also been gained from the substantial knowledge sharing literature produced by government-supported projects and programmes in the Netherlands, Norway, the United Kingdom and the European Energy Programme for Recovery along with various national and European Commission audits and post-implementation reviews.
2.2.1 Generic Parameters The compilation of H2-CCS chain parameters consists of two parts. The first part spans a comprehensive set of generic parameters that has been divided into eight sub-sets of interrelated qualitative and quantitative characteristics and metrics as follows:
1. CO2 Abatement and Supply Potential 2. Markets: Supply & Demand 3. Market Structure: Gas, Electricity, Fuels 4. H2-CCS Infrastructure Chain Design, Deployment and Operability 5. H2-CCS Infrastructure Chain Operability 6. Commercial and Financial 7. Regulation and Policy 8. Social and Environmental
The set of generic parameters is reported in Section 4 – General Background.
2.2.2 Specific Parameters for each WP5 Case Study Specific instances of the generic parameters that provide an additional level of detail for the ELEGANCY case studies in each of the national contexts have also been collated. These specific parameters reflect answers to the questions why?, what? and how? for H2-CCS chain investment and deployment. The responses and their priorities are grouped into three corresponding sets:
1. Climate Business Context 2. Markets 3. Delivery
Page 9
2.3 Regulatory Background Assessment This assessment aims to identify the legal background relevant to the different components of the H2-CCS chain that will be applicable to the case study countries. It will also serve in assessing the need for regulatory development on a supra-national level.
The exact design of the H2-CCS chain is evolving, and it is a research objective of ELEGANCY to further identify its shape and components, as well as its legal, technical and economic rationale. The regulatory assessment also takes into account the different scenarios for the H2-CCS chain, such as: mixed H2-natural gas vs. pure H2 grids; how will H2 be transported; distributed or centralised H2 production; geographical location of production units; where will H2 be produced; optimised CO2 networks development, how will H2 be used. Therefore, the regulatory assessment will be regularly updated and adjusted to take into account the results from other WPs in terms of value chain, the feedback from the project partners and any new changes in the regulatory framework.
2.3.1 Scope and Structure A key objective of the regulatory assessment is to identify both legal bottlenecks and legal incentives in the development of a H2-CCS chain. To this end, the scope of the research is international, European and national law. Although the most part of the legal questions raised is based on public law, the assessment will also raise questions which pertain to private law when applicable. The latter questions relate notably to contractual arrangements, which may vary according to the national jurisdiction (common law vs. civil law), according to the case study country.
The legal screening exercise undertaken in this assessment is focusing on the definition of the operations within the H2-CCS chain, in the light of the specificities of the five national case studies. Therefore, the assessment covers legislation applicable to the following sectors: electricity and gas, heating, transport and industry.
The assessment also focuses on the interaction between CCS and hydrogen, and not CCS and hydrogen as separate activities. Meanwhile, certain aspects related to H2 and CO2-transport, injection or storage taken separately need to be addressed when they form part of the chain. The research is also primarily based – as described in the project proposal – on existing fuel and transport infrastructures.
As to the interaction between CCS and H2, it is useful to remind, as noted by the International Energy Agency (IEA), that while the most long-term potential CO2 emission reductions from CCS projects are associated with the capture and storage of CO2 from combustion of fossil fuels, the short-term CCS potential is in different areas: “These include enhanced oil recovery (EOR) projects and capture-ready streams of CO2 from natural gas processing and industrial processes such as refineries, ammonia and hydrogen plants.”11 Building a business model for the H2-CCS chain should therefore take into account this difference in time perspective, between long-term and short-term benefits and opportunities.
Similarly, it is worth noting that there not one H2-CCS value chain, but more exactly several potential H2-CCS value chains, applicable to different sectors. While this implies a potentially
11 International Energy Agency, “Carbon Capture and Storage in the CDM”, Environment Directorate, COM/ENV/EPOC/IEA/SLT(2007)10, Nov. 2007.

Page 10
very broad scope of research in terms of legal scrutiny, the national case studies will be instrumental in defining the exact nature of the H2-CCS value chains to be examined.
The regulatory assessment is structured around the three main levels of legal requirements which are: international, European and national. The underlying bibliography including a list of legislation is attached in Appendix A.
2.3.2 Regulatory uncertainty due to ongoing processes An important remark as to the scope of the research is the changing legal background. Different changes in the legislation are expected to enter into force within the three-year lifetime of the ELEGANCY project or shortly after its termination. Immediate regulatory changes relate primarily to the negotiations at EU level of the “Clean Energy Package for All Europeans”-legislative package (see Section 4.2) and the negotiations around Brexit (see Section 8.2). One should also expect the adoption of detailed rules for the implementation of the Paris Agreement and the different carbon mechanisms defined in it (Art. 6) by 2020 (see Section 4.2), which will be by the end of the ELEGANCY-project period. The regulatory assessment would not have been complete without mentioning those upcoming legal and regulatory changes. They also form part of the regulatory uncertainty of any new technology and business activities under development and need to be addressed as a separate risk factor. As the negotiation process is still ongoing, it is too early to assess their impacts. At least, a preliminary assessment of the changes adopted to the EU legislation could be performed in early 2019.

Page 11
2.4 Market Background Assessment This tool is designed to facilitate the qualitative and quantitative assessment of the prevailing market background for the H2-CCS integrated value chain of a given country and/or case study. It does not ask for estimates about market potential or any hypothetical situation, but requires the user to simply describe the present situation and to provide ratings correspondingly.
The tool consists of tabs providing the user with guidance and orientation, followed by five tabs (numbered I.-V.) containing modules with questions about the market players, market structure, the existence and strength of business drivers, and about the market-relevant country context. Each tab is further described in the following list:
• H2-CCS Flow Sheet: This tab contains a flow sheet of the integrated H2-CCS chain as covered within the ELEGANCY project, as well as an additional flow sheet showing the alternative/competing/complementary elements affecting the H2-CCS value chain. This serves to position the case study within the overall project scope. The flow sheets are presented in Section 3 below.
• H2-CCS Business Tree: This tab contains an overview table of the business opportunities, categorized into I.) H2 production and infrastructure service options, II.) CO2 capture and infrastructure service options, III.) H2 utilization options, IV.) CO2 utilization options. Also this tab serves for the orientation of the user within the H2-CCS chain, and the full table is present in Section 3.
• I. H2 Infrastructure: This tab covers the supply side of the H2 part of the H2-CCS chain, split into the three segments Production, Transmission/Distribution, and Storage. A first module of questions asks the user to select the business options of relevance to him or to his case study: "present", "niche application", and "not present". For those options that are marked present (and voluntarily also for those identified as "niche applications"), the user is asked to provide qualitative information about the corresponding market players and their interactions. A second module of questions asks the user to evaluate the strength of certain business drivers (Cf. below) in promoting the business options selected in the first module: "strong driver", "medium driver", "weak driver", "not a driver", and "negative driver". A "negative driver"-rating is appropriate should the listed business driver in fact hamper H2 supply and infrastructure services rather than drive them.
• II. CCS Infrastructure: This tab covers the supply side of the CCS part of the H2-CCS chain. It has the same structure as described above for the Tab I. H2 infrastructure.
• III. H2 Utilization: This tab covers the demand side of the H2 part of the H2-CCS chain, split into the four market sectors Mobility, Industry, Decentralized Heat & Power, Centralized Heat & Power. A first module of questions asks the user to select the business options of relevance to him or to his case study, and to provide qualitative information about the corresponding market players and their interactions. A second module of questions asks the user to provide and explain a rating of the strength of certain business drivers in promoting the business options selected in the first module.
• IV. CO2 Utilization: This tab covers the demand side of the CCS part of the H2-CCS chain. It has the same structure as described above for the Tab III. H2 utilization. Note that CO2 utilization is not a primary focus of the ELEGANCY project. It is included in
Page 12
this Market Assessment tool for the sake of completeness, i.e. to cover the entire H2-CCS chain from supply to demand.
• V. Context: This is Tab covers qualitative and quantitative questions in three modules addressing the Macroeconomic and fiscal context, the Climate policy context, and the Market context for some key markets that are in relation to the H2-CCS value chain, namely the Electricity market, the Natural gas market, and the Biogas market.
In each Module, the user is asked to research/compile information and to provide an expert opinion according to the list of questions (rows) and for the business options that are relevant to his business or case study (columns). Some questions are accompanied by additional guidance notes in the rightmost column of Tabs I.-IV.
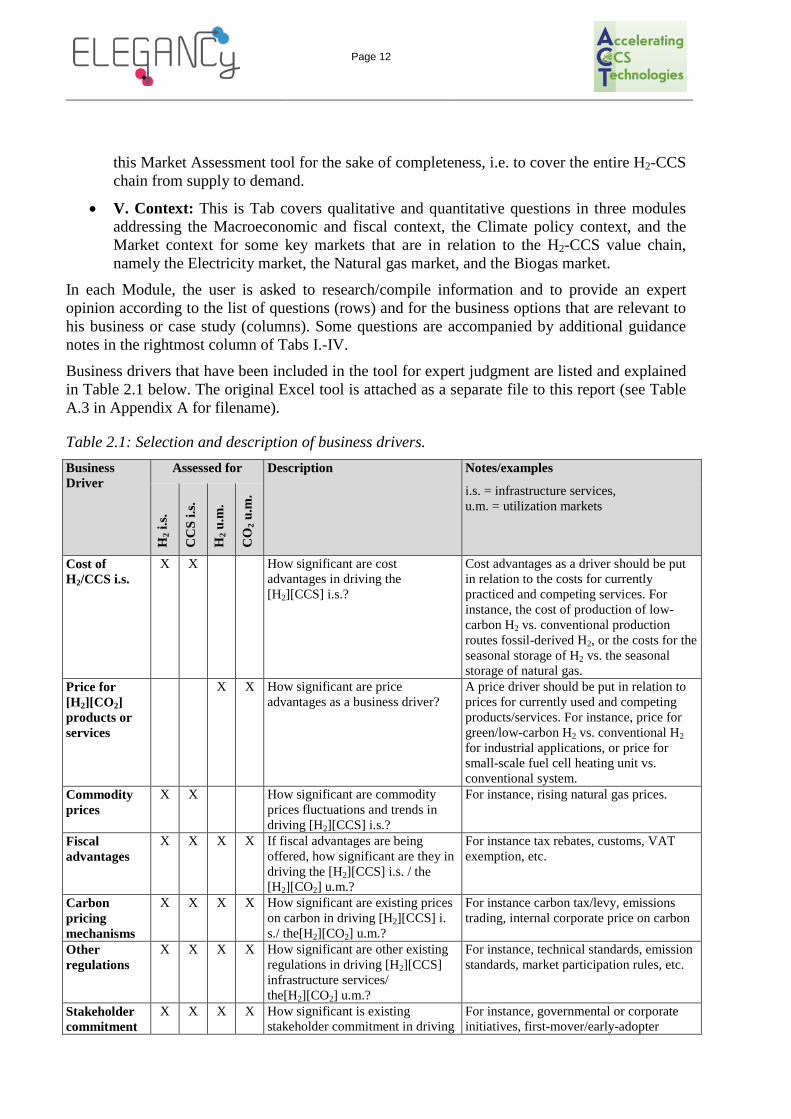
Business drivers that have been included in the tool for expert judgment are listed and explained in Table 2.1 below. The original Excel tool is attached as a separate file to this report (see Table A.3 in Appendix A for filename).
Table 2.1: Selection and description of business drivers. Business Driver
Assessed for Description
Notes/examples
i.s. = infrastructure services, u.m. = utilization markets
H2 i
.s.
CC
S i.s
.
H2 u
.m.
CO
2 u.m
.
Cost of H2/CCS i.s.
X X How significant are cost advantages in driving the [H2][CCS] i.s.?
Cost advantages as a driver should be put in relation to the costs for currently practiced and competing services. For instance, the cost of production of low-carbon H2 vs. conventional production routes fossil-derived H2, or the costs for the seasonal storage of H2 vs. the seasonal storage of natural gas.
Price for [H2][CO2] products or services
X X How significant are price advantages as a business driver?
A price driver should be put in relation to prices for currently used and competing products/services. For instance, price for green/low-carbon H2 vs. conventional H2 for industrial applications, or price for small-scale fuel cell heating unit vs. conventional system.
Commodity prices
X X How significant are commodity prices fluctuations and trends in driving [H2][CCS] i.s.?
For instance, rising natural gas prices.
Fiscal advantages
X X X X If fiscal advantages are being offered, how significant are they in driving the [H2][CCS] i.s. / the [H2][CO2] u.m.?
For instance tax rebates, customs, VAT exemption, etc.
Carbon pricing mechanisms
X X X X How significant are existing prices on carbon in driving [H2][CCS] i. s./ the[H2][CO2] u.m.?
For instance carbon tax/levy, emissions trading, internal corporate price on carbon
Other regulations
X X X X How significant are other existing regulations in driving [H2][CCS] infrastructure services/ the[H2][CO2] u.m.?
For instance, technical standards, emission standards, market participation rules, etc.
Stakeholder commitment
X X X X How significant is existing stakeholder commitment in driving
For instance, governmental or corporate initiatives, first-mover/early-adopter

Page 13
[H2][CCS] infrastructure services/ the[H2][CO2] u.m.?
attitude
Clustering X X How significant is the presence of existing clusters in driving [H2][CCS] infrastructure services?
For instance, the co-location of natural gas storage facilities that can be used for H2 storage, both on the surface (pressurized containers and in geological structures for short-term and long-term storage, respectively)
Technological advances
X X How significant are improved technical capabilities and performances in driving [H2][CCS] infrastructure services?
For instance, improved efficiency of biomass gasification vs. coal gasification for low-carbon H2 production.
Anticipation of future markets
X X How significant are strategic intentions (for the purpose of securing a competitive advantage in future markets) in driving [H2][CCS] infrastructure services?
For instance, implementing hydrogen refuelling stations next to regular petrol/diesel refuelling stations in order to establish a leadership position in future hydrogen mobility market.
Environ-mental consciousness of consumers
X X How significant is environmental consciousness in driving relevant [H2][CO2] u.m.?
For instance, preference of low-emission passenger cars over conventional petrol/diesel-fuelled models.
Social acceptance/ preference
X X X How significant is social acceptance in driving relevant CCS infrastructure services / are social preferences in driving [H2][CO2] u.m.?
‘Social acceptance’ relates to the experiences of the public with the planning/operations of CCS technologies, both positive (employment/industrial development effects, tax rate decrease, community benefits, positively perceived outreach campaigns, etc.) and negative (accidents, expropriation, citizens' initiatives, turmoil) ‘Social preferences’ relate to, e.g., social norms and habits, brand preferences, experiences with the planning/operations of H2 technologies, both positive and negative
2.5 Market Failure Assessment This tool is designed to facilitate the qualitative and quantitative assessment of market failures for the market sectors of relevance for the H2-CCS integrated chain of a given country and/or case study. Market failures are not necessarily barriers to investment. They are situations, mechanisms or activities that change or affect the dynamics of a properly functioning market and distort the ability of the market to achieve equilibrium between supply and demand without intervention.
The spreadsheet table in the tool lists the market sectors (rows) vis-a-vis a suite of market failures (columns). The market sectors are split between H2/CO2 end user markets, namely Large Stationary Power, Small Stationary Power, Mobility – Vehicles, Mobility – Other, Heat, Chemicals and Industry, Power-to-X (Storage), and H2/CO2 chain services, namely H2 Retail, H2 distribution, H2 Storage, H2 Transmission, Low-Carbon H2 Production, CO2 Capture, CO2 Gathering, CO2 Transmission, CO2 Storage. The user can decide to add additional rows in order to break down the market sectors into multiple business segments as per suggested categories taken from the standardised business tree. For example, dividing Large Stationary Power into ‘direct combustion in gas turbines’ and ‘use in stationary (stacked) fuel cells for power & heat’ (Cf. full business tree table in Section 3).
Page 14
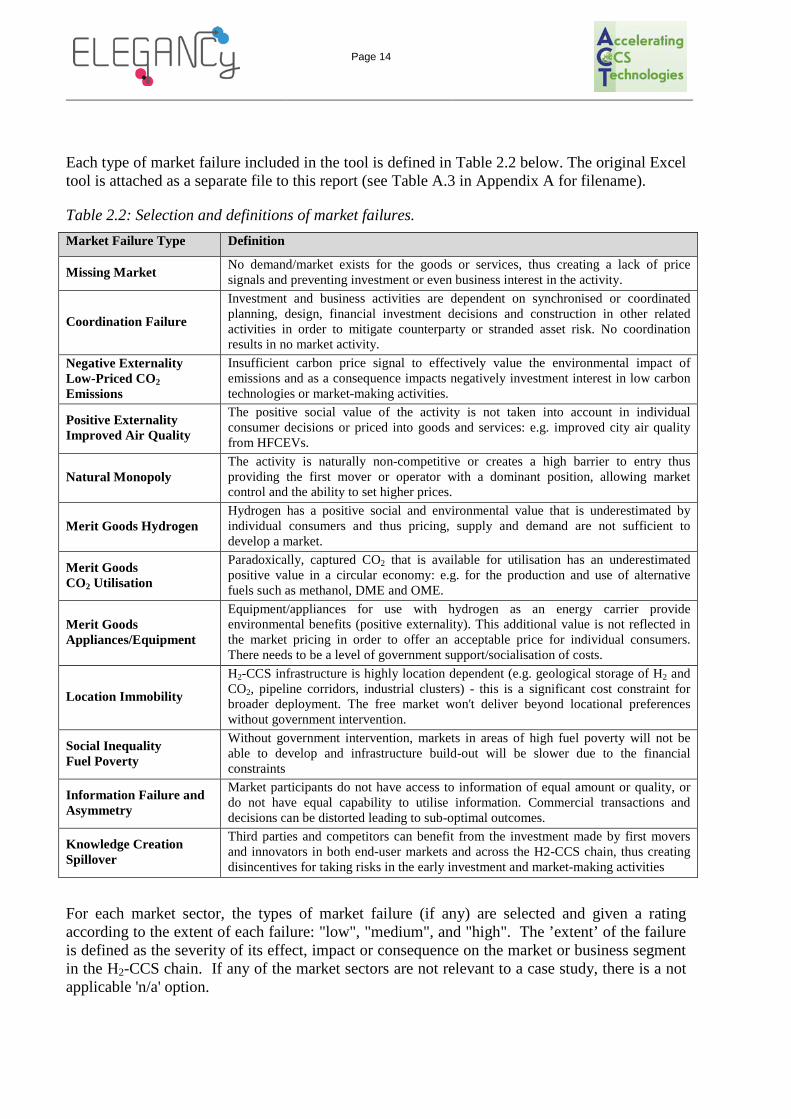
Each type of market failure included in the tool is defined in Table 2.2 below. The original Excel tool is attached as a separate file to this report (see Table A.3 in Appendix A for filename).
Table 2.2: Selection and definitions of market failures. Market Failure Type Definition
Missing Market No demand/market exists for the goods or services, thus creating a lack of price signals and preventing investment or even business interest in the activity.
Coordination Failure
Investment and business activities are dependent on synchronised or coordinated planning, design, financial investment decisions and construction in other related activities in order to mitigate counterparty or stranded asset risk. No coordination results in no market activity.
Negative Externality Low-Priced CO2 Emissions
Insufficient carbon price signal to effectively value the environmental impact of emissions and as a consequence impacts negatively investment interest in low carbon technologies or market-making activities.
Positive Externality Improved Air Quality
The positive social value of the activity is not taken into account in individual consumer decisions or priced into goods and services: e.g. improved city air quality from HFCEVs.
Natural Monopoly The activity is naturally non-competitive or creates a high barrier to entry thus providing the first mover or operator with a dominant position, allowing market control and the ability to set higher prices.
Merit Goods Hydrogen Hydrogen has a positive social and environmental value that is underestimated by individual consumers and thus pricing, supply and demand are not sufficient to develop a market.
Merit Goods CO2 Utilisation
Paradoxically, captured CO2 that is available for utilisation has an underestimated positive value in a circular economy: e.g. for the production and use of alternative fuels such as methanol, DME and OME.
Merit Goods Appliances/Equipment
Equipment/appliances for use with hydrogen as an energy carrier provide environmental benefits (positive externality). This additional value is not reflected in the market pricing in order to offer an acceptable price for individual consumers. There needs to be a level of government support/socialisation of costs.
Location Immobility
H2-CCS infrastructure is highly location dependent (e.g. geological storage of H2 and CO2, pipeline corridors, industrial clusters) - this is a significant cost constraint for broader deployment. The free market won't deliver beyond locational preferences without government intervention.
Social Inequality Fuel Poverty
Without government intervention, markets in areas of high fuel poverty will not be able to develop and infrastructure build-out will be slower due to the financial constraints
Information Failure and Asymmetry
Market participants do not have access to information of equal amount or quality, or do not have equal capability to utilise information. Commercial transactions and decisions can be distorted leading to sub-optimal outcomes.
Knowledge Creation Spillover
Third parties and competitors can benefit from the investment made by first movers and innovators in both end-user markets and across the H2-CCS chain, thus creating disincentives for taking risks in the early investment and market-making activities
For each market sector, the types of market failure (if any) are selected and given a rating according to the extent of each failure: "low", "medium", and "high". The ’extent’ of the failure is defined as the severity of its effect, impact or consequence on the market or business segment in the H2-CCS chain. If any of the market sectors are not relevant to a case study, there is a not applicable 'n/a' option.

Page 15
2.6 Information sources, Interfaces, Update 2.6.1 Information sources The research for the contents in this report builds on three primary sources of information:
1. publicly available literature such as journal articles, reports, governmental bulletins and statistics, legislation;
2. personal communications with ELEGANCY partners and external stakeholders; and 3. inputs obtained via the data gathering tools for the market background and failures
introduced in the previous subsections.
In addition, a workshop was held at the University of Oslo in March 2018 with ELEGANCY internal and external participants to peer review the assessment tools and the risk matrix developed for WP3’s deliverable D3.3.1 (see Table A.2 in Appendix A for list of participants). Recommendations have been distilled from the feedback received both on the day of the workshop and subsequently via interviews and additional participant feedback forms. Generally, the workshop helped in communicating the purpose and methodology of WP3 and in establishing interfaces between WP3 and other WP members (in particular WP4 and WP5), between representatives of the five WP5 countries, as well as with the external participants.
2.6.2 Interfaces
2.6.2.1 Interface with other work packages: WP4 – H2-CCS Chain Tool and Evaluation Methodologies for Integrated Chains: A selection of the quantitative parameters identified and reported in here will be incorporated as metrics and key performance indicators (KPI) in the chain tool developed in WP4. Some of the qualitative parameters will help to inform the tool design from a use-case perspective.
WP5 – National case studies: Since this chapter – as the rest of the WP3 work – will serve as background for the national case studies, input from WP5 participants will be sought through correspondence, meetings and workshop activities regarding the detailed scope of the five case studies that will then guide the business case development throughout the project. Parts of the market background assessment and the regulatory assessment on the national level contain general or preliminary information, and will be refined as WP5 produces its first findings and deliverables, and seeks to apply and benefit the assessment tools designed in WP3.
2.6.2.2 Interface with ERA-Net ACT ALIGN-CCUS Project and other Forums Synergies exist between the case studies of the ELEGANCY project and those of the ALGN-CCUS project. These include commercial and regulatory aspects of CO2 transport and storage infrastructure, and the development of business models and business cases to facilitate deployment and growth of markets for hydrogen used in heating, CO2 utilisation, and disposal. Wherever possible, exchange of knowledge and research results will take place. This has been agreed by the national ACT authority.
Organisations such as the European Zero Emissions Platform (ZEP), the International Energy Agency Hydrogen Agreement, the International Energy Agency Greenhouse Gas programme (IEAGHG) and the Carbon Capture and Storage Association (CCSA) have working groups on subjects that may be of relevance to the ELEGANCY case studies. These will be engaged in ways to sense check or assist with the review and use of parameters.

Page 16
2.6.3 On-going Refresh It is expected that cooperation and knowledge sharing across the abovementioned interfaces will intensify over the course of the ELEGANCY project. All background information compiled in this report, including the H2-CCS chain parameters and the assessment tools themselves, will be continuously assessed for gaps and improvements as the project progresses. We will also continue to invite more project participants and external experts to provide input via the data gathering tools. Finally, feedback from future workshops and interactions with other work packages will inform any updates.

Page 17
3 H2-CCS BUSINESS OPTIONS This chapter provides an overview of what can be characterised as the “markets” for hydrogen and CCS infrastructure services as well as the key end-use markets for hydrogen and CO2. The infrastructure perspective of H2-CCS chains is ultimately one of providing a basis upon which the end-use consumer markets in sectors such as heat and transport can emerge and consolidate in a low carbon economy. Competition will exist in many of these markets between hydrogen as an energy carrier and electricity as the mode of energy transfer and use. Industrial markets for which hydrogen is a feedstock or can be utilised for process heating are exposed directly to the cost of hydrogen production and, in the future, will require that hydrogen to have been produced with low/zero CO2 emissions.
Equipment and appliance innovation will generate the feedbacks that will influence whether hydrogen will wither and die or establish a viable alternative to electrification of the economy. Cross-sector synergies that can be created with hydrogen will ultimately have an impact on lowering costs for some markets, in some cases making it a more competitive option. Different modes of energy consumption and use will influence consumer preferences and consequently an appreciation of the potential of hydrogen and its characteristics will help in the evaluation of business models and ultimately business cases for H2-CCS chains.
CCS on the other hand is a public good infrastructure and its raison d'être is to provide a service for disposing of an unwanted pollutant. Hence the market for these services is intermediate and entirely captive to the needs and constraints of the supply chains of end-use markets. The market for utilisation of CO2 is briefly summarised here, that being the subject of the ERA-Net ACT ALIGN project. Clearly, however, business models and business cases for H2-CCS chains will also be impacted by the nature and potential of CO2 utilisation markets.
The chapter starts by providing a short background on hydrogen, as well as on CCUS.
3.1 Background on Hydrogen and CCUS 3.1.1 Hydrogen Hydrogen is the lightest gas and can be burned to deliver energy making it a potentially useful energy carrier. Although hydrogen can store and deliver usable energy it is not a common freely existing element and has to be produced from compounds that contain it.
Hydrogen can be produced from a wide variety of primary energy resources: natural gas, coal or oil (with carbon sequestration to remove CO2 emissions); any power source including nuclear energy; renewable energy sources (such as biomass, wind, solar, geothermal, and hydroelectric power); wood/biomass and even algae.
Hydrogen is highly flexible and can supply a range of markets. It is clean at the point of use and can be stored at a range of volumes at low cost, thus separating production from use. Hydrogen can be converted by the use of fuel cells, internal combustion engines, gas condensing boilers or in a diluted form as a H2 rich gas in industrial gas turbines. In fuel cells, hydrogen is used to generate power using a chemical reaction rather than combustion, producing only water and heat as by-products. This is attractive particularly as fuel cells are highly efficient and if fuelled with hydrogen produced from clean electricity, CO2 emissions will be minimal on a life cycle basis. Any pollution and carbon emissions associated with the manufacture of the hydrogen from

Page 18
indigenous fossil fuels could be managed centrally and at scale by the use of CCS to provide a practical and cost effective energy alternative.
Hydrogen as an alternative energy carrier to electricity is capable of allowing the use of a wide range of primary energy sources in a much “greener” way. Importantly it can provide an alternative option to ease the transition to a zero/low carbon transport sector without excessively increasing the burden on electricity generation capacity. Hydrogen can be used in many applications to decarbonise parts of the energy system and tackle air quality issues: transport sector, heat and power for residential, commercial and industrial purposes, portable power, electricity production at medium and large scale. Hydrogen can also be used as a storage medium for intermittent power sources, optimizing the use of the renewable energy and facilitating a better management of the grid systems.
Opportunities are already being recognised commercially in a number of markets. Over 10,000 fuel cell powered forklifts are already in operation, hydrogen fuel cell electric vehicles (HFCEV) are being slowly commercialised with over 2,000 Honda and Hyundai cars shipped in 2016 and with costs beginning to come down, it is expected they will provide a greater choice for consumers in the electric vehicles (EV) market. Japan had already installed over 180,000 residential combined heat and power (CHP) fuel cell systems by the end of 201612.
Hydrogen has the potential to be a significant fuel of the future and part of a diverse portfolio of energy options capable of meeting growing energy needs. However, there is a need for joint public-private efforts to deliver risk-mitigation strategies, including the development of financial instruments and innovative business models that enable hydrogen transmission, distribution and retail infrastructure development for HFCEV market introduction.
Therefore, a competitive hydrogen and fuel cell industry has the potential in principle to play a significant role in supporting Europe and industrialised countries meeting the 2050 targets of 80 to 95% cuts in CO2 emissions. In an effort to meet the emissions reduction targets by 2050, it has been easy to focus on the power sector and energy efficiency. However, the distributed emissions sources of the transportation and heating sectors are much more difficult to mitigate and low carbon alternatives in these two sectors are vital to achieving any emission targets. Hydrogen manufactured from indigenous fossil fuels such as gas and coal (with post-combustion CCS) could provide a flexible, alternative option to electricity or batteries as energy carriers.
The current market for hydrogen is almost entirely for use as feedstock in the refining and chemical industries. According to the EC’s Joint Research Centre (JRC) in 2016, “In Europe, 50% is consumed by the refinery sector, 32% is used in the ammonia industry, and together with the methanol and metal industrials, comprise around 90 % of the total H2 used in Europe. The hydrogen market is growing, due in part to refining regulations in transport fuel desulphurisation. It is estimated that global demand will increase by 5-6% during the next five years”13. About two thirds of the hydrogen in Europe is produced by the ammonia and methanol industry for its own use, and about a quarter is produced from by-products such as ethylene and coke oven gas.
12 E4tech. (2016). The Fuel Cell Industry Review 2016. London, UK, and Lausanne, Switzerland: E4tech. 13 JRC. (2016). Science for Policy report on Techno-economic and environmental evaluation of CO2 utilisation for fuel production. Bruxelles, Luxembourg: EC Joint Research Center.

Page 19
3.1.2 CCUS CCUS activities have historically been associated with the upstream petroleum industry for enhancing oil production and/or disposing of CO2 from natural gas processing, fertiliser production and coal-to-gas. Technically some of these are not “markets” when used in-house or through captive organisations, however in North America components of the full chain such as capture and sale of CO2 and pipeline transport of CO2 have operated as markets for the supply of a commodity or a service. Indeed, because of the four-decade history of CO2-enhanced oil recovery (EOR) in North America based primarily on the supply of CO2 from large natural geological accumulations, a commodity market emerged for CO2 with a corresponding trading price.
Global attempts at constructing CCS projects solely for climate purposes have been few and slow. Europe has been at the forefront with its Emissions Trading System to set a price on CO2 and a raft of policies, legislation and innovation funding to kick-start deployment in the fossil fuel power sector for emissions reduction purposes. Cost-effective CO2-EOR potential is limited in Europe to a handful of small-scale onshore fields. The predominance of oil reserves occurs offshore in the North Sea and CO2-EOR operations would require expensive infrastructure to transport CO2 from land-based anthropogenic sources with capture facilities. Europe does not have large producible natural CO2 accumulations to provide a low cost source.
Europe’s programmes to deliver full-chain CCS demonstration projects have not been successful because of a number of market failures. There is no market-pull if it is cheaper to pay a carbon emissions penalty than to pay the costs of a single full chain CO2 disposal system. Power generators are not in the business of, and don’t have the skills for, building and operating CCS systems. Those companies that do cannot invest if there is a missing market for the service. Different parts of the CCS chain require different timeframes to bring to Final Investment Decision (FID) and without a coordinated effort no individual organisation can run the risk of others not performing or delivering. These and other barriers to deployment have been well documented, and ways to overcome them learned from hard experience.
The story of CCUS market potential in Europe has become one of a public good infrastructure. Industrial utilisation markets with CO2 as a feedstock are a possibility if CO2 is captured and delivered at prices that can be supported with policy mechanisms to encourage investment in new processes and facilities, and provide relief from trade exposure on global product and commodity markets. Reduction of industrial emissions is an imperative if climate targets are to be met, and CCUS infrastructure will eventually be essential for the task. Hence, conceptually, there is “market” potential for the provision of CCS services to industry, including hydrogen production. As an infrastructure proposition, for CCS to service these markets there will need to be synchronised action and appropriate policies to nurse both into co-existence.
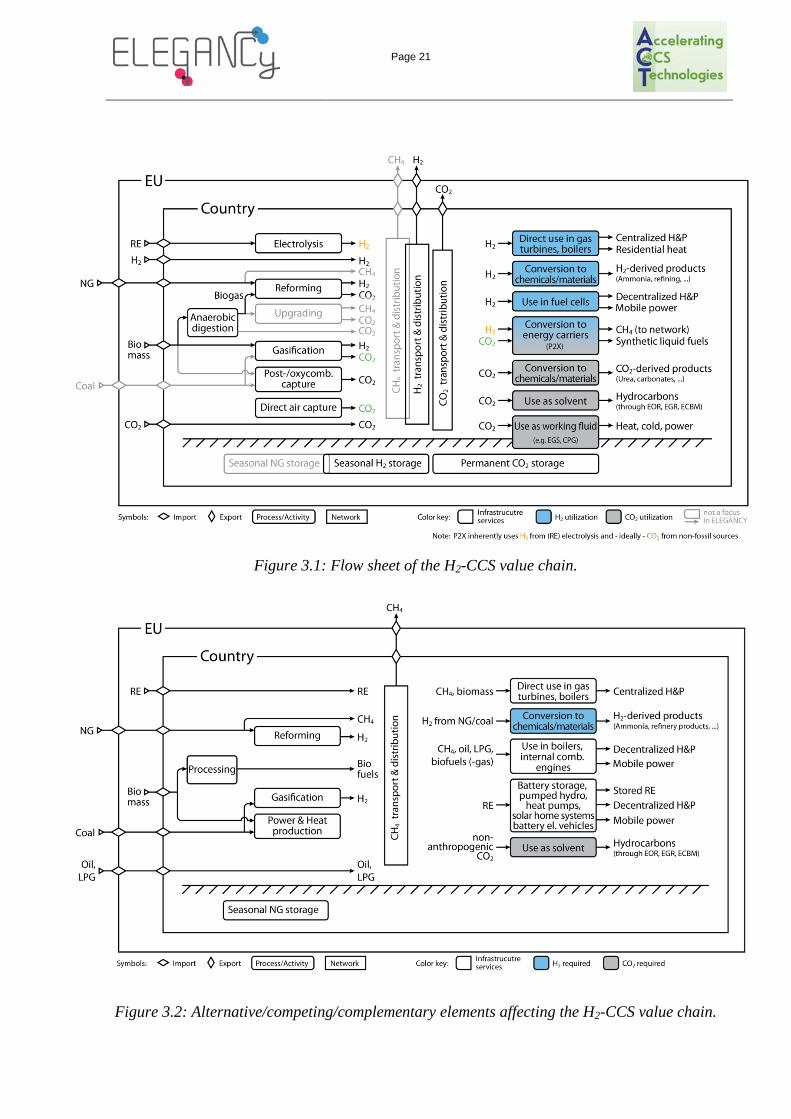
3.2 Flow Sheet and Business Tree The flow sheets presented in Figure 3.1 and Figure 3.2 enable the users of WP3’s business development framework to orientate and position their field(s) of activity or interest quickly within the H2-CCS integrated chain. Figure 3.1 highlights the activities (processes, services), commodity flows, and end-user markets that are included in one or in several of the five ELEGANCY case studies. Activities on the left-hand side of the flow sheet represent the supply side, while the use-cases on the right-hand side represent the demand side. The two sides are connected by the logistics network for natural gas, hydrogen, and CO2. The network services

Page 20
include gathering, transmission, storage (intra-day, seasonal, permanent), and distribution. All elements are within the national borders of a case study and commodity flows can either stem from or end in other European countries, or countries outside Europe.
Figure 3.2 shows a second flow sheet using the same logic as in Figure 3.1, but highlighting alternative, competing, or complementary elements that affect the H2-CCS value chain. This provides additional guidance for (future) considerations about market potential, failures and risks as part of the data gathering process for business development.
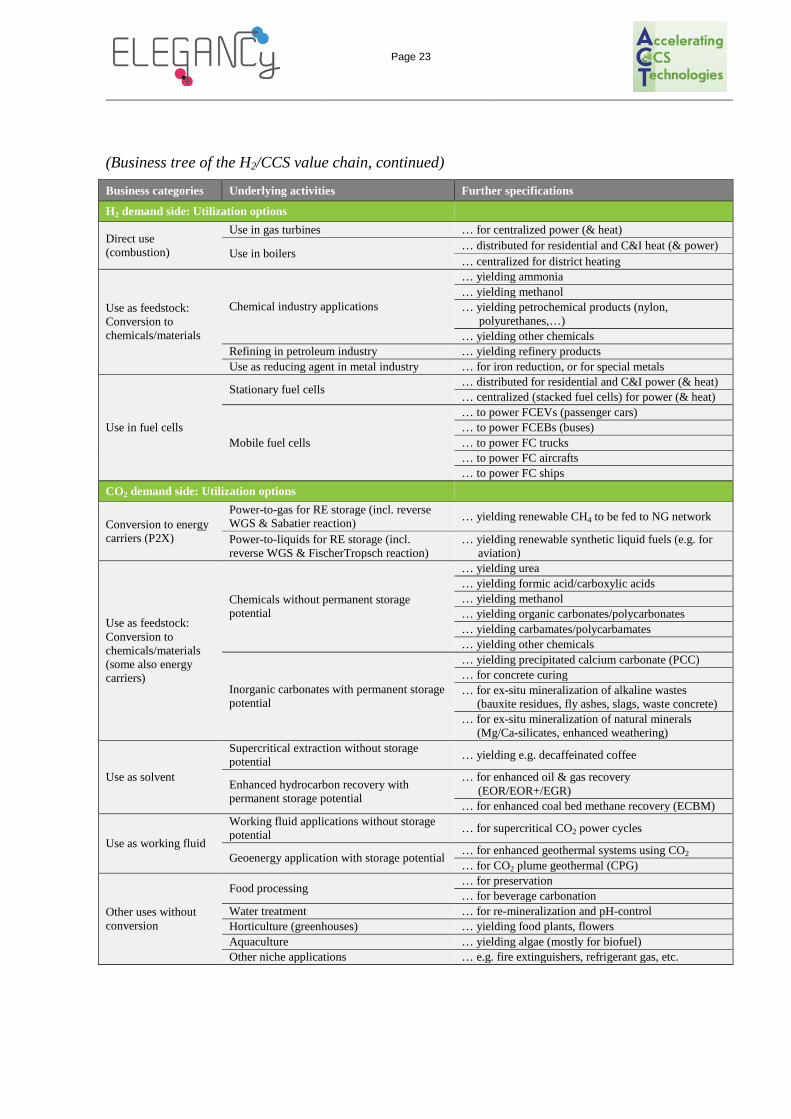
The business tree presented in Table 3.1 further refines the chain elements and terminology included in the ELEGANCY flow sheet. A terminology for business categories is introduced in the left-most column, which in the centre and right-most column further “branch” into individual business options (hence “business tree”). From top to bottom, the table is split into four modules, representing the supply side (H2/CCS infrastructure services) and the demand side (H2/CO2 utilization). Also this business tree serves to provide orientation before starting to use or during the use of WP3 data gathering tools.
Page 21
Figure 3.1: Flow sheet of the H2-CCS value chain.
Figure 3.2: Alternative/competing/complementary elements affecting the H2-CCS value chain.

Page 22
Table 3.1: Business tree of the H2-CCS value chain.
Business categories Underlying activities Further specifications
H2 supply chain: H2 production and infrastructure service options
Production
Reforming (incl. water-gas shift (WGS) reaction and H2/CO2 separation)
… of natural gas (NG) … of biogas
Gasification (incl. WGS, H2/CO2 separation) … of biomass … of coal
Electrolysis … using grid electricity (gridE) … using renewable electricity (RE)
Import/export Import … from other European countries Export … to other European countries
Transmission & distribution
Transmission by pipeline … of pure H2 … blended into NG network
Transmission by cargo tanks … using ships … by rail … by trucks
Distribution to end users by pipeline … pure H2 residential/C&I distribution network … blended into NG distribution network
Distribution to end users by cargo tanks … by trucks Distribution to end users from stationary sources … through hydrogen refuelling station (HRS) network
Storage
Intermediate (short-term) storage … in pressurized containers … in salt caverns
Seasonal/strategic storage in geological reservoirs
… in salt caverns … in saline aquifers … in depleted oil/gas fields
CCS value chain: CO2 capture and infrastructure service options
Capture (production)
Reforming (incl. WGS, H2/CO2 separation) … of NG … of Biogas
Gasification (incl. WGS, H2/CO2 separation) … of biomass … of coal
Biogas upgrading Ethanol production
Post-/oxycombustion capture
… from biomass … from coal … from industrial processes (NG processing, cement,
iron & steel, pulp & paper, etc.) Direct air capture
Import/export Import … from other European countries Export … to other European countries
Gathering, transmission & distribution
Gathering/transmission by pipeline
Transmission by cargo tanks … by ships … by rail
Distribution to end users by pipeline … e.g. to greenhouses Distribution to end users by cargo tanks … by trucks
Storage
Permanent geological storage of fossil/geogenic CO2 for power/industry decarbonization or of biogenic/direct air captured (DAC) CO2 for negative emissions
… in saline aquifers … in depleted oil/gas fields
… in-situ (enhanced) mineralization
Page 23
(Business tree of the H2/CCS value chain, continued)
Business categories Underlying activities Further specifications
H2 demand side: Utilization options
Direct use (combustion)
Use in gas turbines … for centralized power (& heat)
Use in boilers … distributed for residential and C&I heat (& power) … centralized for district heating
Use as feedstock: Conversion to chemicals/materials
Chemical industry applications
… yielding ammonia … yielding methanol … yielding petrochemical products (nylon,
polyurethanes,…) … yielding other chemicals
Refining in petroleum industry … yielding refinery products Use as reducing agent in metal industry … for iron reduction, or for special metals
Use in fuel cells
Stationary fuel cells … distributed for residential and C&I power (& heat) … centralized (stacked fuel cells) for power (& heat)
Mobile fuel cells
… to power FCEVs (passenger cars) … to power FCEBs (buses) … to power FC trucks … to power FC aircrafts … to power FC ships
CO2 demand side: Utilization options
Conversion to energy carriers (P2X)
Power-to-gas for RE storage (incl. reverse WGS & Sabatier reaction) … yielding renewable CH4 to be fed to NG network
Power-to-liquids for RE storage (incl. reverse WGS & FischerTropsch reaction)
… yielding renewable synthetic liquid fuels (e.g. for aviation)
Use as feedstock: Conversion to chemicals/materials (some also energy carriers)
Chemicals without permanent storage potential
… yielding urea … yielding formic acid/carboxylic acids … yielding methanol … yielding organic carbonates/polycarbonates … yielding carbamates/polycarbamates … yielding other chemicals
Inorganic carbonates with permanent storage potential
… yielding precipitated calcium carbonate (PCC) … for concrete curing … for ex-situ mineralization of alkaline wastes
(bauxite residues, fly ashes, slags, waste concrete) … for ex-situ mineralization of natural minerals
(Mg/Ca-silicates, enhanced weathering)
Use as solvent
Supercritical extraction without storage potential … yielding e.g. decaffeinated coffee
Enhanced hydrocarbon recovery with permanent storage potential
… for enhanced oil & gas recovery (EOR/EOR+/EGR)
… for enhanced coal bed methane recovery (ECBM)
Use as working fluid
Working fluid applications without storage potential … for supercritical CO2 power cycles
Geoenergy application with storage potential … for enhanced geothermal systems using CO2 … for CO2 plume geothermal (CPG)
Other uses without conversion
Food processing … for preservation … for beverage carbonation
Water treatment … for re-mineralization and pH-control Horticulture (greenhouses) … yielding food plants, flowers Aquaculture … yielding algae (mostly for biofuel) Other niche applications … e.g. fire extinguishers, refrigerant gas, etc.
Page 24
3.3 Hydrogen Infrastructure Services: Markets and Opportunities The structure of transport of hydrogen as an energy carrier is likely to be similar to that of oil/gas transmission and distribution networks in the long term: a combination of large high pressure pipes to connect large scale production with large users (end users or large scale storage) and facilitate transport over long distances, lower pressure pipes for more distributed regional networks (replacement of regional gas distribution networks) and distribution in liquid form by truck with small local storage (to replace petrol stations or other mobility applications).
As with CO2 transport and storage, based on the projects being considered across Europe, initial transport infrastructure for hydrogen is likely to be limited to point to point between a large producer and a small number of large users or a distribution hub (city gate). With increasing numbers of hydrogen users, market sectors, and producers, the opportunities to run the transport system for hydrogen as a stand-alone infrastructure business will increase.
The development of high-pressure hydrogen networks and business models will vary between countries and be influenced by their current ownership and regulatory models, for example regulated third party ownership in UK or state owned transmission system in the Netherlands (Gasunie). There will be opportunities to reuse the existing infrastructure and opportunities to build new complementary infrastructure, and therefore for engineering companies and supply chains to provide services to adapt or upgrade them.
Energy producers may consider investment in hydrogen production from their current energy resources, transport and storage (similarly as with CCUS) as an opportunity to protect the value from their current assets whilst meeting the ethical investment demands of their shareholders. Investment in high pressure transport to connect with large users and high pressure networks will allow them to integrate their value chain whilst capturing long term cash flow generating opportunities from the ownership of the central transport backbone where other producers/users connect to.
It is expected that large-scale geological storage opportunities similar to natural gas storage facilities will develop. Initially, large-scale storage will be an enabler for the early hydrogen projects (large scale power generation or conversion of gas networks) as it is critical to guarantee security of supply to those end users. Hence, opportunities will be limited to the commercial realisation of the relevant project but as new projects are developed, opportunities for revenue from third party access will increase and later with the greater liberalisation of the market, it is expected that broader commercial and market arbitrage opportunities would open up. Governments may prefer to take some form of ownership in such projects to reduce the risks and encourage their realisation. State ownership will then offer contracting opportunities for private companies to design, construct and manage such large-scale stores
Companies such as the Linde Group, an engineering company and supplier of industrial and process gas, have already taken market leading positions in the development and engineering of hydrogen refuelling stations and in the distribution of liquid H2 to those stations. Other companies such the gas distribution company Northern Gas Networks in the UK are pushing for the opportunities to convert existing low-pressure gas network to H2 for domestic and commercial users.
Page 25
3.4 CCS Infrastructure Services: Markets and Opportunities 3.4.1 Capture services CO2 capture is mainly being considered on a large scale, either at the point of production/processing of the primary energy source (by the energy producers) or the point of utilisation by energy intensive users.
The main objectives of carbon capture for a potential owner/operator are either:
1. For energy producers: a. to offer a cleaner energy source to their consumers by removing CO2 as a waste
stream, a strategy guided by national and international government policies and consumer demand and to protect the value of their assets;
b. to capture business opportunities for utilisation of CO2 as explained in Section 3.6 below.
2. For energy intensive users (electricity producers, energy intensive industrials): a. to allow continued operation of their existing power plants/manufacturing plants
in compliance with more stringent environmental legislation and to minimise the cost of such compliance (EU Emission Trading Scheme (ETS), Carbon tax, etc);
b. to offer new cleaner technological solutions aligned with their core business and capture such opportunities, for example the construction of a new large hydrogen powered power plant in Switzerland or the Netherlands to replace similar old units whilst minimizing land use and infrastructure upgrade costs.
Carbon capture plants are often heavily integrated into the rest of the plant and such investment is likely to be private by the large energy producers/users supported by economic and environmental policies. Potential CO2 capture opportunities are likely to exist as a market for equipment providers, and engineering/construction companies
Other new opportunities may exist in the future for companies to participate via direct CO2 capture from air (DAC) and provide a specific application or service.
3.4.2 Transport & Storage services Transport of CO2 is proven and widely used in North America with 50 pipelines with a combined length of over 7000 km, though primarily for Enhanced Oil Recovery where there is a commercial value for the CO2
14. These pipelines link sources of CO2 with oil and gas fields. Some oil/gas companies such as Denbury Resources who specialise in CO2 EOR production own/operate a number of CO2 pipelines.
Initially it is envisaged that the first European transport and storage projects will use point-to-point transport linking the source and sink directly. The infrastructure will then expand to allow further connections and more sources and more sinks, thereby minimising costs for future users of the infrastructure and increasing optionality for all. The issues associated with development and operation of this infrastructure in the absence of a market pull are well documented and have led to the concept of Market Makers - organisations or partnerships mandated to undertake the
14 Wallace, M., Goudarzi, L., Callahan, K., & Wallace, R. (2015). A Review of the CO2 Pipeline Infrastructure in the US. DOE/NETL.

Page 26
early stage development in order to kick-start the end-use market15. Various business models exist for such public good network and scale dependent services, and comparisons have been made with rail networks, sewage networks, airports, power transmission networks, and national gas pipeline networks.
If carefully managed, ultimately market creation will lead to business opportunities in the form of direct private investment in the assets, with returns supported by economic and financial instruments from the national governments/European Union. With appropriate carbon pricing in one form or another plus market expansion, government support and/or involvement will decrease over time and enable withdrawal of public sector organisations through privatisation (cf electricity and gas transmission networks). Alternatively governments may opt for other ownership/operating models and retain asset ownership while remunerating the private sector as contractors to the state – similar to the sewage networks.
For some countries, the future opportunities extend beyond national borders and can form part of a national economic and energy policy to offer transport and storage services internationally. For example, the Netherlands, which operates as one of the main European energy hubs with a strong infrastructure backbone can act as a European logistical provider for access to a large number of CO2 storage sites in the North Sea. Norway is assessing options either to become a European supplier of hydrogen with local capture and storage of CO2 prior to export or to offer CO2 transport and storage services to other European countries. On the other hand, a number of countries with few carbon storage opportunities due to their geology or geography such as Switzerland and Austria, or with a strong national opposition such as Germany, may value such services to decarbonise their energy systems. Opportunities will exist for those taking a visionary commercial position in the first transport and storage infrastructure, similar to the first investments in oil/gas infrastructure in the North Sea.
3.5 Hydrogen Utilization: Markets and Opportunities 3.5.1 General The main commercial technologies to produce hydrogen are listed below.
1. Conversion of fossil fuels
a. Reforming of fossil hydrocarbons (steam reforming, partial oxidation or auto thermal reforming) is by far the most widespread method of hydrogen production. Reforming is the conversion of hydrocarbons and alcohols by chemical processes into hydrogen, giving rise to the by-products water (vapour), carbon monoxide and carbon dioxide.
b. Gasification, where the hydrogen is produced by reacting coal with a limited amount of oxygen.
c. Hydrogen is also present in waste gases from refineries, and process gases from the chemical industry.
d. Both the above produce CO2 as a by-product, which would need to be captured and stored for “clean” hydrogen.
15 ZEP. (2014). Business models for commercial CO2 transport and storage. Bruxelles, Luxembourg: Zero Emissions Platform.

Page 27
2. Production from biomass (biogenic)
On a global scale, the production of hydrogen from biomass has so far been negligible.
3. Electrolysis, whereby water molecules are broken down into hydrogen and oxygen by the application of electrical current in the presence of anodes.
a. Depending on the method used, the efficiency of water electrolysers is currently in the region of 60% to 80% (based on the calorific value).
b. Producing hydrogen by electrolysis is particularly attractive when surplus renewable electricity (at times when grid supply exceeds demand) is essentially “free” with no CO2 emissions. By contrast, if electricity generated by a natural gas power station is used for electrolysis, the reduced efficiency of the overall process chain has to be taken into account: converting natural gas to electricity to hydrogen is associated with greater losses than the direct conversion of natural gas to hydrogen.
c. The availability of water is a limiting factor for large-scale production.
4. Hydrogen is also obtained as a by-product from refineries or petrochemical plants. For example. It is the by-product of chlorine production and olefin production. It is also released by the processes to make high-value octane products in refineries but that supply is already not sufficient to meet their own needs for the preparation of low sulphur-content fuel.
Hydrogen can be used in broad range of applications, which are described in the sections below:
Industrial applications;
Centralised Heat and Power generation – using industrial gas and steam turbines or large stationary fuel cells
Decentralised Heat and Power
o Domestic and commercial heat – through the decarbonisation of gas networks by blending or 100% replacement of natural gas by hydrogen;
o Smaller scale stationary applications – small stationary power plants, back-up power, micro-CHP using hydrogen fuel cell systems;
Transport and mobility – through the on-board use of hydrogen in vehicles;
Power to X: the conversion of electricity into hydrogen to store energy before conversion back into another form of energy.
3.5.2 Mobility Hydrogen can be used as a direct combustion fuel in an internal combustion engine. However, due to the technical advances that have been made to date, it is the hydrogen/fuel cell combination that is the most promising technology for mobility purposes. The key advantages of HFCEVs are:
Mitigate transport related air pollution problems
Range and performance close to standard vehicles

Page 28
Improve energy security and reduce the transport sector’s dependence on oil.
HFCEVs, especially passenger cars, are technically ready for commercialisation with the main technical issues resolved and major cost reductions having been achieved, although fuel cell electric cars are still expensive at low production volumes. Once fuel cell electric cars are mass-produced projections of their production costs suggest they will be similar to those of hybrid electric cars. To build up the FCEV market and achieve the desired mass production levels will require a (pre-commercial) market transition phase supported by governments.
Importantly, for the first time, the transport sector surpassed the stationary sector in 2016 in sales of hydrogen fuel cells primarily as a result of the introduction of the Toyota Mirai into Japan and California and to a lesser extent into Europe. Honda and Hyundai delivered in total just over 2,200 to customers in 2016. According to the IEA HFC Technology Roadmap, assuming a fast ramp-up of FCEV sales, a self-sustaining market could be achieved within 15 to 20 years after the introduction of the first 10 000 FCEVs16.
The risks related to committing investment in large scale FCEV production and the roll out of a hydrogen delivery/refuelling infrastructure are currently considered to be the two main barriers to the large-scale introduction of hydrogen, rather than technology development. This is especially so in the face of competition from Battery Electric Cars (BEVs) and the uncertainty on the consumer response and uptake of FCEVs. Market development will require the concerted effort of all involved stakeholders, particularly infrastructure companies, industrial gas companies, car manufacturers, and governments.
According to the IEA HFC Technology Roadmap, “for each of the assumed 150 million FCEVs sold between now and 2050, around USD 900 to USD 1,900 will need to be spent on hydrogen infrastructure development, depending on the region.” In other words in excess of $150 billion of infrastructure investment will need to be made with a combination of public and private sector involvement to overcome the coordination market failure – the “chicken and egg” problem typical of large scale infrastructure.
3.5.2.1 Marine Diesel engines are used almost exclusively for shipping today, burning either heavy fuel, marine diesel or commercial diesel fuel and the only alternative fuel for propulsion is the use of liquefied natural gas (LNG) or compressed natural gas (CNG).
Hydrogen fuel cells for ship propulsion are at an early stage of trial and no commercial scale hydrogen powered vessel exists. Fuel cells have the advantage of producing no SOx, NOX or particle emissions and vastly reduced CO2 emissions (dependent on the source of the hydrogen). However, in comparison to the efficient, slow-running diesel engine, the hydrogen power train and fuel are still far too expensive. In addition, international technical standards still need to be developed in order to use gaseous fuels (such as hydrogen).
3.5.2.2 Rail Fuel cells are also being demonstrated in light rail applications and locomotives. While overhead or ground electrification is an excellent way to eliminate local emissions from rail, it can be expensive or impractical, and again hydrogen may offer a solution. Especially on lines with a
16 E4tech. (2016). The Fuel Cell Industry Review 2016. London, UK, and Lausanne, Switzerland: E4tech.

Page 29
low transport volume, the high up-front investment that is needed for electrification of the lines cannot always be justified. Moreover, overhead lines cannot be used for shunting if cranes are also in use for moving transport goods.
Electrification levels have reached 60 to 80% in Europe and Asia, and the average for EU member states is around 60%. Worldwide, however, the proportion of electrified railways is only around one-third. Over 50% of the railways in India are electrified, around 40% in China, 20 % in Africa, but only a few per cent in North America17.
In March 2017, Alstom successfully performed the first test run at 80 km/h of the world’s only fuel cell passenger train, Coradia iLint, on its own test track in Germany and the first passenger test runs are expected in early 2018. In November 2017, the Lower Saxony Transport Authority (LNVG) signed a contract with Alstom and gas supplier Linde Group for a fleet of 14 Coradia iLint hydrogen fuel multiple units, which will replace diesel trains on non-electrified routes in northwest Germany from 2021 onwards. The trains are expected to operate up to 1,000km on single tank of hydrogen. The €10 million hydrogen refuelling facility will be funded with the aid of a €8.4 million grant from the German federal government’s National Innovation Programme for Hydrogen and Fuel Cell Technology.
In China, the first commercial fuel cell tramline is planned to begin operating in 2018 in the city of Foshan, with Ballard supplying the fuel cell modules. In Tangshan China Railway Rolling Corporation (CRRC) is also using Ballard systems and a hydrogen fuel tram which can run up to 40 km between refuelling (which takes 15mins) and a maximum speed of 70 km/h. The tram entered commercial service in October 2017. Shunt locomotives with FC auxiliary power units (APUs) have been demonstrated in India, and fully powered shunt locomotives demonstrated in the US.
3.5.2.3 Aviation In the aviation sector, there are a number of demonstration projects where hydrogen is being used for on-board power supply. Commercial electric planes are a distant proposition due to reliability needs, electric storage requirements and the costs compared to fossil fuels in a highly competitive industry where fuel costs are a major business driver.
Nonetheless, HY4 – the world’s first four-seater passenger aircraft powered solely by a hydrogen fuel cell system and electric propulsion – has demonstrated the feasibility of electric aviation. Partners in the venture include DLR (national aeronautics and space research centre of the Federal Republic of Germany) and Hydrogenics (global market leader in fuel cell technology). Easyjet has partnered with US company Wright Electric to develop an all-electric aircraft capable of handling a large percentage of its short haul flights in the near future.
3.5.2.4 Road Passenger Cars Hydrogen vehicles have to match over 100 years of car development to achieve reliable and cost effective performance to compete with traditional petrol cars. Today, they can provide passengers with a comparable experience to petrol vehicles without the air pollutants and with low noise emissions. With four to seven kilograms of hydrogen stored on board in pressure tanks at 700 bar, they have a typical range of about 400 to 500km (in 2016) and refuelling times of
17 IEA/UIC. (2015). Railway Handbook 2015. Paris, France: International Energy Agency, International Union of Railways.

Page 30
three to five minutes. These are much better than electric vehicles, their main alternative competitor.
Since 2013, when Hyundai’s first small-series production vehicles became available, the number of FCEVs in use has been growing. The Toyota Mirai is the market leader but Honda and Daimler also have models available and many others are also appearing. The focus has been on selling local and regional fleet packages to fleet operators thus enabling investment in a number of refuelling stations.
However, the cost of HFCEVs is still well above that of petrol fuelled passenger cars. And with limited infrastructure in place, concerns about hydrogen safety and tough competition from cheaper electric cars, commercial development is slow. But in an international context where an increasing number of countries (including India, France, Norway, the Netherlands, Germany) are electing to ban polluting vehicles in the future, rapid technological advances and access to cheaper sources of hydrogen could quickly make HFCEVs more cost competitive especially when taking into consideration their longer range and shorter charging times.
Industrial Trucks and smaller commercial vehicles The challenge with industrial trucks is to deliver driving range compared to diesel vehicles. For smaller vehicles like vans, vehicle manufacturers are succeeding in achieving the required range. For example, the Hyundai H350 Fuel Cell Concept van presented in 2016 can get just over 400km of range.
For bigger vehicles, there are a number of hydrogen-powered trucks coming into service across the world, driven in part by the State of California’s interest and financial support, but also the green interests of some corporations for their transport fleet. Vehicles are mostly in the USA (around 50), with individual examples in Germany/EU. For example, Toyota is now running a concept version of their truck moving goods between depots in the Port of Los Angeles and Long Beach over 300 km per day. From a competition standpoint Tesla has recently announced plans for its own fully electric semi-truck.
Fuel Cell Electric Buses (FCEBs) Fuel cells have long been promoted as highly suitable for buses operating in urban areas where local air quality is an issue. This is the case not only in China and India but also in the main European capitals such as Paris and London, where buses currently run on diesel. The technology is tried and tested with development having been on-going for more than two decades and with numerous small fleets worldwide (Europe, North America, Asia). Europe has the largest fleet with about 60, all funded through demonstration programmes.
FCEBs emit no air pollutants and have zero emissions overall, if using green sources of hydrogen. With a range of 300 to 450kms, they require no ‘on-route’ energy infrastructure, neither charging points for battery nor wires for trams. FCEBs simply refuel at their home depot, typically in less than 10 minutes, can operate up to 18 to 20 hours per day with low noise emissions and little additional weight from hydrogen tanks. However, the cost of FCEBs, has been upwards of a million dollars each, making it difficult to compete with diesel buses, and hard to justify for a local authority or a bus operator company running on low margins.
In Japan, Toyota announced its ambition to have 100 or more FCEBs on the roads in time for the Tokyo Olympic and Paralympics, with deliveries starting in 2017. In Korea, Hyundai and the Korean Government announced they intended replacement of up to 26,000 Compressed Natural

Page 31
Gas fuelled public transport buses with FCEBs, though this is currently lacking the regulatory, policy and financial support.
In Europe, a further FCEB project was announced, JIVE: Joint Initiative for Hydrogen Vehicles across Europe. This project aims to deploy 142 more FCEBs across the UK, Germany, Italy, Denmark and Latvia, achieving a 30% reduction in cost per bus, with a stated target of €650,000.
Motorcycles There have been a number of prototypes for hydrogen fuelled motorcycles over the last two decades but no commercial implementation has been possible partly due to the higher purchase/running costs for the fuel cell technology, the inadequate hydrogen supply infrastructure and the faster improvements in the range of electric batteries which can cover the moderate requirements for electric motorcycles in urban commuter traffic.
3.5.3 Industrial Applications As an “industrial gas,” hydrogen is already a big global business in excess of $100 billion USD in 2017 with two main market segments: production for transport and onsale to third party customers and production for own local consumption18. About 55% of the hydrogen produced around the world is used for the production of ammonia, 25% in refineries and about 10% for methanol production. Other applications worldwide account for only about 10% of global hydrogen production19.
3.5.3.1 Ammonia Hydrogen is produced on large quantities to form ammonia, which goes primarily into fertiliser production for agricultural purposes - solid fertiliser salts, nitric acid and nitrates. The other use for ammonia is in refrigeration plants as an environmentally friendly and inexpensive energy source.
3.5.3.2 Methanol Hydrogen is also used extensively for producing methanol, which can be used in the following applications:
production of fuel additives
18 de Valladares , M.-R. (2017). Global Trends and Outlook for Hydrogen. Paris, France: IEA Hydrogen Technology Collaboration on Program (TCP). 19 Adolf, J., Balzer, C., Louis, J., Schabla, U., Fischedick, M., Arnold, K., Schüwer, D. (2017). Shell Hydrogen Study: Energy of the Future? Hamburg, Germany: Shell Deutschland Oil GmbH.
Figure 3.3: Global usage of hydrogen (Shell, 2017).

Page 32
produce of biodiesel from vegetable oils
production of other important chemical intermediates like formaldehyde, acetic acid and others.
directly as a fuel in internal combustion engines or in fuels cells (directly or after reforming).
The demand for methanol has been rising steadily since 2009 with further growth expected.
3.5.3.3 Refining Processes Hydrogen is also used in refining process to remove sulphur compounds (by hydro treatment) and to purify and improve yields (by hydrocracking) of petrol production. The current hydrogen demand for refining exceeds its production as a by-product and requires specifically produced hydrogen. This market is expected to grow further with the commercial pressure to increase processing yields and the worldwide increasing quality requirements for fuels especially in the emerging markets to comply with more stringent engine standards and stricter exhaust gas regulations.
3.5.3.4 Steel Making Processes The steel industry is one of the most carbon and energy intensive industrial processes in the world where the manufacturing process is mainly dependent on coal or coke, not only as an energy source but also as a reducing agent in a conventional blast furnace. Hydrogen can be used as reducing agent to replace coke in the process to converting iron ore into iron (the circored process) and has the potential to reduce CO2 emissions significantly20.
3.5.4 Decentralised Heat and Power 3.5.4.1 Domestic and Commercial Heat In many countries, emissions from domestic and commercial heat account for a significant proportion of total emissions, for example 25% in the UK, and achieving the long term international climate targets will require the near complete decarbonisation of heat in those countries. This challenge will require an energy system that is able to deliver large quantities of flexible low carbon energy to local consumers with minimum disruption and cost. The system will need to deal reliably with the large fluctuations in demand, both in terms of quantity and rate of change over shorter and longer timescales (hourly, daily and seasonal) on a large scale.
Hydrogen could be used to reduce the carbon content of the gas system, either by blending or 100% replacement. Hydrogen can then be used locally to produce heat by combustion in a modified boiler, or in a fuel cell micro-CHP (see Section 3.5.4.2). The hydrogen boilers are similar to standard gas condensing boilers but need modified burners to cope with the higher combustion temperature and different flame characteristics. Hydrogen has similar benefits as natural gas in being able to deal with the peak demands in heating and would reduce the need to upgrade the transmission and distribution infrastructure while also making use of the existing geological storage systems in those countries.
20 Otto, A., Robinius, M., Grube, M., Schiebahn, T., Praktiknjo, A., & Stolten, D. (2017). Power-to-Steel: Reducing CO2 through the Integration of Renewable Energy and Hydrogen into the German Steel Industry and published in April 2017 in. Energiew, 10.

Page 33
However, the amount of carbon abatement is not directly proportional to the percentage blend, as the lower volumetric energy content of hydrogen requires the volume of gas supplied to rise to deliver the same energy. A 10% blend, by volume results only a 3% carbon saving and a 80% blend is required to achieve a 50% carbon saving. Going straight to a 100% hydrogen system or transitioning via blending options has different advantages and drawbacks. Local grids and appliances can usually operate without modification up to a certain level of hydrogen content (% volume) depending on the tolerance of the pipes and appliances in the existing system. For instance, residential gas boilers can be expected to cope with up to around 20% vol hydrogen without any adverse effects. On the other hand, the allowable hydrogen content in Germany’s natural gas system is currently limited to a maximum of 5%. Operating with small blend levels would enable the development of early grid management projects but as the levels increase, more extensive network upgrades and appliance replacement will be required.
In the UK, for example, the historical low-pressure system is made of iron pipes and the transmission system is made of steel pipes which can crack when used with high blends or 100% hydrogen, although they can tolerate low percentages of hydrogen. Commencing in 2002 the UK government embarked on a 30year iron mains replacement programme for safety reasons, and as at 2017 a substantial part of the system has been replaced with modern polyethylene pipes, which are tolerant and can operate with hydrogen. Hence, a conversion from natural gas to 100% hydrogen is not constrained in many places by the existing infrastructure.
Such a large-scale conversion is not unprecedented. The UK gas network was converted from town gas to natural gas during the 1960s-80s following the discovery of North Sea gas. Germany’s town gas (Stadtgas) contained up to 60% hydrogen, and was used on a wide scale until the end of the 1980s. The Leeds H21 City Gate project is already actively looking at the feasibility of converting the network of the city of Leeds (circa 700,000 residents) to 100% hydrogen making use of the existing network of valves to separate the city from the rest of the network and of the neighbouring industrial hubs to produce hydrogen centrally and at scale. This is also the subject of the UK case study in ELEGANCY WP5.
An alternative to hydrogen gas for heating is the electrification of the system combined with the use of electric heat pumps and storage heaters. Such a conversion programme would increase not only the overall electricity demand but also the peak electricity demand (requiring large installed capacity with low load factor) and would also require significant and disruptive network upgrades. Another option is the further use of district heating which could be achieved using hydrogen as a fuel source in larger scale CHPs.
3.5.4.2 Small stationary power and CHP The typical power range of small stationary fuel cells is 0.5kW to 400kW and include systems which generate power and heat for the residential/commercial sector (micro-CHP or mini-CHP) and decentralised power solutions (mainly in off-areas areas or for uninterruptible/backup power supplies). Fuel cells are also used for large stationary combined heat and power (see Subsection 3.5.5.2), and transport applications (see Section 3.5.2).
According to the 2017 Fuel Cell Industry Review by E4Tech21, some 73,000 fuel cell systems were delivered worldwide, with a total generating capacity of approximately 670 MW, an increase of 30% from 2016. Transport showed the steepest increase by more than 60% to 455
21 E4tech. (2017). The Fuel Cell Industry Review 2017. London, UK and Lausanne, Switzerland: E4tech.

Page 34
MW. Around 75% of the fuel cells supplied (about 56,000 units, 50,000 thereof in Japan) and 32% of the fuel cell capacities shipped were stationary applications. Unlike in the year 2016, stationary applications did not grow as much in terms of numbers and capacity shipped (52k 56k, 209 MW 214 MW). The small increase that was observed was largely determined by Japan’s EneFarm programme for domestic micro-CHP systems, as well as by the KfW433 program for micro-CHP plants in Germany that resulted in some 1,500 installations by the end of 2017. For the second year in a row, worldwide the biggest growth of fuel cell technology application has been in the transport sector.
Micro CHP
Fuel cell systems that generate small power outputs plus heat are described as micro-CHP or mini-CHP plants when used in the domestic heating sector. Japan is the consistent world leader in the adoption and installation of residential CHP fuel cell systems with almost 200,000 gas-fuelled fuel cell systems already installed and funded through the state “EneFarm” project. During 2016, the deployment of sub-kW residential CHP units remained high and the Japanese government has set an ambitious target to install 1.4 million systems by 2020 and 5.3 million by 203022.
In Europe the “Ene.Field” public-private programme, an initiative under Horizon 2020 and the FCH-JU, is deploying fuel cells in 12 EU member states with more than 1,500 fuel cell systems operating in residential properties. Depending on the cell, input fuel can be natural gas, LPG or hydrogen. Germany, in particular, has a large demonstration project (“Callux”) within Ene.Field.
Although benefiting from a higher electrical efficiency, low maintenance costs and high efficiencies over all load points, fuel cell heating systems have higher purchase costs and therefore are not economically viable compared to condensing boilers without subsidies. In Japan, the payback period is currently estimated to be 18 years at full purchase price, and therefore the take-up of micro-CHP fuel cell systems is only possible with significant subsidy from the government. The planned reductions in unit costs by the Japanese Ministry of Economy, Trade and Industry (METI) indicate that a payback period of 7-8 year, is possible by 2020 – obviously a more attractive proposition for consumers.
Decentralised Power Supply Stationary fuel cells can be used as decentralized power supply in off-grid areas and also increasingly used as a backup power supply for applications such as emergency power supply and uninterruptible power supply (in particular in telecommunications and IT systems, such as radio towers or data processing centres). This market with size which ranges from a few kW to over 1 MW appeared to be steady in 2016.
3.5.5 Centralised Heat and Power 3.5.5.1 Large Stationary Power from Gas Turbines Hydrogen has the potential to substitute the combustion of coal and natural gas by H2-rich synthetic gas stream in large industrial gas turbines for the large-scale production of electricity. A hydrogen fired gas turbine emits only water and the larger the share of hydrogen in the fuel split (when co-firing) the lower the CO2 emissions.
22 E4tech. (2016). The Fuel Cell Industry Review 2016. London, UK, and Lausanne, Switzerland: E4tech.

Page 35
The capacity of current gas turbines that run successfully on synthesis gas is around 200 MWe and a total plant output of 350 MWe can be achieved when combined with a steam turbine. Integrated Gasification Combined Cycle (IGCC) plants already successfully incorporate such industrial gas turbines where the fuel is the H2-rich syngas produced by the gasification process from a wide variety of high carbon content feedstocks, such as high-sulphur coal, heavy petroleum residues, and biomass. There are a number of such large scale commercial IGCC plants operating around the worldwide with several operating for over fifteen years (including the 253MWe Willem Alexander IGCC Plant in Buggenum, Netherlands and 330MWe Elcogas IGCC Plant in Puertollano, Spain). More recent plants include the 618MWe Duke Energy Edwardsport, Indiana which started operation in 2013, the 250MWe Nakoso IGCC, Japan which started operation in late 2007, 400MW in Vresova, Czech Republic23.
However, H2 is a much more reactive fuel than methane, with a very high flame velocity and leads to combustion temperatures that are too high for conventional gas turbines. Therefore, the use of industrial gas turbines originally designed for burning methane currently requires the dilution of the H2 gas stream with N2 or steam to reduce the peak flame temperature and consequently the NOx emissions, incurring a loss of efficiency, additional investment and operating costs. The challenge is to realise gas turbines burners that are capable of burning hydrogen in high volume concentrations with low NOx emissions and without the energy penalty presently incurred when diluting the hydrogen fuel with steam or nitrogen.
The main turbine manufacturers such as GE, Siemens, Mitsubishi are approving use of their gas turbines (GTs) with modest amounts of H2 in the fuel (c.25%), and improving the designs to cope with a greater % vol H2 content. Siemens offer their standard burners for fuels up to 15 vol% of H2 and is in continued development efforts to allow operation on higher hydrogen contents with a slightly modified burner24.
There are significant on-going projects researching and developing improved technologies for cheaper and more efficient H2 turbines – for example research conducted by New Energy Technology Laboratory under a US Department of Energy sponsored a programme25.
3.5.5.2 Large Stationary Heat and Power from Fuel Cells Stationary hydrogen fuel cells provide electricity (and sometimes heat) but are not designed to be moved. Within the fuel cell, hydrogen combines with oxygen from the air to create electricity. The fuel cell can run continuously and generate energy as long as the hydrogen fuel is being supplied, and the only by-products are heat and water. There are six main electrolytes used in fuel cells: proton exchange membrane fuel cells (PEMFC), direct methanol fuel cells (DMFC), phosphoric acid fuel cells (PAFC), molten carbonate fuel cells (MCFC), solid oxide fuel cells (SOFC) and alkaline fuel cells (AFC).
South Korea is the main market with a number of utility-scale fuel cell parks in operation, including the world’s largest, which exports 59 MW of power to the grid and supplies a district heating system. POSCO Energy and Doosan are the main players with POSCO Energy reported
23 NETL. (2018, 04 24). IGCC Project Examples. Retrieved from https://www.netl.doe.gov/research/coal/energy-systems/gasification/gasifipedia/project-examples. 24 Larfeldt, J., Andersson, M., Larsson, A., & Moëll, D. (2017). Hydrogen Co-Firing in Siemens Low NOX Industrial Gas Turbines. Cologne, Germany: POWER-GEN Europe. 25 Dennis, R. (2010). Advanced Turbines for IGCC with CCS. Uniersity turbine Systems Research Workshop. State College.

Page 36
to have installed over 154MW of fuel cell systems in 20 locations until 2015, either as single units or in the form of fuel cell parks. This development has been supported by Korean Government policies where fuel cells count towards the obligation to generate 10% of electricity from renewable sources by 2020.
The application of fuel cells has not grown as fast as predicted because of the high investment costs and competition from advanced gas turbines despite having much higher electrical efficiencies (up to 60 %, even for small plants) compared with conventional thermal plants.
3.5.6 Power to X and Energy Storage The share of renewable energy has been increasing steadily in most markets across the world with wind power and photovoltaics the technologies that have seen the greatest expansion. However, their output is intermittent and highly dependent upon the availability of the energy source. Such a variable electricity production impacts the stability of the grid when the level of renewable energy penetration exceeds 25% because the nature of electricity is such that grid management requires a constant balancing of supply and demand.
Grid operators use a number of demand and supply measures including constraining generators, and the storage of energy. Until now, storage has been primarily achieved through pumped-storage hydro power plants. Short-term electricity storage in batteries for small plants is developing fast. However, there is significant potential for longer-term storage of larger surplus amounts of electricity.
Surplus renewable electricity generated during periods of high output and low demand (such as strong wind during off-peak hours) can be converted by electrolysis into hydrogen (and oxygen which may be sold for industrial use or released into the atmosphere). The hydrogen can be stored for future use prior to being converted back into another energy carrier. This is known as the Power-to-X concept (P2X).
There are three potential uses for the stored hydrogen:
Power to Gas by feeding hydrogen directly into the natural gas network;
by hydrogen methanation – through the combination of hydrogen with carbon dioxide to create synthetic methane which can be used as an alternative to natural gas.
Power to Power by converting the hydrogen back into electricity via fuel cells or blended with natural gas
in other power generation technologies.
Power to Liquids by using it in refining or chemical processes.
The technology is undergoing advanced study and approaching commercial application, primarily in Europe and in the US.
Note that P2X is not a focus within the ELEGANCY project. This is due to the fact that P2X is not a use case for any type of H2 (incl. methane-derived H2), but inherently uses renewable electricity with electrolysis-derived H2 as intermediate. However, P2X can be interpreted as a use case for CO2, therefore this report will revisit the concept in the following Subsection.

Page 37
3.6 CO2 Utilization: Markets and opportunities This section provides a context for further work to be conducted in the ELEGANCY case studies. The objective of the ERA-NET ACT ALIGN project is to study how utilisation of CO2 in industrial clusters can help to accelerate the delivery of CCS infrastructure and lower deployment costs. Nevertheless there are synergies to be gained by co-locating hydrogen production with CO2 utilisation, and making use of CCS infrastructure: capture facilities, gathering networks, transmission pipelines and geological storage. Furthermore the two gases can be used in combination as feedstocks for chemical synthesis processes. Hence, a brief overview of the potential CO2 utilisation markets is useful in the assessment of various H2-CCS chain business models and business cases.
3.6.1 Overview From a climate mitigation perspective CO2 capture and utilisation (CCU) is not seen as a substitute for full chain CCS, but rather an enabler for justifying investment in infrastructure, new processes and facilities that can contribute to emissions abatement and a future low carbon or circular economy. The Zero Emissions Platform (ZEP) has reviewed the markets for CO2 utilisation and scope for contributing to global emissions reductions26. In its market economics analysis for CCS deployment in Europe27, the ZEP concluded: “An important aspect to keep clearly in mind is that the volumes of CO2 emitted by industry, transport and electricity production that needs to be captured and stored, far exceeds what can be imagined that could be utilised by other industries.”
Placed in proportion, 2015 global CO2 emissions exceeded 36 Gtpa28, whereas the world utilisation of CO2 is of the order of 130 Mtpa29. This is a factor of almost 300 times less. Approximate current utilisation markets, in order of size, are:
Solvents (mainly EOR): 66 Mtpa Feedstocks: 36 Mtpa Energy: 14 Mtpa
Working fluid: 10 Mtpa ZEP predicts the CO2 utilisation potential is approxinately 400 Mtpa by 2040 (Figure 3.4).
26 ZEP. (2015). CCU - Carbon Capture and Utilization. Bruxelles, Belgium: Zero Emission Platform. 27 ZEPa. (2017). CCS and Europe’s Contribution to the Paris Agreement - Modelling least-cost CO2 reduction pathways. Bruxelles, Belgium: Zero Emissions Platform. 28 Olivier, J., Schure, K., & Peters, J. (2017). Trends in Global CO2 and Total Greenhouse Gas Emissions. The hague, Netherlands: PBL Netherlands Environmental Assessment Agency. 29 Gresser, R. (2018, 04 24). The challenges of the CCU industry. Retrieved from https://setis.ec.europa.eu/setis-reports/setis-magazine/carbon-capture-utilisation-and-storage/challenges-of-ccu-industry

Page 38
Figure 3.4: CO2 utilisation uptake potential Mtpa (ZEP, 2015).
A second, but very important, issue with regards to CO2 utilisation in a climate/circular economy context is what is known as “temporal storage”. This simply refers to the length of time that CO2 is removed from the carbon cycle, and hence its value in dealing with emissions abatement. In many uses, such as a feedstock in the production of fertiliser, CO2 will be released back to the atmosphere at the end of the product life. In the case of EOR, it should be possible to permanently store the CO2 used as a working fluid by the end of a field’s life, however the oil produced from the process has a net carbon footprint. Lifecycle analyses (LCA) of the carbon footprint of utilisation are therefore essential to understanding the contribution and value of the process at a system level.
3.6.2 Mobility 3.6.2.1 Synthetic Liquid Fuel production ZEP’s projection in shows a substantial growth potential for utilisation in the energy sector. This is primarily driven by the options of producing alternative fuels as energy carriers for transport with low/lower lifecycle carbon footprints. As described earlier, a synergistic use of H2 and CO2 can occur in the production of energy carriers such as methanol and formic acid.
If the goal is to convert a solid fuel such as coal or biomass, or a gaseous fuel such as methane into a synthetic liquid fuel, the use of both H2 and CO2 is usually captive. This means that the solid fuel is gasified or the methane is reformed to obtain syngas that can be further processed into the synthetic fuel within the same plant perimeter. Non-captive use – where externally purchased H2 or CO2 is delivered to a production site – can be used to modify the hydrogen-to-carbon ratio in the syngas, thus boosting the yield of the fuel product. In the case of coal/biomass-to-liquids, additional H2 can be supplied to increase the H2/carbon ratio to the value of ~2 that is ideal for the synthesis of liquid hydrocarbons (via the Fischer-Tropsch reaction). Traditionally, this additional H2 is obtained from the water-gas-shift (WGS) reaction within the process. In the case of gas-to-liquids, additional CO2 can be supplied to bring down the H2/carbon ratio from 3 to ~2, making use of the reverse-water-gas shift reaction.

Page 39
If the goal is to convert (excess) renewable electricity into synthetic liquid fuels via the aforementioned P2X – or here P2L – chain of reactions, an external source of carbon is needed, making the P2X process a perfect use-case for captured CO2 (also here, the reverse WGS reaction is required as an intermediate step).
If the growth in CO2 demand for fuel synthesis as projected by ZEP is going to be driven by low-carbon objectives, then clearly the non-captive hydrogen has to also be low-carbon, produced either from methane reforming with CCS or electrolysis using renewable electricity. Under low-carbon objectives, also the non-captive CO2 should not be captured from fossil point sources. The GHG footprint of the synthetic fuels would be lower when using CO2 captured exclusively from biomass or from the air.
Ironically there is both opportunity and competition in some transport sectors between hydrogen itself as an energy carrier in fuel cells, and liquid fuels produced from hydrogen and CO2. These fuels can of course also be used in stationary applications, and may provide additional options for long-term energy storage and short term/peak back-up power generation to renewable sources.
Hence heavy-duty vehicles, aviation, and marine applications are likely to be the primary markets, where alternate energy dense fuels can replace diesel or kerosene. Almost all trucks in the European Union operate with diesel engines, and this type of transport is growing across the EU. Possible new replacement fuels in these engines include methanol, dimethyl ether (DME) and oxymethylene dimethyl ether (OME). The latter two fuels do not produce any carbon soot when burnt in diesel engines and so contribute positively to air quality. DME is a gas above -25°C or below 5 bar and thus has handling requirements similar to LPG.
Other aspects of these alternative fuels include a need for cost reduction in production, and the deployment of the storage and supply infrastructure to enable sufficient market penetration and smooth transition from existing diesel and kerosene infrastructure. Methanol can be produced directly from H2 and CO2 using pure feedstocks or synthetic gases using catalysts. DME and OME production methods include biomass gasification, and by-products of methanol production. The ERA-NET ACT ALIGN project is looking into optimising these processes at scale (in excess of 10 Mtpa conversion of CO2) and lowering costs, as well as understanding the implications for CCU chains.
3.6.2.2 Synthetic Gaseous Fuel production Also gaseous synthetic fuels may be used to decarbonize the mobility sector. The P2X concept can be applied to produce synthetic methane (synthetic natural gas - SNG) from renewable electricity and ideally from biogenic or air captured CO2. The ‘zero-emission’ SNG could be fed into the gas grid or directly compressed to fuel CNG vehicles.
3.6.3 Industrial applications 3.6.3.1 Chemical and Plastic production As previously mentioned, the second largest use for CO2 currently is as a chemical feedstock. Market growth is generally limited by the availability of sufficiently low priced pure CO2 and the cost of new innovative processes and facilities. Some of the potential feedstock uses include:
Urea;

Page 40
Formic acid and ethylene;
Polycarbonates and polyurethanes;
Carbonation of alkaline waste in concrete materials;
Mineralisation such as concrete curing or enhanced weathering
While urea production is a mature market for CO2, the other processes and technologies range from the laboratory bench scale to demonstration scale. For commercial industrial utilisation, capture facilities of the order of 0.5 Mtpa within industrial clusters are likely to be needed, depending on application and feedstock use.
3.6.3.2 Use as solvent: Enhanced Oil/Gas Recovery Figure 3.4 also shows a more than doubling of the use of CO2 as a solvent in the period to 2040. This use is substantially for EOR, and the growth recognises the increasing desire of oil field operators to maximise the economic recovery in operating fields. The process of injecting CO2 to improve production can also be extended to gas fields and coal bed methane, although these have still not reached the level of maturity of CO2-EOR. The major CO2-EOR markets are likely to remain North America, the Middle East and, to an increasing extent, China. Until large scale capture and transportation infrastructure is deployed in Europe, CO2-EOR in the North Sea Basin will probably be too expensive and technically risky to encourage the build-out of offshore facilities. The positive benefit of enhanced hydrocarbon projects is the permanent sequestration of CO2 by the end of the field life.
The growth potential of EOR is dependent on the availability of either naturally occurring or captured CO2. North America has the benefit of large natural accumulations but there is an increasing need to supplement these with anthropogenic CO2. Elsewhere, such as the Middle East and China, focus is on synergistic capture facilities with other industrial processes such as coal gasification, natural gas processing and iron smelting. Annual amounts of CO2 required vary with the scale of the EOR operations but will generally be above 1 million tonnes per field.
Since the CO2 for EOR operations comes with a cost, simple EOR seeks to limit the amount of CO2 that needs to be purchased from an external source. Reservoir engineers will seek to apply injection strategies that limit the loss of CO2 into zones outside the vicinity of the production well and the plant operators will seek to efficiently recycle the CO2 that is coproduced with the oil for re-injection. Moreover, CO2 from natural accumulations is currently cheaper than captured CO2 from anthropogenic sources. Therefore, North America’s EOR operations run predominantly on natural CO2 without any climate benefit.
EOR operations can, however, be modified to not only maximize incremental oil production, but also CO2 storage. This is referred to as EOR+ and is accompanied by additional site characterisation to evaluate the storage potential, additional monitoring of vented and fugitive emissions, and changes to site abandonment practices. According to LCA studies that include the downstream emissions from oil use, EOR+ has the potential to result in net negative emissions per barrel of EOR+-oil30.
30 IEA. (2015). Storing CO2 through Enhanced Oil Recovery - Combining EOR with CO2 Storage (EOR+) for profit. Paris, France: International Energy Agency.

Page 41
3.6.3.3 Other uses without conversion Furthermore, other uses without conversion include:
food processing, preservation and packaging; beverage carbonation; water treatment for pH reduction and remineralisation purposes after reverse osmosis in
desalination plants; and algae cultivation; where CO2 is used to foster algal growth and the algae is harvested as
feedstock for chemicals, food & fodder, and biofuels.
A comprehensive overview of existing and emerging CO2 utilization options is provided by the Global CCS Institute, including order-of-magnitude estimates about the demand in 2011 and the ‘potential future demand’31.
Horticulture (Greenhouses) CO2 is currently used in commercial greenhouses for enhancing plant growth and yields. The Netherlands has a CO2 transport system (OCAP) to move about 0.5 Mtpa from high purity sources in Rotterdam to approximately 500 greenhouses extending to the vicinity of Amsterdam. This use of CO2 is an example of low, or short, temporal storage as the CO2 is returned very quickly to the atmosphere once plants and plant products decay.
Research undertaken by TNO has concluded that there is a potential to increase demand in the Netherlands to between 1.5 and 2 Mtpa at market bearable prices32. Hence as a by-product of a CCUS chain, the scope exists for this form of utilisation as an enabler. Putting this in perspective, the Dutch total CO2 emissions where 167 Mtpa in 2016.
The Dutch example demonstrates that if the conditions are right in an industrial region with greenhouse agriculture in close proximity, some CO2 utilisation may be able to assist in recouping infrastructure costs, but the market will be a small fraction of the emissions abatement required for climate targets.
3.6.4 Decentralized Heat and Power 3.6.4.1 Conversion to CH4 to mix into natural gas network The use case for captured CO2 to decarbonize this sector is again the P2X route, where excess renewable electricity together with an external CO2 source can be converted into synthetic methane or SNG. Fed into the natural gas grid, the SNG is transported and distributed to the point of use for decentralized heat and power. This way, the short-term and seasonal33 buffer capacity of the natural gas grid would provide the storage capacity needed for the excess renewable energy.
31 GCCSI. (2011). Accelerating the uptake of CCS: industrial use of captured carbon dioxide. Global CCS Institute/Parsons Brinckerhoff. 32 Mikunda, T., Neele, F., Wilschut, F., & Hanegraaf, M. (2015). A secure and affordable CO2 supply for the Dutch greenhouse sector. TNO. 33 Via import/export adjustments
Page 42
3.6.5 Centralized Heat and Power 3.6.5.1 Use as working fluid in industry and power The use of CO2 as a working fluid for power cycles is an emerging technology that attracts considerable interest from the fossil and nuclear power industry. The power cycle is run above the supercritical point of CO2 to avoid phase changes between the liquid and gaseous state. Then, small changes in temperature and pressure cause drastic density changes which are exploited to drive the generator. This reduces the equipment size, which is the main advantage of supercritical CO2 over conventional working fluids such as water in steam turbines or air in gas turbines.
3.6.5.2 Geothermal applications
Enhanced Geothermal Systems An Enhanced Geothermal System (EGS) consists of two boreholes into hot dry rock in the deep underground that have been connected through hydro-fracturing to create an artificial heat exchanger. Traditionally, water is circulated through the reservoir and needs to be pumped back up to the surface from several kilometres depth in order to exploit the heat it had absorbed. Instead, supercritical CO2 can be used as the heat exchange fluid, which has – compared to water – a lower heat absorption capacity, but better mobility properties within the reservoir. Furthermore, the large density difference between the cold CO2 at the injection well and the hot CO2 in the production well creates a thermosiphon that eliminates or reduces the energy need for pumping. Once at the surface, instead of transferring the absorbed heat to a separate steam cycle unit, the hot CO2 could be used directly as the working fluid in a supercritical CO2 power cycle.
CO2 Plume Geothermal CO2 Plume Geothermal (CPG) is an extension of the concept of CO2-EGS to conventional CO2 storage reservoirs, which are typically much shallower (800-2500m depth) and less warm than the zones targeted for EGS. Nevertheless, the injected CO2 for storage is colder than the surrounding storage rock and will absorb that heat over time. Furthermore, while the artificial heat exchanger in an EGS operation is confined to a relatively small volume of hot dry rock, a CO2 storage reservoir is naturally permeable and extends laterally over hundreds of meters. A while after the onset of the injection, once the CO2 plume has reached a certain size and has stayed long enough in the reservoir to be heated up, CPG seeks to exploit that heat by drilling a well into the plume and producing a small fraction of the stored CO2. Pumping is not required due to the aforementioned thermosiphon effect, and the energy can be recovered using compact supercritical CO2 turbines, before reinjecting the CO2 via the original injection well34. This concept is being studied in the US and in Switzerland, including within ELEGANCY as part of the Swiss case study.
34 Randolph, J. B., & Saar, M. O. (2011). Combining geothermal energy capture with geologic carbon dioxide sequestration. Geophysical Research Letters, 38, 1-7.

Page 43
4 BACKGROUND AT INTERNATIONAL AND EU LEVEL 4.1 Generic Case Study Parameters In the following, the set of generic parameters is presented, which serves to set the framework for business model development and selection as well as business case analysis. For each parameter, the type of information sought is listed.
4.1.1 CO2 Abatement and Supply Potential The scope for CO2 emissions mitigation using capture technologies in a given location, as well as the potential for supply or import of CO2 to that location from remote sources, are defined by the parameters in the following lists.
CO2 capture potential o Understand the direct/immediate sources of high-purity CO2 in the relevant region o Understand the ownership of CO2 sources – company names, industrial sector,
competitors o Understand existing and/or planned CO2 capture facilities in the relevant region o Rank the emitters by volume and apply relevant capture technology efficiency
percentages (with sensitivities) to understand range of potential captured CO2 volumes
o Refine quantification of emission volumes: average volumes, peak volumes on hourly, daily, yearly basis
o Understand overall long term emissions profile – granularity for a region/cluster with regard to quantity and duration
Location and industry cluster synergies o Industrial cluster CO2 aggregation potential o Connection to other regional sources of CO2 (nationally) o Connection to other countries (cross border) o Potential geological storage sites for storage clusters
4.1.2 Markets: Supply & Demand Characterization of the features of the hydrogen market (supply and demand) and its competitor abatement options, and the potential market demand for CO2 utilisation, is provided by the parameters in the following lists.
Hydrogen market potential – primary/secondary o Understand hydrogen application and users across domestic and commercial heat,
transport, power, and industry o Estimate of potential for displacement of current primary energy source o Understanding of current demand profiles for various end users: average, peak,
hourly, daily, yearly o Impact of equipment developments for commercial and industrial uses o Impact of energy efficiency improvements for space heating on demand profile o Impact of other low carbon energy alternatives; sources and storage (heat pumps,
batteries, electrification, bio-energy etc.)
Hydrogen production potential

Page 44
o Review of sources of hydrogen feedstock and forecast for availability and cost over time – understand water availability for electrolysis
o Production methods and corresponding efficiency o Review of locations for implementation of various hydrogen production
technologies – centralised, distributed, synergies (e.g. at refuelling stations) o Estimate of hydrogen production – “easy (low purity)” vs. “hard (high purity)”;
“cheap” vs. “expensive”; intermittent vs. continuous
CO2 utilisation potential o Local vs. export o Chemical industry – feedstock, new processes, new chemicals and fuels o Enhanced hydrocarbon production o Utilization options with potential for carbon storage (e.g. mineralisation) o Other utilization options without carbon storage (food & beverages, horticulture,
pharma, etc.)
4.1.3 Market Structure: Gas, Electricity, Fuels The parameters listed in the following sections describe the manner in which the existing markets for energy carriers operate, how they are regulated, and the extent to which these are capable of being used for hydrogen and CO2.
Market Functionality o Gas, electricity ownership structures in each market o Hydrogen market, ownership and governance structure o Subsidy or market facilitation and support mechanisms o Competition framework and third party access
Market Regulation o Review of regulated rates of return in gas/electricity markets in country o Licencing: regulations and alternatives o Special requirements for hydrogen and CO2 markets
4.1.4 H2-CCS Infrastructure Chain Design and Deployment The practical framework for delivery of H2-CCS infrastructure through the stages of design, development, procurement, construction and conversion is outlined by the following parameters. They include the interactions required between individual projects and system-level planning for phased up-scaling and deployment logistics.
CO2 Processing and Hydrogen Production o Portfolio of industrial sites – co-location with Natural Gas/CO2 producers and
facilities o Land availability o Availability of support and supply chain services
Hydrogen and CO2: Transportation options o Pipelines, ships, barges, temporary storage, ports o Interactions between hydrogen and CO2 infrastructures – land availability o National and Cross Border network infrastructure o Location/cluster synergies: infrastructure scale, phasing, utilisation, cost reduction

Page 45
o Existing infrastructure – availability for re-use, capacities, phasing (pipes, compressors)
o Technical reviews to determine current capacity and options for up-scaling
Hydrogen and CO2: Storage options o Portfolio of storage sites – ownership, timing and accessibility o Status of stores – immature to mature, capacities, data availability, accessibility o Lifecycle costs – appraisal to abandonment o Location/cluster synergies: infrastructure scale, phasing, utilisation, cost reduction o Existing hydrogen infrastructure: expansion potential and optionality o Technical reviews to determine current capacity and options for up-scaling
Oil and Gas (O&G) Infrastructure: lifetime extension and utilisation of existing O&G assets (Cf. Storage potential)
o Location of existing O&G assets with ownership o Location (block number) and production licence number o Existing permitting constraints for conversion of infrastructure or lifetime
extension o Pipelines: installation dates, product transported, manufacturing materials,
throughput o Platforms: installation dates, production compressor stations, platforms, reservoirs o Compressor Stations: age, suitability o Mothballing potential, constraints, costs
Natural Gas networks conversion/transformation o Understanding of current status of gas distribution networks: capacity, materials,
and suitability for hydrogen use – to understand scale of investment required o Potential disruption to end users: excavations, interruptions of supply, metering o Percentage of users connected to gas networks o Logistics, transmission vs. distribution o Underground hydrogen storage – conversion feasibility of natural gas storage
sites, facilities requirements
Scalability impact o Capacity limitations of hydrogen production, hydrogen storage, hydrogen
transportation network, CCS network o Facilitation of hydrogen fuel cell market development: heat, re-fuelling stations,
power-to-gas from renewables, combined heat and power, transport
Timing, roadmap and development schedule o Multi-sector system architecture o Interrelationship between hydrogen and CCS network deployment o Critical path for first phase development o Utilisation of blending: constraints, upper limits o Status of technical characterisation of storage sites and site portfolio o Decommissioning timescale for relevant O&G assets o Level of technological maturity for each component of the chain o Permitting and licencing timescales o Regulatory, market and technology development
Supply chain synergies and metrics

Page 46
o O&G/Hydrogen/CO2 engineering, operations and maintenance (O&M) services o Domestic vs. imported materials/services o Petrochemicals engineering, O&M, ownership
4.1.5 H2-CCS Infrastructure Chain Operability A number of operational features of the H2-CCS chain and the supply of natural gas for hydrogen production that require both technical and contractual handling to ensure smooth functioning of the system, security of hydrogen supply to the end user markets, as well as security of CO2 disposal capacity are characterised by the parameters in the following sections.
Natural Gas Operational Constraints: feedstock supply management o H2-CCS chain impact o Continuity of supply, temporary storage, curtailment o Quality, specifications o Sales and Purchase Agreement special provisions, performance guarantees o Contractual interfaces, back-to-back provisions, obligation mirroring
H2 Operational Constraints: production, storage and demand management o Security of supply, hydrogen purity o Hydrogen intraday, short term and seasonal storage options o Technical restrictions and technology limitations o Redundancy/backup options to avoid outages o O&M characteristics o Hydrogen leakage – surface infrastructure, subsurface events, monitoring
CO2 Operational Constraints: CCS operational and interface management o Security of disposal capacity o Stream quality and standardisation o Intermittency of CO2 supply to storage operators or for feedstock to industrial
customers o CCS “Always On” provisions, redundancy, backup, performance
4.1.6 Commercial and Financial The commercial and financial parameters listed in the following sections cover the full gamut of economic, commodity, contract, financing, risk, insurance, ownership, taxation, profitability, government support, and carbon penalty aspects of H2-CCS chain investment, delivery and operation. Many of these are quantifiable key performance indicators (KPIs) and metrics for business model selection and business case evaluation.
Macro-economic metrics o Inflation (Retail Price Index, Consumer Price Index) o Exchange rate o Carbon market/European Emissions Trading Scheme o Labour market, skills development o Gross value added (GVA)
Project and cluster metrics o Cost benefit analysis (CBA) of shared infrastructure o CBA of capacity deployment and expansion phasing

Page 47
o Synergistic processes - combined hydrogen and CO2 feedstock, co-located syngas production
o Network corridors o Land availability and use
Commercial and financial risk profiling - risk sharing, liability allocation o Risk of fluctuating H2 demand due to competing technology and understanding of
structure for coordinated decision making process o Performance risk & liability allocation within hydrogen network o Performance risk & liability allocation between hydrogen network and hydrogen
producer o Performance risk & liability allocation within CO2 network o Performance risk & liability allocation between hydrogen producer and CO2
network o Impact of EU Storage Directive on full H2-CCS chain as a consequence of storage
operator obligations
Ownership/Collaboration/cooperation/Public-Private Partnership metrics o Understand industry players o Business model alternatives/ownership of multiple segments of H2-CCS chain;
e.g. CO2 transport and storage, H2 production and transmission o Potential for collaborative structures to share risks/financial commitment o Government: direct investment or possibility of public-private partnerships (PPP)
and for which component (also see financial support mechanisms) o Different delivery models and contracts: Build Own Transfer, Build Own Operate
Transfer, Build Transfer Operate, Build Own Operate, etc.
Capital expenditure (Capex) and Operating expenditure (Opex) optimisation o Capital expenditure assumptions o Operating expenditure assumptions o Understand purity requirements and impact on cost o Maintenance reserve account (%) o Decommissioning cost assumptions o Depreciation and other accounting guidelines – assumed life of asset, depreciation
methodology o Asset reliability and major maintenance/inspection (downtime) period (need for
additional inspections and tests during early period of operation?)
Cost of capital and financing metrics o Equity return expectations (range) o Commercial bank lending rates (range) – construction and operation o European Investment Bank (EIB) and other governmental agency lending rate
(range) o Weighted average cost of capital (WACC) o Debt/equity ratio o Debt service cover ratio o Term, availability of re-financing o Payback period
Financial support mechanisms o Capital grants

Page 48
o Carbon finance o Recycling of environmental tax revenues (such as auction revenues from carbon
allowances) o Low cost government financing like guaranteed bonds or project revenue
guarantees o Loan guarantees o Insurance underwriting
Tax o Local tax rates o Capital allowance treatment o R&D/Innovation allowances and deductibility o Investment incentives/deductibility o Carbon taxation
Commercial/financial metrics o Factors including transfer pricing, performance guarantees, insurance, securities o Maturity of insurance market for relevant component of value chain – understand
which level of insurance cover would be available for third party liability, construction risk
o Pricing structures: capacity payments, price per volume, Take or Pay, valuing volume flexibility, regulated pricing based on capex/opex/re-investment
o Requirements for banks to offer bank guarantees, performance guarantees
Commodity price impact o Price forecasts (Natural Gas, oil, coal) o Petrochemical product markets o Steel for pipelines and facilities o Appliance manufacture, price dependence on inputs
Cost/benefit metrics for different stakeholder groups o Reduced carbon damages o Abatement/marginal abatement costs o Avoided penalties o Domestic and commercial consumers – buildings, transport
4.1.7 Regulation and Policy The following sections present parameters that characterise the existing and required government regulations and policies for: removing market barriers; enabling investable business models; delivering large scale infrastructure for long term climate targets; public sector/government cost-benefit decision making.
Impact of regulations and permitting o Suitability, health safety and environment, compliance, costs, third party access o Hydrogen for residential/commercial use: Product certification process
(residential) and production/appliance standards, training and experience of maintenance staff and installers
o Customer protection schemes o Hydrogen & CO2: Insurance certification process for industrial processes
Page 49
o Safety regulations for handling and use of hydrogen (due to its chemical properties): residential, refuelling stations, commercial and industrial, storage and transport, production
o Network and appliance standards o Odourisation and visualisation of hydrogen flames o Safety regulations for handling and storing CO2 o Statutory rights of access and compulsory purchase for developers
Impact of EU energy directives o Potential market impact of renewable, environment, transport directives o Restrictions and constraints on disposal of CO2 – locally and transborder o Securitisation of CO2 storage leakage risk o Constraints on production and use of hydrogen: purity, permitting, liabilities o Permitting o Liabilities o Certification o EU standards o Implication of safety directives for use of H2 in residential properties
Government value for money metrics o Job creation by components of value chain o Impact on employment benefits o Economic metrics for environmental impact – socialisation of costs and benefits –
annual cost/person and levelised cost/person for tonnes CO2 abated o Tax payments
Integrated assessment o Multi-sector energy system decarbonisation and optimisation o Legacy asset value and leveraging investment/technologies o System-level avoided cost/value destruction metrics o Infrastructure option values o Least cost energy system installed peak capacity
Political acceptance o Environmental and economic policies o 2030/2050 Roadmaps o Technology innovation support o Funding mechanisms o Industrial development, retention, asset protection
4.1.8 Social and Environmental The following parameters help to understand the social and environmental characteristics of H2-CCS chains within the political-economy context of the low carbon energy transition and climate mitigation efforts.
Social acceptance and impact o Existing social pressures, public sentiment and licence to operate o General regional and national opinion o Planning awareness/communication campaigns and educating public opinion o Current pollution levels

Page 50
o Economic situation: level of unemployment, level of industrialisation o Environmental protection zones o Health impact o Disruption
Decarbonisation and emissions metrics including embodied CO2 and Lifecycle analysis (LCA)
o Homes converted per year o Fraction energy usage that is decarbonised (per sector) o Transport sector infrastructure roll-out o Industrial hydrogen & CO2 utilisation
4.2 Regulatory Background: International Level 4.2.1 Overview A series of international obligations, both of a global and regional character, will frame the development of national legislation around a H2-CCS value chain. Those relate primarily to environmental protection obligations, climate change regulation, cross-border transport and infrastructures. Meanwhile, there are few provisions of international law which are drafted for the purpose of regulating CCS or H2 activities. The most relevant ones will related to GHG emissions regulation, transboundary movement of substances and transboundary environmental impacts, offshore storage, trade barriers in environmental services and goods, and standardisation initiatives both for safety and compatibility purposes.
4.2.2 International climate change regime 4.2.2.1 CCS as a mitigation option under the UNFCCC and H2-CCS in economy-wide absolute
emission reduction strategy In the context of the United Nations Framework Convention on Climate Change (UNFCCC), CCS forms part of the mitigation options that States Parties can undertake in order to meet the Convention′s objectives set in Article 2 35.
Mitigation can be achieved through the reductions in human (anthropogenic) emissions of greenhouse gases (GHGs), but can also be achieved through the increase in the capacity of natural or artificial carbon sinks.
The Convention contains several provisions on mitigation, in particular Article 4 which requires (“shall”) State Parties to formulate, implement, publish and regularly update national programmes aiming at the reduction of GHG emissions at the source, and the removal of GHG emissions by enhancing sinks and reservoirs (Art. 4.1 (b)). Parties are required to promote processes that control, reduce or prevent emissions of GHG in relevant sectors. Parties are also required to promote sustainable management, conservation and enhancement of sinks and reservoirs (Art. 4.1, d)).
35 The ultimate objective of the UNFCCC, and any legal instrument related to it, is to stabilize atmospheric concentrations of GHGs at a level that would prevent dangerous anthropogenic (i.e, human) interference with the climate system. (UNFCCC, Art. 2).
Page 51
Under the 2015 Paris Agreement, the main incentive to develop mitigation measures comes from the procedural obligation (shall) for each State Party to prepare, communicate and maintain a Nationally Determined Contribution (NDC) (Art. 4.1). State Parties are required (“shall”) to pursue domestic measures, with the aim of achieving the objectives of their NDC (Art. 4.2). When developing their NDCs, developed State Parties “should” have economy-wide absolute emission reduction targets (Art. 4.4). This means that mitigation actions should not be limited to some few sectors – the most polluting ones -, but cover many sectors such as energy supply and demand, transport, buildings, industry, agriculture, forestry and waste management. Moving towards economy-wide targets fits well with the large scope of applications under the H2-CCS chain.
The Intergovernmental Panel on Climate Change (IPCC) has several times insisted on the key contribution than CCS-technologies can make in terms of targets compliance. In 2005, it concluded that the potential of CCS is “considerable”, and that it can contribute to a reduction of the costs for mitigating climate change compared to strategies where only other climate change mitigation options are considered36. In its Fifth Assessment Report (AR5), the IPCC refers to CCS potential in relation mainly to the decarbonisation of electricity generation based on fossil fuels, in addition to BECCS-technologies37.
4.2.2.2 Emissions accounting and reporting obligations The UNFCCC contains a general obligation for State Parties to account for and report their emissions in the form of national inventories of anthropogenic emissions by sources and removals by sinks (Art. 4.1 (a)). The reporting methodology has been progressively refined. IPCC Guidelines are used by Parties to calculate emission estimates and prepare the national GHG inventories under the Convention and the Kyoto Protocol (annual emissions by gas and by sector). The methodology for estimating and reporting includes: fugitive emission losses at the stages of CO2 capture and transport on the one hand (estimates, applying to energy production operations and oil and gas transportation activities), and storage on the other hand (combination of modelling and measurement techniques, applying to fugitive emission losses)38. Where CCS project activities are transboundary, national GHG inventory compilers from a number of States are required to report on and document different parts of the CCS project cycle.
The IPCC Guidelines do not yet cover directly emissions in relation to H2-CCS activities or CCUS or CCS and reuse. Such possibility has to be further assessed.
4.2.2.3 Financial support to H2-CCS projects under the UNFCCC regime: CDM, climate finance
The development of H2-CCS chain activities can be financially supported by different mechanisms under the UNFCCC regime. A series of requirements – eg. additionality,
36 IPCC Special Report on Carbon Dioxide Capture and Storage, 2005 //www.ipcc.ch/pdf/special-reports/srccs/srccs_wholereport.pdf 37 IPCC, 2014: Climate Change 2014: Mitigation of Climate Change. Contribution of Working Group III to the Fifth Assessment Report of the Intergovernmental Panel on Climate Change [Edenhofer, O., R. Pichs-Madruga, Y. Sokona, E. Farahani, S. Kadner, K. Seyboth, A. Adler, I. Baum, S. Brunner, P. Eickemeier, B. Kriemann, J. Savolainen, S. Schlömer, C. von Stechow, T. Zwickel and J.C. Minx (eds.)]. Cambridge University Press, Cambridge, United Kingdom and New York, NY, USA. 38 2006 IPCC Guidelines, volume 2, chapter 5, sections 5.3 and 5.4.

Page 52
environmental integrity of the project and MVR requirements – must be fulfilled and need to be assessed individually.
A first alternative is to include H2-CCS measures under the project mechanisms of the Kyoto Protocol to the UNFCCC, and in particular the Clean Development Mechanism (CDM). The modalities and procedures for CCS to be eligible to become CDM were agreed in 201139. Validated CDMs projects from CCS activities generate Certified Emissions Reductions (CERs) that serve for the purpose of compliance. In addition to pure CCS projects, it appears that projects combining carbon capture and utilisation technologies with hydrogen have already been approved under the CDM-framework. See for example project Project 0940 “Switching of fuel from Natural Gas to Hydrogen in CCU-II at Dahej complex of GACL”40.
A second alternative is to use the funding from the Green Climate Fund, formerly Global Environment Facility (GEF) Trust Fund41. Those actions are to be linked to the new provisions of the Paris agreement on climate finance (Article 9), according to which industrialized countries shall provide financial resources to assist developing country Parties in continuation of their existing obligations under the Convention. Whether these climate finance mechanisms already apply to H2-CCS activities has to be further assessed.
A third option consists in including H2-CCS activities under the projects to be developed under article 6 of the Paris Agreement. Article 6 of the Paris Agreement builds on the previous mechanisms of the Kyoto Protocol, but also provides for several innovations in terms of financing. Three different frameworks are defined:
1. Cooperative approaches to use “Transferable Mitigation Outcomes” towards commitments (linking between ETS). Art. 6 §§1 to 3 allows countries on a voluntary basis to use and transfer mitigation outcomes, subject to Parties’ authorization (linking domestic ETS schemes at operator’s level)
2. New Market Mechanism to contribute to the mitigation of GHG and support sustainable development likely to replace JI/CDM (and combine their features). The objective is to contribute to overall global mitigation (beyond offsetting, achieving a “net” mitigation mechanism). Other features include: All countries can participate, competition for climate investment; Private sector driven, subject to Parties’ authorization; Allocation of credits to buyer and seller countries to prevent double counting; Supervision by a dedicated body, payment of an adaptation levy.
3. Framework for non-market-based approaches to sustainable development. Art. 6 §§8 &9 of the Paris Agreement lays out non market based approaches in an explicit manner
The detailed rules for each one of those mechanisms are still to be developed by 2020. A matter of major importance for H2-CCS activities will be the inclusion of CCS projects under those mechanisms. If CCS is not formally identified as eligible measure, it is preferable that the principle of technological neutrality applies. It will create more competition for H2-CCS projects, but will ensure that that the later ones can participate to the different mechanisms.
39 Decision 10/CMP.7 (FCCC/KP/CMP/2011/L.4 40 https://cdm.unfccc.int/Projects/DB/DNV-CUK1171529871.86 41 www.greenclimate.fund/home
Page 53
4.2.3 International energy regime: investments, transit, etc. Similarly to electricity and gas, hydrogen is an energy carrier depending on transport infrastructures. This raises new but similar issues under existing international regulatory regimes aimed at protecting investment in hydrogen / CCS-assets, but as well in case of transport infrastructures transiting through different countries, of their protection. In the ELEGANCY-project, we primarily target 5 European countries, but the legal practice developed by arbitration tribunals awards under the Energy Charter Treaty (ECT), has confirmed that the international investment protection provisions of the ECT also apply between EU states, accepting possible investor-State arbitration under Art. 26 ECT, as far as the state is a party to that treaty.42
4.2.4 International trade regime and H2-CCS technologies As H2-CCS technologies develop and their use is progressively integrated into national mitigation policies, one can raise the question of access to those technologies. Both tariffs and non-tariffs trade barriers to technology transfer have been identified in the context of energy transition 43. One can also expect that similar national or regional protective measures may apply to H2-CCS technologies, which could delay costs reduction for CCS technologies and slow technology transfer and diffusion44. In such circumstances, the legality of those protective measures will need an assessment under both the World Trade Organisation (WTO) discipline and the trade-related measures of the UNFCCC-regime, including the Technology Mechanism.
The Doha Development Agenda did provide for a specific section on “trade and environment” and called on WTO members to negotiate the “reduction or, as appropriate, elimination of tariff and non-tariff barriers to environmental goods and services (EGS). However, the negotiations on EGS are currently stalled due to the impossibility of reaching consensus on a general definition of environmental goods. Transfer of H2-CCS technologies could also be promoted under a more recent plurilateral initiative under the draft Environmental Goods Agreement under the hospice of the WTO and to which both the EU, Norway and Switzerland are part to45.
A key issue in bringing down the trade barriers to H2-CCS technologies will be the inclusion of those technologies to any list of environmental goods and services (EGS) or environmental goods, on which such agreements would build on. Much will also depend on the definition of CCS in those agreements, as the CCS technologies can be combined with other processes, such as in the case of hydrogen.
42 See Electrabel v. Hungary award, and Charanne and Construction Investments v. Spain award, SCC Case No. V 062/2012, Final Award, 21 January 2016 43 On the revival of techno-nationalism in relation to low carbon energy technologies and the legal challenges it creates, see C. Banet, ‘Techno-nationalism in the context of Energy Transition – Regulating Technology Innovation Tnrasfer in Offshore Wind Technologies’, in D. Zillman, L. Godden, L. Paddock, and M. M. Roggenkamp (eds), Innovation in Energy Law and Technology (OUP, 2018), Chap.5, pp.74-99. 44 Carbon dioxide capture and storage demonstration in developing countries: analysis of key policy issues and barriers, Appendix 2 – Assessment of Trade Barriers to CCS in International trade Negotiations, Asian Developmnent Bank, April 2011. 45 See the dedidated website on the Environmental Goods Agreement negotiations, on the WTO-website: https://www.wto.org/english/tratop_e/envir_e/ega_e.htm

Page 54
4.2.5 International standardisation initiatives 4.2.5.1 International standards for CCS-related operations The International Organization for Standardization (ISO) is working on standards in relation to CCS technologies and operations. Technical Committee ISO/TC 265 has received a broad scope of working areas which could also include H2-CCS technologies. ISO/TC 265 scope includes the standardisation of: design, construction, operation, environmental planning and management, risk management, quantification, monitoring and verification, and related activities in the field of carbon dioxide capture, transportation, and geological storage46.
4.2.5.2 International standards for H2-related infrastructures The availability of international standards varies according to the type of H2 infrastructure. Different alternatives for H2 transport infrastructures exist.
International standards for gas appliances using hydrogen Standards may encompass:
H2 production facilities Gas turbines: co-firing with hydrogen in industrial gas turbines; gas turbine combustion
system development for high hydrogen fuels. Gas burners: impact of hydrogen mixture on installed gas appliances.
International standards for injection of H2 in natural gas infrastructures To date, gas quality requirements for use in the natural gas transport infrastructures have not been regulated in great detail by either international or European standardization bodies. One should therefore refer to quality standards for natural gas in gas infrastructures. See for example:
ISO 13868 “Natural gas – Quality designation” refers gas quality parameters; The EASEE-gas Common Business Practices released by EASEE-gas. The CBP-2005-
001-02 deals with Harmonisation of Natural Gas Quality. It recommends natural gas quality specifications, parameters and parameter ranges to streamline interoperability at cross-border points in Europe. Hydrogen concentration limits are not specified in particular, but only “insignificant levels of hydrogen” are tolerated47.
International standards for gas and tanks engines Standardisation initiatives are more advanced in the vehicles industry where there have been several attempts to harmonize vehicle approval requirements globally, including:
United Nations Economic Commission for Europe (UNECE) Global Technical Regulation (GTRs):
o GTR Number 13 - Hydrogen and Fuel Cell Vehicles. It is the defining document regulating safety requirements in hydrogen vehicles, and in particular, fuel cell electric vehicles (FCEVs). The safety requirements include specifications on the
46 See website of the ISO/TC 265 and the different Working Groups: https://www.iso.org/committee/648607.html 47 The CBP it is not legally binding for the transportation of natural gas, unless agreed upon under private law agreements.

Page 55
allowable hydrogen levels in vehicle enclosures during in-use and post-crash conditions and on the allowable hydrogen emissions levels in vehicle exhaust during certain modes of normal operation. The standards are not binding in themselves, but will serve as the basis for the national regulatory standards for FCEV safety in the European Union, in addition to North America (led by the United States), Japan and Korea.
United Nations Regulation on Hydrogen and Fuel Cell Vehicles (HFCV)48 o Compressed Natural Gas (CNG) tanks: UN ECE Regulation No. 110: Uniform
provisions concerning the approval of: specific components of motor vehicles using CNG in their propulsion system, including maximum hydrogen values.
4.2.6 CCS and hydrogen cross-border activities 4.2.6.1 Transboundary movement of CO2: offshore or onshore Although CCS activities have been included in the London Protocol to the London Convention and in the OSPAR Convention, some issues remain unresolved which refrain the development of transboundary movement of CO2. The 1972 Convention on the Prevention of Marine Pollution by Dumping of Wastes and Other Matter and the 1996 Protocol to it (the London Convention) The Convention covers the deliberate disposal at sea of waste or other matter from
vessels, aircraft and platforms. CO2 is not specifically mentioned in the London Convention. However, London Convention’s Scientific Group concluded that CO2 may fall within the London Convention’s annex I definition of ‘industrial waste’ = prohibited to be dumped in the sea.
In 1996, Parties agreed on the London Protocol (entered into force on 24 March 2006). As a consequence of it, all dumping of waste is prohibited, except for the possibly acceptable wastes on the so-called ‘reverse list’ contained in its annex I. This entails that the transboundary movement of CO2 is currently prohibited under the London Protocol by virtue of its Article 6. It prohibits the export of waste or other matter by the parties to the London Protocol to any other countries for dumping or incineration at sea49.
Annex I to the London Protocol was amended in 2006 to include CO2 streams from CCS, which could be considered eligible for dumping provided that they meet three criteria:
1. disposal is into a sub-seabed geological formation (i.e. not into the water column);
2. the CO2 stream is of high purity, containing only incidental amounts of associated substances; and
3. no waste or other matter has been added for the purpose of disposal In 2009: Article 6 of the London Protocol amended by to allow the export of CO2
streams for disposal, provided that the countries concerned enter into an agreement or arrangement which would include:
48 Entered into force on 15 June 2015. 49 For an interpretation of the notion of “export”, see the works of the Legal and Technical Working Group on Transboundary CO2 sequestration of the IMO. “Unintended migration” is also covered by Article 6 of the London Protocol.
Page 56
1. the allocation of permitting responsibilities between the exporting and receiving countries; and
2. in cases of export by a contracting party to a non-party to the London Protocol, a level of regulation which would ensure that the contract or arrangement does not derogate from the obligations of the contracting parties under the London Protocol.
When in force, this would make it applicable to transboundary activities where only the exporting State is a party to the London Protocol. It could apply to CCS project activities.
However, pursuant to Article 21 of the London Protocol, a minimum threshold of 2/3 of the contracting parties to the London Protocol must accept the amendment for its entry into force. This threshold is not reached as per today.
Additional relevant international law instruments Conventions related to the movement of waste:
o The Basel Convention on the Control of Transboundary Movements of Hazardous Wastes and their Disposal
Marine protection and pollution: o The United Nations Convention on the Law of the Sea o 1973 International Convention for the Prevention of Pollution from Ships, as
modified by the Protocol of 1978 (MARPOL)
4.2.6.2 Transboundary movement of hydrogen The question can be raised as to the applicability of already existing bilateral agreements (eg between the UK and Norway) for the purpose of cross-boundary hydrogen transport, involving a discussion of the inclusion of hydrogen within the material scope application of those agreements (related to petroleum products).
The transboundary movement of hydrogen could otherwise follow the regime of LNG (shipping) or natural gas (pipelines).
4.2.7 Regional environmental agreements 1992 Convention for the Protection of the Marine Environment of the North-East Atlantic (OSPAR Convention) The Convention regulates human activities which can have an adverse effect on the
ecosystems and biodiversity in the North-East Atlantic. In 2007, amendments to the OSPAR Convention allowed the storage of CO2 in
geological formations under the seabed (while not specifically addressing transboundary CCS). They entered into force in 2012.
In addition, Decision 2007/2 of the OSPAR Commission provide for regulatory requirements to ensure that CO2 streams will be retained permanently in the geological formations in the subsoil of the OSPAR maritime area, including sub-seabed geological formations. It also requires that the activity will not lead to significant adverse consequences for the marine environment, human health and other legitimate uses of the marine area.

Page 57
4.3 Regulatory Background: EU Level 4.3.1 Introduction Most of the legal issues that the development of H2-CCS chain activities will raise are to more or less extent covered by specific EU legislation, resulting in harmonised secondary legislation. Meanwhile, due to the fact that the H2 technologies are still under development and that EU CCS legislation has not been revised as foreseen, there is a need both for further interpretation of the applicability of existing provisions to H2-CCS activities, and in some circumstances for reviewing some legal provisions which do not enable to develop such activities and reduce costs.
This Section reviews applicable EU legislation to the H2-CCS chain as described in the ELEGANCY project. It necessarily represents a preliminary mapping and will be adjusted and completed according to the interaction with other Work Packages in the project, including Work Package 5 in charge of the national case studies.
4.3.2 Forthcoming regulatory changes 4.3.2.1 The Clean Energy for All Europeans legislative package On 30 November 2016, the European Commission adopted a comprehensive legislative package called Clean Energy for All Europeans50. The legislative package includes proposals for review of several directives and regulations which are of direct relevance for the ELEGANCY project since they include amendment proposals on energy market and climate change legislation. It also includes proposals for new legislation, such as on governance of the Energy Union. The legislative package includes:
Proposal for a recast of the Internal Electricity Market Directive Proposal for a recast of the Internal Electricity Market Regulation Proposal for a recast of the ACER Regulation Proposal for a Regulation on Risk-Preparedness in the Electricity Sector and Repealing
the Security of Supply Directive Proposal for a recast of the Renewable Energy Directive Proposal for a revised Energy Efficiency Directive Proposal for a revised Energy Performance of Buildings Directive Proposal for a Regulation on the Governance of the Energy Union
Among the directives and regulations under review which are relevant for the ELEGANCY-project are:
a new directive amending and repealing Directive 2009/72 (Electricity Directive), a new regulation on the internal electricity market, amending and repealing Regulation
714/2009 (Electricity Regulation) a revised Renewables Directive 2009/28 (RED) a revised Energy Efficiency Directive 2012/27 (EED) a new regulation repealing Regulation 713/2009 on the ACER (ACER Regulation)
50 See the dedicated website of the European Commission, Directorate-General for Energy https://ec.europa.eu/energy/en/topics/energy-strategy-and-energy-union/clean-energy-all-europeans.

Page 58
The package is expected to be finally negotiated by the trialogue by the end of the year 2018, for a progressive entry into force as from 1 January 2020 in the EU Member States.
As the negotiations on the different legislative proposals are already well advanced, it will be too late to influence to decision-making process. However, the ELEGANCY project results must take into account the content of the different acts as finally adopted, some of them being able to enter into force before the end of the project lifetime.
4.3.2.2 Review of the CCS Directive 2009/31/EC The review of the CCS Directive has been long discussed and the process has been postponed. The responsibility of the review lays with the Directive General for Climate Action (DG CLIMA) of the European Commission. DG CLIMA started a more official process for the review in 2014 with a stakeholder consultation, without any concrete outcomes in terms of revision.
Two reports on the implementation of the Directive have been published, in 201451 and 2017 (the latter as part of the second report on the state of the Energy Union)52. The Commission will continue to assess the implementation of the Directive, with the next report planned for October 2019.
The results from the ELEGANCY project could serve as valuable inputs in discussions on the review of the CCS Directive. This should be integrated into WP6 on Communication.
4.3.2.3 Review of the EU ETS Directive The latest review of the EU ETS Directive started in July 2015 when the European Commission put forward a proposal for review53. On 27 February 2018, the Council formally approved the reform of the EU ETS for the period after 2020, which is the final step of the legislative process. The reform has consequently been formally adopted. The new directive will enter into force on the 20th day following its publication in the Official Journal of the EU (not yet published at the time of the finalization of this draft chapter).
4.3.2.4 Others The review of the Gas Directive is also under discussion, following the ordinary legislative procedure54. The main objective of the proposal is to extend common rules for the internal market in natural gas to gas pipelines from third countries. Although this could have some theoretical applications to H2 transboundary transport, the application of the new provisions to the ELEGANCY project is not part of this first assessment.
51 First implementation report: Report from the Commission to the European Parliament and the Council on the Implementation of Directive 2009/31/EC on the geological storage of carbon dioxide, COM(2014)99. 52 Second implementation report: Report from the Commission to the European Parliament and the Council on Implementation of Directive 2009/31/EC on the Geological Storage of Carbon Dioxide, 1.2.2017, COM(2017) 37 final 53 European Commission, Proposal for a Directive of the European Parliament and of the Council amending Directive 2003/87/EC to enhance cost-effective emission reductions and low-carbon investments, 15.7.2015, COM(2015) 337 final. 54 Proposal for a Directive of the European Parliament and of the Council amending Directive 2009/73/EC concerning common rules for the internal market in natural gas, 8.11.2017, COM(2017) 660 final.
Page 59
4.3.3 Classification of H2-CCS chain activities: between electricity, gas and heat regulation
4.3.3.1 CCS Directive 2009/31/EC on carbon dioxide capture and storage The most relevant piece of EU legislation for CCS activities is Directive 2009/31/EC on carbon dioxide capture and storage (CCS Directive). The main processes covered by the CCS Directive are the capture of CO2 from industrial installations, its transport to a storage site and its injection into a suitable underground geological formation for the purpose of permanent storage. The main requirements relate to:
Site selection and exploration Storage permits Acceptance of CO2 streams, monitoring and reporting Leakages (corrective measures) Closure, post-closure obligations and transfer of responsibility Financial security, financial contribution, third-party access
It is important to note that the CCS Directive focuses on permanent storage of CO2. Its objective is to establish a legal framework for the environmentally safe geological storage of carbon dioxide. In addition, the directive aims to ensure that there is no significant risk of leakage of CO2 or damage to health or the environment, and to prevent any adverse effects on the security of the transport network or storage sites. This entails that other utilisations of CO2 before capture and storage, such as those in relation with H2, were not the primary regulatory objective of that directive. H2-CCS chain operations and CCU may consequently need the adoption of another legal instruments or the insertion of new provisions in other legal acts in order to develop.
Being a directive, Member States are bound as to the results to be achieved through the CCS directive, but retain a certain discretion in terms of the form and method of implementation55. This means that some disparities may occur in the national implementation legislation. Such disparities have already been noted in the Commission’s implementation reports.
4.3.3.2 Energy market design - Unbundling regime and hydrogen operations The interfaces between the H2-CCS chain and other parts of the energy system creates new business opportunities, but also creates new energy activities which needs to be legally qualified. The activities also build on at least three energy markets, which are the electricity, gas and heat markets.
A main question to be solved will be to know where to place hydrogen operations under the electricity and gas directives. This involves considerations related to:
Interactions between the H2 networks and other segments of the energy transmission and distribution system;
interaction between H2 networks and industrial utilisation of CO2 and H2 as feedstock; the use of H2 as energy carrier. Hydrogen has been identified as a potential zero-emission
energy carrier for the future, primarily for the transport sector but also for energy storage and CHP applications;
interaction with energy storage operations – using hydrogen
55 Article 288, TFEU

Page 60
interaction with Power-to-gas P2G energy market reform and a technology-neutral design of the energy market; among others.
4.3.3.3 H2 production The ELEGANCY-project goals for hydrogen production are as follow:
combined systems for H2 production and H2/CO2 separation Enable efficient H2 production and CO2 capture at different plant sizes Find ways to increase the efficiency and productivity of natural gas/biogas reforming and
H2/CO2 separation independently of the plant size Integrate H2 production and CO2 capture with significant industrial processes such as
steel production Legal questions related to H2 production, CO2/H2 separation and CO2-capture as part of the same process would be:
- Requirement of CO2-capture ready installations, for example for steam reforming operations which generate CO2;
- Ownership of the gas captured; - Permitting issues for H2-production; - Emissions regulation.
Some authorisations will be required under national legislation, such as: national legislation dealing with planning approval, building regulations and fire regulations.
Most other aspects are of technical nature, more than of a legal one.
4.3.3.4 H2-storage activities: legal qualification The question of the legal qualification of the hydrogen storage activities have to be further clarified, in order to delimit responsibilities, but also to provide an attractive regime. A clearer qualification will also bring clarity with regards to grid operators’ unbundling requirements between commercial and grid activities. Among the issues discussed in relation to energy storage (through hydrogen) is who will be responsible for the storage, between the grid company or the generator, and where do storage activities fit.
The issue is currently discussed as part of the Clean Energy for All Europeans legislative package, both as part to the Electricity Directive and the Renewable Energy Directive.
4.3.3.5 CO2 capture operations One goal of the ELEGANCY project is to de-risk storage of CO2 produced from natural gas reforming for H2 production.
The feasibility for CCS retrofitting for new large scale combustions plants can also be assessed. The CCS Directive requires that when applying for licence, operators assess the technical and economic feasibility of carbon capture, transport and storage. If the assessment is positive, space on the installation site must be set aside for the equipment necessary to capture and compress CO2. In the countries that have performed them, assessments found that CCS is not always

Page 61
economically feasible. Meanwhile, some countries like the UK have defined more strengthened requirements than in the directive and requires in CO2 capture ready equipment.
Directive 2008/1/EC of the European Parliament and of the Council of 15 January 2008 concerning integrated pollution prevention and control is suitable for regulating, in respect of certain industrial activities, the risks of CO2 capture to the environment and human health and, as a result, should be applied to the capture of CO2 streams for the purposes of geological storage from installations covered by that Directive.
Council Directive 85/337/EEC of 27 June 1985 on the assessment of the effects of certain public and private projects on the environment should be applied to the capture and transport of CO2 streams for the purposes of geological storage. It should also apply to storage sites pursuant to this Directive
4.3.3.6 Transport of CO2 The operation of CO2 pipelines and injection wells will be to be legally qualified under EU law.
4.3.3.7 Storage of CO2 – EU regime The CO2 captured could be store temporarily before re-use and ultimately permanent storage. Both aspects of temporary and permanent storage of CO2 have to be addressed.
4.3.3.8 H2 and CO2 usages The EU regime for CCU and CCUS needs to be further clarified.
4.3.3.9 H2 and CHP applications: heat regulation The applicable piece of legislation will be as per today Directive 2012/27/EU of the European Parliament and of the Council of 25 October 2012 on energy efficiency.
4.3.4 Adaptation of gas infrastructures to H2 Link to gas directive: Directive 2009/73/EC concerning common rules for the internal market in natural gas.
4.3.4.1 Use/re-use of installations for hydrogen/CO2 Hydrogen has been identified as a potential zero-emission energy carrier for the future, primarily for the transport sector but also for energy storage and CHP applications. This raises legal issues related to:
Injection into existing gas infrastructures – blending Transport of hydrogen – H2 transport network Gas quality / purity: including H2 purity and contractual requirement or standardised;
characterize the properties of H2 mixed with CO2, CO, and CH4. Re-use of decommissioned installations – decommissioning. Grid balancing services – enable hydrogen solutions to be part of country’s local
frequency reserves.
Page 62
4.3.4.2 H2 storage
4.3.4.3 Access to H2-CCS / H2-infrastructures by others Injection tariffs Standardised injection limits Terms and conditions for access: Third Parties Access regime, pricing, tariffs, auxiliary
services.
4.3.5 Hydrogen trading market - pricing The trading modalities for hydrogen could raise competition law issues.
4.3.6 Interaction with fuels transport regulation – fuel quality The applicable legal instruments would be:
Directive 2014/94/EU of the European Parliament and of the Council of 22 October 2014 on the deployment of alternative fuels infrastructure (see recitals 4 and 5, with direct references to hydrogen);
Directive 2009/28/EC on the promotion of the use of energy from renewable sources, which sets a market share target of 10 % of renewables in transport fuels
Directive 2015/1513/EC, Fuel Quality Directive (FQD), amending Directives 98/70/EC and 2009/28/EC
4.3.7 Public support to H2-CCS applications Tax incentives CO2 tax Public procurement
4.3.7.1 Public support to CCS A main research question is to which extend H2-CCS activities be covered by current support to CCS under EU law.
EU state aid rules Assessment of the compatibility of national support measures in favour of H2-CCS activities under EU state rules, in particular Article 107(1) of the Treaty on the Functioning of the European Union (TFEU) and Guidelines on State aid for environmental protection and energy 2014-2020.
Projects of common interest (PCIs) lists and Connecting Europe Facility (CEF) funding
Assessment of the possibility to access to the CEF funding by being inserted on the PCI list for cross-border transport CO2.

Page 63
NER 300 – New EU Innovation Fund In Phase 3 of the EU ETS (2013-2020), 300 million allowances set aside in the New Entrants Reserve to fund the deployment of innovative renewable energy technologies and carbon capture and storage through the NER 300 programme56.
2015 Reform of the EU ETS - The Commission has created several support mechanisms to help the industry and the power sectors meet the innovation and investment challenges of the transition to a low-carbon economy. These include two new funds:
Innovation fund - extending existing support for the demonstration of innovative technologies to breakthrough innovation in industry
Modernisation fund - facilitating investments in modernising the power sector and wider energy systems and boosting energy efficiency in 10 lower income member states
4.3.7.2 Public support to hydrogen Regulatory or financial incentives
o Regulatory incentives: - partial exemptions from grid fees, taxes or levies. No harmonised practice
between Member States. o Financial incentives:
- Tax incentives - Feed-in tariff for hydrogen
Public vs. private sources of capital By states By public entities (cities, regions, publicly owned companies, etc.) General scheme or individual aid Review of state aid case (mainly in transport sector) Support to the different usages / H2 utilisation:
o Ex: transport / mobility (Switzerland) o Zero purchase tax (can be as high as 100 % for petrol cars) o Zero VAT (25 %) o Low annual road-tax (10 % of normal) o Free public parking (1 000 BEV/FCEV spots in Oslo city centre) o Access to bus / taxi-lanes (saving commuters significant travelling time daily) o Free passing through toll-roads (Recently approved extended for FCEVs in the
new Oslo Road Act (Oslopakke) 3) o Free transport on public ferries (although some ferry companies now also charge
BEVs)
56 https://ec.europa.eu/clima/policies/lowcarbon/ner300_en

Page 64
4.3.7.3 Support to CCS and hydrogen combined
Overview of relevant support measures
Overcompensation risk
4.3.8 Link to renewable energies activities and renewable energies support Assessment of the qualification as:
Energy waste: H2 allows to limit energy waste due to intermittent renewable energies. Renewable fuel: Hydrogen fuel, when produced by renewable sources of energy like
wind or solar power, is a renewable fuel.
4.3.9 Market valorisation of hydrogen: guarantees of origin, etc. H2 could be made traceable, through for example certificates / guarantees of origin (GoOs), relying on the instruments defined in the Renewable Energy Directive and the Electricity Directive.
4.3.10 Quota obligations and emissions accounting under EU ETS In general, emissions accounting under the EU ETS.
CO2 emissions covered by the scheme include emissions from o power and heat generation o energy-intensive industry sectors including oil refineries, steel works and
production of iron, aluminium, metals, cement, lime, glass, ceramics, pulp, paper, cardboard, acids and bulk organic chemicals
The inclusion of storage sites under the EU ETS.
The revised ETS Directive includes CCS explicitly in Annex I. Emissions captured, transported and stored according to this Directive will be considered as not emitted. Liability for climate damage as a result of leakages was already covered by the inclusion of storage sites in Directive 2003/87/EC, which requires surrender of emissions trading allowances for any leaked emissions.
The latest review of the EU ETS Directive started in July 2015 when the European Commission put forward a proposal for review57. On 27 February 2018, the Council formally approved the reform of the EU ETS for the period after 2020, which is the final step of the legislative process. The reform has consequently been formally adopted. The new directive will enter into force on the 20th day following its publication in the Official Journal of the EU (not yet published at the time of the finalization of this draft chapter).
57 European Commission, Proposal for a Directive of the European Parliament and of the Council amending Directive 2003/87/EC to enhance cost-effective emission reductions and low-carbon investments, 15.7.2015, COM(2015) 337 final.

Page 65
Interesting for the H2-CCS chain is that the proposal has for purpose to enhance cost-effective emission reductions and investments in low carbon technologies. This can mean new funding opportunities for H2-CCS technologies. See further Section 4.3.7.1 on NER 300 and the establishment of a new Innovation Fund.
4.3.11 Environmental requirements, environmental liability / environmental aspects Applicable legislation in addition to the EU ETS, including:
Emissions permits for the different plants: H2 production, CO2 capture, … the Industrial Emissions Directive58 Air Quality Directive59
4.3.12 Safety regime With respect to:
Steam reforming process Appliances. It requires assessing whether the equipment used in the installation complies
with the essential health and safety requirements of all applicable EU Directives. For fuel cells and associated equipment the applicable Directives will include the ATEX Directives, Pressure Equipment Directive, Machinery Directive, Gas Appliances Directive, Low Voltage Directive and Electromagnetic Compatibility Directive
Vehicles: o Subject to certification by the PED - European Pressure Equipment Directive o Those destined for transport on roads are subject to approval by the TPED –
European Transportable Pressure Equipment Directive and the ADR – European Agreement Concerning the International Carriage of Dangerous Goods by Road
o Transport on rail and inland waterways is regulated by RID – European Agreement on the International Carriage of Dangerous Goods by Rail and – European agreement on the International Carriage of Dangerous goods by Inland Waterways.
o Hydrogen vehicles have to undergo a whole-vehicle type approval in the EU according to 79/2009/EC and 406/2010/EU
o In the attempt to harmonize vehicle approval requirements globally, the GTR - Global Technical Regulation - has been adopted in Europe (2015) and will replace the EC Regulations.
4.3.13 Public procurements
58 Directive 2010/75/EU and replaces several directives, including the Large Combustion Plant Directive (2001/80/EC) and the Integrated Polution Prevention and Control Directive (2008/1/EC) 59 Directive 2008/50/EC merges four directives and one Council decision into a single directive on air quality

Page 66
5 NATIONAL BACKGROUND: INTRODUCTION An integral component of ELEGANCY are the case studies defined for each of the five participating countries, which will be used to apply and test the research findings produced over the course of the project (technologies, methodologies and assessment tools). The case studies represent subsets of the overall H2-CCS chain and these ‘sub-chains’ reflect the particular national interests and circumstances. To recall, and as illustrated in Figure 5.1, the five case studies are dedicated to:
• Germany: accelerating the decarbonization of gas infrastructure via a H2-CCS chain – either a pure H2 distribution network, or by mixing H2 into the existing natural gas network;
• The Netherlands: decarbonizing the Rotterdam industry through (i) the introduction of clean H2 as raw material and energy carrier for its base industries and utilities, and (ii) CO2 capture at large single point emitters, CO2 offshore storage and CO2 utilization;
• Norway: decarbonizing the Norwegian gas business by utilising and exporting H2 and H2-enriched natural gas;
• Switzerland: (i) decarbonizing the Swiss road transport sector by using clean H2, (ii) accelerating the Swiss CCS/geothermal roadmap and (iii) studying carbon-negative solutions, which can provide vital headroom in the transition to a low carbon economy;
• The UK: providing evidence and technical research supporting and informing the UK H21 Roadmap, by addressing technical and business case issues for the first phase of the roll-out for Leeds, Teesside and Kingston Upon Hull; including also integration with industrial clusters.
Figure 5.1: ELEGANCY case studies.
Page 67
In the following, country by country, the case study is briefly introduced, building on information available from WP5 (e.g. Deliverable D5.1.1 - Regional overview of requirements and potentials of H2 markets). Then, the case study parameters are presented, followed by the regulatory background that is based in desk-review of the existing body of law and related legal literature. From a legal perspective, the case studies raise some general questions as to:
Common law vs. civil law Public law requirements vs. contractual law requirements The reliance on standardisation Energy and climate planning tools
The next subsection in each country chapter is dedicated to the market background, as compiled from the inputs that were collected using the tool described in Section 2.4 (see Table A.4 in Appendix A for list of contributing organisations). This represents a first appraisal at this early stage of the ELEGANCY project. The level of detail will constantly improve as the project progresses and as the business case development framework will be applied by the country teams involved in the case studies.
The market background assessment includes a list of existing markets and key market players (or for early-stage markets: programmes, R&D activities, etc.), followed by the description of business drivers and market failures. Note that this assessment is deliberately limited to the current situation and hence does not address forward looking elements such as the market potential and outlook. Lastly, market context data is provided for each country in tabular form in Appendix B. This was compiled to inform the next steps in WP3’s business case development work, e.g. the risk assessment.

Page 68
6 THE NETHERLANDS The Dutch case study will develop a roadmap for decarbonizing the Port of Rotterdam and wider industrial region. The area depends heavily on fossil fuels through import and export of oil products, oil refining and petrochemical operations as well as power generation. A credible path to decarbonization must therefore embrace the implementation of H2 and CCUS. The roadmap will identify the possibilities for CO2 capture, H2 and CO2 usage, as well as offshore CO2 storage, and will serve as an example for other industrial clusters in Europe.
To make a timely transition to low-carbon production feasible, the roadmap starts from the production of clean hydrogen from natural gas. Unlike (excess) renewable power for the alternative production of green hydrogen via electrolysis, natural gas is directly available at sufficient scales for the Rotterdam industry and power generation. The Dutch case study will seek how that clean hydrogen technology can be integrated into the versatile infrastructure of the Port of Rotterdam. Thus, the study will better prepare the Rotterdam industry for a rapid decarbonisation, while still utilizing existing industrial assets.
Having an offshore CO2 storage facility in place together with an offshore transport system and onshore local CO2 collection system, an analysis will be made about the consequences in sizing and economy of scale if these facilities would be shared with a German CO2 stream collected for example in the Ruhr Area.
Another particular feature in the Dutch case study is the abundance of greenhouses in the Rotterdam Port area, where gas-fired heaters are currently used to provide heat and CO2 for accelerated plant growth. Thus, utilization of captured CO2 in combination with H2-fuelled heating is a H2-CCUS application that can deliver net CO2 emission reductions in the Netherlands.
6.1 Dutch case study parameters 6.1.1 Climate Business Context National Policies
o Objective to reduce the Port of Rotterdam (PoR) emissions from over 30 Mtpa currently down 14 Mtpa by 2030: need to understand residual emissions, scope for offsets
o Impact of the newly signed Coalition Agreement (2017) with specific CO2 reduction targets, planned closure of coal fired power plants and funding for a CCUS project.
EU Policies o Impact of Pan-European low carbon policies on the PoR markets – greatest
impact will be from transport, power and industrial energy use. o Impact of Pan-European low carbon policies on the PoR asset base (worth €200+
Billion). o Impact of EU Project of Common Interest (PCI) policies/support: new and on-
going projects with funding
6.1.2 Markets Hydrogen

Page 69
o Utilisation potential for transport and heating (both commercial and domestic): market size, economics of conversion/roll out
o Utilisation potential for power generation – local and export – merit order, Feed-in-tariffs (FiTs)
o Industrial utilisation market – scope, value, environmental impact, combination (synthetic fuels and feedstocks), future carbon neutral steel production?
o PoR business opportunities and expansion potential: opportunity for PoR to act as H2 import/export hub for other European countries (Norway, UK, Germany, France…) and beyond.
CO2 o Industrial utilisation market: scope (from current use for greenhouses to other
commercial and industrial uses), value, environmental impact, combination (synthetic fuels and feedstocks), investigate possibility of future carbon neutral steel production
o PoR business opportunities to act as CO2 export hub for other European countries (e.g. Belgium, France, Germany) and beyond.
6.1.3 Delivery First transition phase hydrogen production
o Timing, synchronisation with coal power generation phase-out o How clean? Emissions LCA
Infrastructure o Long term viability of CCS infrastructure – consider holistic infrastructure design
with scalability from the start to avoid stranded H2-CCS assets over long term o Technical and cost optimisation of the PoR facilities and infrastructure – phasing
through blending as an option, multi-sector planning, establishment of industrial activities utilising infrastructure
o Utilisation and expansion of existing H2 infrastructure: Rotterdam/Antwerp/France and investigate synergies with common/co-located infrastructure
o Offshore transport and storage - focus on optionality and scalability through definition and development of real technical and commercial options:
• Re-use of offshore Oil and Gas assets and impact on business model • CO2 bi-directional transmission interconnect with UK • Shipping with UK and Norway • Phased infrastructure development and expansion • Options to address commercial aspects including performance and
liabilities60
Regulatory/policy o Regulation development/improvement across the H2-CCS system: impact and
relevance of current gas network and electricity networks ownership model o Electricity market structure/regulation/operation
60 ZEPb. (2017). Fast Track CO2 Transport and Storage for Europe. Bruxelles, Luxembourg: Zero Emissions Platform.

Page 70
o Offshore CO2 storage, infrastructure re-use and decommissioning regime
6.2 Regulatory Background: National Level 6.2.1 Case specificities To recall, the main focus of the Dutch case study is on the decarbonisation of the national economy. The goal is to decarbonise industry by specifying a comprehensive H2-CCUS value chain. The objective is to identify a credible path for the decarbonisation of the Dutch industry by specifying an H2-CCUS chain, including the regional possibilities for CO2 capture, H2 usage in industry and residential heating, CO2 usage in greenhouses, as well as offshore storage.
The Dutch case study will develop a roadmap for decarbonizing the Rotterdam Port and wider industrial region, while maintaining regional economic integrity and employment. The area depends heavily on oil and gas through import and export of oil products, oil refining and petrochemical operations as well as power generation. A credible path to decarbonization must therefore be via the implementation of H2 and CCUS. The roadmap will be developed in close collaboration with industry partners from the area, identifying the possibilities for CO2 capture, H2 and CO2 usage, as well as offshore CO2 storage, and will serve as an example for other heavy industrial areas in Europe. A particular feature in the Dutch case is the abundance of greenhouses, where CO2 for accelerating plant growth is currently produced by gas-fired heaters. Thus utilization of captured CO2 for this purpose is a CCUS application that can deliver net CO2 emission reductions.
6.2.2 Central legal issues hydrogen-powered plant – will serve as example for other heavy industrial areas in
Europe. The area depends heavily on oil and gas through import and export of oil products, oil
refining and petrochemical operations as well as power generation. A credible path to decarbonization must therefore be via the implementation of H2 and CCUS.
possibilities for CO2 capture, H2 and CO2 usage, as well as offshore CO2 storage utilization of captured CO2 for this purpose is a CCUS application that can deliver net
CO2 emission reductions accounting of net CO2 emission reductions

Page 71
6.3 Market Background 6.3.1 Existing Markets, Major R&D Activities, and Key Players In the Dutch country context and with focus on the scope of its ELEGANCY case study, the following H2-CCS infrastructure services and H2-CO2 utilization options are currently being offered or practiced.
6.3.1.1 Supply side: H2 infrastructure services
H2 production o Reforming
Steam methane reforming is present at large-scale in the Rotterdam harbour area. Refineries and the chemical industry (exl. Ammonia) in the Netherlands currently produce 391 kt of H2 every year, mostly through reforming of natural gas. Key players are Shell, BP, Exxon and AkzoNobel. This market is not specially regulated and centralized within the Rotterdam harbour industrial cluster that also hosts existing CCS infrastructure.
o Gasification Also gasification is practiced to a large extent, e.g. to process the bottom products in the local refineries. With TATA, a major steel manufacturer is present in the Netherlands (some 60 km north of Rotterdam) that integrates coal gasification into its production process. On the R&D side, there is interest in biomass and waste gasification to produce renewable H2 for power & heat applications. The gasification market is decentralized and more regulated than reforming.
o Electrolysis using (excess) renewable power H2 production through electrolysis is a niche application in the Rotterdam harbour area and not actively practiced by the industries that process H2 at large scale. Plans are underway to increase the off-shore wind capacity in combination with P2G plants for balancing. For instance, wind turbine manufacturer Lagerwey, together with HYGRO and ECN are planning to equip a 4.8 MW turbine in the Wieringermeer area with an electrolyser to demonstrate the wind-to-wheel concept, starting from 2019 and expected to supply 5 HRS and 100 FC trucks61.
H2 transmission and distribution
o By pipeline or by cargo tanks (trucks, rail, ship) Hydrogen piping is present, with pipelines reaching as far as into France. Air Liquid (187 km) and Air Products (50 km) are the key players62. Air Liquid operates a 900 km H2 pipeline (mostly 10 mm diameter at ≤ 100 bar) network spanning the North of France, Belgium and the Netherlands63. R&D activities are also dedicated to off-shore H2 pipelines in the North Sea. The existing pipeline infrastructure market is centralized within the Rotterdam cluster
61 www.lagerwey.com/blog/2017/10/18/de-eerste-waterstofmolen-voor-duurzame-brandstof-komt-in-nederland/ 62 https://www.h2tools.org/ 63 Perrin, J.. (2007). Roads2HyCom - PART III: Industrial distribution infrastructure. R2H2007PU.1.
Page 72
and deregulated. Cargo tank transport is present in the industrial gas market (e.g. HyGear in Arnhem).
o Through hydrogen refuelling stations (HRS) network Only three HRS are currently in operation in the Netherlands, one of them SW of the city of Rotterdam. Three additional stations are under planning, among them a second one in Rotterdam64.
H2 storage
o Intermediate (short-term) storage Cargo tanks for short-term H2 storage are present at the refineries.
o Seasonal/strategic, long-term geological storage No seasonal H2 storage operations are currently on-going. There are several salt caverns in and around the PoR and some key players, inkl. Akzo Nobel, Gasunie, Nuon, are interested in exploring this opportunity.
6.3.1.2 Supply side: CCS infrastructure services
CO2 capture o Reforming and Gasification
While there exist the aforementioned H2 production sites, the co-produced CO2 is currently not being used or stored, except for Shell’s Pernis refinery that delivers part of the CO2 from its SRM operations to local greenhouses via the OCAP pipeline. Since several years, the Rotterdam harbour authority has been investigating the potential for the addition of CCS infrastructure to the Rotterdam harbour industrial cluster65. Another cluster with CCS potential is the TATA Steel production site in IJumiden.
o Biogas upgrading, ethanol production There are currently some 250 biogas plants and 25 biogas upgrading plants operating in the Netherlands66. Also, the Dutch diary industry is large. There are plans for CO2 capture from a waste-to-energy plants in Amsterdam and in Rotterdam.
o Post-/oxycombustion capture (incl. NG sweetening) and direct air capture Considered not present.
CO2 gathering, transmission, and distribution
o By pipeline The 97 km OCAP pipeline network connects the PoR area with the central parts of the Netherlands up to Amsterdam. It delivers some 400 ktpa of low-pressure CO2 from Shell’s Pernis refinery to greenhouses in the area67. Extension of the
64 www.netinform.net/H2/H2Stations/H2Stations.aspx 65 www.portofrotterdam.com/en/news-and-press-releases/port-authority-gasunie-and-ebn-studying-feasibility-of-ccs-in-rotterdam 66 World Biogas Association, 2017. Anaerobic digestion market report – the Netherlands. London, UK. 67 Noothout et al., 2014. CO2 Pipleine infrastructure – lessons learnt. Energy Procedia 63, 2481-92.

Page 73
network is being considered to connect additional sources from the PoR area with additional greenhouses.
o By cargo tanks (trucks, rail, ship) Present only for merchant liquid CO2 at small-scale.
CO2 storage
o Permanent geological storage Former plans to develop storage sites on-shore (Barendrecht) have to date not materialized. Currently the focus is on off-shore depleted oil- and gas-fields, building on the experience with the K12-B injection test in the course of the CATO project68.
6.3.1.3 Demand side: H2 utilization markets H2 for mobility (focusing on road transport, i.e. passenger cars, buses, trucks)
o Use in mobile fuel cells This option is currently considered (at most) a niche application, with only two operational HRS operating in the country. The technology provider Horizon Fuel Cells has Horizon Fuel Cells has delivered units for a FC range extender bus development in Holthausen69. Also the company HyMove produce H2 FC range extenders for electric buses.
H2 for industrial applications
o Conversion to chemicals/materials The current market for H2 in the Netherlands amounts to 425 ktpa for Ammonia production, 391 ktpa for refineries and other chemicals, and 61 ktpa for merchant liquid H2. This is mostly captive use, hence the same players that produce the H2 are at the same time its consumers.
o Direct use via combustion for process heat Some oil refineries have started to use H2 also as a fuel to produce process heat.
H2 for decentralized heat & power
o Direct use via combustion in boilers and use in stationary FCs Considered a niche application.
H2 for centralized power (& heat)
o Direct use via combustion in gas turbines This concept is present, although at an early stage. Vattenfall, Gasunie, and Statoil, have announced plans to convert one of the three 440 MW power trains at Vattenfall Nuon’s Magnum plant in Eemshaven into a H2 CCGT unit70.
68 www.co2-cato.org/cato/locations/regions/western-netherlands/gdf-k12-b-offshore-co2-injection-project 69 E4tech. (2017). The Fuel Cell Industry Review 2017. London, UK and Lausanne, Switzerland: E4tech. 70 www.powerengineeringint.com/articles/2017/07/dutch-gas-power-plant-to-undergo-hydrogen-power-conversion.html

Page 74
o Large stationary FC stacks The Dutch company Nedstack produces stationary PEM FC stacks.
6.3.1.4 Demand side: CO2 utilization markets The market presence rating for H2 utilization options was provided without explanatory comments; more research is needed at a later stage of the project.
CO2 for mobility o Conversion to liquid synthetic fuel (P2L)
Considered present. CO2 for industrial applications
o Conversion to chemicals/materials Considered present.
o Use as solvent Considered niche application.
o Other uses without conversion (Cf. business tree in Table 3.1) Considered present. The greenhouses connected to the OPAC pipeline are supplied with some 400 ktpa of CO2 for accelerated plant growth.
CO2 for decentralized heat & power
o Conversion to CH4 to be fed into NG network Considered not present.
CO2 for centralized heat & power
o Use as working fluid (supercritical CO2 power cylces and CPG) Considered not present.

Page 75
6.3.2 Business Drivers Table 6.1 shows the heat map resulting from the assessment of the strength of business drivers in the Netherlands (see Section Table 2.1 in Section 2.4 for a more detailed description of the type of market failures).
H2 infrastructure o Across all supply chain segments, the strongest drivers identified are clustering
effects and possible technical advances. o Commitment by the Port of Rotterdam to reduce CO2 emissions is a strong driver
for H2 production options. Furthermore, in particular for production from renewable energy electrolysis, electricity prices play in a role in driving this technology.
o High commodity prices could also be driver of H2 storage options if associated with temporarily low demand.
CCS infrastructure
o Regulations, such as the Government’s agenda for CO2 capture in industry, and cost advantages are relatively strong drivers for CCS infrastructure in general.
o In contrast to H2 infrastructure, stakeholder commitments and clustering effects are only mild drivers.
o Carbon pricing mechanisms are not a driver for any of the value chain segments. H2 utilization
o Stakeholder commitments, environmental consciousness of consumers and social preferences are all relatively strong drivers of H2 utilization.
o On the contrary, carbon pricing mechanisms and other existing regulations are not viewed as strong driving forces.
CO2 utilization
o Aside from industrial and power & heat end use markets for CO2, cost advantages and regulation (carbon pricing, fiscal and other) are viewed as relatively strong drivers.
o Stakeholder commitments and social preferences only exert limited influence.
6.3.3 Market Failures No feedback has been provided by the Dutch partners until the date of submission of this interim report.

Page 76
Table 6.1: Business driver heat maps for the Dutch case study.
Supply chain segment:Supply/service options:(cf. Tab 'Business tree')
Reforming Gasification RE electrolysis By pipeline, by vessel Through hydrogen refuelling stations (HRS) network
Intermediate (short-term) storage
Seasonal/strategic, long-term geological storage
N° Indicator
I.1 Market players and interactionsI.1.1
present present niche application present present present not present
I.2 Business drivers
Provide rating: negative driver medium medium choose from list choose from list choose from list choose from listProvide rating: strong weak strong not a driver not a driver strong mediumProvide rating: choose from list choose from list medium choose from list choose from list choose from list choose from listProvide rating: weak choose from list choose from list choose from list choose from list choose from list choose from listProvide rating: medium medium strong choose from list choose from list choose from list choose from listProvide rating: medium medium strong choose from list choose from list choose from list choose from listProvide rating: medium medium medium strong medium strong weakProvide rating: medium medium strong medium medium weak weakProvide rating: weak choose from list choose from list strong strong weak strong
H2 InfrastructureTransmission, distribution Storage
I.2.9 Anticipation of future markets:
I.2.4 Carbon pricing mechanisms: I.2.5 Other regulations (apart from those in I.2.3-4):
I.2.2 Commodity prices: I.2.3 Fiscal advantages:
I.2.8 Technological advances:
Production
For the country under investigation and the H2 supply and infrastructure service options that are present (as selected in I.1.1), rate and describe the strength of the following indicators as drivers for H2 infrastructure services. In infrastructure sectors already dealing with grey/carbon-intensive H2, rate and describe the strength of the indicator as driver to switch to green/low-carbon H2. For
I.2.1 Cost of production/services:
In the given country context and with focus on the scope of your case study: Which H2 supply/infrastructure service options are currently being offered domestically?
I.2.6 Stakeholder commitments: I.2.7 Clustering:
CCS value chain segment: StorageCapture/service options:
(cf. Tab 'Business tree')Reforming Gasification Biogas upgrading, ethanol
productionPost-/oxycombustion
capture*Direct air capture By pipeline By vessel Permanent geological
storage
N° Indicator * from power&heat and from industrial point sources (incl. NG processing in the gas industry)
II.1 Market players and interactionsII.1.1
present present present not present not present present niche application not present
II.2 Business drivers
Provide rating: strong strong strong choose from list choose from list strong strong strongProvide rating: weak weak medium choose from list choose from list choose from list choose from list choose from listProvide rating: strong strong strong medium choose from list choose from list choose from list choose from listProvide rating: not a driver not a driver not a driver not a driver not a driver not a driver not a driver not a driverProvide rating: strong medium strong strong choose from list medium choose from list strongProvide rating: weak weak weak weak choose from list choose from list choose from list choose from listProvide rating: strong medium weak weak choose from list strong strong strongProvide rating: medium medium medium medium choose from list weak weak mediumProvide rating: medium medium medium weak choose from list medium medium mediumProvide rating: negative driver negative driver not a driver negative driver choose from list negative driver medium medium
CCS InfrastructureCapture Gathering, transmission, distribution
II.2.2 Commodity prices:
In the given country context and with focus on the scope of your case study: Which CO2 capture/infrastructure service options are currently being offered domestically?
For the country under investigation and the CCS infrastructure service options that are present (as selected in II.1.1), rate and describe the strength of the following indicators as drivers for CCS infrastructure services. II.2.1 Cost of production/services:
II.2.3 Fiscal advantages: II.2.4 Carbon pricing mechanisms: II.2.5 Other regulations (apart from those in II.2.3-4):
II.2.7 Clustering: Stakeholder commitments: II.2.6
II.2.10 Social preferences or rejection:
II.2.8 Technological advances: II.2.9 Anticipation of future markets:

Page 77
(Business driver heat maps for the Dutch case study. Cont.)
Market sector: Mobility*Utilization options:
(cf. Tab 'Business tree')Use in mobile fuel cells Conversion to
chemicals/materialsDirect use via combustion for
process heat only*Direct use via combustion in
boilers for heat (& power)Decentralized stationary FCs
for power (& heat)Direct use via combustion in
gas turbines Large stationary FC stacks
N° Indicator*primary subsector considered is road transport (passenger cars, buses, lorries).
III.1 Market players and interactionsIII.1.1
niche application present present niche application niche application present present
III.2 Business drivers
Provide rating: weak strong strong strong strong strong strongProvide rating: don't know don't know don't know don't know don't know don't know don't knowProvide rating: weak weak weak weak weak weak weakProvide rating: weak weak weak weak weak weak weakProvide rating: strong medium medium medium medium strong mediumProvide rating: strong strong medium medium medium strong mediumProvide rating: medium medium medium medium strong medium medium
H2 Utilization
III.2.3 Carbon pricing mechanisms:
III.2.6 Environmental consciousness of consumers: III.2.7 Social preferences or rejection:
III.2.4III.2.5 Stakeholder commitments:
III.2.2 Fiscal advantages:
For the country under investigation and the utilization options that are present (as selected in III.1.1), rate and describe the strength of the following indicators as drivers for H2 utilization. In sectors where H2 is already being used, rate and describe the strength of the indicator as driver for green/low-carbon H2 utilization.
III.2.1
*the focus l ies on large power, whereas the co-harvesting of heat is always an option for large power applications.
Centralized heat & power*
Other regulations (apart from those in III.2.2-3):
*space heating and power (via combustion, gas turbine, stationary FC) is not considered part of the sector, but in the heat&power sectors.
Industry Decentralized heat & power*
*the focus l ies on decentralized heat via direct combustion in boilers; decentralized FC option is added as a niche option
Price for H2 products or services:
In the given country context and with focus on the scope of your case study: What are the currently prevailing H2 utilization options?
Market sector: Mobility Decentralized heat & power Centralized heat & powerUtilization options:
(cf. Tab 'Business tree')Conversion to liquid synthetic
fuel* Conversion to
chemicals/materialsUse as solvent Other uses without
conversionConversion to CH4 to be fed
into NG network*Use as working fluid*
N° Indicator*Additional note at bottom of this tab.
*Additional note at bottom of this tab.
*considering supercritical CO2 power cycles and geoenergy applications.
IV.1 Market players and interactionsIV.1.1
present present niche application present not present not present
IV.2 Business drivers
Provide rating: strong strong medium strong choose from list weakProvide rating: medium medium weak medium choose from list weakProvide rating: medium medium weak medium choose from list not a driverProvide rating: medium medium not a driver medium choose from list not a driverProvide rating: weak weak don't know weak choose from list don't knowProvide rating: don't know don't know don't know don't know don't know don't knowProvide rating: weak weak not a driver weak choose from list not a driver
IV.2.2 Fiscal advantages: IV.2.3 Carbon pricing mechanisms:
IV.2.5
IV.2.7 Social preferences or rejection:
IV.2.4 Other regulations (apart from those in IV.2.2-3):
IV.2.6 Environmental consciousness of consumers: Stakeholder commitments:
*space heating and power (via combustion, gas turbine, stationary FC) is considered in the sectors to the right (columns H and I).
In the given country context and with focus on the scope of your case study: What are the currently prevailing CO2 utilization options?
For the country under investigation and the utilization options that are present (as selected in IV.1.1), rate and describe the strength of the following indicators as drivers for CO2 utilization. IV.2.1 Price for CO2 products or services:
Industry*
CO2 Utilization

Page 78
7 SWITZERLAND The Swiss case study aims at demonstrating the key role of CCS in addressing the following three challenges:
1) Enabling the efficient generation of emission-free hydrogen – including from biogas – as a means to decarbonize the transport sector;
2) preparing the way for a CO2 storage site and thereby advancing sustainable geoenergy processes; and
3) paving the way for solutions that can remove CO2 from the atmosphere, i.e. enable negative CO2 emissions.
In Switzerland, where electricity is mainly generated from hydropower and nuclear power, as much as 34% of the total domestic GHG emissions are emitted in the transport sector71. Reducing these emissions has been challenging in the past and is currently achieved via offsetting. By 2020, 10% of the transport fuel related emissions will have to be compensated through domestic emission reduction credits. Further reductions through technology switch and behavioural change are key for transport decarbonization.
The case study uses natural gas and organic feedstock as a starting point. Natural gas and biogas will be reformed in a steam reformer with CO2 capture, applying newly developed Vacuum Pressure Swing Adsorption (VPSA) technology for the single cycle purification of hydrogen and CO2. Solid biomass will be gasified, after which the product gas will be cleaned of contaminants CO2 and hydrogen will be purified, likely also with the VPSA technology. The value chain is complemented with a full hydrogen and CO2 transmission network, and hydrogen refuelling stations. To compare with other means of hydrogen production and use, also water electrolysis, and use in the Swiss industry (in particular the chemical industry) may be included.
The development of the CO2 storage site will be undertaken alongside the development of deep geothermal energy, as recommended by the Swiss Energy Strategy 2050 and the Swiss roadmaps for CCS72 and deep geothermal energy development73. Accordingly, multiple storage options will be considered: storage in a saline aquifer in Switzerland; exporting it; putting it to use in CO2 plume geothermal (CPG) energy generation. For this reason, the case study will also favour the production of renewable electricity as well as the decarbonisation of the Swiss building stock, which accounts for another 30% of total CO2 emissions in Switzerland. Other geoenergy processes related to gas (H2) and heat storage will also co-benefit from the case study work that includes setting up criteria for site selection, drawing up active plans for risk management, developing sound communication strategies, and identifying permitting needs and barriers. For the chain analysis,
Finally, the Swiss case study aims to pave the way for solutions that can remove CO2 from the atmosphere, i.e. enable negative CO2 emissions. By using biomass as a feedstock for a producing power or H2 with CO2 capture or by capturing CO2 directly from the air, net-negative emissions are achieved – given the captured CO2 is stored permanently. In Switzerland, where
71 FOEN. (2018). Emissionen von Treibhausgasen nach revidiertem CO2-Gesetz und Kyoto-Protokoll, 2. Verpflichtungsperiode (2013–2020). Bern, Switzerland: Swiss Federal Office of Energy. 72 Mazzotti, M., Burdet, A., Curdin, C., Diamond, L., Häring, M., Leu, W., . . . Zappone, A. (2013). Roadmap for a CCS pilot project in Switzerland. Bern, Switzerland: Swiss Federal Office of Energy. 73 Evans, K., Wieland, U., Wiemer, S., & Giardini, D. (2014). Deep Geothermal Energy R&D Roadmap for Switzerland. Zurich, Switzerland: Swiss Competence Center for Energy Research - Supply of Electricity.
Page 79
the worldwide first commercial direct air capture plant is operating this may compensate unavoidable emissions from other sources than transport and heat in an economic way.
7.1 Swiss case study parameters 7.1.1 Climate Business Context National Policies and Energy Mix
o Understanding of current and expected future Swiss energy mix and CO2 emission sources: dominance of electricity supply from nuclear and hydro (90%), dominance of transport sector, dependence on imported fossil fuel.
o Understanding of transport emissions: domestic, commercial and mapping of fuel consumption by understanding of population distribution across country, city/rural split
o Decarbonisation of transport sector: technology and infrastructure options, implications of Canton and Municipality public opinion
o Nuclear phase-out and option to replace by CCGT with carbon capture - requiring CO2 storage options.
o Domestic compensation mechanism: opportunities for emission reduction projects based on carbon sequestration or FCEVs
o Focus on potential for Bioenergy CCS (BECSS) and Direct Air CCS (DACCS) – technical specifications, CO2 abatement potential…
EU Policies o Impact of Pan-European low-carbon policies o Impact of EU PCI policies/support o Outlook for integration of Swiss electricity market into European market
7.1.2 Markets Biogas/Biomass
o Understanding of local resource potential o Competing use of biogas (carbon neutral vs. carbon negative)
Hydrogen o Potential supply volumes from multiple sources
• Local production from biogas/biomass, natural gas or hydropower (runoff river and dammed hydro)
• Imported hydrogen
o Utilisation potential in the Swiss chemical industry o Scope for hydrogen in power generation and fuel cell CHP applications o Utilisation potential for transport sector (domestic and commercial vehicles):
• state of sector (structure, actors) • technology penetration: Fuel Cell Electric Vehicles (FCEV), Hydrogen
Refuelling Station (HRS) and fuel requirements/flexibility • potential for integration with Compressed Natural Gas (CNG) vehicles • direct vs. indirect power conversion (P2X) such as power to gas (P2G) use
in transportation

Page 80
CO2 utilisation o CO2 Plume Geothermal (CPG)
• technical feasibility in Switzerland • energy production potential and coupling to H2/CCS infrastructure
7.1.3 Delivery Infrastructure
o H2 production infrastructure • potential for local production (from natural gas by Steam Methane
Reforming (SMR), electrolysis…) versus import • potential for production from local biogas/biomass: technical
specifications and limitations
o H2 distribution infrastructure • Transport and storage: road/rail tankers, reuse of existing pipe
infrastructure/distribution points, supply and intermediary distribution storage, seasonal storage
• potential synergies with CNG transport and infrastructure • HRS: co-location with petrol stations or new deployment model • Deployment constraints for rural areas
H2 storage • H2 geostorage in salt caverns (e.g. Rheinsalinen)
o CO2 storage • impact on biogas/H2/natural gas infrastructure • risk profiles of potential permanent storage structure (geological,
population hubs…) • understanding of storage requirements/specifications for DACCS and
BECCS • Export as alternative to storage
Commercial and Financial o Cost implications of syngas/biogas/natural gas interfacing o Carbon market support/impact on transport decarbonisation – impact of negative
emissions o Generic design for a H2/CCS Swiss compensation project/program o Role of state in integrated system development
Regulatory/policy o Regulatory constraints for natural gas/biogas/hydrogen interfacing o Support policies for use of biogas/hydrogen/renewable energies/[CCS] o Carbon markets for compliance o Current state (domestic and abroad, incl. H2/CCS under the CDM) o Prospects (PA Art6, CORSIA, CH post2020) o Transportation sector regulation, incl. environmental provisions and support
schemes o [Prospect of] Permitting requirements for domestic geological H2/CO2 transport
and storage

Page 81
o H2 Safety: car safety testing and certification, safety at refuelling stations and during transport
Implementation phasing (local, regional, national) and prioritisation methodology: highest emissions, highest population density, infrastructure backbone, societal acceptance.
7.2 Regulatory Background: National Level 7.2.1 Case specificities The main focus of the Swiss case study is on enabling CO2 free transport by H2 and CCS. The goal is to decarbonise road transport, accelerating its CCS/geothermal roadmap and studying carbon-negative solutions, which can provide vital headroom in the transition to a low carbon economy. Plan for the decarbonisation of the Swiss road transport sector by introducing clean H2, accelerating the Swiss CCS/geothermal roadmap to fast-track CCS, and studying solutions with carbon negative emissions – as called for by the Paris Agreement.
7.2.2 Switzerland an relationship to EU/EEA law Application of international law Application of EU legislation
o On 23 November 2017, The EU and Switzerland signed an agreement to link their emissions trading systems. The link will allow participants in the EU's Emissions Trading System (EU ETS) to use allowances from the Swiss system for compliance, and vice versa.
Margin of appreciation. Effects on transboundary projects.
7.2.3 Decarbonisation of the transport sector via hydrogen use
7.2.4 CO2 storage in Switzerland Among the legal issues to be considered are:
The criteria for the selection of storage sites in Switzerland Basel Convention as incentive for not exporting CO2.
7.2.5 Negative emissions by removing CO2 from the atmosphere The Swiss case study aims to pave the way for solutions that can remove CO2 from the atmosphere, i.e. enable negative CO2 emissions.
7.2.6 Decarbonization of Swiss building stock via hydrogen use The purpose is to develop deep geothermal energy (increased use of geothermal energy replacing NG). See the policy documents: Swiss Energy Strategy 2050 and regional roadmaps for CCS and deep geothermal energy development.

Page 82
7.3 Market Background 7.3.1 Existing Markets, Major R&D Activities, and Key Players In the Swiss country context and with focus on the scope of its ELEGANCY case study, the following H2-CCS infrastructure services and H2-CO2 utilization options are currently being offered or practiced.
7.3.1.1 Supply side: H2 infrastructure services
H2 production o Reforming
Currently there is only one refinery in Switzerland left (Cressier), where also the largest reforming operation takes place for crude hydrodesulphurization (since 1993). The Swiss chemical industry, clustered around Basel and in the upper Valais valley, has its own SRM facilities but produce way below the ktpa-scale (e.g. BASF in Kaisten). Messer Schweiz AG (and other industrial gas suppliers) produces H2 from SRM at even smaller scales.
o Gasification There is a small biochar community in Switzerland that promotes pyrolysis74, but the primary purpose there is the biochar product, not to extract the H2 from the off-gas.
o Electrolysis using (excess) renewable power A local utility (Eniwa, together with H2energy) runs the only larger site in Switzerland where H2 is centrally produced via renewable energy electrolysis. The plant sits next to Eniwa’s run-off river plant and is set up to deliver the H2 to Switzerland’s first HRS. Another industrial player active in electrolysis (from solar power) is Belenos Clean Power. R&D activities are more widespread, including projects at PSI, EMPA, EPFL, Uni Basel, HES-SO Valais, ETHZ75.
H2 transmission and distribution
o By pipeline or by cargo tanks (trucks, rail, ship) Early this year, after a one year permitting process, the Swiss authorities for the first time gave green light to the injection of H2 into the NG grid. The utility Regio Energie Solothurn is now allowed to mix renewable H2 into their NG net. The H2 is produced in Regio Energie’s Aarmatt Hybridwerk (a Government supported flagship project) using their hydro-power fuelled electrolyser76. Furthermore, a 2007 project report identified a 2 km H2 pipeline between an electrolyser of Syngenta at the industrial site in Monthey, Valais, to a Carbagas (Air Liquide) filling station77.
74 www.charnet.ch 75 SFOE. (2014). Swiss Hydrogen & Fuel Cell Activities - Opportunities, barriers and public support. Bern, Switzerland: Swiss Federal Office of Energy. 76 www.hybridwerk.ch/news/news-detail/article/bund-bewilligt-erstmals-die-einspeisung-von-erneuerbarem-wasserstoff-ins-erdgasnetz/ 77 Perrin, J.. (2007). Roads2HyCom - PART III: Industrial distribution infrastructure. R2H2007PU.1.

Page 83
o Through hydrogen refuelling stations (HRS) network Currently there is no HRS network in Switzerland. The only public HRS is operated by the Swiss retailer Coop in Hunzenschwil, and is part of the company’s pilot integral hydrogen system. It receives the H2 from the aforementioned Eniwa electrolyser and powers a fuel cell 35 tonnes truck. Further stations are planned to be added to this network in stages, depending on demand78. Three semi-public HRS exist at EMPA and EPFL (H2 produced via electrolysis) and at Messer Schweiz AG (H2 produced via SMR)79.
H2 storage
o Intermediate (short-term) storage Providers of high-pressure gas storage parts and equipment in Switzerland are NovaSwiss, Carbagas/Air Liquide, Messer, Pangas/Linde, Weka.
o Seasonal/strategic, long-term geological storage GRZ Technologies is piloting hydrogen based energy storage systems80. Also research institutions are working in the field of using H2 as a means to store (excess) renewable energy from the low to the high demand season (Uni Geneva, Epa, EPFL).
7.3.1.2 Supply side: CCS infrastructure services
CO2 capture o Reforming and gasification
None of the operations producing H2 from SRM or gasification mentioned above are providing the separated CO2 for utilization or storage.
o Biogas upgrading, ethanol production There are around 150 biogas plants and another ca. 900 sewage sludge treatment plants that produce altogether no more than 40 ktpa of biogenic CO2
81. All of that CO2 is vented during upgrading (ca. 20 plants feed in biomethane to NG grid82), or the biogas goes into CHP units without prior CO2 separation. Furthermore, there is no domestic bioethanol production83 that could provide another source for biogenic CO2. There is no evident clustering or market structure in this subsector.
o Post-/oxycombustion capture (incl. NG sweetening) The main Swiss point sources are six cement plants (total 0.84 Mt/y) and 29 waste incineration plants (total 1.16 Mt/y), but there are no plans to retrofit capture any time soon. Nevertheless, the Swiss heavy industry (GE (ex-Alstom), Sulzer, Casale) has been active in developing capture technologies. The interest in CCS from these players has been constantly decreasing owing to the unexpectedly slow deployment of CCS in Europe and the rest of the world.
78 Hydropole. (2017). Hydrogen Report Switzerland 2016-2017. Hydropole. 79 SFOE. (2017). Ökobilanz von Wasserstoff als Treibstoff. Bern, Switzerland: Swiss Federal Office of Energy 80 www.grz-technologies.com/ 81 Meier et al. (2017). Investigation of Carbon Flows in Switzerland with the Special Consideration of Carbon
Dioxide as a Feedstock for Sustainable Energy Carriers. Energy Technologies, 5, 864-76. 82 https://iet.hsr.ch/fileadmin/user_upload/iet.hsr.ch/karte/karte.htm 83 www.biosprit.org/?id=18&z=/Bioethanol
Page 84
o Direct air capture The company Climeworks, partner in the ELEGANCY consortium, has commissioned the world’s first semi-commercial DAC plant in Hinwil early 2017. It captures 900 tpa of CO2 using predominantly waste heat from a municipal solid waste incineration plant, and it delivers that CO2 to a nearby greenhouse. Climeworks is world leader in R&D and commercialization of DAC.
CO2 gathering, transmission, and distribution
o By pipeline Considered not present.
o By cargo tanks (trucks, rail, ship) Considered not present at scales beyond the shipping of industrial gases.
CO2 storage
o Permanent geological storage Limited research activities were conducted in the past, including a first mapping of the storage potential in the Swiss low-lands (CARMA, SCCER-SoE84). Few past experiments, mainly on well integrity, were conducted by Chevron at the Mont Terri rock laboratory85, which will also host some of the experiments planned under ELEGANCY.
7.3.1.3 Demand side: H2 utilization markets H2 for mobility (focusing on road transport, i.e. passenger cars, buses, trucks)
o Use in mobile fuel cells Given the scarcity of HRS in Switzerland, FCEVs are currently not a market. In 2016, 36 FCEVs were in circulation in Switzerland, predominantly the Hyundai ix35. Approximately 85% of the refuelling is done at the Coop HRS in Hunzenschwil86. Interestingly though, there are a couple of manufacturers for FCEV models, namely GreenGT (high-performance cars), Esoro (concept cars) and SwissHydrogen (Fiat500 with FC range extender). Coop operates one of the world’s first FC trucks in the 35t category. PostBus ran a project to use FCEB in public transport. Since the end of 2011 five fuel cell postbuses are operating in and around Brugg87, including an own, non-public HRS.
H2 for industrial applications
o Conversion to chemicals/materials The technology provider Casale manufactures equipment to produce ammonia, urea, methanol, and syngas, and is thus an important Swiss player for processes that produce or can receive both H2 and CO2. The refinery in Cressier and the chemical industry in Basel and Valais operate with H2 that is produced for captive
84 www.sccer-soe.ch 85 www.mont-terri.ch/en/experiments/the-most-important-experiments.html 86 SFOE. (2017). Ökobilanz von Wasserstoff als Treibstoff. Bern, Switzerland: Swiss Federal Office of Energy 87 Hydropole. (2017). Hydrogen Report Switzerland 2016-2017. Hydropole
Page 85
use. The market for non-captive H2 for industrial applications in Switzerland is largely covered by the global industrial gas companies through their Swiss branches Carbagas (Air Liquide), Pangas (The Linde Group) and Messer88.
o Direct use via combustion for process heat Considered not present.
H2 for decentralized heat & power
o Direct use via combustion in boilers for heat (& power) The companies Alge Energie and Neue Energie Schweiz distributes a system to reduce the fuel consumption of existing heaters. The system comprises a small electrolyser and a H2/O2 injection unit that is retrofitted to heaters for any type of fuel89.
o Decentralized stationary FCs for power (& heat) The company Hexis distributes SOFCs below 10 kW and develops microCHPs for the residential sector. Also Energie360° (associate partner in ELEGANCY) advertises the installation of stationary FCs for heat & power supply in residential buildings.
H2 for centralized power (& heat)
o Direct use via combustion in gas turbines and use in large stationary FC stacks Considered not present.
7.3.1.4 Demand side: CO2 utilization markets
CO2 for mobility o Conversion to liquid synthetic fuel (P2L)
Currently there are no P2L activities. However, on the Swiss side of the run-off-river plant in Laufenburg, the German company Energiedienst (with partner Audi and INERATEC) has concrete plans to build a 400,000 Lpa P2L plant that will use renewable electricity and biogenic CO2 to produce biodiesel starting from 201990.
CO2 for industrial applications
o Conversion to chemicals/materials Omya, a world leading precipitated calcium carbonate (PCC) manufacturer, is headquartered in Oftrignen, however without operating a PCC plant in Switzerland itself. Urea production is currently absent in Switzerland, but Casale is offering urea production facility revamping services. Casale is also a technology provider for ammonia, melamine, and methanol. Other, smaller players are offering methanol synthesis services (Swiss Liquid Future) and methanol micro CHPs (Silent Power).
88 SFOE. (2014). Swiss Hydrogen & Fuel Cell Activities - Opportunities, barriers and public support. Bern, Switzerland: Swiss Federal Office of Energy. 89 http://neueenergieschweiz.ch/ 90 www.energiedienst.de/produktion/wasserstoff/power-to-liquid/

Page 86
o Use as solvent There is no hydrocarbon industry, hence no EOR in Switzerland. Supercritical CO2 is used in the pharmaceutical/chemical industry for certain extraction processes.
o Other uses without conversion (Cf. business tree in Table 3.1) CO2 is used in the food and beverage industry, where the Swiss company Nestlé is an important world player. Currently, this market is served through merchant liquid CO2 by one of the big industrial gas suppliers. Climeworks plans to operate a DAC plant starting end of 2018 that will deliver air captured CO2 to a domestic beverage company.
CO2 for decentralized heat & power
o Conversion to CH4 to be fed into NG network All of the large domestic point sources, and the most part of the smaller CO2 sources such as biogas plants are nearby the national high pressure NG grid91. There are currently only three P2G pilots in Switzerland, one in Zurich operated by Energie360° together with PSI, and two research plants at PSI and at the Institute of Applied Sciences in Rapperswil.
CO2 for centralized heat & power
o Use as working fluid (supercritical CO2 power cycles and CPG) The concept of CO2 Plume Geothermal (CPG) has been invented in the US by a professor who is now affiliated to ETH Zurich. This technology is at a low Technology Readiness Level (TRL). At ETH, several researchers are further investigating the concept, primarily through modelling92.
7.3.2 Business Drivers Table 7.1 shows the heat map resulting from the assessment of the strength of business drivers in Switzerland (see Section Table 2.1 in Section 2.4 for a more detailed description of the type of market failures).
H2 infrastructure o Commodity price variations could be significant drivers in certain situations (e.g.
natural gas price for NG reforming, electricity price for RE electrolysis). In other cases, these variations may be of minor importance (e.g. energy for compression and recompression/liquefaction).
o The impact of carbon pricing mechanisms in directly driving H2 infrastructure is rather weak in Switzerland. However, overall climate and energy policy regulations influence the sector (for instance the new CO2 law currently under negotiation in Switzerland will enforce stricter emission standards on vehicles and newly impose emission standards on trucks as well).
o Clustering is not present and therefore not a driver. Neither are fiscal advantages.
91 https://iet.hsr.ch/fileadmin/user_upload/iet.hsr.ch/karte/karte.htm 92 http://www.geophysics.ethz.ch/research/groups/geg.html

Page 87
o Stakeholder commitments and anticipation of future markets are moderate drivers for H2 infrastructure development.
CCS infrastructure
o Capture technologies add to costs of existing processes, therefore cost is not a driver.
o Higher commodity prices on the capture side would favour the use of alternative fuels, for instance biogas in reforming or biomass in gasification. Furthermore, increases in oil and gas prices affect the supply chain which would raise costs (e.g. cost of direct air capture modules, pipeline construction costs, transportation costs by road/ship).
o Existing regulation is in fact a barrier to CCS development in Switzerland since sequestration is not allowable as a domestic sequestration project. Absence of regulation on the transmission/distribution and storage side is also a barrier to investment.
o No clusters are present in Switzerland; therefore clustering effects is not a driver for CCS infrastructure. Note that this is not necessarily a disadvantage for DAC, where one of the strengths of the technology is the independence of CO2 sink from CO2 source. However, DAC often requires a source of waste heat, hence it profits from the presence of industrial clusters with excess waste heat available. If the goal is to store DAC CO2 geologically, it makes sense to construct the capture facilities in the vicinity of storage hubs (even off-shore).
o No evident industry commitment, aside from the biogas and DAC sector. o Anticipation of future markets by industry stakeholders is a driving force for
CCS, albeit a weak one. H2 utilization
o Use of H2 in mobility applications is primarily driven, on the one hand, by existing or upcoming regulation (e.g. new CO2 law) and, on the other hand, by environmental consciousness and social preferences of users.
CO2 utilization
o Environmental consciousness of user could be a strong driver with the right marketing.
o Stakeholder commitments are a strong driver of non-fossil based CO2 use (e.g. from direct air capture).
7.3.3 Market Failures Table 7.2 shows the heat map resulting from the assessment of market failures in Switzerland (see Section Table 2.2 in Section 2.5 for a more detailed description of the market failures).
As expected for the Swiss case, the analysis aptly captures the broad absence of H2/CO2 end user markets and chains in the country. Indeed, with the exception of the industrial markets for both gases and pilot installations on the direct air capture side, the heat map is unequivocal: missing markets are critical market failures across the board. Completing the picture, both coordination failure and insufficient CO2 price signal are assessed critically in the country. Of note as well is the respondents’ perception that knowledge spillover in H2-CCS infrastructure is an inhibitor of investment in the sector.

Page 88
Table 7.1: Business drivers heat map for the Swiss case study.
Supply chain segment:Supply/service options:(cf. Tab 'Business tree')
Reforming Gasification RE electrolysis By pipeline, by cargo tanks Through hydrogen refuelling stations (HRS) network
Intermediate (short-term) storage
Seasonal/strategic, long-term geological storage
N° Indicator
I.1 Market players and interactionsI.1.1
present don't know niche application not present niche application niche application not present
I.2 Business drivers
Provide rating: don't know don't know not a driver don't know not a driver not a driver choose from listProvide rating: medium medium strong weak not a driver strong choose from listProvide rating: don't know don't know not a driver don't know not a driver don't know choose from listProvide rating: medium don't know weak don't know weak don't know choose from listProvide rating: don't know don't know medium don't know medium don't know choose from listProvide rating: strong strong medium strong weak weak choose from listProvide rating: not a driver don't know not a driver don't know not a driver not a driver choose from listProvide rating: weak medium medium weak weak don't know choose from listProvide rating: weak medium medium strong strong weak choose from list
H2 Infrastructure
I.2.6 Stakeholder commitments: I.2.7 Clustering: I.2.8 Technological advances:
Production
For the country under investigation and the H2 supply and infrastructure service options that are present (as selected in I.1.1), rate and describe the strength of the following indicators as drivers for H2 infrastructure services. In infrastructure sectors already dealing with grey/carbon-intensive H2, rate and describe the strength of the indicator as driver to switch to green/low-carbon H2. For
I.2.1 Cost of production/services:
In the given country context and with focus on the scope of your case study: Which H2 supply/infrastructure service options are currently being offered domestically?
I.2.9 Anticipation of future markets:
I.2.4 Carbon pricing mechanisms: I.2.5 Other regulations (apart from those in I.2.3-4):
I.2.2 Commodity prices: I.2.3 Fiscal advantages:
Transmission, distribution Storage
CCS value chain segment: StorageCapture/service options:
(cf. Tab 'Business tree')Reforming Gasification Biogas upgrading, ethanol
productionPost-/oxycombustion
capture*Direct air capture By pipeline By cargo tanks Permanent geological
storage
N° Indicator * from power&heat and from industrial point sources (incl. NG processing in the gas industry)
II.1 Market players and interactionsII.1.1
not present not present not present not present niche application not present not present not present
II.2 Business drivers
Provide rating: not a driver not a driver not a driver not a driver not a driver choose from list choose from list choose from listProvide rating: medium medium medium medium weak choose from list choose from list choose from listProvide rating: not a driver not a driver not a driver not a driver not a driver choose from list choose from list choose from listProvide rating: choose from list choose from list choose from list choose from list not a driver choose from list choose from list choose from listProvide rating: negative driver negative driver negative driver negative driver strong negative driver negative driver negative driverProvide rating: not a driver not a driver strong not a driver strong not a driver not a driver not a driverProvide rating: not a driver not a driver not a driver not a driver weak not a driver not a driver not a driverProvide rating: weak weak weak weak strong not a driver not a driver weakProvide rating: weak weak medium weak strong weak weak weakProvide rating: choose from list choose from list choose from list choose from list strong choose from list choose from list choose from list
CCS Infrastructure
II.2.10 Social acceptance:
II.2.8 Technological advances: II.2.9 Anticipation of future markets:
II.2.5 Other regulations (apart from those in II.2.3-4):
II.2.7 Clustering: Stakeholder commitments: II.2.6
II.2.3 Fiscal advantages: II.2.4 Carbon pricing mechanisms:
II.2.2 Commodity prices:
In the given country context and with focus on the scope of your case study: Which CO2 capture/infrastructure service options are currently being offered domestically?
For the country under investigation and the CCS infrastructure service options that are present (as selected in II.1.1), rate and describe the strength of the following indicators as drivers for CCS infrastructure services. II.2.1 Cost of production/services:
Capture Gathering, transmission, distribution

Page 89
(Business driver heat maps for the Swiss case study - continued)
Market sector: Mobility*Utilization options:
(cf. Tab 'Business tree')Use in mobile fuel cells Conversion to
chemicals/materialsDirect use via combustion for
process heat only*Direct use via combustion in
boilers for heat (& power)Decentralized stationary FCs
for power (& heat)Direct use via combustion in
gas turbines Large stationary FC stacks
N° Indicator*primary subsector considered is road transport (passenger cars, buses, trucks).
III.1 Market players and interactionsIII.1.1
niche application present not present niche application niche application not present not present
III.2 Business drivers
Provide rating: not a driver don't know choose from list don't know choose from list choose from list choose from listProvide rating: weak don't know choose from list don't know choose from list choose from list choose from listProvide rating: weak don't know choose from list weak choose from list choose from list choose from listProvide rating: medium don't know choose from list weak choose from list choose from list choose from listProvide rating: not a driver don't know choose from list don't know choose from list choose from list choose from listProvide rating: medium don't know choose from list weak choose from list choose from list choose from listProvide rating: medium don't know choose from list weak choose from list choose from list choose from list
H2 Utilization
*the focus l ies on large power, whereas the co-harvesting of heat is always an option for large power applications.
Centralized heat & power*
Other regulations (apart from those in III.2.2-3):
*space heating and power (via combustion, gas turbine, stationary FC) is not considered part of the sector, but in the heat&power sectors.
Industry Decentralized heat & power*
*the focus l ies on decentralized heat via direct combustion in boilers; decentralized FC option is added as a niche option
Price for H2 products or services:
In the given country context and with focus on the scope of your case study: What are the currently prevailing H2 utilization options?
III.2.2 Fiscal advantages:
For the country under investigation and the utilization options that are present (as selected in III.1.1), rate and describe the strength of the following indicators as drivers for H2 utilization. In sectors where H2 is already being used, rate and describe the strength of the indicator as driver for green/low-carbon H2 utilization.
III.2.1
III.2.3 Carbon pricing mechanisms:
III.2.6 Environmental consciousness of consumers: III.2.7 Social preferences:
III.2.4III.2.5 Stakeholder commitments:
Market sector: Mobility Decentralized heat & power Centralized heat & powerUtilization options:
(cf. Tab 'Business tree')Conversion to liquid synthetic
fuel* Conversion to
chemicals/materialsUse as solvent Other uses without
conversionConversion to CH4 to be fed
into NG network*Use as working fluid*
N° Indicator*Additional note at bottom of this tab.
*Additional note at bottom of this tab.
*considering supercritical CO2 power cycles and geoenergy applications.
IV.1 Market players and interactionsIV.1.1
not present niche application not present present niche application not present
IV.2 Business drivers
Provide rating: negative driver weak choose from list weak negative driver don't knowProvide rating: weak weak choose from list weak don't know not a driverProvide rating: choose from list weak choose from list weak weak not a driverProvide rating: choose from list weak choose from list strong weak negative driverProvide rating: choose from list don't know choose from list strong weak not a driverProvide rating: choose from list strong choose from list strong strong strongProvide rating: choose from list don't know choose from list strong don't know don't know
CO2 Utilization
In the given country context and with focus on the scope of your case study: What are the currently prevailing CO2 utilization options?
For the country under investigation and the utilization options that are present (as selected in IV.1.1), rate and describe the strength of the following indicators as drivers for CO2 utilization. IV.2.1 Price for CO2 products or services:
Industry*
IV.2.4 Other regulations (apart from those in IV.2.2-3):
IV.2.6 Environmental consciousness of consumers: Stakeholder commitments: IV.2.5
IV.2.7 Social preferences:
IV.2.2 Fiscal advantages: IV.2.3 Carbon pricing mechanisms:

Page 90
Table 7.2: Market failures heat map for the Swiss case study.
Market Opportunities/Market
FailuresMissing Market Coordination Failure
Negative ExternalityLow Priced CO2 Emissions
Positive Externality Improved Air Quality Natural Monopoly
Merit GoodsHydrogen
Merit GoodsCO2 Utilisation
Merit GoodsAppliances/Equipment Location Immobility
Social InequalityFuel Poverty
Information Failure and Asymmetry
Knowledge Creation Spillover
H2/CO2 End Use Markets
Large Stationary Power n/a n/a n/a n/a n/a n/a n/a n/a n/a n/a n/a n/a
Small Stationary Power n/a n/a n/a n/a n/a n/a n/a n/a n/a n/a n/a n/a
Mobility - Vehicles ✔ - High ✔ - High ✔ - High ✔ - Medium ✔ - Low ✔ - Low ✔ - Medium ✔ - High ✔ - Low ✔ - Low ✔ - Low ✔ - Medium
Mobility - Other ✔ - High ✔ - High ✔ - High ✔ - Medium ✔ - Medium ✔ - Low ✔ - Medium ✔ - High ✔ - Low ✔ - Low ✔ - Medium ✔ - High
Heat ✔ - High ✔ - Low ✔ - Medium ✔ - Medium ✔ - Low ✔ - Medium n/a ✔ - Medium ✔ - Low ✔ - Low ✔ - Low ✔ - Medium
Chemicals and Industry ✔ - Medium ✔ - Low ✔ - High ✔ - Medium ✔ - Low ✔ - Medium ✔ - Medium ✔ - Low ✔ - Medium ✔ - Low ✔ - Low ✔ - High
Power to X (Storage) n/a n/a n/a n/a n/a n/a n/a n/a n/a n/a n/a n/a
H2-CCS Chain
H2 Retail ✔ - Medium ✔ - High ✔ - High ✔ - Medium ✔ - Low n/a n/a n/a ✔ - Low ✔ - Low ✔ - Low ✔ - Low
H2 Distribution ✔ - High ✔ - High ✔ - High ✔ - Medium ✔ - Low n/a n/a n/a ✔ - Low ✔ - Low ✔ - Low ✔ - Medium
H2 Storage ✔ - High ✔ - High ✔ - High ✔ - Medium ✔ - Medium n/a n/a n/a ✔ - High ✔ - Low ✔ - Medium ✔ - High
H2 Transmission ✔ - High ✔ - High ✔ - High ✔ - Medium ✔ - Medium n/a n/a n/a ✔ - High ✔ - Low ✔ - Low ✔ - High
Low Carbon H2 Production ✔ - High ✔ - High ✔ - High ✔ - Low ✔ - Low ✔ - Low n/a n/a ✔ - Medium ✔ - Low ✔ - Low ✔ - High
CO2 Capture ✔ - Medium ✔ - High ✔ - High ✔ - High ✔ - Low n/a ✔ - High n/a ✔ - Medium ✔ - Low ✔ - Low ✔ - High
CO2 Gathering ✔ - High ✔ - High ✔ - High ✔ - Medium ✔ - Low n/a ✔ - High n/a ✔ - Medium ✔ - Low ✔ - Low ✔ - Medium
CO2 Transmission ✔ - High ✔ - High ✔ - High ✔ - Medium ✔ - Medium n/a n/a n/a ✔ - High ✔ - Low ✔ - Low ✔ - High
CO2 Storage ✔ - High ✔ - High ✔ - High ✔ - Medium ✔ - Medium n/a n/a n/a ✔ - High ✔ - Low ✔ - Medium ✔ - High

Page 91
8 UNITED KINGDOM The UK case study supports and informs the H21 Roadmap project and is based on the phased roll-out presented in the H21 Leeds City Gate report93. The parameters listed in the next Subsection correspond to the proposed conversion of the UK gas distribution network to 100% hydrogen integrated with a CCS network. The case study addresses the planned first phase for three cities of a UK wide roll-out and hydrogen produced at industrial clusters by SMR in addition to current production. It aims to help deliver the H21 Roadmap project by providing technical information, and an infrastructure planning and development strategy, ahead of the scheduled ‘key policy decision’ and commitment to build in 2021. WP5 research will be tailored to complement implementation planned in four technical work packages of the H21 Roadmap: WP8 Technical Standards, WP9 Regulation, WP12 Carbon Capture and Storage, and WP16 UK Wide Development Strategy. The evidence provided will increase confidence in the provision of hydrogen production technologies, transport infrastructure and storage capacity (in the absence of an existing ‘over-the-fence’ operation, as currently assumed in the H21 Roadmap), as well as the capture and disposal of associated CO2 emissions.
The baseline of CO2 emissions from UK industrial clusters used in ELEGANCY, including existing hydrogen production operations, will be consistent with that presented by the ALIGN-CCUS project (Accelerating Low-carbon Industrial Growth through Carbon Capture Utilisation and Storage). Collaboration between the contemporaneous ELEGANCY and ALIGN-CCUS projects is facilitated by in-common ERA-Net ACT funding. ALIGN-CCUS considers storage of CO2 captured from clusters of industrial sources at Teesside and Grangemouth.
The period investigated by the UK case study includes all phases of implementation planned by H21 Leeds City Gate to 2052 with scenarios of growth to 2100. Initially, hydrogen production is assumed to be solely by SMR with novel processes being incorporated as technologies evolve for both hydrogen production and CO2 capture.
The case study includes business investment and optimization of strategies for integrating H2-CCS with a wider CCS system, in particular with technical and commercial feasibility studies from a petrochemicals industry perspective. It will also provide an understanding of the requirements for maintaining CO2 injectivity and ensuring geological containment when the CO2 is captured from the SMR process of H2 production. This knowledge will be applicable to the development of hydrogen and CCS in other regions of the UK and EU.
8.1 UK case study parameters 8.1.1 Climate Business Context National Policies
o Decarbonisation of stationary domestic and commercial natural gas use o Clean Growth Strategy and Industrial Decarbonisation Roadmaps o Regional development and devolved responsibilities o Contribution to UK Gross Value Added (GVA)
H21 Project
93 Sadler, D., Cargill, A., Crowther, M., Rennie, A., Watt, J., Burton, S., & Haines, M. (2016). H21 Leeds City Gate Report. Leeds, UK.

Page 92
o Project office supported by Leeds City Council funded by £25m government funding
o Network Innovation Competition bid – £15m UK gas industry collaborative bid to provide the compelling safety evidence for gas grid conversion to hydrogen
o Roadmap viability for multiple stakeholders
CO2 sources o Infrastructure vector for Tees Valley industrial cluster decarbonisation o Additional CO2 sources from other industrial clusters (Grangemouth)
8.1.2 Markets Hydrogen
o Potential UK wide expansion – interface with H21 Strategic Modelling aimed at expanding the methodology adopted in the H21 Leeds City Gate projects to other major urban centres across the UK.
o Consequent scale-up of CO2 storage requirements with growing market.
International CO2 transport and storage service o Interface with Rotterdam/Netherlands infrastructure as de-risking option o Interface with Norwegian infrastructure
8.1.3 Delivery Infrastructure
o Choice of SMR locations with implications for natural gas (NG), hydrogen and CO2 infrastructure
o Interface with H21 project objective to consider alternative production and network storage solutions for a hydrogen conversion.
o Impact on infrastructure design of variable H2 production and storage (including intraday and inter-seasonal storage) and CO2 disposal
o Understanding of different phasing scenarios including CCS infrastructure based on proposed first phase of Leeds/Teesside/Hull
o Valuation of real options.
Regulatory o Relevance and amendments required of Ofgem (Office of gas and electricity
markets) regulatory model for H2: uniform network code, Supply Point Administration Agreement, Smart Energy Code, Gas (Calculation of Thermal Energy) Regulations (GCoTER)
o Applicability to hydrogen of Ofgem Natural Gas finance and regulation model, support, incentives and Gas Distribution Network business plan impact for 2021-2029 (RIIO-GD2)94 and beyond
Customer
94 RIIO is an abbreviation for Revenue=Incentives+Innovation+Outputs. This is the UK Ofgem’s performance-based framework for setting price controls for regulated network companies that are monopoly businesses. GD2 stands for the second gas distribution network price control period starting in 2021.

Page 93
o Domestic and commercial metering interface with H2 considering the impact on network meters for a hydrogen conversion
o Cost of appliance conversion – government contribution/manufacturing subsidies o Understanding and mitigation of impact on customers
8.2 Regulatory Background: National Level 8.2.1 Case specificities To recall, the main focus of the UK case study is on the decarbonisation of UK cities and industrial clusters. The goal is to switch large cities to a 100% H2 network, building on the Leeds City Gate H21 project. This involves support the planning for large-scale decarbonisation of UK cities and industrial clusters, by conversion from natural gas to H2 infrastructure for the first three cities in the H21 Roadmap project, to inform key policy decisions and commitment to build in 2021, considering the technical, operational, legal and financial aspects including industrial integration.
8.2.2 Brexit
8.2.3 Cities and associated industrial clusters converting the UK gas network to hydrogen, integrated with CCS (see H21 Leeds City
Gate Project) rollout to three cities and associated industrial clusters, complemented with technical and
commercial feasibility studies from a petrochemicals industry perspective energy network development city planning procedures
8.2.4 Appliance market The case study presupposes the existence of sufficiently large appliance market, as well as compatibility rules.
8.2.5 Storage of the CO2 stream captured from NG reforming Here must be addressed the uncertainties related to storage of the CO2 stream captured from NG reforming units.
8.3 Market Background 8.3.1 Existing Markets, Major R&D Activities, and Key Players In the UK country context and with focus on the scope of its ELEGANCY case study, the following H2/CCS infrastructure services and H2/CO2 utilization options are currently being offered or practiced.
8.3.1.1 Supply side: H2 infrastructure services
H2 production

Page 94
o Reforming SMR is widely deployed in the UK. Key players are from oil and gas: Shell and BP, and the industrial gas suppliers Air Products/TechnipFMC and BOC/Linde. Several SMR operations are co-located in the Tees Valley and in the Grangemouth industrial cluster.
o Gasification Considered not present
o Electrolysis using (excess) renewable power Electrolysis is considered an early-stage market. The UK company ITM Power is offering electrolyser technology to produce H2 de-centrally, aiming at clean fuel, (renewable) power storage, and ‘renewable chemistry’ off-takers.
H2 transmission and distribution
o By pipeline or by cargo tanks (trucks, rail, ship) Both BOC/Linde (35 km) and Air Products (5 km) have built and operated a H2 pipeline in the Teesside valley95. Generally, H2 pipeline transport occurs within clusters rather than in-between clusters. Technology-push and R&D initiatives with elements of H2 transport include Ofgem’s Network Innovation Competition96, the Leeds H21, and Cadent’s plans for a Liverpool-Manchester Hydrogen Cluster97. The first project to inject H2 into the NG gird is HyDeploy, hosted by Keele Universtiy and funded by Ofgem, Cadent and Northern Gas Networks98. The goal is to test gas blends of up to 20% H2 starting from 2019.
o Through hydrogen refuelling stations (HRS) network In the UK, there are currently 13 HRS operating and 4 more in planning, primarily in and around London99. Research and support initiatives include the recently finished HyFIVE project100, the Hydrogen For Transport Programme by BEIS, and the private-public partnership project UK H2Mobility101.
H2 storage
o Intermediate (short-term) storage ITM Power offers solutions for H2 short-term storage. So do the industrial gas suppliers such as BOC, Air Products, etc. There is no dedicated market for this activity.
o Seasonal/strategic, long-term geological storage
95 Perrin, J.. (2007). Roads2HyCom - PART III: Industrial distribution infrastructure. R2H2007PU.1. 96 www.ofgem.gov.uk/network-regulation-riio-model/current-network-price-controls-riio-1/network-innovation/gas-network-innovation-competition 97 Cadent. (2017). The Liverpool-Manchester Hydrogen Cluster - A Low Cost, Deliverable Project. Coventry, UK. Cadent Gas Ltd. and Progressive Energy Ltd. 98 https://hydeploy.co.uk/about/ 99 www.netinform.net/H2/H2Stations/H2Stations.aspx 100 https://cordis.europa.eu/project/rcn/185719_en.html 101 www.ukh2mobility.co.uk/

Page 95
Considered not present. Seasonal storage will be an integral part of the Leeds H21 initiative and has been taken into account for feasibility studies and demand/supply modelling. Salt caverns are available or can be created at the East coast just south of the Teesside valley102.
8.3.1.2 Supply side: CCS infrastructure services
CO2 capture o Reforming, gasification, and post-/oxycombustion capture (incl. NG sweetening)
Respondents in general concluded that there is currently no CCS infrastructure (capture, transport, storage) present in the UK. Pull-outs from project proponents or from the Governmental funding side have led to the cancellation of numerous piloting activities. The list of failed projects includes Don Valley, C.GEN, White Rose, Peterhead, etc. The major remaining industry/governmental CCS initiatives are the Teesside Collective103, the Caledonia New Energy project in Grangemouth104, the Liverpool-Manchester Hydrogen Cluster105, the OGCI Clean Gas Project106, and of course the Leeds H21. Clustering of CCS infrastructure is considered key for accelerated deployment, most notably in the Tees valley industrial hub.
o Biogas upgrading, ethanol production, direct air capture Neither is biogenic CO2 is currently captured and delivered, nor are there any industrial DAC projects in the UK. Academia is interested in both to explore negative emissions opportunities.
CO2 gathering, transmission, and distribution
o By pipeline Currently, there are not CO2 pipelines in the UK. In the context of the now cancelled Don Valley project, National Grid had investigated the building of a pipeline from Doncaster to prospective storage sites off the coast of Yorkshire (COOLTRANS project107). The project’s findings informed the development and application of a quantified risk assessment methodology for CO2 pipelines.
o By cargo tanks (trucks, rail, ship) Considered not present at scales beyond the shipping of industrial gases.
CO2 storage
o Permanent geological storage
102 Sadler, D., Cargill, A., Crowther, M., Rennie, A., Watt, J., Burton, S., & Haines, M. (2016). H21 Leeds City Gate Report. Leeds, UK. 103 www.teessidecollective.co.uk/ 104 Kerr, S. (2018). Caledonia Clean Energy Project – Feasibility Study Findings. UKCCSRC Conference, Cambridge University, 2018-03-26 105 Lewis, A. and Hanstock, D. (2018). Reducing the Carbon Intensity of the Gas Network. UKCCSRC Conference, Cambridge University, 2018-03-26. 106 Briggs, J. (2018). OGCI’s Clean Gas Project. UKCCSRC Conference, Cambridge University, 2018-03-26 107 Cooper, R., and Barnett, J. (2014). Pipelines for transporting CO2 in the UK. Energy Proceedia 63, 2412-31.
Page 96
Currently, there are no active CO2 storage sites on-shore or off-shore in the UK. Researchers and project proponents had been mapping storage opportunities extensively, especially offshore in the North Sea.
8.3.1.3 Demand side: H2 utilization markets H2 for mobility (focusing on road transport, i.e. passenger cars, buses, trucks)
o Use in mobile fuel cells The UK FCEV market can be characterized by prototype testing and piloting programs mostly driven by public sector customers. Notable players in this market are Air Liquid, BOC/Linde, ITM Power Daimler, Honda, Hyundai, Nissan and Toyota. The biggest demand cluster is in and around London, where vehicle owners find 7 HRS for refuelling.
H2 for industrial applications
o Conversion to chemicals/materials This is an established market in the UK, involving industrial and captive customers and structured in mature industrial clusters. Key players are Shell, BP, INEOS and BOC/Linde.
o Direct use via combustion for process heat Considered not present.
H2 for decentralized heat & power
o Direct use via combustion in boilers for heat (& power) Considered not present
o Decentralized stationary FCs for power (& heat) This is considered a niche application at very early stage, with mainly prototype testing and public sector customers. Some actors interested in this business are Ceres Power, Intelligent Energy, Rolls-Royce Fuel Cell Systems.
H2 for centralized power (& heat)
o Direct use via combustion in gas turbines and use in large stationary FC stacks Considered not present.
8.3.1.4 Demand side: CO2 utilization markets None of the CO2 utilization routes are considered present in the UK and no details about ongoing R&D efforts have been provided to date.

Page 97
8.3.2 Business Drivers Table 8.1 shows the heat map resulting from the assessment of the strength of business drivers in the UK (see Section Table 2.1 in Section 2.4 for a more detailed description of the type of market failures).
H2 infrastructure o Stakeholder commitments and strategic positioning are prominent driving forces. o For most supply/service options, commodity price variations do not significantly
drive development, except for reforming where prices of natural gas play a strong role.
o Innovation funding for H2 production (namely renewable electricity electrolysis), transmission/distribution and storage is a strong driver of early-stage market development.
o Carbon pricing mechanisms are not a driver for development of H2 infrastructure. CCS infrastructure
o In general, changes in commodity prices such as oil, gas and steel impact overall supply chains and therefore influence market development.
o No material commitments exist towards CCS infrastructure. Similarly, no fiscal advantages are offered.
o While strategic anticipation of future markets is not a driver on the CO2 capture side (capture suppliers stand ready for when a market exists), it is a driving force for transmission/distribution network operators and for storage service providers (oil and gas companies).
o Permitting and HSE regulations are satisfactory to deliver capture and pipeline infrastructure and are therefore not an existing driver; however liability regulations for CO2 storage are currently a barrier to investment.
H2 utilization
o Mobility, industrial and decentralized power & heat are all driver by stakeholder commitments.
o Use of H2 in mobility is also driver by environmental consciousness, social preferences and price/fiscal advantages.
CO2 utilization
o No drivers are identified by the respondents at this stage.
8.3.3 Market Failures Table 8.2 shows the heat map resulting from the assessment of market failures in the UK (see Section Table 2.2 in Section 2.5 for a more detailed description of the type of market failures).
Aside from industrial end-use markets for H2 and CO2, all elements of the H2-CCS sector in the UK were given overall a relatively stark market failure rating by respondents. In particular, H2 infrastructure services (transmission, distribution, storage) present severe market challenges throughout most categories, while the CO2 infrastructure side is especially affected by missing markets, coordination failure, insufficient CO2 signal and high barriers to entry (natural monopoly). Contrary to H2 infrastructure, the positive externality of the CCS chain is not assessed as a market failure.

Page 98
Table 8.1: Business drivers heat map for the UK case study.
Supply chain segment:Supply/service options:(cf. Tab 'Business tree')
Reforming Gasification RE electrolysis By pipeline, by vessel Through hydrogen refuelling stations (HRS) network
Intermediate (short-term) storage
Seasonal/strategic, long-term geological storage
N° Indicator
I.1 Market players and interactionsI.1.1
present not present not present present present not present not present
I.2 Business drivers
Provide rating: weak choose from list strong strong strong strong choose from listProvide rating: medium choose from list not a driver weak weak not a driver choose from listProvide rating: not a driver choose from list strong strong strong strong choose from listProvide rating: not a driver choose from list not a driver not a driver not a driver not a driver choose from listProvide rating: choose from list choose from list choose from list medium medium choose from list choose from listProvide rating: strong choose from list strong strong strong strong choose from listProvide rating: medium choose from list not a driver medium not a driver not a driver choose from listProvide rating: strong choose from list strong weak medium strong choose from listProvide rating: strong choose from list strong strong strong strong choose from list
I.2.6 Stakeholder commitments: I.2.7 Clustering: I.2.8 Technological advances:
Production
For the country under investigation and the H2 supply and infrastructure service options that are present (as selected in I.1.1), rate and describe the strength of the following indicators as drivers for H2 infrastructure services. In infrastructure sectors already dealing with grey/carbon-intensive H2, rate and describe the strength of the indicator as driver to switch to green/low-carbon H2. For
I.2.1 Cost of production/services:
In the given country context and with focus on the scope of your case study: Which H2 supply/infrastructure service options are currently being offered domestically?
I.2.9 Anticipation of future markets:
I.2.4 Carbon pricing mechanisms: I.2.5 Other regulations (apart from those in I.2.3-4):
I.2.2 Commodity prices: I.2.3 Fiscal advantages:
H2 InfrastructureTransmission, distribution Storage
CCS value chain segment: StorageCapture/service options:
(cf. Tab 'Business tree')Reforming Gasification Biogas upgrading, ethanol
productionPost-/oxycombustion
capture*Direct air capture By pipeline By vessel Permanent geological
storage
N° Indicator * from power&heat and from industrial point sources (incl. NG processing in the gas industry)
II.1 Market players and interactionsII.1.1
not present not present not present not present not present not present not present not present
II.2 Business drivers
Provide rating: strong choose from list choose from list strong choose from list medium choose from list mediumProvide rating: strong choose from list choose from list strong choose from list medium choose from list mediumProvide rating: not a driver choose from list choose from list weak choose from list not a driver choose from list not a driverProvide rating: strong choose from list choose from list strong choose from list strong choose from list negative driverProvide rating: not a driver choose from list choose from list weak choose from list not a driver choose from list negative driverProvide rating: not a driver choose from list choose from list not a driver choose from list not a driver choose from list not a driverProvide rating: not a driver choose from list choose from list weak choose from list medium choose from list weakProvide rating: medium choose from list choose from list strong choose from list weak choose from list mediumProvide rating: not a driver choose from list choose from list not a driver choose from list medium choose from list strongProvide rating: not a driver choose from list choose from list not a driver choose from list not a driver choose from list not a driver
CCS InfrastructureCapture Gathering, transmission, distribution
II.2.2 Commodity prices:
In the given country context and with focus on the scope of your case study: Which CO2 capture/infrastructure service options are currently being offered domestically?
For the country under investigation and the CCS infrastructure service options that are present (as selected in II.1.1), rate and describe the strength of the following indicators as drivers for CCS infrastructure services. II.2.1 Cost of production/services:
II.2.3 Fiscal advantages: II.2.4 Carbon pricing mechanisms: II.2.5 Other regulations (apart from those in II.2.3-4):
II.2.7 Clustering: Stakeholder commitments: II.2.6
II.2.10 Social preferences or rejection:
II.2.8 Technological advances: II.2.9 Anticipation of future markets:

Page 99
(Business driver heat maps for the UK case study - continued)
Market sector: Mobility*Utilization options:
(cf. Tab 'Business tree')Use in mobile fuel cells Conversion to
chemicals/materialsDirect use via combustion for
process heat only*Direct use via combustion in
boilers for heat (& power)Decentralized stationary FCs
for power (& heat)Direct use via combustion in
gas turbines Large stationary FC stacks
N° Indicator*primary subsector considered is road transport (passenger cars, buses, lorries).
III.1 Market players and interactionsIII.1.1
present present not present not present not present not present not present
III.2 Business drivers
Provide rating: strong weak choose from list choose from list strong choose from list choose from listProvide rating: strong not a driver choose from list choose from list strong choose from list choose from listProvide rating: not a driver not a driver choose from list choose from list not a driver choose from list choose from listProvide rating: weak not a driver choose from list choose from list not a driver choose from list choose from listProvide rating: strong strong choose from list choose from list strong choose from list choose from listProvide rating: strong weak choose from list choose from list weak choose from list choose from listProvide rating: strong not a driver choose from list choose from list not a driver choose from list choose from list
H2 Utilization
III.2.3 Carbon pricing mechanisms:
III.2.6 Environmental consciousness of consumers: III.2.7 Social preferences or rejection:
III.2.4III.2.5 Stakeholder commitments:
III.2.2 Fiscal advantages:
For the country under investigation and the utilization options that are present (as selected in III.1.1), rate and describe the strength of the following indicators as drivers for H2 utilization. In sectors where H2 is already being used, rate and describe the strength of the indicator as driver for green/low-carbon H2 utilization.
III.2.1
*the focus l ies on large power, whereas the co-harvesting of heat is always an option for large power applications.
Centralized heat & power*
Other regulations (apart from those in III.2.2-3):
*space heating and power (via combustion, gas turbine, stationary FC) is not considered part of the sector, but in the heat&power sectors.
Industry Decentralized heat & power*
*the focus l ies on decentralized heat via direct combustion in boilers; decentralized FC option is added as a niche option
Price for H2 products or services:
In the given country context and with focus on the scope of your case study: What are the currently prevailing H2 utilization options?
Market sector: Mobility Decentralized heat & power Centralized heat & powerUtilization options:
(cf. Tab 'Business tree')Conversion to liquid synthetic
fuel* Conversion to
chemicals/materialsUse as solvent Other uses without
conversionConversion to CH4 to be fed
into NG network*Use as working fluid*
N° Indicator*Additional note at bottom of this tab.
*Additional note at bottom of this tab.
*considering supercritical CO2 power cycles and geoenergy applications.
IV.1 Market players and interactionsIV.1.1
not present not present not present not present not present not present
IV.2 Business drivers
Provide rating: choose from list choose from list choose from list choose from list choose from list choose from listProvide rating: choose from list choose from list choose from list choose from list choose from list choose from listProvide rating: choose from list choose from list choose from list choose from list choose from list choose from listProvide rating: choose from list choose from list choose from list don't know choose from list choose from listProvide rating: choose from list choose from list choose from list choose from list choose from list choose from listProvide rating: choose from list choose from list choose from list choose from list choose from list choose from listProvide rating: choose from list choose from list choose from list choose from list choose from list choose from list
IV.2.2 Fiscal advantages: IV.2.3 Carbon pricing mechanisms:
IV.2.5
IV.2.7 Social preferences or rejection:
IV.2.4 Other regulations (apart from those in IV.2.2-3):
IV.2.6 Environmental consciousness of consumers: Stakeholder commitments:
*space heating and power (via combustion, gas turbine, stationary FC) is considered in the sectors to the right (columns H and I).
In the given country context and with focus on the scope of your case study: What are the currently prevailing CO2 utilization options?
For the country under investigation and the utilization options that are present (as selected in IV.1.1), rate and describe the strength of the following indicators as drivers for CO2 utilization. IV.2.1 Price for CO2 products or services:
Industry*
CO2 Utilization

Page 100
Table 8.2: Market failures heat map for the UK case study.
Market Opportunities/Market
FailuresMissing Market Coordination Failure
Negative ExternalityLow Priced CO2 Emissions
Positive Externality Improved Air Quality Natural Monopoly
Merit GoodsHydrogen
Merit GoodsCO2 Utilisation
Merit GoodsAppliances/Equipment Location Immobility
Social InequalityFuel Poverty
Information Failure and Asymmetry
Knowledge Creation Spillover
H2/CO2 End Use Markets
Large Stationary Power n/a n/a n/a n/a n/a n/a n/a n/a n/a n/a n/a n/a
Small Stationary Power ✔ - High ✔ - High ✔ - High n/a n/a ✔ - Medium n/a ✔ - Medium ✔ - Low ✔ - Medium ✔ - Low ✔ - Medium
Mobility - Vehicles ✔ - High ✔ - High ✔ - High ✔ - High n/a ✔ - Medium ✔ - Medium n/a ✔ - Low ✔ - Low ✔ - Low ✔ - Medium
Mobility - Other n/a n/a n/a n/a n/a n/a n/a n/a n/a n/a n/a n/a
Heat ✔ - High ✔ - High ✔ - High ✔ - Low ✔ - Low ✔ - Medium n/a ✔ - High ✔ - Low ✔ - High ✔ - Low ✔ - Medium
Chemicals and Industry ✔ - Low ✔ - Low ✔ - Medium ✔ - Medium n/a ✔ - Medium ✔ - High n/a ✔ - Low n/a ✔ - Low ✔ - High
Power to X (Storage) ✔ - High ✔ - High ✔ - High n/a n/a ✔ - High n/a n/a ✔ - Medium n/a ✔ - Low ✔ - High
H2-CCS Chain
H2 Retail ✔ - High ✔ - High ✔ - High ✔ - High ✔ - Low ✔ - High n/a ✔ - High n/a ✔ - High ✔ - Low ✔ - Low
H2 Distribution ✔ - High ✔ - High ✔ - High ✔ - High ✔ - Medium ✔ - High n/a n/a ✔ - Medium n/a n/a n/a
H2 Storage ✔ - High ✔ - High ✔ - High ✔ - High ✔ - High ✔ - High n/a n/a ✔ - High n/a ✔ - High ✔ - Medium
H2 Transmission ✔ - High ✔ - High ✔ - High ✔ - High ✔ - High ✔ - High n/a n/a ✔ - High n/a n/a n/a
Low Carbon H2 Production ✔ - Medium ✔ - High ✔ - High ✔ - High ✔ - Medium ✔ - High n/a n/a ✔ - Medium n/a ✔ - Low ✔ - Low
CO2 Capture ✔ - Medium ✔ - High ✔ - High ✔ - Medium ✔ - Low n/a ✔ - High n/a ✔ - Low n/a ✔ - Low ✔ - Medium
CO2 Gathering ✔ - High ✔ - High ✔ - High n/a ✔ - High n/a ✔ - High n/a ✔ - Medium n/a ✔ - Low ✔ - Medium
CO2 Transmission ✔ - High ✔ - High ✔ - High n/a ✔ - High n/a n/a n/a ✔ - High n/a ✔ - Medium ✔ - Medium
CO2 Storage ✔ - High ✔ - High ✔ - High n/a ✔ - High n/a n/a n/a ✔ - Medium n/a ✔ - High ✔ - Medium

Page 101
9 GERMANY The German case study investigates the feasibility of a decarbonized domestic gas infrastructure. Three scenarios will be developed and validated:
1) (Base case scenario) Natural gas is imported to Germany, decarbonized at the point of use (power plants and other large CO2 point sources), and the captured CO2 is transported via a new-built CO2 transport infrastructure to a storage site abroad.
2) Natural gas is decarbonized at the point of production and the clean hydrogen is imported to Germany. There it is blended with natural gas at high H2/CH4 ratios, in order to exploit (after necessary adaptions) the existing gas grid and distribution network.
3) Clean hydrogen is imported as in 2) and distributed to the end-users via a new-built H2 transport infrastructure.
The first scenario assumes that natural gas imports will precede as usual form countries like Norway, the Netherlands and Russia, and that on-shore geological storage of the CO2 after conventional capture is currently not an option in Germany. Hence, the captured CO2 will have to be exported. The economics for transport and storage of CO2 in this scenario will be linked to the Dutch case study that looks into the domestic off-shore storage options in the Netherlands. The second and third scenarios link to the Norwegian case study that aims to explore options of converting the Norwegian NG resources into clean hydrogen prior to export.
All the work in the case study is processed with an interdisciplinary approach, evaluating technical challenges as well as economic, legal and public-perception issues. With regard to technical aspects, the German case study will focus on questions related to necessary infrastructure upgrades w.r.t. pipeline material, compressor design, technical options for accurate custody transfer, capacity of existing gas-grids for operation with H2, restrictions with regard to gas storage etc. The environmental impact will be assessed by a life-cycle analysis.
To assess capacity limitations resulting from a fuel switch to H2, or to assess the required dimensions of a new H2 grid, scenarios for the structure of the future gas market need to be analysed. The economic assessment will consider costs and benefits for different stakeholder groups at different states of the gas-infrastructure transition as well as their influence on political decisions are more meaningful.
Public acceptance is a major factor for the viability of large-scale infrastructure projects. A mixed-method-design including surveys and interviews will be applied to assess opportunities and risks arising from public perception. Possible mechanisms aiming at increased acceptance by early public participation will be discussed. Furthermore, the legal framework relevant for planning, building and operating of pipeline grids will be analysed. For the legal framework in Germany, it will be particularly relevant to assess whether the modification of natural-gas infrastructure or the setup of separate H2 infrastructure can be dealt with under the legal regime implemented for the accelerated extension of the electricity grid. European energy directives aiming at the regulation of the internal market and of the trans-European energy-infrastructure will be considered.

Page 102
9.1 German case study parameters 9.1.1 Climate Business Context National Policies
o EU2050 Energy Plan: focus on 80% reduction in emissions achieved through renewable energy
o Dominance of coal/lignite in energy mix
9.1.2 Markets Hydrogen
o Local production vs. import options (Norway, Netherlands, others) o Focus on potential demand for transport and industry
9.1.3 Delivery Infrastructure
o H2 for commercial/residential heating • new H2 networks – cost/benefit of phasing, location • re-purposing of NG network (transmission, distribution, storage) - impact
of H2 blending in NG network for different concentrations o H2 network for transport – Expansion potential of NOW (organisation) o Export of CO2 – elaborate real options for transport/storage alternatives
Societal acceptance
o issue of CO2 storage as same as nuclear waste storage o H2 only acceptable for industrial applications
Regulatory o Impact of German infrastructure and energy laws and regulations on delivery of
H2-CCS networks and component businesses o Need for standards and regulatory harmonisation with destination and/or transit
jurisdictions
9.2 Regulatory Background: National Level 9.2.1 Case specificities To recall, the main focus of the German case study is on the adaptation of gas infrastructures to H2. The goal is to accelerate the decarbonisation of gas infrastructure via H2-CCS chain – either pure H2 distribution network, or by mixing H2 into the existing natural gas network. Accelerate the decarbonisation of German gas infrastructure via an H2-CCS chain, addressing the technical, economic, legal and social aspects that will influence the decision to build either a new pure H2 distribution network or mix H2 into the existing natural gas network.
Underground storage of CO2 is highly controversial in Germany, where five German federal states are preparing decisions or have passed laws limiting or banning underground storage of CO2, including for research purposes.
Page 103
9.2.2 Adaptation of gas infrastructures to H2 One objective would be the decarbonization of German natural gas as an energy carrier.
Implementing legislation in Germany is included in the Federal Emission Control Act and the Greenhouse Gas Emissions Trading Act (GGETA)108. Both acts provide for a licensing regime for the installations emitting hazardous substances. Initially these permits were granted according to the Federal Pollution Control Act109. Since 1 January 2013 GGETTA requires that a new type of permit applies although these are issued by the Federal Pollution Control Act as before.
9.2.3 Decarbonization of chemical and process industry Decarbonization of chemical and process industry as well as households will require a large-scale transformation of infrastructure.
9.3 Market Background 9.3.1 Existing Markets, Major R&D Activities, and Key Players In the German country context and with focus on the scope of its ELEGANCY case study, the following H2-CCS infrastructure services and H2-CO2 utilization options are currently being offered or practiced.
9.3.1.1 Supply side: H2 infrastructure services
H2 production o Reforming, Gasification, and Electrolysis using renewable power
All three categories are considered a niche application at this point of time. No further information about first-movers and/or ongoing R&D efforts has been provided to date.
H2 transmission and distribution
o By pipeline or by cargo tanks (trucks, rail, ship) There are two isolated pipeline networks in Germany. One is operated by Linde in the Eastern German chemical industry hub between Leuna, Buna, and Bitterfeld (135 km). It connects Linde SMRs with users such as the Total refinery in Spergau, and is also connected to a section owned and operated byBSL/Dow. The other is operated by Air Liquide in the Ruhr/Rhine area (240 km, ca. 250 Mm3pa) and connects Air Liquide’s own production sites with consumers in the chemical, oil and gas, coal hydration industry. Other net suppliers of hydrogen connected to the network are Bayer AG (Krefeld, Leverkusen), Evonik (ex-
108 Bundesimmissionsschutzgesetz, 15 March 1974, revised version published on 26 September 2002, (BGBl I, 3830), as amended and Gesetz über den Handel mit Berechtigungen zur Emission von Treibhausgasen, 21 July 2011, (BGBl I, 1475.), as amended. 109 Bundesimmissionsschutzgesetz, 15 March 1974, revised version published on 26 September 2002, (BGBl I, 3830), as amended.

Page 104
Degussa, Luelsdorf, Marl), and Ruhrkohle Bergbau AG (Bottrop). The total capacity of this Ruhr pipeline network is estimated to be 250 million m3/year. Linde had plans to operate a short (2 km) high-pressure (900 bar) pipeline in Frankfurt Hoechst, to serve HRS and the emerging FCEV market.110 Several utilities are piloting the injection of H2 into the NG grid, e.g. Thüga Group in Frankfurt am Main111, Ibbenbüren demo plant by RWE with Westnetz and WindGas Falkenhagen by E.ON with Ontras Gastranport GmbH112.
o Through hydrogen refuelling stations (HRS) network In Germany there are to date 54 HRS with some degree of clustering around bigger cities (Munich, Stuttgart, Frankfurt, Ruhr area, Berlin, Hamburg), while 37 are at planning stage113. The federal government is committed to the creation of HRS network in the future. It supports a remarkable industry initiative, H2 Mobility, dedicated to build and operate 100 HRS in 9 urban areas by end of 2019, followed by another 300 HRS thereafter. The H2 Mobility Initiative was founded in 2015 by Air Liquide, Daimler, Linde, OMV, Shell and TOTAL, with associated partners BMW, Honda, Hyundai, Toyota and Volkswagen, as well as Germany’s National Organisation for Hydrogen and Fuel Cell Technology (NOW GmbH). Furthermore, the German Government supports fuel cell technologies, including FCEVs and the associated infrastructure, via the National Innovation Programme for Hydrogen and Fuel Cell Technology, implemented by the National Organisation for Hydrogen and Fuel Cell Technology GmbH (NOW114).
H2 storage
o Intermediate (short-term) storage The HRS in Germany usually receive the H2 by trucks, then it is stored at 45 bar in pressurized containers, and compressed to 700 bar for the vehicles during refuelling.
o Seasonal/strategic, long-term geological storage The project H2STORE (2012-2015) studied H2 storage in depleted gas fields in Germany (4 sites) Austria and Argentina 115
9.3.1.2 Supply side: CCS infrastructure services
CO2 capture and transport None of the CO2 capture and transport infrastructure services are considered present in Germany and no details about ongoing R&D efforts have been provided to date.
110 Perrin, J.. (2007). Roads2HyCom - PART III: Industrial distribution infrastructure. R2H2007PU.1 111 www.itm-power.com/news-item/injection-of-hydrogen-into-the-german-gas-distribution-grid 112 Roland Berger GmbH, (2017). Development of Business Cases for Fuel Cells and Hydrogen Applications for European Regions and Cities. Fuel Cells and Hydrogen 2 Joint Undertaking, Reference N° FCH JU2017 D4259. 113 www.netinform.net/H2/H2Stations/H2Stations.aspx 114 https://www.now-gmbh.de/en 115 http://forschung-energiespeicher.info/en/wind-to-hydrogen/project-list/project-details/74/Wasserstoff_unter_Tage_speichern/

Page 105
CO2 storage o Permanent geological storage
On-shore CO2 storage in Germany has never materialized, despite the early interest of the major German utilities to demonstrate the entire CCS value chain from capture to storage (e.g. RWE Goldberg, Vattenfall Jänschwalde, E.ON Wilhelmshaven). In all cases, the projects were facing resistance from locals and politicians to a point where they had to be cancelled or were prohibited. On the R&D side, the Pilot Site Ketzin close to Pootsdam was used for CO2 storage research from exploration to abandonment. The site was recently closed after completion of the last project CO2 COMPLETE116.
9.3.1.3 Demand side: H2 utilization markets H2 for mobility (focusing on road transport, i.e. passenger cars, buses, trucks)
o Use in mobile fuel cells In January 2017 there were only 314 FCEVs registered in Germany117. Mercedes Benz has announced to roll out the battery/FC hybrid model GLC F-CELL in fall 2018. Linde has imitated the world’s first FCEV car sharing service in Munich. Due to economic reasons, the 50 FCEVs of this service will cease operations after two years in June 2018118. Since 2011, the public transport company of Cologne, RVK, has acquired 30 FCEBs and two HRS with support from the national Government. End of 2017, Lower Saxon public transport company LNVG signed a contract with Alstom for them to deliver 14 FC trains of the type ‘Coradia iLint’119.
H2 for industrial applications
o Conversion to chemicals/materials Germany has a strong chemical industry (BASF, Bayer, Evonik, Lanxess,…) and with Linde the second largest industrial gas manufacturer. Two clusters of hydrogen demand (refineries, chemical industry, coal hydration) are identified through the presence of the two H2 pipeline networks in Eastern Germany and in the Rhine/Ruhr area mentioned above.
o Direct use via combustion for process heat No rating provided; further research required.
H2 for decentralized heat & power
o Direct use via combustion in boilers for heat (& power) Considered a niche application.
o Decentralized stationary FCs for power (& heat)
116 www.co2ketzin.de/en/home/ 117 www.automobilwoche.de/article/20170118/nachrichten/170119880/wasserstofffahrzeuge-in-deutschland-warum-bisher-erst--brennstoffzellenautos-zugelassen-wurden 118 https://beezero.com/en 119 www.alstom.com/de/press-centre/2017/11/minister-lies-die-zugkunft-beginnt-in-niedersachsen/

Page 106
While not yet a market, also this type of use of FCs is supported by the Government via the National Innovation Programme for Hydrogen and Fuel Cell Technology120. That programme also supports a project that seeks reducing the energy consumption and fuel use on board ships, the e4ships project121.
H2 for centralized power (& heat)
o Direct use via combustion in gas turbines and in large stationary FC stacks. No rating provided; further research required.
9.3.1.4 Demand side: CO2 utilization markets None of the CO2 utilization routes except for P2G are considered present in Germany and no details about ongoing R&D efforts have been provided to date. CO2 for decentralized heat & power
o Conversion to CH4 (P2G) to be fed into NG network Considered currently a niche application reflecting an early-stage market. Audi’s e-Gas plant in Wertle, N-Germany, is producing some 1000 tpa of synthetic methane from renewable electricity and using some 2800 tpa biogenic CO2 from a nearby biogas plant122. The synthetic green methane is fed into the NG grid. The company Viessmann offers P2G adjacent to biogas plants, but using microbial methanation instead of the Sabatier reaction to produce the synthetic methane. The methane can be fed into the NG grid, or used directly as a climate neutral fuel (the company’s flagship plant in Schwandorf delivers to Audi for its g-tron CNG fleet). Also the P2G pilot plant in Allendorf injects since 2014 green synthetic gas (from renewable power and biogenic CO2 from a biogas upgrading plant) into the local NG gird123.
120 https://www.now-gmbh.de/en 121 http://www.e4ships.de/ 122 https://zukunft.erdgas.info/markt/erneuerbares-erdgas/power-to-gas/audi-e-gas 123 www.powertogas.info/power-to-gas/pilotprojekte-im-ueberblick/

Page 107
9.3.2 Business Drivers Table 9.1 shows the heat map resulting from the assessment of the strength of business drivers in Germany (see Section Table 2.1 in Section 2.4 for a more detailed description of the type of market failures).
H2 infrastructure o Carbon prices at the current level are not sufficient to be a strong driver. o Increasing commodity prices or greater commodity price volatility could be a
strong driver, in particular for transmission/distribution and storage segments. o Technical ameliorations in production of H2 through RE electrolysis or in short-
term storage of H2 could be a strong driver of market development. On the other hand, reforming and gasification, as well as pipeline infrastructure, are already at mature technology levels and therefore technical advances would have only limited driving impact.
CCS infrastructure
o For energy intensive CO2 separation processes, increase in commodity (e.g. energy) prices could reduce the attractiveness and feasibility of such processes.
o Higher carbon prices (for instance at the level of carbon capture costs) could be a strong driver.
o Storage of CO2 is effectively bared in Germany, which inhibits the demand for infrastructure.
o For carbon capture technologies, technical improvements could be relatively strong drivers of adoption.
o Social preferences are generally viewed as a rather weak driver for CO2 capture. H2 utilization
o Environmental consciousness and social preferences are relatively strong drivers for mobility applications.
CO2 utilization
o No drivers are identified by the respondents at this stage.
9.3.3 Market Failures Table 9.2 shows the heat map resulting from the assessment of market failures in Germany (see Section Table 2.2 in Section 2.5 for a more detailed description of the type of market failures).
On the infrastructure side of the H2-CCS chain (i.e. production, distribution, transmission, storage), the intensity of the market failures identified is higher for CO2- than H2-related elements. Missing market, coordination failure, externalities and entry barriers (natural monopoly) are assessed medium-to-high for the former and rather low-to-medium for the latter. In addition, limited merit good or location immobility market failures were found for H2 infrastructure, whereas this is clearly a critical challenge for CO2. On the end-use markets side, industrial uses (and to a lesser extent the heat and stationary power markets) are the most resilient to market failures in the country.

Page 108
Table 9.1: Business drivers heat map for the German case study. o
Supply chain segment:Supply/service options:(cf. Tab 'Business tree')
Reforming Gasification RE electrolysis By pipeline, by vessel Through hydrogen refuelling stations (HRS) network
Intermediate (short-term) storage
Seasonal/strategic, long-term geological storage
N° Indicator
I.1 Market players and interactionsI.1.1
niche application niche application niche application niche application niche application don't know don't know
I.2 Business drivers
Provide rating: don't know don't know negative driver strong don't know strong strongProvide rating: negative driver negative driver strong medium strong strong strongProvide rating: don't know don't know don't know don't know don't know don't know don't knowProvide rating: weak weak weak weak weak weak weakProvide rating: don't know don't know don't know don't know don't know don't know don't knowProvide rating: don't know don't know don't know don't know medium don't know don't knowProvide rating: don't know don't know don't know strong don't know don't know don't knowProvide rating: medium medium strong weak weak strong mediumProvide rating: don't know don't know don't know don't know don't know don't know don't know
I.2.1 Cost of production/services:
In the given country context and with focus on the scope of your case study: Which H2 supply/infrastructure service options are currently being offered domestically?
Production
For the country under investigation and the H2 supply and infrastructure service options that are present (as selected in I.1.1), rate and describe the strength of the following indicators as drivers for H2 infrastructure services. In infrastructure sectors already dealing with grey/carbon-intensive H2, rate and describe the strength of the indicator as driver to switch to green/low-carbon H2. For
H2 InfrastructureTransmission, distribution Storage
I.2.3 Fiscal advantages:
I.2.8 Technological advances:
I.2.6 Stakeholder commitments: I.2.7 Clustering:
I.2.9 Anticipation of future markets:
I.2.4 Carbon pricing mechanisms: I.2.5 Other regulations (apart from those in I.2.3-4):
I.2.2 Commodity prices:
CCS value chain segment: StorageCapture/service options:
(cf. Tab 'Business tree')Reforming Gasification Biogas upgrading, ethanol
productionPost-/oxycombustion
capture*Direct air capture By pipeline By vessel Permanent geological
storage
N° Indicator * from power&heat and from industrial point sources (incl. NG processing in the gas industry)
II.1 Market players and interactionsII.1.1
not present not present not present not present not present don't know don't know not present
II.2 Business drivers
Provide rating: don't know weak don't know negative driver negative driver don't know don't know negative driverProvide rating: negative driver negative driver negative driver negative driver not a driver not a driver don't know not a driverProvide rating: don't know don't know don't know don't know don't know don't know don't know don't knowProvide rating: weak weak weak weak weak weak weak weakProvide rating: don't know don't know don't know don't know don't know negative driver negative driver don't knowProvide rating: don't know don't know don't know don't know don't know don't know don't know don't knowProvide rating: don't know don't know don't know don't know don't know don't know don't know don't knowProvide rating: medium medium medium strong strong weak medium don't knowProvide rating: don't know don't know don't know don't know don't know don't know don't know don't knowProvide rating: not a driver not a driver not a driver not a driver not a driver don't know don't know negative driver
CCS Infrastructure
II.2.10 Social preferences or rejection:
II.2.8 Technological advances: II.2.9 Anticipation of future markets:
II.2.5 Other regulations (apart from those in II.2.3-4):
II.2.7 Clustering: Stakeholder commitments: II.2.6
II.2.3 Fiscal advantages: II.2.4 Carbon pricing mechanisms:
II.2.2 Commodity prices:
In the given country context and with focus on the scope of your case study: Which CO2 capture/infrastructure service options are currently being offered domestically?
For the country under investigation and the CCS infrastructure service options that are present (as selected in II.1.1), rate and describe the strength of the following indicators as drivers for CCS infrastructure services. II.2.1 Cost of production/services:
Capture Gathering, transmission, distribution

Page 109
(Business driver heat maps for the German case study - continued)
Market sector: Mobility*Utilization options:
(cf. Tab 'Business tree')Use in mobile fuel cells Conversion to
chemicals/materialsDirect use via combustion for
process heat only*Direct use via combustion in
boilers for heat (& power)Decentralized stationary FCs
for power (& heat)Direct use via combustion in
gas turbines Large stationary FC stacks
N° Indicator*primary subsector considered is road transport (passenger cars, buses, lorries).
III.1 Market players and interactionsIII.1.1
present present don't know niche application niche application don't know don't know
III.2 Business drivers
Provide rating: negative driver don't know don't know don't know don't know don't know don't knowProvide rating: don't know don't know don't know don't know don't know don't know don't knowProvide rating: don't know don't know don't know don't know don't know don't know don't knowProvide rating: don't know don't know don't know don't know don't know don't know don't knowProvide rating: don't know don't know don't know don't know don't know don't know don't knowProvide rating: strong not a driver don't know don't know medium don't know don't knowProvide rating: medium don't know don't know don't know weak don't know don't know
Other regulations (apart from those in III.2.2-3):
*space heating and power (via combustion, gas turbine, stationary FC) is not considered part of the sector, but in the heat&power sectors.
Industry Decentralized heat & power*
*the focus l ies on decentralized heat via direct combustion in boilers; decentralized FC option is added as a niche option
Price for H2 products or services:
In the given country context and with focus on the scope of your case study: What are the currently prevailing H2 utilization options?
III.2.2 Fiscal advantages:
For the country under investigation and the utilization options that are present (as selected in III.1.1), rate and describe the strength of the following indicators as drivers for H2 utilization. In sectors where H2 is already being used, rate and describe the strength of the indicator as driver for green/low-carbon H2 utilization.
III.2.1
H2 Utlization
*the focus l ies on large power, whereas the co-harvesting of heat is always an option for large power applications.
Centralized heat & power*
III.2.3 Carbon pricing mechanisms:
III.2.6 Environmental consciousness of consumers: III.2.7 Social preferences or rejection:
III.2.4III.2.5 Stakeholder commitments:
Market sector: Mobility Decentralized heat & power Centralized heat & powerUtilization options:
(cf. Tab 'Business tree')Conversion to liquid synthetic
fuel* Conversion to
chemicals/materialsUse as solvent Other uses without
conversionConversion to CH4 to be fed
into NG network*Use as working fluid*
N° Indicator*Additional note at bottom of this tab.
*Additional note at bottom of this tab.
*considering supercritical CO2 power cycles and geoenergy applications.
IV.1 Market players and interactionsIV.1.1
not present not present not present not present niche application not present
IV.2 Business drivers
Provide rating: choose from list choose from list choose from list choose from list don't know choose from listProvide rating: choose from list choose from list choose from list choose from list don't know choose from listProvide rating: choose from list choose from list choose from list choose from list don't know choose from listProvide rating: choose from list choose from list choose from list choose from list don't know choose from listProvide rating: choose from list choose from list choose from list choose from list don't know choose from listProvide rating: choose from list choose from list choose from list choose from list don't know choose from listProvide rating: choose from list choose from list choose from list choose from list don't know choose from list
*space heating and power (via combustion, gas turbine, stationary FC) is considered in the sectors to the right (columns H and I).
In the given country context and with focus on the scope of your case study: What are the currently prevailing CO2 utilization options?
For the country under investigation and the utilization options that are present (as selected in IV.1.1), rate and describe the strength of the following indicators as drivers for CO2 utilization. IV.2.1 Price for CO2 products or services:
Industry*
CO2 Utlization
IV.2.4 Other regulations (apart from those in IV.2.2-3):
IV.2.6 Environmental consciousness of consumers: Stakeholder commitments: IV.2.5
IV.2.7 Social preferences or rejection:
IV.2.2 Fiscal advantages: IV.2.3 Carbon pricing mechanisms:

Page 110
Table 9.2: Market failures heat map for the German case study.
Market Opportunities/Market
FailuresMissing Market Coordination Failure
Negative ExternalityLow Priced CO2 Emissions
Positive Externality Improved Air Quality Natural Monopoly
Merit GoodsHydrogen
Merit GoodsCO2 Utilisation
Merit GoodsAppliances/Equipment Location Immobility
Social InequalityFuel Poverty
Information Failure and Asymmetry
Knowledge Creation Spillover
H2/CO2 End Use Markets
Large Stationary Power ✔ - High ✔ - Medium ✔ - High ✔ - Low ✔ - Low ✔ - High ✔ - Medium ✔ - Low ✔ - Low ✔ - Medium ✔ - Medium ✔ - High
Small Stationary Power ✔ - High ✔ - Medium ✔ - High ✔ - Medium ✔ - Low ✔ - High ✔ - Low ✔ - Low ✔ - Low ✔ - Medium ✔ - Medium ✔ - High
Mobility - Vehicles ✔ - High ✔ - High ✔ - High ✔ - High ✔ - Low ✔ - High n/a ✔ - High n/a ✔ - High ✔ - High ✔ - High
Mobility - Other ✔ - High ✔ - High ✔ - High ✔ - High ✔ - Medium ✔ - High n/a ✔ - High n/a ✔ - High ✔ - High ✔ - High
Heat ✔ - High ✔ - Low ✔ - High ✔ - Medium ✔ - Low ✔ - High ✔ - Low ✔ - Medium ✔ - Low ✔ - Medium ✔ - Medium ✔ - High
Chemicals and Industry ✔ - Medium ✔ - Medium ✔ - Medium ✔ - Low ✔ - Medium ✔ - High ✔ - Medium ✔ - Medium ✔ - Low ✔ - Medium ✔ - Medium ✔ - High
Power to X (Storage) ✔ - High ✔ - High ✔ - High n/a ✔ - Low ✔ - High n/a n/a ✔ - Low ✔ - High ✔ - High ✔ - High
H2-CCS Chain
H2 Retail ✔ - Medium ✔ - Low ✔ - Low ✔ - Low ✔ - Medium n/a n/a n/a n/a ✔ - Medium ✔ - Low ✔ - Medium
H2 Distribution ✔ - Medium ✔ - High ✔ - Low ✔ - Low ✔ - Medium n/a n/a n/a n/a ✔ - Medium ✔ - Low ✔ - Medium
H2 Storage ✔ - High ✔ - Medium ✔ - Medium n/a ✔ - Medium n/a n/a n/a n/a ✔ - Low ✔ - Low ✔ - High
H2 Transmission ✔ - High ✔ - High ✔ - Low n/a ✔ - High n/a n/a n/a n/a ✔ - Low ✔ - Low ✔ - High
Low Carbon H2 Production ✔ - Medium ✔ - High ✔ - High ✔ - High ✔ - Low ✔ - High n/a ✔ - High ✔ - Medium ✔ - High ✔ - High ✔ - High
CO2 Capture ✔ - High ✔ - Medium ✔ - High n/a ✔ - Low n/a ✔ - High ✔ - High ✔ - High ✔ - High ✔ - Medium ✔ - High
CO2 Gathering ✔ - High ✔ - High ✔ - High n/a ✔ - Low n/a ✔ - High ✔ - High ✔ - High ✔ - High ✔ - Medium ✔ - High
CO2 Transmission ✔ - High ✔ - High ✔ - High n/a ✔ - High n/a ✔ - Low n/a ✔ - High ✔ - High ✔ - Medium ✔ - High
CO2 Storage ✔ - High ✔ - Medium ✔ - High n/a ✔ - Medium n/a ✔ - Low n/a ✔ - Medium ✔ - High ✔ - Medium ✔ - High

Page 111
10 NORWAY The European energy market, which received 95% of the Norwegian natural gas in 2017124, is in a transition phase towards a significantly higher share of renewable energy. In order to ensure a future value creation based on natural gas and reduce global CO2 emissions, increased knowledge of H2-related possibilities and opportunities is key for Norway. The question is, whether it is optimal to convert natural gas to H2 in Norway and export this, or H2-enriched natural gas, via new (or converted existing) pipelines, or to export natural gas in existing pipelines for distributed H2 conversion in Europe and then import the captured CO2 for storage in the North Sea via ships or a new CO2 pipeline network. The answer to this question depends on technical, economical and legal aspects, which will all be considered in WP5.
The Norwegian case study will aim to provide increased knowledge for the national market as well as export, making full use of the industrial expertise across the Norwegian academic, industrial and governmental partners. Using the chain modelling tools developed in ELEGANCY WP4, the Norwegian case study will develop an optimal strategy and infrastructure investment scenario for Norwegian H2 export and utilization, including the location of H2 production, CO2 storage and transport of both gases to/from Continental Europe in synergy with the Norwegian full-scale CCS project
Independent of the findings related to system optimization (H2 exports vs. CO2 imports), the Norwegian case study will evaluate the benefit of converting Norway’s large natural gas resources to H2 with CCS, primarily to satisfy the expected growth in worldwide demand of H2 as an energy carrier and additionally to mitigate emissions in off-shore platforms and the transport sector.
10.1 Norwegian case study parameters 10.1.1 Climate Business Context Energy Policies and Budget Norway hydrogen strategy: Hydrogen as an energy carrier for transport and energy
supply and increased national competence and role in European hydrogen industry H2-CCS value chain options: produce and export H2 with domestic capture for CCS vs.
produce and export Natural Gas with import and storage of CO2 as a service
10.1.2 Markets Hydrogen
o H2 consumption or demand profiles over time and geographic variation of demand
o Export market potential: UK, Northern Europe, Japan o Potential domestic utilisation for transport: road, rail, shipping
CO2 transport and storage services o Target sources: Northern Europe, landlocked countries o Transport/handling services: ports, pipelines, ships
124 www.norskpetroleum.no/en/production-and-exports/oil-and-gas-production/

Page 112
o Skills export potential
10.1.3 Delivery Infrastructure
o Option development for two cases (H2 vs. NG): design, location, development, and operation
o Comparison of LCA, system emissions profile for two case (H2 vs. NG) (including end use)
o Implications of H2-enriched NG versus either H2 or NG
Commercial and Financial o State and private industry participation o Integrated assessment and macro-economic valuation of system options o Interaction between operation of regulated assets in different jurisdictions o Third country transit fees and commercial obligations
Legal o International treaties and cross border movement of CO2 o Harmonisation of standards and regulations between jurisdictions
10.2 Regulatory Background: National Level 10.2.1 Case specificities To recall, the main focus of the Norwegian case study is on the full scale CCS chain and synergies with H2 production. The goal is to develop an optimal infrastructure investment scenario for H2 export and utilisation, including the location of H2 production, CO2 storage and transport of both gases to/from Continental Europe in synergy with the Norwegian full-scale CCS project.
Question raised as to the case study design include: Should H2 be converted to CO2 in Norway, requiring a new hydrogen pipeline, or should the conversion happen in continental Europe, requiring a new CO2 pipeline? Will shipping of H2 or CO2 be a sensible fast-track solution, or would it lead to delays in large-scale deployment such that the net benefit is negative?
10.2.2 Relationship to EU/EEA-law May imply from delays in the implementation of directives.
Ex: implementation of the third energy package
10.2.3 Converting Norway's large natural gas resources to H2 with CCS The Norwegian case study will evaluate the benefit of converting Norway's large natural gas resources to H2 with CCS.

Page 113
10.2.4 Decarbonise the offshore petroleum sector: mitigate emissions in offshore platforms
10.2.5 Decarbonise the transport sector
10.2.6 Storage of CO2 on the Norwegian continental shelf
10.2.7 Synergies with the full-scale CCS project.
10.3 Market Background 10.3.1 Existing Markets, Major R&D Activities, and Key Players In the Norwegian country context and with focus on the scope of its ELEGANCY case study, the following H2-CCS infrastructure services and H2-CO2 utilization options are currently being offered or practiced.
10.3.1.1 Supply side: H2 infrastructure services The market presence rating for H2 infrastructure services was provided without explanatory comments; more research is needed at a later stage of the project.
H2 production o Reforming
Considered present.
o Gasification and Electrolysis using (excess) renewable power Considered not present.
H2 transmission and distribution
o By pipeline, cargo tanks, and through HRS network Considered present.
H2 storage
o Intermediate (short-term) storage Considered present
o Seasonal/strategic, long-term geological storage Considered not present.
10.3.1.2 Supply side: CCS infrastructure services The market presence rating for CCS infrastructure services was provided without explanatory comments; more research is needed at a later stage of the project.
CO2 capture o Reforming
Considered present.

Page 114
o Gasification, Biogas upgrading, and Ethanol production Considered not present.
o Post-/oxycombustion capture (incl. NG sweetening) Outside the scope of the Norwegian case study.
o Direct air capture Considered not present.
CO2 gathering, transmission, and distribution
o By pipeline and by cargo tanks Considered present.
CO2 storage
o Permanent geological storage Considered present.
10.3.1.3 Demand side: H2 utilization markets The market presence rating for H2 utilization options was provided without explanatory comments; more research is needed at a later stage of the project.
H2 for mobility (focusing on road transport, i.e. passenger cars, buses, trucks)
o Use in mobile fuel cells Considered present.
H2 for industrial applications
o Conversion to chemicals/materials and direct use via combustion for process heat Both considered present.
H2 for decentralized heat & power
o Direct use via combustion in boilers and in stationary FCs Both considered not present.
H2 for centralized power (& heat)
o Direct use via combustion in gas turbines Considered present.
o Large stationary FC stacks Considered not present.
10.3.1.4 Demand side: CO2 utilization markets No market presence rating for CO2 utilization options nor explanatory comments were provided; as they are outside the scope of the case study.

Page 115
10.3.2 Business Drivers Table 10.1 shows the heat map resulting from the assessment of the strength of business drivers in Norway (see Section Table 2.1 in Section 2.4 for a more detailed description of the type of market failures). For the Norwegian case study, minimal qualitative feedback from respondents limits the extent to which the heat map presented in Table 10.1 below may be analysed.
H2 infrastructure o For the supply and service options present, the indicators are mostly viewed as
being positive drivers. o The strongest drivers identified are stakeholder commitments, cost advantages
and anticipation of future markets CCS infrastructure
o A number of indicators are highlighted as being relatively strong drivers for market development in the supply and service options present: cost advantages, carbon pricing mechanisms and stakeholder commitment
o Conversely, the weaker drivers listed are social preferences are general regulation (aside from fiscal and carbon regulation)
H2 utilization
o Several indicators are highlighted as being relatively strong drivers for the utilization options present: price advantages, carbon pricing mechanisms and stakeholder commitments.
o Social preferences of users are not viewed as a driver of H2 utilization options CO2 utilization
CO2 utilization options were not assessed as they are outside the scope of the case study.
10.3.3 Market Failures Table 10.1 shows the heat map resulting from the assessment of market failures in Norway (see Section Table 2.2 in Section 2.5 for a more detailed description of the type of market failures).
The market failure heat map for the Norwegian case study is representative of the country’s leading role in the CCS sector, comparative to the H2 sector. Indicators of gaps in early-stage market development (e.g. missing market, coordination failure, negative externality, knowledge creation spillover) are assessed as ‘medium-to-low’ for the CO2 part of the chain and up to ‘high’ for the H2 chain. For those market failures less tied to a specific development stage (e.g. natural monopoly, merit goods), the result of the assessment are less segregated.

Page 116
Table 10.1: Business drivers heat map for the Norwegian case study.
Supply chain segment:Supply/service options:(cf. Tab 'Business tree')
Reforming Gasification RE electrolysis By pipeline, by vessel Through hydrogen refuelling stations (HRS) network
Intermediate (short-term) storage
Seasonal/strategic, long-term geological storage
N° Indicator
I.1 Market players and interactionsI.1.1
present not present not present present present present not present
I.2 Business drivers
Provide rating: strong choose from list choose from list strong strong strong choose from listProvide rating: medium choose from list choose from list medium strong medium choose from listProvide rating: don't know choose from list choose from list don't know don't know don't know choose from listProvide rating: medium choose from list choose from list medium medium weak choose from listProvide rating: medium choose from list choose from list medium medium don't know choose from listProvide rating: strong choose from list choose from list strong strong strong choose from listProvide rating: not a driver choose from list choose from list strong medium medium choose from listProvide rating: medium choose from list choose from list strong medium medium choose from listProvide rating: medium choose from list choose from list strong medium strong choose from list
H2 InfrastructureTransmission, distribution Storage
I.2.9 Anticipation of future markets:
I.2.4 Carbon pricing mechanisms: I.2.5 Other regulations (apart from those in I.2.3-4):
I.2.2 Commodity prices: I.2.3 Fiscal advantages:
I.2.8 Technological advances:
Production
For the country under investigation and the H2 supply and infrastructure service options that are present (as selected in I.1.1), rate and describe the strength of the following indicators as drivers for H2 infrastructure services. In infrastructure sectors already dealing with grey/carbon-intensive H2, rate and describe the strength of the indicator as driver to switch to green/low-carbon H2. For
I.2.1 Cost of production/services:
In the given country context and with focus on the scope of your case study: Which H2 supply/infrastructure service options are currently being offered domestically?
I.2.6 Stakeholder commitments: I.2.7 Clustering:
CCS value chain segment: StorageCapture/service options:
(cf. Tab 'Business tree')Reforming Gasification Biogas upgrading, ethanol
productionPost-/oxycombustion
capture*Direct air capture By pipeline By vessel Permanent geological
storage
N° Indicator * from power&heat and from industrial point sources (incl. NG processing in the gas industry)
II.1 Market players and interactionsII.1.1
present not present not present not present not present present present present
II.2 Business drivers
Provide rating: strong choose from list choose from list choose from list choose from list strong strong mediumProvide rating: medium choose from list choose from list choose from list choose from list weak weak weakProvide rating: don't know choose from list choose from list choose from list choose from list don't know don't know don't knowProvide rating: medium choose from list choose from list choose from list choose from list strong strong strongProvide rating: weak choose from list choose from list choose from list choose from list weak weak weakProvide rating: strong choose from list choose from list choose from list choose from list strong strong strongProvide rating: medium choose from list choose from list choose from list choose from list strong weak strongProvide rating: medium choose from list choose from list choose from list choose from list weak medium strongProvide rating: medium choose from list choose from list choose from list choose from list strong medium mediumProvide rating: weak choose from list choose from list choose from list choose from list medium weak weak
CCS InfrastructureCapture Gathering, transmission, distribution
II.2.2 Commodity prices:
In the given country context and with focus on the scope of your case study: Which CO2 capture/infrastructure service options are currently being offered domestically?
For the country under investigation and the CCS infrastructure service options that are present (as selected in II.1.1), rate and describe the strength of the following indicators as drivers for CCS infrastructure services. II.2.1 Cost of production/services:
II.2.3 Fiscal advantages: II.2.4 Carbon pricing mechanisms: II.2.5 Other regulations (apart from those in II.2.3-4):
II.2.7 Clustering: Stakeholder commitments: II.2.6
II.2.10 Social preferences or rejection:
II.2.8 Technological advances: II.2.9 Anticipation of future markets:

Page 117
(Business driver heat maps for the Norwegian case study - continued)
Market sector: Mobility*Utilization options:
(cf. Tab 'Business tree')Use in mobile fuel cells Conversion to
chemicals/materialsDirect use via combustion for
process heat only*Direct use via combustion in
boilers for heat (& power)Decentralized stationary FCs
for power (& heat)Direct use via combustion in
gas turbines Large stationary FC stacks
N° Indicator*primary subsector considered is road transport (passenger cars, buses, lorries).
III.1 Market players and interactionsIII.1.1
present present present not present not present present not present
III.2 Business drivers
Provide rating: strong strong strong choose from list choose from list strong choose from listProvide rating: don't know don't know don't know choose from list choose from list don't know choose from listProvide rating: medium strong strong choose from list choose from list strong choose from listProvide rating: strong don't know don't know choose from list choose from list strong choose from listProvide rating: strong strong strong choose from list choose from list strong choose from listProvide rating: medium medium medium choose from list choose from list weak choose from listProvide rating: weak not a driver not a driver choose from list choose from list not a driver choose from list
H2 Utilization
III.2.3 Carbon pricing mechanisms: How significant are
III.2.6 Environmental consciousness of consumers: How III.2.7 Social preferences or rejection: How significant are
III.2.4III.2.5 Stakeholder commitments: How significant are
III.2.2 Fiscal advantages: If fiscal advantages are being
For the country under investigation and the utilization options that are present (as selected in III.1.1), rate and describe the strength of the following indicators as drivers for H2 utilization. In sectors where H2 is already being used, rate and describe the strength of the indicator as driver for green/low-carbon H2 utilization.
III.2.1
*the focus l ies on large power, whereas the co-harvesting of heat is always an option for large power applications.
Centralized heat & power*
Other regulations (apart from those in III.2.2-3):
*space heating and power (via combustion, gas turbine, stationary FC) is not considered part of the sector, but in the heat&power sectors.
Industry Decentralized heat & power*
*the focus l ies on decentralized heat via direct combustion in boilers; decentralized FC option is added as a niche option
Price for H2 products or services: How significant are
In the given country context and with focus on the scope of your case study: What are the currently prevailing H2 utilization options?

Page 118
Table 10.2: Market failures heat map for the Norwegian case study.
Market Opportunities/Market
FailuresMissing Market Coordination Failure
Negative ExternalityLow Priced CO2 Emissions
Positive Externality Improved Air Quality Natural Monopoly
Merit GoodsHydrogen
Merit GoodsCO2 Utilisation
Merit GoodsAppliances/Equipment Location Immobility
Social InequalityFuel Poverty
Information Failure and Asymmetry
Knowledge Creation Spillover
H2/CO2 End Use Markets
Large Stationary Power n/a n/a n/a n/a n/a n/a n/a n/a n/a n/a n/a n/a
Small Stationary Power ✔ - Medium ✔ - High ✔ - Medium ✔ - Medium ✔ - Medium ✔ - High ✔ - High ✔ - Medium ✔ - Low n/a ✔ - Low ✔ - Low
Mobility - Vehicles ✔ - Medium ✔ - Medium ✔ - High ✔ - Medium ✔ - Low ✔ - High ✔ - High ✔ - Medium ✔ - High ✔ - Medium ✔ - Medium ✔ - Low
Mobility - Other ✔ - Medium ✔ - Medium ✔ - High ✔ - Medium ✔ - High ✔ - High ✔ - High ✔ - Medium ✔ - Medium n/a ✔ - Low ✔ - Low
Heat n/a n/a n/a n/a n/a n/a n/a n/a n/a n/a n/a n/a
Chemicals and Industry ✔ - Medium ✔ - High ✔ - High ✔ - Medium ✔ - High ✔ - Medium ✔ - Medium ✔ - Medium ✔ - Low ✔ - Medium ✔ - Low ✔ - Low
Power to X (Storage) ✔ - Medium ✔ - High ✔ - High n/a ✔ - Medium ✔ - High ✔ - High ✔ - Medium ✔ - High ✔ - High ✔ - High ✔ - Low
H2-CCS Chain
H2 Retail ✔ - High ✔ - High ✔ - High ✔ - Medium ✔ - Medium ✔ - Medium ✔ - High n/a ✔ - High ✔ - Medium ✔ - High ✔ - Low
H2 Distribution ✔ - High ✔ - High ✔ - High ✔ - Medium ✔ - High ✔ - Medium ✔ - High ✔ - Medium ✔ - High ✔ - Medium ✔ - Medium ✔ - Medium
H2 Storage ✔ - High ✔ - High ✔ - High ✔ - Medium ✔ - Medium ✔ - Medium ✔ - High ✔ - Medium ✔ - High ✔ - Medium ✔ - Medium ✔ - Low
H2 Transmission ✔ - High ✔ - High ✔ - High ✔ - Medium ✔ - High ✔ - Medium ✔ - High ✔ - Medium ✔ - High ✔ - Medium ✔ - Low ✔ - Medium
Low Carbon H2 Production ✔ - Medium ✔ - High ✔ - High ✔ - Medium ✔ - Low ✔ - Medium ✔ - High ✔ - Low ✔ - High ✔ - Medium ✔ - Medium ✔ - Low
CO2 Capture ✔ - Medium ✔ - Medium ✔ - Medium ✔ - Medium ✔ - Low n/a ✔ - High ✔ - Medium ✔ - Medium n/a ✔ - Low ✔ - Low
CO2 Gathering ✔ - Medium ✔ - Medium ✔ - Medium ✔ - Medium ✔ - Medium n/a ✔ - High ✔ - Medium ✔ - Medium n/a ✔ - Low ✔ - Medium
CO2 Transmission ✔ - Medium ✔ - Medium ✔ - Medium ✔ - Medium ✔ - High n/a ✔ - High ✔ - Medium ✔ - Medium n/a ✔ - Low ✔ - Medium
CO2 Storage ✔ - Medium ✔ - Medium ✔ - Medium ✔ - Medium ✔ - High n/a n/a ✔ - Medium ✔ - Medium n/a ✔ - Low ✔ - Low

Page 119
11 FINAL REMARKS
Regulatory background The following points bear need for further clarifications as the project progresses:
Market design: qualification of new activities. Ex: temporary storage for CO2 and H2. Plants requirements: capture-ready, etc. Support: diversity of support measures (regulatory/financial), use of financing
mechanisms (ex: Innovation Fund, PCI lists), justification (environment, security of supply: capacity mechanisms); application of state aid rules – EEAG practice; market valorisation
Access to the grid. Fuel quality requirements (FQD) – life-cycle approach Use of biomass (Switzerland), negative emissions.
The following points bear a need for adaption or existing rules, removal of legal bottlenecks, or adoption of new rules:
Cross-boundary movement of CO2 for permanent storage CCS Directive and focus on permanent storage. Other legal basis. Balance of responsibilities along the chain (commercial operations vs. non-commercial
ones, like storage) Standardisation efforts for technical requirements (transport, blending, infrastructures)
Business drivers A few considerations are relevant and should be acknowledged after reviewing the business driver matrix results:
In responding to these sheets, participants from the same country, as well as participants across countries, adopted different perspectives and viewpoints from which the business drivers and market failures were assessed. In some instances, the existing situation in the country was evaluated and the strength of a driver determined based on what the respondent currently perceives. In other cases, the participants viewed the framework rather hypothetically, thereby assessing how strong a driver could be rather than is currently.
The intended rating hierarchy (strong, medium, weak, not a driver, negative driver) was well understood and implemented by the participants; however differences in perspectives again played a role, in particular with the ‘negative driver’ rating. This was applied in some cases to signal that the indicator is in fact a barrier as opposed to a driver, whereas in other cases the meaning of this rating was intended rather as a driver of competing business options. Occasionally as well, the ‘negative driver’ and ‘not a driver’ ratings were used interchangeably thereby carrying a similar meaning in the eye of the respondent.
Respondents’ inputs are primarily based on their deep expertise and knowledge of the national context for H2-CCS chains, but in certain cases the short narrative provided along with the rating indicated that the response was in fact rather an educated guess or an assumption.

Page 120
As a result, care is to be taken when viewing the heat maps in Sections 6-10 without additional context. For a detailed understanding of the respondent’s perspective, the Excel tools should be consulted directly (attached to this report as separate files, see Table A.3 in Appendix A).
Across the case study countries, a number of similarities can be noted with regards to the strength/weakness of current business drivers:
On the H2 infrastructure side stakeholder actions are the strongest drivers of activity in supply chain segments, namely through commitments made or strategic positioning in anticipation of future markets. Market dynamics, in the form of commodity price fluctuations, affect these segments to a certain extent as well. On the other hand, regulations such as carbon pricing are found to be of limited impact in promoting the hydrogen supply/service options listed.
No strong overarching driving force can be identified across all case study countries for CCS infrastructure. In contrast to H2 infrastructure, CSS infrastructure is only mildly driven (if at all in certain cases) by stakeholder actions such as commitments, social preferences or anticipation of future markets. Similarly, commodity price fluctuations, both with respect to fuel use in capture processes and overall supply chain costs, are also rather moderate drivers. With regards to regulations, these are in fact more often identified as barriers to CCS deployment than drivers, although carbon pricing is in certain cases identified as a promoter.
Drivers for activity in end-use markets for H2 are mostly reported for mobility and industrial applications. For these, environmental consciousness of consumers and social preferences are key drivers. Other notable drivers of H2 utilization in certain cases are stakeholder commitments, carbon pricing and regulation.
Given the limited data collected on drivers of end-use markets for CO2, direct conclusions across countries cannot be drawn at this stage.
Market Failures Similar considerations as those described above with respect to the business drivers should be highlighted following the review of market failure matrices. That is, different perspectives and understanding of the ratings are likely to have been applied by respondents and, therefore, precautions should be taken when drawing conclusions from the results.
Overall, significant market failures were identified in all case studies (with the exception of the Netherlands, where no data was reported) demonstrating the complexity of the challenges faced by early stage H2-CCS sectors. At a high level, all countries pointed to missing markets, coordination failure and unpriced negative externality as inhibitors of investment and business activity. However, when analysing closer, the matrices (see Sections 7-10) reveal certain specificities of each country, which highlight aspects to be considered for the development of the business case frameworks.
Netherlands: N/A
Switzerland: On the infrastructure and the end-use side, the country is clearly facing broad and considerable market failures for early-stage H2-CCS chain development.

Page 121
• UK: Most end-use market and infrastructure services are rated with high market failures, with hydrogen infrastructure facing the broadest scope of challenges.
Germany: CO2 infrastructure (i.e. production, transmission/distribution, storage) faces more intense market failures than hydrogen infrastructure. Of note as well is the high disincentive for early-mover risk-taking due to knowledge creation spillover effects.
Norway: The market failure landscape is generally identified as less severe in Norway than in other countries. Nevertheless, market failures in H2 infrastructure remain high.
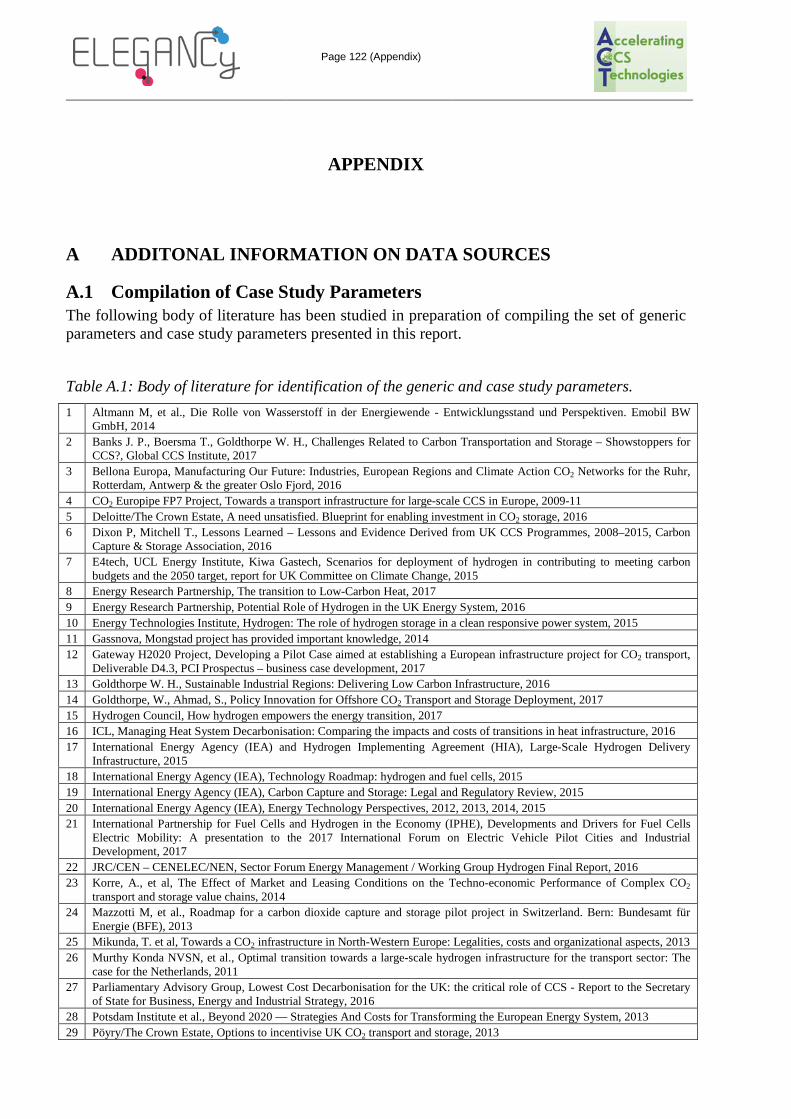
Page 122 (Appendix)
APPENDIX
A ADDITONAL INFORMATION ON DATA SOURCES
A.1 Compilation of Case Study Parameters The following body of literature has been studied in preparation of compiling the set of generic parameters and case study parameters presented in this report.
Table A.1: Body of literature for identification of the generic and case study parameters. 1 Altmann M, et al., Die Rolle von Wasserstoff in der Energiewende - Entwicklungsstand und Perspektiven. Emobil BW
GmbH, 2014 2 Banks J. P., Boersma T., Goldthorpe W. H., Challenges Related to Carbon Transportation and Storage – Showstoppers for
CCS?, Global CCS Institute, 2017 3 Bellona Europa, Manufacturing Our Future: Industries, European Regions and Climate Action CO2 Networks for the Ruhr,
Rotterdam, Antwerp & the greater Oslo Fjord, 2016 4 CO2 Europipe FP7 Project, Towards a transport infrastructure for large-scale CCS in Europe, 2009-11 5 Deloitte/The Crown Estate, A need unsatisfied. Blueprint for enabling investment in CO2 storage, 2016 6 Dixon P, Mitchell T., Lessons Learned – Lessons and Evidence Derived from UK CCS Programmes, 2008–2015, Carbon
Capture & Storage Association, 2016 7 E4tech, UCL Energy Institute, Kiwa Gastech, Scenarios for deployment of hydrogen in contributing to meeting carbon
budgets and the 2050 target, report for UK Committee on Climate Change, 2015 8 Energy Research Partnership, The transition to Low-Carbon Heat, 2017 9 Energy Research Partnership, Potential Role of Hydrogen in the UK Energy System, 2016 10 Energy Technologies Institute, Hydrogen: The role of hydrogen storage in a clean responsive power system, 2015 11 Gassnova, Mongstad project has provided important knowledge, 2014 12 Gateway H2020 Project, Developing a Pilot Case aimed at establishing a European infrastructure project for CO2 transport,
Deliverable D4.3, PCI Prospectus – business case development, 2017 13 Goldthorpe W. H., Sustainable Industrial Regions: Delivering Low Carbon Infrastructure, 2016 14 Goldthorpe, W., Ahmad, S., Policy Innovation for Offshore CO2 Transport and Storage Deployment, 2017 15 Hydrogen Council, How hydrogen empowers the energy transition, 2017 16 ICL, Managing Heat System Decarbonisation: Comparing the impacts and costs of transitions in heat infrastructure, 2016 17 International Energy Agency (IEA) and Hydrogen Implementing Agreement (HIA), Large-Scale Hydrogen Delivery
Infrastructure, 2015 18 International Energy Agency (IEA), Technology Roadmap: hydrogen and fuel cells, 2015 19 International Energy Agency (IEA), Carbon Capture and Storage: Legal and Regulatory Review, 2015 20 International Energy Agency (IEA), Energy Technology Perspectives, 2012, 2013, 2014, 2015 21 International Partnership for Fuel Cells and Hydrogen in the Economy (IPHE), Developments and Drivers for Fuel Cells
Electric Mobility: A presentation to the 2017 International Forum on Electric Vehicle Pilot Cities and Industrial Development, 2017
22 JRC/CEN – CENELEC/NEN, Sector Forum Energy Management / Working Group Hydrogen Final Report, 2016 23 Korre, A., et al, The Effect of Market and Leasing Conditions on the Techno-economic Performance of Complex CO2
transport and storage value chains, 2014 24 Mazzotti M, et al., Roadmap for a carbon dioxide capture and storage pilot project in Switzerland. Bern: Bundesamt für
Energie (BFE), 2013 25 Mikunda, T. et al, Towards a CO2 infrastructure in North-Western Europe: Legalities, costs and organizational aspects, 2013 26 Murthy Konda NVSN, et al., Optimal transition towards a large-scale hydrogen infrastructure for the transport sector: The
case for the Netherlands, 2011 27 Parliamentary Advisory Group, Lowest Cost Decarbonisation for the UK: the critical role of CCS - Report to the Secretary
of State for Business, Energy and Industrial Strategy, 2016 28 Potsdam Institute et al., Beyond 2020 — Strategies And Costs for Transforming the European Energy System, 2013 29 Pöyry/The Crown Estate, Options to incentivise UK CO2 transport and storage, 2013

Page 123 (Appendix)
30 Rotterdam Climate Initiative, Transport & Storage Economics of CCS Networks in the Netherlands, 2013 31 Sadler D, et al., H21 Leeds City Gate report, Northern Gas Networks, 2016 32 Shell, Shell Hydrogen Study – Energy of the Future? Sustainable Mobility through Fuel Cells and H2, 2017 33 Summit Power, Clean Air – Clean Industry – Clean Growth: How carbon capture will boost the UK economy – report by
Caledonia Clean Energy Project, 2017 34 Swiss Federal Office of Energy SFOE. What is the Energy Strategy 2050?, 2016 35 Umwelt Bundesamt, Germany in 2050 – a greenhouse gas-neutral country, 2014 36 Wuppertal Institute, Decarbonisation Pathwaysfor the Industrial Cluster of the Port of Rotterdam – report on behalf of Port
of Rotterdam, 2016 37 Zero Emissions Platform (ZEP), Business Models for commercial CO2 transport and storage, 2014 38 Zero Emissions Platform (ZEP), CCS and Europe’s contribution to the Paris Agreement, 2017 39 Zero Emissions Platform (ZEP), CCU – carbon capture and utilization, 2016 40 Zero Emissions Platform (ZEP), Commercial Scale Feasibility of Clean Hydrogen, 2017 41 Zero Emissions Platform (ZEP), Fast track CO2 Transport and Storage, 2017
A.2 Participants Workshop 1&2 The following institutions were represented at the WP3 workshop held in Oslo on March 9th 2018:
Table A.2: Participating organizations to Workshop 1&2.
Case study country
Consortium partners Funding institution External organisations (in parentheses: # participants, Total: 22)
Germany RUB (2) The Netherlands Norway SINTEF (1)
UiO (1) Gassnova (1) Total E&P Norge AS (2)
Research Council of Norway (2) Aker Solutions (1) ZERO (1) Bellona (1)
Switzerland ETHZ (1) Uni Geneva (1) FC (2)
Sulzer (1)
The UK SDL (2) IEAGHG (1) Other countries CO2-H2 SARL (1)
Air Liquid (1)
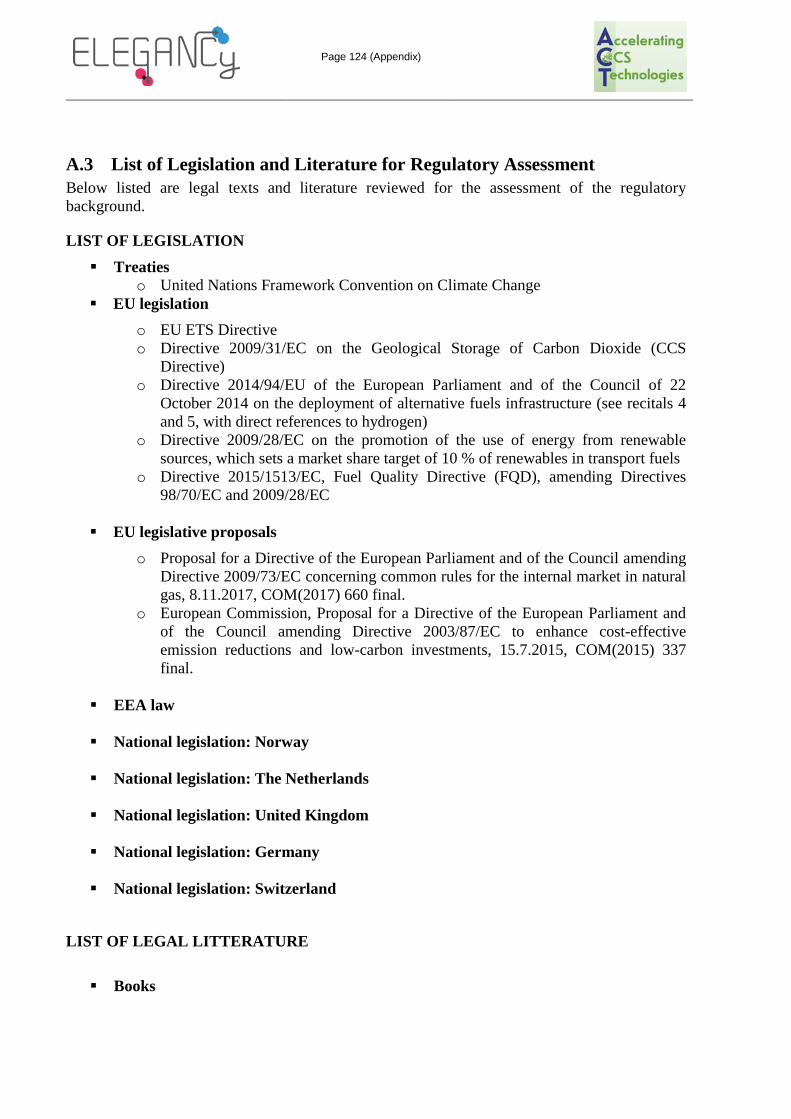
Page 124 (Appendix)
A.3 List of Legislation and Literature for Regulatory Assessment Below listed are legal texts and literature reviewed for the assessment of the regulatory background.
LIST OF LEGISLATION Treaties
o United Nations Framework Convention on Climate Change EU legislation
o EU ETS Directive o Directive 2009/31/EC on the Geological Storage of Carbon Dioxide (CCS
Directive) o Directive 2014/94/EU of the European Parliament and of the Council of 22
October 2014 on the deployment of alternative fuels infrastructure (see recitals 4 and 5, with direct references to hydrogen)
o Directive 2009/28/EC on the promotion of the use of energy from renewable sources, which sets a market share target of 10 % of renewables in transport fuels
o Directive 2015/1513/EC, Fuel Quality Directive (FQD), amending Directives 98/70/EC and 2009/28/EC
EU legislative proposals
o Proposal for a Directive of the European Parliament and of the Council amending Directive 2009/73/EC concerning common rules for the internal market in natural gas, 8.11.2017, COM(2017) 660 final.
o European Commission, Proposal for a Directive of the European Parliament and of the Council amending Directive 2003/87/EC to enhance cost-effective emission reductions and low-carbon investments, 15.7.2015, COM(2015) 337 final.
EEA law
National legislation: Norway
National legislation: The Netherlands
National legislation: United Kingdom
National legislation: Germany
National legislation: Switzerland
LIST OF LEGAL LITTERATURE Books

Page 125 (Appendix)
o Havercroft, R. Macrory and R. Stewart (eds.), Carbon Capture and Storage – Emerging Legal and Regulatory Issues (Hart, 2018), 2nd edition.
o M.M. Roggenkamp (eds.), Legal Design of Carbon Capture and Storage (Intersentia, 2009).
Articles
Policy documents
o European Commission, Report from the Commission to the European Parliament and the
Council on Implementation of Directive 2009/31/EC on the Geological Storage of Carbon Dioxide, 1.2.2017, COM(2017) 37 final;
Report from the Commission to the European Parliament and the Council on the Implementation of Directive 2009/31/EC on the geological storage of carbon dioxide, COM(2014)99
Reports
o Intergovernmental Panel on Climate Change (IPCC):
IPCC, 2014: Climate Change 2014: Mitigation of Climate Change. Contribution of Working Group III to the Fifth Assessment Report of the Intergovernmental Panel on Climate Change [Edenhofer, O., R. Pichs-Madruga, Y. Sokona, E. Farahani, S. Kadner, K. Seyboth, A. Adler, I. Baum, S. Brunner, P. Eickemeier, B. Kriemann, J. Savolainen, S. Schlömer, C. von Stechow, T. Zwickel and J.C. Minx (eds.)]. Cambridge University Press, Cambridge, United Kingdom and New York, NY, USA
IPCC 2006 Guidelines for National GHG inventories includes CO2 transport, injection and geological storage [IPCC, 2006].
IPCC Special Report on Carbon Dioxide Capture and Storage, 2005 https://www.ipcc.ch/pdf/special-reports/srccs/srccs_wholereport.pdf
o European Parliament, - Committee on Industry, Research and Energy (ITRE), Report on
Towards a New Energy Market Design, 2015/2322(INI), Rapporteur Wener Langen, 21 June 2016

Page 126 (Appendix)
A.4 Data Gathering Tools The original tools used in this work to assess the market background and market failures are accompanying this report as separate files, as per the following Table.
Table A.3: Accompanying files to this report.
File Filetype Filename Market Background Assessment Tool
MS Excel Market Background Assessment Tool_20180427_out.xlsx
Market Failures Assessment Tool
MS Excel Market Failures Tool v2.1.xlsx
A.5 Respondents to Tools As per April 2018, input to the market background and market failures tool has been collected from representatives of the following organisations.
Table A.4: Responding organization to background assessment.
Case study country ELGANCY consortium partners External organisations Germany RUB
Uniper
The Netherlands TNO Utrecht University
Norway SINTEF Switzerland PSI
ETHZ Climeworks FC
Sulzer
The UK SDL IEAGHG
More replies are expected to be provided over the course of the ELEGANCY project. Over time, partners will further familiarize with their case study scope and the contacts to external organisations will be deepened. When approaching stakeholders for inputs to the upcoming work by WP3, we will seize to opportunity to let the respondents challenge the current state of data gathering (consolidated tables as presented in this report).

Page 127 (Appendix)
B COUNTRY CONTEXT DATA SHEETS
B.1 The Netherlands
N° Indicator UnitQuantitative Response(i.e. specific values or estimates where available)
Qualitative Response(i.e. sources, reference year, description, and where relevant a clarification of quantitative response)
Module V.1: Macroeconomic and fiscal contextFor the country under investigation and for the currently prevailing situation, compile the following context information:V.1.1 Population # 17'081'507 In 2017 [Source: Statistics Netherlands (2018).
Website.]V.1.2 National population growth rate %/y 6.0 In 2017 [Source: Statistics Netherlands (2018).
Website.]V.1.3 Gross domestic product (GDP) EUR or USD 777'300'000'000 USD, in 2016 [Source: World Bank (2018). Website.]V.1.4 GDP per capita (at purchasing power parity, PPP) EUR or USD 50'538 In 2016 [Source: World Bank (2018). Website.]V.1.5 Sovereign rating Rating agencies'
scalesAAA S&P, Fitch, Moody's [Source: Trading Economics (2018).
Netherlands - Credit Rating. Website.]
V.1.6 National inflation rate (Consumer Price Index, CPI) % 1.0 March 2018 [Source: OECD (2018). Website.]V.1.7 Unemployment rate % 4.5 In Q4 2017 [Source: OECD (2018. Website.]V.1.8 Corporate income tax rate % 25 [Source: Deloitte (2018). Corporate Tax Rates 2018.
Deloitte Touche Tomahatsu Limited]V.1.9 Local tax rates (sales tax, VAT, other consumption taxation) % 21% (general VAT tariff), 6%
(low VAT tariff)[Source: Netherlands Tax and Customs Administration (2018). Website.]
V.1.10 Carbon tax(es) EUR/tCO2
Module V.2: Climate policy contextFor the country under investigation and for the currently prevailing situation, compile the following context information:
tCO2/yCO2 only: 167'000'000 In 2016 [Source: Statistics Netherlands (2017),
Greenhouse gas emissions slightly up in 2016. Website.]
tCO2e/yall GHGs: 197'000'000 In 2016 [Source: Statistics Netherlands (2017),
Greenhouse gas emissions slightly up in 2016. Website.]
Transport (all means):Road transport:Industrial:Power&heat:Commercial/residential:Other:>Energy: 78%> Industrial processes and product use: ~7%> Agriculture: ~13%> Waste: ~2%
In 2015 [Source: National Institute for Public Health and the Environment (2017). GHG Emissions in the Netherlands 1990-2015, National Inventory Report 2017 . Figure 2.6. Bilthoven, Netherlands: National Institute for Public Health and the Environment]
V.2.3 Electricity grid emission factor tCO2e/MWh 0.42 In 2018 [Source: Energy Transition Center at University of Applied Sciences Groningen (2018). Renewable Energy in The NetherlandsJanuary 2018, Website.]
V.2.4 Carbon price other than simple carbon tax (Cf. I.1.11) EUR/tCO2 EU ETS: 13 EUR/tCO2 (April 2018)
Plan to introduce a CO2 tax on electricity starting at 18 EUR/t in 2020 [Source: Aequilibria (2017. The Netherlands launches the Carbon Tax. Website.]
V.2.5 Is the use of H2 technologies mentioned in the Nationally Determined Contribution (NDC) submitted to UNFCCC in the context of the Paris Agreement, or in other official national climate policy plans/strategies? If yes, please describe the extent to which H2 technologies are considered in the NDC/policy plans.
-
yes
V.2.6 Is the use of CCS technologies mentioned in the Nationally Determined Contribution (NDC) submitted to UNFCCC in the context of the Paris Agreement, or in other official national climate policy plans/strategies? If yes, please describe the extent to which CCS technologies are considered in the NDC/policy plans.
-
yes
The EU NDC covers CO2 transport and storage.
%Total annual GHG emissions per sectorV.2.2
V.2.1 Total annual GHG emissions

Page 128 (Appendix)
Module V.3: Market context for relevant energy carriersFor the country under investigation and for the currently prevailing situation, compile the following context information:Electricity marketV.3.1 Electricity market structure: Provide information about major
actors/ownership, public sector involvement, bundling of production/transmission/distribution, competition framework, third party access and other relevant market governance.
- Public sector- TSO: TENNET, DSO: STEDIN, ALIANDER, ESSENT
Domestic production: 114.7 Provisional figure for 2016 [Source: Statistics Netherlands (2018). Electricity Balance Sheet; supply and consumption. Website.]
Imports: 24.3 Provisional figure for 2016 [Source: Statistics Netherlands, (2018). Electricity Balance Sheet; supply and consumption. Website.]
Exports: 19.3 Provisional figure for 2016 [Source: Statistics Netherlands, (2018). Electricity Balance Sheet; supply and consumption. Website.]
Coal/peat: 35% In 2016 [Source: IEA (2018). Netherlands - Energy System Overview. Website.]
Oil: 1% In 2016 [Source: IEA (2018). Netherlands - Energy System Overview. Website.]
Natural gas: 46% In 2016 [Source: IEA (2018). Netherlands - Energy System Overview. Website.]
Nuclear: 3% In 2016 [Source: IEA (2018). Netherlands - Energy System Overview. Website.]
Hydro:Biofuels/waste: 6% In 2016 [Source: IEA (2018). Netherlands - Energy
System Overview. Website.]Wind/solar/geothermal: 9% In 2016 [Source: IEA (2018). Netherlands - Energy
System Overview. Website.]V.3.4 Storage: Is it possible to seasonally store electricity? If yes,
please describe the storage technologies/installations involved.-
no
V.3.5Demand: Total annual electricity consumption TWh/y 119.6 Gross consumption in 2016 (provisional figure) [Source:
Statistics Netherlands (2018), Electricity Balance Sheet; supply and consumption. Website.]
Transport (all means):Industrial:Residential:Commercial:Other:
V.3.7 Price level wholesales: Yearly average spot market price for electricity
EUR/MWh 44.8 Wholesale electricity baseload price in Q4 2017 [Source: European Commission (2018). Quarterly Report on European Electricity Markets, Q4 2017 . Brussels, Belgium: EU Commission]
V.3.8 Price level retail: Yearly average retail price for electricity EUR/MWh 158 Electricity price for household consumers in Q4 2017 [Source: European Commission (2018). Quarterly Report on European Electricity Markets, Q4 2017 . Brussels, Belgium: EU Commission]
V.3.9 Subsidies/market facilitation/support mechanisms for renewable electricity production
-
Production: Share of domestic electricity production by technology
V.3.3
V.3.2 Production: Total annual electricity domestic production, imports, exports
TWh/y
%
V.3.6 Demand: Share of annual electricity consumption by sector %
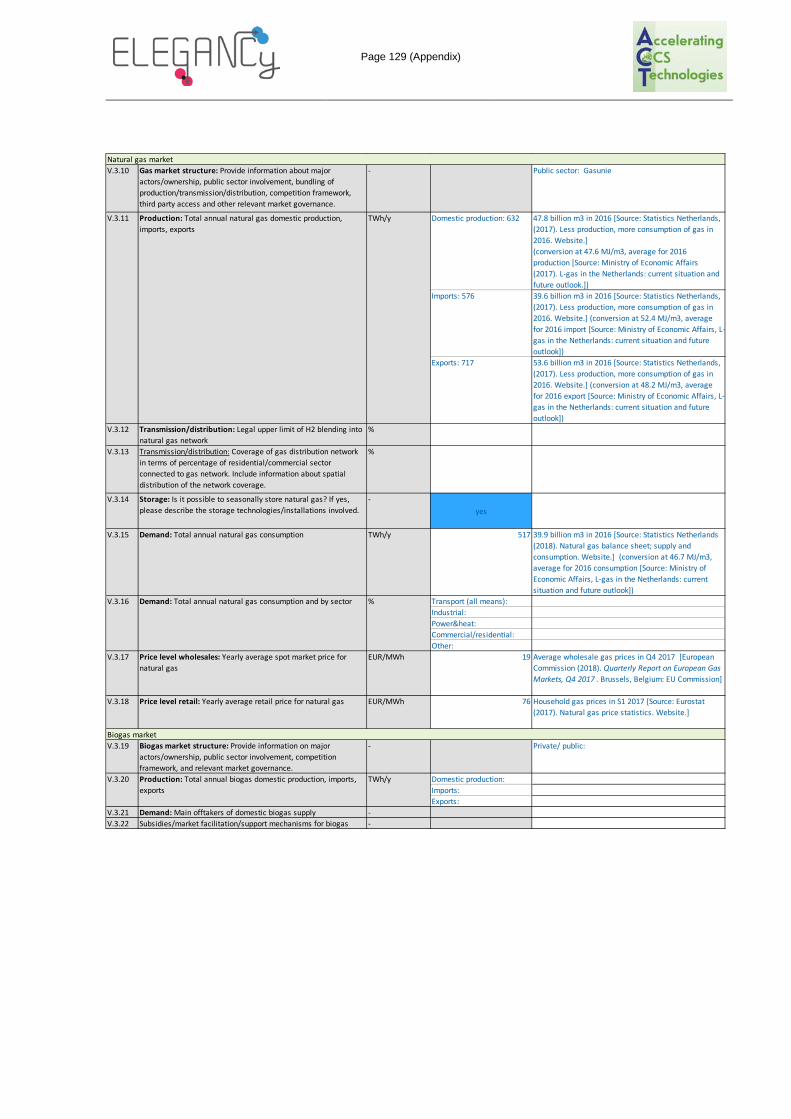
Page 129 (Appendix)
Natural gas marketV.3.10 Gas market structure: Provide information about major
actors/ownership, public sector involvement, bundling of production/transmission/distribution, competition framework, third party access and other relevant market governance.
- Public sector: Gasunie
Domestic production: 632 47.8 billion m3 in 2016 [Source: Statistics Netherlands, (2017). Less production, more consumption of gas in 2016. Website.](conversion at 47.6 MJ/m3, average for 2016 production [Source: Ministry of Economic Affairs (2017). L-gas in the Netherlands: current situation and future outlook.])
Imports: 576 39.6 billion m3 in 2016 [Source: Statistics Netherlands, (2017). Less production, more consumption of gas in 2016. Website.] (conversion at 52.4 MJ/m3, average for 2016 import [Source: Ministry of Economic Affairs, L-gas in the Netherlands: current situation and future outlook])
Exports: 717 53.6 billion m3 in 2016 [Source: Statistics Netherlands, (2017). Less production, more consumption of gas in 2016. Website.] (conversion at 48.2 MJ/m3, average for 2016 export [Source: Ministry of Economic Affairs, L-gas in the Netherlands: current situation and future outlook])
V.3.12 Transmission/distribution: Legal upper limit of H2 blending into natural gas network
%
V.3.13 Transmission/distribution: Coverage of gas distribution network in terms of percentage of residential/commercial sector connected to gas network. Include information about spatial distribution of the network coverage.
%
V.3.14 Storage: Is it possible to seasonally store natural gas? If yes, please describe the storage technologies/installations involved.
-yes
V.3.15 Demand: Total annual natural gas consumption TWh/y 517 39.9 billion m3 in 2016 [Source: Statistics Netherlands (2018). Natural gas balance sheet; supply and consumption. Website.] (conversion at 46.7 MJ/m3, average for 2016 consumption [Source: Ministry of Economic Affairs, L-gas in the Netherlands: current situation and future outlook])
Transport (all means):Industrial:Power&heat:Commercial/residential:Other:
V.3.17 Price level wholesales: Yearly average spot market price for natural gas
EUR/MWh 19 Average wholesale gas prices in Q4 2017 [European Commission (2018). Quarterly Report on European Gas Markets, Q4 2017 . Brussels, Belgium: EU Commission]
V.3.18 Price level retail: Yearly average retail price for natural gas EUR/MWh 76 Household gas prices in S1 2017 [Source: Eurostat (2017). Natural gas price statistics. Website.]
Biogas marketV.3.19 Biogas market structure: Provide information on major
actors/ownership, public sector involvement, competition framework, and relevant market governance.
- Private/ public:
Domestic production:Imports:Exports:
V.3.21 Demand: Main offtakers of domestic biogas supply -V.3.22 Subsidies/market facilitation/support mechanisms for biogas -
V.3.20 Production: Total annual biogas domestic production, imports, exports
TWh/y
%
V.3.11 Production: Total annual natural gas domestic production, imports, exports
TWh/y
Demand: Total annual natural gas consumption and by sectorV.3.16

Page 130 (Appendix)
B.2 Switzerland
N° Indicator UnitQuantitative Response(i.e. specific values or estimates where available)
Qualitative Response(i.e. sources, reference year, description, and where relevant a clarification of quantitative response)
Module V.1: Macroeconomic and fiscal contextFor the country under investigation and for the currently prevailing situation, compile the following context information:V.1.1 Population # 8'419'550 In 2016 [Source: Swiss Federal Statistical Office (2017).
Switzerland's population 2016 . Neuchâtel, Switzerland: Federal Statistical Office.]
V.1.2 National population growth rate %/y 1.1 In 2016 [Source: Swiss Federal Statistical Office (2017). Switzerland's population 2016 . Neuchâtel, Switzerland: Federal Statistical Office.]
V.1.3 Gross domestic product (GDP) EUR or USD 690'000'000'000 Swiss Federal Statistical Office, 2016 (converted from CHF with today's exchange rate, 21.03.2018) [Source: Swiss Federal Statistical Office (2018). National economy. Website.]
V.1.4 GDP per capita (at purchasing power parity, PPP) EUR or USD 82'600 Swiss Federal Statistical Office, 2016 (converted from CHF with today's exchange rate, 21.03.2018) [Source: Swiss Federal Statistical Office (2018). National economy. Website.]
V.1.5 Sovereign rating Rating agencies' scales
AAA Fitch, S&P, Moody's
V.1.6 National inflation rate (Consumer Price Index, CPI) % 0.63 February 2018 [Source: OECD (2018). Inflation (CPI). Website.]
V.1.7 Unemployment rate % 0.46 In 2016 [Source: Swiss Federal Statistical Office (2017). Indicateurs du marché du travail 2017 . Neuchâtel, Switzerland: Federal Statistical Office]
V.1.8 Corporate income tax rate % 12 - 24% Fixed federal income tax at 8.5%, then variable cantonal income tax [Source: Deloitte (2018). Corporate Tax Rates 2018 . Deloitte Touche Tomahatsu Limited]
V.1.9 Local tax rates (sales tax, VAT, other consumption taxation) % 7.7 VAT. A special and reduced rate apply for overnight stays in hotels (3.7%) and for everyday consumer goods such as food, medicine, etc. (2.5%)
V.1.10 Carbon tax(es) EUR/tCO2 82 A tax of 96 CHF/tCO2 is applied on heating and process fuels.

Page 131 (Appendix)
Module V.2: Climate policy contextFor the country under investigation and for the currently prevailing situation, compile the following context information:
tCO2/y
CO2 only: 38'850'000 In 2015 [Source: Federal Office for the Environment (2017). Émissions de gaz à effet de serre visées par la loi sur le CO2 révisée et par le Protocole de Kyoto, 2e période d’engagement (2013–2020) . Bern, Switzerland: Federal Office of the Environment]
tCO2e/y
all GHGs: 48'140'000 In 2015 [Source: Federal Office for the Environment (2017). Émissions de gaz à effet de serre visées par la loi sur le CO2 révisée et par le Protocole de Kyoto, 2e période d’engagement (2013–2020) . Bern, Switzerland: Federal Office of the Environment]
Transport (all means):Road transport: 32.1
In 2015 [Source: Federal Office for the Environment (2017). Émissions de gaz à effet de serre visées par la loi sur le CO2 révisée et par le Protocole de Kyoto, 2e période d’engagement (2013–2020) . Bern, Switzerland: Federal Office of the Environment]
Industrial: 20.3 In 2015 [Source: Federal Office for the Environment (2017). Émissions de gaz à effet de serre visées par la loi sur le CO2 révisée et par le Protocole de Kyoto, 2e période d’engagement (2013–2020) . Bern, Switzerland: Federal Office of the Environment]
Power&heat:Commercial/residential:Other:
V.2.3 Electricity grid emission factor tCO2e/MWh 0.0298 Swiss production mix, 2014 [Source: Federal Office for the Environment (2018). Projets et programmes de réduction des émissions réalisés en Suisse . Berne, Switzerland: Federal Office for the Environment]
V.2.4 Carbon price other than simple carbon tax (Cf. I.1.11) EUR/tCO2 An emission trading scheme effectively imposes a price on carbon for large emitters in Switzerland (approx. 6.8 EUR/tCO2 as of 21.03.2018). Also, importers of motor fuels must compensate a share (10%) of the emissions associated with the consumption of these fuels in Switzerland (effectively at a cost of ~100 EUR/tCO2).
Regarding price of CO2 as a commodity, this varies significantly, depending on location, season and amount delivered. Since CO2 today is usually a waste product from ammonia production (80% of liquid CO2 in EU is produced by the chemical industry) the final CO2 price usually depends on the transportation distance. In CH the average price is roughly 150-250 CHF/tCO2, but can go up to 600 CHF/t if less than 100 t/y are purchased in more remote locations. In EU the prices are generally lower, average 60 - 120 EUR/tCO2. Globally the average price is roughly 100 $/t developing countries and other remote locations (islands) generally see very high CO2 prices up to 800 - 1'000 $/t. These are rough estimates.
V.2.5 Is the use of H2 technologies mentioned in the Nationally Determined Contribution (NDC) submitted to UNFCCC in the context of the Paris Agreement, or in other official national climate policy plans/strategies? If yes, please describe the extent to which H2 technologies are considered in the NDC/policy plans.
-
no
V.2.6 Is the use of CCS technologies mentioned in the Nationally Determined Contribution (NDC) submitted to UNFCCC in the context of the Paris Agreement, or in other official national climate policy plans/strategies? If yes, please describe the extent to which CCS technologies are considered in the NDC/policy plans.
-
no
%Total annual GHG emissions per sectorV.2.2
V.2.1 Total annual GHG emissions

Page 132 (Appendix)
Module V.3: Market context for relevant energy carriersFor the country under investigation and for the currently prevailing situation, compile the following context information:Electricity marketV.3.1 Electricity market structure: Provide information about major
actors/ownership, public sector involvement, bundling of production/transmission/distribution, competition framework, third party access and other relevant market governance.
- Highly regulated electricity market
Domestic production: 61.6 In 2016, total gross production [Source: Swiss Federal Office of Energy (2018). Gesamte Erzeugung und Abgabe elektrischer Energie in der Schweiz. Website.]
Imports: 34.1 In 2016, total gross production [Source: Swiss Federal Office of Energy (2018). Gesamte Erzeugung und Abgabe elektrischer Energie in der Schweiz. Website.]
Exports: 30.2 In 2016, total gross production [Source: Swiss Federal Office of Energy (2018). Gesamte Erzeugung und Abgabe elektrischer Energie in der Schweiz. Website.]
Coal/peat:Oil:Natural gas:Nuclear: 32.8 In 2016 [Source: Swiss Federal Office of Energy (2018).
Gesamte Erzeugung und Abgabe elektrischer Energie in der Schweiz. Website.]
Hydro: 59.0 In 2016 [Source: Swiss Federal Office of Energy (2018). Gesamte Erzeugung und Abgabe elektrischer Energie in der Schweiz. Website.]
Biofuels/waste: 1.9 In 2016 [Source: Swiss Federal Office for Energy (2017). Statistique globale suisse de l’énergie 2016 . Ittigen, Bern: Swiss Federal Office for Energy]
Wind/solar/geothermal: 3.2 Renewables, including biogas. [Source: Swiss Federal Office for Energy (2017). Statistique globale suisse de l’énergie 2016 . Ittigen, Bern: Swiss Federal Office for Energy]
V.3.4 Storage: Is it possible to seasonally store electricity? If yes, please describe the storage technologies/installations involved.
-yes
Pumped hydropower; however, these plants are currently not mainly operated for seasonal storage
V.3.5
Demand: Total annual electricity consumption TWh/y 58.2 In 2016, including transmission and distribution losses [Source: Swiss Federal Office for Energy (2017). Statistique globale suisse de l’énergie 2016 . Ittigen, Bern: Swiss Federal Office for Energy]
Transport (all means): 8.2% In 2016 [Source: Swiss Federal Office of Energy (2017). Aperçu de la consommation d'énergie en suisse au cours de l'année 2016. Ittigen, Switzerland: Swiss Federal Office of Energy]
Industrial: 30.5% In 2016 [Source: Swiss Federal Office of Energy (2017). Aperçu de la consommation d'énergie en suisse au cours de l'année 2016. Ittigen, Switzerland: Swiss Federal Office of Energy]
Residential: 32.8% In 2016 [Source: Swiss Federal Office of Energy (2017). Aperçu de la consommation d'énergie en suisse au cours de l'année 2016. Ittigen, Switzerland: Swiss Federal Office of Energy]
Commercial: 26.8% In 2016 [Source: Swiss Federal Office of Energy (2017). Aperçu de la consommation d'énergie en suisse au cours de l'année 2016. Ittigen, Switzerland: Swiss Federal Office of Energy]
Other: 1.7% Agriculture, in 2016 [Source: Swiss Federal Office of Energy (2017). Aperçu de la consommation d'énergie en suisse au cours de l'année 2016. Ittigen, Switzerland: Swiss Federal Office of Energy]
V.3.7 Price level wholesales: Yearly average spot market price for electricity
EUR/MWh
V.3.8 Price level retail: Yearly average retail price for electricity EUR/MWh 174 204 CHF/MWh expected for retail rates for 2018 [Source: Swiss Federal Council (2017). Légère augmentation des prix de l’électricité 2018 pour les ménages. Website.]
V.3.9 Subsidies/market facilitation/support mechanisms for renewable electricity production
- Federal and, in some cases, cantonal feed-in tariffs available.
Production: Share of domestic electricity production by technology
V.3.3 5% for thermal power plants [Source: Swiss Federal Office of Energy (2018). Gesamte Erzeugung und Abgabe elektrischer Energie in der Schweiz. Website.]
V.3.2 Production: Total annual electricity domestic production, imports, exports
TWh/y
%
V.3.6 Demand: Share of annual electricity consumption by sector %

Page 133 (Appendix)
Natural gas marketV.3.10 Gas market structure: Provide information about major
actors/ownership, public sector involvement, bundling of production/transmission/distribution, competition framework, third party access and other relevant market governance.
- 75% Swissgas ag, 25% Gasverbund Mittelland AG, Erdgas OstschweizAG and Gaznat SA. Infrastructure government-owned. 100 gas utilities.
Domestic production: 0 In 2016 [Source: Swiss Federal Office for Energy (2017). Statistique globale suisse de l’énergie 2016 . Ittigen, Bern: Swiss Federal Office for Energy]
Imports: 34.8 In 2016 [Source: Swiss Federal Office for Energy (2017). Statistique globale suisse de l’énergie 2016 . Ittigen, Bern: Swiss Federal Office for Energy]
Exports: 0 In 2016 [Source: Swiss Federal Office for Energy (2017). Statistique globale suisse de l’énergie 2016 . Ittigen, Bern: Swiss Federal Office for Energy]
V.3.12 Transmission/distribution: Legal upper limit of H2 blending into natural gas network
% 4%
V.3.13 Transmission/distribution: Coverage of gas distribution network in terms of percentage of residential/commercial sector connected to gas network. Include information about spatial distribution of the network coverage.
%
V.3.14 Storage: Is it possible to seasonally store natural gas? If yes, please describe the storage technologies/installations involved.
-no
Switzerland has agreement to share gas storage in France
V.3.15 Demand: Total annual natural gas consumption TWh/y 32.6 In 2016 [Source: Swiss Federal Office for Energy (2017). Statistique globale suisse de l’énergie 2016 . Ittigen, Bern: Swiss Federal Office for Energy]
Transport (all means):Industrial:Power&heat:Commercial/residential:Other:
V.3.17 Price level wholesales: Yearly average spot market price for natural gas
EUR/MWh ~50 ~58 CHF/MWh [Source: Eidgenössisches Departement für Wirtschaft, Bildung und Forschung WBF (2018). Presüberwachung. Website.]
V.3.18 Price level retail: Yearly average retail price for natural gas EUR/MWh ~72 ~85 CHF/MWh [Source: Eidgenössisches Departement für Wirtschaft, Bildung und Forschung WBF (2018). Presüberwachung. Website.]
Biogas marketV.3.19 Biogas market structure: Provide information on major
actors/ownership, public sector involvement, competition framework, and relevant market governance.
-
Domestic production: 0.3 2016 [Source: Verband der Schweizerischen Gasindustrie (2017). Erdgas/Biogas in der Schweiz. Zurich, Switzerland: Verband der Schweizerischen Gasindustrie]
Imports: 0.3 2016 [Source: Verband der Schweizerischen Gasindustrie (2017). Erdgas/Biogas in der Schweiz. Zurich, Switzerland: Verband der Schweizerischen Gasindustrie]
Exports:V.3.21 Demand: Main offtakers of domestic biogas supply - For heating purposes and as transport fuel [Source:
Verband der Schweizerischen Gasindustrie (2017). Erdgas/Biogas in der Schweiz. Zurich, Switzerland: Verband der Schweizerischen Gasindustrie]
V.3.22 Subsidies/market facilitation/support mechanisms for biogas -
V.3.20 Production: Total annual biogas domestic production, imports, exports
TWh/y
%
V.3.11 Production: Total annual natural gas domestic production, imports, exports
TWh/y
Demand: Total annual natural gas consumption and by sectorV.3.16

Page 134 (Appendix)
B.3 The United Kingdom
N° Indicator UnitQuantitative Response(i.e. specific values or estimates where available)
Qualitative Response(i.e. sources, reference year, description, and where relevant a clarification of quantitative response)
Module V.1: Macroeconomic and fiscal contextFor the country under investigation and for the currently prevailing situation, compile the following context information:V.1.1 Population # 65'648'100 Mid-year estimate 2016 [Source: Office for National
Statistics (2017). Population estimates. Website.]V.1.2 National population growth rate %/y 0.8 2014 to 2015 [Source: The Guardian (2017). UK
population shows sharpest rise in almost 70 years. Website.]
V.1.3 Gross domestic product (GDP) EUR or USD 2'980'000'000'000 USD, in 2018 [Source: IMF (2017). Website.]V.1.4 GDP per capita (at purchasing power parity, PPP) EUR or USD 44'822 USD, in 2018 [Source: IMF (2017). Website.]V.1.5 Sovereign rating Rating agencies'
scalesAA (S&P, Fitch)Aa2 (Moody's)
[Source: Trading Economics (2018). Website.]
V.1.6 National inflation rate (Consumer Price Index, CPI) % 2.5 February 2018 [Source: Office for National Statistics (2018). Consumer price inflation, UK: March 2018. Website.]
V.1.7 Unemployment rate % 4.2 In 2017 [Source: Office for National Statistics (2018). Unemployment. Website. ]
V.1.8 Corporate income tax rate % 19 [Source: Deloitte (2018). Corporate Tax Rates 2018 . Deloitte Touche Tomahatsu Limited]
V.1.9 Local tax rates (sales tax, VAT, other consumption taxation) % Standard VAT: 20% (reduced VAT rate: 5%)
[Source: UK Gov (2018). Website]
V.1.10 Carbon tax(es) EUR/tCO2 21 Carbon price floor [Source: House of Commons Library (2018), Carbon Price Floor (CPF) and the price support mechanism. Website]
Module V.2: Climate policy contextFor the country under investigation and for the currently prevailing situation, compile the following context information:
tCO2/y CO2 only: 378.9 million In 2016 [Source: UK GOV (2018). 2016 UK greenhouse gas emissions: final figures - data tables. Website.]
tCO2e/y all GHGs: 467.9 In 2016 [Source: UK GOV (2018). 2016 UK greenhouse gas emissions: final figures - data tables. Website.]
Transport (all means): 26.9Road transport: 24.4
In 2016 [Source: UK GOV (2018). 2016 UK greenhouse gas emissions: final figures - data tables, Table 3. Website.]
Industrial: 10.5 In 2016 [Source: UK GOV (2018). 2016 UK greenhouse gas emissions: final figures - data tables, Table 3. Website.]
Power&heat: 17.5 Power stations, in 2016 Source: UK GOV (2018). 2016 UK greenhouse gas emissions: final figures - data tables, Table 3. Website.]
Commercial/residential: 32.4
In 2016 [Source: UK GOV (2018). 2016 UK greenhouse gas emissions: final figures - data tables, Table 3. Website.]
Other: 16.7 Agriculture, waste, LULUCF, in 2016 [Source: UK GOV (2018). 2016 UK greenhouse gas emissions: final figures - data tables, Table 3. Website.]
V.2.3 Electricity grid emission factor tCO2e/MWh 0.35 In 2017 [Source: UK GOV (2017). Conversion factors 2017 - Full set (for advanced users). Website.]
V.2.4 Carbon price other than simple carbon tax (Cf. I.1.11) EUR/tCO2 13 EU ETS in April 2018
V.2.5 Is the use of H2 technologies mentioned in the Nationally Determined Contribution (NDC) submitted to UNFCCC in the context of the Paris Agreement, or in other official national climate policy plans/strategies? If yes, please describe the extent to which H2 technologies are considered in the NDC/policy plans.
-
no
V.2.6 Is the use of CCS technologies mentioned in the Nationally Determined Contribution (NDC) submitted to UNFCCC in the context of the Paris Agreement, or in other official national climate policy plans/strategies? If yes, please describe the extent to which CCS technologies are considered in the NDC/policy plans.
-
no
%Total annual GHG emissions per sectorV.2.2
V.2.1 Total annual GHG emissions

Page 135 (Appendix)
Module V.3: Market context for relevant energy carriersFor the country under investigation and for the currently prevailing situation, compile the following context information:Electricity marketV.3.1 Electricity market structure: Provide information about major
actors/ownership, public sector involvement, bundling of production/transmission/distribution, competition framework, third party access and other relevant market governance.
-
Domestic production: 336.4 In 2016, not including pumped storage production [Source: UK GOV (2017), Digest of UK Energy Statistics (DUKES): electricity, Chapter 5.1. Website.]
Imports: 19.7 In 2016 [Source: UK GOV (2017), Digest of UK Energy Statistics (DUKES): electricity, Chapter 5.1. Website.]
Exports: 2.2 In 2016 [Source: UK GOV (2017), Digest of UK Energy Statistics (DUKES): electricity, Chapter 5.1. Website.]
Coal/peat: 9.1 In 2016 [Source: UK GOV (2017), Digest of UK Energy Statistics (DUKES): electricity, Chapter 5.1. Website.]
Oil: 0.5 In 2016 [Source: UK GOV (2017), Digest of UK Energy Statistics (DUKES): electricity, Chapter 5.1. Website.]
Natural gas: 42.6 In 2016 [Source: UK GOV (2017), Digest of UK Energy Statistics (DUKES): electricity, Chapter 5.1. Website.]
Nuclear: 21.3 In 2016 [Source: UK GOV (2017), Digest of UK Energy Statistics (DUKES): electricity, Chapter 5.1. Website.]
Hydro: 1.6 In 2016 [Source: UK GOV (2017), Digest of UK Energy Statistics (DUKES): electricity, Chapter 5.1. Website.]
Biofuels/waste:Wind/solar/geothermal: 14.2
In 2016 [Source: UK GOV (2017), Digest of UK Energy Statistics (DUKES): electricity, Chapter 5.1. Website.]
V.3.4 Storage: Is it possible to seasonally store electricity? If yes, please describe the storage technologies/installations involved.
-yes
Pumped hydro
V.3.5 Demand: Total annual electricity consumption TWh/y 303.8 In 2016 [Source: UK GOV (2017), Digest of UK Energy Statistics (DUKES): electricity, Chapter 5.1. Website.]
Transport (all means): 1.5 In 2016 [Source: UK GOV (2017), Digest of UK Energy Statistics (DUKES): electricity, Chapter 5.1. Website.]
Industrial: 30.2 In 2016 [Source: UK GOV (2017), Digest of UK Energy Statistics (DUKES): electricity, Chapter 5.1. Website.]
Residential: 35.5 In 2016 [Source: UK GOV (2017), Digest of UK Energy Statistics (DUKES): electricity, Chapter 5.1. Website.]
Commercial: 24.7 In 2016 [Source: UK GOV (2017), Digest of UK Energy Statistics (DUKES): electricity, Chapter 5.1. Website.]
Other: 8.1 Agriculture, public sector, miscellaneous, in 2016 [Source: UK GOV (2017), Digest of UK Energy Statistics (DUKES): electricity, Chapter 5.1. Website.]
V.3.7 Price level wholesales: Yearly average spot market price for electricity
EUR/MWh 57 Wholesale electricity baseload price in Q4 2017 [Source: European Commission (2018). Quarterly Report on European Electricity Markets, Q4 2017 . Brussels, Belgium: EU Commission]
V.3.8 Price level retail: Yearly average retail price for electricity EUR/MWh 197 Electricity price for household consumers in Q4 2017 [Source: European Commission (2018). Quarterly Report on European Electricity Markets, Q4 2017. Brussels, Belgium: EU Commission]
V.3.9 Subsidies/market facilitation/support mechanisms for renewable electricity production
-
Production: Share of domestic electricity production by technology
V.3.3
V.3.2 Production: Total annual electricity domestic production, imports, exports
TWh/y
%
V.3.6 Demand: Share of annual electricity consumption by sector %
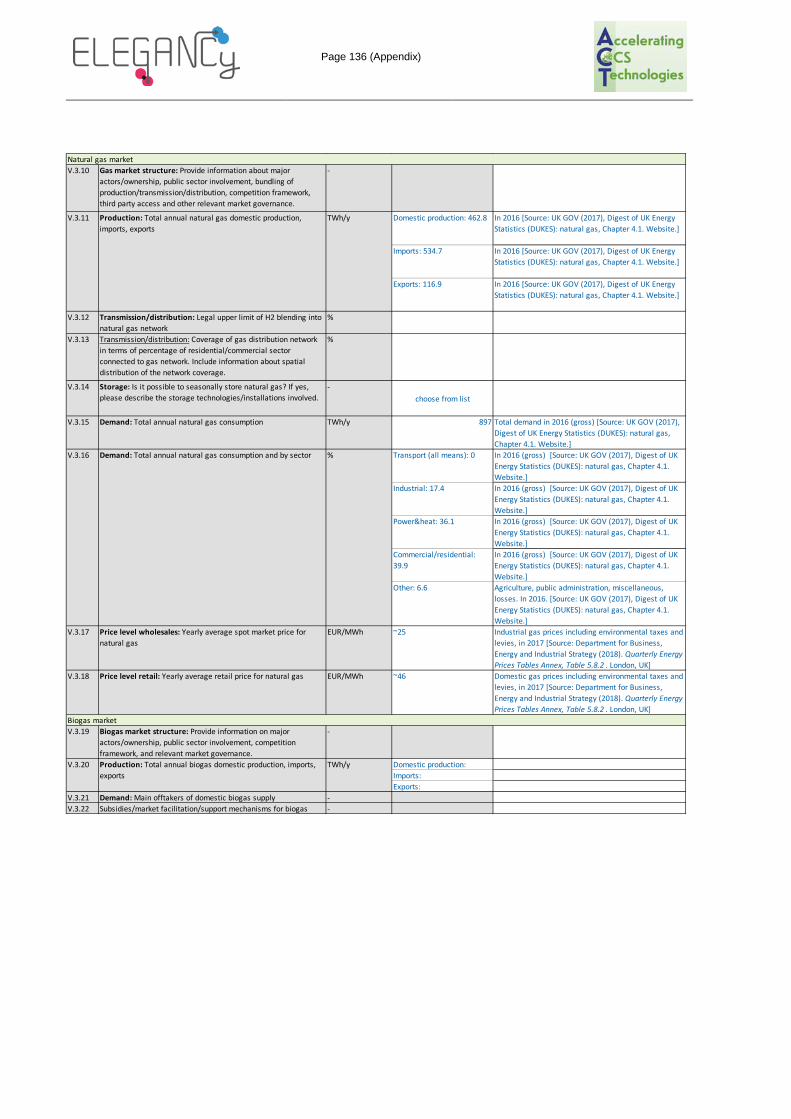
Page 136 (Appendix)
Natural gas marketV.3.10 Gas market structure: Provide information about major
actors/ownership, public sector involvement, bundling of production/transmission/distribution, competition framework, third party access and other relevant market governance.
-
Domestic production: 462.8 In 2016 [Source: UK GOV (2017), Digest of UK Energy Statistics (DUKES): natural gas, Chapter 4.1. Website.]
Imports: 534.7 In 2016 [Source: UK GOV (2017), Digest of UK Energy Statistics (DUKES): natural gas, Chapter 4.1. Website.]
Exports: 116.9 In 2016 [Source: UK GOV (2017), Digest of UK Energy Statistics (DUKES): natural gas, Chapter 4.1. Website.]
V.3.12 Transmission/distribution: Legal upper limit of H2 blending into natural gas network
%
V.3.13 Transmission/distribution: Coverage of gas distribution network in terms of percentage of residential/commercial sector connected to gas network. Include information about spatial distribution of the network coverage.
%
V.3.14 Storage: Is it possible to seasonally store natural gas? If yes, please describe the storage technologies/installations involved.
-choose from list
V.3.15 Demand: Total annual natural gas consumption TWh/y 897 Total demand in 2016 (gross) [Source: UK GOV (2017), Digest of UK Energy Statistics (DUKES): natural gas, Chapter 4.1. Website.]
Transport (all means): 0 In 2016 (gross) [Source: UK GOV (2017), Digest of UK Energy Statistics (DUKES): natural gas, Chapter 4.1. Website.]
Industrial: 17.4 In 2016 (gross) [Source: UK GOV (2017), Digest of UK Energy Statistics (DUKES): natural gas, Chapter 4.1. Website.]
Power&heat: 36.1 In 2016 (gross) [Source: UK GOV (2017), Digest of UK Energy Statistics (DUKES): natural gas, Chapter 4.1. Website.]
Commercial/residential: 39.9
In 2016 (gross) [Source: UK GOV (2017), Digest of UK Energy Statistics (DUKES): natural gas, Chapter 4.1. Website.]
Other: 6.6 Agriculture, public administration, miscellaneous, losses. In 2016. [Source: UK GOV (2017), Digest of UK Energy Statistics (DUKES): natural gas, Chapter 4.1. Website.]
V.3.17 Price level wholesales: Yearly average spot market price for natural gas
EUR/MWh ~25 Industrial gas prices including environmental taxes and levies, in 2017 [Source: Department for Business, Energy and Industrial Strategy (2018). Quarterly Energy Prices Tables Annex, Table 5.8.2 . London, UK]
V.3.18 Price level retail: Yearly average retail price for natural gas EUR/MWh ~46 Domestic gas prices including environmental taxes and levies, in 2017 [Source: Department for Business, Energy and Industrial Strategy (2018). Quarterly Energy Prices Tables Annex, Table 5.8.2 . London, UK]
Biogas marketV.3.19 Biogas market structure: Provide information on major
actors/ownership, public sector involvement, competition framework, and relevant market governance.
-
Domestic production:Imports:Exports:
V.3.21 Demand: Main offtakers of domestic biogas supply -V.3.22 Subsidies/market facilitation/support mechanisms for biogas -
V.3.20 Production: Total annual biogas domestic production, imports, exports
TWh/y
%
V.3.11 Production: Total annual natural gas domestic production, imports, exports
TWh/y
Demand: Total annual natural gas consumption and by sectorV.3.16

Page 137 (Appendix)
B.4 Germany
N° Indicator UnitQuantitative Response(i.e. specific values or estimates where available)
Qualitative Response(i.e. sources, reference year, description, and where relevant a clarification of quantitative response)
Module V.1: Macroeconomic and fiscal contextFor the country under investigation and for the currently prevailing situation, compile the following context information:V.1.1 Population # 82'521'000 On 2017/12/31 [Source: Federal Statistical office of
Germany (2018). Website.]V.1.2 National population growth rate %/y 0.4 Compared to 2016 [Source: Federal Statistical Office of
Germany (2018). Website.]V.1.3 Gross domestic product (GDP) EUR or USD 3'263'400'000'000 EUR [Source: Federal Statistical Office of Germany
(2018). Bruttoinlandsprodukt 2017. Wiesbaden, Deutschland: Federal Statistical Office of Germany]
V.1.4 GDP per capita (at purchasing power parity, PPP) EUR or USD 39'454 EUR [Source: Statista (2018). Website.]V.1.5 Sovereign rating Rating agencies'
scalesAAA Moody's, Fitch, S&P
V.1.6 National inflation rate (Consumer Price Index, CPI) % 1.4 2018/02 compared to 2017/02 [Source: Federal Statistical office of Germany (2018). Website.]
V.1.7 Unemployment rate % 5.7 (2018/02) [Source: Federal Statistical office of Germany (2017). Website.]
V.1.8 Corporate income tax rate % 30-33 Combined rate (i.e. corporate income tax, trade tax, solidarity surcharge) [Source: Deloitte (2018). Corporate Tax Rates 2018. Deloitte Touche Tomahatsu Limited]
V.1.9 Local tax rates (sales tax, VAT, other consumption taxation) % 19 Normal VAT in Germany. A reduced rate of 7% applies to certain consumer goods
V.1.10 Carbon tax(es) EUR/tCO2 No specific carbon tax in Germany
Module V.2: Climate policy contextFor the country under investigation and for the currently prevailing situation, compile the following context information:
tCO2/y
CO2 only: 801'753'000 In 2016 [Source: Umweltbundesamt (2018). National Trend Tables for the German Atmospheric Emission Reporting, Summary Table on Emission Trends for Germany since 1990 . Dessau, Germany: Umweltbundesamt]
tCO2e/y
all GHGs: 909'404'000 In 2016 [Source: Umweltbundesamt (2018). National Trend Tables for the German Atmospheric Emission Reporting, Summary Table on Emission Trends for Germany since 1990 . Dessau, Germany: Umweltbundesamt]
Transport (all means): 18%Road transport:
In 2015 [Source: Umweltbundesamt (2017). Annual greenhouse gas emissions in Germany . Umweltbundesamt, National GHG Inventory]
Industrial: 21% In 2015 [Source: Umweltbundesamt (2017). Annual greenhouse gas emissions in Germany . Umweltbundesamt, National GHG Inventory]
Power&heat: 37% In 2015 [Source: Umweltbundesamt (2017). Annual greenhouse gas emissions in Germany . Umweltbundesamt, National GHG Inventory]
Commercial/residential:Other: 7.5 % agriculture, 1% waste and wastewater, 15.5% other
In 2015 [Source: Umweltbundesamt (2017). Annual greenhouse gas emissions in Germany . Umweltbundesamt, National GHG Inventory]
V.2.3 Electricity grid emission factor tCO2e/MWh 0.58 Provisional for 2015. Accounting for electricity export balance. [Source: Umweltbundesamt (2017), Entwicklung der spezifischen Kohlendioxid-Emissionen des deutschen Strommix in den Jahren 1990 – 2016 . Dessau, Germany: Umweltbundesamt]
V.2.4 Carbon price other than simple carbon tax (Cf. I.1.11) EUR/tCO2 13 EU ETS, as of April 2018V.2.5 Is the use of H2 technologies mentioned in the Nationally
Determined Contribution (NDC) submitted to UNFCCC in the context of the Paris Agreement, or in other official national climate policy plans/strategies? If yes, please describe the extent to which H2 technologies are considered in the NDC/policy plans.
-
yes
The "Nationaler Strategierahmen" on alternative fuel mentions H2. National Organization for Hydrogen and Fuel Cell Technology GmbH (NOW) was established in 2008 to coordinate and manage National Innovation Programme for Hydrogen and Fuel Cell Technology (NIP)
V.2.6 Is the use of CCS technologies mentioned in the Nationally Determined Contribution (NDC) submitted to UNFCCC in the context of the Paris Agreement, or in other official national climate policy plans/strategies? If yes, please describe the extent to which CCS technologies are considered in the NDC/policy plans.
-
yes
The EU NDC covers CO2 transport and storage. The German energy policy ‘Energiekonzept’ was passed in 2010 as part of the German energy transition. In this concept, CCS is mentioned as one option to reduce CO2 emissions in Germany.
%Total annual GHG emissions per sectorV.2.2
V.2.1 Total annual GHG emissions

Page 138 (Appendix)
Module V.3: Market context for relevant energy carriersFor the country under investigation and for the currently prevailing situation, compile the following context information:Electricity marketV.3.1 Electricity market structure: Provide information about major
actors/ownership, public sector involvement, bundling of production/transmission/distribution, competition framework, third party access and other relevant market governance.
-
Domestic production: 651 in 2016 [Source: Arbeitsgemeinschaft Energiebilanzen (2018). Bruttostromerzeugung in Deutschland ab 1990 nach Energieträgern .]
Imports: 14.8 In 2016 [Source: Fraunhofer ISE (2018). Stromaustausch von Deutschland mit seinen Nachbarländern in 2018 . Website.]
Exports: 63.9 In 2016 [Source: Fraunhofer ISE (2018). Stromaustausch von Deutschland mit seinen Nachbarländern in 2018 . Website.]
Coal/peat: 42% In 2016 [Source: Fraunhofer ISE (2018). Stromerzeugung in Deutschland in 201 6. Website.]
Oil: < 1% In 2016 [Source: Fraunhofer ISE (2018). Stromerzeugung in Deutschland in 201 6. Website.]
Natural gas: 8% In 2016 [Source: Fraunhofer ISE (2018). Stromerzeugung in Deutschland in 201 6. Website.]
Nuclear: 14.5% In 2016 [Source: Fraunhofer ISE (2018). Stromerzeugung in Deutschland in 201 6. Website.]
Hydro: 4% In 2016 [Source: Fraunhofer ISE (2018). Stromerzeugung in Deutschland in 201 6. Website.]
Biofuels/waste:Wind/solar/geothermal: 21% In 2016 [Source: Fraunhofer ISE (2018).
Stromerzeugung in Deutschland in 201 6. Website.]V.3.4 Storage: Is it possible to seasonally store electricity? If yes,
please describe the storage technologies/installations involved.-
choose from list
V.3.5
Demand: Total annual electricity consumption TWh/y Gross electricity consumption: ~600
Net electricity consumption: ~525
Gross electricity consumption, in 2016 [Source: Federal Statistical Office of Germany (2017). Website.]
Net electricity consumption, in 2016, provisional [Source: Arbeitsgemeinschaft Energiebilanzen (2017). Energieverbrauch in Deutschland im Jahr 2016 . Berlin, Deutschland: AGEB]
Transport (all means): 2.1% Percentage of net electricity consumption, in 2016 [Source: Arbeitsgemeinschaft Energiebilanzen (2017). Energieverbrauch in Deutschland im Jahr 2016 . Berlin, Deutschland: AGEB]
Industrial: 47% Percentage of net electricity consumption, in 2016 [Source: Arbeitsgemeinschaft Energiebilanzen (2017). Energieverbrauch in Deutschland im Jahr 2016 . Berlin, Deutschland: AGEB]
Residential: 24.5% Percentage of net electricity consumption, in 2016 [Source: Arbeitsgemeinschaft Energiebilanzen (2017). Energieverbrauch in Deutschland im Jahr 2016 . Berlin, Deutschland: AGEB]
Commercial: 26.4% Percentage of net electricity consumption, in 2016 [Source: Arbeitsgemeinschaft Energiebilanzen (2017). Energieverbrauch in Deutschland im Jahr 2016 . Berlin, Deutschland: AGEB]
Other:V.3.7 Price level wholesales: Yearly average spot market price for
electricityEUR/MWh 35 Intraday, average 2017 [Source: Fraunhofer ISE (2018).
Jährliche Börsenstrompreise in Deutschland. Website.]
V.3.8 Price level retail: Yearly average retail price for electricity EUR/MWh 308 Electricity price for household consumers in Q4 2017 [Source: European Commission (2018). Quarterly Report on European Electricity Markets, Q4 2017 . Brussels, Belgium: EU Commission]
V.3.9 Subsidies/market facilitation/support mechanisms for renewable electricity production
-
Production: Share of domestic electricity production by technology
V.3.3
V.3.2 Production: Total annual electricity domestic production, imports, exports
TWh/y
%
V.3.6 Demand: Share of annual electricity consumption by sector %
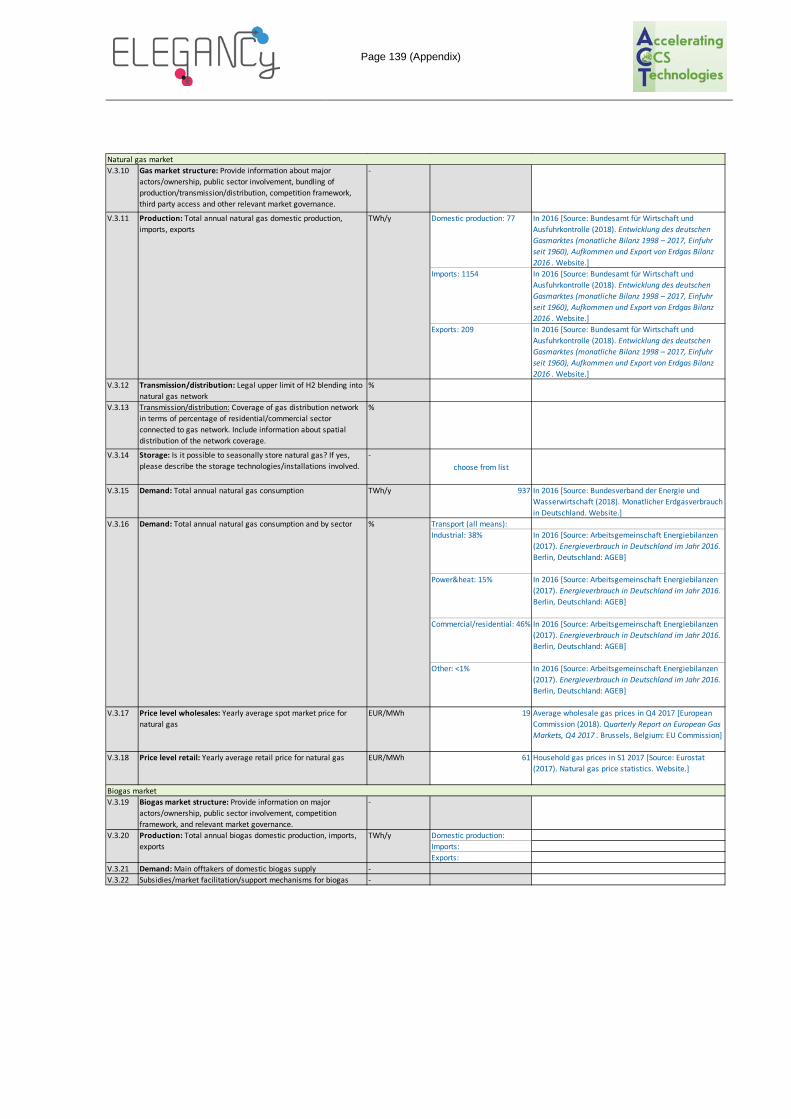
Page 139 (Appendix)
Natural gas marketV.3.10 Gas market structure: Provide information about major
actors/ownership, public sector involvement, bundling of production/transmission/distribution, competition framework, third party access and other relevant market governance.
-
Domestic production: 77 In 2016 [Source: Bundesamt für Wirtschaft und Ausfuhrkontrolle (2018). Entwicklung des deutschen Gasmarktes (monatliche Bilanz 1998 – 2017, Einfuhr seit 1960), Aufkommen und Export von Erdgas Bilanz 2016 . Website.]
Imports: 1154 In 2016 [Source: Bundesamt für Wirtschaft und Ausfuhrkontrolle (2018). Entwicklung des deutschen Gasmarktes (monatliche Bilanz 1998 – 2017, Einfuhr seit 1960), Aufkommen und Export von Erdgas Bilanz 2016 . Website.]
Exports: 209 In 2016 [Source: Bundesamt für Wirtschaft und Ausfuhrkontrolle (2018). Entwicklung des deutschen Gasmarktes (monatliche Bilanz 1998 – 2017, Einfuhr seit 1960), Aufkommen und Export von Erdgas Bilanz 2016 . Website.]
V.3.12 Transmission/distribution: Legal upper limit of H2 blending into natural gas network
%
V.3.13 Transmission/distribution: Coverage of gas distribution network in terms of percentage of residential/commercial sector connected to gas network. Include information about spatial distribution of the network coverage.
%
V.3.14 Storage: Is it possible to seasonally store natural gas? If yes, please describe the storage technologies/installations involved.
-choose from list
V.3.15 Demand: Total annual natural gas consumption TWh/y 937 In 2016 [Source: Bundesverband der Energie und Wasserwirtschaft (2018). Monatlicher Erdgasverbrauch in Deutschland. Website.]
Transport (all means):Industrial: 38% In 2016 [Source: Arbeitsgemeinschaft Energiebilanzen
(2017). Energieverbrauch in Deutschland im Jahr 2016. Berlin, Deutschland: AGEB]
Power&heat: 15% In 2016 [Source: Arbeitsgemeinschaft Energiebilanzen (2017). Energieverbrauch in Deutschland im Jahr 2016. Berlin, Deutschland: AGEB]
Commercial/residential: 46% In 2016 [Source: Arbeitsgemeinschaft Energiebilanzen (2017). Energieverbrauch in Deutschland im Jahr 2016. Berlin, Deutschland: AGEB]
Other: <1% In 2016 [Source: Arbeitsgemeinschaft Energiebilanzen (2017). Energieverbrauch in Deutschland im Jahr 2016. Berlin, Deutschland: AGEB]
V.3.17 Price level wholesales: Yearly average spot market price for natural gas
EUR/MWh 19 Average wholesale gas prices in Q4 2017 [European Commission (2018). Quarterly Report on European Gas Markets, Q4 2017 . Brussels, Belgium: EU Commission]
V.3.18 Price level retail: Yearly average retail price for natural gas EUR/MWh 61 Household gas prices in S1 2017 [Source: Eurostat (2017). Natural gas price statistics. Website.]
Biogas marketV.3.19 Biogas market structure: Provide information on major
actors/ownership, public sector involvement, competition framework, and relevant market governance.
-
Domestic production:Imports:Exports:
V.3.21 Demand: Main offtakers of domestic biogas supply -V.3.22 Subsidies/market facilitation/support mechanisms for biogas -
V.3.20 Production: Total annual biogas domestic production, imports, exports
TWh/y
%
V.3.11 Production: Total annual natural gas domestic production, imports, exports
TWh/y
Demand: Total annual natural gas consumption and by sectorV.3.16

Page 140 (Appendix)
B.5 Norway
N° Indicator UnitQuantitative Response(i.e. specific values or estimates where available)
Qualitative Response(i.e. sources, reference year, description, and where relevant a clarification of quantitative response)
Module V.1: Macroeconomic and fiscal contextFor the country under investigation and for the currently prevailing situation, compile the following context information:V.1.1 Population # 5'295'619 As of Jan 1 2017 [Source: Statistics Norway (2018).
Website.]V.1.2 National population growth rate %/y 0.7 2017-2018 [Source: Statistics Norway (2018). Website.]
V.1.3 Gross domestic product (GDP) EUR or USD 371'100'000'000 USD, in 2016 [Source: World Bank (2018). Website.]V.1.4 GDP per capita (at purchasing power parity, PPP) EUR or USD 58'790 USD, in 2016 [Source: World Bank (2018). Website.]V.1.5 Sovereign rating Rating agencies'
scalesAAA Fitch, Moody's S&P
V.1.6 National inflation rate (Consumer Price Index, CPI) % 2.2 In 2018 [Source: Statistics Norway (2018). Website.]V.1.7 Unemployment rate % 4 In 2018 [Source: Trading Economics (2018). Website.]V.1.8 Corporate income tax rate % 23 [Source: Deloitte (2018). Corporate Tax Rates 2018.
Deloitte Touche Tomahatsu Limited]V.1.9 Local tax rates (sales tax, VAT, other consumption taxation) % 25 VAT [Source: Trading Economics (2018). Website.]V.1.10 Carbon tax(es) EUR/tCO2 up to ~45 Tax rate depends on fuel type [Source: World Bank
Group, Ecofys (2015). State and Trends of Carbon Pricing . Washington, USA: World Bank Group]
Module V.2: Climate policy contextFor the country under investigation and for the currently prevailing situation, compile the following context information:
tCO2/y CO2 only: 44'100'000 In 2016 [Source: Statistics Norway (2017). Emissions of greenhouse gases. Website]
tCO2e/y all GHGs: 53'300'000 In 2016 [Source: Statistics Norway (2017). Emissions of greenhouse gases. Website]
Transport (all means): 26.6Road transport:18.6
In 2016 [Source: Statistics Norway (2017). Emissions of greenhouse gases, Table 3. Website]
Industrial: 49.5 In 2016 [Source: Statistics Norway (2017). Emissions of greenhouse gases, Table 3. Website]
Power&heat: 5.3 In 2016 [Source: Statistics Norway (2017). Emissions of greenhouse gases, Table 3. Website]
Commercial/residential:Other: 18.0 In 2016 [Source: Statistics Norway (2017). Emissions of
greenhouse gases, Table 3. Website]V.2.3 Electricity grid emission factor tCO2e/MWh 0.017 In 2015 [Source: Norwegian Water Resources and
Energy Directorate (2016). Electricity disclosure 2015. Website.]
V.2.4 Carbon price other than simple carbon tax (Cf. I.1.11) EUR/tCO2 13 EU ETS, as of April 2018V.2.5 Is the use of H2 technologies mentioned in the Nationally
Determined Contribution (NDC) submitted to UNFCCC in the context of the Paris Agreement, or in other official national climate policy plans/strategies? If yes, please describe the extent to which H2 technologies are considered in the NDC/policy plans.
-
choose from list
Hydrogen is not mentioned in Norway's NDC. National climate policy would have to checked
V.2.6 Is the use of CCS technologies mentioned in the Nationally Determined Contribution (NDC) submitted to UNFCCC in the context of the Paris Agreement, or in other official national climate policy plans/strategies? If yes, please describe the extent to which CCS technologies are considered in the NDC/policy plans.
-
yes
CCS is mentioned in Norway's NDC
V.2.1 Total annual GHG emissions
%Total annual GHG emissions per sectorV.2.2

Page 141 (Appendix)
Module V.3: Market context for relevant energy carriersFor the country under investigation and for the currently prevailing situation, compile the following context information:Electricity marketV.3.1 Electricity market structure: Provide information about major
actors/ownership, public sector involvement, bundling of production/transmission/distribution, competition framework, third party access and other relevant market governance.
-
Domestic production: 149.0 In 2016 [Source: Statistics Norway (2017). Electricity. Website.]
Imports: 5.7 In 2016 [Source: Statistics Norway (2017). Electricity. Website.]
Exports: 22.2 In 2016 [Source: Statistics Norway (2017). Electricity. Website.]
Coal/peat:Oil: Natural gas:Nuclear:Hydro: 96.3 In 2016 [Source: Statistics Norway (2017). Electricity.
Website.]Biofuels/waste:Wind/solar/geothermal: 1.4 In 2016 [Source: Statistics Norway (2017). Electricity.
Website.]V.3.4 Storage: Is it possible to seasonally store electricity? If yes,
please describe the storage technologies/installations involved.-
choose from list
V.3.5 Demand: Total annual electricity consumption TWh/y Gross: 132.6Net: 123.5
In 2016 [Source: Statistics Norway (2017). Electricity. Website.]
Transport (all means): 1.5 In 2016 [Source: Statistics Norway (2017). Electricity, Table 4. Website.]
Industrial: 44.4 In 2016 [Source: Statistics Norway (2017). Electricity, Table 4. Website.]
Residential: 32.4 In 2016 [Source: Statistics Norway (2017). Electricity, Table 4. Website.]
Commercial: 20.0 In 2016 [Source: Statistics Norway (2017). Electricity, Table 4. Website.]
Other: 1.7 Agriculture in 2016 [Source: Statistics Norway (2017). Electricity, Table 4. Website.]
V.3.7 Price level wholesales: Yearly average spot market price for electricity
EUR/MWh 30 Wholesale electricity basleoad price in Q4 2017 [Source: European Commission (2018). Quarterly Report on European Electricity Markets, Q4 2017 . Brussels, Belgium: EU Commission]
V.3.8 Price level retail: Yearly average retail price for electricity EUR/MWh 100 ~1 NOK/kWh in 2017 [Source: Statistics Norway (2018). Electricity prices. Website.]
V.3.9 Subsidies/market facilitation/support mechanisms for renewable electricity production
-
V.3.2 Production: Total annual electricity domestic production, imports, exports
TWh/y
%
V.3.6 Demand: Share of annual electricity consumption by sector %
Production: Share of domestic electricity production by technology
V.3.3 2.3% for thermal power generation in 2016 [Source: Statistics Norway (2017). Electricity. Website.]
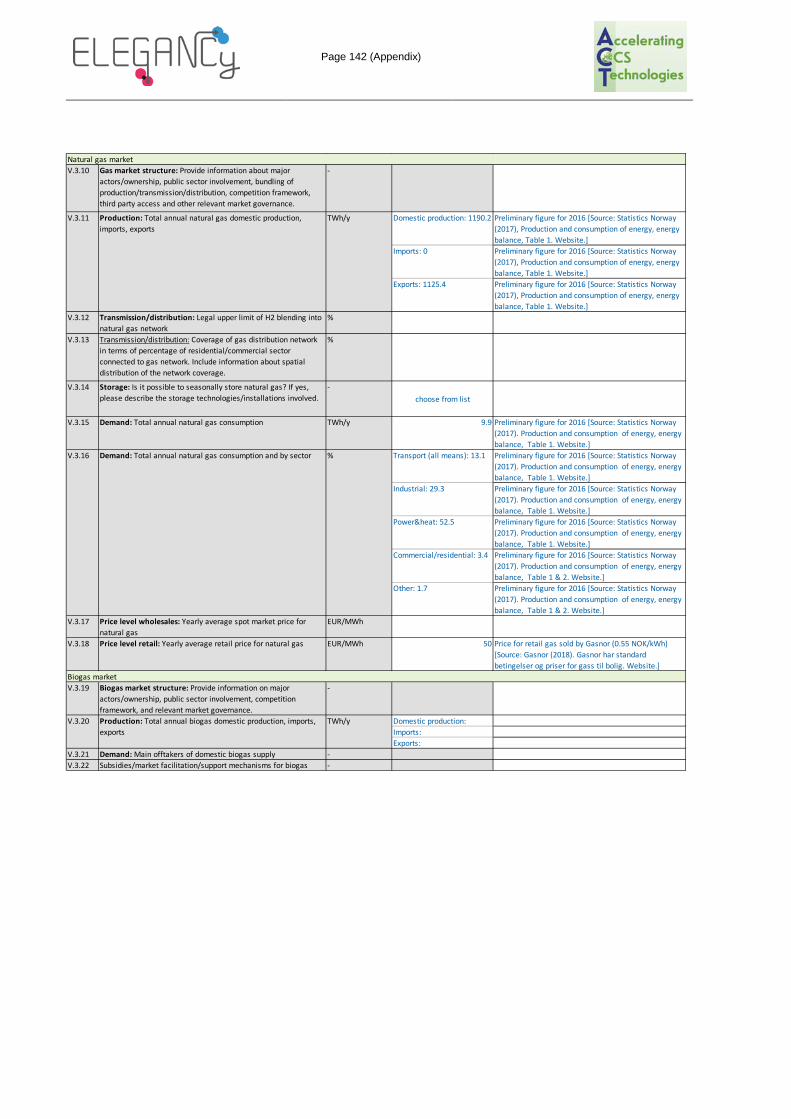
Page 142 (Appendix)
Natural gas marketV.3.10 Gas market structure: Provide information about major
actors/ownership, public sector involvement, bundling of production/transmission/distribution, competition framework, third party access and other relevant market governance.
-
Domestic production: 1190.2 Preliminary figure for 2016 [Source: Statistics Norway (2017), Production and consumption of energy, energy balance, Table 1. Website.]
Imports: 0 Preliminary figure for 2016 [Source: Statistics Norway (2017), Production and consumption of energy, energy balance, Table 1. Website.]
Exports: 1125.4 Preliminary figure for 2016 [Source: Statistics Norway (2017), Production and consumption of energy, energy balance, Table 1. Website.]
V.3.12 Transmission/distribution: Legal upper limit of H2 blending into natural gas network
%
V.3.13 Transmission/distribution: Coverage of gas distribution network in terms of percentage of residential/commercial sector connected to gas network. Include information about spatial distribution of the network coverage.
%
V.3.14 Storage: Is it possible to seasonally store natural gas? If yes, please describe the storage technologies/installations involved.
-choose from list
V.3.15 Demand: Total annual natural gas consumption TWh/y 9.9 Preliminary figure for 2016 [Source: Statistics Norway (2017). Production and consumption of energy, energy balance, Table 1. Website.]
Transport (all means): 13.1 Preliminary figure for 2016 [Source: Statistics Norway (2017). Production and consumption of energy, energy balance, Table 1. Website.]
Industrial: 29.3 Preliminary figure for 2016 [Source: Statistics Norway (2017). Production and consumption of energy, energy balance, Table 1. Website.]
Power&heat: 52.5 Preliminary figure for 2016 [Source: Statistics Norway (2017). Production and consumption of energy, energy balance, Table 1. Website.]
Commercial/residential: 3.4 Preliminary figure for 2016 [Source: Statistics Norway (2017). Production and consumption of energy, energy balance, Table 1 & 2. Website.]
Other: 1.7 Preliminary figure for 2016 [Source: Statistics Norway (2017). Production and consumption of energy, energy balance, Table 1 & 2. Website.]
V.3.17 Price level wholesales: Yearly average spot market price for natural gas
EUR/MWh
V.3.18 Price level retail: Yearly average retail price for natural gas EUR/MWh 50 Price for retail gas sold by Gasnor (0.55 NOK/kWh) [Source: Gasnor (2018). Gasnor har standard betingelser og priser for gass til bolig. Website.]
Biogas marketV.3.19 Biogas market structure: Provide information on major
actors/ownership, public sector involvement, competition framework, and relevant market governance.
-
Domestic production:Imports:Exports:
V.3.21 Demand: Main offtakers of domestic biogas supply -V.3.22 Subsidies/market facilitation/support mechanisms for biogas -
%
V.3.11 Production: Total annual natural gas domestic production, imports, exports
TWh/y
Demand: Total annual natural gas consumption and by sectorV.3.16
V.3.20 Production: Total annual biogas domestic production, imports, exports
TWh/y