Embed Size (px)
Citation preview

1
Deliverable D4Review of existing BMS and definition of inputs
for the proposed BMS
Status P
BRIMEPL97-2220
ProjectCoordinator: Dr R J Woodward, Transport Research Laboratory (TRL)
Partners: Bundesanstalt fuer Strassenwesen (BASt)
Centro de Estudios y Experimentacion de Obras Publicas (CEDEX)
Laboratoire Central des Ponts et Chaussées (LCPC)
Norwegian Public Roads Administration (NPRA)
Slovenian National Building and Civil Engineering Institute (ZAG)
Date: February 1999
PROJECT FUNDED BY THE EUROPEANCOMMISSION UNDER THE TRANSPORTRTD. PROGRAM OF THE4th FRAMEWORK PROGRAM

2
Review of existing BMS and definition of inputs for theproposed BMS
by B Godart (LCPC) and P R Vassie (TRL)
Deliverable D4

3
P97-2220
CONTENTS
Page
1 INTRODUCTION................................................................................................................... 22 REVIEW OF EXISTING BRIDGE MANAGEMENT SYSTEMS .......................................... 2
2.1 METHODOLOGY ........................................................................................................... 22.2 ANALYSIS OF THE REPLIES TO THE QUESTIONNAIRE......................................... 3
2.2.1 Global description of bridge management systems ........................................................ 32.2.2 Information on the database......................................................................................... 42.2.3 Bridge condition.......................................................................................................... 52.2.4 Other Information recorded on BMS........................................................................... 52.2.5 Prediction ................................................................................................................... 52.2.6 Information on costs.................................................................................................... 62.2.7 Decision on maintenance and repair ............................................................................. 72.2.8 Prioritisation................................................................................................................ 72.2.9 Quality control ............................................................................................................ 8
2.3 BMS IN THE UNITED STATES OF AMERICA............................................................. 82.3.1 Description of BRIDGIT............................................................................................. 82.3.2 Description of PONTIS .............................................................................................. 9
3 DEFINITION OF INPUTS FOR A BMS.............................................................................. 143.1 THE BMS OUTPUTS..................................................................................................... 14
4 CONCLUSION..................................................................................................................... 23ANNEX.................................................................................................................................... 24

1
EXECUTIVE SUMMARY
SCOPE
Europe has a large capital investment in the road network including bridges, which are the mostvulnerable element. As bridges age, deterioration caused by heavy traffic and an aggressiveenvironment becomes increasingly significant resulting in a higher frequency of repairs and possibly areduced load carrying capacity.
The purpose of this project is to develop a framework for the management of bridges on theEuropean road network that enables bridges to be maintained at minimum overall cost ie taking allfactors into account including condition of the structure, load carrying capacity, rate of deterioration,effect on traffic, life of the repair and the residual life of the structure.
SUMMARY
This report describes a review of existing Bridge Management Systems (BMS) used in Europe andabroad. The review was based on a questionnaire that was developed during the first months of1998.
The questionnaire was sent to the partners in the BRIME project and to other European countries,as well as countries outside Europe known to be well advanced in terms of bridge management(Canada, Japan, USA).
The number of questionnaires returned was excellent, with only the responses from Japan andCanada missing; however, the time taken for the questionnaires to be completed wasunderestimated, with some responses not being returned until late October 98.
Eleven responses were received and analysed. The responses received from the FHWA of theUnited States of America were treated separately as they used different systems, namely BRIDGITand PONTIS.
The information given in the completed questionnaires was analysed and a list of functions needed tosatisfy the objectives of a bridge management system and that could realistically be achieved, wasobtained.
These functions were developed to generate a system of well defined outputs for the BMS. Theinput data and algorithms needed to produce the outputs were specified and allocated to theappropriate work package groups providing them with clear objectives and formats.
IMPLEMENTATION
The results of this study will be used to develop the outline framework for a bridge managementsystem. This will be described in deliverable D13 which is due to be completed at the end of 1999.

2
REVIEW OF EXISTING BMS AND DEFINITION OFINPUTS FOR THE PROPOSED BMS
1 INTRODUCTION
The objective of this project is to develop a strategy for the management of the bridge stock on theEuropean Highway Network. This strategy will include a methodology for the development of asystem for optimising the use of the resources available for the management of bridge maintenance.The specific objective of this work package is to specify the requirements of a bridge managementsystem (BMS) that will satisfy the project objectives and to co-ordinate the work and combine theresults from work packages 1 to 6 to achieve these requirements.
The first aspects considered were the functions that the BMS should have. These were establishedby studying the literature and the results of a carefully composed questionnaire that was sent to anumber of highway authorities in Europe and North America. The evidence from the completedquestionnaires was analysed and a list of functions needed to satisfy the objectives, and that couldrealistically be achieved, was obtained. These functions are shown in Table 4.
These functions were developed to generate a system of well defined outputs for the BMS. Theinput data and algorithms needed to produce the outputs were specified and allocated to theappropriate work package groups providing them with clear objectives and formats.
2 REVIEW OF EXISTING BRIDGE MANAGEMENT SYSTEMS
2.1 METHODOLOGY
In order to produce an outline framework for management of bridges on the road networks acrossEurope, a review was undertaken of existing Bridge Management Systems (BMS) used in Europeand abroad. This review was based on a questionnaire that was developed during the first months ofthe year 1998 (see text of the questionnaire in annex).
The questionnaire was sent to the partners of the BRIME project, and to other European countries,as well as countries outside Europe known to be well advanced in terms of bridge management(Canada, Japan, USA). The questionnaire was sent in June 98 to the following Departments ofTransportation:
• France - Road Directorate (via LCPC)• Germany - BASt• Great Britain - TRL• Norway - Directorate of Public Roads (via NPRA)• Slovenia - Road Directorate of the Republic of Slovenia (via ZAG)• Spain - CEDEX• Denmark - Danish Road Directorate• Finland - Finnish National Road Administration

3
• USA - Federal Highway Administration - New York City DOT - California DOT• Canada• Japan - Public Work Research Institute.
The number of replies received was excellent, since only the questionnaires sent to Japan andCanada were not returned; however, the time taken for the questionnaires to be completed wasunderestimated, with some responses not being returned until late October 98.
Responses were obtained from:
D - Germany - Bundesanstalt für Strassenwesen: M. Peter HAARDT E - Spain - CEDEX: M. R. ASTUDILLO F - France - Road Directorate: M. J.L. ASTRUC UK - Great Britain - Highways Agency: M. P. TAILOR NO - Norway- Directorate of Public Roads: M. Borre STENVOLD SI - Slovenia - Road Directorate of the Republic of Slovenia: M. Miklavz CEPON DK - Denmark - Danish Road Directorate: M. Jorn LAURIDSEN FIN - Finland - Finnish National Road Administration: Mrs Maria-Kaarina SÖDERQVIST FHWA - USA - Federal Highway Administration: M. Edgar P. SMALL NY - New York City DOT: M. Bojidar YANEV CA - California DOT: M. Richard W. SHEPARD.
Eleven responses were received and analysed. The responses received from the FHWA of theUnited States of America were treated separately as they used different systems, namely BRIDGITand PONTIS.
2.2 ANALYSIS OF THE REPLIES TO THE QUESTIONNAIRE
2.2.1 Global description of bridge management systems
Eight countries operate a computerised Bridge Management System; two countries do not operate aBMS (D, E) even if the first steps on their way to a BMS have been performed, and one countryuses a partial one (F). For the countries operating a computerised BMS, its age varies from 2 to 20years.
For Slovenia, there is no official user manual or guidelines; the available documentation is a threevolume report of a research project carried out by ZAG (Slovenian National Building and CivilEnginneering Institute). For other countries the procedures for using the BMS are given in variousdocuments: maintenance manual (UK), Management instructions (F), User manual (NO, DK, FIN,NY). For D and E, there is no special documentation on their BMSs.
4
For most of the countries, the BMS is used to manage bridges on the National Highway Network iemotorways and trunk roads.
No country has its BMS linked to a road management system. However the Norwegian system hasan automatic link to the road network for route number and location.
2.2.2 Information on the database
Most of the countries that use a computerised BMS use commercial database software; the mostpopular one is ORACLE as can be seen below:
Structured Query Language (SQL): FHWA, D ORACLE: F, NO, FIN, FHWA, CA ACCESS: F, FHWA DELPHI: DK
The exceptions are UK and SI that do not use commercial database software.
Pontis uses Sybase SQL Anyware for the Relational Database of the Bridge Management System(RDBMS); drivers are also provided for Oracle and MS-Access. The database is ODBC (OpenData Base Connectivity) compliant and runs under MS-Windows (3.1 and 95/NT).
Germany is using a commercial SQL database software (SIB-Bauwerke) for recording data onstructures, inspection, maintenance and cost.
France is using ORACLE for the global evaluation of the condition of bridges (the software is calledImage Qualité des Ouvrages d'Art (IQOA)), and ACCESS for prioritising bridges for repair (thesoftware is called Ouvrages d'Art (OA)).
Most of the countries are working under the WINDOWS environment:
• Norway uses a Client/Server architecture (Windows 3.1 on a PC/ UNIX or Windows NT on aServer).
• Finland uses an inventory and network BMS in DOS, and a project BMS in Windows NT.
NY and SI are also working under DOS.
For most of the countries, the database is used for both management of individual structures andmanagement of the bridge stock. Spain uses the database mainly for the management of the bridgestock, and France uses a different database for the management of individual structures and for themanagement of the stock.
The BMSs are used at all the different levels that have a role in maintenance ie NationalHeadquarters, regional offices or county authorities and maintaining agents. In Norway and

5
Denmark, it is also used by consultants. The responsibility for maintenance is always at the nationallevel (Road Directorate).
Information is updated according to the type and performance of the BMS; for some it is done daily,some occasionally and for others annually or even every 2 years.
The number of datafields varies enormously; for example the Norwegian database contains 1228fields in 147 different tables. The Finnish database contains 250 datafields. Some databases havethe facilities to add user-defined fields.
2.2.3 Bridge condition
There are 3 or 4 levels of inspection (routine, general, detailed and special). In general, the resultsof general and detailed inspections are stored on the database although Norway also stores theresults of measurements and investigations.
The condition of bridges is also stored, except for UK and E. In general the condition is stored forindividual elements and the whole bridge, except for D where the condition is stored only for thewhole bridge. The condition is mostly based on a 3 to 5 rating scale.
2.2.4 Other Information recorded on BMS
The date, type, cost and location of maintenance work are recorded in every country. For France, itis only stored for maintenance work which costs more than 300kF and for Slovenia, type and costare stored separately.
The condition immediately before and after maintenance is not stored, except for DK and CA.
2.2.5 Prediction
Most countries do not use past condition data or a deterioration model to predict future condition.The exceptions are:
• FIN which uses probabilistic Markovian models at the network level, and deterministic models atthe project level.
• NY which uses past condition data and degradation of materials with time.
• CA which uses past condition data.
• F and SI use previous condition ratings.
DK does not believe in models for predicting future condition.

6
2.2.6 Information on costs
Table 2 gives some information on costs. For most of the countries the BMSs are used to storemaintenance, repair and, in some cases, inspection costs; the exceptions are D, NO, SI.
The BMSs used in most countries do not calculate the financial consequences of traffic disruptioncaused by maintenance work and the associated traffic management. In UK, delay costs arecalculated using either look-up tables or the computer programme QUADRO.

7
2.2.7 Decision on maintenance and repair
Most of the countries do not use the BMS to make decisions on maintenance and repair. Theexceptions are DK that uses a prioritisation programme, FIN which uses a repair index and CAwhich uses long term least cost optimal strategies from PONTIS.
For F and D, decisions are based on engineering judgement. UK uses cost benefit analysis. E makesa decision based on the cost of the repair as a percentage of replacement costs but it is not clearfrom their response whether this includes the traffic disruption costs.
Most countries decide when maintenance work is needed on basis of inspections and engineeringjudgement. SI Decides on the basis of increased traffic flows and the importance of the bridge to theregion. CA decides on the basis of safety and an analysis of the economic benefits. (In general it isbased on technical rather than economic requirements.)
Most countries decide which is the best maintenance option to use on basis of engineeringjudgement. In UK it depends on the solutions available and the cost of traffic management and trafficdisruption; whole life costing is also used for major schemes.
In SI it depends on the importance of the bridge, and FIN uses repair guidelines. CA uses long-termoptimal strategies.
2.2.8 Prioritisation
D, F, UK, NO and SI have no BMS module for generating an optimal (minimum cost) maintenancestrategy subject to certain constraints such as a lowest acceptable level of condition. Such a moduleis used in DK (for repair) and E, FIN, NY and CA.
In the optimisation process, other constraints are usually applied such as cost and policy for UK,and for CA it is the « lowest long-term cost that prevents failure ». Budget and bridge condition arealso mentioned by several countries as a usual constraint.
For F, D, UK, NO and SI, the BMS does not produce a prioritised maintenance strategy for thebridge stock when the maintenance budget is insufficient. However it does for E, DK, NY and CA,although for DK this is only done for repair.
No country quantifies the consequences of carrying out a sub-optimal maintenance strategy. DK andNY calculate the economical consequences of not carrying out an optimal maintenance strategy.
Each country uses different criteria for prioritisation: see Table 3
For most countries, the responsibility for prioritisation of bridges is at the national level. Only for NOand FIN is the responsibility at the local level.

8
2.2.9 Quality control
For all countries, there is no quality control of the management of bridges, except for FIN whereinternal procedures are applied.
2.3 BMS IN THE UNITED STATES OF AMERICA
Design, assessment, repair, and strengthening of bridges are increasingly important topics in theeffort to deal with deteriorating infrastructure in the United States. About one-third of the nation’s570,000 bridges are classified according to FWHA criteria as deficient and in need of rehabilitationor replacement. The major factors that have contributed to the present situation are age, inadequatemaintenance, increasing load spectra, and environmental contamination. The cost of the bridgereplacement and rehabilitation program is estimated at about 70 billion ECU.
Bridge management in the U.S. is performed by the bridge owning agencies. These are typically theState Departments of Transportation, County Agencies and Metropolitan Areas. There is norequirement for a particular BMS to be used and there are three systems currently in use:
• PONTIS: the predominant system used in the US, and licensed by 39 States.
• BRIDGIT: A project level system employed in the State of Maine and used by WashingtonState and Louisiana.
• State Specific Systems: five states have developed their own BMS : Alabama, Indiana, NewYork State, North Carolina and Pennsylvania.
2.3.1 Description of BRIDGIT
As described in NCHRP 300, the objectives of BRIDGIT are to « assist decision makers at allbridge management levels to select optimum solutions from an array of cost effective alternatives forevery action needed to achieve the desired levels of service within the funds allocated and to identifyfuture funding requirements ». The main functions of BRIDGIT are to provide support for thetransportation investment plan, and for project level planning and programming.
The system maintains a comprehensive data model to evaluate the condition states of bridges(including functional deficiencies), determination of policies for optimisation of funds at networklevel, recommendations for project level action, and prioritisation of maintenance and repair actions.
The database engine is FoxPro/Visual FoxPro. The information is used for both the management ofa stock of bridges and the management of individual structures. The users of the database are thebridge maintenance engineers.
National Bridge Inventory (NBI) fields and element models are both included in the BMS, butelement inspections (more detailed) are performed to replace the NBI condition rating inspectionwhich is too general. Inspection data is updated every 2 years. Fracture critical inspections, underwater inspections and other special inspections are performed periodically on vulnerable structures

9
(between 6 and 48 months according to site specific conditions). Visual inspection techniques areused with a 3 to 5 scale rating system. All bridge information collected over time is stored in thesystem.
The BMS records the date, type and cost of work performed both per bridge and per element. Italso records the condition of bridges before and after the maintenance work is performed.
For predicting future condition, BRIDGIT uses Markovian deterioration models where the futurecondition state depends on a transition probability matrix. Actual condition state models are usedfor updating the transition state probabilities, and predictions of future load carrying capacity arebased on the worst superstructure element condition.
BRIDGIT stores the direct and indirect costs of maintenance and repair works but not inspectioncosts. It includes the financial costs of traffic disruption, and user costs due to accidents, increasedtravel time and increased travel distances associated with detours. These costs are estimated on abridge by bridge basis.
The bridge level actions are developed through minimisation of expected life-cycle costs over a 20year planning horizon. The optimal sequence of actions and the optimal time to take the action areconsidered. Benefits are calculated as user cost savings.
Prioritisation and project planning are performed using an incremental cost benefit analysis. Thisprocedure is capable of developing a minimum cost strategy for a given budget. Moreover,condition state distributions can be generated to examine and quantify the effects on condition offollowing a sub-optimal policy.
2.3.2 Description of PONTIS
PONTIS has the same functions as BRIDGIT plus the following additional features:
It uses a relational database and Sybase SQL Anyware for the engine. Drivers are also provided forOracle and MS-Access. The database is ODBC compliant and runs under MS-Windows.
The overall condition is predicted using a health index for performance measurement. The futurehealth of the inventory may be predicted based on the size of the budget.
The optimisation is based on a network level using the minimum expected life-cycle costs over aninfinite planning horizon. Benefits are computed as agency cost savings of performing an actioncompared with postponement of the action by one year. The optimal policy is then applied to onebridge and aggregated to determine the optimal maintenance strategy for each bridge. The bestmaintenance option is the minimum cost option for each element; the best bridge-level option isdependent on the costs and benefits.

10
The procedure of prioritisation develops a minimum cost policy constrained by the need to minimisethe risk of failure. The models may be easily accommodated to consider minimum conditions orthreshold health index.
In general, PONTIS is used by bridge maintenance engineers (for inspection, in-service analysis,design), planners (long-term planning, corridor planning,etc.) and upper level decision makers(budgeting and forecasting).
The Pontis BMS can generate a large number of graphical and tabular reports and may becustomised through any SQL query software.

11
Table 1 Information on BMSs
Main Functions of BMS D DK E F UK NO FIN SI CA NY(state
Name SIB-Bauwerke
Danbro Edouard and OA
NATS Brutus
Time of operation (years) new 20 15 2 3 5 4 Number of bridges managed 34 600 1400 15 000 22 000 9 500 17 000 15 000 1760 25 000 10 000 Inventory of existing stock Yes Yes Yes Yes Yes Yes Yes Yes Yes Yes Schedule of inspection Yes Yes Yes Yes Yes Yes Yes Yes Condition of structures (rating, ...)
Yes Yes Yes Yes Yes Yes Yes Yes Yes
Bid for maintenance funds No Yes Yes Yes Yes ? Yes Yes Prioritising of maintenance work No Yes Yes Yes Yes ? Yes Yes Yes Budget planning (long term) No Yes No Yes Yes Yes Yes Registering detailed cost informationfor actions
Yes Yes Yes Yes
Safety assessments No No Yes Yes Taking into account alternativemaintenance strategies
No No Yes Yes
Application of whole-life costing No No Yes Yes Road user delays No No Yes
Deterioration prediction No No No No No No Yes No Yes Yes

12
Table 2 Information on costs.
Information on costs (millions of ECU)
D DK E F UK NO FIN SI CA NY City
Total surface of bridges (million of m2)
24 8,1 0,7 1,4
Number of bridges managed 34 600 1 400 15 000 22 000 9 500 17 000 15 000 1 760 25 000 847 Inspection cost 3 nd Nd 4,6 15 nd 1,2 4,5 nd Routine maintenance cost nd Nd 11,5 15 nd 0,43 4 20 Specialized maintenance cost 270 nd Nd 97,5 nd 2,6 6 20 Repair and strengthening cost nd 6 28,6 90 nd 10,2 100 20 Replacement cost 45 nd Nd 3,1 7,5 nd 10,2 13,6 50 450 Total cost (annual) 318 nd Nd 47,8 225 37 29,8 14 200 510
Replacement value of the stock 30 000 2 600 Nd 12 310 22 500 6 000 2 890 nd nd 6 000
Total cost ofmaintenance/replacement value
0,4 % 0,4 % 1,0 % 0,6 % 1,0 % 8,5 %
mean maintenance cost per bridge 0,009 0,0022 0,0237 0,0022 0,0020 0,0080 0,008 0,602 mean maintenance annual cost perm2 (ECU /m2)
13,2 5,9 365

13
Table 3 Criteria for prioritisation
COUNTRY
CRITERIA FOR PRIORITISATION
D Condition of Bridges Degree and consequences of damage Importance of roads Bridge Deck clearance Traffic safety Available staff
DK Minimisation of the maintenance costs E Not mentioned F Condition of the bridges
Importance of roads Minimum funds allocated for each local county Possibility for each county to do the job (studies and repairs) Policy
UK Whole cost life Safety index Policy
NO Degree and consequence of Damage Investigation of alternative strategies in terms of technical choices andcomparison between maintenance cost (direct and indirect costs) andbridge’s replacement value.
FIN Repair Index (based on damage class of the structural parts and repairurgency class of the damages).
SI Rating of the structure Importance of the road Load carrying capacity
CA Benefit cost ratios NY Not mentioned

14
3 DEFINITION OF INPUTS FOR A BMS
3.1 THE BMS OUTPUTS
The primary outputs were considered under two headings
• project level and • network level
Project level information is related to individual bridges, elements or components. It is important forspecifying the maintenance requirements and retrieving information about particular bridges.
Network level information relates to the entire bridge stock or to subsets of the entire stock such asall the bridges in a given region. (See Table 5 for other examples of subsets). This is important fordetermining whether the condition of the bridges within the network is improving or deteriorating andfor establishing the value of the budget required in order to maintain the condition of the network atan acceptable level.
The first aspects considered were the functions that the BMS should have. These were establishedby studying the literature and the results of the questionnaire. The information obtained wasanalysed and a list of functions needed to satisfy the objectives, and that could realistically beachieved, was obtained. These functions are shown in Table 4.
These functions were developed to generate a system of well defined outputs for the BMS. Theinput data and algorithms needed to produce the outputs were specified and allocated to theappropriate work package groups providing them with clear objectives and formats.

15
Table 4. Functions of a Bridge Management System
Functions of a Bridge Management System
To provide an inventory of bridges To record/predict the historical and future condition of elements and components To record/predict the historical and future load carrying capacity of the bridge To assess the rate of deterioration To select the most cost-effective maintenance To evaluate the cost of various maintenance options To evaluate traffic management and delay costs To calculate discounted costs to give a lifetime cost Assess the implications for safety and traffic congestion of deferring maintenance work To produce optimal and prioritised maintenance programme To assist with budget planning
Table 5. Examples of network level subsets
Examples of Network Level Subsets
All bridges in a particular region or country All bridges on a particular route All bridges in a particular age range All post-tensioned bridges All painted steel bridges All bridges with continuous decks All multi-span bridges All substandard bridges All substandard bridges less than a given age in a particular country
The examples of subsets in Table 5 represent only a few of the almost unlimited number ofpossibilities.
Tables 6 and 7 list the primary and secondary project and network level outputs that are necessaryto meet the objectives of the BMS

16
Table 6. Project level outputs
Primary Secondary
General Queries Inspection History Maintenance History Traffic History Condition History Load carrying capacity history Posting History Optimal Maintenance Programme
Cost of Optimal Maintenance Programme
Test History
Prediction of variation of load carrying capacitywith time. Prediction of the variation of condition withtime. The effect of maintenance and/or strengtheningon the future rate of change of condition and/orload carrying capacity. Estimation of the cost of maintenance based onthe load carrying capacity and condition. Estimation of the cost of traffic disruption dueto maintenance or traffic restriction.
An example of a general query could be “how many bridges have not been painted for 20 years”.Alternatively it could be more detailed for example, “is the bridge painted and if yes what type ofpaint was used and when was it last applied”. There are many possible general queries of varyingcomplexity. The number is only limited by the range of data fields in the database.
The input data and algorithms required in order to generate the outputs are shown in Tables 8 and 9for the project level and network level systems. A comprehensive inventory of data fields isessential for all bridge management systems as it will provide the data inputs required to generate allthe outputs. Tables 8 and 9 generally state specific inputs and only state bridge inventory where thenecessary inputs are non specific. The necessary types of inventory field are listed in Table 11.
Only complex algorithms are given in Tables 8 and 9. These are required for predictions ofcondition and load carrying capacity, the estimation of maintenance and traffic delay costs, and forobtaining optimal and prioritised maintenance programmes. These algorithms can be based onstandard statistical methods such as Markov Chain transition probabilities and dynamicprogramming or on novel techniques based on neural networks. Where no algorithm is given for anoutput it can be assumed that the calculations required are simple and evident and are easilyachieved using the functions of a relational database.
It can be seen that many of the inputs necessary to generate the network level outputs are the sameas inputs for some project level outputs. This demonstrates the inherent interconnection between the

17
project and network level systems confirming that the BMS requires both systems in order toproduce satisfactory results.
The suggested allocation of outputs to each work package is shown in Table 10. Two factorsshould be noted
• some outputs are harder to achieve than others hence some work package groupsare responsible for less outputs than others
• some outputs require the combined efforts of more than one work package groupand good communication must, therefore, be maintained between these groups, inparticular.

18
Table 7. Network level outputs
Primary Secondary
List and count bridges meeting specified criteria List and count bridges that are overdue forinspection List and count bridges that are substandard List and count bridges that are in the poorestcondition state List and count bridges with traffic Restrictions The budget needed for the optimal maintenanceprogramme The numbers of bridges with deferredmaintenance due to a sub-optimal budget The long term cost of deferring maintenancedue to a sub-optimal budget The prioritised maintenance programme for agiven sub-optimal budget Predictions of load carrying capacity for a specified budget Prediction of the condition for a Specified budget/maintenance programme Routing of heavy, high, wide or long vehicles History of different types of Maintenance History of occurrence of different types of defect History of occurrence of substandard Bridges History of performance of different Element types and component types Cost rates for different maintenance Options History of performance of different Maintenance methods
Prioritised maintenance programmes based onother constraints
An example of a general query for the network level could be “list and count the post tensionedbridges more than 10 years old in a given region that are overdue for inspection”.

19
Table 8. Input data and algorithms required to satisfy project level outputs
Output Algorithm Inputs
A1 General Queries Database search Inventory
A2 Inspection History ConditionHistory
Date of inspection, Type of inspection Extent/Severity, Occurrence of defects
A3 Maintenance History Date of maintenance, Location of maintenance Type of maintenance, Area maintained Cost of maintenance Immediate effect of maintenance on load carryingcapacity/condition Duration and extent of any traffic delays
A4 Traffic History Date of survey, Flow rate % HGV, Alternative route Additional time/distance
A5 Load carrying capacity history Date of assessment, Load carrying capacity See also inspection/condition/test history
A6 Posting history Start and finish dates for any load, height, widthrestrictions Duration and extent of traffic delays
A7 Predicting the variation of loadcarrying capacity with time
Markov Chain orNeural Network models
See inputs for outputs A2 to A5
A8 Predicting the variation ofcondition with time
Markov Chain orNeural Network models
See inputs for outputs A2 to A3, A4 & A6.
A9 Estimating the cost ofmaintenance
Neural Network See inputs for outputs A2 to A2, A3 & A5.
A10 Estimating the cost of trafficdelays
QUADRO See inputs for outputs A3 to A6
A11 Optimal maintenanceprogramme
Neural Network Dynamic Programming Discounting
See inputs for outputs A7 to A10 Also constraints and future life required
A12 Test result history Type of test Date of test

20
Table 9. Input data and algorithms required to satisfy the network level outputs
Output Algorithm Inputs
B1 List/count bridges satisfyingspecific criteria
Relational database search Inventory
B2 List/count bridges overdue forinspection
See inputs for output A2 Date for next inspection
B3 List/count bridges that aresubstandard
See inputs for output A5
B4 List/count bridges in the poorestcondition state
See inputs for output A2
B5 List/count bridges with trafficrestrictions
See inputs for outputs A5 & A6
B6 Budget for optimal programme
See inputs for output A11
B7 No. of bridges with deferredmaintenance
See inputs for output A11 Prioritised maintenance programme
B8 Long term cost of maintenance Neural Network Dynamic programming
See inputs for outputs A7 to A11
B9 Prioritised maintenanceprogramme
Neural Network Dynamic programming
See inputs for outputs A7 to A11 Budget constraint
B10 Prediction of mean loadcarrying capacity for a givenbudget/prioritised programme
Neural Network Dynamic programming Markov Chain
See inputs for outputs B9
B11 Prediction of mean conditionfor a given budget/prioritisedprogramme
Neural Network Dynamic programming Markov Chain
See inputs for output B9
B12 Routing of vehicles See inputs for output A6 Inventory
B13 History of different types ofmaintenance
See inputs for output A3
B14 History of the occurrence ofdifferent types of defect
See inputs for output A2

21
B15 History of the occurrence ofsubstandard bridges
See inputs for output A5
Table 9 cont. Input data and algorithms required to satisfy the network level outputs
Output Algorithm Inputs
B16 History of the performance ofelements/components
Inventory See inputs for output A2
B17 Cost rates for differentmaintenance options
See inputs for outputs A9 & A10
B18 History of the performance ofdifferent maintenance methods
See outputs for B17, B13, A2 and A5
Table 10. Allocation of BMS outputs to workpackage groups
Work Package Project Level Network Level
1. Condition Assessment A8, A2 B11
2. Structural Assessment A4, A5, A7, A12 B10
3. Modelling of DeterioratedStructures
A5, A7, A8, A12 B10, B11
4. Modelling Rates ofDeterioration
A8 B11
5. Strategy for Repair andReplacement
A3, A6, A9, A10, A11 B13
6. Priority Ranking andPrioritisation
A11 B6, B7, B8, B9, B10, B11
7. Systems for BridgeManagement
A1 B1, B2, B3, B4, B5, B12

22
Table 11. Inventory data fields relating to the bridge
Types of Information Examples of data fields
General Name Number Road Grid Reference Owner Maintainer Year Built Obstacle No. of Spans Structure Type Form of Construction Material of Construction
Drawing/Photograph and document register Types of drawing available Location of drawings
Route and Traffic Details
Postings Flow Rate % HGV Designated Route
Public Utilities Type Date Notified
Span/Support/Foundation/Retaining WallDetails
Bearings - Type, date fitted Joint - Type, date fitted Parapets - Type, date fitted Waterproofing - Type, date fitted Construction Type Element Type Prestressing Type

23
4 CONCLUSION
This review shows a large variety of approaches among European countries. Most of the countriesuse a computerised BMS. The condition of the bridge (through bridge inspection results),information on maintenance work and costs are recorded. Prediction models and taking account ofindirect costs are not very well developed. Decision on maintenance and repair, as well asprioritisation, is essentially a matter of engineering judgment.
The most advanced BMS Software seems to be Pontis which is used by 40 states in USA. It isdifficult to know if all functions of Pontis are actually used in the field, but it appears that Americanmaintenance engineers are more prone to rely on computerised tools, than European engineers whoprefer to rely on human judgement.
The findings from the questionnaire have been used to compile a list of functions needed to satisfythe objectives for a BMS. The inputs and algorithms required to generate this information have beengiven and allocated to each work package.

24
ANNEX 1 QUESTIONNAIRE
Bridge Management in Europe (BRIME)
QUESTIONNAIRE on Bridge Management Systems (BMS)
in various countries. (May 1998)
Europe has a large capital investment in the road network including bridges, which are the mostvulnerable element. Different Road Management Systems are commonly used across Europe by theRoad Directorate of each country. In general, these systems allow the allocation of budget for themaintenance of the infrastructure, but they do not incorporate rate of deterioration of the bridgestock, prioritisation of maintenance actions, and optimisation of the use of allocated funds.
One of the tasks identified in the framework of the European RTD Transport Research Program isdefined as : Development of construction and maintenance techniques that lead to lower overall costsfor pavements and structures, and greater efficiencies for the user. Addressing this task, a projectnamed BRIME has been launched. The purpose of this project is to produce an outline frameworkfor management of bridges on the road networks across Europe, to identify the inputs required toimplement such a system, and to develop the modules required for a bridge management system thatenables bridges to be maintained at minimum overall cost, taking all factors into account includingeffect on traffic, life of repair and the residual life of the structure.
In order to design the basement of this framework, the first step consists of a review of existingbridge management systems used in Europe and abroad (Canada, Japan, USA,...). This review ismainly based on the following questionnaire which is designed to get information on the managementof bridges located on main roads and highways ; but, if you are aware of another bridge managementsystem used on a local scale, please feel free to fill in another questionnaire to describe it or to givethe name and the address of the person responsible for this local BMS.
If you are answering this questionnaire, please give us the following informations :
Country : ................................................................................................................................ Organism : .............................................................................................................................. Your name : ............................................................................................................................ Adress : .................................................................................................................................. ................................................................................................................................... ................................................................................................................................... Tel : ........................................................ Fax : ....................................................... e-mail : ...................................................

25
1. Global description of the Bridge Management System
1.1. Does your country operate a computerised BMS ? r YES r NO
If YES, how long has it been in operation ? ..............................................................
If NO, how do you organise your information and maintenance/inspection programmes ?
................................................................................................................................................. ................................................................................................................................................. ................................................................................................................................................. ................................................................................................................................................. ................................................................................................................................................. .................................................................................................................................................
1.2. What are the main functions of your BMS ? - What do you use the BMS for ?.
................................................................................................................................................. ................................................................................................................................................. ................................................................................................................................................. ................................................................................................................................................. .................................................................................................................................................
1.3. Is the BMS a simple inventory database or does it include management functions such asinspection organisation, evaluation, maintenance planning, prioritisation ?
................................................................................................................................................. ................................................................................................................................................. ................................................................................................................................................. ................................................................................................................................................. ................................................................................................................................................. ................................................................................................................................................. ................................................................................................................................................. ................................................................................................................................................. ................................................................................................................................................. .................................................................................................................................................
1.4. Does special documentation on the BMS exist ? r YES r NO
If YES, please give the references below (user’s manual, guidelines, instructions,...) :
.................................................................................................................................................
26
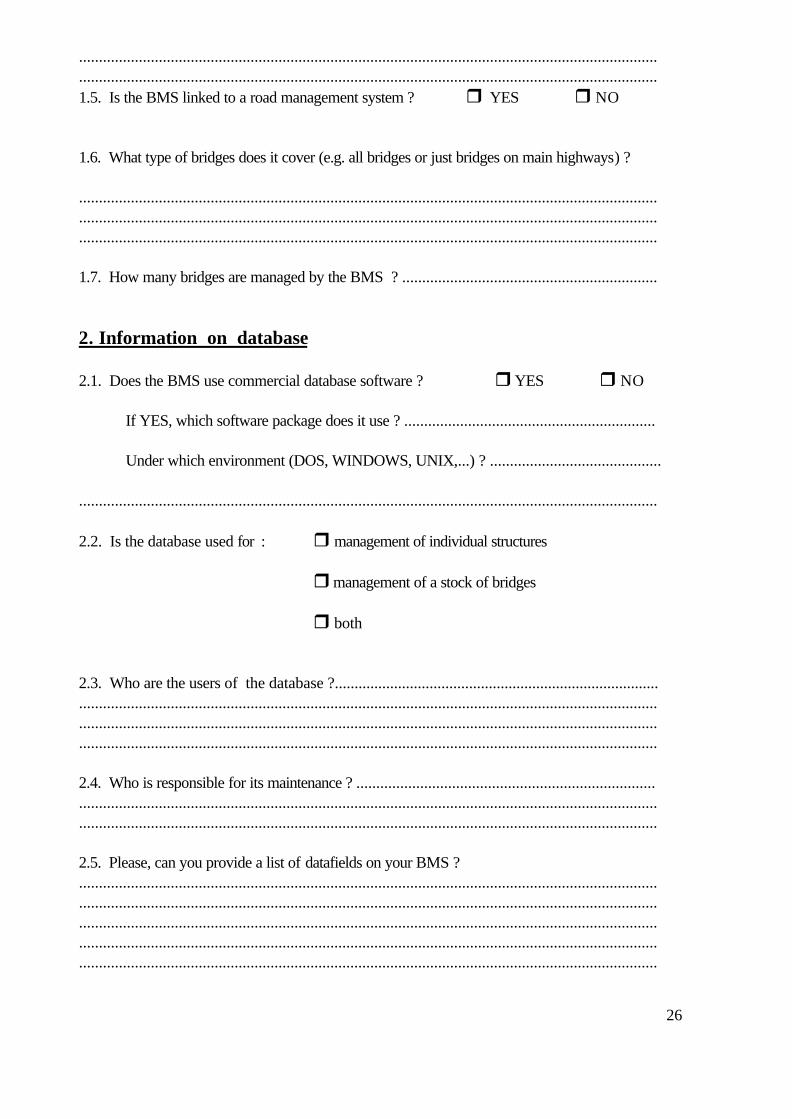
................................................................................................................................................. ................................................................................................................................................. 1.5. Is the BMS linked to a road management system ? r YES r NO
1.6. What type of bridges does it cover (e.g. all bridges or just bridges on main highways) ?
................................................................................................................................................. ................................................................................................................................................. .................................................................................................................................................
1.7. How many bridges are managed by the BMS ? ................................................................
2. Information on database
2.1. Does the BMS use commercial database software ? r YES r NO
If YES, which software package does it use ? ...............................................................
Under which environment (DOS, WINDOWS, UNIX,...) ? ...........................................
.................................................................................................................................................
2.2. Is the database used for : r management of individual structures
r management of a stock of bridges
r both
2.3. Who are the users of the database ?.................................................................................. ................................................................................................................................................. ................................................................................................................................................. .................................................................................................................................................
2.4. Who is responsible for its maintenance ? ........................................................................... ................................................................................................................................................. .................................................................................................................................................
2.5. Please, can you provide a list of datafields on your BMS ? ................................................................................................................................................. ................................................................................................................................................. ................................................................................................................................................. ................................................................................................................................................. .................................................................................................................................................

27
.................................................................................................................................................
2.6. How often is the data updated ? ......................................................................................

28
3. Condition of bridges
3.1. What are the different types of inspection, their content and their frequency ? (routine inspection, annual visit, detailed inspection, etc....), and who is doing it ?
................................................................................................................................................. ................................................................................................................................................. ................................................................................................................................................. ................................................................................................................................................. ................................................................................................................................................. ................................................................................................................................................. ................................................................................................................................................. ................................................................................................................................................. ................................................................................................................................................. .................................................................................................................................................
3.2. Are the results of bridge inspections stored on the database ? r YES r NO
If YES, which type of inspection ? ...............................................................................
.................................................................................................................................................
3.3. Is the condition of each bridge at different ages stored ? r YES r NO
3.4. Is the condition stored for the whole bridge or for individual elements ? ...........................
.................................................................................................................................................
3.5. What is the method used for rating the condition of bridges ? (If necessary, please, attach a document)
................................................................................................................................................. ................................................................................................................................................. ................................................................................................................................................. ................................................................................................................................................. ................................................................................................................................................. ................................................................................................................................................. ................................................................................................................................................. ................................................................................................................................................. ................................................................................................................................................. .................................................................................................................................................

29
................................................................................................................................................. .................................................................................................................................................

30
4. Other information recorded on BMS
4.1. Does the BMS record the following data related to maintenance work ?
date : r YES r NO
type : r YES r NO
cost : r YES r NO
location : r YES r NO
4.2. Does the BMS record the condition immediately before and after maintenance work ?
r YES r NO
5. Prediction :
Does the BMS use past condition data or deterioration models to predict future condition ?
past condition data r YES r NO
degradation of materials with time r YES r NO
mean condition state-time function r YES r NO
mean load carrying capacity-time function r YES r NO
residual life model r YES r NO
future load models r YES r NO
other models ? ..............................................................................................................
(Please attach to your answer any available description of the model used...)
................................................................................................................................................. ................................................................................................................................................. ................................................................................................................................................. ................................................................................................................................................. ................................................................................................................................................. .................................................................................................................................................

31
................................................................................................................................................. ................................................................................................................................................. .................................................................................................................................................

32
6. Informations on costs :
6.1. Does your BMS store the costs of maintenance, repair and inspection work ?
r YES r NO
If YES, please give the amount of money spent each year on managing the stock : (if possible by distinguishing routine maintenance, specialized maintenance, repair and strengthening, replacement, etc....)
inspection cost ? ......................................... routine maintenance cost ? ......................................... specialized maintenance cost ? ......................................... repair and strengthening cost ? ......................................... replacement cost ? ......................................... TOTAL COST ? .........................................
Does it include the cost of all administrative labour working specially for the management of bridges ? r YES r NO
administrative labour cost ? .........................................
6.2.What is the value of the existing stock of bridges (based on the cost of new construction) ? (You may distinguish extra cost due to demolition, traffic delays, widening, etc.) ................................................................................................................................................. ..................................................................................................................................................................................................................................................................................................
6.3. Does the BMS estimate the financial consequences of disruption to traffic caused by maintenance work or traffic restrictions ?
r YES r NO
(If YES, please give details...)
6.4. Do you know the cost of delay caused by maintenance actions ?
r YES r NO
(If YES, please give details...)

33

34
6.5. How is the overall condition of the bridge stock correlated with the size of the maintenancebudget ?...................................................................................................................................................................................................................................................................................................................................................................................................................................................................................................................................................................................................................................................................................................................................................................................................................................................................................................... .................................................................................................................................................
7. Decision on maintenance and repair :
7.1. Does the BMS use a specific tool or criterion to decide whether to : repair, strengthen orreplace elements of a damaged bridge ? r YES r NO
If YES, which kind of specific tool (program, decision chart,...) is your Organisation using ?......................................................................................................................... ..................................................................................................................................... ...................................................................................................................................... ...................................................................................................................................... ......................................................................................................................................
If NO, what is the methodology used by your Organisation for this task ? ...................................................................................................................................... ...................................................................................................................................... ...................................................................................................................................... ......................................................................................................................................
7.2. How do you decide when maintenance work is needed ? ................................................................................................................................................. ................................................................................................................................................. ................................................................................................................................................. .................................................................................................................................................
7.3. How do you decide which is the best maintenance option to use ? ................................................................................................................................................. ................................................................................................................................................. ................................................................................................................................................. ................................................................................................................................................. .................................................................................................................................................

35
7.4. Do you know any Bridge Administration which uses specific tools for deciding when and howto maintain ? r YES r NO ................................................................................................................................................. .................................................................................................................................................

36
7.5. Which person in your Organisation could be contacted in order to exchange information on thissubject ? ................................................................................................................................................. .................................................................................................................................................
8. Prioritisation :
8.1. Does the BMS generate an optimal (minimum cost) maintenance strategy subject to certainconstraints such as a lowest acceptable level of condition ?
r YES r NO
8.2. What constraints are usually applied to the optimisation process ? ................................................................................................................................................. ................................................................................................................................................. ................................................................................................................................................. ................................................................................................................................................. ................................................................................................................................................. .................................................................................................................................................
8.3. Does the BMS produce a prioritised maintenance strategy for the bridge stock when themaintenance budget is insufficient ?
r YES r NO
8.4. How are the consequences of carrying out a sub-optimal maintenance strategy quantified ? ................................................................................................................................................. ................................................................................................................................................. ................................................................................................................................................. ................................................................................................................................................. .................................................................................................................................................
8.5. What are the criteria for prioritisation ? ................................................................................................................................................. ................................................................................................................................................. ................................................................................................................................................. ................................................................................................................................................. ................................................................................................................................................. .................................................................................................................................................
8.6. Who is responsible for prioritisation of bridges ? ................................................................................................................................................. .................................................................................................................................................

37
.................................................................................................................................................
Please, attach any document available describing the procedure for prioritisation

38
9. Quality Control
Is there any Quality Control of the Bridge Management System ? r YES r NO (based on ISO 9000, or internal procedures...)
................................................................................................................................................. ................................................................................................................................................. ................................................................................................................................................. .................................................................................................................................................
10. Administrative organisation :
• Please give a description of the administrative organisation existing to manage the stock ofbridges. Please give a short description of services involved in the management of bridges(including administrative technical services and private consultants or laboratories if any), a flow-chart describing the relations between the services involved in the management, and a descriptionof the money flows between services).
• Give also the profiles of people involved in the BMS (level of studies and duration of experience)
11. List of Documents :
Please give a list of Administrative and Technical Documents for the management of bridges(inspection, maintenance, finance, ...)