Embed Size (px)
Citation preview
DA NANG PRESS CONFERENCE Q3 2013 Presented by: Adam Bury & Thao Le
18th November, 2013
2 CBRE MARKET INSIGHTS | Q3/2013
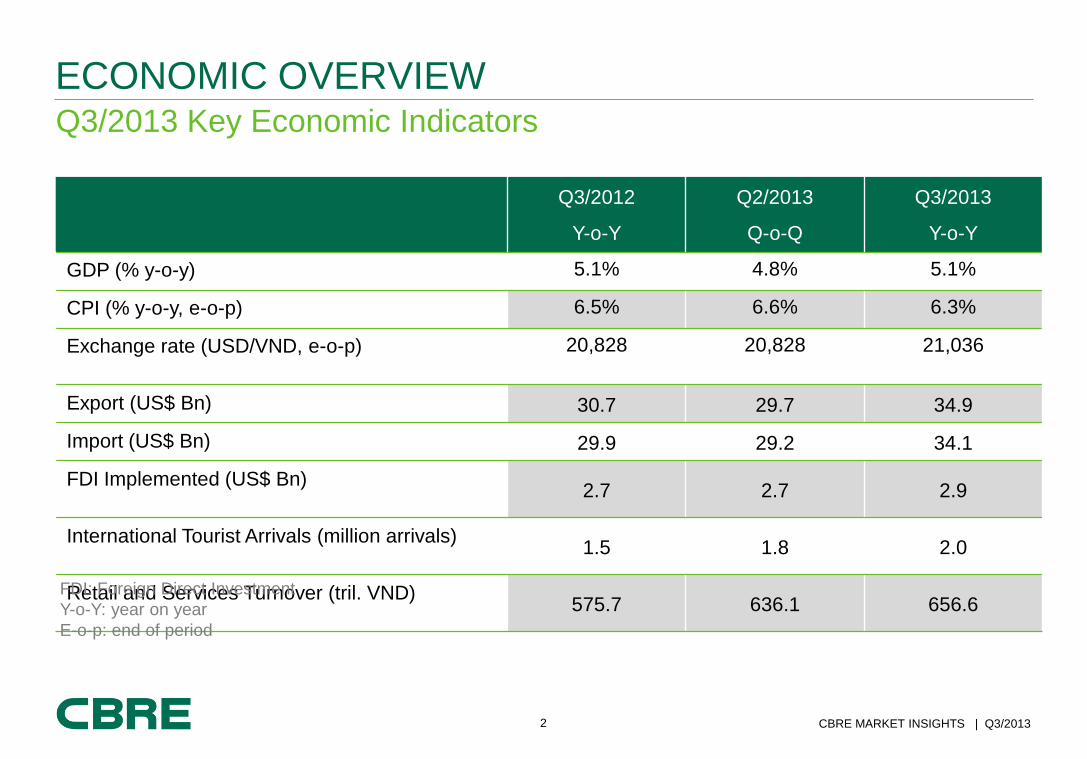
Q3/2013 Key Economic Indicators
ECONOMIC OVERVIEW
Q3/2012
Y-o-Y
Q2/2013
Q-o-Q
Q3/2013
Y-o-Y
GDP (% y-o-y) 5.1% 4.8% 5.1%
CPI (% y-o-y, e-o-p) 6.5% 6.6% 6.3%
Exchange rate (USD/VND, e-o-p) 20,828 20,828 21,036
Export (US$ Bn) 30.7 29.7 34.9
Import (US$ Bn) 29.9 29.2 34.1
FDI Implemented (US$ Bn) 2.7 2.7 2.9
International Tourist Arrivals (million arrivals) 1.5 1.8 2.0
Retail and Services Turnover (tril. VND) 575.7 636.1 656.6
FDI: Foreign Direct Investment
Y-o-Y: year on year
E-o-p: end of period
3 CBRE MARKET INSIGHTS | Q3/2013
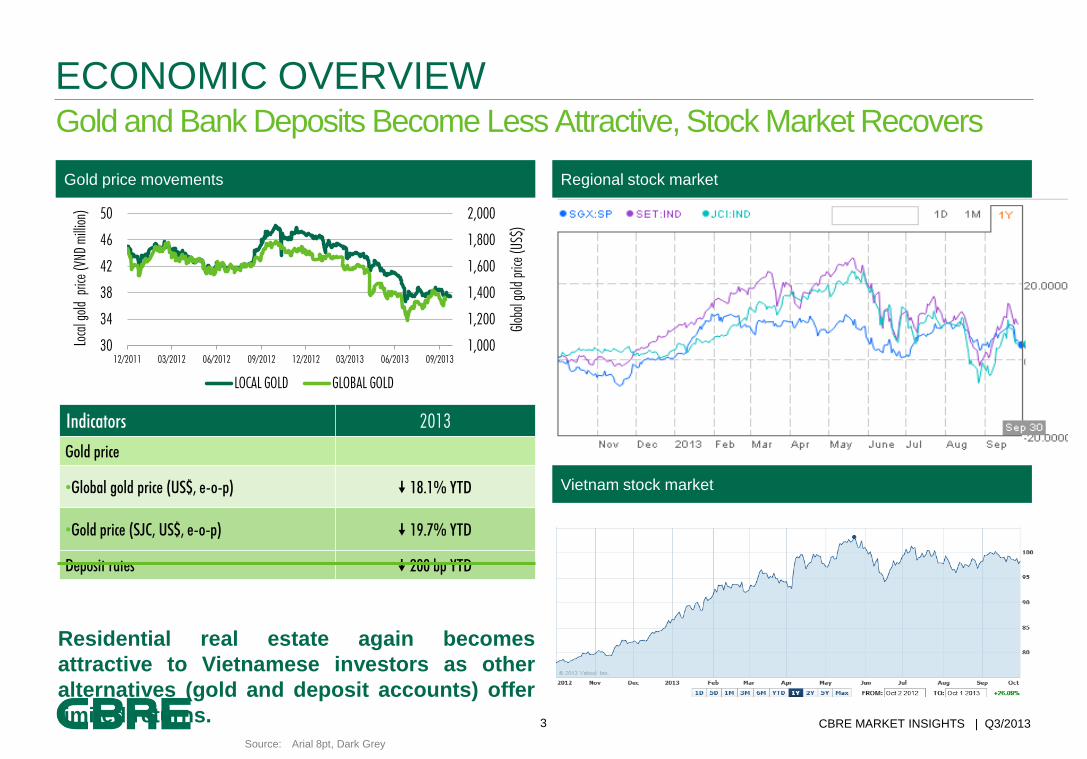
Gold and Bank Deposits Become Less Attractive, Stock Market Recovers
ECONOMIC OVERVIEW
Gold price movements Regional stock market
Source: Arial 8pt, Dark Grey
Indicators 2013
Gold price
•Global gold price (US$, e-o-p) 18.1% YTD
•Gold price (SJC, US$, e-o-p) 19.7% YTD
Deposit rates 200 bp YTD
Residential real estate again becomes
attractive to Vietnamese investors as other
alternatives (gold and deposit accounts) offer
limited returns.
1,000
1,200
1,400
1,600
1,800
2,000
30
34
38
42
46
50
12/2011 03/2012 06/2012 09/2012 12/2012 03/2013 06/2013 09/2013
Glo
bal gold
price
(U
S$
)
Loca
l gold
price
(VN
D m
illion)
LOCAL GOLD GLOBAL GOLD
Vietnam stock market

4 CBRE MARKET INSIGHTS | Q3/2013
LEGISLATION OVERVIEW
Supporting legislation from the government:
Resolution 19 on allowing foreign individuals
to buy property in Vietnam;
Submitted draft on raising the ceiling for
foreign ownership ratio in listed companies
from 49% to 60%;
A single visa for tourists to Vietnam, Thailand
and Cambodia.
The Government is Listening
5 CBRE MARKET INSIGHTS | Q3/2013
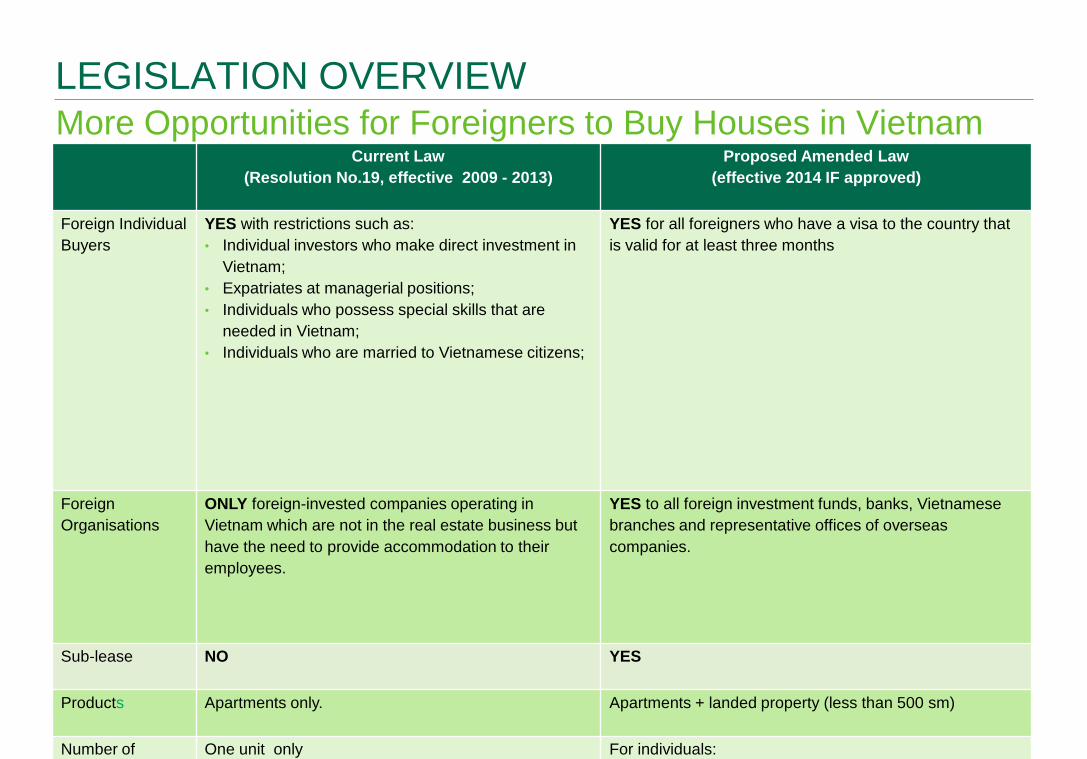
More Opportunities for Foreigners to Buy Houses in Vietnam
LEGISLATION OVERVIEW
Current Law
(Resolution No.19, effective 2009 - 2013)
Proposed Amended Law
(effective 2014 IF approved)
Foreign Individual
Buyers
YES with restrictions such as:
• Individual investors who make direct investment in
Vietnam;
• Expatriates at managerial positions;
• Individuals who possess special skills that are
needed in Vietnam;
• Individuals who are married to Vietnamese citizens;
YES for all foreigners who have a visa to the country that
is valid for at least three months
Foreign
Organisations
ONLY foreign-invested companies operating in
Vietnam which are not in the real estate business but
have the need to provide accommodation to their
employees.
YES to all foreign investment funds, banks, Vietnamese
branches and representative offices of overseas
companies.
Sub-lease NO YES
Products Apartments only. Apartments + landed property (less than 500 sm)
Number of
Products
One unit only For individuals:
Option 1: Unlimited
6 CBRE MARKET INSIGHTS | Q3/2013
26
83
7
2
16
23
$1,827.50
$667.60
$171.50
$152.20
$106.50
$21.40
0 500 1000 1500 2000
Real estate
Processing and manufacturing …
Education
Beverages
Textile, garment and footwear
Information technology
US$ million
Total registered capital ($US mil) No. of projects
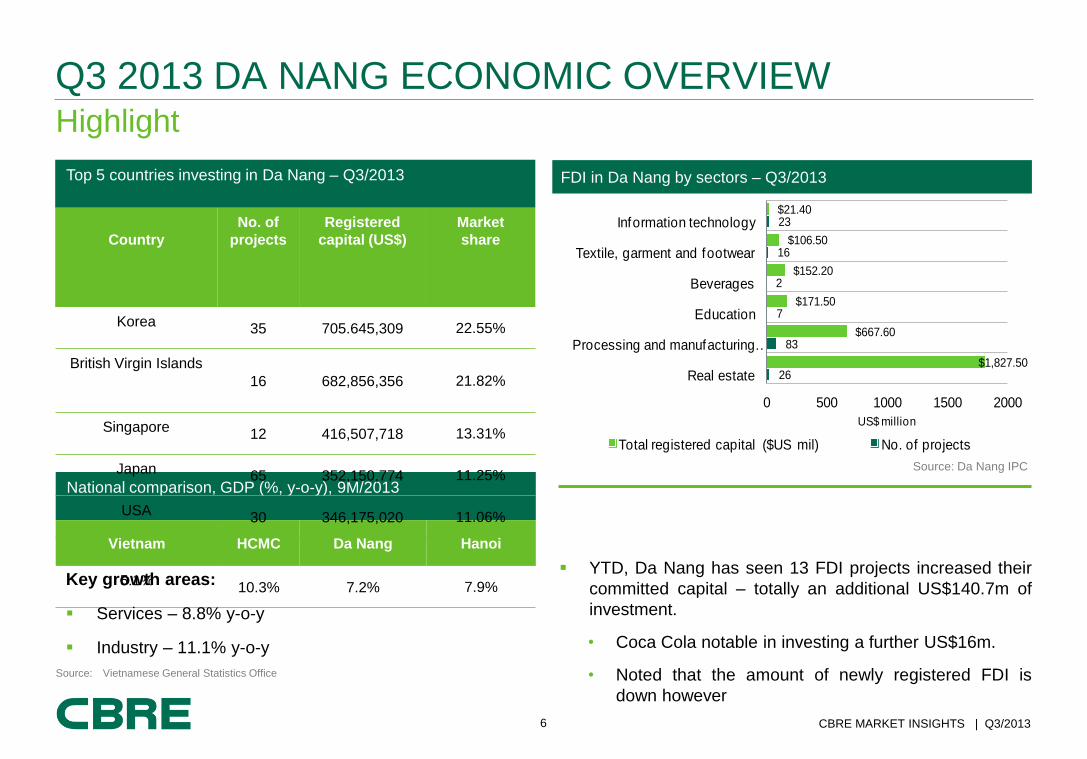
National comparison, GDP (%, y-o-y), 9M/2013
Vietnam HCMC Da Nang Hanoi
5.1% 10.3% 7.2% 7.9%
Highlight
Q3 2013 DA NANG ECONOMIC OVERVIEW
FDI in Da Nang by sectors – Q3/2013
Source: Vietnamese General Statistics Office
Top 5 countries investing in Da Nang – Q3/2013
Country
No. of
projects
Registered
capital (US$)
Market
share
Korea 35 705.645,309 22.55%
British Virgin Islands
16 682,856,356 21.82%
Singapore 12 416,507,718 13.31%
Japan 65 352,150,774 11.25%
USA 30 346,175,020 11.06%
Source: Da Nang IPC
Key growth areas:
Services – 8.8% y-o-y
Industry – 11.1% y-o-y
YTD, Da Nang has seen 13 FDI projects increased their
committed capital – totally an additional US$140.7m of
investment.
• Coca Cola notable in investing a further US$16m.
• Noted that the amount of newly registered FDI is
down however

INFRASTRUCTURE
8 CBRE MARKET INSIGHTS | Q3/2013
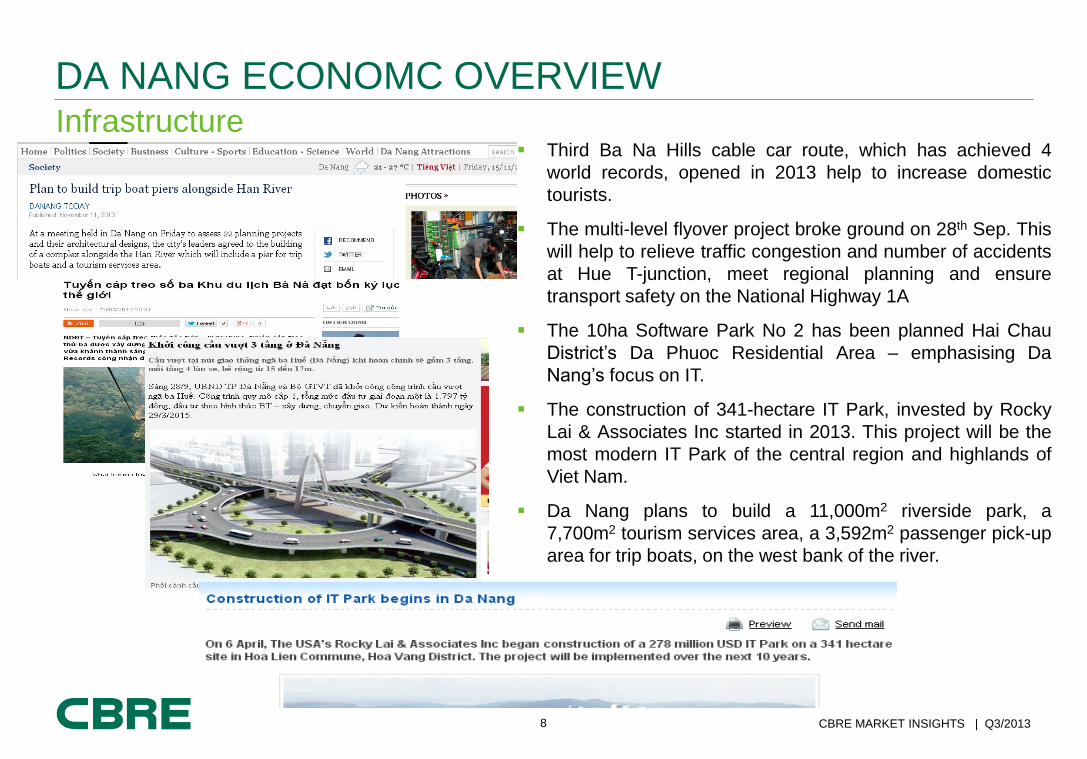
DA NANG ECONOMC OVERVIEW Infrastructure
Third Ba Na Hills cable car route, which has achieved 4
world records, opened in 2013 help to increase domestic
tourists.
The multi-level flyover project broke ground on 28th Sep. This
will help to relieve traffic congestion and number of accidents
at Hue T-junction, meet regional planning and ensure
transport safety on the National Highway 1A
The 10ha Software Park No 2 has been planned Hai Chau
District’s Da Phuoc Residential Area – emphasising Da
Nang’s focus on IT.
The construction of 341-hectare IT Park, invested by Rocky
Lai & Associates Inc started in 2013. This project will be the
most modern IT Park of the central region and highlands of
Viet Nam.
Da Nang plans to build a 11,000m2 riverside park, a
7,700m2 tourism services area, a 3,592m2 passenger pick-up
area for trip boats, on the west bank of the river.
9 CBRE MARKET INSIGHTS | Q3/2013
Improving and Still Room for Growth
AIR INFRASTRUCTURE
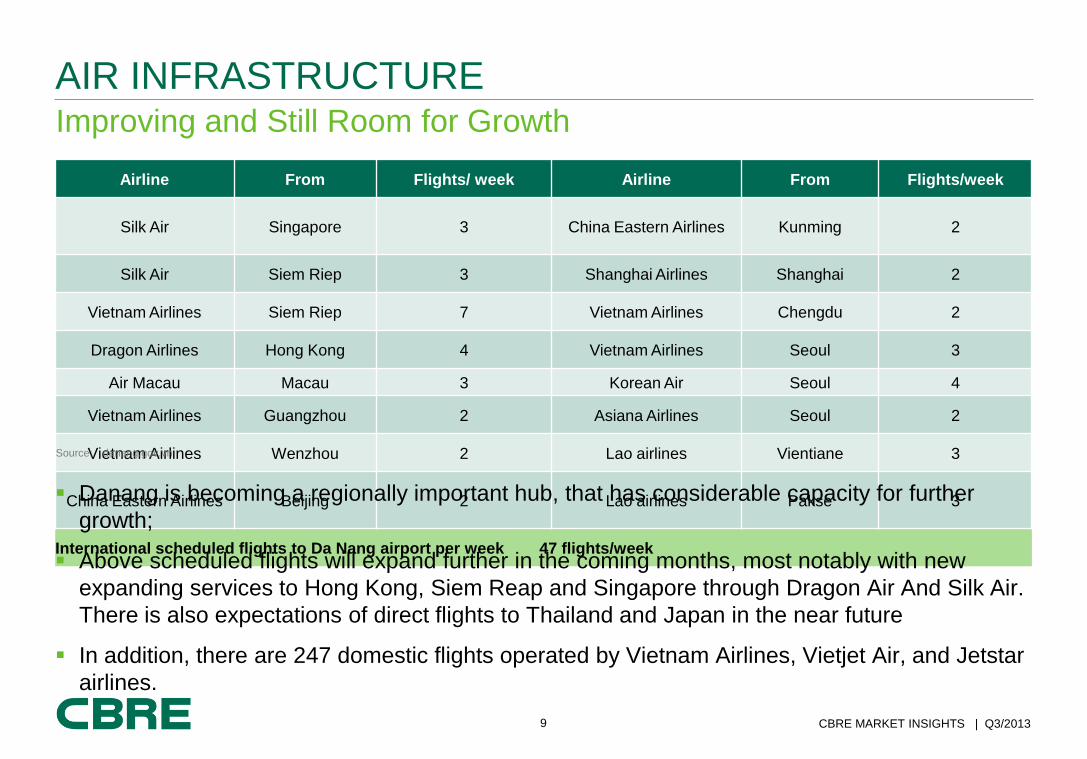
Airline From Flights/ week Airline From Flights/week
Silk Air Singapore 3 China Eastern Airlines Kunming 2
Silk Air Siem Riep 3 Shanghai Airlines Shanghai 2
Vietnam Airlines Siem Riep 7 Vietnam Airlines Chengdu 2
Dragon Airlines Hong Kong 4 Vietnam Airlines Seoul 3
Air Macau Macau 3 Korean Air Seoul 4
Vietnam Airlines Guangzhou 2 Asiana Airlines Seoul 2
Vietnam Airlines Wenzhou 2 Lao airlines Vientiane 3
China Eastern Airlines Beijing 2 Lao airlines Pakse 3
International scheduled flights to Da Nang airport per week 47 flights/week
Danang is becoming a regionally important hub, that has considerable capacity for further
growth;
Above scheduled flights will expand further in the coming months, most notably with new
expanding services to Hong Kong, Siem Reap and Singapore through Dragon Air And Silk Air.
There is also expectations of direct flights to Thailand and Japan in the near future
In addition, there are 247 domestic flights operated by Vietnam Airlines, Vietjet Air, and Jetstar
airlines.
Source: danang.gov.vn
10 CBRE MARKET INSIGHTS | Q3/2013
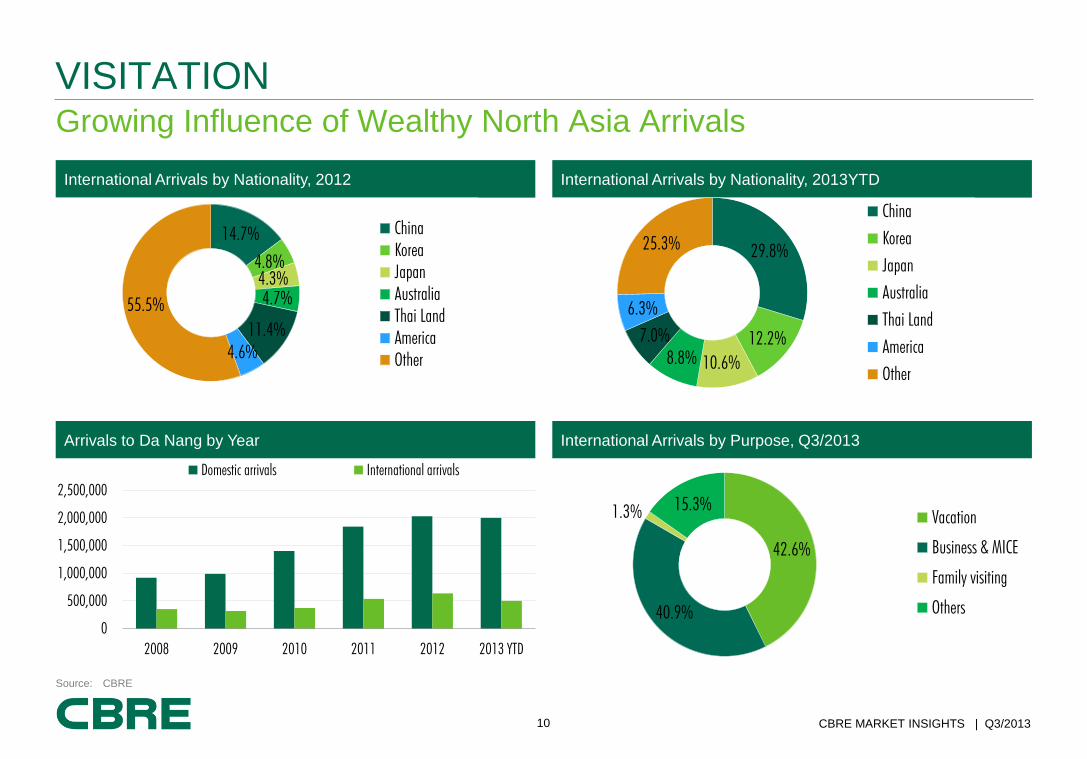
Growing Influence of Wealthy North Asia Arrivals
VISITATION
International Arrivals by Nationality, 2012 International Arrivals by Nationality, 2013YTD
Arrivals to Da Nang by Year International Arrivals by Purpose, Q3/2013
Source: CBRE
29.8%
12.2%
10.6% 8.8%
7.0%
6.3%
25.3%
China
Korea
Japan
Australia
Thai Land
America
Other
14.7%
4.8%
4.3%
4.7%
11.4%
4.6%
55.5%
China
Korea
Japan
Australia
Thai Land
America
Other
0
500,000
1,000,000
1,500,000
2,000,000
2,500,000
2008 2009 2010 2011 2012 2013 YTD
Domestic arrivals International arrivals
42.6%
40.9%
1.3% 15.3%
Vacation
Business & MICE
Family visiting
Others

HOSPITALITY Hotel/Resort
12 CBRE MARKET INSIGHTS | Q3/2013
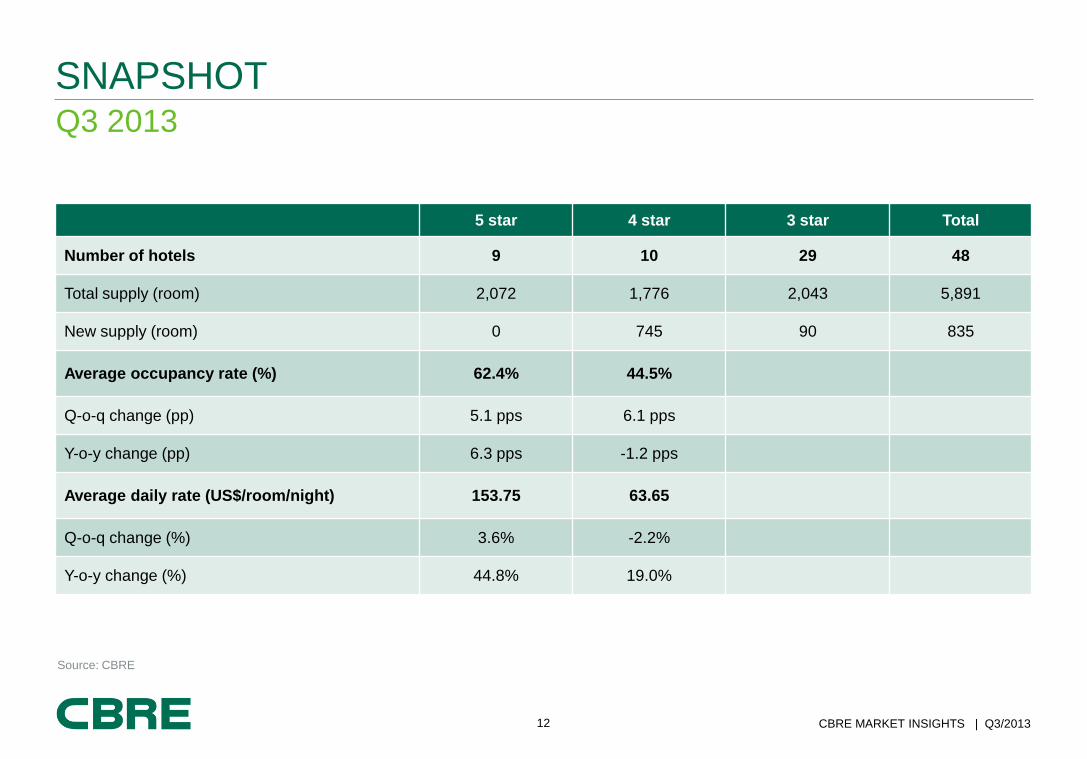
Q3 2013
SNAPSHOT
5 star 4 star 3 star Total
Number of hotels 9 10 29 48
Total supply (room) 2,072 1,776 2,043 5,891
New supply (room) 0 745 90 835
Average occupancy rate (%) 62.4% 44.5%
Q-o-q change (pp) 5.1 pps 6.1 pps
Y-o-y change (pp) 6.3 pps -1.2 pps
Average daily rate (US$/room/night) 153.75 63.65
Q-o-q change (%) 3.6% -2.2%
Y-o-y change (%) 44.8% 19.0%
Source: CBRE
13 CBRE MARKET INSIGHTS | Q3/2013
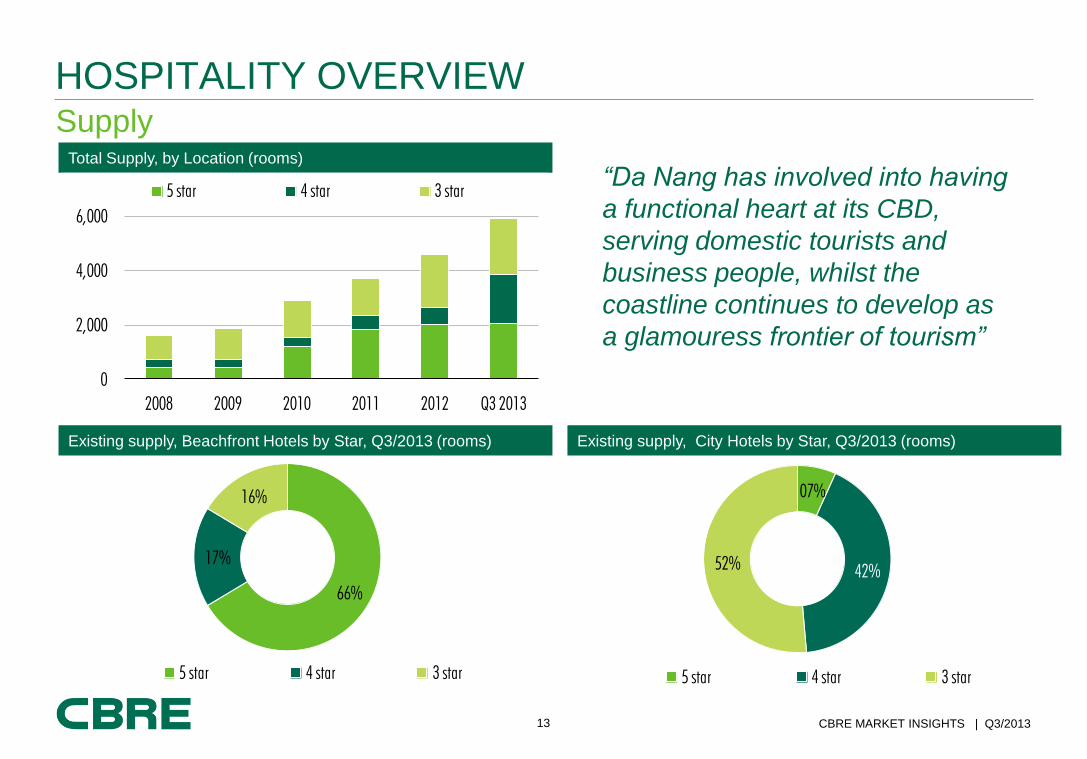
Supply
HOSPITALITY OVERVIEW
“Da Nang has involved into having
a functional heart at its CBD,
serving domestic tourists and
business people, whilst the
coastline continues to develop as
a glamouress frontier of tourism”
Total Supply, by Location (rooms)
0
2,000
4,000
6,000
2008 2009 2010 2011 2012 Q3 2013
5 star 4 star 3 star
Existing supply, Beachfront Hotels by Star, Q3/2013 (rooms) Existing supply, City Hotels by Star, Q3/2013 (rooms)
66%
17%
16%
5 star 4 star 3 star
07%
42%52%
5 star 4 star 3 star
14 CBRE MARKET INSIGHTS | Q3/2013
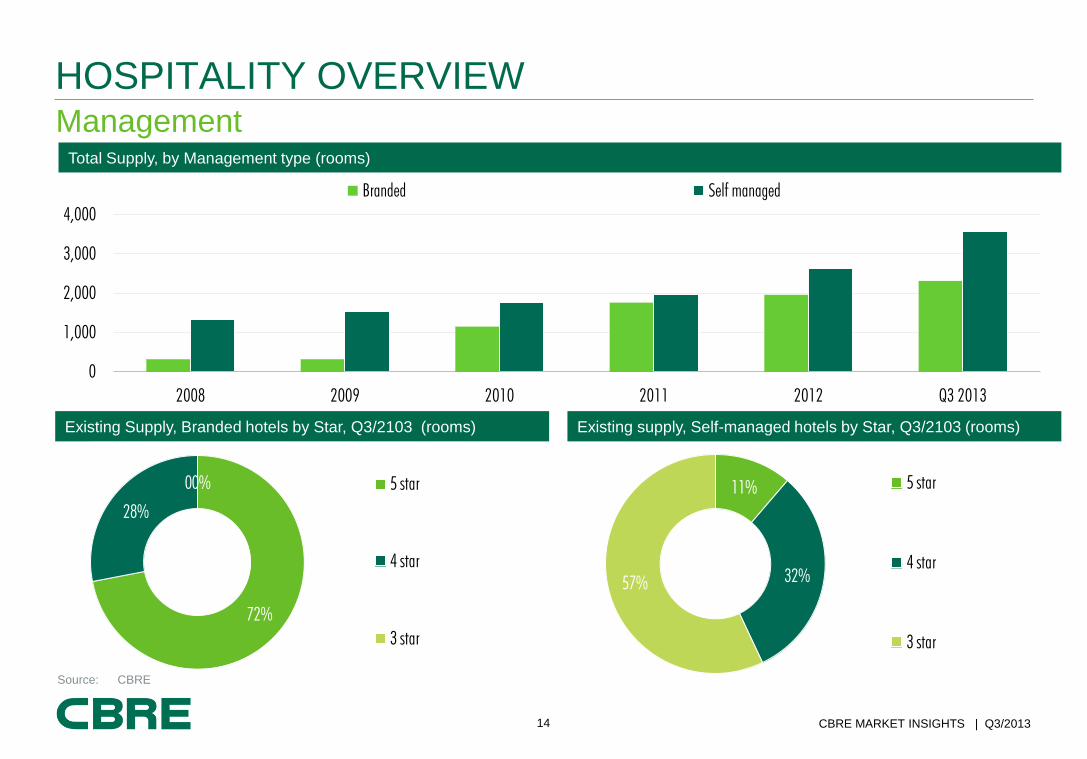
Management
HOSPITALITY OVERVIEW
Existing Supply, Branded hotels by Star, Q3/2103 (rooms) Existing supply, Self-managed hotels by Star, Q3/2103 (rooms)
72%
28%
00% 5 star
4 star
3 star
11%
32%57%
5 star
4 star
3 star
Total Supply, by Management type (rooms)
0
1,000
2,000
3,000
4,000
2008 2009 2010 2011 2012 Q3 2013
Branded Self managed
Source: CBRE
15 CBRE MARKET INSIGHTS | Q3/2013
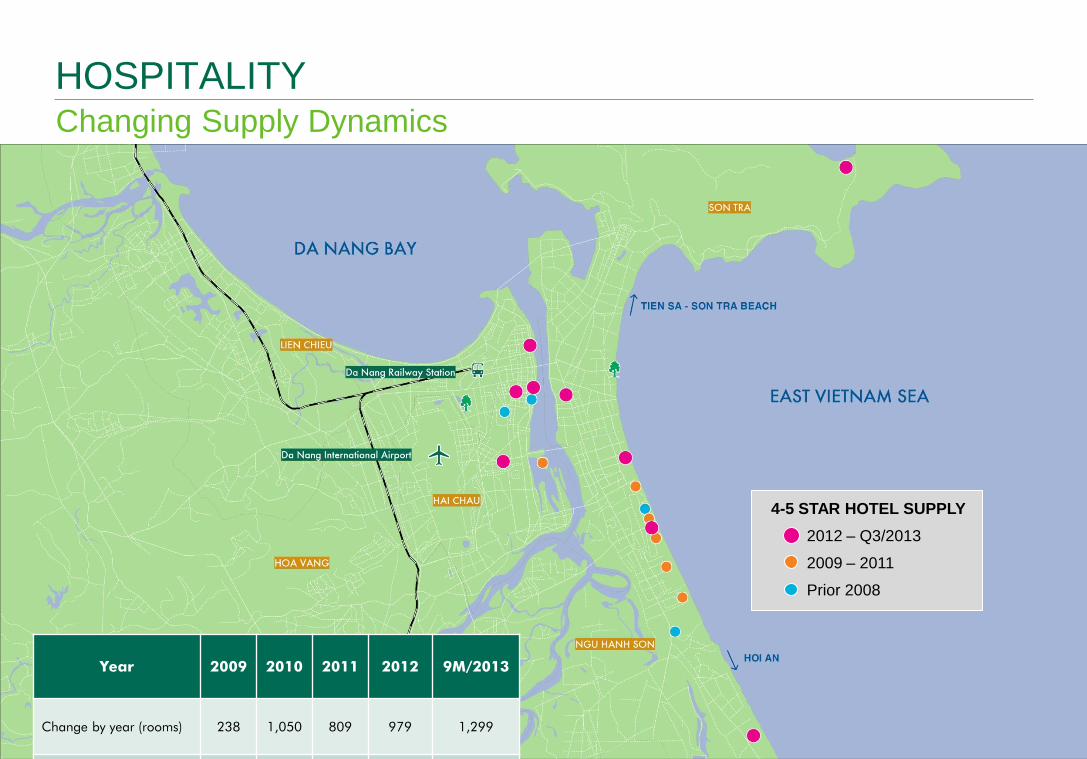
Changing Supply Dynamics
HOSPITALITY
4-5 STAR HOTEL SUPPLY
2012 – Q3/2013
2009 – 2011
Prior 2008
Year 2009 2010 2011 2012 9M/2013
Change by year (rooms) 238 1,050 809 979 1,299
16 CBRE MARKET INSIGHTS | Q3/2013
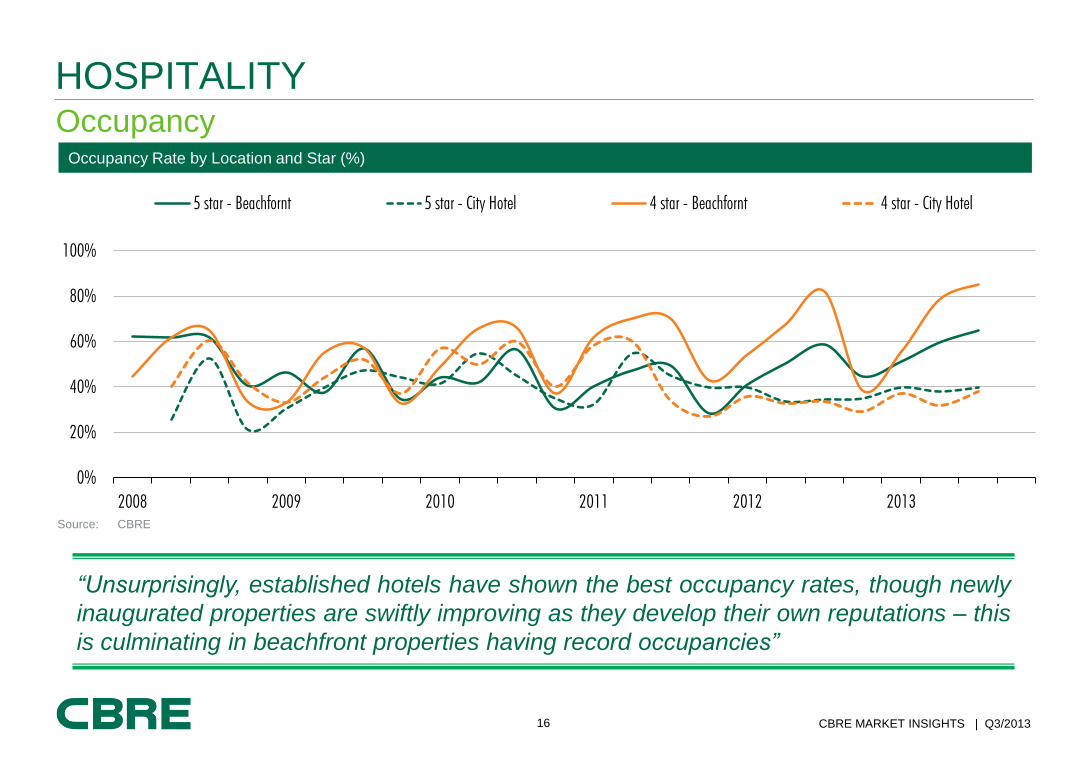
Occupancy
HOSPITALITY
“Unsurprisingly, established hotels have shown the best occupancy rates, though newly
inaugurated properties are swiftly improving as they develop their own reputations – this
is culminating in beachfront properties having record occupancies”
Occupancy Rate by Location and Star (%)
0%
20%
40%
60%
80%
100%
2008 2009 2010 2011 2012 2013
5 star - Beachfornt 5 star - City Hotel 4 star - Beachfornt 4 star - City Hotel
Source: CBRE
17 CBRE MARKET INSIGHTS | Q3/2013
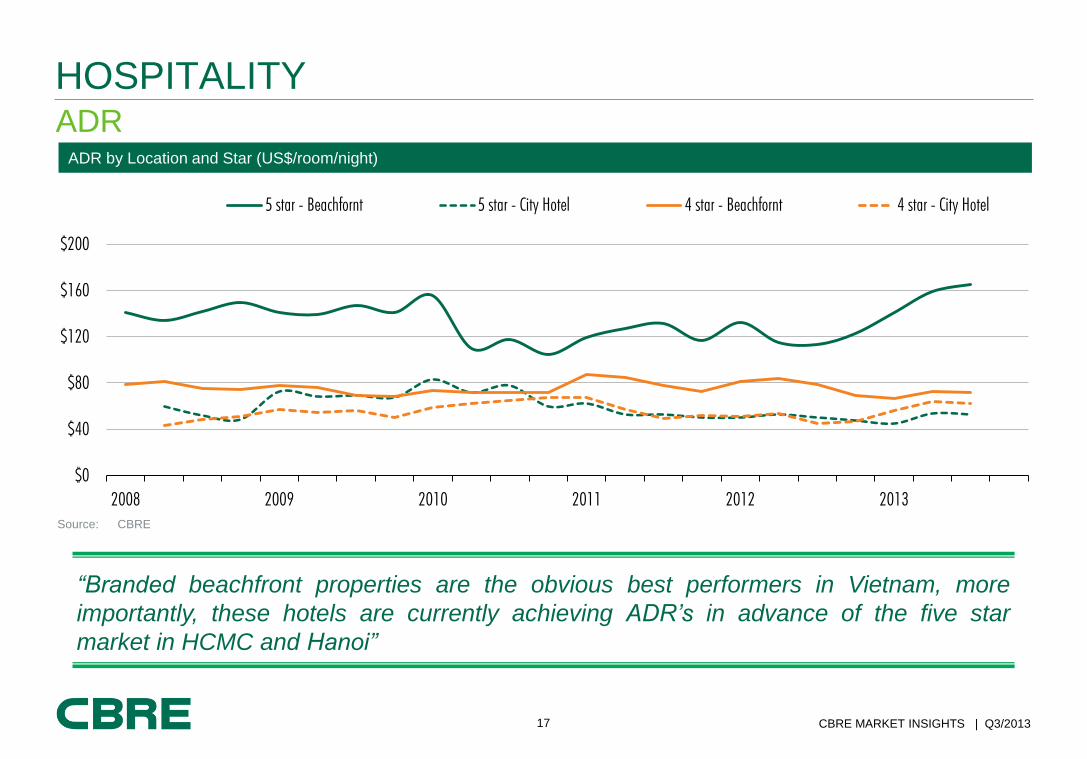
ADR
HOSPITALITY
“Branded beachfront properties are the obvious best performers in Vietnam, more
importantly, these hotels are currently achieving ADR’s in advance of the five star
market in HCMC and Hanoi”
ADR by Location and Star (US$/room/night)
$0
$40
$80
$120
$160
$200
2008 2009 2010 2011 2012 2013
5 star - Beachfornt 5 star - City Hotel 4 star - Beachfornt 4 star - City Hotel
Source: CBRE
18 CBRE MARKET INSIGHTS | Q3/2013
RevPar
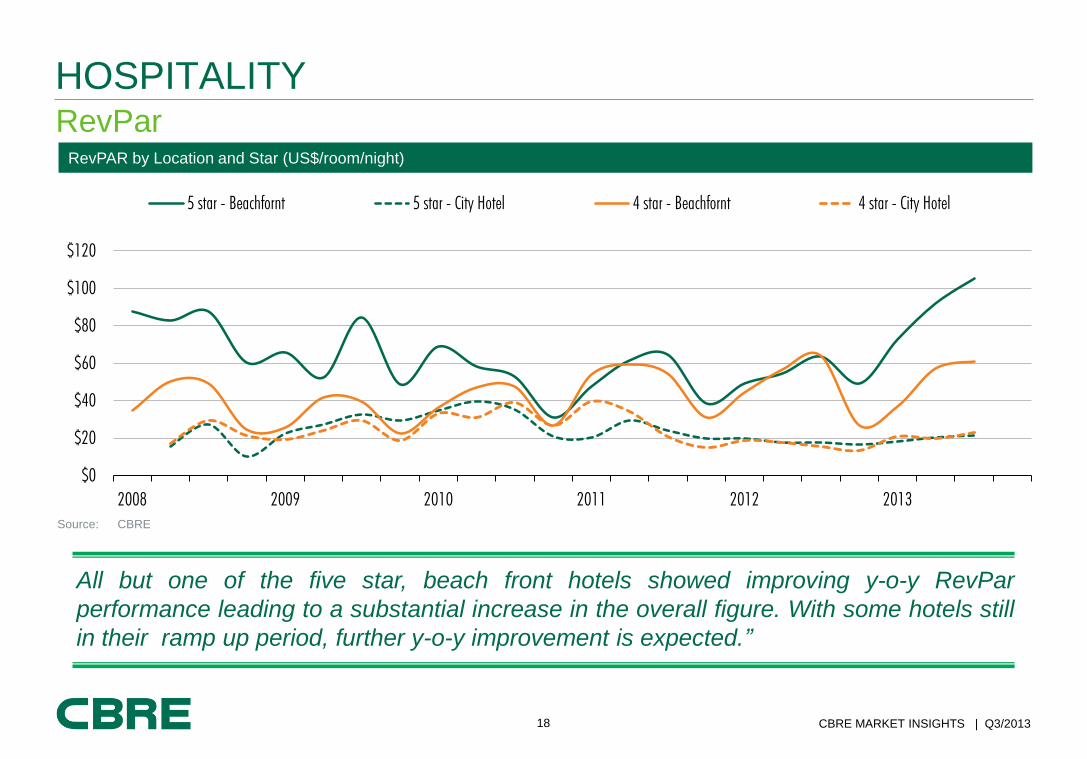
HOSPITALITY
All but one of the five star, beach front hotels showed improving y-o-y RevPar
performance leading to a substantial increase in the overall figure. With some hotels still
in their ramp up period, further y-o-y improvement is expected.”
RevPAR by Location and Star (US$/room/night)
$0
$20
$40
$60
$80
$100
$120
2008 2009 2010 2011 2012 2013
5 star - Beachfornt 5 star - City Hotel 4 star - Beachfornt 4 star - City Hotel
Source: CBRE
19 CBRE MARKET INSIGHTS | Q3/2013
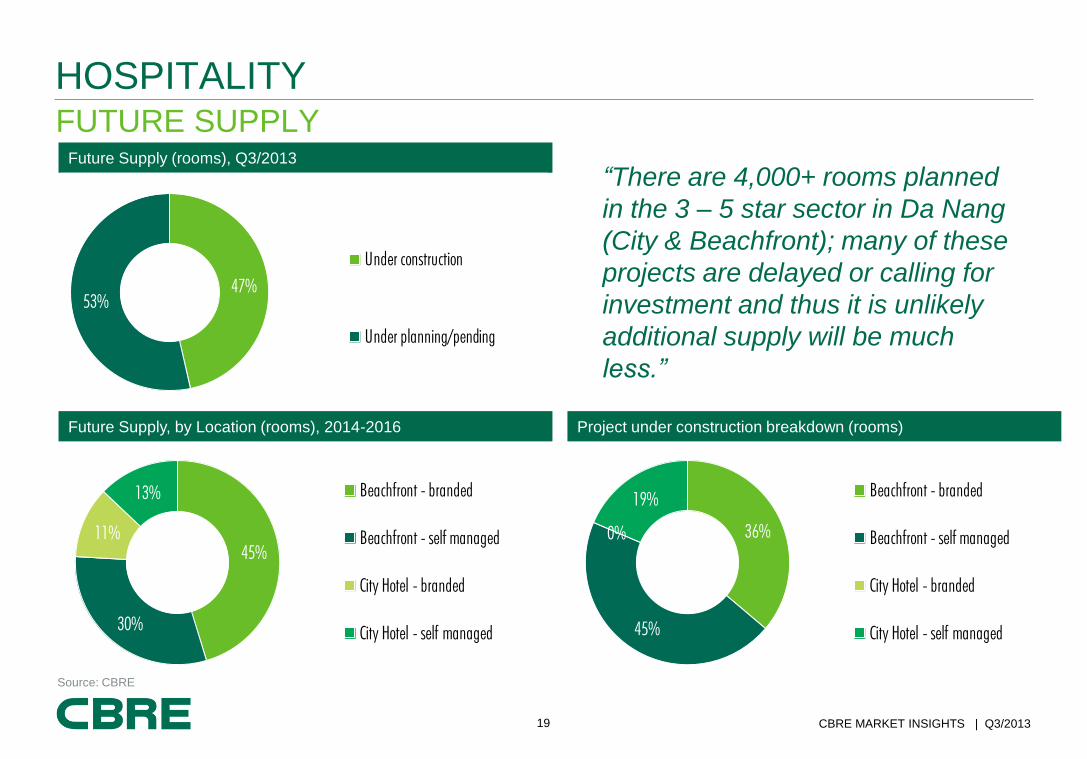
FUTURE SUPPLY
HOSPITALITY
Future Supply (rooms), Q3/2013
Future Supply, by Location (rooms), 2014-2016 Project under construction breakdown (rooms)
47%
53%
Under construction
Under planning/pending
45%
30%
11%
13% Beachfront - branded
Beachfront - self managed
City Hotel - branded
City Hotel - self managed
36%
45%
0%
19%Beachfront - branded
Beachfront - self managed
City Hotel - branded
City Hotel - self managed
Source: CBRE
“There are 4,000+ rooms planned
in the 3 – 5 star sector in Da Nang
(City & Beachfront); many of these
projects are delayed or calling for
investment and thus it is unlikely
additional supply will be much
less.”
20 CBRE MARKET INSIGHTS | Q3/2013
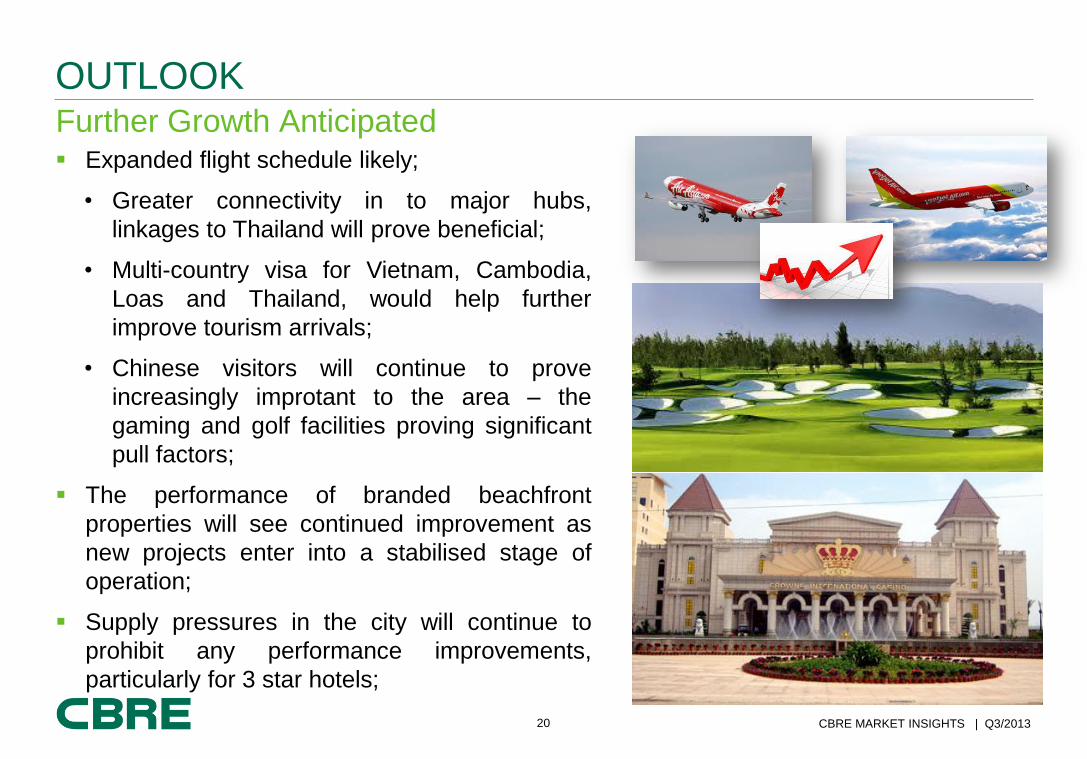
Further Growth Anticipated
OUTLOOK
Expanded flight schedule likely;
• Greater connectivity in to major hubs,
linkages to Thailand will prove beneficial;
• Multi-country visa for Vietnam, Cambodia,
Loas and Thailand, would help further
improve tourism arrivals;
• Chinese visitors will continue to prove
increasingly improtant to the area – the
gaming and golf facilities proving significant
pull factors;
The performance of branded beachfront
properties will see continued improvement as
new projects enter into a stabilised stage of
operation;
Supply pressures in the city will continue to
prohibit any performance improvements,
particularly for 3 star hotels;
RESIDENTIAL MARKET Condominium

22 CBRE MARKET INSIGHTS | Q3/2013
Q3 2013 Snapshot
RESIDENTIAL FOR SALE
Market Indicator Luxury High-end Mid-end Affordable Total
Total launched supply (projects) 3 6 4 2 15
Total launched supply (units) 316 1,240 1,102 429 3,087
New launch (units) 0 0 0 0 0
Average asking price (US$ psm) 2,854 1,648 868 694
Q-o-q change (%) -4.4% -0.4% 0.0% 0.0%
Y-o-y change (%) -4.4% 0.7% -3.5% -2.1%
Source: CBRE
• All prices are quoted exclusive of VAT and service charges.
• “Launched supply”: the total number of units that have been released to the market.
• “New completion”: the total number of units that were completed and started delivering to buyers in the review quarter - these are added to existing supply.
• “New launch”: the number of units that were released to the market by developers (official start of sales for a project) in the review quarter. All units in each development are
included in the calculations, however, the developer may divide sales into numerous phases and thus not all units may come online at launch date.

23 CBRE MARKET INSIGHTS | Q3/2013
Highlights
CONDOMINIUM FOR SALES
• No new supply. The total supply remains at 3,087 apartments.
Supply
• Q3/2013, unsold stock accumulated to 1,469 units, a decrease of 6.0% q-o-q
• Six delayed projects made up 58% (854 units) of total unsold inventory.
• Positive sales activities recorded with sales volumes increasing in two consecutive quarters (Q2 and Q3). All sales made at completed or nearly completed projects
Sales activity
• Apart from Fusion Suites and OceanViews, construction of the other launched projects progressed very slowly during the third quarter. There is no sign of construction activities on 12 future pipeline projects during the quarter;
Construction work
0
400
800
1,200
1,600
2,000
New Launch Unsold
Inventory
Unsold stock from
Paused/delayed
Q1.2013 Q2.2013 Q3.2013
Unsold Inventory
Launch Supply Vs Completion
0
800
1,600
2,400
2009 2010 2011 2012 Q3/2013Q1/13 Q2/13 Q3/13
Launch Supply Completion
24 CBRE MARKET INSIGHTS | Q3/2013
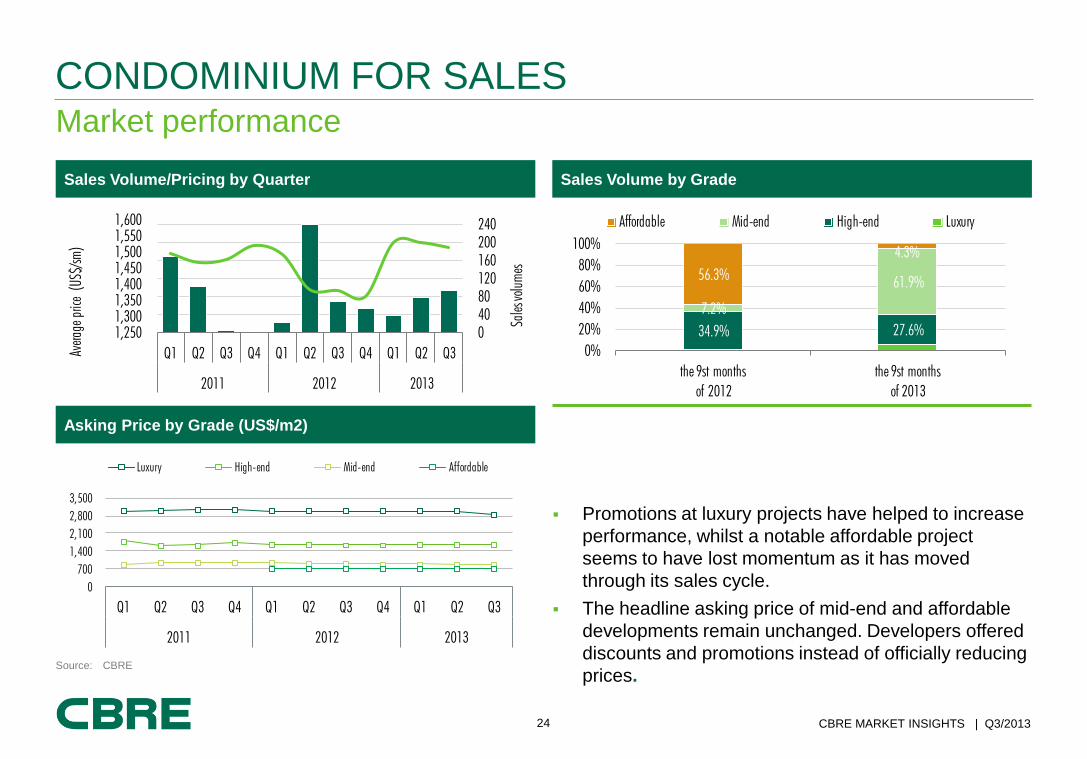
Market performance
CONDOMINIUM FOR SALES
Sales Volume/Pricing by Quarter Sales Volume by Grade
Asking Price by Grade (US$/m2)
Source: CBRE
Promotions at luxury projects have helped to increase
performance, whilst a notable affordable project
seems to have lost momentum as it has moved
through its sales cycle.
The headline asking price of mid-end and affordable
developments remain unchanged. Developers offered
discounts and promotions instead of officially reducing
prices.
1,250
1,300
1,350
1,400
1,450
1,500
1,550
1,600
0
40
80
120
160
200
240
Q1 Q2 Q3 Q4 Q1 Q2 Q3 Q4 Q1 Q2 Q3
2011 2012 2013
Sale
s volu
mes
Avera
ge p
rice
(U
S$/s
m)
0
700
1,400
2,100
2,800
3,500
Q1 Q2 Q3 Q4 Q1 Q2 Q3 Q4 Q1 Q2 Q3
2011 2012 2013
Luxury High-end Mid-end Affordable
34.9% 27.6%
7.2%
61.9%56.3%
4.3%
0%
20%
40%
60%
80%
100%
the 9st months
of 2012
the 9st months
of 2013
Affordable Mid-end High-end Luxury
25 CBRE MARKET INSIGHTS | Q3/2013
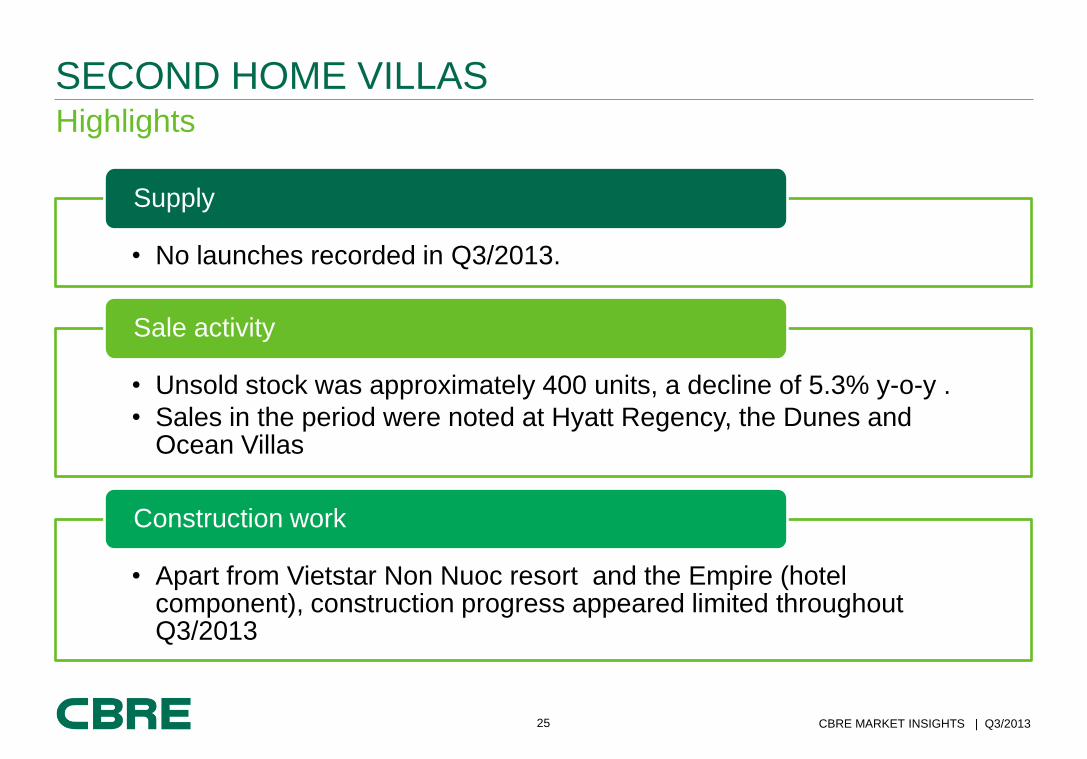
Highlights
SECOND HOME VILLAS
• No launches recorded in Q3/2013.
Supply
• Unsold stock was approximately 400 units, a decline of 5.3% y-o-y .
• Sales in the period were noted at Hyatt Regency, the Dunes and Ocean Villas
Sale activity
• Apart from Vietstar Non Nuoc resort and the Empire (hotel component), construction progress appeared limited throughout Q3/2013
Construction work

26 CBRE MARKET INSIGHTS | Q3/2013
Market performance
SECOND HOME VILLAS
“ As the market has evolved their has been an evolution to the type of product which is on offer
Sales remain slow and steady though there is obvious signs of trading on the secondary
market;
Developers are typically prefer to maintain headline pricing but offer incentives with the sales
package;
”
Launch Price
16%
46%
22%
16%
250.000 - 500.000 501,000 - 900,000
900,000 - 1,500,000 > 1,500,000
0%
20%
40%
60%
80%
100%
2008 2009 2010 2011 2012 2013 YTD
>1,500,000 900,000 - 1,500,000
501,000 - 900,000 250.000 - 500.000
Launch Price by Year

27 CBRE MARKET INSIGHTS | Q3/2013
In the city purchases were mostly made in price range of approximately US$100,000 per unit due to low
investment cost and more potential for buy-to-let.
Condotel concepts which applied the guaranteed return program appears to have captured buyers ‘attention –
notable examples include OceanViews and Fusion Suites, we expect this trend to grow.
Location, price and construction progress remain the central consideration for buyers – the ability to lease units is
also becoming more important.
No significant new launches are expected in the next 2 quarters.
Promotional packages, as oppose to out and out price decreases remain the likely options for developers hoping
to further stimulate the market.
Outlook
RESIDENTIAL MARKET
Azura
339 Tran Hung
Dao Str, Son Tra
Dist.
@$1,575/m2
Da Nang
Lakeside
Ham Nghi Str,
Hai Chau Dist.
@$590/m2
Da Nang Plaza
Nguyen Du Str,
Hai Chau Dist.
@$1,080/m2
Harmony Tower
Pham Van Dong
Str, Son Tra Dist.
@$1,100/m2
Hyatt Regency
Truong Sa Str,
Ngu Hanh Son
Dist.
@$3,716/m2
Fusion Suites
Hoang Sa Str,
Son Tra Dist.
@$1,768/m2
Projects have sale activity in quarter

COMMERCIAL MARKET Office
29 CBRE MARKET INSIGHTS | Q3/2013
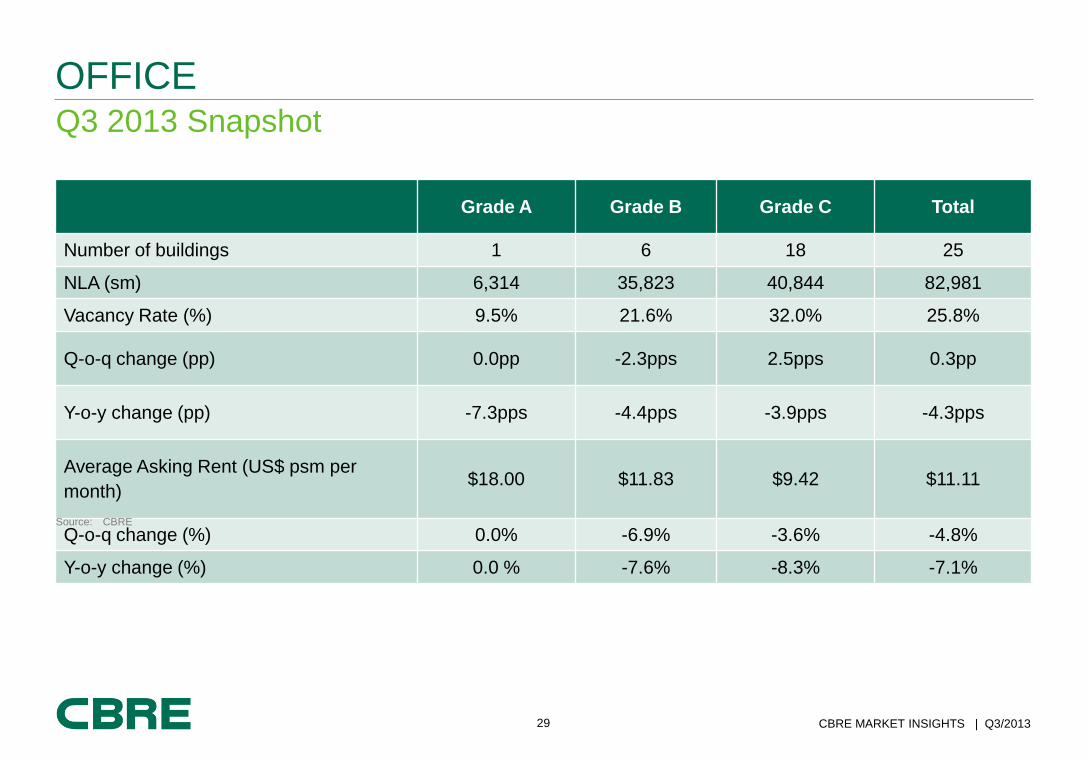
Q3 2013 Snapshot
OFFICE
Grade A Grade B Grade C Total
Number of buildings 1 6 18 25
NLA (sm) 6,314 35,823 40,844 82,981
Vacancy Rate (%) 9.5% 21.6% 32.0% 25.8%
Q-o-q change (pp) 0.0pp -2.3pps 2.5pps 0.3pp
Y-o-y change (pp) -7.3pps -4.4pps -3.9pps -4.3pps
Average Asking Rent (US$ psm per
month) $18.00 $11.83 $9.42 $11.11
Q-o-q change (%) 0.0% -6.9% -3.6% -4.8%
Y-o-y change (%) 0.0 % -7.6% -8.3% -7.1%
Source: CBRE
30 CBRE MARKET INSIGHTS | Q3/2013
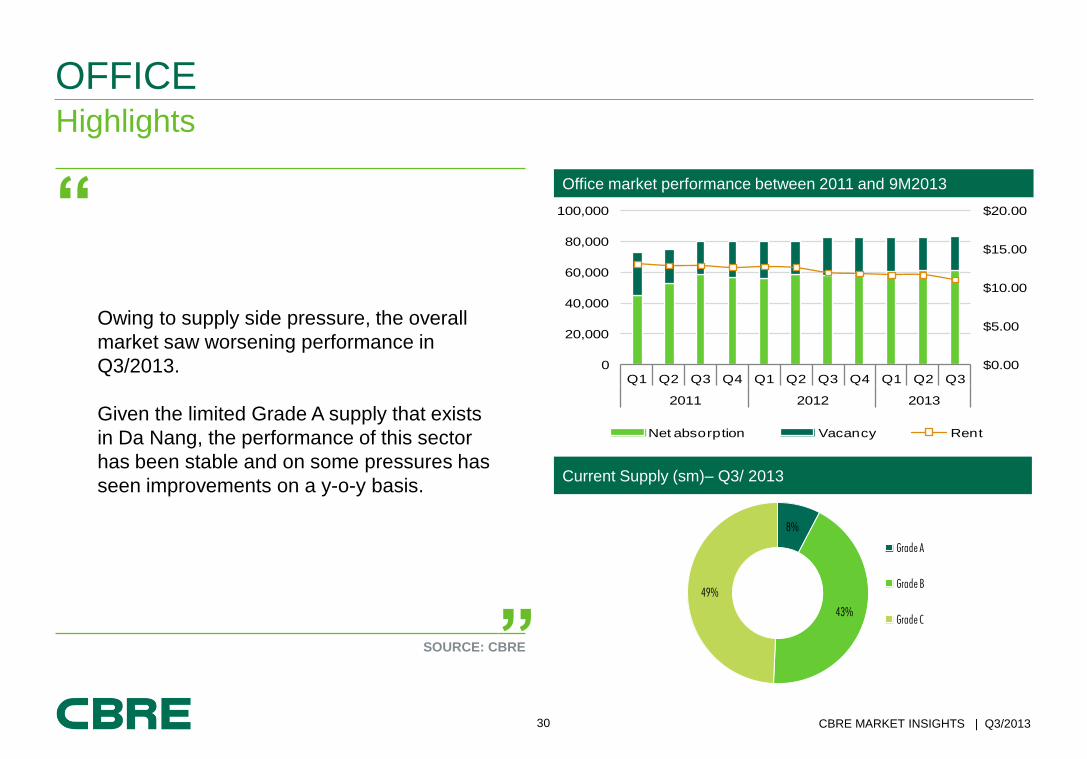
Highlights
OFFICE
“
Owing to supply side pressure, the overall
market saw worsening performance in
Q3/2013.
Given the limited Grade A supply that exists
in Da Nang, the performance of this sector
has been stable and on some pressures has
seen improvements on a y-o-y basis.
” SOURCE: CBRE
Current Supply (sm)– Q3/ 2013
Office market performance between 2011 and 9M2013
$0.00
$5.00
$10.00
$15.00
$20.00
0
20,000
40,000
60,000
80,000
100,000
Q1 Q2 Q3 Q4 Q1 Q2 Q3 Q4 Q1 Q2 Q3
2011 2012 2013
Net absorption Vacancy Rent
8%
43%
49%
Grade A
Grade B
Grade C
31 CBRE MARKET INSIGHTS | Q3/2013
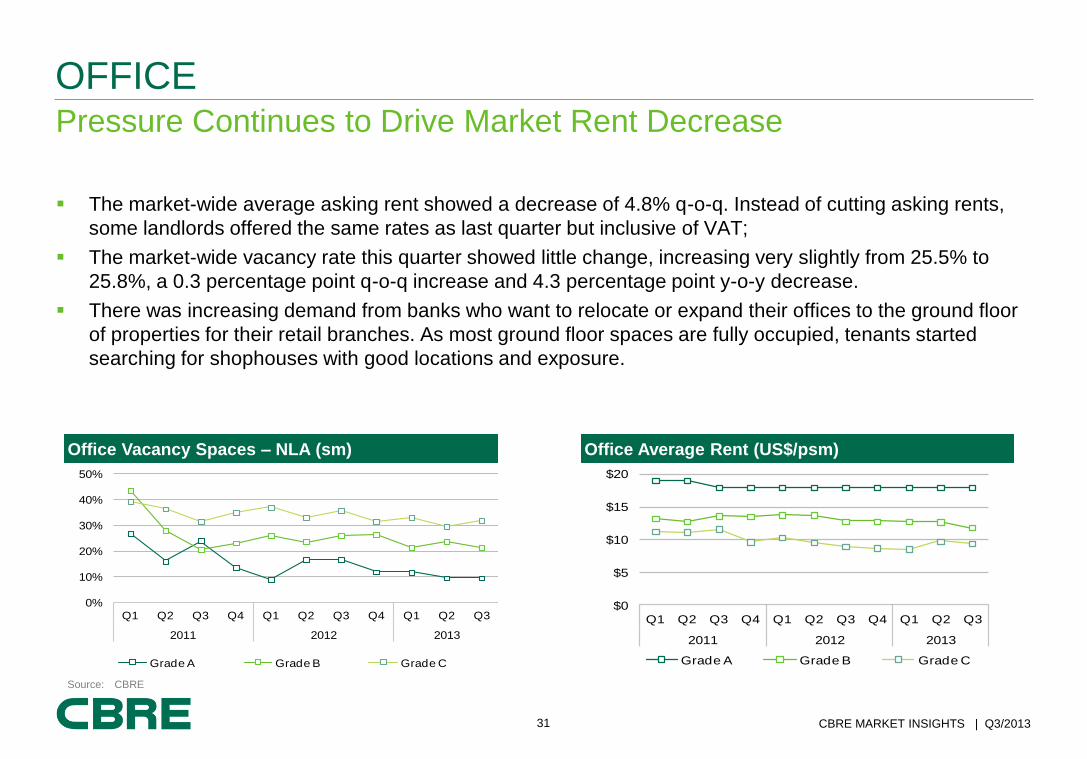
The market-wide average asking rent showed a decrease of 4.8% q-o-q. Instead of cutting asking rents,
some landlords offered the same rates as last quarter but inclusive of VAT;
The market-wide vacancy rate this quarter showed little change, increasing very slightly from 25.5% to
25.8%, a 0.3 percentage point q-o-q increase and 4.3 percentage point y-o-y decrease.
There was increasing demand from banks who want to relocate or expand their offices to the ground floor
of properties for their retail branches. As most ground floor spaces are fully occupied, tenants started
searching for shophouses with good locations and exposure.
Pressure Continues to Drive Market Rent Decrease
OFFICE
Office Vacancy Spaces – NLA (sm) Office Average Rent (US$/psm)
$0
$5
$10
$15
$20
Q1 Q2 Q3 Q4 Q1 Q2 Q3 Q4 Q1 Q2 Q3
2011 2012 2013
Grade A Grade B Grade C
0%
10%
20%
30%
40%
50%
Q1 Q2 Q3 Q4 Q1 Q2 Q3 Q4 Q1 Q2 Q3
2011 2012 2013
Grade A Grade B Grade C
Source: CBRE
32 CBRE MARKET INSIGHTS | Q3/2013
Outlook
OFFICE
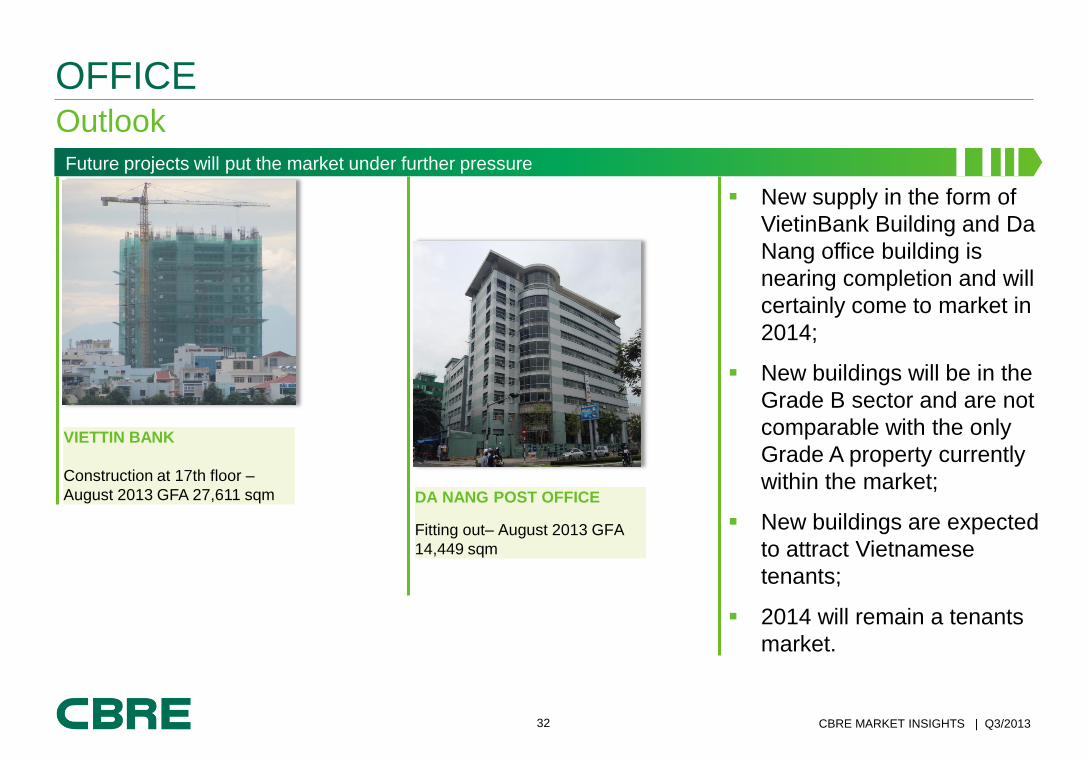
VIETTIN BANK
Construction at 17th floor –
August 2013 GFA 27,611 sqm DA NANG POST OFFICE
Fitting out– August 2013 GFA
14,449 sqm
New supply in the form of
VietinBank Building and Da
Nang office building is
nearing completion and will
certainly come to market in
2014;
New buildings will be in the
Grade B sector and are not
comparable with the only
Grade A property currently
within the market;
New buildings are expected
to attract Vietnamese
tenants;
2014 will remain a tenants
market.
Future projects will put the market under further pressure

CBRE Vietnam – Research & Consulting – Da Nang office T +84.511.2222.111
F +84.511.2222.100
CBRE QUARTERLY REPORT
Available NOW… CBRE offers better-priced sector reports with longer
historical data and In-depth analysis