Embed Size (px)
Citation preview
January 29, 2021 1
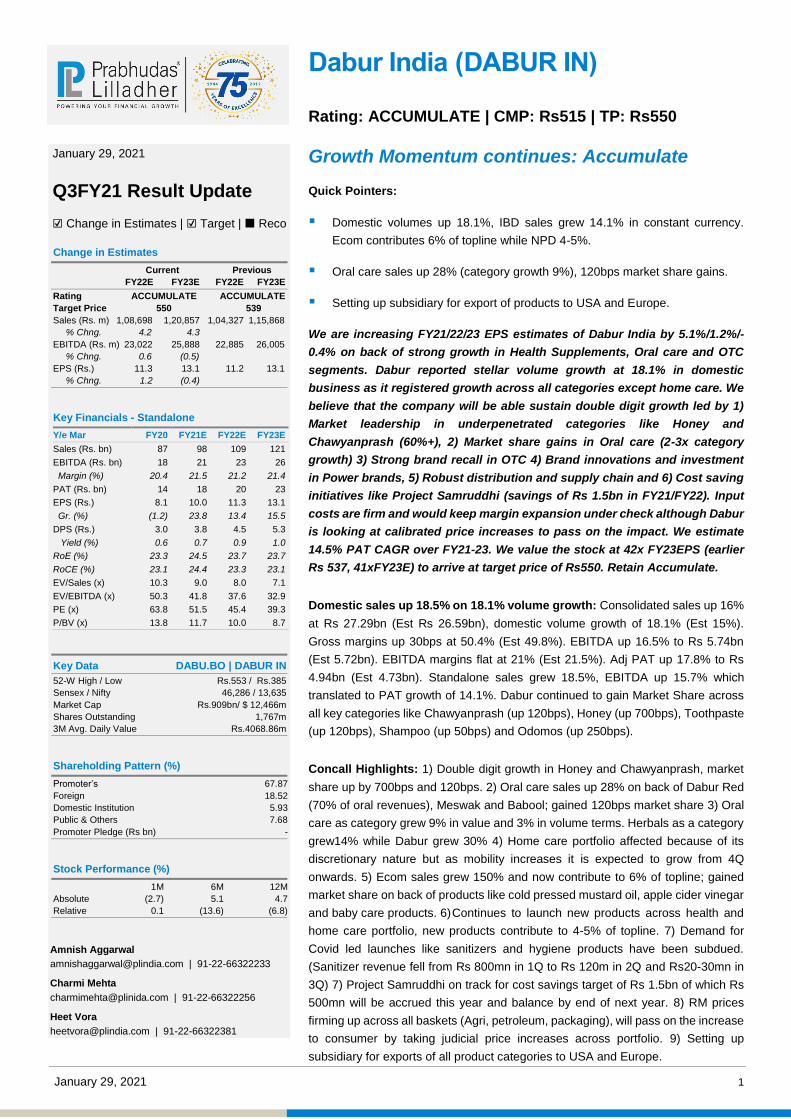
Rating: ACCUMULATE | CMP: Rs515 | TP: Rs550
Growth Momentum continues: Accumulate
Quick Pointers:
Domestic volumes up 18.1%, IBD sales grew 14.1% in constant currency.
Ecom contributes 6% of topline while NPD 4-5%.
Oral care sales up 28% (category growth 9%), 120bps market share gains.
Setting up subsidiary for export of products to USA and Europe.
We are increasing FY21/22/23 EPS estimates of Dabur India by 5.1%/1.2%/-
0.4% on back of strong growth in Health Supplements, Oral care and OTC
segments. Dabur reported stellar volume growth at 18.1% in domestic
business as it registered growth across all categories except home care. We
believe that the company will be able sustain double digit growth led by 1)
Market leadership in underpenetrated categories like Honey and
Chawyanprash (60%+), 2) Market share gains in Oral care (2-3x category
growth) 3) Strong brand recall in OTC 4) Brand innovations and investment
in Power brands, 5) Robust distribution and supply chain and 6) Cost saving
initiatives like Project Samruddhi (savings of Rs 1.5bn in FY21/FY22). Input
costs are firm and would keep margin expansion under check although Dabur
is looking at calibrated price increases to pass on the impact. We estimate
14.5% PAT CAGR over FY21-23. We value the stock at 42x FY23EPS (earlier
Rs 537, 41xFY23E) to arrive at target price of Rs550. Retain Accumulate.
Domestic sales up 18.5% on 18.1% volume growth: Consolidated sales up 16%
at Rs 27.29bn (Est Rs 26.59bn), domestic volume growth of 18.1% (Est 15%).
Gross margins up 30bps at 50.4% (Est 49.8%). EBITDA up 16.5% to Rs 5.74bn
(Est 5.72bn). EBITDA margins flat at 21% (Est 21.5%). Adj PAT up 17.8% to Rs
4.94bn (Est 4.73bn). Standalone sales grew 18.5%, EBITDA up 15.7% which
translated to PAT growth of 14.1%. Dabur continued to gain Market Share across
all key categories like Chawyanprash (up 120bps), Honey (up 700bps), Toothpaste
(up 120bps), Shampoo (up 50bps) and Odomos (up 250bps).
Concall Highlights: 1) Double digit growth in Honey and Chawyanprash, market
share up by 700bps and 120bps. 2) Oral care sales up 28% on back of Dabur Red
(70% of oral revenues), Meswak and Babool; gained 120bps market share 3) Oral
care as category grew 9% in value and 3% in volume terms. Herbals as a category
grew14% while Dabur grew 30% 4) Home care portfolio affected because of its
discretionary nature but as mobility increases it is expected to grow from 4Q
onwards. 5) Ecom sales grew 150% and now contribute to 6% of topline; gained
market share on back of products like cold pressed mustard oil, apple cider vinegar
and baby care products. 6) Continues to launch new products across health and
home care portfolio, new products contribute to 4-5% of topline. 7) Demand for
Covid led launches like sanitizers and hygiene products have been subdued.
(Sanitizer revenue fell from Rs 800mn in 1Q to Rs 120m in 2Q and Rs20-30mn in
3Q) 7) Project Samruddhi on track for cost savings target of Rs 1.5bn of which Rs
500mn will be accrued this year and balance by end of next year. 8) RM prices
firming up across all baskets (Agri, petroleum, packaging), will pass on the increase
to consumer by taking judicial price increases across portfolio. 9) Setting up
subsidiary for exports of all product categories to USA and Europe.
Dabur India (DABUR IN)
January 29, 2021
Q3FY21 Result Update
☑ Change in Estimates | ☑ Target | Reco
Change in Estimates
Current Previous
FY22E FY23E FY22E FY23E
Rating ACCUMULATE ACCUMULATE
Target Price 550 539
Sales (Rs. m) 1,08,698 1,20,857 1,04,327 1,15,868
% Chng. 4.2 4.3
EBITDA (Rs. m) 23,022 25,888 22,885 26,005
% Chng. 0.6 (0.5)
EPS (Rs.) 11.3 13.1 11.2 13.1
% Chng. 1.2 (0.4)
Key Financials - Standalone
Y/e Mar FY20 FY21E FY22E FY23E
Sales (Rs. bn) 87 98 109 121
EBITDA (Rs. bn) 18 21 23 26
Margin (%) 20.4 21.5 21.2 21.4
PAT (Rs. bn) 14 18 20 23
EPS (Rs.) 8.1 10.0 11.3 13.1
Gr. (%) (1.2) 23.8 13.4 15.5
DPS (Rs.) 3.0 3.8 4.5 5.3
Yield (%) 0.6 0.7 0.9 1.0
RoE (%) 23.3 24.5 23.7 23.7
RoCE (%) 23.1 24.4 23.3 23.1
EV/Sales (x) 10.3 9.0 8.0 7.1
EV/EBITDA (x) 50.3 41.8 37.6 32.9
PE (x) 63.8 51.5 45.4 39.3
P/BV (x) 13.8 11.7 10.0 8.7
Key Data DABU.BO | DABUR IN
52-W High / Low Rs.553 / Rs.385
Sensex / Nifty 46,286 / 13,635
Market Cap Rs.909bn/ $ 12,466m
Shares Outstanding 1,767m
3M Avg. Daily Value Rs.4068.86m
Shareholding Pattern (%)
Promoter’s 67.87
Foreign 18.52
Domestic Institution 5.93
Public & Others 7.68
Promoter Pledge (Rs bn) -
Stock Performance (%)
1M 6M 12M
Absolute (2.7) 5.1 4.7
Relative 0.1 (13.6) (6.8)
Amnish Aggarwal
[email protected] | 91-22-66322233
Charmi Mehta
[email protected] | 91-22-66322256
Heet Vora
[email protected] | 91-22-66322381
Dabur India
January 29, 2021 2
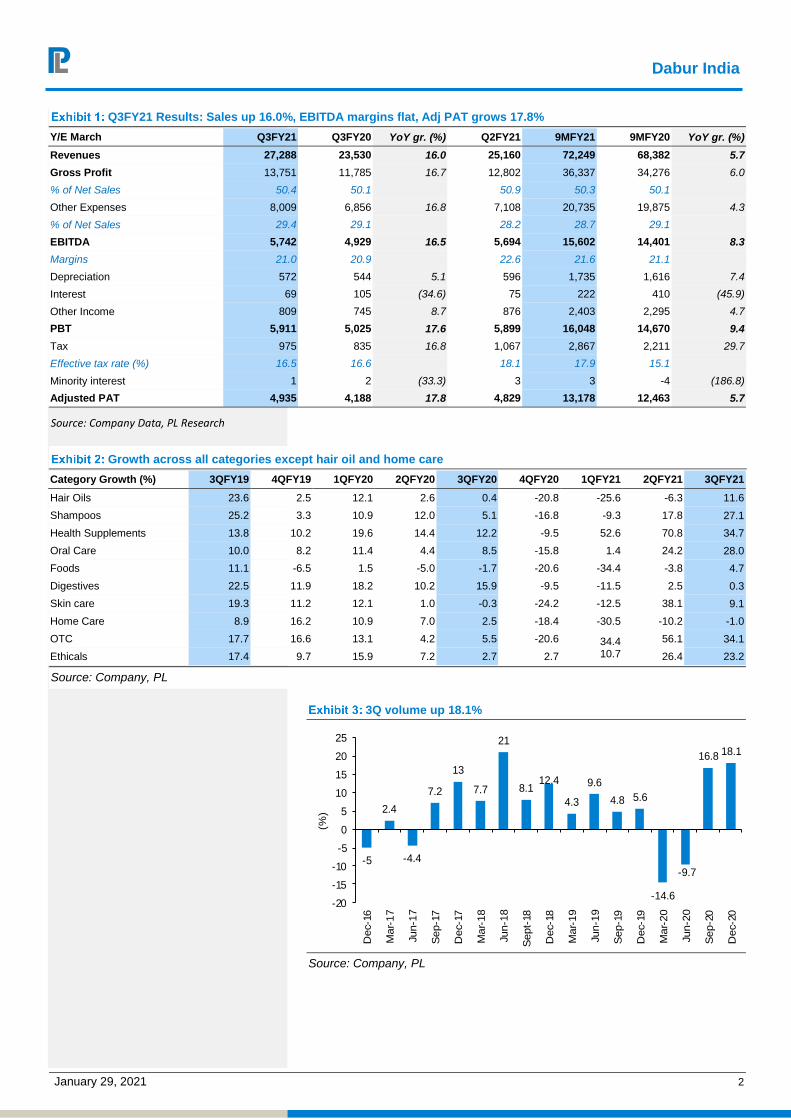
Q3FY21 Results: Sales up 16.0%, EBITDA margins flat, Adj PAT grows 17.8%
Y/E March Q3FY21 Q3FY20 YoY gr. (%) Q2FY21 9MFY21 9MFY20 YoY gr. (%)
Revenues 27,288 23,530 16.0 25,160 72,249 68,382 5.7
Gross Profit 13,751 11,785 16.7 12,802 36,337 34,276 6.0
% of Net Sales 50.4 50.1 50.9 50.3 50.1
Other Expenses 8,009 6,856 16.8 7,108 20,735 19,875 4.3
% of Net Sales 29.4 29.1 28.2 28.7 29.1
EBITDA 5,742 4,929 16.5 5,694 15,602 14,401 8.3
Margins 21.0 20.9 22.6 21.6 21.1
Depreciation 572 544 5.1 596 1,735 1,616 7.4
Interest 69 105 (34.6) 75 222 410 (45.9)
Other Income 809 745 8.7 876 2,403 2,295 4.7
PBT 5,911 5,025 17.6 5,899 16,048 14,670 9.4
Tax 975 835 16.8 1,067 2,867 2,211 29.7
Effective tax rate (%) 16.5 16.6 18.1 17.9 15.1
Minority interest 1 2 (33.3) 3 3 -4 (186.8)
Adjusted PAT 4,935 4,188 17.8 4,829 13,178 12,463 5.7
Source: Company Data, PL Research
Growth across all categories except hair oil and home care
Category Growth (%) 3QFY19 4QFY19 1QFY20 2QFY20 3QFY20 4QFY20 1QFY21 2QFY21 3QFY21
Hair Oils 23.6 2.5 12.1 2.6 0.4 -20.8 -25.6 -6.3 11.6
Shampoos 25.2 3.3 10.9 12.0 5.1 -16.8 -9.3 17.8 27.1
Health Supplements 13.8 10.2 19.6 14.4 12.2 -9.5 52.6 70.8 34.7
Oral Care 10.0 8.2 11.4 4.4 8.5 -15.8 1.4 24.2 28.0
Foods 11.1 -6.5 1.5 -5.0 -1.7 -20.6 -34.4 -3.8 4.7
Digestives 22.5 11.9 18.2 10.2 15.9 -9.5 -11.5 2.5 0.3
Skin care 19.3 11.2 12.1 1.0 -0.3 -24.2 -12.5 38.1 9.1
Home Care 8.9 16.2 10.9 7.0 2.5 -18.4 -30.5 -10.2 -1.0
OTC 17.7 16.6 13.1 4.2 5.5 -20.6 34.4 10.7
56.1 34.1
Ethicals 17.4 9.7 15.9 7.2 2.7 2.7 26.4 23.2
Source: Company, PL
3Q volume up 18.1%
Source: Company, PL
-5
2.4
-4.4
7.2
13
7.7
21
8.112.4
4.3
9.6
4.8 5.6
-14.6
-9.7
16.8 18.1
-20
-15
-10
-5
0
5
10
15
20
25
Dec-1
6
Mar-
17
Jun-1
7
Sep-1
7
Dec-1
7
Mar-
18
Jun-1
8
Sept-
18
Dec-1
8
Mar-
19
Jun-1
9
Sep-1
9
Dec-1
9
Mar-
20
Jun-2
0
Sep-2
0
Dec-2
0
(%)

Dabur India
January 29, 2021 3
Premium variants launched in Honey, Vinegar and OTC healthcare
Source: Company, PL
Dabur’s oral care aggression continues to pay off
Source: Company, PL
Hair care launches coincide with category growth uptick
Source: Company, PL
Dabur India
January 29, 2021 4
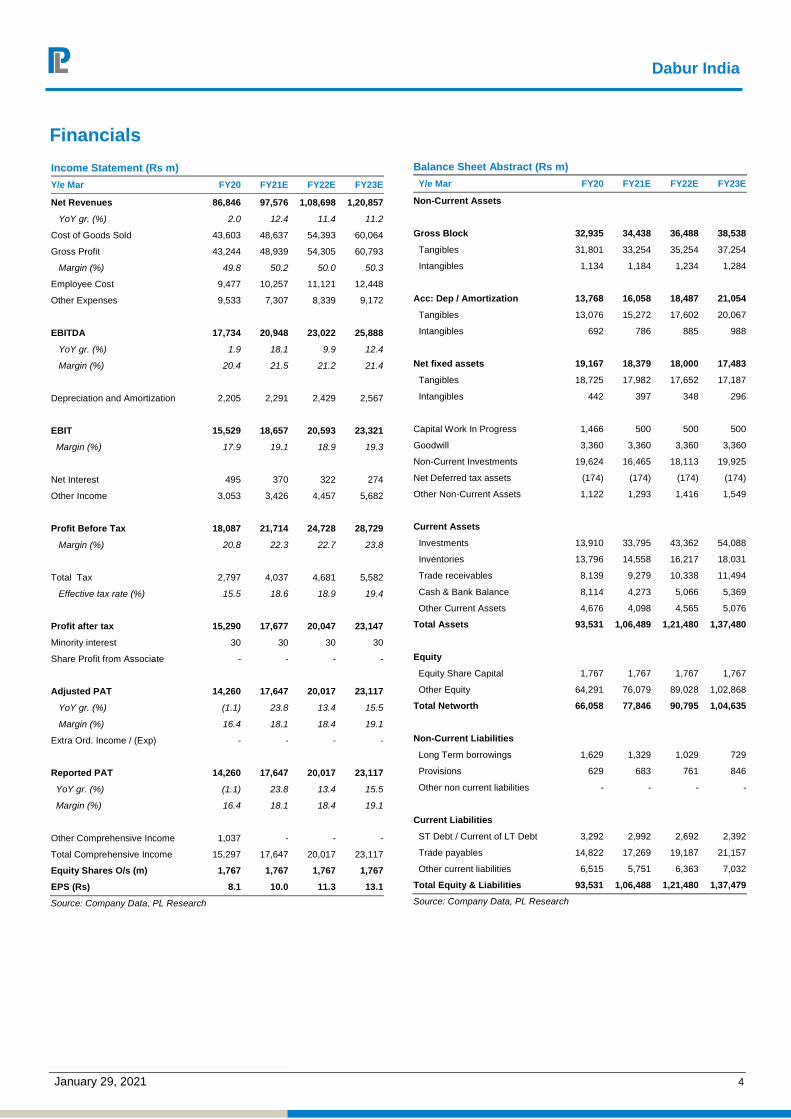
Financials
Income Statement (Rs m)
Y/e Mar FY20 FY21E FY22E FY23E
Net Revenues 86,846 97,576 1,08,698 1,20,857
YoY gr. (%) 2.0 12.4 11.4 11.2
Cost of Goods Sold 43,603 48,637 54,393 60,064
Gross Profit 43,244 48,939 54,305 60,793
Margin (%) 49.8 50.2 50.0 50.3
Employee Cost 9,477 10,257 11,121 12,448
Other Expenses 9,533 7,307 8,339 9,172
EBITDA 17,734 20,948 23,022 25,888
YoY gr. (%) 1.9 18.1 9.9 12.4
Margin (%) 20.4 21.5 21.2 21.4
Depreciation and Amortization 2,205 2,291 2,429 2,567
EBIT 15,529 18,657 20,593 23,321
Margin (%) 17.9 19.1 18.9 19.3
Net Interest 495 370 322 274
Other Income 3,053 3,426 4,457 5,682
Profit Before Tax 18,087 21,714 24,728 28,729
Margin (%) 20.8 22.3 22.7 23.8
Total Tax 2,797 4,037 4,681 5,582
Effective tax rate (%) 15.5 18.6 18.9 19.4
Profit after tax 15,290 17,677 20,047 23,147
Minority interest 30 30 30 30
Share Profit from Associate - - - -
Adjusted PAT 14,260 17,647 20,017 23,117
YoY gr. (%) (1.1) 23.8 13.4 15.5
Margin (%) 16.4 18.1 18.4 19.1
Extra Ord. Income / (Exp) - - - -
Reported PAT 14,260 17,647 20,017 23,117
YoY gr. (%) (1.1) 23.8 13.4 15.5
Margin (%) 16.4 18.1 18.4 19.1
Other Comprehensive Income 1,037 - - -
Total Comprehensive Income 15,297 17,647 20,017 23,117
Equity Shares O/s (m) 1,767 1,767 1,767 1,767
EPS (Rs) 8.1 10.0 11.3 13.1
Source: Company Data, PL Research
Balance Sheet Abstract (Rs m)
Y/e Mar FY20 FY21E FY22E FY23E
Non-Current Assets
Gross Block 32,935 34,438 36,488 38,538
Tangibles 31,801 33,254 35,254 37,254
Intangibles 1,134 1,184 1,234 1,284
Acc: Dep / Amortization 13,768 16,058 18,487 21,054
Tangibles 13,076 15,272 17,602 20,067
Intangibles 692 786 885 988
Net fixed assets 19,167 18,379 18,000 17,483
Tangibles 18,725 17,982 17,652 17,187
Intangibles 442 397 348 296
Capital Work In Progress 1,466 500 500 500
Goodwill 3,360 3,360 3,360 3,360
Non-Current Investments 19,624 16,465 18,113 19,925
Net Deferred tax assets (174) (174) (174) (174)
Other Non-Current Assets 1,122 1,293 1,416 1,549
Current Assets
Investments 13,910 33,795 43,362 54,088
Inventories 13,796 14,558 16,217 18,031
Trade receivables 8,139 9,279 10,338 11,494
Cash & Bank Balance 8,114 4,273 5,066 5,369
Other Current Assets 4,676 4,098 4,565 5,076
Total Assets 93,531 1,06,489 1,21,480 1,37,480
Equity
Equity Share Capital 1,767 1,767 1,767 1,767
Other Equity 64,291 76,079 89,028 1,02,868
Total Networth 66,058 77,846 90,795 1,04,635
Non-Current Liabilities
Long Term borrowings 1,629 1,329 1,029 729
Provisions 629 683 761 846
Other non current liabilities - - - -
Current Liabilities
ST Debt / Current of LT Debt 3,292 2,992 2,692 2,392
Trade payables 14,822 17,269 19,187 21,157
Other current liabilities 6,515 5,751 6,363 7,032
Total Equity & Liabilities 93,531 1,06,488 1,21,480 1,37,479
Source: Company Data, PL Research
Dabur India
January 29, 2021 5
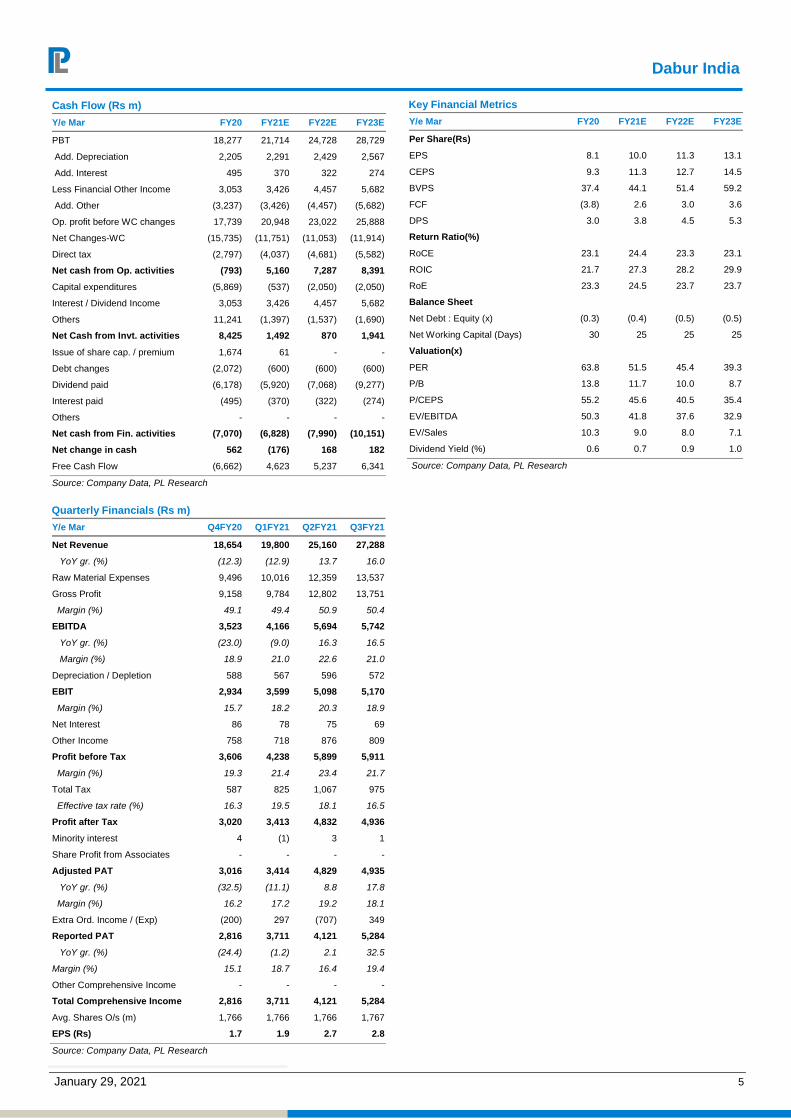
Cash Flow (Rs m)
Y/e Mar FY20 FY21E FY22E FY23E Year
PBT 18,277 21,714 24,728 28,729
Add. Depreciation 2,205 2,291 2,429 2,567
Add. Interest 495 370 322 274
Less Financial Other Income 3,053 3,426 4,457 5,682
Add. Other (3,237) (3,426) (4,457) (5,682)
Op. profit before WC changes 17,739 20,948 23,022 25,888
Net Changes-WC (15,735) (11,751) (11,053) (11,914)
Direct tax (2,797) (4,037) (4,681) (5,582)
Net cash from Op. activities (793) 5,160 7,287 8,391
Capital expenditures (5,869) (537) (2,050) (2,050)
Interest / Dividend Income 3,053 3,426 4,457 5,682
Others 11,241 (1,397) (1,537) (1,690)
Net Cash from Invt. activities 8,425 1,492 870 1,941
Issue of share cap. / premium 1,674 61 - -
Debt changes (2,072) (600) (600) (600)
Dividend paid (6,178) (5,920) (7,068) (9,277)
Interest paid (495) (370) (322) (274)
Others - - - -
Net cash from Fin. activities (7,070) (6,828) (7,990) (10,151)
Net change in cash 562 (176) 168 182
Free Cash Flow (6,662) 4,623 5,237 6,341
Source: Company Data, PL Research
Quarterly Financials (Rs m)
Y/e Mar Q4FY20 Q1FY21 Q2FY21 Q3FY21
Net Revenue 18,654 19,800 25,160 27,288
YoY gr. (%) (12.3) (12.9) 13.7 16.0
Raw Material Expenses 9,496 10,016 12,359 13,537
Gross Profit 9,158 9,784 12,802 13,751
Margin (%) 49.1 49.4 50.9 50.4
EBITDA 3,523 4,166 5,694 5,742
YoY gr. (%) (23.0) (9.0) 16.3 16.5
Margin (%) 18.9 21.0 22.6 21.0
Depreciation / Depletion 588 567 596 572
EBIT 2,934 3,599 5,098 5,170
Margin (%) 15.7 18.2 20.3 18.9
Net Interest 86 78 75 69
Other Income 758 718 876 809
Profit before Tax 3,606 4,238 5,899 5,911
Margin (%) 19.3 21.4 23.4 21.7
Total Tax 587 825 1,067 975
Effective tax rate (%) 16.3 19.5 18.1 16.5
Profit after Tax 3,020 3,413 4,832 4,936
Minority interest 4 (1) 3 1
Share Profit from Associates - - - -
Adjusted PAT 3,016 3,414 4,829 4,935
YoY gr. (%) (32.5) (11.1) 8.8 17.8
Margin (%) 16.2 17.2 19.2 18.1
Extra Ord. Income / (Exp) (200) 297 (707) 349
Reported PAT 2,816 3,711 4,121 5,284
YoY gr. (%) (24.4) (1.2) 2.1 32.5
Margin (%) 15.1 18.7 16.4 19.4
Other Comprehensive Income - - - -
Total Comprehensive Income 2,816 3,711 4,121 5,284
Avg. Shares O/s (m) 1,766 1,766 1,766 1,767
EPS (Rs) 1.7 1.9 2.7 2.8
Source: Company Data, PL Research
Key Financial Metrics
Y/e Mar FY20 FY21E FY22E FY23E
Per Share(Rs)
EPS 8.1 10.0 11.3 13.1
CEPS 9.3 11.3 12.7 14.5
BVPS 37.4 44.1 51.4 59.2
FCF (3.8) 2.6 3.0 3.6
DPS 3.0 3.8 4.5 5.3
Return Ratio(%)
RoCE 23.1 24.4 23.3 23.1
ROIC 21.7 27.3 28.2 29.9
RoE 23.3 24.5 23.7 23.7
Balance Sheet
Net Debt : Equity (x) (0.3) (0.4) (0.5) (0.5)
Net Working Capital (Days) 30 25 25 25
Valuation(x)
PER 63.8 51.5 45.4 39.3
P/B 13.8 11.7 10.0 8.7
P/CEPS 55.2 45.6 40.5 35.4
EV/EBITDA 50.3 41.8 37.6 32.9
EV/Sales 10.3 9.0 8.0 7.1
Dividend Yield (%) 0.6 0.7 0.9 1.0
Source: Company Data, PL Research
Dabur India
January 29, 2021 6
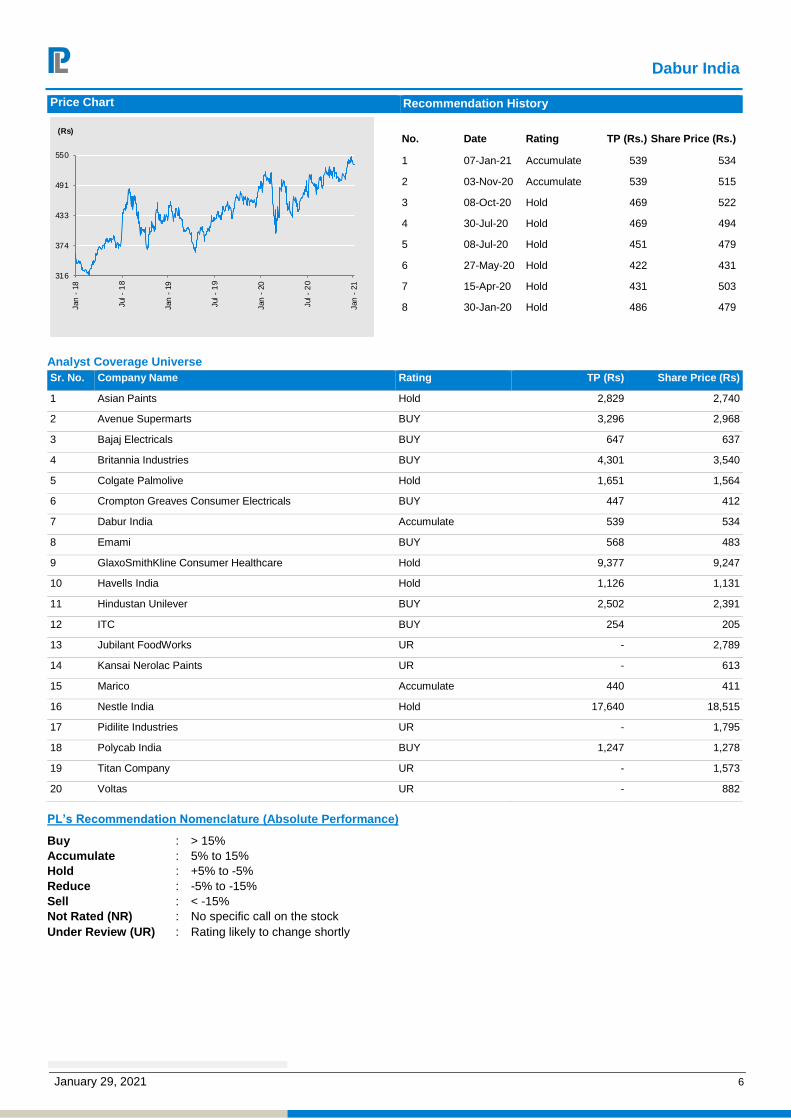
Price Chart Recommendation History
No. Date Rating TP (Rs.) Share Price (Rs.)
1 07-Jan-21 Accumulate 539 534
2 03-Nov-20 Accumulate 539 515
3 08-Oct-20 Hold 469 522
4 30-Jul-20 Hold 469 494
5 08-Jul-20 Hold 451 479
6 27-May-20 Hold 422 431
7 15-Apr-20 Hold 431 503
8 30-Jan-20 Hold 486 479
Analyst Coverage Universe
Sr. No. Company Name Rating TP (Rs) Share Price (Rs)
1 Asian Paints Hold 2,829 2,740
2 Avenue Supermarts BUY 3,296 2,968
3 Bajaj Electricals BUY 647 637
4 Britannia Industries BUY 4,301 3,540
5 Colgate Palmolive Hold 1,651 1,564
6 Crompton Greaves Consumer Electricals BUY 447 412
7 Dabur India Accumulate 539 534
8 Emami BUY 568 483
9 GlaxoSmithKline Consumer Healthcare Hold 9,377 9,247
10 Havells India Hold 1,126 1,131
11 Hindustan Unilever BUY 2,502 2,391
12 ITC BUY 254 205
13 Jubilant FoodWorks UR - 2,789
14 Kansai Nerolac Paints UR - 613
15 Marico Accumulate 440 411
16 Nestle India Hold 17,640 18,515
17 Pidilite Industries UR - 1,795
18 Polycab India BUY 1,247 1,278
19 Titan Company UR - 1,573
20 Voltas UR - 882
PL’s Recommendation Nomenclature (Absolute Performance)
Buy : > 15%
Accumulate : 5% to 15%
Hold : +5% to -5%
Reduce : -5% to -15%
Sell : < -15%
Not Rated (NR) : No specific call on the stock
Under Review (UR) : Rating likely to change shortly
316
374
433
491
550
Jan
- 1
8
Jul -
18
Jan
- 1
9
Jul -
19
Jan
- 2
0
Jul -
20
Jan
- 2
1
(Rs)
Dabur India
January 29, 2021 7
ANALYST CERTIFICATION
(Indian Clients)
We/I, Mr. Amnish Aggarwal- MBA, CFA, Ms. Charmi Mehta- CA, Mr. Heet Vora- CA Research Analysts, authors and the names subscribed to this report, hereby certify that all of the views expressed in this research report accurately reflect our views about the subject issuer(s) or securities. We also certify that no part of our compensation was, is, or will be directly or indirectly related to the specific recommendation(s) or view(s) in this report.
(US Clients)
The research analysts, with respect to each issuer and its securities covered by them in this research report, certify that: All of the views expressed in this research report accurately reflect his or her or their personal views about all of the issuers and their securities; and No part of his or her or their compensation was, is or will be directly related to the specific recommendation or views expressed in this research report.
DISCLAIMER
Indian Clients
Prabhudas Lilladher Pvt. Ltd, Mumbai, India (hereinafter referred to as “PL”) is engaged in the business of Stock Broking, Portfolio Manager, Depository Participant and distribution for third party financial products. PL is a subsidiary of Prabhudas Lilladher Advisory Services Pvt Ltd. which has its various subsidiaries engaged in business of commodity broking, investment banking, financial services (margin funding) and distribution of third party financial/other products, details in respect of which are available at www.plindia.com.
This document has been prepared by the Research Division of PL and is meant for use by the recipient only as information and is not for circulation. This document is not to be reported or copied or made available to others without prior permission of PL. It should not be considered or taken as an offer to sell or a solicitation to buy or sell any security.
The information contained in this report has been obtained from sources that are considered to be reliable. However, PL has not independently verified the accuracy or completeness of the same. Neither PL nor any of its affiliates, its directors or its employees accepts any responsibility of whatsoever nature for the information, statements and opinion given, made available or expressed herein or for any omission therein.
Recipients of this report should be aware that past performance is not necessarily a guide to future performance and value of investments can go down as well. The suitability or otherwise of any investments will depend upon the recipient's particular circumstances and, in case of doubt, advice should be sought from an independent expert/advisor.
Either PL or its affiliates or its directors or its employees or its representatives or its clients or their relatives may have position(s), make market, act as principal or engage in transactions of securities of companies referred to in this report and they may have used the research material prior to publication.
PL may from time to time solicit or perform investment banking or other services for any company mentioned in this document.
PL is in the process of applying for certificate of registration as Research Analyst under Securities and Exchange Board of India (Research Analysts) Regulations, 2014
PL submits that no material disciplinary action has been taken on us by any Regulatory Authority impacting Equity Research Analysis activities.
PL or its research analysts or its associates or his relatives do not have any financial interest in the subject company.
PL or its research analysts or its associates or his relatives do not have actual/beneficial ownership of one per cent or more securities of the subject company at the end of the month immediately preceding the date of publication of the research report.
PL or its research analysts or its associates or his relatives do not have any material conflict of interest at the time of publication of the research report.
PL or its associates might have received compensation from the subject company in the past twelve months.
PL or its associates might have managed or co-managed public offering of securities for the subject company in the past twelve months or mandated by the subject company for any other assignment in the past twelve months.
PL or its associates might have received any compensation for investment banking or merchant banking or brokerage services from the subject company in the past twelve months.
PL or its associates might have received any compensation for products or services other than investment banking or merchant banking or brokerage services from the subject company in the past twelve months
PL or its associates might have received any compensation or other benefits from the subject company or third party in connection with the research report.
PL encourages independence in research report preparation and strives to minimize conflict in preparation of research report. PL or its analysts did not receive any compensation or other benefits from the subject Company or third party in connection with the preparation of the research report. PL or its Research Analysts do not have any material conflict of interest at the time of publication of this report.
It is confirmed that Mr. Amnish Aggarwal- MBA, CFA, Ms. Charmi Mehta- CA, Mr. Heet Vora- CA Research Analysts of this report have not received any compensation from the companies mentioned in the report in the preceding twelve months
Compensation of our Research Analysts is not based on any specific merchant banking, investment banking or brokerage service transactions.
The Research analysts for this report certifies that all of the views expressed in this report accurately reflect his or her personal views about the subject company or companies and its or their securities, and no part of his or her compensation was, is or will be, directly or indirectly related to specific recommendations or views expressed in this report.
The research analysts for this report has not served as an officer, director or employee of the subject company PL or its research analysts have not engaged in market making activity for the subject company
Our sales people, traders, and other professionals or affiliates may provide oral or written market commentary or trading strategies to our clients that reflect opinions that are contrary to the opinions expressed herein, and our proprietary trading and investing businesses may make investment decisions that are inconsistent with the recommendations expressed herein. In reviewing these materials, you should be aware that any or all of the foregoing, among other things, may give rise to real or potential conflicts of interest.
PL and its associates, their directors and employees may (a) from time to time, have a long or short position in, and buy or sell the securities of the subject company or (b) be engaged in any other transaction involving such securities and earn brokerage or other compensation or act as a market maker in the financial instruments of the subject company or act as an advisor or lender/borrower to the subject company or may have any other potential conflict of interests with respect to any recommendation and other related information and opinions.
US Clients
This research report is a product of Prabhudas Lilladher Pvt. Ltd., which is the employer of the research analyst(s) who has prepared the research report. The research analyst(s) preparing the research report is/are resident outside the United States (U.S.) and are not associated persons of any U.S. regulated broker-dealer and therefore the analyst(s) is/are not subject to supervision by a U.S. broker-dealer, and is/are not required to satisfy the regulatory licensing requirements of FINRA or required to otherwise comply with U.S. rules or regulations regarding, among other things, communications with a subject company, public appearances and trading securities held by a research analyst account.
This report is intended for distribution by Prabhudas Lilladher Pvt. Ltd. only to "Major Institutional Investors" as defined by Rule 15a-6(b)(4) of the U.S. Securities and Exchange Act, 1934 (the Exchange Act) and interpretations thereof by U.S. Securities and Exchange Commission (SEC) in reliance on Rule 15a 6(a)(2). If the recipient of this report is not a Major Institutional Investor as specified above, then it should not act upon this report and return the same to the sender. Further, this report may not be copied, duplicated and/or transmitted onward to any U.S. person, which is not the Major Institutional Investor.
In reliance on the exemption from registration provided by Rule 15a-6 of the Exchange Act and interpretations thereof by the SEC in order to conduct certain business with Major Institutional Investors, Prabhudas Lilladher Pvt. Ltd. has entered into an agreement with a U.S. registered broker-dealer, Marco Polo Securities Inc. ("Marco Polo").
Transactions in securities discussed in this research report should be effected through Marco Polo or another U.S. registered broker dealer.
Prabhudas Lilladher Pvt. Ltd. 3rd Floor, Sadhana House, 570, P. B. Marg, Worli, Mumbai-400 018, India | Tel: (91 22) 6632 2222 Fax: (91 22) 6632 2209
www.plindia.com