Embed Size (px)
DESCRIPTION
Epic Research is a leading financial services provider with presence in Indian and other global capital markets. Provides Stock Tips, Forex Tips, Currency Tips, Commodity Tips, MCX Tips, Equity Tips, Tips, Intraday Tips, NSE Tips, BSE Tips, COMEX Tips, PCG Pack NCDEX Tips and Free Stock Tips. We provide services in equity, commodity and Forex market.
Citation preview
www.epicresearch.co +91 9752199966
HEADLINES
Cardamom down marginally in futures trade on
sluggish demand.
Cardamom prices were down 0.27 per cent per kg in futures
market, largely in line with a weak trend in spot markets due
to sluggish demand at higher levels. Adequate stocks position
following increased arrivals from producing regions also
influenced cardamom rates. At the Multi Commodity
Exchange, cardamom for delivery in February declined by Rs
2.90, or 0.27 per cent in business turnover of 152 lots.
Pepper rises on winter demand; turmeric falls
Pepper futures rose, tracking firm spot cues where winter
demand supported prices while lesser stocks also aided the
upside. The most-active February pepper contract on the
National Commodity and Derivatives Exchange (NCDEX) was
up 1.52 percent. Winter buying is supporting prices but higher
output expectations are seen capping a sharp upside.
EXPERT OPINION
STOCK S1 S2 R1 R2
CHANA 3879 3823 3971 4034
RM SEED 4151 4102 4251 4298
SOYABEAN 3159 3121 3256 3312
JEERA 14420 14290 14620 14790
Trading tip:
Buy Jeera Apr
Above 14540
TGTS-14600/14700
SL- 14450
Buy Mentha oil Jan
Above 1387
TGTS-1395/1405
SL-1380

PRODUCT NAME
EXP DATE OPEN HIGH LOW CLOSE LTP CHG PERCENTAGE CHANGE
CHANA 7/19/2012 4556 4573 4525 4560 4532 -28 -0.61
CHILLI 7/19/2012 5060 5060 5018 5120 5018 -102 -1.99
GUR 7/19/2012 1188 1188 1178 1183.5 1178 -5.5 -0.46
JEERA 7/19/2012 14955 14960 14650 15052.5 14800 -252.5 -1.68
KAPAS 7/19/2012 1044 1053 1035 1049 1041 -8 -0.76
PEPPER 7/19/2012 42300 42555 42250 42390 42435 45 0.11
REF SOYA 7/19/2012 780.5 783.6 777.4 782.85 781.3 -1.55 -0.2
SOY BEAN 7/19/2012 4309 4330 4265.5 4303 4315 12 0.28
TURMERIC 7/19/2012 4600 4676 4518 4664 4540 -124 -2.66
WHEAT 7/19/2012 1251 1282 1251 1246 1282 36 2.89
www.epicresearch.co +91 9752199966
DAILY MARKET STATISTICS
PRODUCT NAME
EXP DATE OPEN HIGH LOW CLOSE LTP CHANGE PERCENTAGE
CHANGE
Chana 18-Jan-13 3970 3972 3927 3951 3928 -23 -0.58
Chilli 20-Mar-13 6240 6276 6202 6272 6248 -24 -0.38
Gur 18-Jan-13 1083.5 1084.5 1076.5 1086 1080.5 -5.5 -0.51
Jeera 20-Mar-13 14380 14572.5 14340 14405 14492.5 87.5 0.61
Kapas 28-Feb-13 926 926 919.5 934 919.5 -14.5 -1.55
Pepper 20-Feb-13 35070 35640 34800 34910 35305 395 1.13
Ref Soya Oil
18-Jan-13 704.15 708.4 702.8 703.25 706.5 3.25 0.46
Soy Bean 18-Jan-13 3231 3231 3191 3207 3210 3 0.09
Turmeric 19-Apr-13 6774 6820 6700 6774 6710 -64 -0.94
Wheat New
18-Jan-13 1593 1593 1572 1587 1572 -15 -0.95
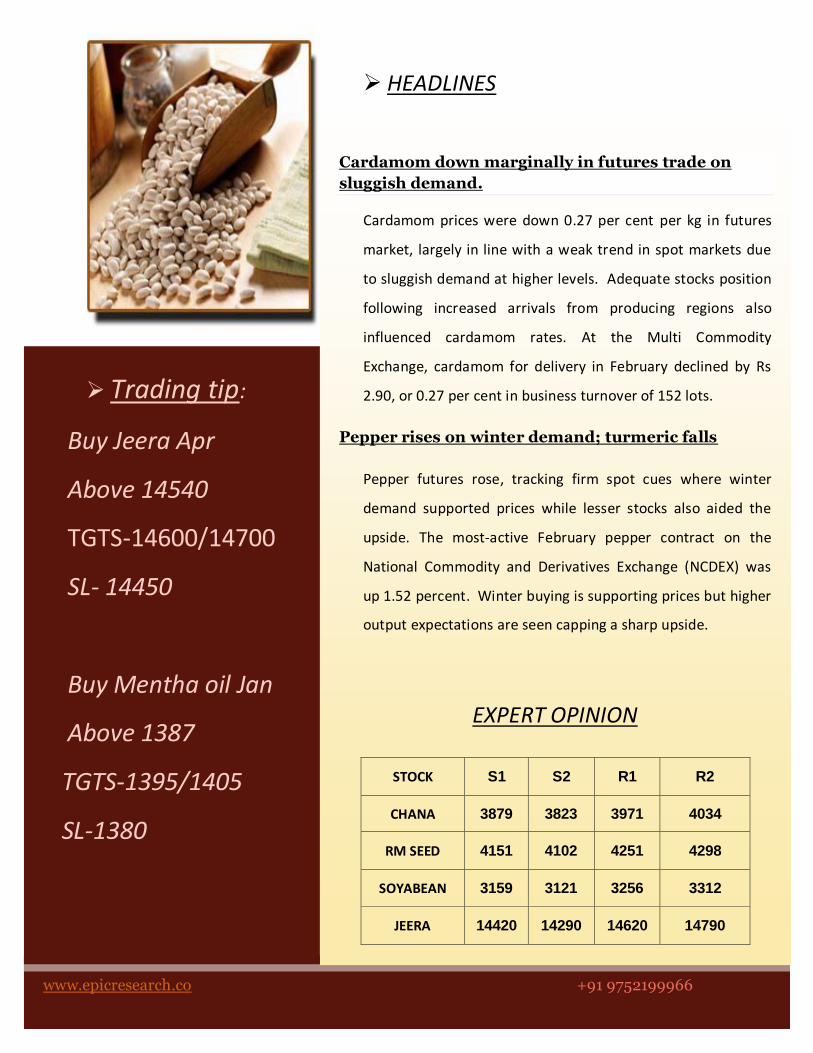
DAILY SOYABEAN CHART
ANALYSIS
OPEN: 3231
HIGH: 3231
LOW: 3191
CLOSE: 3210
SOYABEAN LOOKS SIDEWAYS
TREND: CONSOLIDATE
STRATEGY: SELL ON RISE
www.epicresearch.co +91 9752199966

DAILY CHANA CHART
ANALYSIS
OPEN: 3966
HIGH: 3972
LOW: 3927
CLOSE: 3928
CHANA LOOKS UPWARD
TREND: BULLISH
STRATEGY: BUY ON DIPS
www.epicresearch.co +91 9752199966

Disclaimer
The information and views in this report, our website & all the service we provide are believed to be reliable, but we do not accept any responsibility (or liability) for errors of fact or opinion. Users have the right to choose the product/s that suits them the most.
Sincere efforts have been made to present the right investment perspective. The information contained herein is based on analysis and up on sources that we consider reliable.
This material is for personal information and based upon it & takes no responsibility
The information given herein should be treated as only factor, while making investment decision. The report does not provide individually tailor-made investment advice. Epic research recommends that investors independently evaluate particular investments and strategies, and encourages investors to seek the advice of a financial adviser. Epic research shall not be responsible for any transaction conducted based on the information given in this report, which is in violation of rules and regulations of NSE and BSE.
The share price projections shown are not necessarily indicative of future price performance. The information herein, together with all estimates and forecasts, can change without notice. Analyst or any person related to epic research might be holding positions in the stocks recommended. It is understood that anyone who is browsing through the site has done so at his free will and does not read any views expressed as a recommendation for which either the site or its owners or anyone can be held responsible for . Any surfing and reading of the information is the acceptance of this disclaimer.
All Rights Reserved.
Investment in equity & bullion market has its own risks.
We, however, do not vouch for the accuracy or the completeness thereof. we are not responsible for any loss incurred whatsoever for any financial profits or loss which may arise from the recommendations above epic research does not purport to be an invitation or an offer to buy or sell any financial instrument. Our Clients (Paid Or Unpaid), Any third party or anyone else have no rights to forward or share our calls or SMS or Report or Any Information Provided by us to/with anyone which is received directly or indirectly by them. If found so then Serious Legal Actions can be taken.
www.epicresearch.co +91 9752199966