Embed Size (px)
DESCRIPTION
Daily Individual Person Trips in New Jersey & USA: A Synthesis. by Alain L. Kornhauser, PhD Professor, Operations Research & Financial Engineering Director, Program in Transportation Faculty Chair, PAVE (Princeton Autonomous Vehicle Engineering) Princeton University Presented at - PowerPoint PPT Presentation
Citation preview
by
Alain L. Kornhauser, PhDProfessor, Operations Research & Financial Engineering
Director, Program in Transportation Faculty Chair, PAVE (Princeton Autonomous Vehicle Engineering)
Princeton University
Presented at
PAVE – Summer WorkshopPrinceton, NJAugust 4-6, 2014
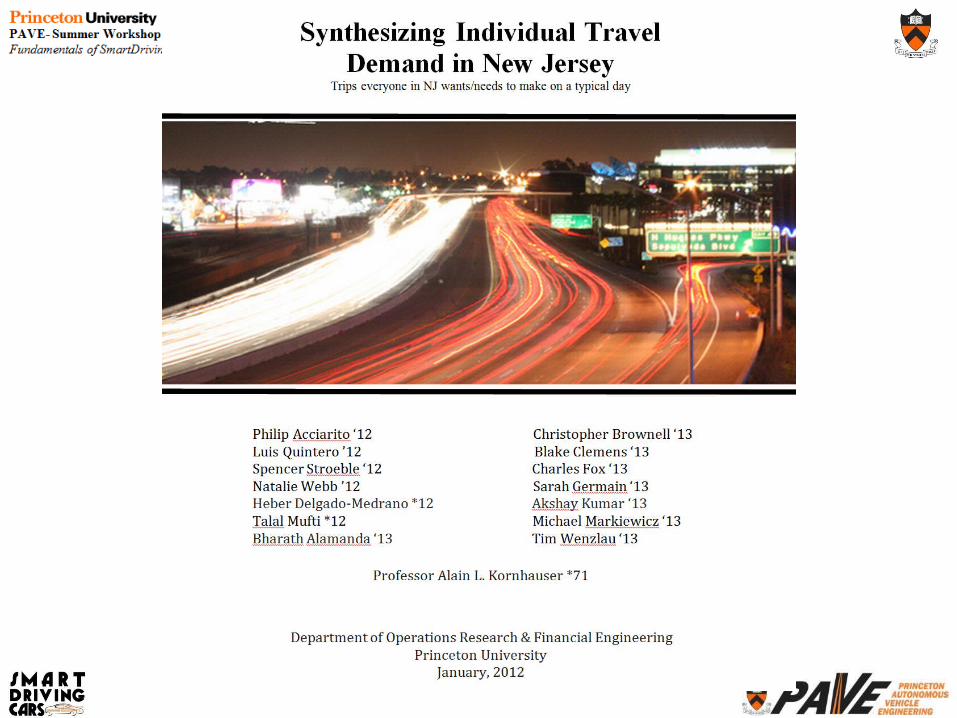
Daily Individual Person Trips in New Jersey & USA:
A Synthesis
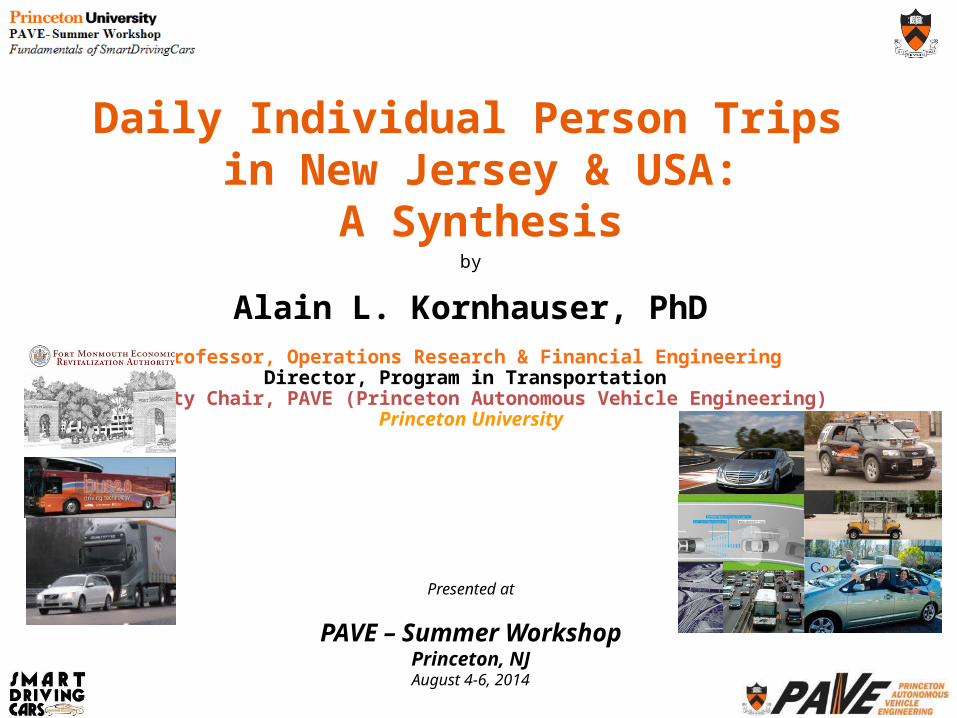
Most every day…
• Almost 9 Million NJ residents • 0.25 Million of out of state commuters• Make 30+ Million trips • Throughout the 8,700 sq miles of NJ• Where/when do they start?• Where do they go? • Does anyone know???– I certainly don’t
• Not to sufficient precision for credible analysis
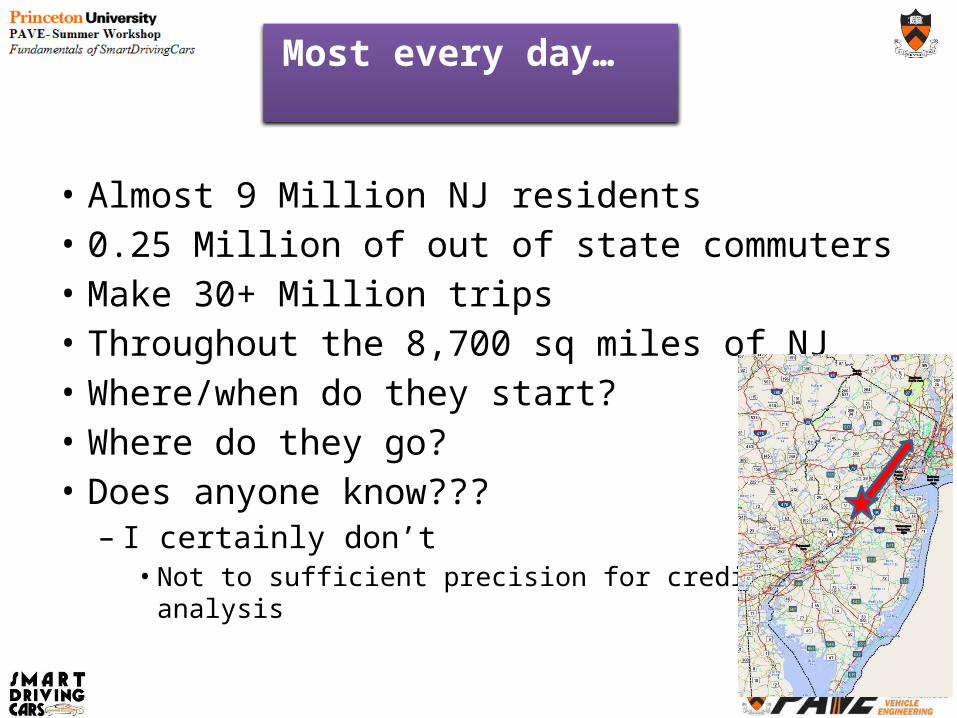
• I’ve harvested one of the largest troves of GPS tracks – Literally billions of individual trips, – Unfortunately, they are spread throughout the western
world, throughout the last decade. – Consequently, I have only a very small ad hoc sample of
what happens in NJ on a typical day.
I’ve Tried…
Why do I want to know every trip?
• Academic Curiosity• If offered an alternative, which ones would likely “buy
it” and what are the implications.• More specifically:– If an alternative transport system were available, which
trips would be diverted to it and what operational requirements would those trip impose on the new system?
• In the end… – a transport system serves individual decision makers. It’s
patronage is an ensemble of individuals, – I would prefer analyzing each individual trip patronage
opportunity.
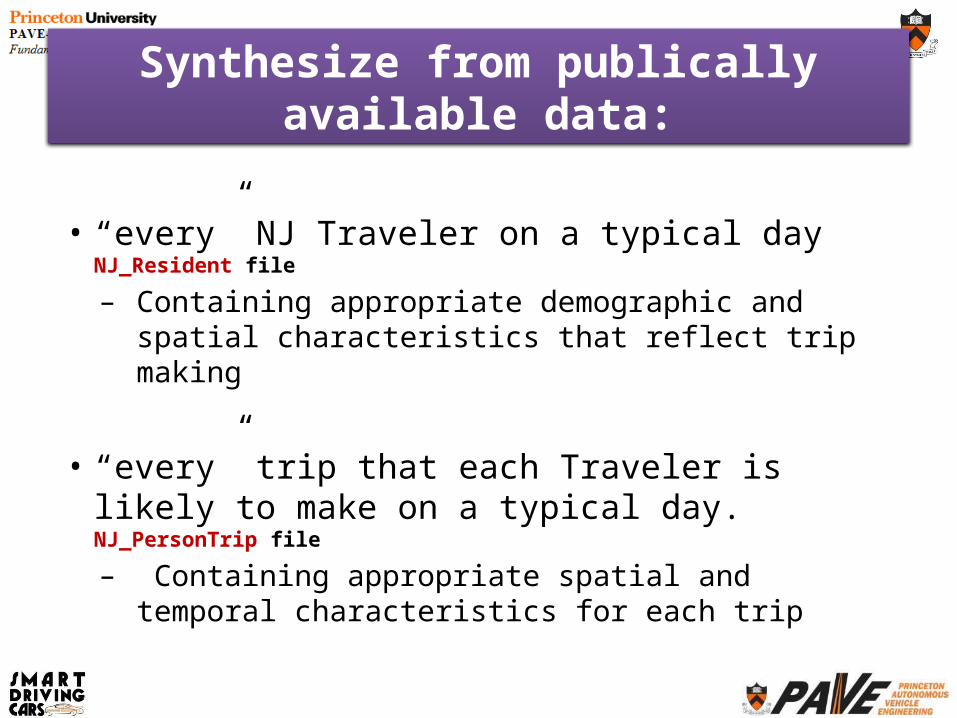
Synthesize from publically available data:
• “every” NJ Traveler on a typical day NJ_Resident file
– Containing appropriate demographic and spatial characteristics that reflect trip making
• “every” trip that each Traveler is likely to make on a typical day. NJ_PersonTrip file
– Containing appropriate spatial and temporal characteristics for each trip
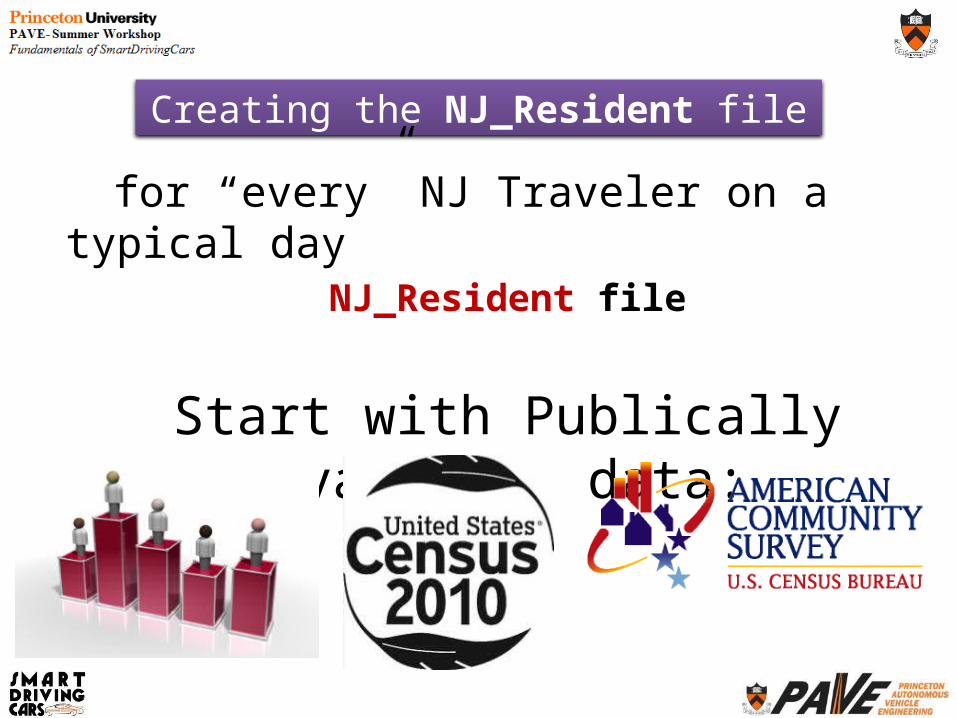
Creating the NJ_Resident file
for “every” NJ Traveler on a typical dayNJ_Resident file
Start with Publically available data:
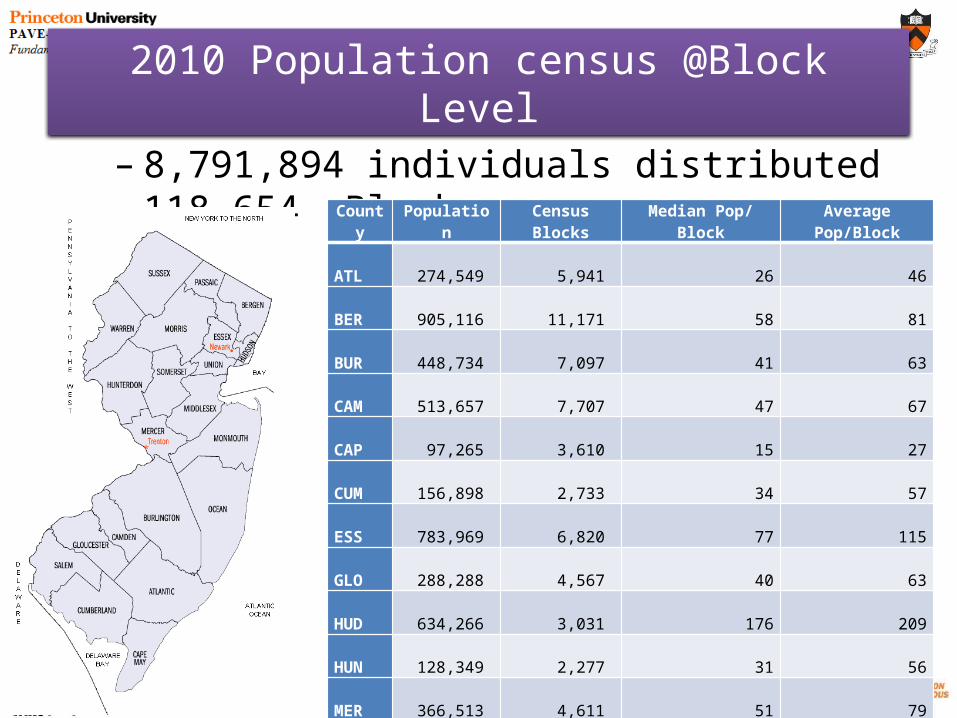
2010 Population census @Block Level
– 8,791,894 individuals distributed 118,654 Blocks.County Population Census Blocks Median Pop/ Block Average Pop/BlockATL 274,549 5,941 26 46BER 905,116 11,171 58 81BUR 448,734 7,097 41 63CAM 513,657 7,707 47 67CAP 97,265 3,610 15 27CUM 156,898 2,733 34 57ESS 783,969 6,820 77 115GLO 288,288 4,567 40 63HUD 634,266 3,031 176 209HUN 128,349 2,277 31 56MER 366,513 4,611 51 79MID 809,858 9,845 50 82MON 630,380 10,067 39 63MOR 492,276 6,543 45 75OCE 576,567 10,457 31 55PAS 501,226 4,966 65 101SAL 66,083 1,665 26 40SOM 323,444 3,836 51 84SUS 149,265 2,998 28 50UNI 536,499 6,139 61 87WAR 108,692 2,573 23 42Total 8,791,894 118,654 74.1
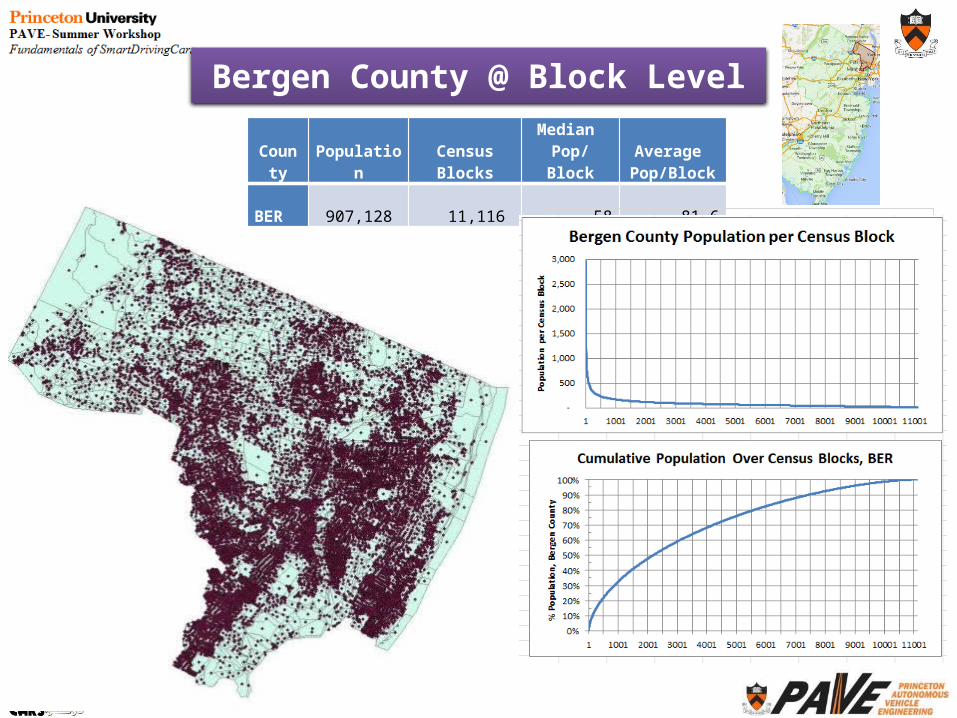
Bergen County @ Block LevelCounty Population Census Blocks
Median Pop/ Block
Average Pop/Block
BER 907,128 11,116 58 81.6
Bergen County Population per Census Block
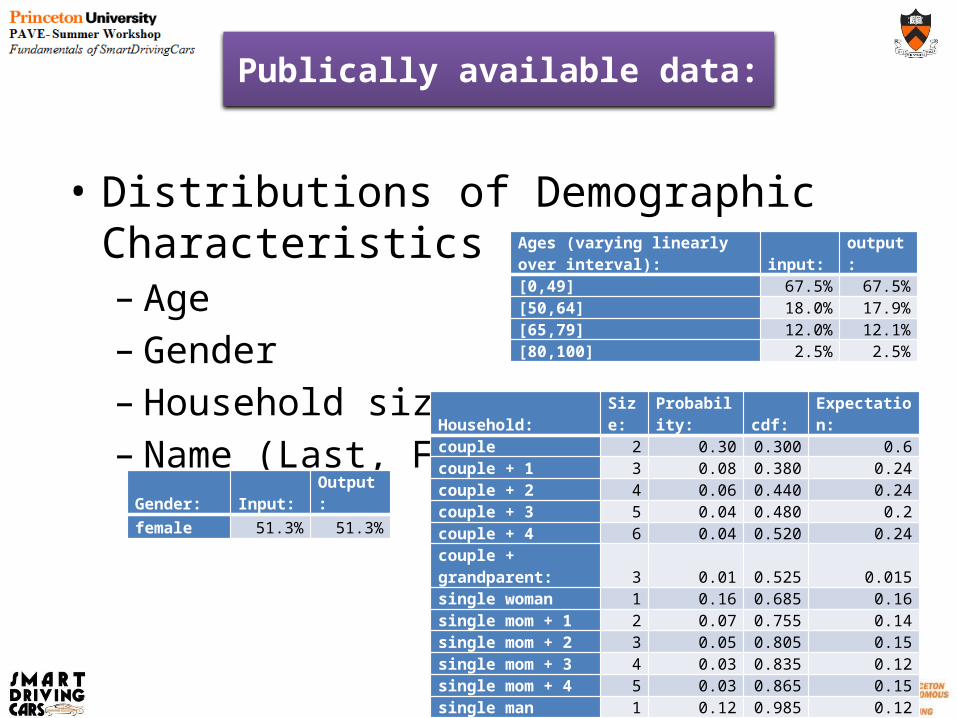
Publically available data:
• Distributions of Demographic Characteristics– Age– Gender– Household size– Name (Last, First)
Ages (varying linearly over interval): input: output:[0,49] 67.5% 67.5%[50,64] 18.0% 17.9%[65,79] 12.0% 12.1%[80,100] 2.5% 2.5%
Gender: Input: Output:female 51.3% 51.3%
Household: Size: Probability: cdf: Expectation:couple 2 0.30 0.300 0.6couple + 1 3 0.08 0.380 0.24couple + 2 4 0.06 0.440 0.24couple + 3 5 0.04 0.480 0.2couple + 4 6 0.04 0.520 0.24couple + grandparent: 3 0.01 0.525 0.015single woman 1 0.16 0.685 0.16single mom + 1 2 0.07 0.755 0.14single mom + 2 3 0.05 0.805 0.15single mom + 3 4 0.03 0.835 0.12single mom + 4 5 0.03 0.865 0.15single man 1 0.12 0.985 0.12single dad + 1 2 0.01 0.990 0.01single dad + 2 3 0.005 0.995 0.015single dad + 3 4 0.005 1.000 0.02 2.42
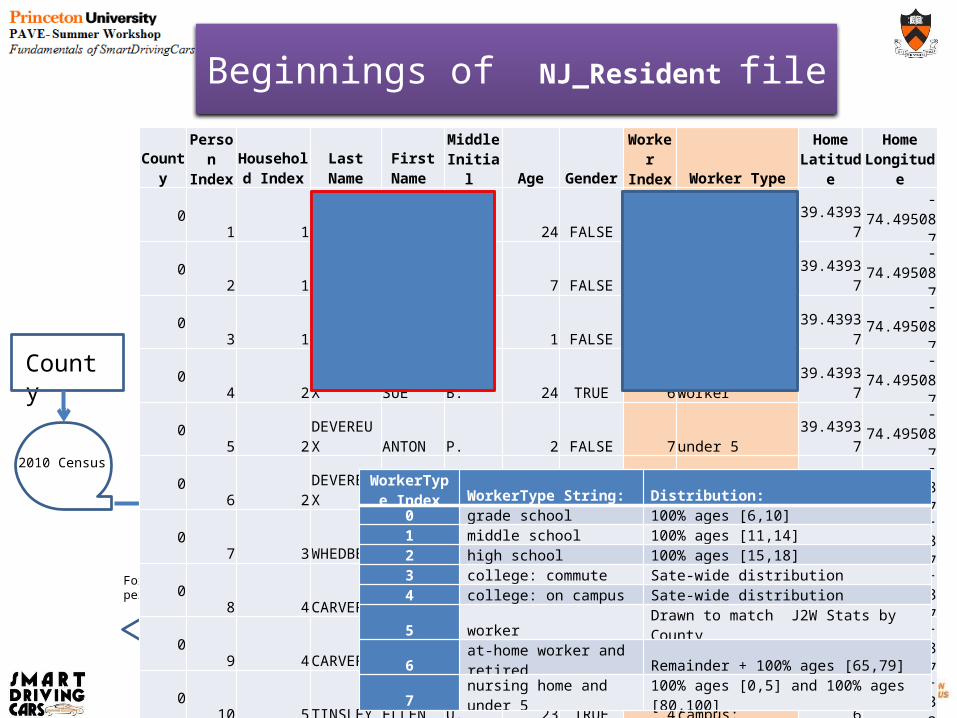
Beginnings of NJ_Resident file
County
2010 Census
# People,Lat, Lon,
For each person
Vital Stats RandomDraw:
Age, M/F, WorkerType,
Task 1
CountyPerson Index
Household Index Last Name
First Name
Middle Initial Age Gender
Worker Index Worker Type
Home Latitude
Home Longitude
0 1 1 PREVILLE RICHARD G. 24 FALSE 5 worker 39.43937 -74.4950870 2 1 PREVILLE JACK J. 7 FALSE 0 grade School 39.43937 -74.4950870 3 1 PREVILLE CHARLES X. 1 FALSE 7 under 5 39.43937 -74.4950870 4 2 DEVEREUX SUE B. 24 TRUE 6 at-home-worker 39.43937 -74.4950870 5 2 DEVEREUX ANTON P. 2 FALSE 7 under 5 39.43937 -74.4950870 6 2 DEVEREUX KATIE S. 6 TRUE 0 grade School 39.43937 -74.4950870 7 3 WHEDBEE LINDA C. 26 TRUE 6 at-home-worker 39.43937 -74.4950870 8 4 CARVER ROBERT Z. 24 FALSE 5 worker 39.43937 -74.4950870 9 4 CARVER JENNIFER P. 25 TRUE 6 at-home-worker 39.43937 -74.4950870 10 5 TINSLEY ELLEN U. 23 TRUE 4 college on campus: 40.85646 -74.197833
WorkerType Index WorkerType String: Distribution:
0 grade school 100% ages [6,10]1 middle school 100% ages [11,14]2 high school 100% ages [15,18]3 college: commute Sate-wide distribution4 college: on campus Sate-wide distribution5 worker Drawn to match J2W Stats by County6 at-home worker and retired Remainder + 100% ages [65,79]7 nursing home and under 5 100% ages [0,5] and 100% ages [80,100]
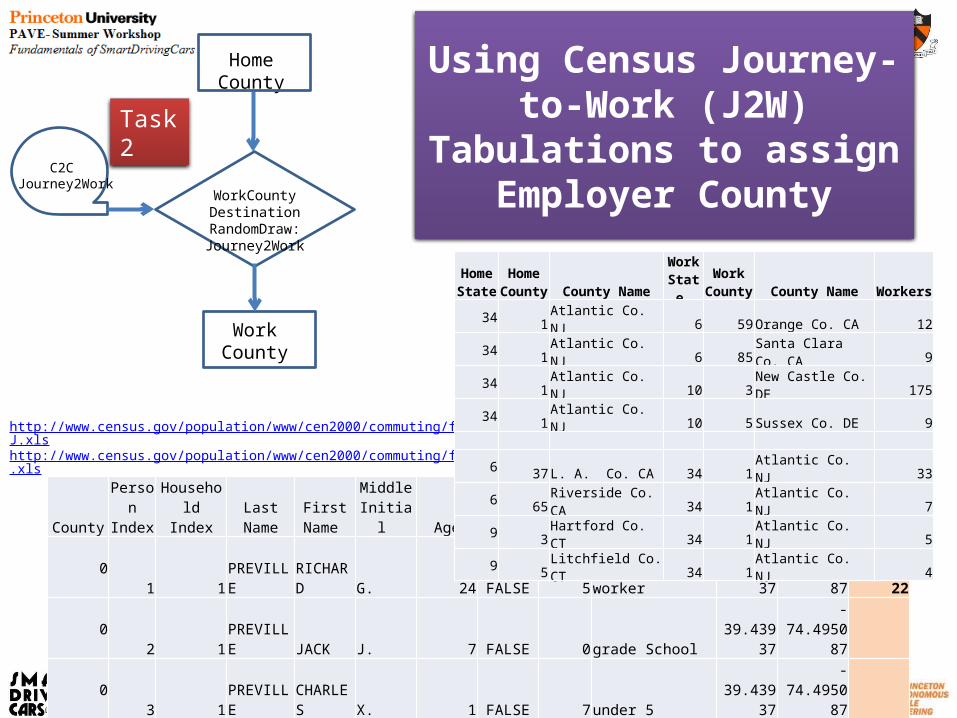
Using Census Journey-to-Work (J2W) Tabulations to
assign Employer County
CountyPerson Index
Household Index Last Name
First Name
Middle Initial Age Gender
Worker Index Worker Type
Home Latitude
Home Longitude
Employer County
0 1 1 PREVILLE RICHARD G. 24 FALSE 5 worker 39.43937 -74.495087 220 2 1 PREVILLE JACK J. 7 FALSE 0 grade School 39.43937 -74.495087 0 3 1 PREVILLE CHARLES X. 1 FALSE 7 under 5 39.43937 -74.495087 0 4 2 DEVEREUX SUE B. 24 TRUE 6 at-home-worker 39.43937 -74.495087 0 5 2 DEVEREUX ANTON P. 2 FALSE 7 under 5 39.43937 -74.495087 0 6 2 DEVEREUX KATIE S. 6 TRUE 0 grade School 39.43937 -74.495087 0 7 3 WHEDBEE LINDA C. 26 TRUE 6 at-home-worker 39.43937 -74.495087 0 8 4 CARVER ROBERT Z. 24 FALSE 5 worker 39.43937 -74.495087 00 9 4 CARVER JENNIFER P. 25 TRUE 6 at-home-worker 39.43937 -74.495087 0 10 5 TINSLEY ELLEN U. 23 TRUE 4 college on c ampus: 40.85646 -74.197833
WorkCounty Destination RandomDraw:Journey2Work
HomeCounty
C2C Journey2Work
WorkCounty
Task 2
http://www.census.gov/population/www/cen2000/commuting/files/2KRESCO_NJ.xls
http://www.census.gov/population/www/cen2000/commuting/files/2KWRKCO_NJ.xls
Home State
Home County County Name
Work State
Work County County Name Workers
34 1 Atlantic Co. NJ 6 59 Orange Co. CA 1234 1 Atlantic Co. NJ 6 85 Santa Clara Co. CA 934 1 Atlantic Co. NJ 10 3 New Castle Co. DE 17534 1 Atlantic Co. NJ 10 5 Sussex Co. DE 9
6 37 L. A. Co. CA 34 1 Atlantic Co. NJ 336 65 Riverside Co. CA 34 1 Atlantic Co. NJ 79 3 Hartford Co. CT 34 1 Atlantic Co. NJ 59 5 Litchfield Co. CT 34 1 Atlantic Co. NJ 4
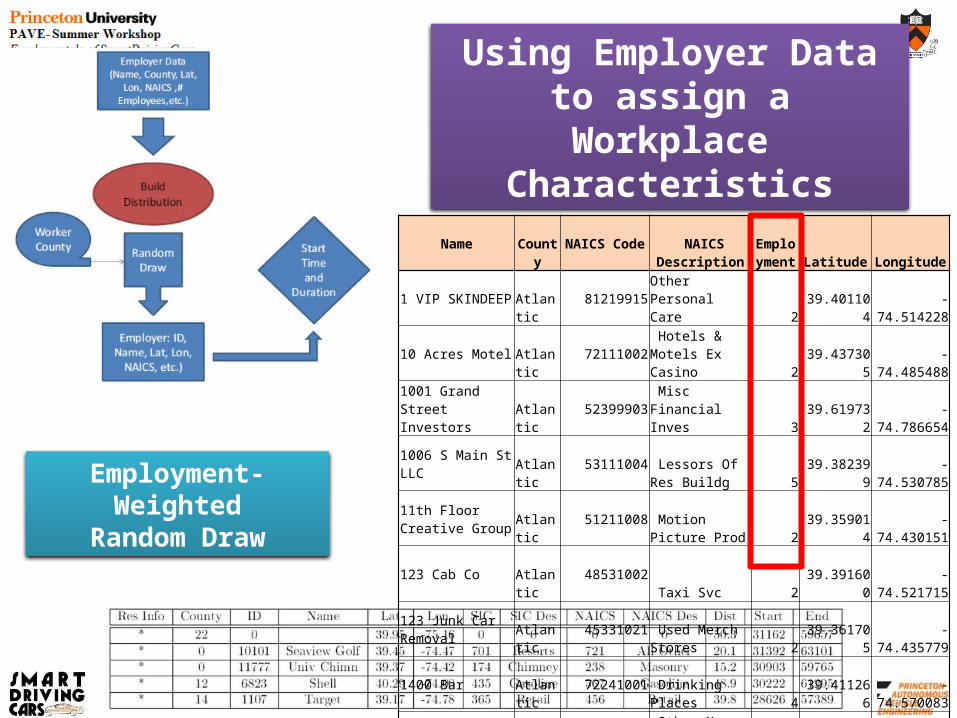
Using Employer Data to assign a Workplace
Characteristics
Name County
NAICS Code NAICS Description
Employment Latitude Longitude
1 VIP SKINDEEP Atlantic 81219915 Other Personal Care 2 39.401104 -74.514228
10 Acres Motel Atlantic 72111002 Hotels & Motels Ex Casino 2 39.437305 -74.485488
1001 Grand Street Investors Atlantic
52399903 Misc Financial Inves 3 39.619732 -74.786654
1006 S Main St LLC Atlantic 53111004 Lessors Of Res Buildg 5 39.382399 -74.530785
11th Floor Creative Group Atlantic 51211008 Motion Picture
Prod 2 39.359014 -74.430151
123 Cab Co Atlantic 48531002 Taxi Svc 2 39.391600 -74.521715123 Junk Car Removal Atlantic 45331021 Used Merch
Stores 2 39.361705 -74.435779
1400 Bar Atlantic 72241001 Drinking Places 4 39.411266 -74.570083
1-800-Got-Junk? Atlantic 56221910 Other Non-Haz Waste Disp 4 39.423954 -74.557892
Employment-WeightedRandom Draw

Using School Data to Assign School Characteristics
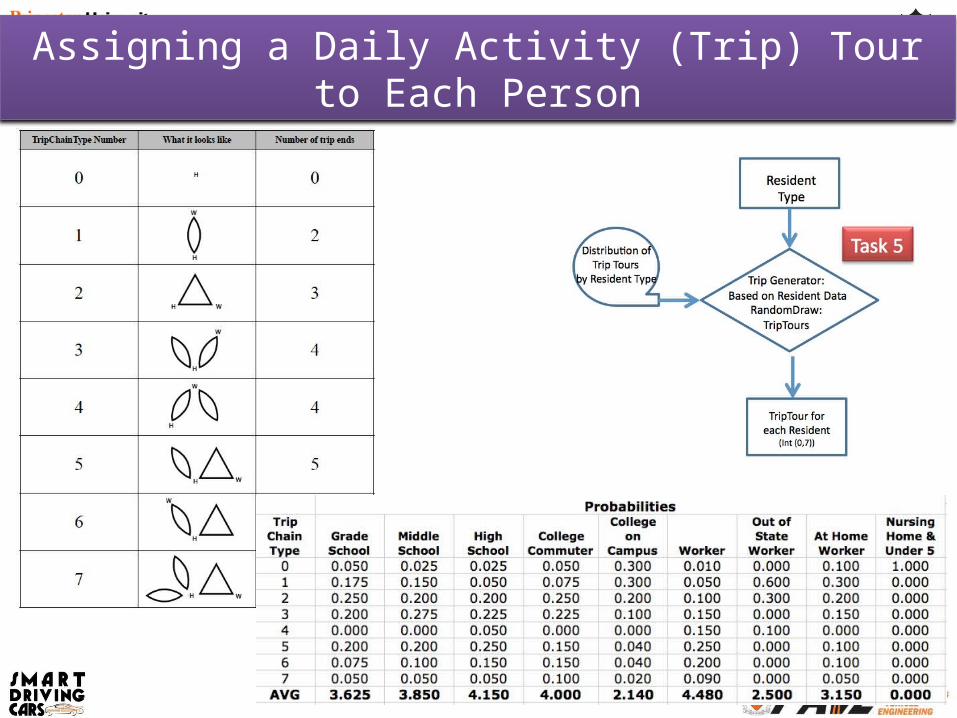
Assigning a Daily Activity (Trip) Tour to Each Person
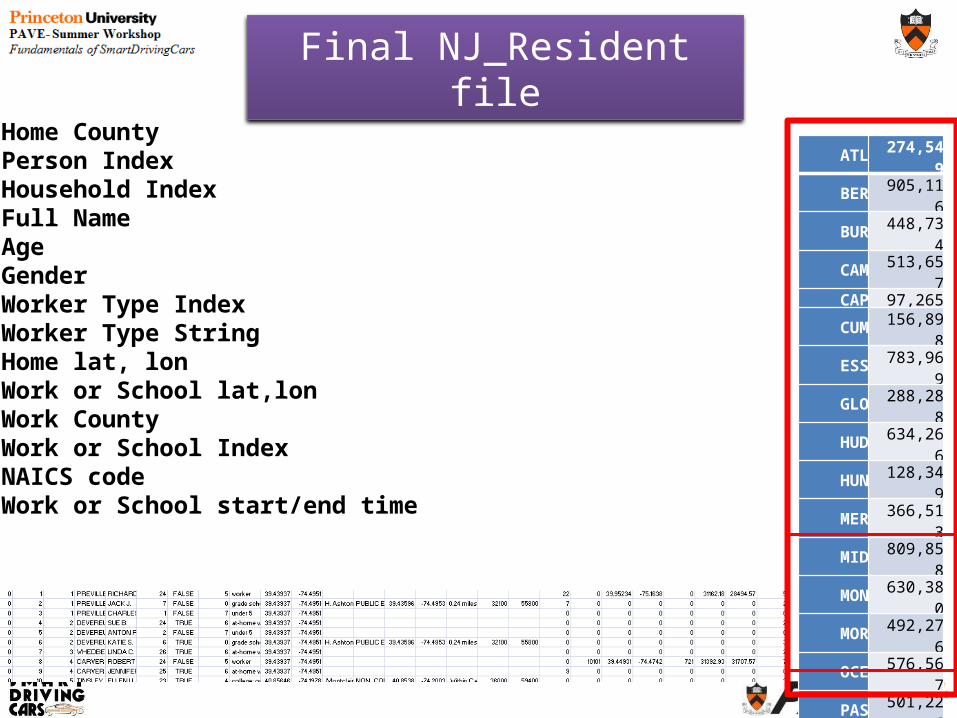
Final NJ_Resident fileHome CountyPerson IndexHousehold IndexFull NameAgeGenderWorker Type IndexWorker Type StringHome lat, lonWork or School lat,lonWork CountyWork or School IndexNAICS codeWork or School start/end time
ATL 274,549BER 905,116BUR 448,734
CAM 513,657CAP 97,265
CUM 156,898ESS 783,969
GLO 288,288HUD 634,266HUN 128,349MER 366,513MID 809,858
MON 630,380MOR 492,276OCE 576,567PAS 501,226SAL 66,083
SOM 323,444SUS 149,265UNI 536,499
WAR 108,692NYC 86,418PHL 18,586BUC 99,865SOU 13,772NOR 5,046WES 6,531ROC 32,737
Total: 9,054,849
Creating the NJ_PersonTrip file
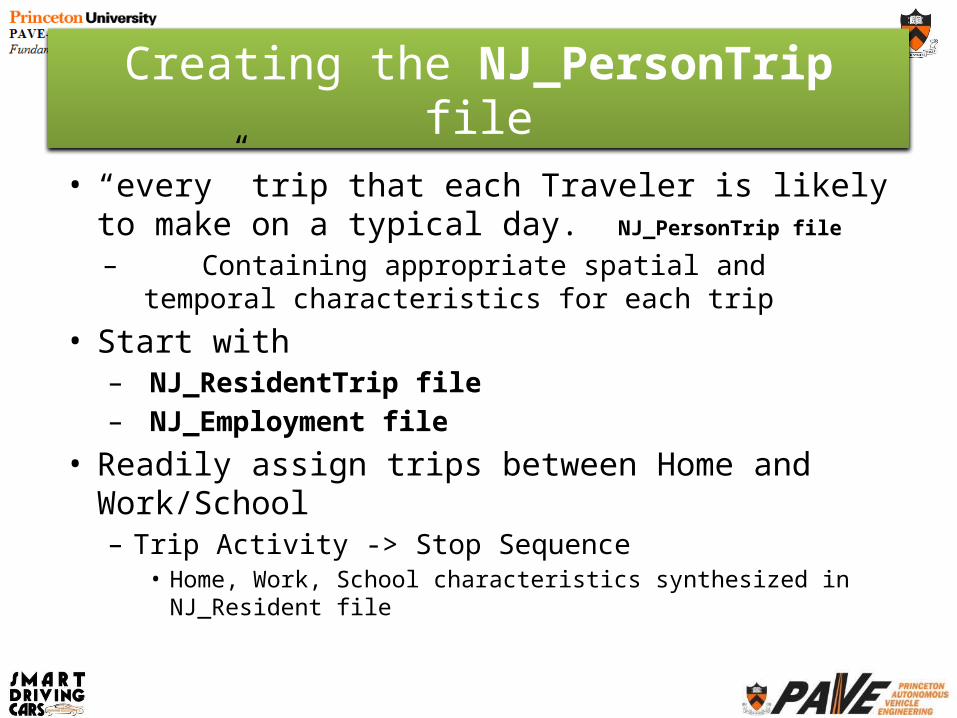
• “every” trip that each Traveler is likely to make on a typical day. NJ_PersonTrip file
– Containing appropriate spatial and temporal characteristics for each trip
• Start with– NJ_ResidentTrip file– NJ_Employment file
• Readily assign trips between Home and Work/School– Trip Activity -> Stop Sequence
• Home, Work, School characteristics synthesized in NJ_Resident file
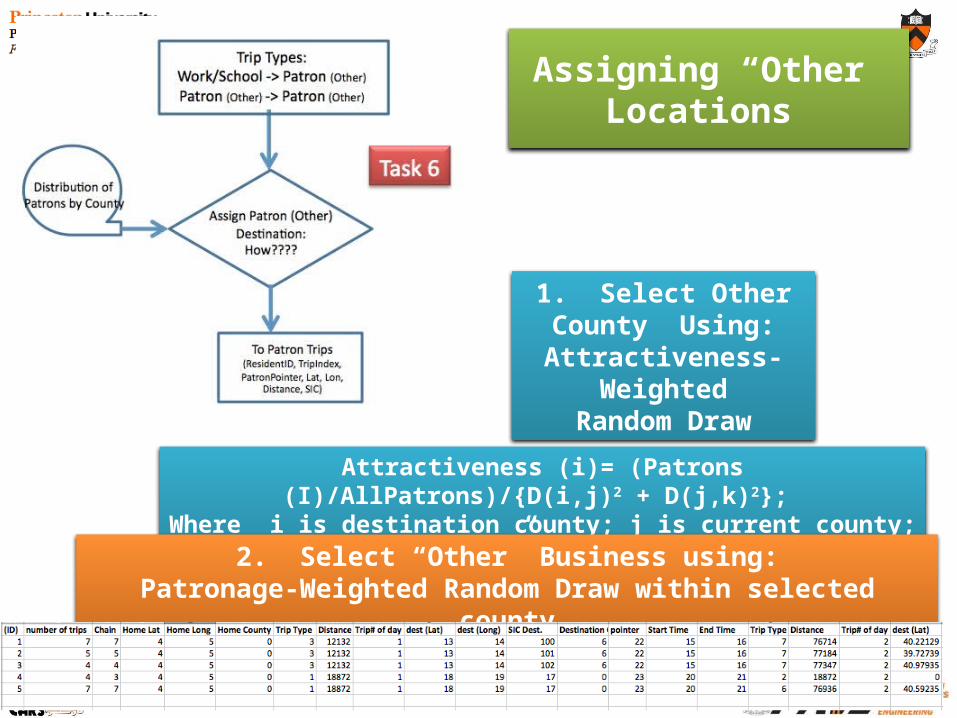
Assigning “Other” Locations
Attractiveness (i)= (Patrons (I)/AllPatrons)/{D(i,j)2 + D(j,k)2}; Where i is destination county; j is current county; k is home county
1. Select Other County Using:
Attractiveness-WeightedRandom Draw
2. Select “Other” Business using:Patronage-Weighted Random Draw within selected county
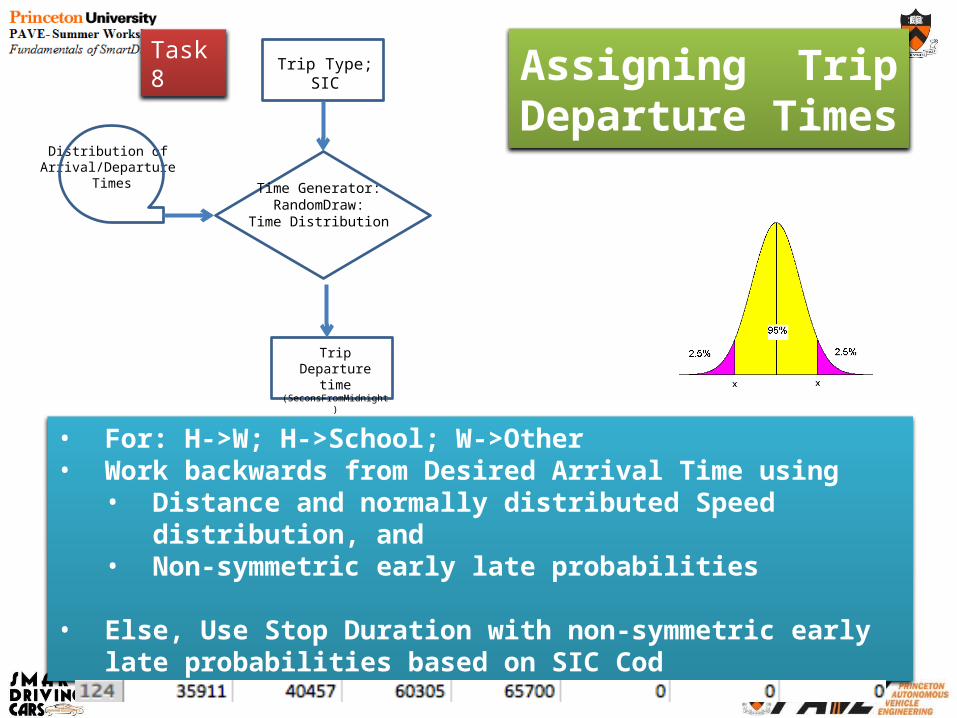
Assigning Trip Departure Times
• For: H->W; H->School; W->Other• Work backwards from Desired Arrival Time using
• Distance and normally distributed Speed distribution, and • Non-symmetric early late probabilities
• Else, Use Stop Duration with non-symmetric early late probabilities based on SIC Cod
Distribution of Arrival/Departure
Times
Trip Type; SIC
Time Generator:RandomDraw:
Time Distribution
Trip Departure time(SeconsFromMidnight)
Task 8
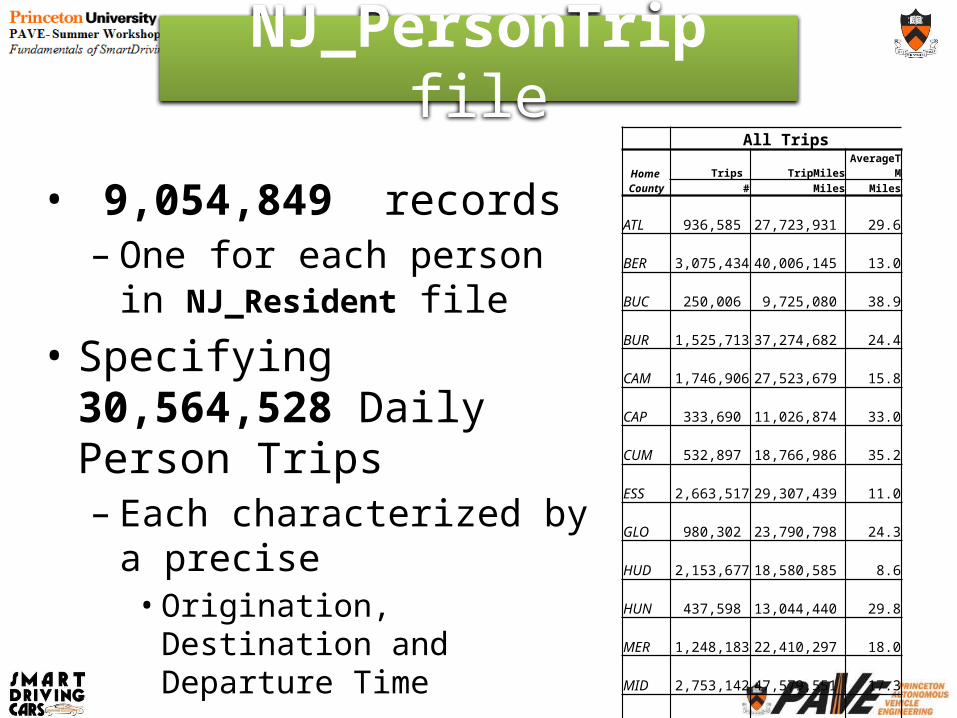
NJ_PersonTrip file
• 9,054,849 records– One for each person in
NJ_Resident file• Specifying 30,564,528 Daily
Person Trips– Each characterized by a precise• Origination, Destination and
Departure Time
All TripsHome County
Trips TripMiles AverageTM# Miles Miles
ATL 936,585 27,723,931 29.6BER 3,075,434 40,006,145 13.0BUC 250,006 9,725,080 38.9BUR 1,525,713 37,274,682 24.4CAM 1,746,906 27,523,679 15.8CAP 333,690 11,026,874 33.0CUM 532,897 18,766,986 35.2ESS 2,663,517 29,307,439 11.0GLO 980,302 23,790,798 24.3HUD 2,153,677 18,580,585 8.6HUN 437,598 13,044,440 29.8MER 1,248,183 22,410,297 18.0MID 2,753,142 47,579,551 17.3MON 2,144,477 50,862,651 23.7MOR 1,677,161 33,746,360 20.1NOR 12,534 900,434 71.8NYC 215,915 4,131,764 19.1OCE 1,964,014 63,174,466 32.2PAS 1,704,184 22,641,201 13.3PHL 46,468 1,367,405 29.4ROC 81,740 2,163,311 26.5SAL 225,725 8,239,593 36.5SOM 1,099,927 21,799,647 19.8SOU 34,493 2,468,016 71.6SUS 508,674 16,572,792 32.6UNI 1,824,093 21,860,031 12.0WAR 371,169 13,012,489 35.1WES 16,304 477,950 29.3
Total 30,564,528 590,178,597 19.3
What about the whole country?

Public Schools in the US
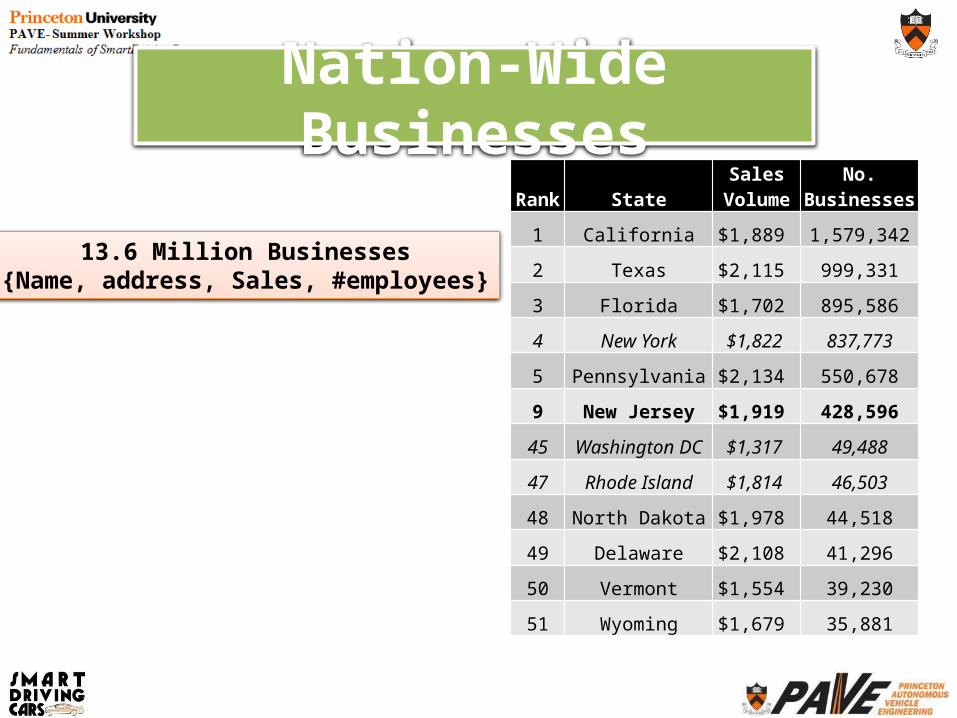
Nation-Wide BusinessesRank State
Sales Volume No. Businesses
1 California $1,889 1,579,342
2 Texas $2,115 999,331
3 Florida $1,702 895,586
4 New York $1,822 837,773
5 Pennsylvania $2,134 550,678
9 New Jersey $1,919 428,596
45 Washington DC $1,317 49,488
47 Rhode Island $1,814 46,503
48 North Dakota $1,978 44,518
49 Delaware $2,108 41,296
50 Vermont $1,554 39,230
51 Wyoming $1,679 35,881
13.6 Million Businesses{Name, address, Sales, #employees}
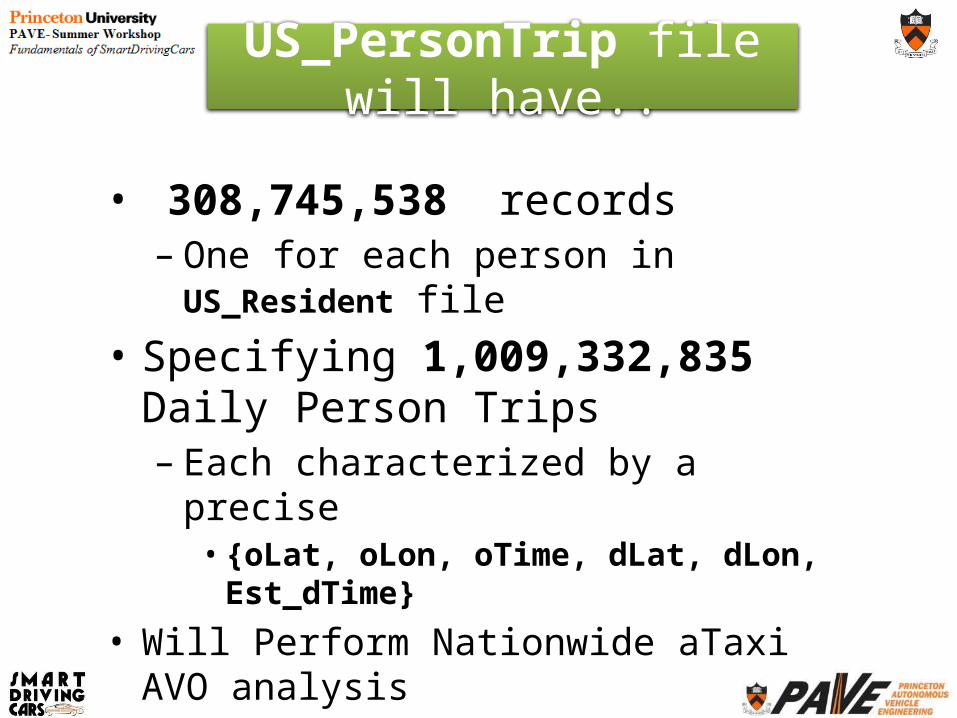
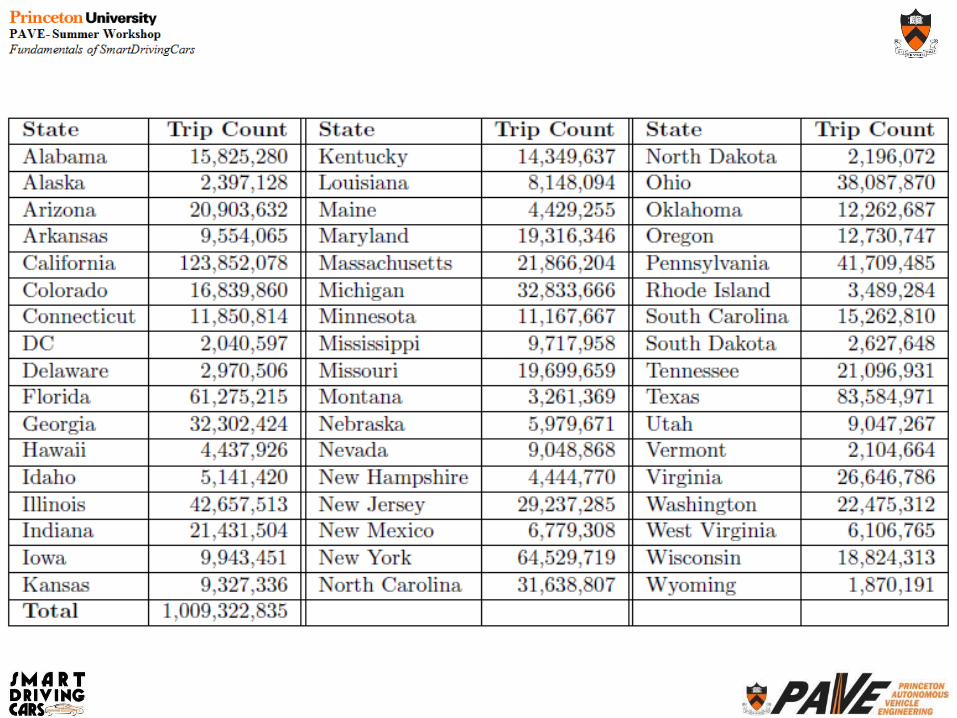
US_PersonTrip file will have..
• 308,745,538 records– One for each person in US_Resident file
• Specifying 1,009,332,835 Daily Person Trips– Each characterized by a precise• {oLat, oLon, oTime, dLat, dLon, Est_dTime}
• Will Perform Nationwide aTaxi AVO analysis• Results ????

Trip Files are Available If You want to Play

• Assuming PLANNERS continue to PLAN as they do now. – How will people “get around”?
• Assuming this new way of “getting around” offers different opportunities and constraints for PLANNERS to improve “Quality of Life”. – How will Zoning/Land-Use Change?– How will people “get around”?
What about Level 4 Implications on Energy, Congestion, Environment?
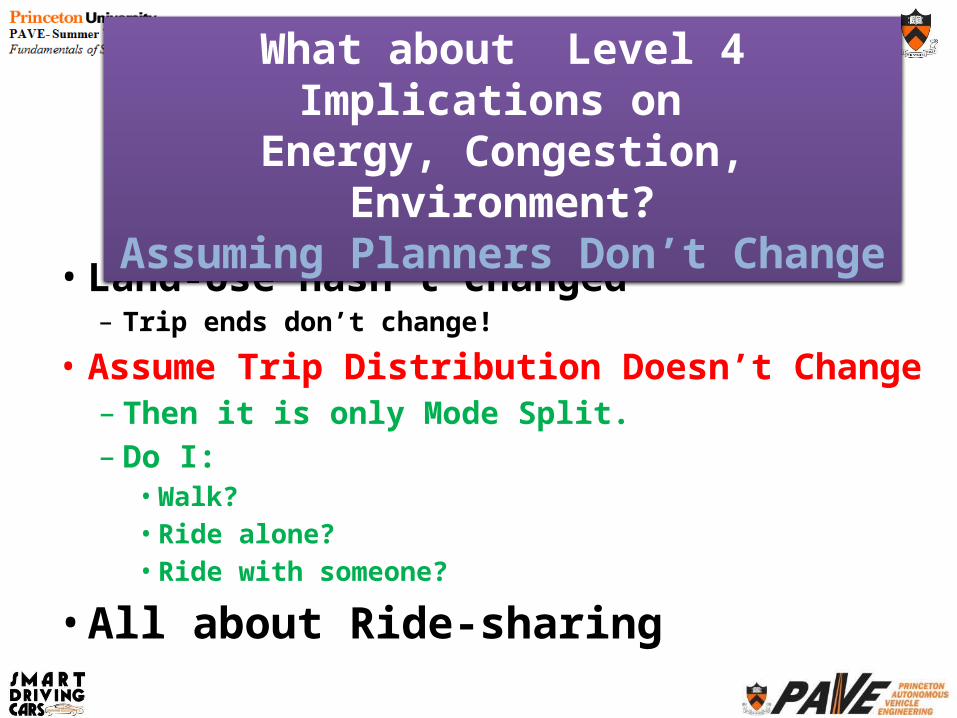
• Land-Use hasn’t changed – Trip ends don’t change!
• Assume Trip Distribution Doesn’t Change– Then it is only Mode Split. – Do I:
• Walk?• Ride alone?• Ride with someone?
• All about Ride-sharing
What about Level 4 Implications on Energy, Congestion, Environment?Assuming Planners Don’t Change
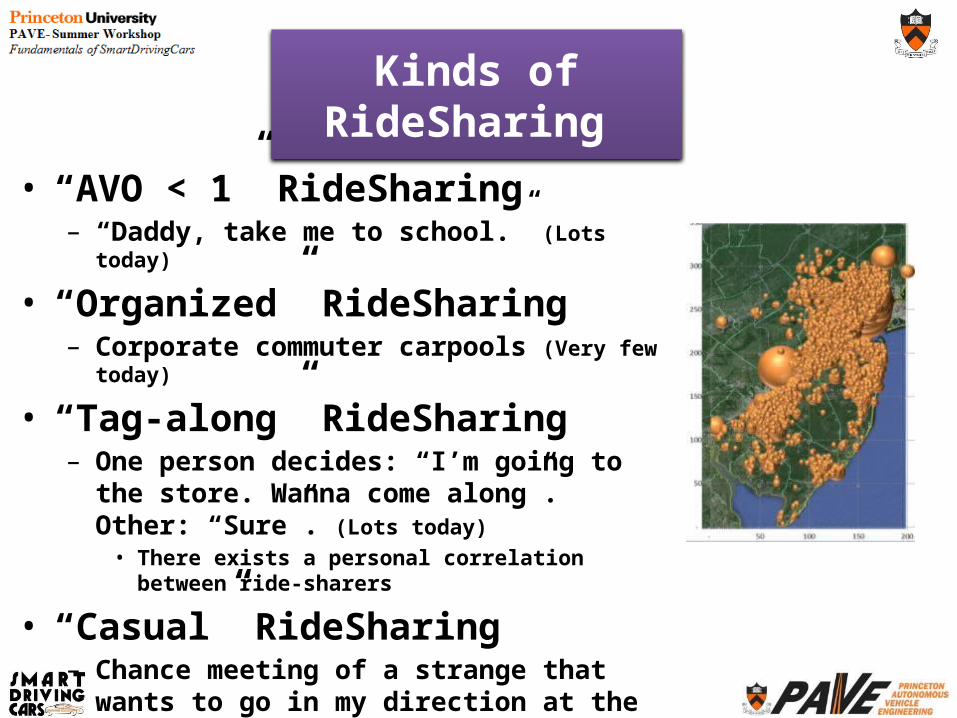
• “AVO < 1” RideSharing– “Daddy, take me to school.” (Lots today)
• “Organized” RideSharing– Corporate commuter carpools (Very few today)
• “Tag-along” RideSharing– One person decides: “I’m going to the store.
Wanna come along”. Other: “Sure”. (Lots today)• There exists a personal correlation between ride-sharers
• “Casual” RideSharing– Chance meeting of a strange that wants to go in
my direction at the time I want to go • “Slug”, “Hitch hiker”
Kinds of RideSharing
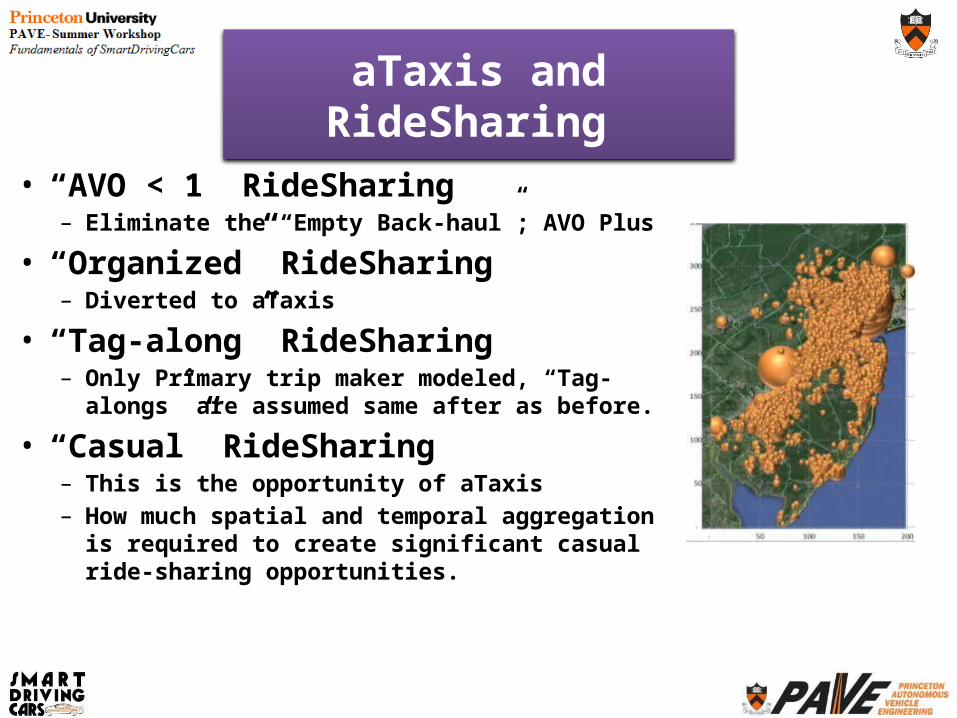
• “AVO < 1” RideSharing– Eliminate the “Empty Back-haul”; AVO Plus
• “Organized” RideSharing– Diverted to aTaxis
• “Tag-along” RideSharing– Only Primary trip maker modeled, “Tag-alongs”
are assumed same after as before.
• “Casual” RideSharing– This is the opportunity of aTaxis– How much spatial and temporal aggregation is
required to create significant casual ride-sharing opportunities.
aTaxis and RideSharing
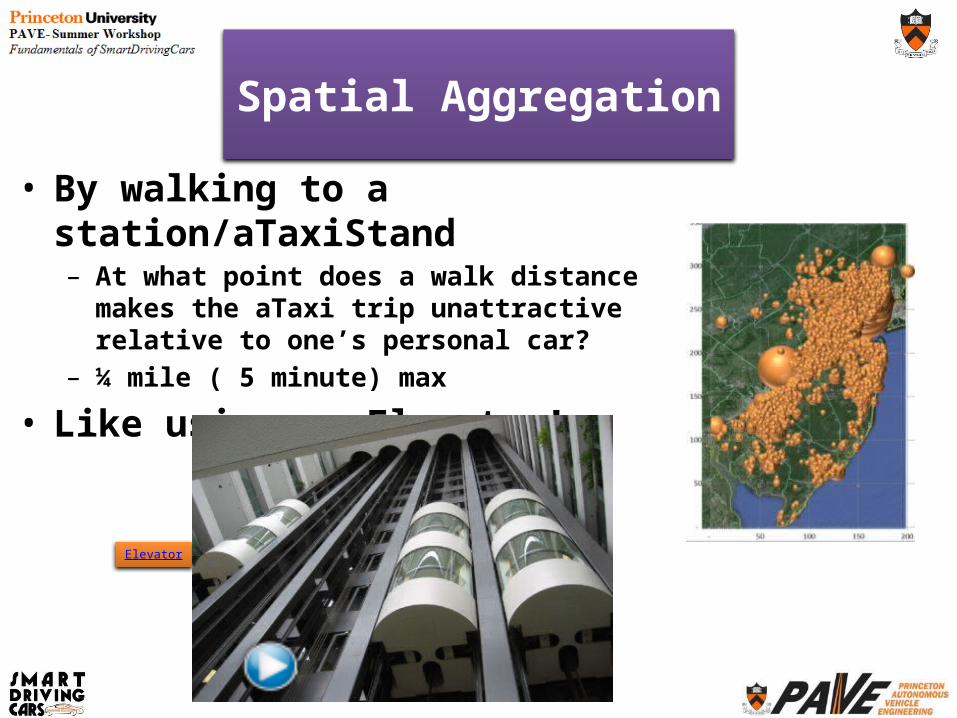
• By walking to a station/aTaxiStand– At what point does a walk distance makes the
aTaxi trip unattractive relative to one’s personal car?
– ¼ mile ( 5 minute) max
• Like using an Elevator!
Spatial Aggregation
Elevator
• No Change in Today’s Walking, Bicycling and Rail trips
– Today’s Automobile trips become aTaxi or aTaxi+Rail trips with hopefully LOTS of Ride-sharing opportunities
What about Level 4 Implications on Energy, Congestion, Environment?Assuming Planners Don’t Change
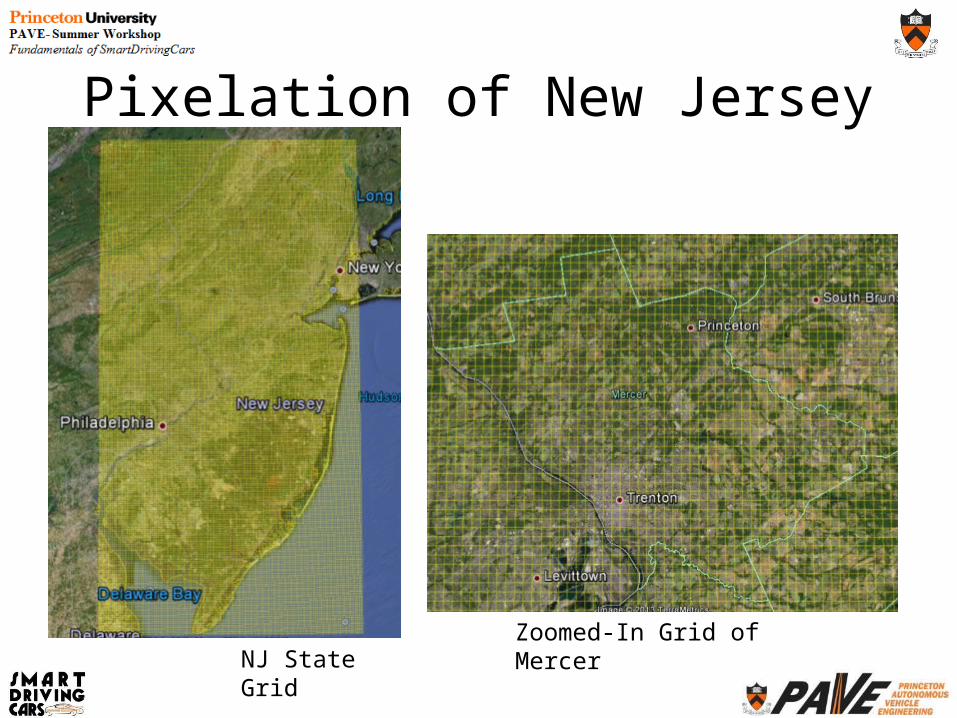
Pixelation of New Jersey
NJ State GridZoomed-In Grid of Mercer

Pixelating the State with half-mile Pixels
xPixel = floor{108.907 * (longitude + 75.6)}yPixel = floor{138.2 * (latitude – 38.9))
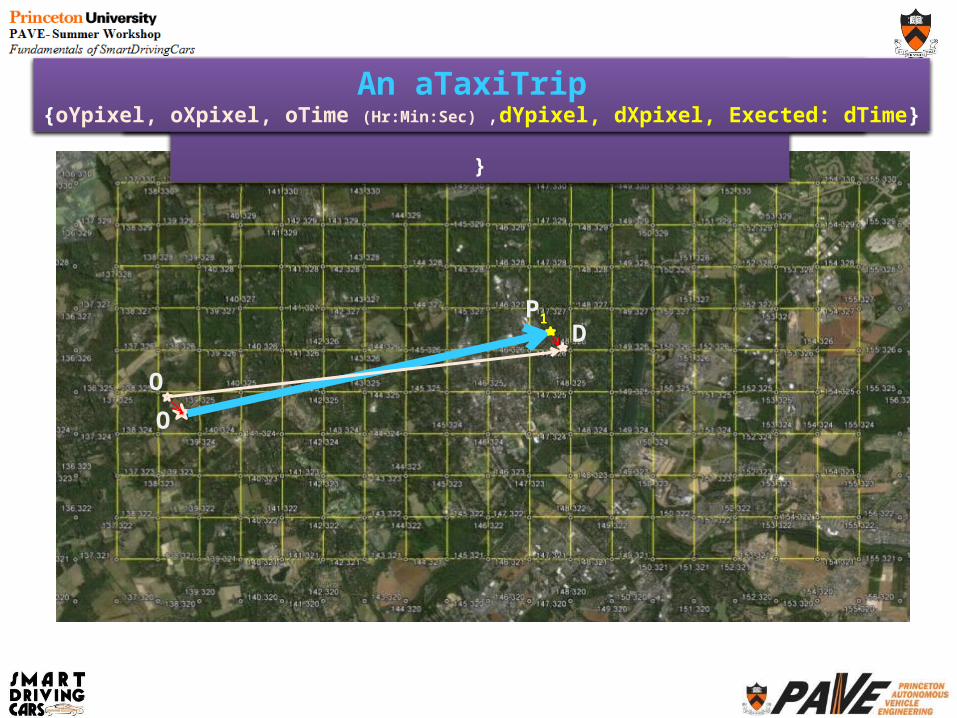
a PersonTrip {oLat, oLon, oTime (Hr:Min:Sec) ,dLat, dLon, Exected: dTime}
O
O
DP1
An aTaxiTrip {oYpixel, oXpixel, oTime (Hr:Min:Sec) , }
An aTaxiTrip {oYpixel, oXpixel, oTime (Hr:Min:Sec) ,dYpixel, dXpixel, Exected: dTime}
P1
O
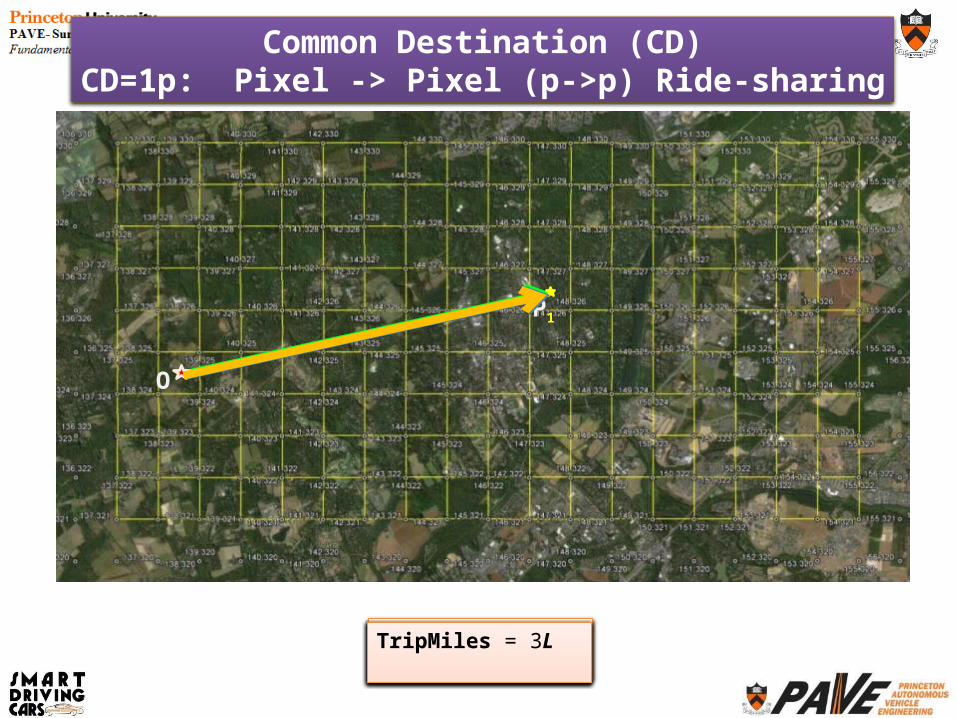
Common Destination (CD)CD=1p: Pixel -> Pixel (p->p) Ride-sharing
TripMiles = LTripMiles = 2LTripMiles = 3L
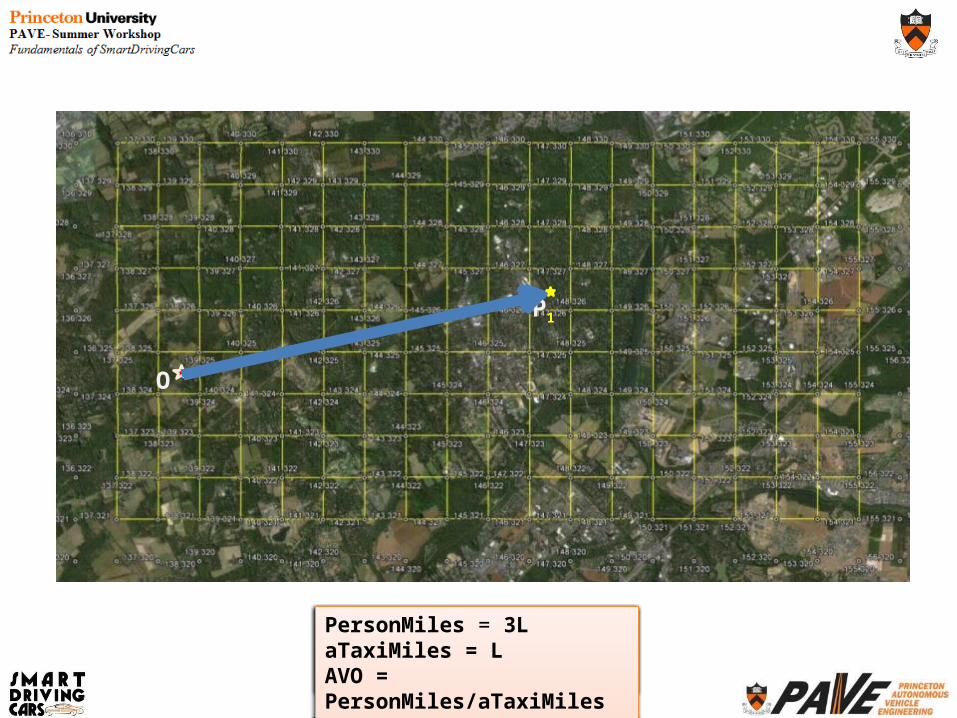
P1
O
PersonMiles = 3LPersonMiles = 3LaTaxiMiles = LAVO = PersonMiles/aTaxiMiles = 3
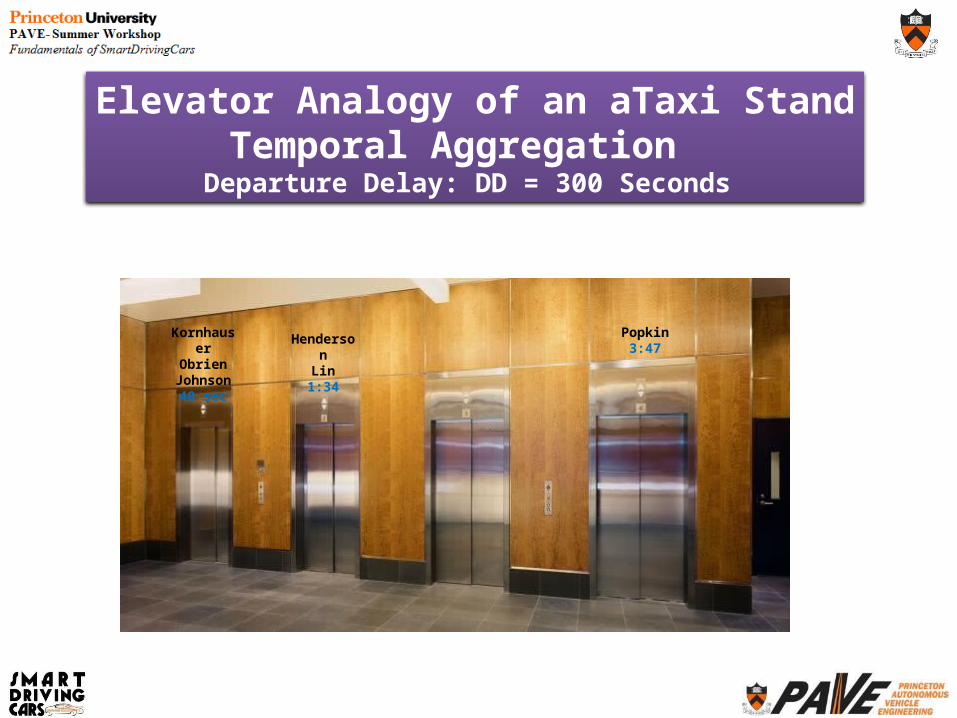
Elevator Analogy of an aTaxi StandTemporal Aggregation
Departure Delay: DD = 300 Seconds
KornhauserObrien
Johnson40 sec
HendersonLin
1:34
Popkin3:47
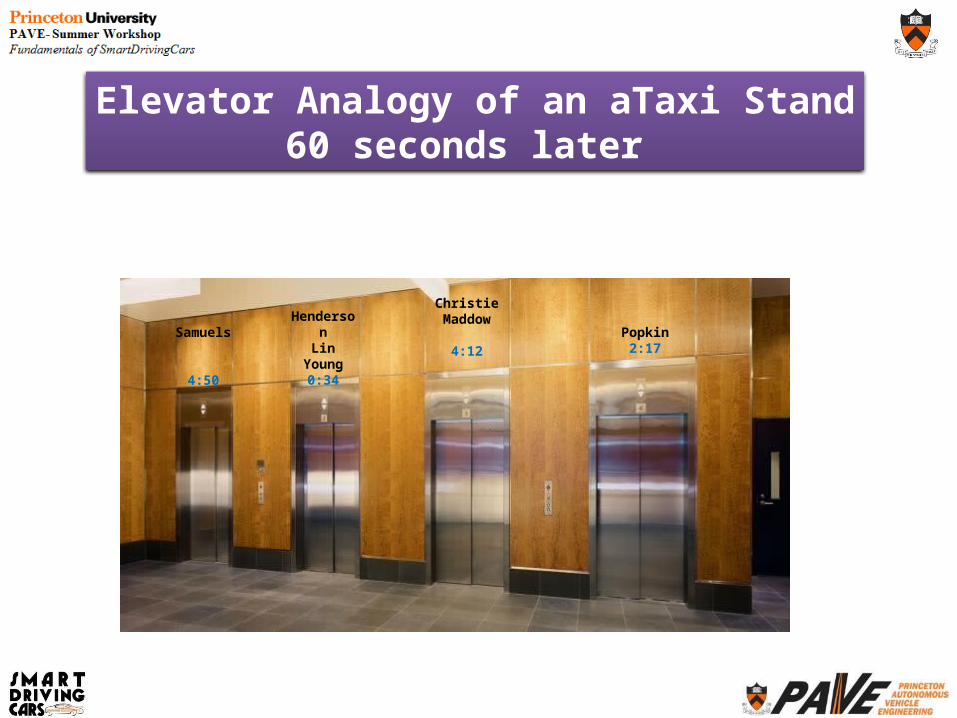
Samuels
4:50
HendersonLin
Young0:34
Popkin2:17
Elevator Analogy of an aTaxi Stand60 seconds later
ChristieMaddow
4:12
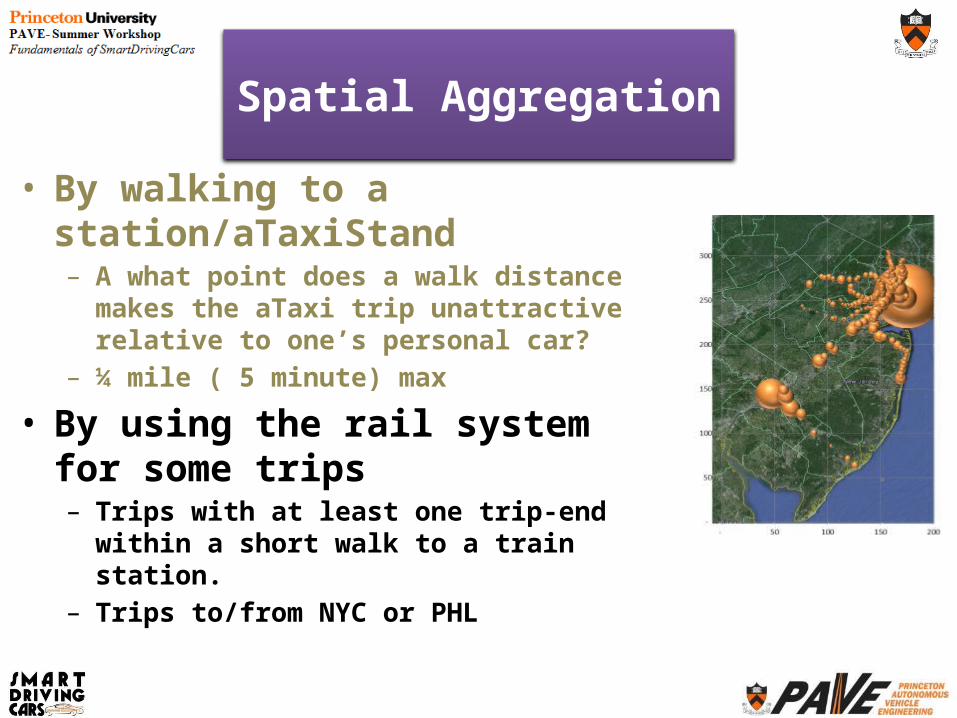
• By walking to a station/aTaxiStand– A what point does a walk distance makes the aTaxi
trip unattractive relative to one’s personal car?– ¼ mile ( 5 minute) max
• By using the rail system for some trips– Trips with at least one trip-end within a short walk
to a train station.– Trips to/from NYC or PHL
Spatial Aggregation

D
a PersonTrip from NYC (or PHL or any Pixel containing a Train station)
NYC
O
Princeton Train Station
NJ Transit
Rail Line to
NYC,
next Departu
re
aTaxiTrip
An aTaxiTrip {oYpixel, oXpixel, TrainArrivalTime, dYpixel, dXpixel, Exected: dTime}
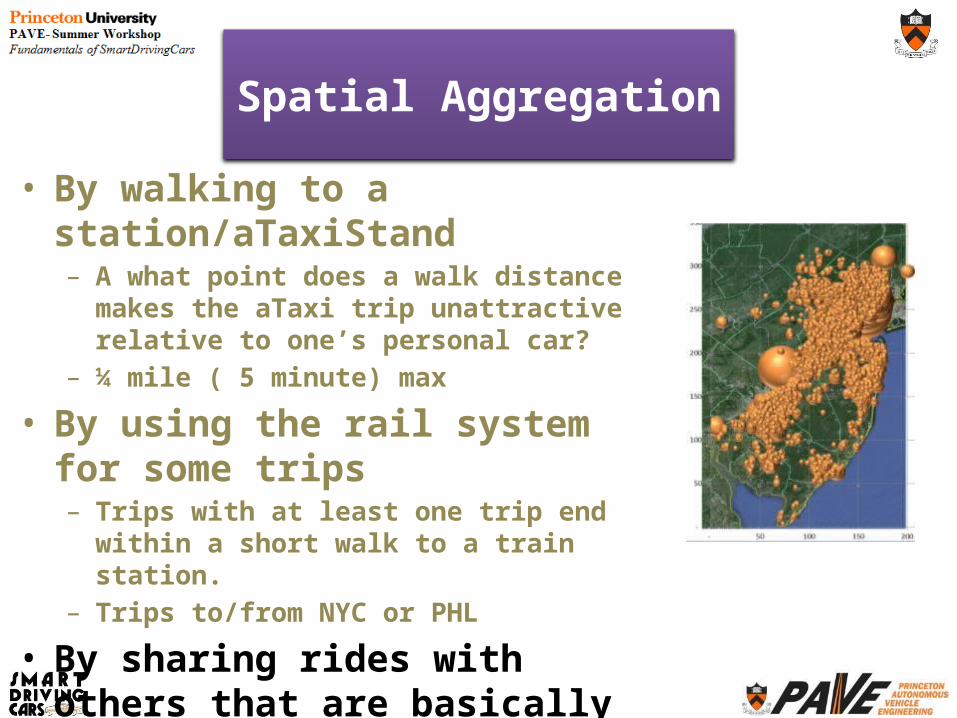
• By walking to a station/aTaxiStand– A what point does a walk distance makes the aTaxi
trip unattractive relative to one’s personal car?– ¼ mile ( 5 minute) max
• By using the rail system for some trips– Trips with at least one trip end within a short walk
to a train station.– Trips to/from NYC or PHL
• By sharing rides with others that are basically going in my direction– No trip has more than 20% circuity added to its
trip time.
Spatial Aggregation
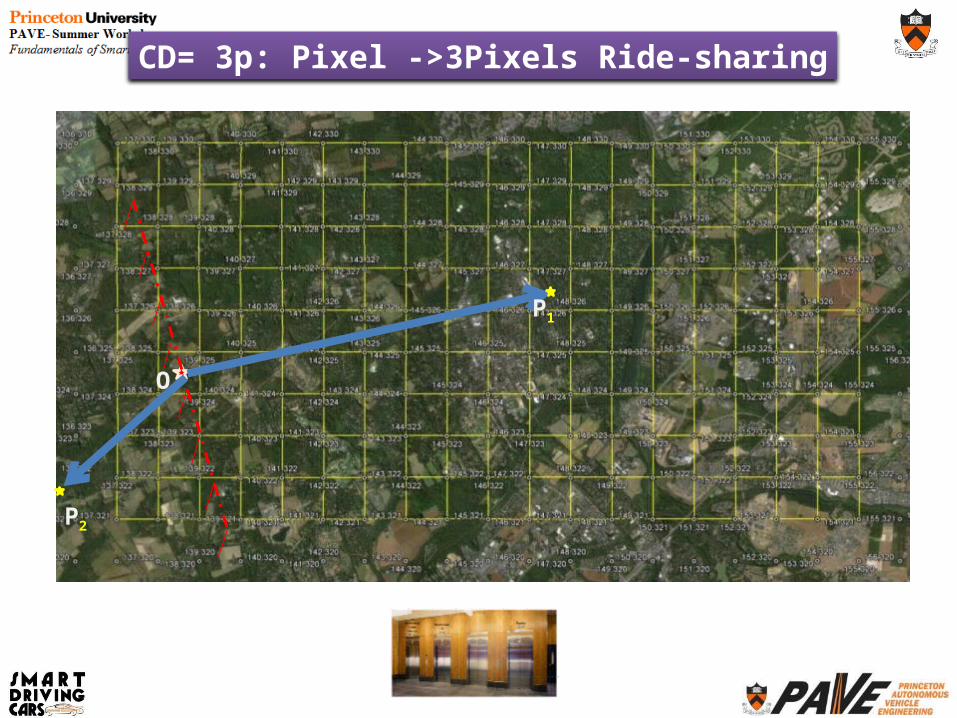
P1
P2
O
CD= 3p: Pixel ->3Pixels Ride-sharing
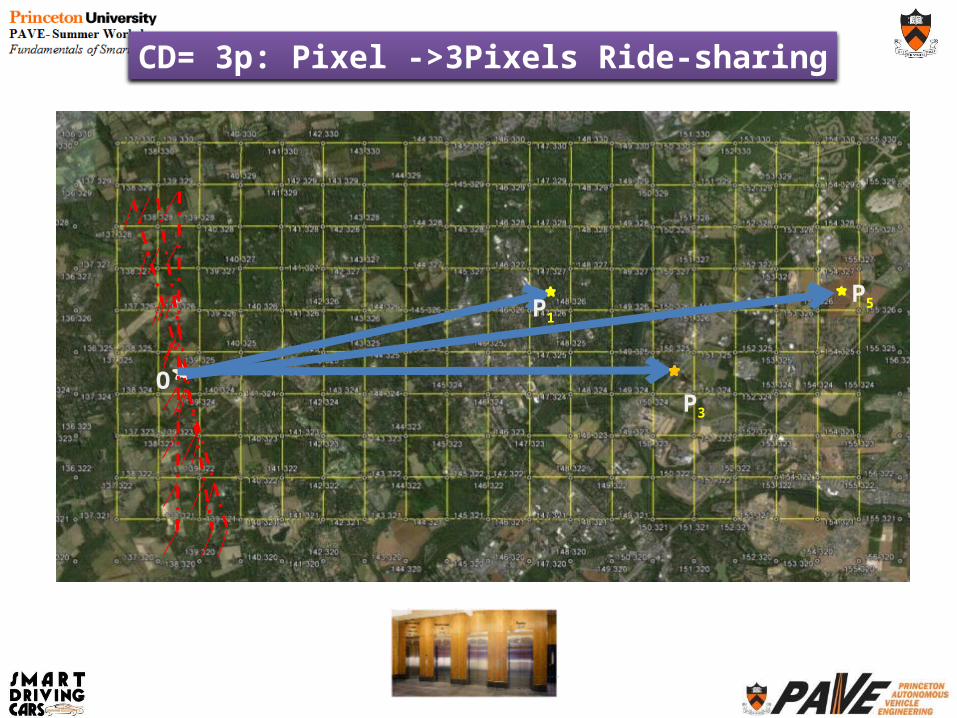
P1P5
OP3
CD= 3p: Pixel ->3Pixels Ride-sharing
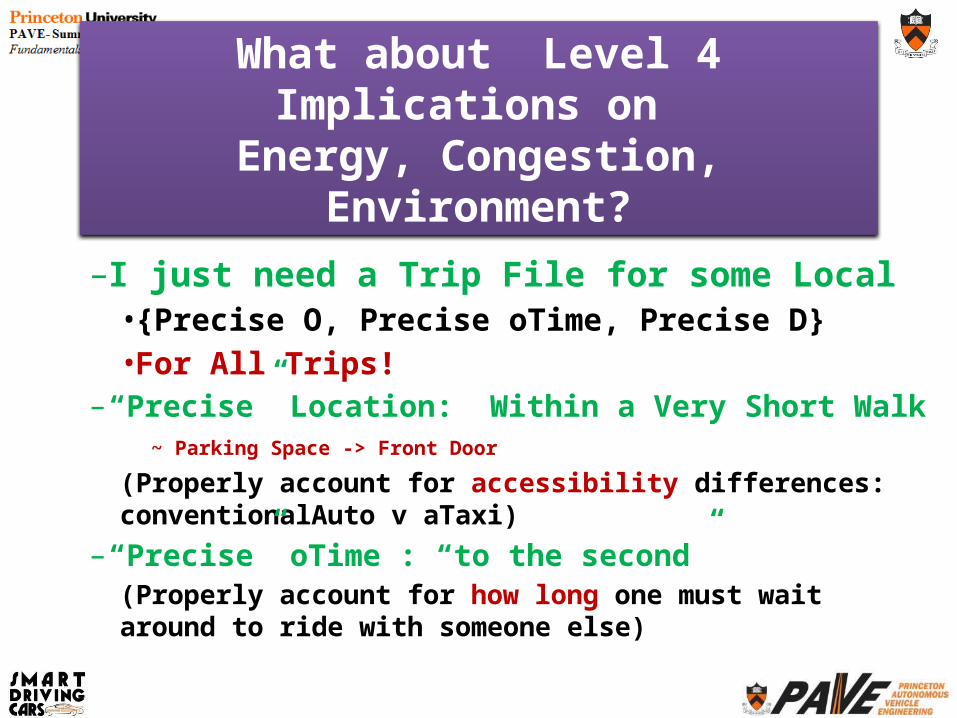
– I just need a Trip File for some Local• {Precise O, Precise oTime, Precise D} • For All Trips!
– “Precise” Location: Within a Very Short Walk~ Parking Space -> Front Door
(Properly account for accessibility differences: conventionalAuto v aTaxi)
– “Precise” oTime : “to the second”(Properly account for how long one must wait around to ride with someone else)
What about Level 4 Implications on Energy, Congestion, Environment?
c
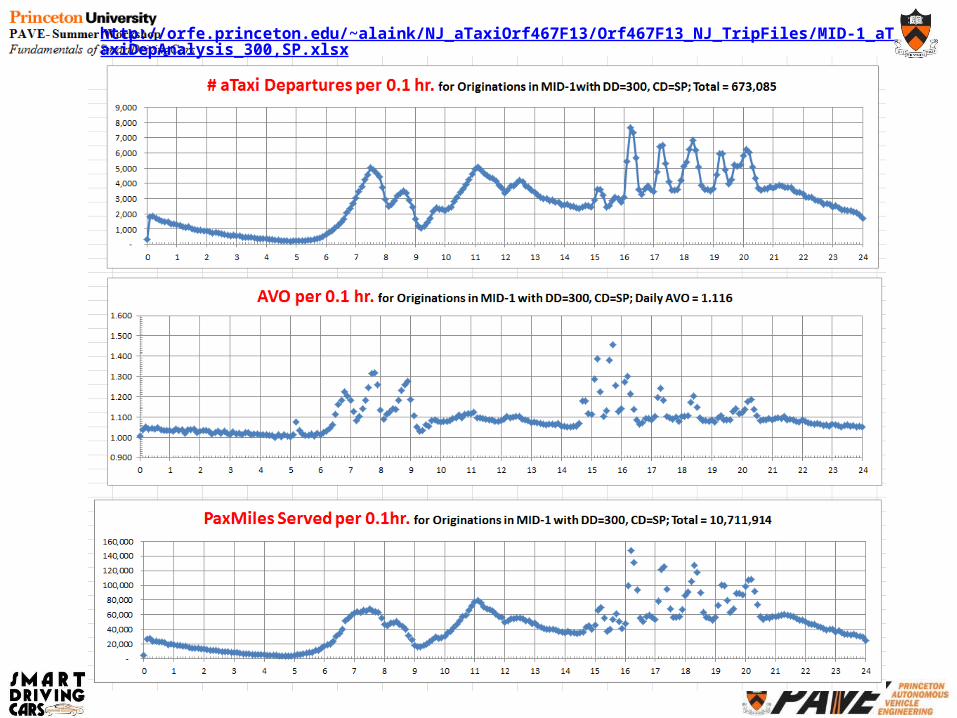
http://orfe.princeton.edu/~alaink/NJ_aTaxiOrf467F13/Orf467F13_NJ_TripFiles/MID-1_aTaxiDepAnalysis_300,SP.xlsx
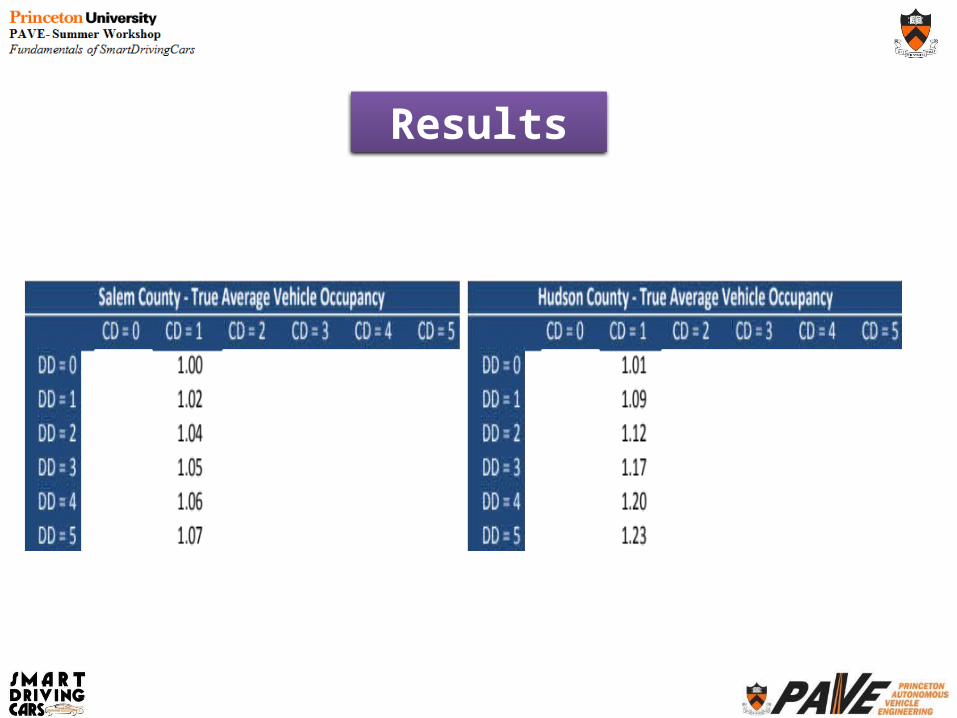
Results
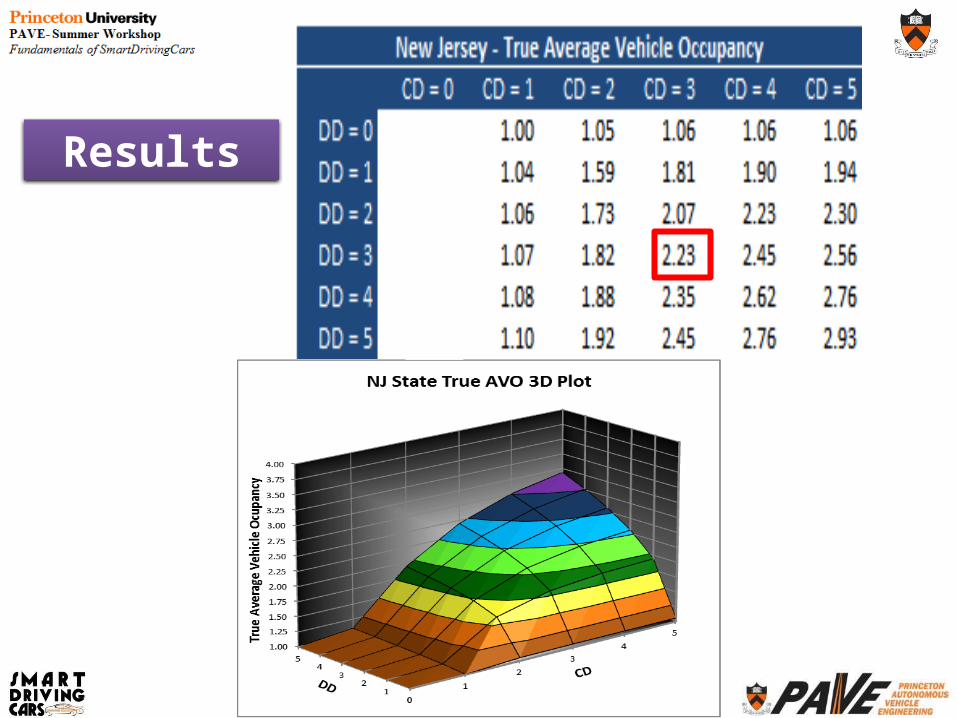
Results

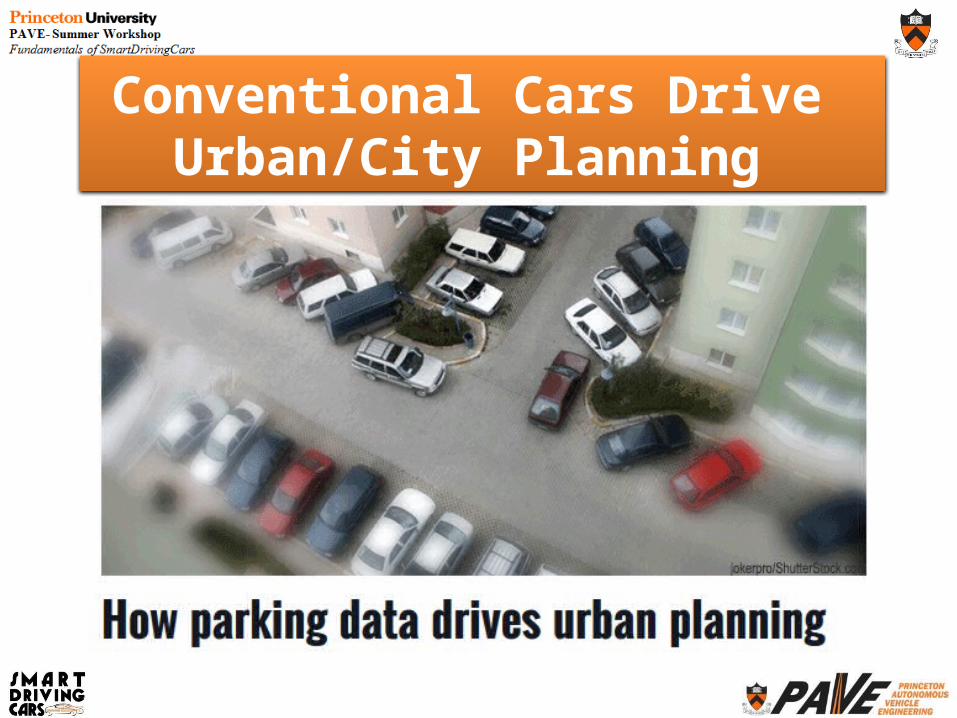
Conventional Cars Drive Urban/City Planning
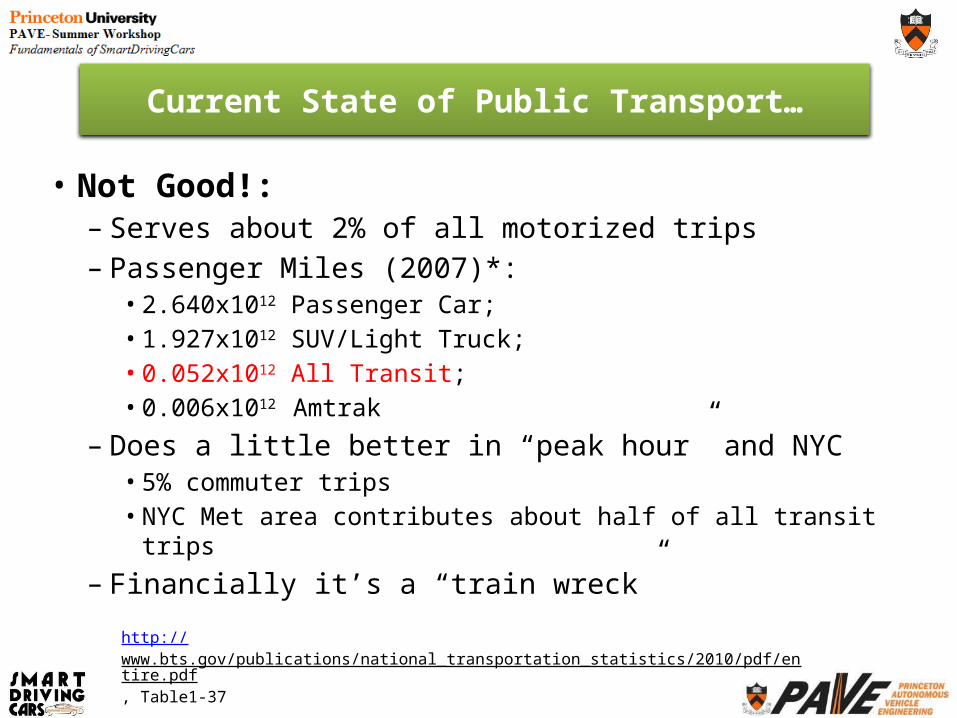
Current State of Public Transport…• Not Good!:– Serves about 2% of all motorized trips– Passenger Miles (2007)*:
• 2.640x10¹² Passenger Car; • 1.927x10¹² SUV/Light Truck; • 0.052x10¹² All Transit; • 0.006x10¹² Amtrak
– Does a little better in “peak hour” and NYC • 5% commuter trips• NYC Met area contributes about half of all transit trips
– Financially it’s a “train wreck”http://www.bts.gov/publications/national_transportation_statistics/2010/pdf/entire.pdf, Table1-37
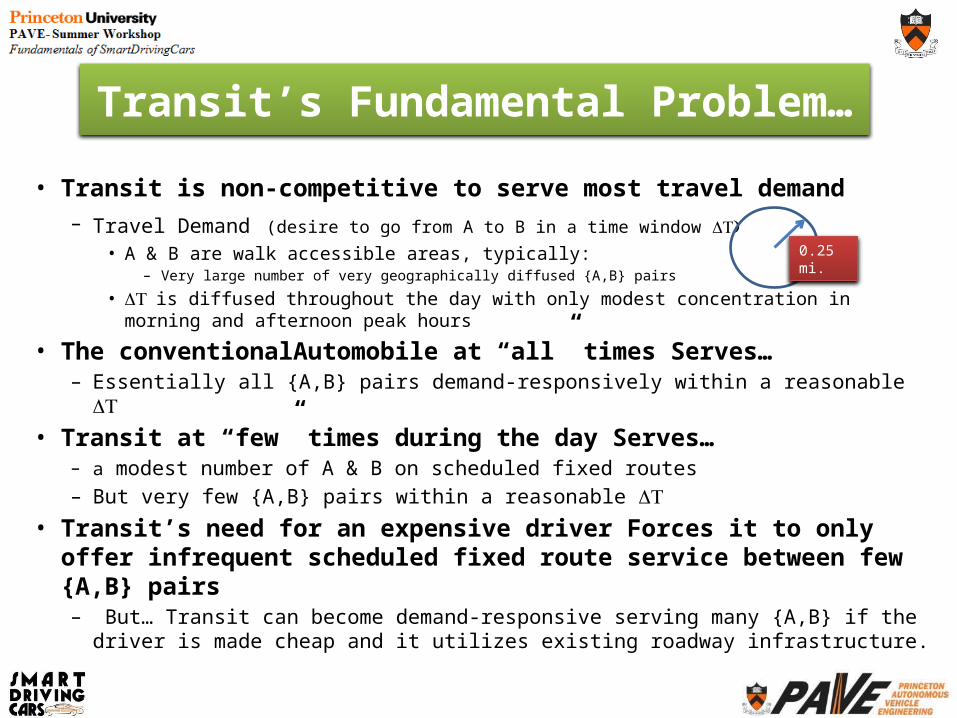
Transit’s Fundamental Problem…
• Transit is non-competitive to serve most travel demand– Travel Demand (desire to go from A to B in a time window )DT
• A & B are walk accessible areas, typically: – Very large number of very geographically diffused {A,B} pairs
• DT is diffused throughout the day with only modest concentration in morning and afternoon peak hours
• The conventionalAutomobile at “all” times Serves…– Essentially all {A,B} pairs demand-responsively within a reasonable DT
• Transit at “few” times during the day Serves…– a modest number of A & B on scheduled fixed routes– But very few {A,B} pairs within a reasonable DT
• Transit’s need for an expensive driver Forces it to only offer infrequent scheduled fixed route service between few {A,B} pairs– But… Transit can become demand-responsive serving many {A,B} if the driver is
made cheap and it utilizes existing roadway infrastructure.
0.25 mi.