Embed Size (px)
Citation preview

Interim Report Q1 2018
Daimler AGMercedesstr. 13770327 StuttgartGermanywww.daimler.com
englisch_Daimler_Q1_2018.indd Alle Seiten 23.04.18 14:00
INTERIM REPORT Q1 2018 | CONTENTS 3
Contents
A | Key Figures 4
B | Daimler and the Capital Market 5
C | Interim Management Report 6 - 20
Business development 6Profitability 8Cash flows 10Financial position 13Workforce 15Important events 15Risk and opportunity report 16Outlook 18 D | The Divisions 21 - 25
Mercedes-Benz Cars 21Daimler Trucks 22Mercedes-Benz Vans 23Daimler Buses 24Daimler Financial Services 25 E | Interim Consolidated
Financial Statements 26 - 56
Consolidated Statement of Income 26Consolidated Statement of Comprehensive Income
27
Consolidated Statement of Financial Position 28Consolidated Statement of Cash Flows 29Consolidated Statement of Changes in Equity 30Notes to the Interim Consolidated Financial Statements 32 Auditor’s Review Report 57 F | Addresses – Information –
Financial Calendar 59
Cover photo: new A-Class with MBUX. The new A-Class is the first model from Mercedes-Benz to receive the completely new multimedia system MBUX (Mercedes-Benz User Experience), commencing a new era for Mercedes me Connectivity. The name MBUX – Mercedes-Benz User Experience – for the new infotainment system signals that user experience has top priority. A unique aspect of this system is its ability to learn thanks to artificial intelligence. MBUX is customizable and adapts to each user, creating an emotional connection between vehicle and driver.

4 A | KEY FIGURES
Q1
Key Figures Daimler Group € amounts in millions Q1 2018 Q1 2017 % change Revenue 39,785 38,582 2 +3 1 Europe 16,434 16,138 +2 thereof Germany 5,955 5,808 +3 NAFTA 10,601 10,814 -2 thereof United States 9,074 9,428 -4 Asia 10,338 9,235 +12 thereof China 5,171 4,332 +19 Other markets 2,412 2,395 +1 Investment in property, plant, equipment 1,343 1,300 +3 Research and development expenditure 2,321 2,133 +9 thereof capitalized development costs 609 685 -11 Free cash flow of the industrial business 1,822 1,945 -6 EBIT 3,335 3,771 2 -12 Net profit 2,354 2,652 2 -11 Earnings per share (in euros) 2.12 2.39 2 -11 Employees 294,029 289,321 3 +2
1 Adjusted for the effects of currency translation, increase in revenue of 8%. 2 The amounts have been adjusted due to first-time adoption of IFRS 15 and IFRS 9. Further information is provided in Note 1 of the Notes to the
Interim Consolidated Financial Statements. 3 As of December 31, 2017.
Q1 Q2 Q3 Q4
In billions of euros
2017
2018
In billions of euros In billions of euros
0 0 0
In euros
Q1 Q2 Q3 Q4 Q1 Q2 Q3 Q4 Q1 Q2 Q3 Q4
50
45
40
35
30
25
20
15
10
5
0
Revenue Net profitTIBE Earnings per share
5.0
4.5
4.0
3.5
3.0
2.5
2.0
1.5
1.0
0.5
5.0
4.5
4.0
3.5
3.0
2.5
2.0
1.5
1.0
0.5
5.00
4.50
4.00
3.50
3.00
2.50
2.00
1.50
1.00
0.50
B | DAIMLER AND THE CAPITAL MARKET 5
Daimler and the Capital Market
Key figures
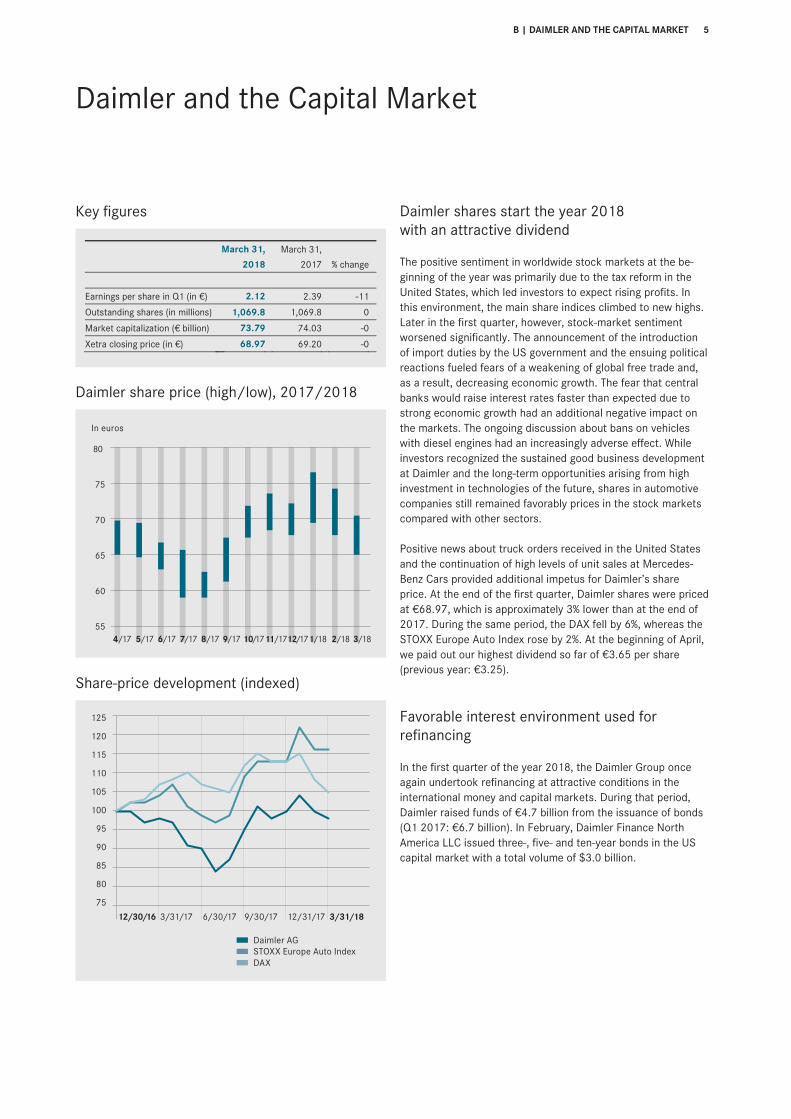
March 31, March 31, 2018 2017 % change Earnings per share in Q1 (in €) 2.12 2.39 -11 Outstanding shares (in millions) 1,069.8 1,069.8 0 Market capitalization (€ billion) 73.79 74.03 -0 Xetra closing price (in €) 68.97 69.20 -0
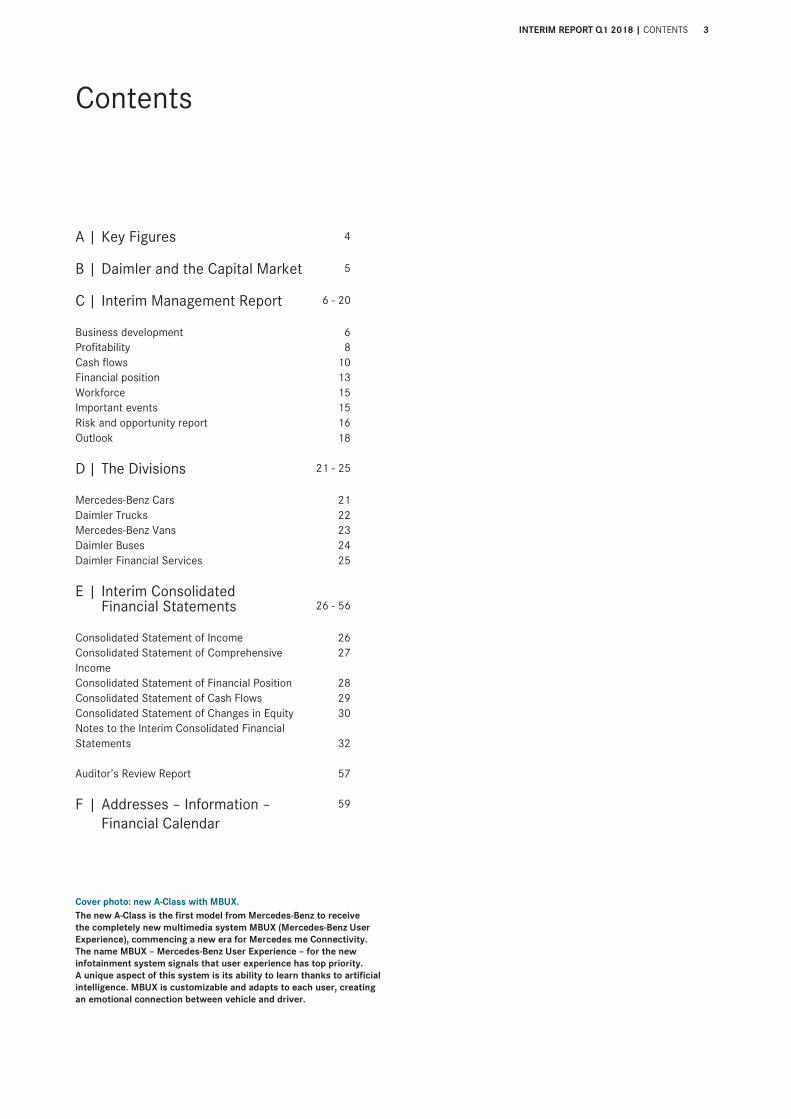
Daimler share price (high/low), 2017/2018
Share-price development (indexed)
Daimler shares start the year 2018 with an attractive dividend
The positive sentiment in worldwide stock markets at the be-ginning of the year was primarily due to the tax reform in the United States, which led investors to expect rising profits. In this environment, the main share indices climbed to new highs. Later in the first quarter, however, stock-market sentiment worsened significantly. The announcement of the introduction of import duties by the US government and the ensuing political reactions fueled fears of a weakening of global free trade and, as a result, decreasing economic growth. The fear that central banks would raise interest rates faster than expected due to strong economic growth had an additional negative impact on the markets. The ongoing discussion about bans on vehicles with diesel engines had an increasingly adverse effect. While investors recognized the sustained good business development at Daimler and the long-term opportunities arising from high investment in technologies of the future, shares in automotive companies still remained favorably prices in the stock markets compared with other sectors.
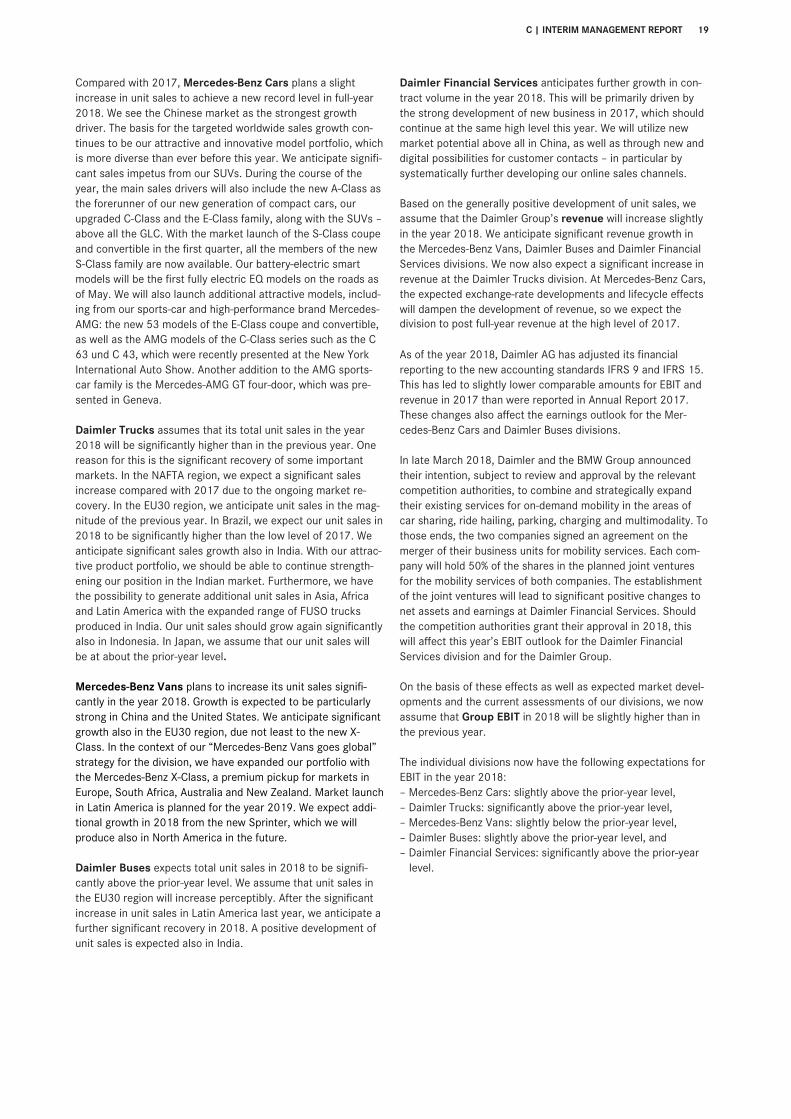
Positive news about truck orders received in the United States and the continuation of high levels of unit sales at Mercedes-Benz Cars provided additional impetus for Daimler’s share price. At the end of the first quarter, Daimler shares were priced at €68.97, which is approximately 3% lower than at the end of 2017. During the same period, the DAX fell by 6%, whereas the STOXX Europe Auto Index rose by 2%. At the beginning of April, we paid out our highest dividend so far of €3.65 per share (previous year: €3.25).
Favorable interest environment used for refinancing
In the first quarter of the year 2018, the Daimler Group once again undertook refinancing at attractive conditions in the international money and capital markets. During that period, Daimler raised funds of €4.7 billion from the issuance of bonds (Q1 2017: €6.7 billion). In February, Daimler Finance North America LLC issued three-, five- and ten-year bonds in the US capital market with a total volume of $3.0 billion.
55
60
65
70
75
80
In euros
3/182/181/1812/1711/1710/179/178/177/176/175/174/17
3/31/18
STOXX Europe Auto IndexDAX
Daimler AG
125
120
115
110
105
100
95
90
85
80
753/31/17 6/30/17 9/30/17 12/31/1712/30/16

6 C | INTERIM MANAGEMENT REPORT
Interim Management Report Unit sales significantly above prior-year level at 806,900 vehicles (+7%) Revenue up by 3% to €39.8 billion Group EBIT of €3.3 billion (Q1 2017: €3.8 billion) Net profit of €2.4 billion (Q1 2017: €2.7 billion) Free cash flow of industrial business of €1.8 billion (Q1 2017: €1.9 billion) Slight growth in unit sales and revenue anticipated for full-year 2018 Group EBIT expected to be slightly higher than in 2017
Business development
Ongoing expansion of world economy The world economy seems to have continued its strong ex-pansion in the first quarter of 2018, and is likely to have grown by more than 3% compared with the prior-year period once again. Although key economic indicators have weakened somewhat recently, they are still at a high level compared with the long-term average. The corrections in global stock markets and trade-policy tension resulting from protectionist measures taken by the US government have dampened global sentiment indicators, but have so far not had a significant impact on real economic growth. In the United States, the tax reform passed in late 2017 boosted optimism at companies, whereas consumer spending was rather moderate at the beginning of the year. As expected, the US Federal Reserve continued its course of in-creasing interest rates in March and raised its benchmark rates by another 25 basis points. In the European Monetary Union (EMU), business sentiment deteriorated slightly in the first quarter, but robust growth is likely to have continued due not least to the ongoing expansive monetary policy of the ECB. The Chinese economy also continued its stable development in the first three months of the year. Oil prices of between 65 and 70 US dollars per barrel were significantly higher than in the same period of last year, and prices of industrial raw materials also continued rising during the first quarter, although at significant-ly lower rates. This was to the benefit of emerging markets with significant levels of raw-material exports.
Worldwide demand for cars continued to develop favorably in the first quarter and increased slightly. The European market was slightly larger than in the prior-year period. Sales in West-ern Europe were only at the prior-year level, primarily due to the significant contraction of the British market. Demand increased in Germany and France, however. Sales figures continued to rise in Eastern Europe, mainly as a result of strong growth in Russia. In China, tax incentives for car buyers were discontin-ued at the beginning of the year, with a consequential dampen-ing effect on demand in the first quarter. The market expanded compared with the prior-year period, however. The US market for cars and light trucks remained at a very high level and was 2% larger than in the first quarter of last year. On the other hand, car sales in Japan decreased slightly.
Demand for medium- and heavy-duty trucks continued to develop very differently from one region to another. The market in the NAFTA region is in a buoyant recovery phase and sur-passed the prior-year level by more than 20%. Demand in the EU30 region (European Union, Switzerland and Norway), started the year at a solid level and actually increased slightly com-pared with the robust prior-year period. The Brazilian market recovered from a very low level and expanded by more than 50%. The Turkish market also posted significantly double-digit growth compared with its weak prior-year level. According to recent estimates, the Russian market continued its recovery in the first quarter.
The most important Asian markets from Daimler’s perspective displayed differing tendencies at the beginning of the year. In Japan, demand for light-, medium- and heavy-duty trucks de-creased significantly from the very solid prior-year level. In India, however, a significant market recovery was to be ob-served in the medium- and heavy-duty segment. The market now seems to be finally emerging from the regulatory burdens that significantly reduced demand in the previous year. The Chinese market was recently very volatile, but was above the prior-year level overall.
Demand for vans in the EU30 region continued to grow in the first quarter of 2018 with a 1% increase in the market volume for mid-size and large vans. Demand for small vans increased by 2%. In the segment of mid-size pickups, the market grew by 7% compared with the prior-year period. The US market for large vans was at the prior-year level. In Latin America, the market for large vans continued to develop positively compared with the first quarter of last year.
The market volume for buses in the EU30 region was at the prior-year level. Demand in Brazil increased significantly with a plus of more than 50% compared with the prior-year quarter.
Significant increase in first-quarter unit sales In the first quarter of 2018, Daimler sold 806,900 cars and commercial vehicles worldwide, surpassing the number sold in the prior-year period by 7%. C.01

C | INTERIM MANAGEMENT REPORT 7
Mercedes-Benz Cars increased its sales by 5% to 594,300 units in the first quarter of this year, its strongest-selling first quarter so far. In Europe, the record number of vehicles sold in the prior-year quarter was surpassed by 1% with sales of 244,200 Mercedes-Benz and smart automobiles. In the German market, the division achieved an increase of 6% to sell 78,500 units. First-quarter unit sales were higher than in the previous year also in France (+7%) and Spain (+4%). In China, sales in the first three months of the year increased by 16% to a new high of 178,800 units. South Korea (+18%) and India (+26%) also con-tributed to the successful development with new sales records. First-quarter unit sales in the United States amounted to 70,500 vehicles, which is 10% lower than in the prior-year peri-od. In Canada (+2%) and Mexico (+7%), more vehicles were sold in the months of January through March than ever before in that period.
Daimler Trucks increased its first-quarter unit sales by 21% to 113,800 units. In a positive market environment in the NAFTA region, we significantly increased our sales to 40,800 vehicles (Q1 2017: 32,900). In Latin America, we also achieved signifi-cant growth with 9,400 trucks sold (Q1 2017: 6,300). A key contribution came from the positive development in Brazil with sales of 4,000 units (Q1 2017: 2,400). In the EU30 region (European Union, Switzerland and Norway), our sales of 17,300 trucks were close to the number sold in the prior-year period (Q1 2017: 17,400). Our sales in Turkey increased to 1,800 vehicles (Q1 2017: 1,300). In Asia, we increased our unit sales by 26% and sold 37,700 trucks. Sales in Indonesia rose signifi-cantly to 12,500 units (Q1 2017: 7,200). In Japan, our sales of 12,000 vehicles were slightly higher than in the first quarter of last year (Q1 2017: 11,600). In India, we achieved growth of 66% to sell 6,200 vehicles.
In the first quarter of 2018, Mercedes-Benz Vans increased its unit sales by 7% to a new record of 93,000 vehicles. In the EU30 region, sales of 60,400 units were at the prior-year level (Q1 2017: 60,500). We achieved growth for example in Spain (+9%), France (+3%) and Switzerland (+16%). In the important German market, the van division’s sales grew by 7% to the new high of 22,300 units. The development in the NAFTA region was very positive. Unit sales in the United States increased by a signifi-cant 40% to 8,800 vehicles. In Latin America, first-quarter sales of 3,800 units were at the prior-year level (Q1 2017: 3,900). In China, Mercedes-Benz Vans further improved its position and also set a new record with an increase of 49% to sales of 6,500 units.
Unit sales by Daimler Buses increased by 6% to 5,700 buses and bus chassis in the first quarter. This growth primarily re-flects the stronger business with bus chassis in Latin America (excluding Mexico). In the EU30 region, we sold 1,400 vehicles of the Mercedes-Benz and Setra brands, representing a slight decrease compared with the first quarter of last year (-2%). In Latin America (excluding Mexico), Daimler Buses increased its unit sales by 30% and sold 3,100 bus chassis. In Mexico, we sold 500 units in the first quarter of 2018, which is 39% fewer than in the prior-year period. In India, however, we achieved growth of 83% and sold 340 units.
At Daimler Financial Services, new business increased com-pared with the prior-year period by 6% to €17.9 billion. Contract volume reached €141.7 billion at the end of March and was thus at the level of year-end 2017. Adjusted for exchange-rate effects, contract volume increased by 2%. The insurance busi-ness also continued to develop very positively. Worldwide, 523,000 insurance contracts were brokered by Daimler Finan-cial Services in the first quarter (Q1 2017: 468,000).
The Daimler Group’s revenue amounted to €39.8 billion in the first quarter, which is 3% higher than in the prior-year period. Adjusted for exchange-rate effects, revenue grew by 8%.
C.02
Revenue at Mercedes-Benz Cars increased by 2% to €23.0 billion. Daimler Trucks’ revenue rose by 8% to €8.6 billion. Due in particular to adverse exchange-rate effects and regional shifts in the sales structure, revenue increased at a lower rate than unit sales. Mercedes-Benz Vans increased its revenue by 4% to €3.1 billion. At Daimler Buses, rising unit sales in Latin America (without Mexico) along with falling sales in Europa and Mexico led to an overall 8% decrease in revenue to €850 mil-lion. Daimler Financial Services’ revenue increased by 2% to €6.0 billion.
C.01 Unit sales by division
Q1 2018 Q1 2017 % change
Daimler Group 806,905 754,259 +7
Mercedes-Benz Cars 594,299 568,070 +5
Daimler Trucks 113,846 94,007 +21
Mercedes-Benz Vans 93,016 86,778 +7
Daimler Buses 5,744 5,404 +6
C.02 Revenue by division In millions of euros Q1 2018 Q1 2017
1 % change
Daimler Group 39,785 38,582 +3
Mercedes-Benz Cars 22,998 22,521 +2
Daimler Trucks 8,619 7,951 +8
Mercedes-Benz Vans 3,098 2,977 +4
Daimler Buses 850 923 -8
Daimler Financial Services 6,020 5,911 +2
1 The comparative figures have been adjusted due to the effects of first-time adoption of IFRS 15 and IFRS 9. Information on the adjustments of the prior-year figures is provided in Note 1 of the Notes to the Inter-im Consolidated Financial Statements.

8 C | INTERIM MANAGEMENT REPORT
Profitability
The Daimler Group achieved first-quarter EBIT of €3,335 million in 2018, which is significantly below its prior-year earnings (Q1 2017: €3,771 million). C.03
C.03 EBIT by segment
In millions of euros Q1 2018 Q1 2017
1 % change
Mercedes-Benz Cars 2,060 1,998 +3
Daimler Trucks 647 662 -2
Mercedes-Benz Vans 172 337 -49
Daimler Buses 37 72 -49
Daimler Financial Services 548 524 +5
Reconciliation -129 178 .
Daimler Group
2 3,335 3,771 -12
1 The prior-year figures have been adjusted due to the effects of first-time adoption of IFRS 15 and IFRS 9. Information related to the ad-justments of the prior-year figures is disclosed in Note 1 of the Notes to the Interim Consolidated Financial Statements.
2 EBIT, the indicator of operating performance, comprises earnings before interest income and corporate income taxes. The reconciliation of the Daimler Group’s EBIT to earnings before income taxes is in-cluded in Note 19 of the Notes to the Interim Consolidated Financial Statements.
In the first quarter of 2018, the EBIT of the Mercedes-Benz Cars division was €2,060 million, which is slightly above the prior-year figure of €1,998 million. The division’s return on sales was 9.0% (Q1 2017: 8.9%). C.03
Daimler Trucks’ EBIT of €647 million was at the prior-year level (Q1 2017: €662 million). Its return on sales was 7.5% (Q1 2017: 8.3%). C.03
In the first quarter of the year 2018, the division’s earnings increased due to higher unit sales especially in the NAFTA region and efficiency enhancements. Negative impacts on EBIT resulted from exchange-rate effects and higher ex-penses for raw materials. In the first quarter of the previous year, the gain of €267 million on the sale of real estate by Mitsubishi Fuso Truck and Bus Corporation in Japan had a positive effect on earnings.
Mercedes-Benz Vans’ EBIT of €172 million was significant-ly below the prior-year level (Q1 2017: €337 million). The division’s return on sales decreased to 5.6% (Q1 2017: 11.3%) C.03
The positive development of unit sales, especially in the NAFTA region and China, did not offset expenses for the Sprinter model change, advance expenditure for new tech-nologies and products and higher expenses for raw materi-als.
Daimler Buses’ EBIT of €37 million was significantly below the very strong prior-year period (Q1 2017: €72 million). The division’s return on sales was 4.4% (Q1 2017: 7.8%). C.03
Earnings were reduced by an unfavorable product mix and higher expenses for raw materials. Further efficiency en-hancements only partially offset these effects.
In the first quarter of 2018, the Daimler Financial Services division achieved earnings of €548 million, thus slightly surpassing the prior-year figure (Q1 2017: €524 million). C.03
This positive development was mainly the result of in-creased contract volume. However, the higher level of inter-est rates and negative exchange-rate effects had a negative impact on earnings.
At Mercedes-Benz Cars, the slight earnings growth resulted primarily from the very positive development of the S-Class and the SUVs. However, Daimler Trucks’ earnings were at the prior-year level. The Mercedes-Benz Vans and Daimler Buses divisions posted significantly lower earnings than in the prior-year quarter. At Daimler Financial Services, earn-ings increased slightly due to the higher contract volume. Exchange-rate effects had an overall slightly negative impact on earnings.
The reconciliation of segment earnings to Group EBIT had a negative impact in the first quarter of 2018. In the first quarter of 2017, the reversal of an impairment of Daimler’s equity investment in BAIC Motor Corporation Ltd. (BAIC Motor) had a positive effect on EBIT.
In particular, the very positive development of unit sales of the S-Class and the SUVs made a significant contribution to the increase in earnings in the first quarter of 2018. How-ever, there were negative effects on earnings from advance expenditure for new technologies and future products and higher expenses for raw materials. In addition, increased expenses arising from the valuation of the leasing portfolio in Germany impacted earnings negatively. In the prior-year quarter earnings were significantly reduced by a non-recurring effect connected with the adoption of IFRS 15 (€236 million). Income of €183 million in connection with a new investor in HERE boosted EBIT additionally in the first quarter of the previous year.

C | INTERIM MANAGEMENT REPORT 9
C.04 Consolidated statement of income1 Consolidated Industrial Business2 Daimler Financial
Services
Q1 2018 Q1 2017 ³ Q1 2018 Q1 2017 ³ Q1 2018 Q1 2017 ³ In millions of euros
Revenue 39,785 38,582 33,765 32,671 6,020 5,911
Cost of sales -31,160 -30,579 -26,068 -25,530 -5,092 -5,049 Gross profit 8,625 8,003 7,697 7,141 928 862
Selling expenses -3,097 -3,071 -2,909 -2,912 -188 -159
General administrative expenses -971 -897 -741 -680 -230 -217
Research and non-capitalized development costs -1,712 -1,448 -1,712 -1,448 - -
Other operating income 331 671 287 622 44 49
Other operating expense -293 -172 -282 -164 -11 -8
Profit/loss on equity-method investments, net 343 719 348 721 -5 -2
Other financial income/expense, net 105 -37 95 -36 10 -1
Interest income 55 58 55 58 - -
Interest expense -139 -135 -138 -133 -1 -2 Profit before income taxes 3,247 3,691 2,700 3,169 547 522
Income taxes -893 -1,039 -729 -885 -164 -154 Net profit 2,354 2,652 1,971 2,284 383 368
thereof profit attributable to non-controlling interests 81 95
thereof profit attributable to shareholders of Daimler AG 2,273 2,557
Earnings per share (in euros)
for profit attributable to shareholders of Daimler AG
Basic 2.12 2.39 Diluted 2.12 2.39
2 The industrial business comprises the vehicle segments Mercedes-Benz Cars, Mercedes-Benz Trucks, Mercedes-Benz Vans and Daimler Buses. Intra-group eliminations between the industrial business and Daimler Financial Services are generally allocated to the industrial business.
3 The prior-year figures have been adjusted due to the effects of first-time adoption of IFRS 15 and IFRS 9. Information related to the adjustments of the prior-year figures is disclosed in Note 1 of the Notes to the Interim Consolidated Financial Statements.
The reconciliation of the divisions’ EBIT to Group EBIT comprises gains at the corporate level and the effects on earnings of eliminating intra-group transactions between the divisions.
Items at the corporate level resulted in expenses of €119 million in the first quarter of 2018 (Q1 2017: income of €187 million). In the first quarter of 2017, the reversal of an impairment of Daimler’s equity investment in BAIC Motor by an amount of €240 million had a positive effect on EBIT.
The elimination of intra-group transactions resulted in ex-penses of €10 million in the first quarter of 2018 (Q1 2017: €9 million).
Net interest expense in the first quarter of 2018 amounted to €84 million (Q1 2017: €77 million).
The income-tax expense recognized in the first quarter of 2018 amounts to €893 million (Q1 2017: €1,039 million) and developed in line with the change in profit before in-come taxes.
The effective tax rate developed from 28.1% to 27.5% in the reporting period. While in the previous year, high – partially tax-free – results from equity-method investments slightly reduced the tax rate, the lower nationwide federal corporate income tax rate for US companies had a positive impact on the tax rate in 2018.
Net profit for the first quarter of 2018 of €2,354 million (Q1 2017: €2,652 million) was significantly below the prior-year figure. Net profit of €81 million is attributable to non-controlling interests (Q1 2017: €95 million). Net profit attributable to the shareholders of Daimler AG amounts to €2,273 million (Q1 2017: €2,557 million), representing a decrease in earnings per share to €2.12 (Q1 2017: €2.39).
The calculation of earnings per share (basic) is based on an unchanged average number of outstanding shares of 1,069.8 million.
1 The columns “Industrial business” and “Daimler Financial Services” represent a business point of view.

10 C | INTERIM MANAGEMENT REPORT
Cash flows
In the first quarter of 2018, cash provided by operating activi-ties C.05 amounted to €0.8 billion (Q1 2017: €2.0 billion). The decrease was primarily due to the development of working capital and the general business performance. In addition, there
were effects from the renewed growth in the leasing and sales-financing business. However, the cash inflow of €0.3 billion as the dividend received from Beijing Benz Automotive Co., Ltd. (BBAC) increased cash provided by operating activities.
C.05 Condensed statement of cash flows1
Consolidated Industrial Business2 Daimler Financial Services
Q1 2018 Q1 2017³ Q1 2018 Q1 2017³ Q1 2018 Q1 2017³
In millions of euros
Cash and cash equivalents at beginning of period 12,072 10,981 9,515 8,751 2,557 2,230
Profit before income taxes 3,247 3,691 2,700 3,169 547 522
Depreciation and amortization/impairments 1,478 1,389 1,444 1,368 34 21 Other non-cash expense and income and gains/losses on disposals of assets -342 -986 -361 -1,009 19 23
Change in operating assets and liabilities
Inventories -2,072 -1,221 -2,103 -1,382 31 161
Trade receivables -4 30 91 183 -95 -153
Trade payables 2,485 2,247 2,309 2,057 176 190
Receivables from financial services -2,258 -1,491 -27 -55 -2,231 -1,436
Vehicles on operating leases -558 -659 455 224 -1,013 -883
Other operating assets and liabilities -787 -110 -616 -189 -171 79
Dividends received from equity-method investments 421 - 346 - 75 -
Income taxes paid -797 -850 -645 -735 -152 -115 Cash used for/provided by operating activities 813 2,040 3,593 3,631 -2,780 -1,591 Additions to property, plant and equipment and intangible assets -2,108 -2,147 -2,082 -2,120 -26 -27
Investments in and disposals of shareholdings 55 -109 129 -61 -74 -48 Acquisitions and sales of marketable debt securities and similar investments -383 2,087 -375 2,042 -8 45
Other 194 511 282 511 -88 - Cash used for/provided by investing activities -2,242 342 -2,046 372 -196 -30
Change in financing liabilities 3,581 -339 940 742 2,641 -1,081
Dividends paid -4 -12 -4 -11 - -1
Other transactions with shareholders -52 -42 -57 -42 5 -
Internal equity and financing transactions - - 429 -2,130 -429 2,130 Cash used for/provided by financing activities 3,525 -393 1,308 -1,441 2,217 1,048 Effect of foreign exchange rate changes on cash and cash equivalents -110 -4 -107 -6 -3 2 Cash and cash equivalents at end of period 14,058 12,966 12,263 11,307 1,795 1,659
2 The industrial business comprises the vehicle segments Mercedes-Benz Cars, Mercedes-Benz Trucks, Mercedes-Benz Vans and Daimler Buses. Intra-group eliminations between the industrial business and Daimler Financial Services are generally allocated to the industrial business.
3 The prior-year figures have been adjusted due to the effects of first-time adoption of IFRS 15 and IFRS 9. Information related to the adjustments of the prior-year figures is disclosed in Note 1 of the Notes to the Interim Consolidated Financial Statements.
1 The columns “Industrial business” and “Daimler Financial Services” represent a business point of view.

C | INTERIM MANAGEMENT REPORT 11
Cash used for/provided by investing activities C.05 amounted to a cash outflow of €2.2 billion (Q1 2017: cash inflow of €0.3 billion). The change compared with the first quarter of last year primarily reflects acquisitions and disposals of securities and similar investments in the context of liquidity management. Those transactions resulted in a net cash outflow in the first quarter of 2018, whereas disposals of securities significantly exceeded acquisitions in the prior-year period. In the first quarter of 2017, the sale of real estate in Japan led to a cash inflow of €0.3 billion.
Cash used for/provided by financing activities C.05 resulted in a cash inflow of €3.5 billion (Q1 2017: cash outflow of €0.4 billion). The increase was primarily due to a higher net cash inflow from financing liabilities in the context of refinanc-ing the leasing and sales-financing business.
Cash and cash equivalents increased compared with December 31, 2017 by €2.0 billion, after taking currency translation into account. Total liquidity, which also includes marketable debt securities and similar investments, increased by €2.3 billion to €24.5 billion.
C.06 Free cash flow of the industrial business
In millions of euros Q1 2018 Q1 2017 Change
Cash provided by operating activities 3,593 3,631 -38 Cash used for/provided by investing activities -2,046 372 -2,418 Change in marketable debt securities and similar invest-ments 375 -2,042 +2,417
Other adjustments -100 -16 -84 Free cash flow of the industrial business 1,822 1,945 -123
The parameter used by Daimler to measure the financial capa-bility of the Group’s industrial business is the free cash flow of the industrial business C.06, which is derived from the reported cash flows from operating and investing activities. The cash flows from the acquisition and sale of marketable debt securities and similar investments included in cash flows from investing activities are deducted, as those securities are allo-cated to liquidity and changes in them are thus not a part of the free cash flow.
Other adjustments relate to non-cash additions to property, plant and equipment that are allocated to the Group as their beneficial owner due to the form of their underlying lease contracts. Furthermore, effects from the financing of dealer-ships and effects from internal deposits within the Group are adjusted. In addition, the calculation of the free cash flow includes those cash flows to be shown under cash provided by financing activities in connection with the acquisition or disposal of interests in subsidiaries without loss of control.
In the first quarter of 2018, the free cash flow of the indus-trial business amounted to €1.8 billion (Q1 2017: €1.9 billion). This slight decrease resulted primarily from the development of working capital. In the first quarter of 2018, the dividend re-ceived from BBAC led to a cash inflow of €0.3 billion, whereas the prior year period was influenced by the sale of real estate in Japan.
In the first quarter 2018, the free cash flow of the Daimler Group led to a cash outflow of €1.1 billion (Q1 2017: cash inflow of €0.3 billion). Besides the effects of the free cash flow of the industrial business, the free cash flow of the Daimler Group is mainly affected by the leasing and sales-financing business of Daimler Financial Services.

12 C | INTERIM MANAGEMENT REPORT
C.07 Net liquidity of the industrial business
In millions of euros March 31,
2018 Dec. 31,
2017 Change
Cash and cash equivalents 12,263 9,515 +2,748 Marketable debt securities and similiar investments 9,133 8,894 +239 Liquidity 21,396 18,409 +2,987
Financing liabilities -2,464 -1,600 -864 Market valuation and currency hedges for financing liabilities -249 -212 -37 Financing liabilities (nominal) -2,713 -1,812 -901 Net liquidity 18,683 16,597 +2,086
C.08 Net debt of the Daimler Group
In millions of euros March 31,
2018 Dec. 31,
2017 Change
Cash and cash equivalents 14,058 12,072 +1,986 Marketable debt securities and similar investments 10,407 10,063 +344 Liquidity 24,465 22,135 +2,330
Financing liabilities -129,388 -127,124 -2,264 Market valuation and currency hedges for financing liabilities -283 -229 -54 Financing liabilities (nominal) -129,671 -127,353 -2,318 Net debt -105,206 -105,218 +12
C.09 Benchmark issuances Issuer
Volume Month
of issue Maturity
Daimler Finance North America $1,700 million Feb. 2018 Feb. 2021 Daimler Finance North America $675 million Feb. 2018 Feb. 2023 Daimler Finance North America $625 million Feb. 2018 Feb. 2028
The net liquidity of the industrial business C.07 is calcu-lated as the total amount as shown in the statement of financial position of cash, cash equivalents and marketable debt securi-ties and similar investments included in liquidity management, less the currency-hedged nominal amounts of financing liabili-ties.
To the extent that the Group’s internal refinancing of the finan-cial services business is provided by the companies of the industrial business, this amount is deducted in the calculation of the net debt of the industrial business.
Compared with December 31, 2017, the net liquidity of the industrial business increased by €2.1 billion to €18.7 billion. The increase was mainly due to the positive free cash flow.
Net debt at Group level, which primarily results from refinancing the leasing and sales-financing business, was unchanged com-pared with December 31, 2017 at €105.2 billion. C.08
The Daimler Group once again utilized attractive conditions in the international money and capital markets for refinancing in the first quarter of 2018.
In the first quarter of 2018, Daimler had a cash inflow of €4.7 billion from the issuance of bonds (Q1 2017: €6.7 billion). The redemption of bonds resulted in cash outflows of €4.4 billion (Q1 2017: €4.8 billion). A large proportion of the issuance volume was carried out in the form of so-called benchmark bonds (bonds with high nominal values). C.09
In addition to the issuances shown in the table, multiple smaller issuances were undertaken in various countries. In January 2018, Daimler AG issued a so-called panda-bond with a volume of RMB3.0 billion in the Chinese capital market.
Furthermore, two asset-backed securities (ABS) transac-tions were conducted in the United States in the first quarter of 2018, generating a refinancing volume of $2.3 billion.

C | INTERIM MANAGEMENT REPORT 13
Financial position
The balance sheet total increased compared with December 31, 2017 from €255.3 billion to €262.8 billion; adjusted for the effects of currency translation, the increase amounts to €9.3 billion. Daimler Financial Services accounts for €152.1 billion of the balance sheet total (December 31, 2017: €150.0 billion), equivalent to 58% of the Daimler Group’s total assets (December 31, 2017: 59%).
The increase in total assets is primarily due to higher cash and cash equivalents, the increased volume of the financial services business and higher inventories. On the liabilities side of the balance sheet, there were increases primarily in trade liabilities and financing liabilities, as well as in equity. Current assets account for 43% of the balance sheet total (December 31, 2017: 42%). Current liabilities amount unchanged to 34% of total equity and liabilities.
C.10 Condensed statement of financial position1 Consolidated Industrial Business2 Daimler Financial
Services
At March 31, At Dec. 31, At March 31, At Dec. 31, At March 31, At Dec. 31, 2018 2017³ 2018 2017³ 2018 2017³ In millions of euros Assets Intangible assets 13,962 13,735 13,065 12,789 897 946 Property, plant and equipment 28,095 27,981 28,033 27,914 62 67 Equipment on operating leases 47,079 47,074 18,049 18,071 29,030 29,003 Receivables from financial services 87,942 86,054 -99 -109 88,041 86,163 Equity-method investments 5,021 4,818 4,872 4,670 149 148 Inventories 27,579 25,686 26,451 24,492 1,128 1,194 Trade receivables 11,665 11,995 9,630 9,742 2,035 2,253 Cash and cash equivalents 14,058 12,072 12,263 9,515 1,795 2,557 Marketable debt securities and similar investments 10,407 10,063 9,133 8,894 1,274 1,169
thereof current 9,525 9,073 9,131 8,893 394 180 thereof non-current 882 990 2 1 880 989
Other financial assets 7,347 6,806 -10,614 -10,661 17,961 17,467 Other assets 9,181 9,061 -57 39 9,238 9,022 Assets held for sale 451 - - - 451 - Total assets 262,787 255,345 110,726 105,356 152,061 149,989 Equity and liabilities Total equity 66,887 65,159 54,628 52,780 12,259 12,379 Provisions 22,209 22,136 21,085 21,110 1,124 1,026 Financing liabilities 129,388 127,124 2,464 1,600 126,924 125,524
thereof current 49,147 48,746 -21,647 -19,435 70,794 68,181 thereof non-current 80,241 78,378 24,111 21,035 56,130 57,343
Trade payables 14,865 12,451 13,881 11,632 984 819 Other financial liabilities 9,481 9,275 5,505 5,375 3,976 3,900 Contract liabilities 11,114 11,208 10,756 10,862 358 346 Other liabilities 8,644 7,992 2,407 1,997 6,237 5,995 Liabilities held for sale 199 - - - 199 - Total equity and liabilities 262,787 255,345 110,726 105,356 152,061 149,989
2 The industrial business comprises the vehicle segments Mercedes-Benz Cars, Mercedes-Benz Trucks, Mercedes-Benz Vans and Daimler Buses. Intra-group eliminations between the industrial business and Daimler Financial Services are generally allocated to the industrial business.
3 The prior-year figures have been adjusted due to the effects of first-time adoption of IFRS 15 and IFRS 9. Information related to the adjustments of the prior-year figures is disclosed in Note 1 of the Notes to the Interim Consolidated Financial Statements.
Intangible assets of €14.0 billion (December 31, 2017: €13.7 billion) include €10.5 billion of capitalized development costs (December 31, 2017: €10.3 billion), €2.0 billion of fran-chises, industrial property and similar rights (December 31, 2017: €2.0 billion) and €1.1 billion of goodwill (December 31, 2017: €1.1 billion). The Mercedes-Benz Cars division accounts for 79% of the development costs while the Mercedes-Benz Vans and Daimler Trucks divisions each account for 10% (December 31, 2017: 10%).
Property, plant and equipment remain nearly unchanged at €28.1 billion (December 31, 2017: €28.0 billion). In the first quarter of 2018, €1.3 billion was invested worldwide, primarily at our production and assembly sites for new products and technologies and for the expansion and modernization of the production facilities. The sites in Germany accounted for €1.1 billion of capital expenditure (Q1 2017: €0.9 billion).
1 The columns “Industrial business” and “Daimler Financial Services” represent a business point of view.

14 C | INTERIM MANAGEMENT REPORT
Equipment on operating leases and receivables from financial services increased to €135.0 billion (December 31, 2017: €133.1 billion). The increase adjusted for exchange-rate effects of €3.3 billion was primarily caused by the higher level of new business at Daimler Financial Services. The business with end-customers was further expanded in Asia and Europe. The leasing and sales-financing business as a proportion of 51% of total assets was above the prior year-level (December 31, 2017: 52%).
Equity-method investments of €5.0 billion (December 31, 2017: €4.8 billion) mainly comprise the carrying amounts of our equity interests in Beijing Benz Automotive Co., Ltd., BAIC Motor Corporation Ltd. and There Holding B.V.
Inventories increased from €25.7 billion to €27.6 billion, equivalent to 10% of total assets and thus the same as at the end of 2017. The increase in stocks, mainly in finished goods, applied to all automotive divisions.
Trade receivables were below the prior-year level at €11.7 billion (December 31, 2017: €12.0 billion). The Mercedes-Benz Cars division accounts for 46% of these receivables and the Daimler Trucks division accounts for 26%.
Cash and cash equivalents increased compared with the end of the year 2017 by €2.0 billion to €14.1 billion.
Marketable debt securities and similar investments in-creased compared with December 31, 2017 from €10.1 billion to €10.4 billion. Those assets include the debt instruments that are allocated to liquidity, most of which are traded in active markets. They generally have an external rating of A or better.
Other financial assets increased by €0.5 billion to €7.3 billion. They primarily consist of derivative financial instruments, equity instruments in unconsolidated subsidiaries and other invest-ments, as well as loans and other receivables due from third parties.
Other assets of €9.2 billion (December 31, 2017: €9.1 billion) primarily comprise deferred tax assets and tax refund claims.
Assets held for sale of €0.5 billion and liabilities held for sale of €0.2 billion result from an agreement reached between the Daimler Group and the BMW Group in March 2018 to merge their business units for mobility services. See Note 2 of the Notes to the Interim Consolidated Financial Statements for further information.
The Group’s equity increased compared with December 31, 2017 from €65.2 billion to €66.9 billion. Positive effects result-ing from the net profit of €2.4 billion were partially offset by actuarial losses of €0.2 billion from the defined-benefit pension plans that are recognized in retained earnings, and the remeas-urement of derivative financial instruments of € 0.1 billion not recognized in profit and loss. In addition, there were negative effects from currency translation of €0.3 billion. Equity attribut-able to the shareholders of Daimler AG therefore increased to €65.5 billion (December 31, 2017: €63.9 billion).
Equity adjusted for the dividend increased in proportional to the increase in the balance-sheet total of 3%. The Group’s equity ratio of 24.0% was therefore at the level of year-end 2017; the equity ratio for the industrial business was 45.8% (December 31, 2017: 46.4%).
Provisions of €22.2 billion were slightly above the level of December 31, 2017 (€22.1 billion); as a proportion of the bal-ance-sheet total, they amount to 8%, which is below the prior-year level (9%). They primarily comprise provisions for pensions and similar obligations of €6.1 billion (December 31, 2017: €5.8 billion), which mainly consist of the difference between the present value of defined-benefit pension obligations of €31.5 billion (December 31, 2017: €31.7 billion) and the fair value of the pension plan assets applied to finance those obligations of €26.6 billion (December 31, 2017: €27.2 billion). Provisions also relate to liabilities from income taxes of €1.6 billion (De-cember 31, 2017: €1.6 billion), from product warranties of €6.6 billion (December 31, 2017: €6.7 billion) and from person-nel and social costs of €4.2 billion (December 31, 2017: €4.4 billion), as well as other provisions of €3.6 billion (Decem-ber 31, 2017: €3.6 billion).
Financing liabilities of €129.4 billion were above the level of December 31, 2017 (€127.1 billion). Adjusted for exchange-rate effects, the increase amounts to €3.3 billion. 51% of the financing liabilities are accounted for by notes and bonds, 28% by liabilities to financial institutions, 9% by deposits in the direct banking business and 9% by liabilities from ABS transactions.
Trade payables increased to €14.9 billion (December 31, 2017: €12.5 billion), primarily due to the higher volume of business. The Mercedes-Benz Cars division accounts for 63% of those payables and the Daimler Trucks division accounts for 22%.
Other financial liabilities of €9.5 billion (December 31, 2017: €9.3 billion) mainly consist of liabilities from derivative financial instruments, residual value guarantees, accrued interest on financing liabilities, deposits received and liabilities from sala-ries and wages.
Contract liabilities remained nearly unchanged at €11.1 billion (December 31, 2017: €11.2 billion). They mainly comprise deferred revenue for service and maintenance contracts and for extended warranty contracts, as well as obligations from sales in the scope of IFRS 15.
Other liabilities of €8.6 billion (December 31, 2017: €8.0 billion) primarily comprise deferred income, tax liabilities, and deferred taxes. The increase was partially the result of higher tax liabilities.
Further information on the assets presented in the statement of financial position and on the Group’s equity and liabilities is provided in the Consolidated Statement of Financial Position, the Consolidated Statement of Changes in Equity and the relat-ed notes in the Notes to the Interim Consolidated Financial Statements.

C | INTERIM MANAGEMENT REPORT 15
Workforce
At the end of the first quarter of 2018, the Daimler Group employed 294,029 people worldwide (end of 2017: 289,321). Of that total, 173,882 people were employed in Germany (end of 2017: 172,089), 24,426 in the United States (end of 2017: 23,513), 10,027 in Brazil (end of 2017: 9,800) and 9,898 in Japan (end of 2017: 10,016). Our consolidated companies in China had 4,150 employees at the end of March (end of 2017: 4,099). C.11
Important events
Changes in the Board of Management and the Supervisory Board In February 2018, the Supervisory Board of Daimler AG extend-ed the contract of Renata Jungo Brüngger until the end of 2023. Jungo Brüngger has been a member of the Board of Manage-ment of Daimler AG with responsibility for Integrity and Legal Affairs since January 1, 2016; her contract would have expired at the end of 2018.
On April 5, 2018, the Annual Shareholders’ Meeting once again elected Sari Baldauf, formerly Chairwoman of the Board of Directors of Fortum Oyj, Finland, and Dr. Jürgen Hambrecht, Chairman of the Supervisory Board of BASF SE, as members of the Supervisory Board of Daimler AG representing the share-holders. Marie Wieck, General Manager at IBM Blockchain, was elected for the first time as a member of the Supervisory Board representing the shareholders. The period of office of the three Supervisory Board members began after the end of the 2018 Annual Shareholders’ Meeting and ends at the end of the Annual Shareholders’ Meeting in 2023.
Elections of members of the Supervisory Board representing the employees were held in March and April 2018. Dr. Sabine Zimmer and Raymond Curry Jr. were newly elected. With Ray-mond Curry Jr., there will continue to be a member of the Su-pervisory Board of Daimler AG as a trade-union representative from outside Germany. Jörg Spies and Valter Sanches are no longer members of the new Supervisory Board. The period of office of the Supervisory Board members representing the employees began after the end of the 2018 Annual Sharehold-ers’ Meeting and expires at the end of the Annual Shareholders’ Meeting in 2023.
Daimler welcomes new major shareholder The Chinese entrepreneur Li Shufu has acquired a 9.69% equity interest in Daimler AG. Daimler is pleased to announce that with Li Shufu it could win another long-term orientated share-holder, which is convinced by Daimler’s innovation strength, the strategy and the future potential. Daimler knows and appreci-ates Li Shufu as an especially knowledgeable Chinese entrepre-neur with clear vision for the future, with whom one can con-structive discuss the change in the industry. Daimler has got a broad-based portfolio and footprint in China and with BAIC a strong partner on site. Daimler and BMW Group agree to merge their mobility services Subject to review and approval by the relevant authorities, Daimler and the BMW Group plan to combine and strategically expand their existing services for on-demand mobility in the areas of car sharing, ride hailing, parking, charging and multi-modality. The two companies will each hold 50% of the shares in the joint ventures for mobility services of both companies. The agreement was signed in March and has the goal of making the joint ventures into one of the leading providers of innovative mobility services.
Employees by division (as of March 31, 2018)C.11
Mercedes-Benz Cars 144,757
Daimler Trucks 81,059
Mercedes-Benz Vans 25,768
Daimler Buses 18,605
Daimler Financial Services 13,260
Group Functions & Services 10,580
Daimler Group 294,029

16 C | INTERIM MANAGEMENT REPORT
Risk and opportunity report
The risks and opportunities that can have a significant influence on the profitability, cash flows and financial position of the Daimler Group, as well as detailed information on our risk and opportunity management system, are presented on pages 155 to 169 of our Annual Report 2017. In addition, we refer to the notes on forward-looking statements provided at the end of this Interim Management Report.
In the first quarter of 2018, the risks that could arise from the increasingly trade-restrictive policy of the US administration have exacerbated. The transition from protectionist rhetoric to specific actions, such as the decision of the US government to impose import duties on steel and aluminum, has increased the risk of further measures and countermeasures, by the EU or China for example, leading to a spiral of protectionist actions. This could have considerable negative consequences for global sentiment indicators and investment decisions, and ultimately also for the growth of the world economy. As reported in Annual Report 2017, insufficient availability of vehicle components, interruptions in the supply chain and possible interruptions in supply by energy providers can lead to bottlenecks. This can affect the Mercedes-Benz Cars and the Daimler Trucks divisions. Compared with the situation de-scribed in Annual Report 2017, the probability of occurrence and possible impact of production and technology risks are unchanged.
Furthermore, in April 2018, the U.S. Department of the Treas-ury’s Office of Foreign Assets Control announced sanctions against various persons and companies. Daimler is examining the extent to which its business activities – in particular with sanctioned business partners in Russia – might be affected. The geopolitical environment continues to be a source of risks, which increased slightly in the first quarter of 2018.
Currently, Daimler is subject to governmental information re-quests, inquiries, investigations and administrative proceedings as well as litigation relating to environmental, securities, crimi-nal, antitrust and other laws and regulations in connection with diesel exhaust emissions. Several federal and state authorities and institutions worldwide have inquired about and/or are investigating test results, the emission control systems used in Mercedes-Benz diesel vehicles and/or Daimler’s interaction with the relevant federal and state authorities as well as related legal issues and implications, including, but not limited to, under applicable environmental, securities, criminal and anti-trust laws. These authorities include, amongst others, the U.S. Department of Justice (“DOJ”), which has requested that Daim-ler conduct an internal investigation, the U.S. Environmental Protection Agency (“EPA”), the California Air Resources Board (“CARB”) and other US state authorities, the U.S. Securities and Exchange Commission (“SEC”), the European Commission, with which Daimler has filed a leniency application, as well as na-tional cartel authorities and other authorities of various foreign states as well as the German Federal Financial Supervisory Authority (“BaFin”) and the German Federal Motor Transport Authority (“KBA”). The Stuttgart district attorney’s office is conducting criminal investigation proceedings against Daimler employees on the suspicion of fraud and criminal advertising, and searched the premises of Daimler at several locations in Germany. Further, Daimler comprehensively responded to the diesel emissions committee of inquiry of the German Parlia-ment. Daimler continues to fully cooperate with the authorities and institutions. Irrespective of such cooperation by Daimler, it is possible that further civil and criminal investigative and en-forcement actions and measures relating to Daimler and/or its employees will be taken, such as subpoenas, i.e. legal instruc-tions issued under penalty of law in the process of taking evi-dence, or other requests for documentation, testimony or other information, further search warrants, a notice of violation or an increased formalization of the governmental proceedings. Addi-tionally, delays in obtaining regulatory approvals necessary to introduce new or recertify existing diesel models could occur.

C | INTERIM MANAGEMENT REPORT 17
In 2017, US environmental authorities issued notices of viola-tion to another vehicle manufacturer, and the United States filed a related complaint against such manufacturer. In such notices of violation and complaint, functionalities were identi-fied, apparently including functionalities that are common in diesel vehicles, as undisclosed Auxiliary Emission Control De-vices (AECDs) and, in some unspecified cases, as impermissi-ble. Further, in a request for a hearing submitted to Daimler in the first quarter of 2018, KBA has expressed the suspicion that certain specified functionalities in a vehicle type could be im-permissible. In light of these matters and in light of the ongoing governmental information requests, inquiries, investigations and administrative proceedings, and our own internal investigation, it cannot be ruled out that the various authorities reach the conclusion that Mercedes-Benz diesel vehicles have similar and/or impermissible functionalities. Furthermore, the authori-ties have increased scrutiny of Daimler’s running change, field fix, and defect reporting processes and compliance. The inquir-ies, investigations, legal actions and proceedings as well as the replies to the governmental information requests and our inter-nal investigation are still ongoing and open; hence, Daimler cannot predict the outcome at this time. If these or other inquir-ies, investigations, legal actions and/or proceedings result in unfavorable findings, an unfavorable outcome or otherwise develop unfavorably, Daimler could be subject to significant monetary penalties, remediation requirements, vehicle recalls, process improvements, mitigation measures and the early
termination of promotional loans, and/or other sanctions, measures and actions, including further investigations by these or other authorities and additional litigations. The occurrence of the aforementioned events in whole or in part could cause significant collateral damage including reputational harm. Fur-ther, a negative determination or finding with respect to tech-nical or legal issues by one of the various governmental agen-cies could result in other agencies also adopting such determi-nation or finding, even if such determination or finding is not within the scope of such authority's responsibility or jurisdic-tion. Thus, a negative determination or finding in one proceed-ing carries the risk of having an adverse effect on other pro-ceedings, also potentially leading to new or expanded investiga-tions or proceedings.
In addition, Daimler’s ability to defend itself in litigations could be impaired by unfavorable findings, results or developments in any of the governmental information requests, inquiries, inves-tigations, legal actions and proceedings discussed above. Therefore, it cannot be ruled out that the risks discussed above may materially adversely impact our profitability, cash flows and financial position.
Beyond the above, our assessment of risks and opportunities has not changed significantly since publication of Annual Report 2017.

18 C | INTERIM MANAGEMENT REPORT
Outlook
At the beginning of the second quarter, the economic outlook for the world economy continues to be good, so the solid growth dynamism should continue as the year progresses. As before, current forecasts for full-year 2018 are above the 3% mark. The US economy should continue its upswing and accel-erate its growth to more than 2.5% thanks to stable domestic demand and impetus from the tax reform passed in late 2017. Irrespective of political uncertainties, most indicators for the economy of the European Monetary Union (EMU) also signal an above-average development for the year 2018. On the basis of robust domestic demand and a solid contribution from foreign trade, economic growth of more than 2% should be achieved, once again. In view of ongoing uncertainty in connection with the impending exit from the EU by the United Kingdom, the growth of the British economy is likely to be moderate at around 1.5%. The further development of the Chinese economy is of key importance for the world economy. Based on the extremely robust economic development in 2017, the majority of analysts expect a slight slowdown in growth to about 6.5% due to a reduction in state stimuli and somewhat more restric-tive lending. The South American economic area should contin-ue along its recovery path this year with some acceleration, but will remain below its potential with expansion of just under 2.5%. This applies in particular to Brazil, where the economic recovery should gradually pick up in the course of the year, but is expected to be rather moderate compared to earlier up-swings with growth of approximately 2.5%. In Eastern Europe, growth is likely to weaken somewhat overall following the ex-tremely dynamic development in 2017, mainly due to the con-solidation of growth rates in larger economies such as Turkey and Poland. However, in Russia, the largest market, slight ac-celeration is to be expected after the so-far restrained recovery. The greatest risk for the positive outlook for the global economy at present is certainly the exacerbation of current trade-policy tensions.
Worldwide demand for cars is likely to increase again from an already high level. Slight growth of approximately 2% is current-ly expected. In Europe, we expect a slight increase in overall car sales. As the market volume in Western Europe is now above average again, demand should remain fairly stable. In Eastern Europe, a significant increase in sales is anticipated, primarily due to the ongoing recovery of the Russian market. The US market for cars and light trucks should maintain its high level of approximately 17 million units sold. The Chinese car market continues to be significantly affected by regulatory conditions. At the beginning of 2018, the tax rate on purchases of cars with small engines (up to 1.6 liters) was raised back to its original level of 10%, which is likely to dampen demand this year. None-theless, slight growth of the Chinese car market is expected. In Japan, we assume that the car market will undergo a slight downward correction, while demand in India should continue to grow significantly.
Demand for medium- and heavy-duty trucks should in-crease significantly in most of the regions relevant to us. In the NAFTA region, the cyclical recovery of the truck market should continue as the year progresses. In weight classes 6-8, we anticipate a significant increase in sales in the full year. In an ongoing favorable economic environment, we assume that demand in the EU30 region will maintain the robust market volume of the previous year. In Brazil, it is to be expected that a somewhat livelier economic recovery will bring about significant growth of the truck market, although from a very low level. The Turkish market should also grow significantly from its present low level. In Russia, we expect further significant growth in demand for trucks.
The most important Asian markets from Daimler’s perspective are likely to present a varied picture in 2018. In the Japanese market for light-, medium- and heavy-duty trucks, we anticipate a slight market correction at an ongoing solid level. We assume that the Indonesian truck market will develop positively. In India, demand for medium- and heavy-duty trucks should recov-er significantly from the market contraction of 2017. In the Chinese market, a significant correction is to be expected fol-lowing the extremely high volume of the previous year.
For the year 2018, in the EU30 region, we expect slight market growth for small vans, in the combined segment for mid-size and large vans, and in the segment for mid-size pickups. In the United States, demand for large vans should be slightly higher than in the previous year. The market for large vans in Latin America should continue its recovery in 2018. In China, we also anticipate significantly more lively demand in the market we address there.
We expect the bus market in the EU30 region to grow slightly compared with 2017. There is a significantly positive effect on the market situation in Latin America from the upward trend of the Brazilian economy. Following the significant declines until 2016 and the upturn in 2017, we assume that the significant market recovery will continue in 2018. We anticipate a signifi-cant revival of demand also in India.
On the basis of the assumptions presented above on the devel-opment of the markets important for us and of the divisions’ current assessments, Daimler expects to slightly increase its total unit sales in the year 2018.
C | INTERIM MANAGEMENT REPORT 19
Compared with 2017, Mercedes-Benz Cars plans a slight increase in unit sales to achieve a new record level in full-year 2018. We see the Chinese market as the strongest growth driver. The basis for the targeted worldwide sales growth con-tinues to be our attractive and innovative model portfolio, which is more diverse than ever before this year. We anticipate signifi-cant sales impetus from our SUVs. During the course of the year, the main sales drivers will also include the new A-Class as the forerunner of our new generation of compact cars, our upgraded C-Class and the E-Class family, along with the SUVs – above all the GLC. With the market launch of the S-Class coupe and convertible in the first quarter, all the members of the new S-Class family are now available. Our battery-electric smart models will be the first fully electric EQ models on the roads as of May. We will also launch additional attractive models, includ-ing from our sports-car and high-performance brand Mercedes-AMG: the new 53 models of the E-Class coupe and convertible, as well as the AMG models of the C-Class series such as the C 63 und C 43, which were recently presented at the New York International Auto Show. Another addition to the AMG sports-car family is the Mercedes-AMG GT four-door, which was pre-sented in Geneva.
Daimler Trucks assumes that its total unit sales in the year 2018 will be significantly higher than in the previous year. One reason for this is the significant recovery of some important markets. In the NAFTA region, we expect a significant sales increase compared with 2017 due to the ongoing market re-covery. In the EU30 region, we anticipate unit sales in the mag-nitude of the previous year. In Brazil, we expect our unit sales in 2018 to be significantly higher than the low level of 2017. We anticipate significant sales growth also in India. With our attrac-tive product portfolio, we should be able to continue strength-ening our position in the Indian market. Furthermore, we have the possibility to generate additional unit sales in Asia, Africa and Latin America with the expanded range of FUSO trucks produced in India. Our unit sales should grow again significantly also in Indonesia. In Japan, we assume that our unit sales will be at about the prior-year level.
Daimler Buses expects total unit sales in 2018 to be signifi-cantly above the prior-year level. We assume that unit sales in the EU30 region will increase perceptibly. After the significant increase in unit sales in Latin America last year, we anticipate a further significant recovery in 2018. A positive development of unit sales is expected also in India.
Daimler Financial Services anticipates further growth in con-tract volume in the year 2018. This will be primarily driven by the strong development of new business in 2017, which should continue at the same high level this year. We will utilize new market potential above all in China, as well as through new and digital possibilities for customer contacts – in particular by systematically further developing our online sales channels.
Based on the generally positive development of unit sales, we assume that the Daimler Group’s revenue will increase slightly in the year 2018. We anticipate significant revenue growth in the Mercedes-Benz Vans, Daimler Buses and Daimler Financial Services divisions. We now also expect a significant increase in revenue at the Daimler Trucks division. At Mercedes-Benz Cars, the expected exchange-rate developments and lifecycle effects will dampen the development of revenue, so we expect the division to post full-year revenue at the high level of 2017.
As of the year 2018, Daimler AG has adjusted its financial reporting to the new accounting standards IFRS 9 and IFRS 15. This has led to slightly lower comparable amounts for EBIT and revenue in 2017 than were reported in Annual Report 2017. These changes also affect the earnings outlook for the Mer-cedes-Benz Cars and Daimler Buses divisions.
In late March 2018, Daimler and the BMW Group announced their intention, subject to review and approval by the relevant competition authorities, to combine and strategically expand their existing services for on-demand mobility in the areas of car sharing, ride hailing, parking, charging and multimodality. To those ends, the two companies signed an agreement on the merger of their business units for mobility services. Each com-pany will hold 50% of the shares in the planned joint ventures for the mobility services of both companies. The establishment of the joint ventures will lead to significant positive changes to net assets and earnings at Daimler Financial Services. Should the competition authorities grant their approval in 2018, this will affect this year’s EBIT outlook for the Daimler Financial Services division and for the Daimler Group.
On the basis of these effects as well as expected market devel-opments and the current assessments of our divisions, we now assume that Group EBIT in 2018 will be slightly higher than in the previous year.
The individual divisions now have the following expectations for EBIT in the year 2018: – Mercedes-Benz Cars: slightly above the prior-year level,– Daimler Trucks: significantly above the prior-year level,– Mercedes-Benz Vans: slightly below the prior-year level,– Daimler Buses: slightly above the prior-year level, and– Daimler Financial Services: significantly above the prior-year
level.
Mercedes-Benz Vans plans to increase its unit sales signifi-cantly in the year 2018. Growth is expected to be particularly strong in China and the United States. We anticipate significant growth also in the EU30 region, due not least to the new X-Class. In the context of our “Mercedes-Benz Vans goes global” strategy for the division, we have expanded our portfolio with the Mercedes-Benz X-Class, a premium pickup for markets in Europe, South Africa, Australia and New Zealand. Market launch in Latin America is planned for the year 2019. We expect addi-tional growth in 2018 from the new Sprinter, which we will produce also in North America in the future.

20 C | INTERIM MANAGEMENT REPORT
The anticipated development of earnings in the automotive divisions will have a positive impact on the free cash flow of the industrial business also in the year 2018. Despite a fur-ther increase in advance expenditure for new products and technologies, the free cash flow from the industrial business should be significantly above the level of 2017 and also higher than the dividend distribution in 2018. It must be taken into consideration, however, that the free cash flow of the industrial business in 2017 was reduced by an extraordinary contribution of €3 billion to the German pension plan assets of Daimler AG.
Against the backdrop of further efficiency improvements in the context of the medium- and long-term programs for the struc-tural improvement of our business processes, we assume that our ambitious growth targets can be achieved with only a slight increase in the size of our workforce.
Forward-looking statements: This document contains forward-looking statements that reflect our current views about future events. The words “anticipate”, “assume”, “believe”, “estimate”, “expect”, “intend”, “may”, “can”, “could”, “plan”, “project”, “should” and similar expressions are used to identify forward-looking state-ments. These statements are subject to many risks and uncertainties, including an adverse development of global economic conditions, in particu-lar a decline of demand in our most important markets; a deterioration of our refinancing possibilities on the credit and financial markets; events of force majeure including natural disasters, acts of terrorism, political unrest, armed conflicts, industrial accidents and their effects on our sales, purchasing, production or financial services activities; changes in currency exchange rates; a shift in consumer preferences towards smaller, lower-margin vehi-cles; a possible lack of acceptance of our products or services which limits our ability to achieve prices and adequately utilize our production capacities; price increases for fuel or raw materials; disruption of production due to shortages of materials, labor strikes or supplier insolvencies; a decline in resale prices of used vehicles; the effective implementation of cost reduction and efficiency-optimization measures; the business outlook for companies in which we hold a significant equity interest; the successful implementation of strategic cooperations and joint ventures; changes in laws, regulations and government policies, particularly those relating to vehicle emissions, fuel economy and safety; the resolution of pending government investigations or of investigations requested by governments and the conclusion of pending or threatened future legal proceedings; and other risks and uncertainties, some of which we describe under the heading “Risk and Opportunity Report” in the current Annual Report. If any of these risks and uncertainties material-izes or if the assumptions underlying any of our forward-looking statements prove to be incorrect, the actual results may be materially different from those we express or imply by such statements. We do not intend or assume any obligation to update these forward-looking statements since they are based solely on the circumstances at the date of publication.

D | THE DIVISIONS 21
Mercedes-Benz Cars Record unit sales of 594,300 vehicles (Q1 2017: 568,100) Continued strong demand for new E-Class and SUVs World premiere of new A-Class EBIT slightly above prior-year level at €2,060 million (Q1 2017: €1,998 million)
D.01 € amounts in millions Q1 2018 Q1 2017 % change
Revenue 22,998 22,521 1 +2
EBIT 2,060 1,998 1 +3
Unit sales 594,299 568,070 +5
Production 608,071 584,942 +4
Employees 144,757 142,666 2 +1
1 Amounts adjusted due to first-time adoption of IFRS 15 and IFRS 9 2 As of December 31, 2017
D.02 Unit sales Q1 2018 Q1 2017 % change
Total 594,299 568,070 +5
Europe 244,178 241,403 +1
thereof Germany 78,547 74,072 +6
United States 70,490 78,425 -10
China 178,817 154,563 +16
Other markets 100,814 93,679 +8
New record for unit sales at Mercedes-Benz Cars Mercedes-Benz Cars’ unit sales increased by 5% to 594,300 vehicles in the first quarter of 2018. The division thus set a new record once again in the past quarter. Revenue rose by 2% to €23.0 billion and EBIT amounted to €2,060 million (Q1 2017: €1,998 million).
In Europe, the record from the first quarter of last year was slightly surpassed with sales of 244,200 Mercedes-Benz and smart automobiles (+1%). In the German market, the car divi-sion achieved an increase of 6% and sold 78,500 vehicles. First-quarter unit sales were higher than in the previous year also in in France (+7%) and Spain (+4%). New records were set in Bel-gium (+9%) and Sweden (+6%) – as well as in Poland, where growth was particularly strong at 43%. In China, sales in the first three months of the year increased by 16% to a new high of 178,800 units. The successful development was supported also by new sales records in South Korea (+18%), India (+26%) and Malaysia (+29%). Unit sales in the United States totaled 70,500 vehicles in the past quarter (Q1 2017: 78,400). In Canada (+2%) and Mexico (+7%), more vehicles were sold in the months of January through March than ever before in that period.
SUVs as the strongest-selling segment Demand for the SUVs from Mercedes-Benz increased in the first quarter by 13% with sales of 212,300 units. Growth in sales of the S-Class sedan was even stronger: 21,100 of these luxury automobiles were sold in the first quarter, which is 31% more than in the first three months of last year. With an increase of 6%, sales of the E-Class sedan and wagon reached the new record of 90,800 units. Sales of 101,800 units of the C-Class sedan and wagon shortly before the model change were slightly above the prior-year level (+1%). With the compact cars, in the quarter before the market launch of the new A-Class, a total of 98,000 of the A-and B-Class, the CLA and the CLA Shooting Brake were sold (Q1 2017: 102,200). Sales of the two-door and four-door smart models totaled 30,400 units (Q1 2017: 34,000).
World premiere of new A-Class The new A-Class, which sets the new benchmark for the com-pact class, had its world premiere in the first quarter. Further-more, the complete C-Class family – with the sedan, wagon, convertible and coupe – was upgraded and presented to the public. Additional new models shown in the first quarter were the new G-Class, the four-door Mercedes-AMG GT coupe, the upgraded Mercedes-Maybach S-Class and the further refined Mercedes-Maybach Pullman. The convertible and coupe ver-sions of the new S-Class have been available in Europe and the United States since the first quarter. The new CLS coupe was launched in the European market in March. The battery-electric versions of the smart models have been sold under the EQ product and technology brand since the corresponding an-nouncement at the Geneva Motor Show.
Ongoing worldwide investment by Mercedes-Benz Cars in electric offensive and the world’s most advanced car plant The plants of the Mercedes-Benz Cars division operated at high levels of capacity utilization once again in the first quarter. We continue to expand our global production network and are pushing ahead with our electric offensive. At the Mercedes-Benz plant in Sindelfingen, we presented “Factory 56” – one of the world’s most advanced automobile production facilities – and laid the foundation stone for the first factory of this kind. “Factory 56” combines three pioneering characteristics: It is thoroughly digital and flexible, and it puts life into the term green production. In Thailand, we have started the construction of another battery factory. With this strategic decision, Mer-cedes-Benz Cars is strengthening its presence in Southeast Asia to meet the growing demand for electric mobility in that region. This will enable us to produce batteries at six sites on three continents in the future.

22 D | THE DIVISIONS
Daimler Trucks Unit sales significantly above prior-year level at 113,800 vehicles (Q1 2017: 94,000) Mercedes-Benz eActros to be tested in everyday customer use Trucks from Daimler Trucks subsidiary FUSO driving in digitally linked mode on public roads in Greater Tokyo EBIT of €647 million (Q1 2017: €662 million)
D.03 € amounts in millions Q1 2018 Q1 2017 % change
Revenue 8,619 7,951 1 +8
EBIT 647 662 1 -2
Unit sales 113,846 94,007 +21
Production 120,770 104,799 +15
Employees 81,059 79,483 2 +2
1 Amounts adjusted due to first-time adoption of IFRS 15 and IFRS 9 2 As of December 31, 2017
D.04 Unit sales Q1 2018 Q1 2017 % change
Total 113,846 94,007 +21
EU30
1 17,250 17,394 -1
NAFTA 40,822 32,906 +24
Latin America (excl. Mexico) 9,370 6,324 +48
Asia 37,675 30,000 +26
Other markets 8,729 7,383 +18
BFDA (Auman Trucks) 24,009 26,433 -9
Total (incl. BFDA) 137,855 120,440 +14
1 European Union, Switzerland and Norway
Strong unit sales in the first quarter Daimler Trucks increased its first-quarter unit sales by 21% to 113,800 vehicles and its revenue rose to €8.6 billion (Q1 2017: €8.0 billion). EBIT of €647 million was at the level of the prior-year figure of €662 million, which included an income of €267 million from the sale of real estate at the site in Kawasaki, Japan.
First-quarter sales significantly higher than in 2017 In a positive market environment in the NAFTA region, we were able to increase our sales significantly to 40,800 units (Q1 2017: 32,900). We continue to be the market leader in weight classes 6-8 with a market share of 41.5% (Q1 2017: 40.8%). We achieved significant growth also in Latin America with sales of 9,400 vehicles (Q1 2017: 6,300). A key contribution came from the positive development in Brazil, where we sold 4,000 units (Q1 2017: 2,400). Our share of the medium- and heavy-duty market segment in Brazil was 29.4% (Q1 2017: 30.6%). Our sales of 17,300 trucks in the EU30 region (European Union, Switzerland and Norway) were close to the prior-year level (Q1 2017: 17,400). In this region, we are the market leader in the medium- and heavy-duty segment with Mercedes-Benz, taking a share of 18.3% in the first quarter (Q1 2017: 18.8%). In Germa-ny, we had sales of 6,100 vehicles (Q1 2017: 6,500 units). Our truck sales in Turkey increased to 1,800 units (Q1 2017: 1,300). In Asia, we increased our unit sales by 26% to 37,700 vehicles. Sales in Indonesia increased significantly to 12,500 units (Q1 2017: 7,200). Our sales of 12,000 units in Japan were slightly higher than in the first quarter of last year (Q1 2017: 11,600). We achieved a market share in the overall Japanese truck mar-ket of 18.7% with the FUSO brand (Q1 2017: 17.6%). Our sales of 6,200 units in India were significantly higher than in the prior-year period (Q1 2017: 3,700). We increased the market share accounted for by BharatBenz in the segment of upper medium- and heavy-duty trucks to 8.7% (Q1 2017: 7.2%). Sales of Auman trucks by our joint venture in China, BFDA, decreased to 24,000 units (Q1 2017: 26,400).
Mercedes-Benz eActros going into customer use Starting in late April, the everyday practicality and economy of ten heavy-duty Mercedes-Benz electric trucks are to be tested in use by customers. Trials will be performed by customers in Germany and Switzerland of two variants of the Mercedes-Benz eActros with 18 and 25 tons gross vehicle weight. The pilot customers will test the innovation fleet for twelve months and for purposes that would otherwise be undertaken by trucks with conventional diesel engines. The goal is to be able to mass-produce electric trucks for heavy-duty urban distribution appli-cations as of 2021. FUSO trucks in a platoon in Japan Following tests of electronically linked trucks in Europe and North America, digitally connected, partially automated FUSO Super Great trucks are now on the road in platooning tests in Japan. This is an initiative of the Future Strategy 2017 of the Japanese government, which pursues the goal of applying inno-vations such as the Internet of things, big data and artificial intelligence across all industries. Current Mercedes-Benz truck models also for the Middle East and Africa With the Actros and the Arocs, we are launching the current generation of Mercedes-Benz trucks in more than 40 additional markets in the Middle East and Africa. Until now, trucks of the previous generation had been sold there. The new models are specially configured for local requirements such as extreme heat, difficult terrain, dust and extreme loads, and have been tested in advance under the most arduous conditions in Abu Dhabi. The market launch is being organized by the Daimler regional centers for trucks in Dubai and Nairobi.

D | THE DIVISIONS 23
Mercedes-Benz Vans Best unit sales in a first quarter with 93,000 vehicles sold (Q1 2017: 86,800) Strong growth for Vito (+16%) and V-Class (+19%) World premiere and start of production of new Sprinter EBIT significantly below prior-year level at €172 million (Q1 2017: €337 million)
D.05 € amounts in millions Q1 2018 Q1 2017 % change
Revenue 3,098 2,977 1 +4
EBIT 172 337 1 -49
Unit sales 93,016 86,778 +7
Production 109,996 104,116 +6
Employees 25,768 25,255 2 +2
1 Amounts adjusted due to first-time adoption of IFRS 15 and IFRS 9 2 As of December 31, 2017
D.06 Unit sales Q1 2018 Q1 2017 % change
Total 93,016 86,778 +7
EU30 60,418 60,539 -0
thereof Germany 22,343 20,965 +7
NAFTA region 11,272 8,531 +32
thereof United States 8,750 6,251 +40
Latin America (excl. Mexico) 3,821 3,860 -1
Asia 9,253 6,787 +36
thereof China 6,540 4,404 +49
Other markets 8,252 7,061 +17
New record for unit sales Mercedes-Benz Vans increased its unit sales by 7% and sold 93,000 vehicles in the first quarter of 2018, its strongest-selling first quarter to date. Revenue rose by 4% compared with the prior-year period to €3.1 billion. The van division’s EBIT amounted to €172 million, which is significantly lower than the prior-year level (Q1 2017: €337 million).
Mercedes-Benz Vans continues along its growth path First-quarter sales of 60,400 units in the EU30 region were at the prior-year level (Q1 2017: 60,500). Mercedes-Benz Vans achieved growth for example in Spain (+9%), France (+3%) and Switzerland (+16%). In the important German market, the van division posted a new record in the first quarter with growth of 7% and sales of 22,300 vehicles.
The development in the NAFTA region was very positive, with a significant increase of 40% in the United States and sales of 8,800 units. First-quarter sales of 3,800 vehicles in Latin Amer-ica were at the level of last year (Q1 2017: 3,900).
In China, Mercedes-Benz Vans further improved its position, achieving sales growth of 49% to sell 6,500 units – also a new record. Unit sales developed very positively also in Turkey (+60%) and in Russia (+13%).
The worldwide market success was driven in particular by our vehicles in the midsize segment, where sales increased by 17% in the first quarter of 2018 to a total of 42,700 vehicles. Vito sales rose by 16% to 27,000 units. The V-Class multipurpose vehicle also continued to be very popular with customers and its sales of 15,700 units surpassed the prior-year quarter by 19%. Due to the Sprinter model changeover to the new genera-tion, sales of 41,300 units of the large van were 8% lower than in the first quarter of last year.
Sales of the Citan urban delivery van increased by a significant 9% to 5,900 units. Of the X-Class, which was launched in late 2017, we sold 3,200 units in the first quarter.
World premiere and start of production of new Sprinter Mercedes-Benz Vans had the world premiere of the new Sprint-er in early February. As the first fully connected complete sys-tem solution of the van division, it embodies the adVANce future initiative. It thus marks another milestone for Mercedes-Benz Vans in its transformation from a vehicle manufacturer into a provider of complete transport and mobility solutions, and aims to offer tailored solutions for each sector. Series production started in early March at the plants in Düsseldorf and Ludwigsfelde.
Wide-ranging supply relationship agreed with Hymer Mercedes-Benz Vans and the caravan and camper manufacturer Hymer announced a wide-ranging supply relationship in mid-March. This means that Hymer is likely to be the biggest cus-tomer for the new Sprinter, especially for the new tractor-head variant, which offers body manufacturers full flexibility from the B-pillar rearwards.
ViaVan starts ride-sharing service ViaVan, the joint venture between Mercedes-Benz Vans and the US startup company Via, started its ride-sharing service in Amsterdam in early March. Other major European cities will follow.
World premiere of X-Class with six-cylinder engine At the Geneva Motor Show in early March, the Mercedes-Benz X-Class had its world premiere with a six-cylinder engine and 4MATIC permanent all-wheel drive. This top model is to be available in Europe as of mid-2018.

24 D | THE DIVISIONS
Daimler Buses Significant increase in unit sales to 5,700 buses and bus chassis New sales partner in North America Expansion of bus business in Asia EBIT significantly below prior-year level at €37 million (Q1 2017: €72 million)
D.07 € amounts in millions Q1 2018 Q1 2017 % change
Revenue 850 923 1 -8
EBIT 37 72 1 -49
Unit sales 5,744 5,404 +6
Production 6,924 6,583 +5
Employees 18,605 18,292 2 +2
1 Amounts adjusted due to first-time adoption of IFRS 15 and IFRS 9 2 As of December 31, 2017
D.08 Unit sales Q1 2018 Q1 2017 % change
Total 5,744 5,404 +6
EU30 1,367 1,392 -2
thereof Germany 422 509 -17
Latin America (excl. Mexico) 3,109 2,398 +30
thereof Brazil 1,856 1,399 +33
Mexico 453 738 -39
Asia 580 515 +13
Other markets 235 361 -35
Unit sales significantly above prior-year level First-quarter sales by Daimler Buses increased by 6% to 5,700 units. The sales growth was primarily driven by the stronger business with bus chassis in Latin America (excluding Mexico). Revenue decreased compared with the prior-year quarter by 8% to €850 million. EBIT amounted to €37 million (Q1 2017: €72 million).
Significant growth in unit sales overall In the EU30 region, Daimler Buses sold 1,400 complete buses and bus chassis of the brands Mercedes-Benz and Setra in the first quarter, representing a slight decrease compared with the same period of last year (-2%). Despite Daimler Buses’ clear market leadership, unit sales in Germany, the domestic market, did not reach the prior-year level and decreased by 17% to 400 units.
The Brazilian market continued its recovery and unit sales there were 33% above the prior-year level. Brazil thus made a signifi-cant contribution to our positive sales development in Latin America in the first quarter of this year. Daimler Buses’ overall unit sales in Latin America (excluding Mexico) increased by 30% to 3,100 bus chassis. First-quarter sales of 500 units in Mexico were significantly lower than in the previous year (Q1 2017: 700). However, we achieved strong growth in India with sales of 340 units (Q1 2017: 190).
New sales partner in North America Daimler Buses granted North American sales rights for the Setra brand to REV Coach LLC at the beginning of 2018. REV thus succeeds to Motor Coach Industries International Inc. (MCI) as the general agency for Daimler Buses in the North American market. As of July 2018, REV Coach will also be re-sponsible for Setra customer service. Daimler Buses and REV have agreed to explore further opportunities together in the North American market.
Expansion of bus business in Asia Daimler Buses is expanding its bus business in Asia and has started sales of Mercedes-Benz buses in Taiwan. The chassis are produced at the Brazilian plant in São Bernardo do Campo and modified for the requirements of the destination market. The chassis are built up into complete buses by MFBT Taiwan Company Ltd., a joint venture between the Daimler commercial-vehicle subsidiary FUSO and the Taiwanese Shung Ye Group. Market entry in Taiwan is an important step in the context of the global growth strategy of Daimler Buses.
Advance presentation for the Citaro electric bus At this year’s annual press discussion organized by Daimler Buses, there was an advance presentation to media representa-tives of the concept of the electric Mercedes-Benz Citaro. The fully electric city bus will have its world premiere in September 2018 at the IAA Commercial Vehicles Show. The new electric bus has the advantages of innovative thermal management and particularly high energy efficiency. The electric Citaro also features an intelligent module concept for battery and charging technology. Series production of the electric bus is scheduled to start towards the end of 2018.

D | THE DIVISIONS 25
Daimler Financial Services New business up by 6% Contract volume grows to €142 billion Daimler and BMW Group agree to merge mobility services EBIT slightly above prior-year level at €548 million (Q1 2017: €524 million)
D.09 € amounts in millions Q1 2018 Q1 2017 % change
Revenue 6,020 5,911 +2
EBIT 548 524 +5
New business 17,861 16,812 +6
Contract volume 141,678 139,907 1 +1
Employees 13,260 13,012 1 +2
1 As of December 31, 2017
New business up by 6% worldwide Daimler Financial Services increased its new business once again in the first quarter of 2018. Worldwide, 494,000 new leasing and financing contracts were concluded with a total volume of €17.9 billion, which is 6% more than in the prior-year period. Contract volume reached €141.7 billion at the end of March and was thus at the level of year-end 2017. Adjusted for exchange-rate effects, contract volume grew by 2%. First-quarter EBIT amounted to €548 million, which is slightly higher than in the previous year (Q1 2017: €524 million).
Europe region: strong growth in new business In the whole of Europe, 233,000 new leasing and financing contracts were signed in the first quarter (+7%). New business increased by 11% to €7.5 billion. Contract volume of €60.8 billion in Europe was slightly higher than at the end of 2017.
The Americas: slight decrease in new business due to exchange-rate effects In the Americas region, leasing and financing contracts with a total value of €5.3 billion were concluded in the period of Janu-ary through March 2018, which is slightly lower than in the first quarter of last year as a result of exchange-rate effects. Con-tract volume in the Americas region of €49.4 billion at the end of March was slightly lower than at year-end 2017 due to ex-change-rate effects.
Strong growth in Africa & Asia-Pacific and China New business in the Africa & Asia-Pacific region (excluding China) amounted to €2.1 billion in the first quarter, which is of the same magnitude as in the prior-year period. In Japan, the value of newly concluded financing and leasing contracts in-creased by 7%. Contract volume in the region amounted to €17.4 billion at the end of March, and was thus at the level of year-end 2017.
New business continued its strong growth in China. In the first quarter, 91,000 new leasing and financing contracts were concluded worth €2.9 billion (+15%). Contract volume amount-ed to €13.9 billion at the end of March, which is 14% higher than at the end of 2017.
Ongoing positive development of insurance business In the insurance business, Daimler Financial Services brokered 523,000 contracts, and thus 12% more than in the first quarter of 2017. The development was especially positive in Russia (+80%), China (+11%) and Germany (+3%).
Strong alliance for a unique mobility offering Daimler and the BMW Group are joining forces to offer custom-ers a single source for sustainable urban mobility services in the areas of car sharing, ride hailing and multimodal solutions, as well as parking and charging. On March 28, 2018, the two companies signed an agreement on the merger of their busi-ness units for mobility services.
The partners intend to offer their customers a holistic ecosys-tem of intelligent, seamlessly connected mobility services, available at the tip of a finger. The mobility services of Daimler Financial Services alone – with car2go, moovel and mytaxi - had 21.4 million customers and 37.5 million transactions in more than 100 cities in the first quarter of this year. The joint project is subject to review and approval by the responsible competi-tion authorities.

26 E | INTERIM CONSOLIDATED FINANCIAL STATEMENTS
Consolidated Statement of Income
E.01 Q1 2018 Q1 2017
(adjusted)1
In millions of euros
Revenue 39,785 38,582
Cost of sales -31,160 -30,579
Gross profit 8,625 8,003
Selling expenses -3,097 -3,071
General administrative expenses -971 -897
Research and non-capitalized development costs -1,712 -1,448
Other operating income 331 671
Other operating expense -293 -172
Profit on equity-method investments, net 343 719
Other financial income/expense, net 105 -37
Interest income 55 58
Interest expense -139 -135
Profit before income taxes2 3,247 3,691
Income taxes -893 -1,039
Net profit 2,354 2,652
thereof profit attributable to non-controlling interests 81 95
thereof profit attributable to shareholders of Daimler AG 2,273 2,557
Earnings per share (in euros)
for profit attributable to shareholders of Daimler AG
Basic 2.12 2.39
Diluted 2.12 2.39
1 The prior-year figures have been adjusted due to the effects of the first-time adoption of IFRS 15 and IFRS 9. Information related to the adjustments of the prior-year figures is disclosed in Note 1 of the Notes to the Interim Consolidated Financial Statements.
2 The reconciliation of Group EBIT to profit before income taxes is presented in Note 19.
The accompanying notes are an integral part of these Interim Consolidated Financial Statements.

E | INTERIM CONSOLIDATED FINANCIAL STATEMENTS 27
Consolidated Statement of Comprehensive Income/Loss
E.02 Q1 2018 Q1 2017
(adjusted)1
In millions of euros
Net profit 2,354 2,652
Gains/losses on currency translation -333 114
Gains/losses on equity instruments and debt instruments -12 3
Losses on derivative financial instruments -91 -15
Gains/losses on equity-method investments 2 13
Items that may be reclassified to profit/loss -434 115
Actuarial gains/losses from pensions and similar obligations -164 187
Items that will not be reclassified to profit/loss -164 187
Other comprehensive income/loss, net of taxes -598 302
thereof income/loss attributable to non-controlling interests, after taxes 6 8
thereof income/loss attributable to shareholders of Daimler AG, after taxes -604 294
Total comprehensive income/loss 1,756 2,954
thereof income/loss attributable to non-controlling interests 87 103
thereof income/loss attributable to shareholders of Daimler AG 1,669 2,851
1 The prior-year figures have been adjusted due to the effects of the first-time adoption of IFRS 15 and IFRS 9. Information related to the adjustments of the prior-year figures is disclosed in Note 1 of the Notes to the Interim Consolidated Financial Statements.
The accompanying notes are an integral part of these Interim Consolidated Financial Statements.

28 E | INTERIM CONSOLIDATED FINANCIAL STATEMENTS
Consolidated Statement of Financial Position
E.03 March 31, 2018 Dec. 31, 2017 (adjusted)1
In millions of euros Assets Intangible assets 13,962 13,735 Property, plant and equipment 28,095 27,981 Equipment on operating leases 47,079 47,074 Equity-method investments 5,021 4,818 Receivables from financial services 47,757 46,600 Marketable debt securities and similar investments 882 990 Other financial assets 3,745 3,204 Deferred tax assets 2,995 2,844 Other assets 1,191 1,203 Total non-current assets 150,727 148,449 Inventories 27,579 25,686 Trade receivables 11,665 11,995 Receivables from financial services 40,185 39,454 Cash and cash equivalents 14,058 12,072 Marketable debt securities and similar investments 9,525 9,073 Other financial assets 3,602 3,602 Other assets 4,995 5,014 Assets held for sale 451 - Total current assets 112,060 106,896 Total assets 262,787 255,345 Equity and liabilities Share capital 3,070 3,070 Capital reserves 11,741 11,742 Retained earnings 49,664 47,553 Other reserves 1,036 1,504 Equity attributable to shareholders of Daimler AG 65,511 63,869 Non-controlling interests 1,376 1,290 Total equity 66,887 65,159 Provisions for pensions and similar obligations 6,107 5,767 Provisions for income taxes 915 1,046 Provisions for other risks 7,211 7,143 Financing liabilities 80,241 78,378 Other financial liabilities 2,504 2,370 Deferred tax liabilities 2,474 2,347 Deferred income 1,603 1,668 Contract liabilities 4,778 3,833 Other liabilities 11 10 Total non-current liabilities 105,844 102,562 Trade payables 14,865 12,451 Provisions for income taxes 721 560 Provisions for other risks 7,255 7,620 Financing liabilities 49,147 48,746 Other financial liabilities 6,977 6,905 Deferred income 1,576 1,528 Contract liabilities 6,336 7,375 Other liabilities 2,980 2,439 Liabilities held for sale 199 - Total current liabilities 90,056 87,624 Total equity and liabilities 262,787 255,345 1 The prior-year figures have been adjusted due to the effects of the first-time adoption of IFRS 15 and IFRS 9. Information related to the adjustments
of the prior-year figures is disclosed in Note 1 of the Notes to the Interim Consolidated Financial Statements.
The accompanying notes are an integral part of these Interim Consolidated Financial Statements.

E | INTERIM CONSOLIDATED FINANCIAL STATEMENTS 29
Consolidated Statement of Cash Flows
E.04 Q1 2018 Q1 2017 (adjusted)1 In millions of euros Profit before income taxes 3,247 3,691 Depreciation and amortization/impairments 1,478 1,389 Other non-cash expense and income -342 -707 Gains (-)/losses (+) on disposals of assets - -279 Change in operating assets and liabilities
Inventories -2,072 -1,221 Trade receivables -4 30 Trade payables 2,485 2,247 Receivables from financial services -2,258 -1,491 Vehicles on operating leases -558 -659 Other operating assets and liabilities -787 -110
Dividends received from equity-method investments 421 - Income taxes paid -797 -850 Cash provided by operating activities 813 2,040 Additions to property, plant and equipment -1,343 -1,300 Additions to intangible assets -765 -847 Proceeds from disposals of property, plant and equipment and intangible assets 94 439 Investments in shareholdings -198 -141 Proceeds from disposals of shareholdings 253 32 Acquisition of marketable debt securities and similar investments -1,737 -806 Proceeds from sales of marketable debt securities and similar investments 1,354 2,893 Other 100 72 Cash used for/provided by investing activities -2,242 342 Change in financing liabilities 3,581 -339 Dividends paid to non-controlling interests -4 -12 Proceeds from the issue of share capital 6 - Acquisition of treasury shares -50 -42 Acquisition of non-controlling interests in subsidiaries -8 - Cash used for/provided by financing activities 3,525 -393 Effect of foreign exchange rate changes on cash and cash equivalents -110 -4 Net increase in cash and cash equivalents 1,986 1,985
Cash and cash equivalents at beginning of period 12,072 10,981 Cash and cash equivalents at end of period 14,058 12,966
1 The prior-year figures have been adjusted due to the effects of the first-time adoption of IFRS 15 and IFRS 9. Information related to the adjustments of the prior-year figures is disclosed in Note 1 of the Notes to the Interim Consolidated Financial Statements.
The accompanying notes are an integral part of these Interim Consolidated Financial Statements.

30 E | INTERIM CONSOLIDATED FINANCIAL STATEMENTS
Consolidated Statement of Changes in Equity
E.05
Share
capital Capital
reserves Retainedearnings
Currencytranslation
Equity instruments /
debt instruments
In millions of euros Balance at January 1, 2017 3,070 11,744 40,794 2,842 53 First-time adoption of IFRS 15 - - 95 - - First-time adoption of IFRS 9 - - 23 - - Balance at January 1, 2017 (adjusted)1 3,070 11,744 40,912 2,842 53
Net profit (adjusted)1 - - 2,557 - -
Other comprehensive income/loss before taxes (adjusted)1 - - 214 97 4
Deferred taxes on other comprehensive income/loss (adjusted)1 - - -27 - -1
Total comprehensive income/loss (adjusted)1 - - 2,744 97 3 Dividends - - -3,477 - - Changes in consolidated group - - -35 - - Acquisition of treasury shares - - - - - Issue and disposal of treasury shares - - - - - Changes in ownership interests in subsidaries - -11 - - - Other - -7 - - - Balance at March 31, 2017 (adjusted)1 3,070 11,726 40,144 2,939 56 Balance at January 1, 2018 (adjusted)1 3,070 11,742 47,553 258 66 First-time adoption of IFRS 9 - - 2 - -28 Balance at January 1, 2018 (adjusted)1 3,070 11,742 47,555 258 38
Net profit - - 2,273 - - Other comprehensive income/loss before taxes - - -218 -339 -15
Deferred taxes on other comprehensive income/loss - - 54 - 3
Total comprehensive income/loss - - 2,109 -339 -12 Dividends - - - - - Capital increase/Issue of new shares - - - - - Acquisition of treasury shares - - - - - Issue and disposal of treasury shares - - - - - Changes in ownership interests in subsidiaries - -1 - - - Balance at March 31, 2018 3,070 11,741 49,664 -81 26 1 The prior-year figures have been adjusted due to the effects of the first-time adoption of IFRS 15 and IFRS 9. Information related to the adjustments
of the prior-year figures is disclosed in Note 1 of the Notes to the Interim Consolidated Financial Statements.
The accompanying notes are an integral part of these Interim Consolidated Financial Statements.

E | INTERIM CONSOLIDATED FINANCIAL STATEMENTS 31
Other reserves
Items that may bereclassified to profit/loss
Derivativefinancial
instruments
Equity-method
investments Treasury
shares
Equityattributable to
shareholdersof Daimler AG
Non-controlling
interests Total
equity In millions of euros
-537 -16 - 57,950 1,183 59,133 Balance at January 1, 2017 - - - 95 - 95 First-time adoption of IFRS 15
-23 - - - - - First-time adoption of IFRS 9 -560 -16 - 58,045 1,183 59,228 Balance at January 1, 2017 (adjusted)1
- - - 2,557 95 2,652 Net profit (adjusted)1
-4 13 - 324 5 329 Other comprehensive income/loss
before taxes (adjusted)1
-2 - - -30 3 -27 Deferred taxes on other comprehensive
income/loss (adjusted)1 -6 13 - 2,851 103 2,954 Total comprehensive income/loss (adjusted)1
- - - -3,477 -240 -3,717 Dividends - - - -35 - -35 Changes in consolidated group - - -42 -42 - -42 Acquisition of treasury shares - - 42 42 - 42 Issue and disposal of treasury shares
- - - -11 14 3 Changes in ownership interests in subsidaries
- - - -7 -18 -25 Other -566 -3 - 57,366 1,042 58,408 Balance at March 31, 2017 (adjusted)1
1,171 9 - 63,869 1,290 65,159 Balance at January 1, 2018 (adjusted)1
- - - -26 -8 -34 First-time adoption of IFRS 9 1,171 9 - 63,843 1,282 65,125 Balance at January 1, 2018 (adjusted)1
- - - 2,273 81 2,354 Net profit
-130 3 - -699 6 -693 Other comprehensive income/loss
before taxes
39 -1 - 95 - 95 Deferred taxes on
other comprehensive income/loss -91 2 - 1,669 87 1,756 Total comprehensive income/loss
- - - - -50 -50 Dividends - - - - 6 6 Capital increase/Issue of new shares - - -50 -50 - -50 Acquisition of treasury shares - - 50 50 - 50 Issue and disposal of treasury shares
- - - -1 51 50Changes in ownership interests in subsidiaries
1,080 11 - 65,511 1,376 66,887 Balance at March 31, 2018
The accompanying notes are an integral part of these Interim Consolidated Financial Statements.

32 E | INTERIM CONSOLIDATED FINANCIAL STATEMENTS
Notes to the Interim Consolidated Financial Statements
1. Presentation of the Interim ConsolidatedFinancial Statements
The interim financial statements comply with the International Financial Reporting Standards (IFRS) as adopted by the Europe-an Union.
Daimler AG is a stock corporation organized under the laws of the Federal Republic of Germany. Daimler AG is entered in the Commercial Register of the Stuttgart District Court under No. HRB 19360 and its registered office is located at Mercedes-straße 137, 70327 Stuttgart, Germany.
The interim financial statements of the Daimler Group are pre-sented in euros (€). Unless otherwise stated, all amounts are stated in millions of euros. All figures shown are rounded in accordance with standard business rounding principles.
The Board of Management authorized the interim consolidated financial statements for publication on April 26, 2018. These interim financial statements have been reviewed by the Daimler Group’s independent auditor.
All significant intercompany accounts and transactions have been eliminated. In the opinion of the management, the interim financial statements reflect all adjustments (i.e. normal recur-ring adjustments) necessary for a fair presentation of the profit-ability, liquidity and capital resources, and financial position of the Group. Results for the interim periods presented are not necessarily indicative of the results that may be expected for any future period or for the full fiscal year. The interim financial statements should be read in conjunction with the December 31, 2017 audited and published IFRS consolidated financial statements and notes thereto. The accounting policies applied by the Group in these interim financial statements basically correspond with those applied for the consolidated financial statements for the year ended December 31, 2017.
Preparation of interim financial statements in conformity with IFRS requires estimates and management assumptions to be made which can affect the amounts and reporting of assets and liabilities, the reporting of contingent assets and liabilities as at the end of the reporting period and the amounts of income and expense reported for the period. Actual amounts can differ from those estimates. Changes in the estimates and management assumptions can have a material impact on the interim consoli-dated financial statements.
IFRSs initially applied in the reporting period
Application of IFRS 15 Revenue from Contracts with Cus-tomers. In May 2014, the IASB published the standard IFRS 15. It replaces existing guidance for revenue recognition, including IAS 18 Revenue, IAS 11 Construction Contracts and IFRIC 13 Customer Loyalty Programmes. The new standard lays down a comprehensive framework for determining in which amount and at which date revenue is recognized. The new standard speci-fies a uniform, five-step model for revenue recognition, which is generally to be applied to all contracts with customers.
Daimler applies IFRS 15 for the first time for the financial year beginning on January 1, 2018. The first-time adoption has been conducted retrospectively. The figures reported for the previous year have been adjusted by the effects arising from the adop-tion of IFRS 15.
Daimler uses the following practical expedients available under IFRS 15 for retrospective first-time adoption:
− Contracts concluded until December 31, 2016 were not reassessed under IFRS 15. Due to the application of this practical expedient profit decreased especially in Q1 2017 in comparison to a full retrospective adoption. The impact on the Group’s profitability, liquidity and capital resources or fi-nancial position is assessed to be not material.
− Contracts that were modified before January 1, 2017 have not been reassessed regarding the guidance of IFRS 15 for contract modifications. The application of this practical expe-dient did not have any major impact on the Group’s profitabil-ity, liquidity and capital resources or financial position.
General These unaudited interim consolidated financial statements (interim financial statements) of Daimler AG and its subsidiaries “Daimler” or “the Group”) have been prepared in accordance with Section 115 of the German Securities Trading Act (WpHG) and International Accounting Standard (IAS) 34 Interim Finan-cial Reporting.
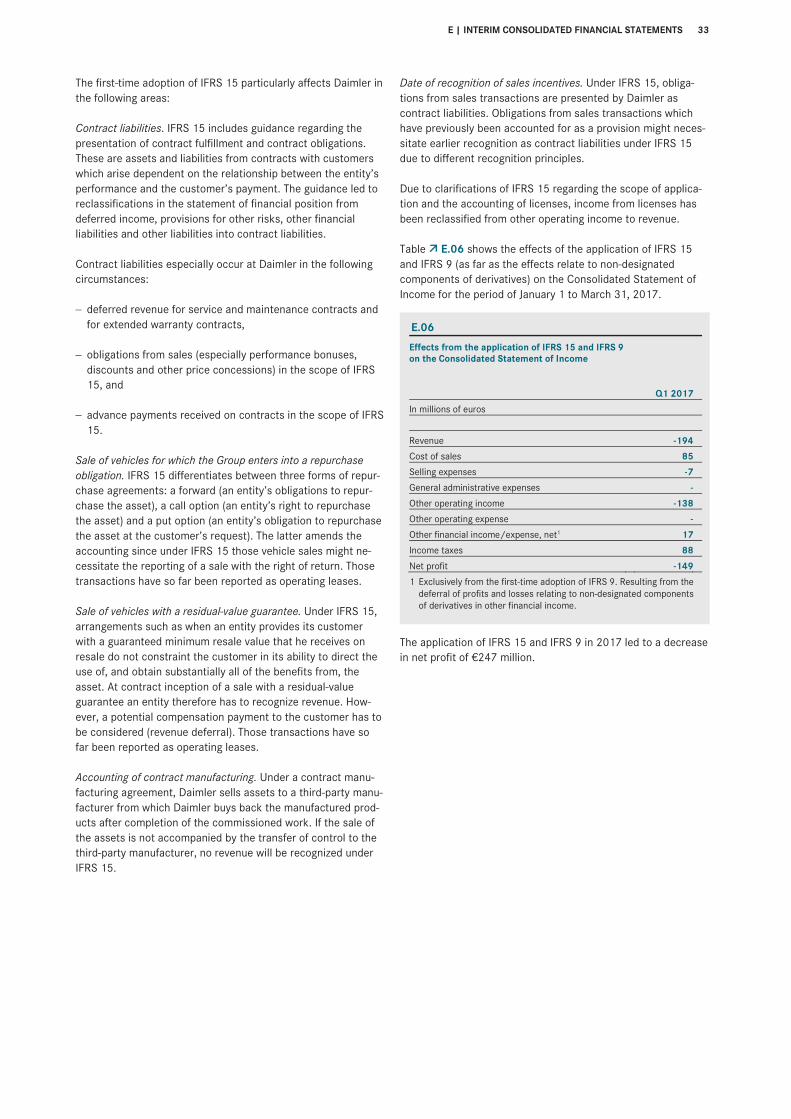
E | INTERIM CONSOLIDATED FINANCIAL STATEMENTS 33
The first-time adoption of IFRS 15 particularly affects Daimler in the following areas:
Contract liabilities. IFRS 15 includes guidance regarding the presentation of contract fulfillment and contract obligations. These are assets and liabilities from contracts with customers which arise dependent on the relationship between the entity’s performance and the customer’s payment. The guidance led to reclassifications in the statement of financial position from deferred income, provisions for other risks, other financial liabilities and other liabilities into contract liabilities.
Contract liabilities especially occur at Daimler in the following circumstances:
− deferred revenue for service and maintenance contracts and for extended warranty contracts,
− obligations from sales (especially performance bonuses, discounts and other price concessions) in the scope of IFRS 15, and
− advance payments received on contracts in the scope of IFRS 15.
Sale of vehicles for which the Group enters into a repurchase obligation. IFRS 15 differentiates between three forms of repur-chase agreements: a forward (an entity’s obligations to repur-chase the asset), a call option (an entity’s right to repurchase the asset) and a put option (an entity’s obligation to repurchase the asset at the customer’s request). The latter amends the accounting since under IFRS 15 those vehicle sales might ne-cessitate the reporting of a sale with the right of return. Those transactions have so far been reported as operating leases.
Accounting of contract manufacturing. Under a contract manu-facturing agreement, Daimler sells assets to a third-party manu-facturer from which Daimler buys back the manufactured prod-ucts after completion of the commissioned work. If the sale of the assets is not accompanied by the transfer of control to the third-party manufacturer, no revenue will be recognized under IFRS 15.
Date of recognition of sales incentives. Under IFRS 15, obliga-tions from sales transactions are presented by Daimler as contract liabilities. Obligations from sales transactions which have previously been accounted for as a provision might neces-sitate earlier recognition as contract liabilities under IFRS 15 due to different recognition principles.
Due to clarifications of IFRS 15 regarding the scope of applica-tion and the accounting of licenses, income from licenses has been reclassified from other operating income to revenue.
Table E.06 shows the effects of the application of IFRS 15 and IFRS 9 (as far as the effects relate to non-designated components of derivatives) on the Consolidated Statement of Income for the period of January 1 to March 31, 2017.
E.06Effects from the application of IFRS 15 and IFRS 9 on the Consolidated Statement of Income Q1 2017In millions of euros
Revenue -194
Cost of sales 85
Selling expenses -7
General administrative expenses -
Other operating income -138
Other operating expense -
Other financial income/expense, net1 17
Income taxes 88
Net profit -149
1 Exclusively from the first-time adoption of IFRS 9. Resulting from the deferral of profits and losses relating to non-designated components of derivatives in other financial income.
The application of IFRS 15 and IFRS 9 in 2017 led to a decrease in net profit of €247 million.
Sale of vehicles with a residual-value guarantee. Under IFRS 15, arrangements such as when an entity provides its customer with a guaranteed minimum resale value that he receives on resale do not constraint the customer in its ability to direct the use of, and obtain substantially all of the benefits from, the asset. At contract inception of a sale with a residual-value guarantee an entity therefore has to recognize revenue. How-ever, a potential compensation payment to the customer has to be considered (revenue deferral). Those transactions have so far been reported as operating leases.

34 E | INTERIM CONSOLIDATED FINANCIAL STATEMENTS
The effects on the line items of the Consolidated Statement of Financial Position at January 1, 2017 as well as at December 31, 2017 are presented in table E.07.
E.07Effects from the application of IFRS 15 on the Consolidated Statement of Financial Position
Dec. 31,
2017 Jan. 1,
2017In millions of euros
Assets
Equipment on operating leases -640 -264
Trade receivables 5 2
Receivables from financial services 267 0
Other financial assets 5 14
Deferred tax assets -9 -35
Other assets 112 63
Total assets -260 -220
Equity and liabilities
Total equity -155 95
Trade payables -23 -1
Provisions for other risks -2,481 -2,663
Other financial liabilities -2,247 -1,955
Deferred tax liabilities -55 4
Deferred income -6,274 -5,820
Contract liabilities 11,208 10,328
Other liabilities -233 -208
Total equity and liabilities -260 -220
Basic and diluted earnings per share decrease by €0.14 in Q1 2017.
Application of IFRS 9 Financial Instruments. Daimler applies IFRS 9 initially for reporting periods beginning on and after January 1, 2018. Initial application is made retrospectively. In accordance with the transition requirements, Daimler chose to present prior periods in accordance with IAS 39. As an excep-tion, the transition for recognition of fair-value changes of cer-tain non-designated components of derivatives through other comprehensive income is to be applied retrospectively to the comparative figures.
Financial Assets. IFRS 9 introduces a comprehensive classifica-tion model for financial assets that classifies financial assets into three categories: financial assets at amortized costs, finan-cial assets at fair value through other comprehensive income and financial assets at fair value through profit or loss.
Financial assets that give rise to cash flows consisting only of payments of principal and interest are classified in accordance with Daimler’s business model for holding these instruments. Financial assets that are held in a business model with the objective to hold them until maturity and collect the contractual cash flows are measured at amortized cost. These business models are managed principally based on interest-rate structure and credit risk. If the business model comprises the intention to hold the financial assets to collect the contractual cash flows but expects to sell these financial assets if this is necessary, e.g. to fulfill a specific need for liquidity, then these instruments are measured at fair value through other comprehensive income. Financial assets that have only cash flows of principal and interest but are not held within one of the business models described above are measured at fair value through profit or loss.
Initial application of IFRS 9 leads to the following major changes:

E | INTERIM CONSOLIDATED FINANCIAL STATEMENTS 35
Financial assets that contain cash flows other than those of principal and interest, such as interests in money-market funds or derivatives including separated embedded derivatives, are measured at fair value through profit or loss. For equity instru-ments, IFRS 9 optionally allows measurement at fair value through other comprehensive income. Daimler elects to meas-ure equity instruments at fair value through other comprehen-sive income on an instrument by instrument basis. When these equity instruments are sold or written off, any unrealized gains and losses on these equity instruments are reclassified to re-tained earnings and not presented under profit or loss. These equity instruments are shown within other financial assets.
Trade receivables and receivables from financial services were categorized as loans and receivables under IAS 39 and meas-ured at amortized cost respectively. All of these instruments are categorized as measured at amortized cost using the effective interest rate method.
Marketable debt securities and similar investments were cate-gorized as available for sale under IAS 39 and measured at fair value through other comprehensive income. Except for interests in money-market funds, these instruments are categorized as measured at fair value through other comprehensive income under IFRS 9, while similar investments are measured at amor-tized cost.
Impairment model based on expected credit losses. IFRS 9 introduces the expected loss impairment approach to be ap-plied on all financial assets (debt instruments) at amortized cost or at fair value through other comprehensive income. While under IAS 39, only incurred losses were recognized as an im-pairment of financial assets, the new approach takes projec-tions of the future into consideration. The expected credit-loss approach uses three stages for allocating impairment losses:
Stage 1: expected credit losses within the next twelve months
Stage 1 includes all contracts with no significant increase in credit risk since initial recognition and usually includes new acquisitions and contracts with fewer than 31 days past due date. The portion of the lifetime expected credit losses resulting from default events possible within the next 12 months is rec-ognized.
Stage 2: expected credit losses over the lifetime – not credit impaired
If a financial asset has a significant increase in credit risk since initial recognition but is not yet credit impaired, it is moved to Stage 2 and measured at lifetime expected credit loss, which is defined as the expected credit loss that results from all possible default events over the expected life of a financial instrument.
Stage 3: expected credit losses over the lifetime – credit im-paired
If a financial asset is defined as credit impaired or in default, it is transferred to Stage 3 and measured at lifetime expected credit loss. Objective evidence for a credit-impaired financial asset includes 91 days past due date and other information about significant financial difficulties of the borrower.
The determination of whether a financial asset has experienced a significant increase in credit risk is based on an assessment of the probability of default, which is made at least quarterly, incorporating external credit rating information as well as inter-nal information on the credit quality of financial assets. For debt instruments that are not receivables from financial services a significant increase in credit risk is assessed mainly based on past-due information.

36 E | INTERIM CONSOLIDATED FINANCIAL STATEMENTS
A financial asset is migrated to stage 2 if the asset’s credit risk has increased significantly compared to its credit risk at initial recognition. The credit risk is assessed based on the probability of default. For trade receivables, the simplified approach is applied whereby all trade receivables are allocated to stage 2 initially. Hence, no determination of significant increases in credit risk is necessary.
Daimler applies the low credit risk exception to the stage allo-cation to debt instruments quoted on the stock exchange with investment-grade ratings. These debt instruments are always allocated to stage 1.
In stage 1 and 2, the effective interest revenue is calculated based on gross carrying amounts. If a financial asset becomes credit impaired in stage 3, the effective interest revenue is calculated based on its net carrying amount (gross carrying amount adjusted for any loss allowance).
Measurement of expected credit losses. Expected credit losses are measured in a way that reflects:
a) the unbiased and probability-weighted amount;
b) the time value of money; and
c) reasonable and supportable information (if available without undue cost or effort) at the reporting date about past events, current conditions and forecasts of future economic conditions.
Expected credit losses are measured as the probability-weighted present value of all cash shortfalls over the expected life of each financial asset. For receivables from financial ser-vices, expected credit losses are mainly calculated with a statis-tical model using three major risk parameters: probability of default, loss given default and exposure at default.
The estimation of these risk parameters incorporates all available relevant information, not only historical and current loss data, but also reasonable and supportable forward-looking information reflected by the future expectation factors. This information includes macroeconomic factors (e.g., gross do-mestic product growth, unemployment rate, cost performance index) and forecasts of future economic conditions. For receiv-ables from financial services, these forecasts are performed using a scenario analysis (base case, adverse and optimistic scenarios).
A default occurs when financial assets are written off when there is no reasonable expectation of recovery, for example at the end of insolvency or a court decision of uncollectability.
Significant modification (e.g., that leads to a change in the present value of the contractual cash flows of 10%) leads to derecognition of financial assets. This is estimated to be rare and immaterial for receivables from financial services. If the terms of a contract are renegotiated or modified and this does not result in derecognition of the contract, then the gross carry-ing amount of the contract has to be recalculated and a modifi-cation gain or loss has to be recognized in profit or loss.

E | INTERIM CONSOLIDATED FINANCIAL STATEMENTS 37
Derivative financial instruments and hedge accounting. The Group uses derivative financial instruments exclusively for hedging financial risks that arise from its commercial business or refinancing activities. These are mainly interest rate risks, currency risks and commodity price risks. Embedded deriva-tives are principally separated from the host contract and rec-ognized separately. However, embedded derivatives are not separated from the host contract, if that host contract is a financial asset, if Daimler chooses to measure a hybrid contract at fair value through profit or loss or if an analysis shows that the economic characteristics and risks of embedded derivatives are closely related to those of the host contract.
Derivative financial instruments are measured at fair value upon initial recognition and at each subsequent reporting date. The fair value of listed derivatives is equal to their positive or nega-tive market value. If a market value is not available, fair value is calculated using standard financial valuation models such as discounted cash flow or option pricing models. Derivatives are presented as assets if their fair value is positive and as liabilities if the fair value is negative.
If the requirements for hedge accounting set out in IFRS 9 are met, Daimler designates and documents the hedge relationship from the date a derivative contract is entered into as a fair value hedge, a cash flow hedge or a hedge of a net investment in a foreign business operation. In a fair value hedge, the changes in the fair value of a recognized asset or liability or an unrecognized firm commitment are hedged. In a cash flow hedge, the variability of cash flows to be received or paid from expected transactions related to a recognized asset or liability or a highly probable forecast transaction is hedged. The docu-mentation of the hedging relationship includes the objectives and strategy of risk management, the type of hedging relation-ship, the nature of the risk being hedged, the identification of the eligible hedging instrument and the eligible hedged item, as well as an assessment of the effectiveness requirements com-prising the risk mitigating economic relationship, the absence of deteriorating effects from credit risk and the appropriate hedge ratio. Hedging transactions are regularly assessed to determine whether the effectiveness requirements are met throughout the financial reporting periods for which they are designated.
Under IFRS 9, for cash flow hedges of volatile prices in highly probable forecast procurement transactions, designation can be made for separable risk components of these non-financial hedged items. Daimler can apply this possibility to facilitate future hedge accounting and thereby reduce ineffectiveness of hedge relationships for commodities.
Changes in the fair value of derivative financial instruments that are designated in a hedge relationship are recognized periodi-cally in either profit or loss or other comprehensive income, depending on whether the derivative is designated as a hedge of changes in fair value or cash flows. Changes in fair value of non-designated derivatives are recognized through profit or loss. For fair value hedges, changes in the fair value of the hedged item and the derivative are recognized in profit or loss. For cash flow hedges, fair value changes in the effective portion of the hedging instrument are recognized in other comprehen-sive income. Under IFRS 9 amounts recognized as effective hedging gains or losses of the hedging instrument in other comprehensive income are removed from the equity reserve and directly included in the initial cost or carrying amount of the hedged item at initial recognition if a hedged forecast transac-tion results in the recognition of a non-financial asset or liability.
For other cash flow hedges the accumulated hedging gains or losses from the hedging instrument are reclassified from the cash flow hedge reserves to the statement of income when the hedged item affects profit or loss. The ineffective portions of fair value changes are recognized directly in profit or loss.
If derivative financial instruments do not or no longer qualify for hedge accounting because the qualifying criteria for hedge accounting are not or are no longer met, the derivative financial instruments are classified as held for trading and are measured at fair value through profit or loss.
For derivative instruments designated in a hedge relationship, certain components can be excluded from designation and the changes in these components’ fair value are then deferred in other comprehensive income under IFRS 9. This applies for example to the fair value of options or cross currency basis spreads.

38 E | INTERIM CONSOLIDATED FINANCIAL STATEMENTS
Table E.08 shows the effects on the components of equity from first-time adoption of IFRS 9.
The original measurement categories and carrying amounts of financial instruments according to IAS 39 as well as the new measurement categories and carrying amounts of financial instruments according to IFRS 9 are summarized in table
E.09.
Table E.10 shows the reconciliation of the carrying amounts of financial instruments according to IAS 39 at December 31, 2017 to the carrying amounts according to IFRS 9 at January 1, 2018.
E.08First-time adoption effects of IFRS 9 on equity In millions of euros Retained earnings Balance at December 31, 2017 according to IAS 39 47,553 Change in credit risk for financial instruments -52
Reclassification of impairments of equity instruments recognized through profit or loss under IAS 39 38 Adjustments from measurement of equity instru-ments recognized through profit or loss 16 Other effects from first-time adoption of IFRS 9 1 Deferred taxes on first-time adoption effects -1 Balance at January 1, 2018 according to IFRS 9 47,555 Reserves for available-for-sale financial assets Balance at December 31, 2017 according to IAS 39 66
Reclassification in reserve for equity instruments recognized at fair value through other comprehensive income (after deferred taxes) -44
Reclassification in reserve for debt instruments recognized at fair value through other comprehensive income (after deferred taxes) -22 Balance at January 1, 2018 according to IFRS 9 -
Reserves for equity instruments recognized at fair value through other comprehensive income Balance at December 31, 2017 according to IAS 39 -
Reclassification from reserves for available-for-sale financial assets (after deferred taxes) 44
Reclassification of impairments of equity instruments recognized through profit or loss under IAS 39 -38 Deferred taxes on first-time adoption effects 6 Balance at January 1, 2018 according to IFRS 9 12
Reserves for debt instruments recognized at fair value through other comprehensive income Balance at December 31, 2017 according to IAS 39 -
Reclassification from reserves for available-for-sale financial assets (after deferred taxes) 22 Change in credit risk for debt instruments 4 Other effects from first-time adoption of IFRS 9 2 Deferred taxes on first-time adoption effects -2 Balance at January 1, 2018 according to IFRS 9 26 Non-controlling interests after taxes Balance at December 31, 2017 according to IAS 39 1,290 Change in credit risk for financial instruments -11 Deferred taxes on first-time adoption effects 3 Balance at January 1, 2018 according to IFRS 9 1,282
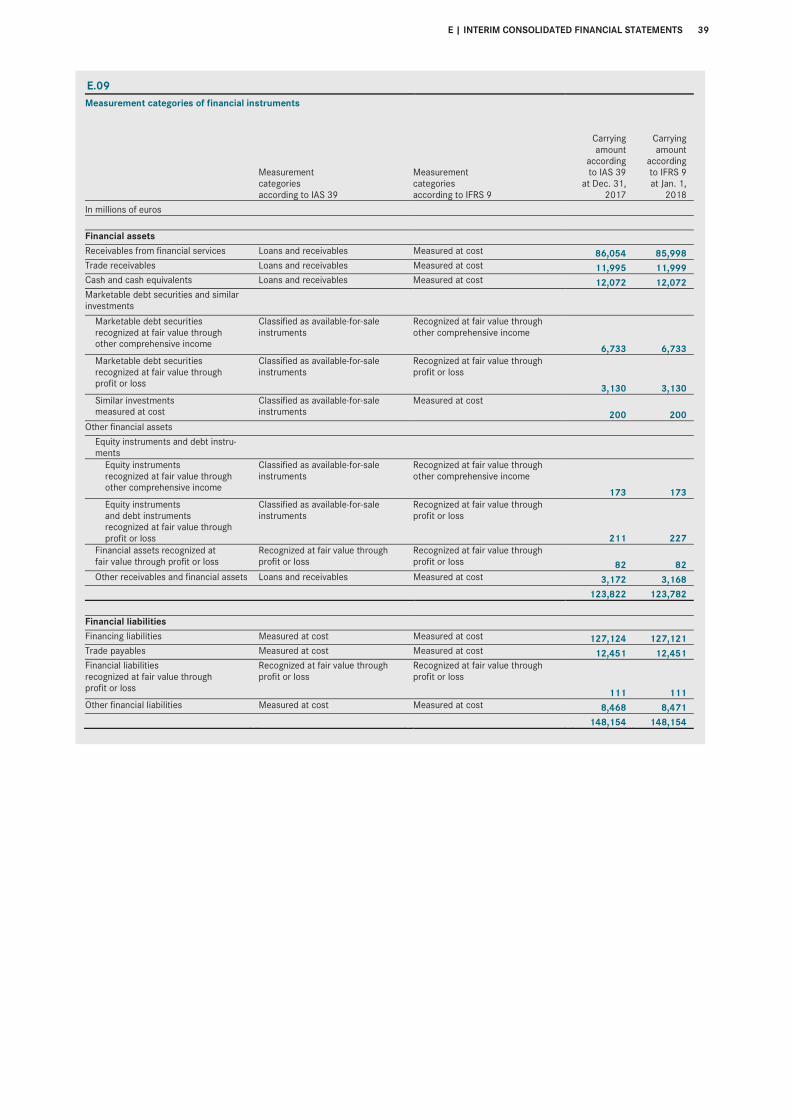
E | INTERIM CONSOLIDATED FINANCIAL STATEMENTS 39
E.09Measurement categories of financial instruments
Measurement categories according to IAS 39
Measurement categories according to IFRS 9
Carrying amount
according to IAS 39
at Dec. 31, 2017
Carrying amount
according to IFRS 9 at Jan. 1,
2018In millions of euros Financial assets Receivables from financial services Loans and receivables Measured at cost 86,054 85,998 Trade receivables Loans and receivables Measured at cost 11,995 11,999 Cash and cash equivalents Loans and receivables Measured at cost 12,072 12,072 Marketable debt securities and similar investments
Marketable debt securities recognized at fair value through other comprehensive income
Classified as available-for-sale instruments
Recognized at fair value through other comprehensive income
6,733 6,733 Marketable debt securities recognized at fair value through profit or loss
Classified as available-for-sale instruments
Recognized at fair value through profit or loss
3,130 3,130 Similar investments measured at cost
Classified as available-for-sale instruments
Measured at cost 200 200
Other financial assets Equity instruments and debt instru-ments
Equity instruments recognized at fair value through other comprehensive income
Classified as available-for-sale instruments
Recognized at fair value through other comprehensive income
173 173 Equity instruments and debt instruments recognized at fair value through profit or loss
Classified as available-for-sale instruments
Recognized at fair value through profit or loss
211 227 Financial assets recognized at fair value through profit or loss
Recognized at fair value through profit or loss
Recognized at fair value through profit or loss 82 82
Other receivables and financial assets Loans and receivables Measured at cost 3,172 3,168 123,822 123,782 Financial liabilities Financing liabilities Measured at cost Measured at cost 127,124 127,121 Trade payables Measured at cost Measured at cost 12,451 12,451 Financial liabilities recognized at fair value through profit or loss
Recognized at fair value through profit or loss
Recognized at fair value through profit or loss
111 111 Other financial liabilities Measured at cost Measured at cost 8,468 8,471 148,154 148,154

40 E | INTERIM CONSOLIDATED FINANCIAL STATEMENTS
E.10Reconciliation of carrying amount (IAS 39 to IFRS 9)
Carrying amount
according to IAS 39
at Dec. 31, 2017
Reclassi-fication effects
Remeasure-ment
effects
Carrying amount
according to IFRS 9
at January 1, 2018
In millions of euros Financial instruments measured at cost
Receivables from financial services 86,054 - -56 85,998 Trade receivables 11,995 - 4 11,999 Cash and cash equivalents 12,072 - - 12,072 Marketable debt securities and similar investments - 200 - 200 Other receivables and financial assets 3,172 - -4 3,168
Total financial instruments measured at cost 113,293 200 -56 113,437
Available-for-sale financial assets Marketable debt securities and similar investments 10,063 -10,063 - - Equity instruments recognized at fair value 384 -384 - -
Total available-for-sale financial assets 10,447 -10,447 - -
Financial assets recognized at fair value through other comprehensive income
Marketable debt securities and similar investments - 6,733 - 6,733 Equity instruments - 173 - 173
Total financial assets recognized at fair value through other comprehensive income - 6,906 - 6,906
Financial assets recognized at fair value through profit or loss
Marketable debt securities and similar investments - 3,130 - 3,130 Equity instruments and debt instruments - 211 16 227
Total financial assets recognized at fair value through profit or loss - 3,341 16 3,357

E | INTERIM CONSOLIDATED FINANCIAL STATEMENTS 41
2. Assets and liabilities held for sale
In March 2018, the Daimler Group and the BMW Group signed an agreement to merge their business units for mobility ser-vices. The partners intend to offer their customers a holistic ecosystem of intelligent, seamlessly connected mobility ser-vices, available at the tap of a finger. To this end, the partners will combine and strategically expand their existing on-demand mobility offering in the areas of CarSharing, Ride-Hailing, Park-ing, Charging and Multimodality in joint ventures. The formation of the joint ventures will produce a significant positive earnings effect and cash outflow in the segment Daimler Financial Ser-vices. Completion of the transaction is expected in the second half of 2018, subject to the approval of the competition authori-ties. At March 31, 2018, the disposal group’s assets amounted to €451 million and its liabilities amounted to €199 million.

42 E | INTERIM CONSOLIDATED FINANCIAL STATEMENTS
3. Revenue
Revenue from contracts with customers (revenue according to IFRS 15) is disaggregated by the two categories - type of prod-ucts and services and geographical region - and presented in table E.11. The category type of products and services cor-responds to the reportable segments.
Other revenue primarily comprises revenue from the rental and leasing business (IAS 17) and interest from the financial ser-vices business at Daimler Financial Services.
E.11Revenue
Mercedes- Benz Cars
Daimler Trucks
Mercedes-Benz Vans
Daimler Buses
Daimler Financial Services
Total segments
Recon-ciliation
DaimlerGroup
In millions of euros Q1 2018
Europe 9,162 2,435 2,039 516 1,044 15,196 -881 14,315 NAFTA 4,047 3,532 371 38 1,058 9,046 -15 9,031 Asia 7,984 1,551 217 29 46 9,827 -3 9,824 Other markets 948 925 245 171 39 2,328 -107 2,221
Revenue according to IFRS 15 22,141 8,443 2,872 754 2,187 36,397 -1,006 35,391 Other revenue 857 176 226 96 3,833 5,188 -794 4,394 Total revenue 22,998 8,619 3,098 850 6,020 41,585 -1,800 39,785
Mercedes- Benz Cars
Daimler Trucks
Mercedes-Benz Vans
Daimler Buses
Daimler Financial Services
Total segments
Recon-ciliation
DaimlerGroup
In millions of euros Q1 2017 (adjusted)1
Europe 9,210 2,299 2,084 559 940 15,092 -835 14,257 NAFTA 4,840 3,219 297 65 1,185 9,606 -17 9,589 Asia 7,272 1,534 179 35 50 9,070 -1 9,069 Other markets 1,093 739 243 180 45 2,300 -49 2,251
Revenue according to IFRS 15 22,415 7,791 2,803 839 2,220 36,068 -902 35,166 Other revenue 106 160 174 84 3,691 4,215 -799 3,416 Total revenue 22,521 7,951 2,977 923 5,911 40,283 -1,701 38,582 1 Information related to the adjustments of the prior-year figures is disclosed in Note 1 of the Notes to the Interim Consolidated Financial Statements.

E | INTERIM CONSOLIDATED FINANCIAL STATEMENTS 43
4. Functional costs
Cost of sales Cost of sales amounted to €31,160 million in the first quarter of 2018 (Q1 2017: €30,579 million). It primarily comprises ex-penses of goods sold. Selling expenses In the first quarter of 2018, selling expenses amounted to €3,097 million (Q1 2017: €3,071 million). Selling expenses consist of direct selling costs as well as selling overhead ex-penses and comprise personnel expenses, material costs and other selling costs.
General administrative expenses General administrative expenses amounted to €971 million in the first quarter of 2018 (Q1 2017: €897 million). They consist of expenses which are not attributable to production, sales or research and development functions, and comprise personnel expenses, depreciation and amortization of fixed and intangible assets, and other administrative costs.
Research and non-capitalized development costs Research and non-capitalized development costs were €1,712 million in the first quarter of 2018 (Q1 2017: €1,448 million). They primarily comprise personnel expenses and material costs.
Optimization programs In the Daimler Trucks segment, no significant expenses were incurred in connection with the optimization of fixed costs, especially at the Mercedes-Benz brand, in the first quarter of 2018. In the year 2017, this led to expenses of €172 million. Cash outflows will mainly occur in 2018.
5. Other operating income
Other operating income in the first quarter of 2018 amounted to €331 million (Q1 2017: €671 million). The first quarter of 2017 primarily reflected income of €267 million from the sale of real estate by Mitsubishi Fuso Truck and Bus Corporation at the Kawasaki site in Japan.
6. Interest income and interest expense
Interest income and interest expense are comprised as follows:
E.12Interest income and interest expense Q1 2018 Q1 2017 In millions of euros Interest income
Net interest income on the net assets of defined benefit pension plans 1 1 Interest and similar income 54 57
55 58 Interest expense
Net interest expense on the net obligation from defined benefit pension plans -33 -52 Interest and similar expense -106 -83 -139 -135
7. Intangible assets
Intangible assets are shown in the following table:
E.13Intangible assets March 31, Dec. 31, 2018 2017 In millions of euros Goodwill 1,082 1,115Development costs 10,526 10,280 Other intangible assets 2,354 2,340 13,962 13,735

44 E | INTERIM CONSOLIDATED FINANCIAL STATEMENTS
8. Property, plant and equipment
Property, plant and equipment are comprised as follows:
E.14Property, plant and equipment March 31, Dec. 31, 2018 2017 In millions of euros
Land, leasehold improvements and buildings including buildings on land owned by others 8,209 8,244 Technical equipment and machinery 9,226 9,334
Other equipment, factory and office equipment 6,172 5,933 Advance payments relating to plant and equipment and construction in progress 4,488 4,470 28,095 27,981
9. Equipment on operating leases
At March 31, 2018, the carrying amount of equipment on oper-ating leases was €47,079 million (December 31, 2017: €47,074 million). In the three-month period ended March 31, 2018, additions and disposals amounted to €6,060 million and €3,412 million respectively (Q1 2017: €5,946 million and €3,386 million). Depreciation for the three-month period ended March 31, 2018 was €2,070 million (Q1 2017: €1,917 million). Other changes primarily comprise the effects of currency trans-lation.

E | INTERIM CONSOLIDATED FINANCIAL STATEMENTS 45
10. Equity-method investments
Table E.15 shows the carrying amounts and profits/losses from equity-method investments.
Table E.16 presents key figures on interests in associated companies accounted for using the equity method in the Group’s consolidated financial statements.
E.15Summarized carrying amounts and profits/losses from equity-method investments
Associatedcompanies
Jointventures
Jointoperations Total
In millions of euros At March 31, 2018
Equity investment1 4,463 520 38 5,021
Equity result (Q1 2018)1 319 21 3 343 At December 31, 2017
Equity investment1 4,282 500 36 4,818 Equity result (Q1 2017)1 714 3 2 719
1 Including investor-level adjustments.
E.16Key figures on interests in associated companies accounted for using the equity method
BBAC BAIC
Motor2THBV
(HERE) Others TotalIn millions of euros At March 31, 2018
Equity interest (in %) 49.0 10.1 29.4 - - Equity investment1 2,479 784 545 655 4,463
Equity result (Q1 2018)1 332 3 -16 - 319 At December 31, 2017
Equity interest (in %) 49.0 10.1 33.3 - - Equity investment1 2,130 777 732 643 4,282 Equity result (Q1 2017)1 290 264 166 -6 714
1 Including investor-level adjustments. 2 Earnings of BAIC Motor Corporation Ltd. (BAIC Motor) are included in Daimler’s consolidated financial statements with a three-month time lag.

46 E | INTERIM CONSOLIDATED FINANCIAL STATEMENTS
BBAC The remainder of the dividend which was declared by the shareholders of Beijing Benz Automotive Co., Ltd. (BBAC) in the second quarter of 2017 was paid out in the first quarter of 2018 and led to a cash inflow of €346 million. BAIC Motor In the first quarter of 2017, the equity result included a gain of €240 million due to a fully reversed impairment of the invest-ment in BAIC Motor Corporation Ltd. (BAIC Motor).
THBV (HERE) In the first quarter of 2018, the shareholders of There Holding B.V. (THBV) decided on a distribution from the capital reserve. The amount of €96 million attributable to Daimler was paid out and decreased the carrying amount of the investment accord-ingly.
In December 2017, Daimler, Audi and BMW signed agreements on the sale of shares in THBV to Robert Bosch Investment Nederland B.V. and to Continental Automotive Holding Nether-lands B.V. Those transactions were concluded on February 28, 2018. Each of both buyers acquired a share of 5.9% of THBV. The sale of shares was carried out in equal parts by Daimler, Audi and BMW. The effect on earnings was not material for Daimler.
In the first quarter of 2017, the equity result included a gain of €183 million from the remeasurement at fair value of shares in HERE International B.V. (HERE), a subsidiary of THBV.

E | INTERIM CONSOLIDATED FINANCIAL STATEMENTS 47
11. Receivables from financial services
Receivables from financial services are shown in the following table:
E.17Receivables from financial services March 31, 2018 Dec. 31, 2017 (adjusted)1 Current Non-current Total Current Non-current Total In millions of euros
Sales financing with customers 17,297 29,058 46,355 16,363 28,635 44,998 Sales financing with dealers 15,737 3,000 18,737 16,065 3,061 19,126 Finance-lease contracts 7,628 16,233 23,861 7,430 15,370 22,800
Gross carrying amount 40,662 48,291 88,953 39,858 47,066 86,924 Allowances for doubtful accounts -477 -534 -1,011 -404 -466 -870 Net carrying amount 40,185 47,757 87,942 39,454 46,600 86,054 1 Information related to the adjustments of the prior-year figures is disclosed in Note 1 of the Notes to the Interim Consolidated Financial Statements.
12. Inventories
Inventories are comprised as follows:
E.18Inventories March 31, Dec. 31, 2018 2017 In millions of euros Raw materials and manufacturing supplies 2,932 2,655
Work in progress 3,817 3,373 Finished goods, parts and products held for resale 20,559 19,361
Advance payments to suppliers 271 297
27,579 25,686
13. Equity
Approved capital The Annual Shareholders’ Meeting held on April 5, 2018 author-ized the Board of Management, with the consent of the Super-visory Board, to increase the share capital of Daimler AG in the period until April 4, 2023 by a total of €1.0 billion in one lump sum or by separate partial amounts at different times by issuing new, registered no-par-value shares in exchange for cash and/or non-cash contributions (Approved Capital 2018). The new shares are generally to be offered to the shareholders for subscription (also by way of indirect subscription pursuant to Section 186 Subsection 5 Sentence 1 of the German Stock Corporation Act (AktG)). Among other things, the Board of Management was authorized with the consent of the Superviso-ry Board to exclude shareholders’ subscription rights under certain conditions and within defined limits.
Approved Capital 2014, which has not yet been utilized, will be cancelled when the resolution for a new Approved Capital 2018 takes effect.
In order to fulfill the conditions of the above-mentioned authori-zation, the Annual Shareholders’ Meeting on April 1, 2015 also resolved to increase the share capital conditionally by an amount of up to €500 million (Conditional Capital 2015). Treasury shares By resolution of the Annual Shareholders’ Meeting on April 1, 2015, the Company is authorized until March 31, 2020 to acquire treasury shares in a volume up to 10% of the share capital issued as of the day of the resolution to be used for all legal purposes. The shares can be used, among other things, with the exclusion of shareholders’ subscription rights, for business combinations or to acquire companies or to be sold to third parties for cash at a price that is not significantly lower than the stock-exchange price of the Company’s shares. The acquired shares can also be used to fulfill obligations from issued convertible bonds and/or bonds with warrants and to be issued to employees of the Company and employees and board
Conditional capital By resolution of the Annual Shareholders’ Meeting on April 1, 2015, the Board of Management is authorized, with the consent of the Supervisory Board, until March 31, 2020 to issue con-vertible and/or warrant bonds or a combination of these instruments (“bonds”) with a total face value of up to €10.0 billion and a maturity of no more than ten years. The Board of Management is allowed to grant the holders of these bonds conversion or warrant rights for new registered no-par-value shares in Daimler AG with an allocable portion of the share capital of up to €500 million in accordance with the details defined in the terms and conditions of the bonds. The bonds can be offered in exchange for cash and/or non-cash contribu-tions, in particular for shares in other companies. The terms and conditions of the bonds can include warranty obligations or conversion obligations. The bonds can be issued once or sever-al times, wholly or in installments, or simultaneously in various tranches, as well as by affiliates of the Company within the meaning of Sections 15 et seq. of the German Stock Corpora-tion Act (AktG). Among other things, the Board of Management was authorized, with the consent of the Supervisory Board, to exclude shareholders’ subscription rights for the bonds under certain conditions and within defined constraints.

48 E | INTERIM CONSOLIDATED FINANCIAL STATEMENTS
members of the Company’s affiliates pursuant to Sections 15 et seq. of the German Stock Corporation Act (AktG). The treasury shares can also be canceled.
The Board of Management is further authorized, with the con-sent of the Supervisory Board, to exclude shareholders’ sub-scription rights in other defined cases. In a volume up to 5% of the share capital issued as of the day of the resolution of the Annual Shareholders’ Meeting, the Company was also author-ized to acquire treasury shares also by using derivatives (put options, call options, forward purchases or a combination of these instruments), whereas the term of a derivative must not exceed 18 months and must not end later than March 31, 2020.
Employee share purchase plan In the first quarter of 2018, 0.7 million (2017: 0.6 million) Daimler shares were purchased and reissued to employees in connection with employee share purchase plans.
Dividend The Annual Shareholders’ Meeting held on April 5, 2018 author-ized Daimler to pay a dividend of €3,905 million (€3.65 per share) from the distributable profit of Daimler AG (separate financial statements) for the year 2017 (2017: €3,477 million and €3.25 per share). The dividend was paid out on April 10, 2018.
14. Pensions and similar obligations
Pension cost The components of pension cost included in the consolidated statement of income are shown in table E.19.
Contributions to pension plan assets In the three months ended March 31, 2018, contributions from Daimler to the Group’s pension plan assets amounted to €30 million (Q1 2017: €44 million).
E.19Components of net periodic pension cost Q1 2018 Q1 2017
TotalGerman
plans
Non- German
plans TotalGerman
plans
Non-German
plansIn millions of euros Current service cost -171 -147 -24 -170 -145 -25 Net interest expense -22 -14 -8 -39 -29 -10 Net interest income 1 - 1 1 - 1 -192 -161 -31 -208 -174 -34
15. Provisions for other risks
Provisions for other risks are comprised as shown in table E.20.
E.20Provisions for other risks March 31, 2018 Dec. 31, 2017 (adjusted)1
Current Non-current Total Current Non-current Total In millions of euros Product warranties 2,917 3,675 6,592 3,154 3,562 6,716Personnel and social costs 2,045 2,190 4,235 2,209 2,216 4,425 Other 2,293 1,346 3,639 2,257 1,365 3,622 7,255 7,211 14,466 7,620 7,143 14,763 1 Information related to the adjustments of the prior-year figures is disclosed in Note 1 of the Notes to the Interim Consolidated Financial Statements.

E | INTERIM CONSOLIDATED FINANCIAL STATEMENTS 49
16. Financing liabilities
Financing liabilities are comprised as follows:
E.21Financing liabilities March 31, 2018 Dec. 31, 2017 Current Non-current Total Current Non-current Total In millions of euros Notes/bonds 11,721 54,624 66,345 13,785 53,288 67,073 Commercial paper 2,435 - 2,435 1,045 - 1,045 Liabilities to financial institutions 18,902 17,231 36,133 17,583 16,972 34,555 Deposits in the direct banking business 9,704 1,761 11,465 9,450 2,010 11,460 Liabilities from ABS transactions 5,824 5,385 11,209 6,214 4,823 11,037 Liabilities from finance leases 25 323 348 27 325 352 Loans, other financing liabilities 536 917 1,453 642 960 1,602 49,147 80,241 129,388 48,746 78,378 127,124
17. Legal proceedings
As already reported, several consumer class-action lawsuits were filed against Mercedes-Benz USA, LLC (MBUSA) in federal courts in the United States in early 2016. The main allegation was the use of devices that impermissibly impair the effective-ness of emission control systems in reducing nitrogen-oxide (NOX) emissions and which cause excessive emissions from vehicles with diesel engines. In addition, plaintiffs alleged that consumers were deliberately deceived in connection with the advertising of Mercedes-Benz diesel vehicles. Those consumer class actions were consolidated into one class action pending against both Daimler AG and MBUSA in the US District Court for the District of New Jersey, in which the plaintiffs asserted various grounds for monetary relief on behalf of a nation-wide class of persons or entities who owned or leased certain mod-els of Mercedes-Benz diesel vehicles as of February 18, 2016. Daimler AG and MBUSA moved to dismiss the lawsuit in its entirety. By order dated December 6, 2016, the court granted Daimler AG’s and MBUSA’s motion to dismiss and dismissed the lawsuit without prejudice, based on plaintiffs’ failure to allege with sufficient specificity the advertising that they con-tended had misled them. Plaintiffs subsequently filed an amended class action complaint in the same court making similar allegations. The amended complaint also adds as de-fendants Robert Bosch LLC and Robert Bosch GmbH (collective-ly “Bosch”), and alleges that Daimler AG and MBUSA conspired with Bosch to deceive US regulators and consumers. Daimler AG and MBUSA view the lawsuit as being without merit and will defend against the claims.
Another consumer class-action lawsuit against Daimler AG and other companies of the Group containing similar allegations was filed in Canada in April 2016. On June 29, 2017, the court granted a procedural motion to certify certain issues for class treatment, and on March 12, 2018 the court ordered the parties to send a notice to the class by May 18, 2018, informing class members that the litigation is ongoing. Daimler also regards this lawsuit as being without merit and will defend against the claims. On July 14, 2017, an additional class action was filed in the Superior Court of California, Los Angeles County, against Daimler AG and other companies of the Group, alleging claims
similar to the existing US class action. That action was removed to federal court and, on October 31, 2017, was transferred to the District of New Jersey. On December 21, 2017, the parties stipulated to dismiss, without prejudice, that lawsuit. It may be filed again under specific conditions, but Daimler also regards this lawsuit as being without merit.
Several state and federal authorities and institutions world-wide have inquired about and/or are conducting investigations or administrative proceedings regarding test results, the emission control systems used in Mercedes-Benz diesel vehicles and/or Daimler’s interaction with the relevant state and federal authori-ties, as well as related legal issues and implications, including, but not limited to, under applicable environmental, securities, criminal and antitrust laws. These authorities and institutions include, among others, the U.S. Department of Justice (DOJ), which, in April 2016, requested that Daimler AG review its certification and admissions processes related to exhaust emis-sions of diesel vehicles in the United States by way of an inter-nal investigation in cooperation with the DOJ, the U.S. Environ-mental Protection Agency (EPA), the California Air Resources Board (CARB) and other US state authorities, the U.S. Securities and Exchange Commission (SEC), the European Commission, with which Daimler AG has filed a leniency application, as well as national cartel authorities and other authorities of various foreign states, as well as the German Federal Financial Supervi-sory Authority (BaFin) and the German Federal Motor Transport Authority (KBA), the diesel emissions committee of inquiry of the German Parliament and the Stuttgart district attorney’s office. The Stuttgart district attorney’s office is conducting criminal investigation proceedings against Daimler employees concerning the suspicion of fraud and criminal advertising, and searched the premises of Daimler at several locations in Ger-many. Daimler continues to fully cooperate with the DOJ and the other authorities and institutions. As these inquiries, inves-tigations, administrative proceedings and the replies to these related information requests as well as Daimler’s internal inves-tigation are ongoing, we rely on IAS 37.92 in not disclosing any further information on whether or not, or to what extent, provi-sions have been recognized and/or contingent liabilities have been disclosed.

50 E | INTERIM CONSOLIDATED FINANCIAL STATEMENTS
Starting on July 25, 2017, a number of class actions have been filed in the United States and Canada against Daimler AG and other manufacturers of automobiles as well as various of their North American subsidiaries. Plaintiffs allege to have suffered damages because defendants engaged in anticompetitive be-havior relating to vehicle technology, costs, suppliers, markets, and other competitive attributes, including diesel emissions control technology, since the 1990s. On October 4, 2017, all pending US class actions were centralized in one proceeding by the Judicial Panel on Multidistrict Litigation and transferred to the U.S. District Court for the Northern District of California. On March 15, 2018 plaintiffs in the US class action amended and consolidated their complaints into two pleadings, one on behalf of consumers and the other on behalf of dealers. Daimler AG and the other Daimler group affiliates respectively affected regard the US and Canadian lawsuits as being without merit, and will defend against the claims.
Following the settlement decision by the European Commission adopted on July 19, 2016 concluding the trucks antitrust pro-ceedings, Daimler AG faces customers’ claims for damages to a considerable degree. Respective legal actions have been initiat-ed in various states in and outside of Europe. Appropriate legal remedies are taken to defend the company. In accordance with IAS 37.92, no further information is disclosed with respect to whether, or to what extent, provisions have been recognized and/or contingent liabilities have been disclosed, so as not to prejudice Daimler AG’s position.
As already reported, in August 2016, Mercedes-Benz Canada (MB Canada) was added as a defendant to a putative nation-wide class action pending in Ontario Superior Court. The main allegation in the matter is that MB Canada, along with Takata entities and many other companies that sold vehicles equipped with Takata airbag inflators, was allegedly negligent in selling such vehicles, purportedly not recalling them quickly enough, and failing to provide an allegedly adequate replacement airbag inflator. In addition, on June 28, 2017, Takata entities along with Daimler AG and MBUSA were named as defendants in a US nation-wide class action, which was filed in New Jersey federal court and includes allegations that are similar to the Canadian action. In the third quarter of 2017, the New Jersey lawsuit was transferred to federal court in the Southern District of Florida for consolidation with other multi-district litigation proceedings. Then, on March 14, 2018, Daimler AG and MBUSA were named as defendants in two additional US nation-wide class action complaints, one filed in Georgia federal court, and the other filed into the multi-district litigation proceedings pending in Florida. The allegations in these new complaints are similar to those in the Canadian and New Jersey actions. The previously reported lawsuit filed by the State of New Mexico, which also made similar claims against MBUSA and many other companies that sold vehicles equipped with Takata airbag inflators, was dismissed without prejudice on June 22, 2017. It may, however, be filed again under specific conditions. Daimler AG continues to regard all these lawsuits brought with regard to Mercedes-Benz vehicles as being without merit, and the Daimler Group affiliates respectively affected will further defend themselves against the claims.
The statements contained in this interim report are to be read in conjunction with the consolidated financial statements as at December 31, 2017. In our assessment, there have been no substantial changes with respect to the other legal proceedings reported in Note 29 to the consolidated financial statements as at December 31, 2017.

E | INTERIM CONSOLIDATED FINANCIAL STATEMENTS 51
18. Financial instruments
Table E.22 and table E.23 show the carrying amounts and fair values of the Group’s financial instruments at March 31, 2018 according to IFRS 9 and at December 31, 2017 according to IAS 39.
The fair value of a financial instrument is the price that would be received to sell an asset or paid to transfer a liability in an orderly transaction between market participants at the meas-urement date. Given the varying influencing factors, the report-ed fair values can only be viewed as indicators of the prices that may actually be achieved in the market.
E.22Carrying amounts and fair values of financial instruments (according to IFRS 9) March 31, 2018
Carryingamount Fair value
In millions of euros Financial assets Receivables from financial services 87,942 88,239 Trade receivables 11,665 11,665 Cash and cash equivalents 14,058 14,058 Marketable debt securities and similar investments 10,407 10,407
Recognized at fair value through other comprehensive income 6,843 6,843 Recognized at fair value through profit or loss 3,328 3,328 Measured at cost 236 236
Other financial assets Equity instruments and debt instruments 524 524
Recognized at fair value through other comprehensive income 339 339 Recognized at fair value through profit or loss 185 185
Other financial assets recognized at fair value through profit or loss 127 127 Derivative financial instruments used in hedge accounting 2,380 2,380 Other receivables and financial assets 3,652 3,652
130,755 131,052 Financial liabilities Financing liabilities 129,388 130,240 Trade payables 14,865 14,865 Other financial liabilities
Financial liabilities recognized at fair value through profit or loss 122 122 Derivative financial instruments used in hedge accounting 979 979 Miscellaneous other financial liabilities 8,380 8,380
153,734 154,586

52 E | INTERIM CONSOLIDATED FINANCIAL STATEMENTS
E.23Carrying amounts and fair values of financial instruments (according to IAS 39)1 Dec. 31, 2017
Carryingamount Fair value
in millions of euros Financial assets Receivables from financial services 86,054 86,420 Trade receivables 11,995 11,995 Cash and cash equivalents 12,072 12,072 Marketable debt securities
Available-for-sale financial assets 10,063 10,063 Other financial assets
Available-for-sale financial assets 1,173 1,173 thereof equity instruments recognized at fair value 171 171 thereof equity instruments measured at cost 1,002 1,002
Financial assets recognized at fair value through profit or loss 82 82 Derivative financial instruments used in hedge accounting 2,379 2,379 Other receivables and financial assets 3,172 3,172 126,990 127,356
Financial liabilities Financing liabilities 127,124 128,437 Trade payables 12,451 12,451 Other financial liabilities
Financial liabilities recognized at fair value through profit or loss 111 111 Derivative financial instruments used in hedge accounting 696 696 Miscellaneous other financial liabilities 8,468 8,468
148,850 150,163 1 Information related to the adjustments of the prior-year figures is disclosed in Note 1 of the Notes to the Interim Consolidated Financial Statements.
The fair values of financial instruments were calculated on the basis of market information available on the reporting date. The following methods and premises were used:
Marketable debt securities and similar investments, other financial assets and liabilities At March 31, 2018, Marketable debt securities are measured at fair value through other comprehensive income or at fair value through profit or loss. Similar investments are measured at amortized cost and are not included in the measurement hier-archy, as their fair value equals the carrying amount. Equity Instruments are measured at fair value through other comprehensive income or at fair value through profit or loss. Daimler does not intend to sell its equity instruments which are presented at March 31, 2018. Marketable debt securities and equity instruments measured at fair value were measured using quoted market prices at March 31, 2018. If quoted market prices were not available for these debt and equity instruments, the fair value measurement is based on inputs that are either directly or indirectly observable in active markets.
Other financial assets and liabilities recognized at fair value through profit or loss comprise derivative financial instruments not used in hedge accounting. These financial instruments as well as derivative financial instruments used in hedge accounting comprise: − derivative currency hedging contracts; the fair values of
cross-currency interest rate swaps are determined on the basis of the discounted estimated future cash flows using market interest rates appropriate to the remaining terms of the financial instruments. The valuation of currency forwards is based on market quotes of forward curves; currency options were measured using price quotations or option pricing models using market data.
− derivative interest rate hedging contracts; the fair values of interest rate hedging instruments (e.g. interest rate swaps) are calculated on the basis of the discounted estimated future cash flows using the market interest rates appropriate to the remaining terms of the financial instruments.
− derivative commodity hedging contracts; the fair values of commodity hedging contracts (e.g. commodity forwards) are determined on the basis of current reference prices with consideration of forward premiums and discounts.

E | INTERIM CONSOLIDATED FINANCIAL STATEMENTS 53
Table E.24 and Table E.25 provide an overview of the classification into measurement hierarchies of financial assets and liabilities measured at fair value (according to IFRS 13) at March 31, 2018 according to IFRS 9 and at December 31, 2017 according to IAS 39 respectively.
At the end of each reporting period, Daimler reviews the neces-sity for reclassification between the fair value hierarchies.
For the determination of the credit risk from derivative financial instruments which are allocated to the Level 2 measurement hierarchy, portfolios managed on basis of net exposure are applied.
E.24Measurement hierarchy of financial assets and liabilities recognized at fair value (according to IFRS 9) March 31, 2018
Total Level 11 Level 22 Level 33 In millions of euros Financial assets recognized at fair value
Marketable debt securities 10,171 6,370 3,801 - Recognized at fair value through other comprehensive income 6,843 3,042 3,801 - Recognized at fair value through profit or loss 3,328 3,328 - -
Equity instruments and debt instruments 524 94 256 174 Recognized at fair value through other comprehensive income 339 94 148 97 Recognized at fair value through profit or loss 185 - 108 77
Other financial assets recognized at fair value through profit or loss 127 - 127 - Derivative financial instruments used in hedge accounting 2,380 - 2,380 -
13,202 6,464 6,564 174 Financial liabilities recognized at fair value
Financial liabilities recognized at fair value through profit or loss 122 - 122 - Derivative financial instruments used in hedge accounting 979 - 979 -
1,101 - 1,101 - 1 Fair value measurement based on quoted prices (unadjusted) in active markets for these or identical assets or liabilities. 2 Fair value measurement based on inputs that are observable in active markets either directly (i.e. as prices) or indirectly (i.e. derived from prices). 3 Fair value measurement based on inputs for which no observable market data is available.
E.25Measurement hierarchy of financial assets and liabilities recognized at fair value (according to IAS 39) Dec. 31, 2017
Total Level 11 Level 22 Level 33 in millions of euros Financial assets recognized at fair value
Financial assets available-for-sale 10,234 6,721 3,513 - thereof marketable debt securities 10,063 6,615 3,448 - thereof equity instruments recognized at fair value 171 106 65 -
Financial assets recognized at fair value through profit or loss 82 - 82 - Derivative financial instruments used in hedge accounting 2,379 - 2,379 -
12,695 6,721 5,974 - Financial liabilities recognized at fair value
Financial liabilities recognized at fair value through profit or loss 111 - 111 - Derivative financial instruments used in hedge accounting 696 - 696 -
807 - 807 - 1 Fair value measurement based on quoted prices (unadjusted) in active markets for these or identical assets or liabilities. 2 Fair value measurement based on inputs that are observable in active markets either directly (i.e. as prices) or indirectly (i.e. derived from prices). 3 Fair value measurement based on inputs for which no observable market data is available.

54 E | INTERIM CONSOLIDATED FINANCIAL STATEMENTS
19. Segment reporting
Segment information for the three-month periods ended March 31, 2018 and March 31, 2017 is as follows:
E.26Segment reporting
Mercedes- Benz Cars
DaimlerTrucks
Mercedes-Benz Vans
Daimler Buses
Daimler Financial Services
Total segments
Recon-ciliation
DaimlerGroup
In millions of euros Q1 2018
External revenue 22,083 8,203 2,917 824 5,758 39,785 - 39,785 Intersegment revenue 915 416 181 26 262 1,800 -1,800 -
Total revenue 22,998 8,619 3,098 850 6,020 41,585 -1,800 39,785
Segment profit (EBIT) 2,060 647 172 37 548 3,464 -129 3,335
thereof share of profit/loss from equity-method investments 319 10 16 - -5 340 3 343
thereof profit/loss from compounding and effects from changes in discount rates of provisions for other risks 10 5 - -1 -1 13 - 13
Mercedes- Benz Cars
DaimlerTrucks
Mercedes-Benz Vans
Daimler Buses
Daimler Financial Services
Total segments
Recon-ciliation
DaimlerGroup
In millions of euros
Q1 2017 (adjusted)1 External revenue 21,628 7,612 2,851 901 5,590 38,582 - 38,582 Intersegment revenue 893 339 126 22 321 1,701 -1,701 -
Total revenue 22,521 7,951 2,977 923 5,911 40,283 -1,701 38,582
Segment profit (EBIT) 1,998 662 337 72 524 3,593 178 3,771
thereof share of profit/loss from equity-method investments 456 -6 7 - -2 455 264 719
thereof profit/loss from compounding and effects from changes in discount rates of provisions for other risks -3 -2 - - -1 -6 - -6
1 Information related to the adjustments of the prior-year figures is disclosed in Note 1 of the Notes to the Interim Consolidated Financial Statements.

E | INTERIM CONSOLIDATED FINANCIAL STATEMENTS 55
Reconciliation Reconciliation of the total segments’ profit (EBIT) to profit before income taxes is as shown in table E.27.
The reconciliation comprises corporate items for which head-quarter is responsible. Transactions between the segments are eliminated in the context of consolidation.
E.27Reconciliation to Group figures
Q1 2018 Q1 2017 (adjusted)1
In millions of euros
Total segments' profit (EBIT) 3,464 3,593
Share of profit from equity-method investments2 3 264
Other corporate items -122 -77
Eliminations -10 -9
Group EBIT 3,335 3,771
Amortization of capitalized borrowing costs3 -4 -3
Interest income 55 58
Interest expense -139 -135
Profit before income taxes 3,247 3,691
20. Related party relationships
Related parties are deemed to be associated companies, joint ventures, joint operations and unconsolidated subsidiaries, as well as persons who exercise a significant influence on the financial and business policy of the Daimler Group. The latter category includes all persons in key positions and their close family members. At the Daimler Group, those persons are the members of the Board of Management and of the Supervisory Board.
Most of the goods and services supplied within the ordinary course of business between the Group and related parties involve transactions with associated companies, joint ventures and joint operations, and are shown in table E.28.
Associated companies A large proportion of the Group’s sales of goods and services with associated companies as well as receivables due from them results from business relations with LSH Auto Internation-al Limited (LSHAI) and with Beijing Benz Automotive Co., Ltd. (BBAC). In the second quarter of 2017, Daimler had acquired a 15% stake in LSHAI. See Note 10 for further information on BBAC.
The purchases of goods and services shown in table E.28 were primarily from LSHAI and MBtech Group GmbH & Co. KGaA (MBtech Group). MBtech Group develops, integrates and tests components, systems, modules and vehicles worldwide.
Joint ventures In business relationships with joint ventures, significant sales of goods and services took place with Fujian Benz Automotive Co., Ltd. and with DAIMLER KAMAZ RUS OOO, a company estab-lished with Kamaz PAO, another of the Group’s associated companies.
Shenzen DENZA New Energy Automotive Co. Ltd. (DENZA) is allocated to the Mercedes-Benz Cars segment. Daimler provid-ed guarantees in a total amount of RMB 1,250 million (approxi-mately €161 million) to external banks which provided two loans to DENZA. At March 31, 2018, loans amounting to RMB 705 million (approximately €91 million) were utilized. In addi-tion, Daimler provided a shareholder loan of RMB 250 million (approximately €32 million) to DENZA, which is fully utilized. In accordance with its shareholding ratio, Daimler contributed additional equity of RMB 500 million (€65 million) to DENZA in July 2017.
In connection with its 45% equity interest in Toll Collect GmbH, Daimler has issued guarantees which are not shown in table
E.28 (€100 million at March 31, 2018 and at December 31, 2017).
Joint operations Joint operations primarily relate to significant business transac-tions with Beijing Mercedes-Benz Sales Service Co., Ltd. and EM-motive GmbH.
1 Information related to the adjustments of the prior-year figures is dis-closed in Note 1 of the Notes to the Interim Consolidated Financial Statements.
2 The first quarter of 2017 mainly comprises the reversal of an impair-ment of Daimler’s equity investments in BAIC Motor of €240 million.
3 Amortization of capitalized borrowing costs is not considered in inter-nal performance measure “EBIT”, but is included in cost of sales.

56 E | INTERIM CONSOLIDATED FINANCIAL STATEMENTS
E.28Transactions with related parties
Sales of goodsand services
and other income
Purchases of goodsand services
and other expense Receivables
2 Payables
3
In millions of euros Q1 2018 Q1 2017 Q1 2018 Q1 2017March 31,
2018Dec. 31,
2017 March 31,
2018Dec. 31,
2017 Associated companies 3,424 1,103 243 96 2,566 2,827 247 253
thereof LSHAI
1 2,251 - 157 - 1,036 1,075 147 127 thereof BBAC 1,075 1,008 19 37 1,456 1,673 65 65
Joint ventures 286 169 16 14 224 183 101 115 Joint operations 10 3 56 54 36 28 16 54 1 As the equity interest in LSHAI was acquired in May 2017, business relations with LSHAI are reported from June 2017 onward. 2 After write-downs totaling €53 million (December 31, 2017: €52 million). 3 Including liabilities from default risks from guarantees for related parties.

57
To Daimler AG, Stuttgart
We have reviewed the condensed interim consolidated financial statements of Daimler AG - comprising the consolidated state-ment of income/loss, consolidated statement of comprehen-sive income/loss, consolidated statement of financial position, consolidated statement of changes in equity, consolidated statement of cash flows and selected, explanatory notes - together with the interim group management report of Daimler AG, for the period from January 1 to March 31, 2018, that are part of the quarterly financial report according to § 115 WpHG (“Wertpapierhandelsgesetz”:“German Securities Trading Act”). The preparation of the condensed interim consolidated financial statements in accordance with International Accounting Stand-ard IAS 34 “Interim Financial Reporting” as adopted by the EU, and of the interim group management report in accordance with the requirements of the WpHG applicable to interim group management reports, is the responsibility of the Company’s management. Our responsibility is to issue a report on the condensed interim consolidated financial statements and on the interim group management report based on our review.
We performed our review of the condensed interim consolidat-ed financial statements and the interim group management report in accordance with the German generally accepted standards for the review of financial statements promulgated by the Institut der Wirtschaftsprüfer (IDW) and additional application of the International Standard on Review Engage-ments 2410 “Review of Interim Financial Information Performed by the Independent Auditor of the Entity” (ISRE 2410). Those standards require that we plan and perform the review so that we can preclude through critical evaluation, with a certain level of assurance, that the condensed interim consolidated financial statements have not been prepared, in material respects, in accordance with IAS34, “Interim Financial Reporting” as adopt-ed by the EU, and that the interim group management report has not been prepared, in material respects, in accordance with the requirements of the WpHG applicable to interim group management reports. A review is limited primarily to inquiries of company employees and analytical assessments and therefore does not provide the assurance attainable in a financial state-ment audit. Since, in accordance with our engagement, we have not performed a financial statement audit, we cannot issue an auditor’s report.
Based on our review, no matters have come to our attention that cause us to presume that the condensed interim consoli-dated financial statements have not been prepared, in material respects, in accordance with IAS 34, “Interim Financial Report-ing” as adopted by the EU, or that the interim group manage-ment report has not been prepared, in material respects, in accordance with the requirements of the WpHG applicable to interim group management reports.
Stuttgart, April 26, 2018
KPMG AG Wirtschaftsprüfungsgesellschaft
Becker Dr. Thümler Wirtschaftsprüfer Wirtschaftsprüfer
Auditor’s Review Report

Addresses | Information
Investor Relations Telephone +49 711 17 92261
17 9777817 9525617 95277
Fax +49 711 17 94075
This report and additional information can be found on the Internet at www.daimler.com
Concept and contents Daimler AG Investor Relations
Publications for our shareholders Annual Report (German and English) Interim Reports on the first, second and third quarters (German and English) Sustainability Report (German and English) www.daimler.com/ir/reports
Financial Calendar
Interim Report Q1 2018 April 27, 2018
Interim Report Q2 2018 July 26, 2018
Interim Report Q3 2018 October 25, 2018
As changes to the above dates cannot be ruled out, we recommend checking on the Internet shortly before each scheduled date at www.daimler.com/ir/calendar.

Interim Report Q1 2018
Daimler AGMercedesstr. 13770327 StuttgartGermanywww.daimler.com
englisch_Daimler_Q1_2018.indd Alle Seiten 23.04.18 14:00