Embed Size (px)
Citation preview
Dairy Consumption and Risk of Stroke: A Systematic Review andUpdated Dose–Response Meta-Analysis of Prospective CohortStudiesJanette de Goede, PhD; Sabita S. Soedamah-Muthu, PhD; An Pan, PhD; Lieke Gijsbers, MSc; Johanna M. Geleijnse, PhD
Background-—A higher milk consumption may be associated with a lower stroke risk. We conducted a comprehensive systematicreview and dose–response meta-analysis of milk and other dairy products in relation to stroke risk.
Methods and Results-—Through a systematic literature search, prospective cohort studies of dairy foods and incident stroke instroke-free adults were identified. Random-effects meta-analyses with summarized dose–response data were performed, takinginto account sources of heterogeneity, and spline models were used to systematically investigate nonlinearity of the associations.We included 18 studies with 8 to 26 years of follow-up that included 762 414 individuals and 29 943 stroke events. An incrementof 200 g of daily milk intake was associated with a 7% lower risk of stroke (relative risk 0.93; 95% CI 0.88–0.98; P=0.004; I2=86%).Relative risks were 0.82 (95% CI 0.75–0.90) in East Asian and 0.98 (95% CI 0.95–1.01) in Western countries (median intakes 38and 266 g/day, respectively) with less but still considerable heterogeneity within the continents. Cheese intake was marginallyinversely associated with stroke risk (relative risk 0.97; 95% CI 0.94–1.01 per 40 g/day). Risk reductions were maximal around125 g/day for milk and from 25 g/day onwards for cheese. Based on a limited number of studies, high-fat milk was directlyassociated with stroke risk. No associations were found for yogurt, butter, or total dairy.
Conclusions-—Milk and cheese consumption were inversely associated with stroke risk. Results should be placed in the context ofthe observed heterogeneity. Future epidemiological studies should provide more details about dairy types, including fat content. Inaddition, the role of dairy in Asian populations deserves further attention. ( J Am Heart Assoc. 2016;5:e002787 doi: 10.1161/JAHA.115.002787)
Key Words: dairy products • meta-analysis • prospective cohort study • stroke • systematic review
S troke is the second-leading global cause of death,accounting for 11% of total deaths worldwide,1 and a
major cause of long-term disability.2 East Asian countriessuch as Japan and China have greater mortality and morbidityfrom stroke than from coronary heart disease, whereas it isthe opposite in Western countries.3 A healthy diet is
important for the primary prevention of stroke.4,5 In Westernas well as Asian countries, dairy consumption is recom-mended as part of a healthy diet.6–9 For example, in theUnited States, 3 daily servings of dairy, mainly low-fat or fat-free, is recommended.7 The Chinese and Japanese recom-mendations are 300 mL of daily dairy8 and 2 daily servings ofmilk and dairy products, respectively.9
In 2011, we observed a nonsignificant inverse associationof milk with stroke risk with a relative risk (RR) of 0.87 (95%CI: 0.72–1.07) per 200 mL of daily intake in a meta-analysis.10 This meta-analysis was, however, based on only6 cohort studies and showed large heterogeneity, partly dueto a strong inverse association in a Japanese cohort.11 In amore recent meta-analysis of dairy consumption and strokerisk, the pooled RR was 0.91 (95% CI 0.82–1.01) for highversus low milk intake with large heterogeneity, based on 9studies,12 including 1 study in children.13 Based on 6 studies,the association was nonlinear.12
Several new prospective cohort studies14–17 havebecome available on the association between dairy con-sumption and stroke risk, amounting to a total of 18
From the Division of Human Nutrition, Wageningen University, Wageningen, TheNetherlands (J.G., S.S.S.-M., L.G., J.M.G.); Department of Epidemiology andBiostatistics, Ministry of Education Key Lab of Environment and Health, Schoolof Public Health, Tongji Medical College, Huazhong University of Science andTechnology, Wuhan, Hubei, China (A.P.).
An accompanying Data S1 is available at http://jaha.ahajournals.org/content/5/5/e002787/DC1/embed/inline-supplementary-material-1.pdf
Correspondence to: Sabita Soedamah-Muthu, PhD, Division of HumanNutrition, Wageningen University, P.O. Box 8129, 6700 EV, Wageningen, TheNetherlands. E-mail: [email protected]
Received December 15, 2015; accepted March 4, 2016.
ª 2016 The Authors. Published on behalf of the American Heart Association,Inc., by Wiley Blackwell. This is an open access article under the terms of theCreative Commons Attribution-NonCommercial License, which permits use,distribution and reproduction in any medium, provided the original work isproperly cited and is not used for commercial purposes.
DOI: 10.1161/JAHA.115.002787 Journal of the American Heart Association 1
ORIGINAL RESEARCH
by guest on July 11, 2018http://jaha.ahajournals.org/
Dow
nloaded from
studies. Most evidence of dairy in relation to stroke riskrelates to milk consumption. However, a considerableamount of heterogeneity was present in 2 previous meta-analyses in relation to the results of milk.10,12 Previousinvestigations on heterogeneity were limited based on thenumber of available studies10 or were limited to the
analysis of total dairy only.12 We conducted a comprehen-sive dose–response meta-analysis, taking into accountpotential nonlinear associations and sources of heterogene-ity (such as continent, type of stroke, and fat content), forwhich additional or unpublished data were obtained frominvestigators.
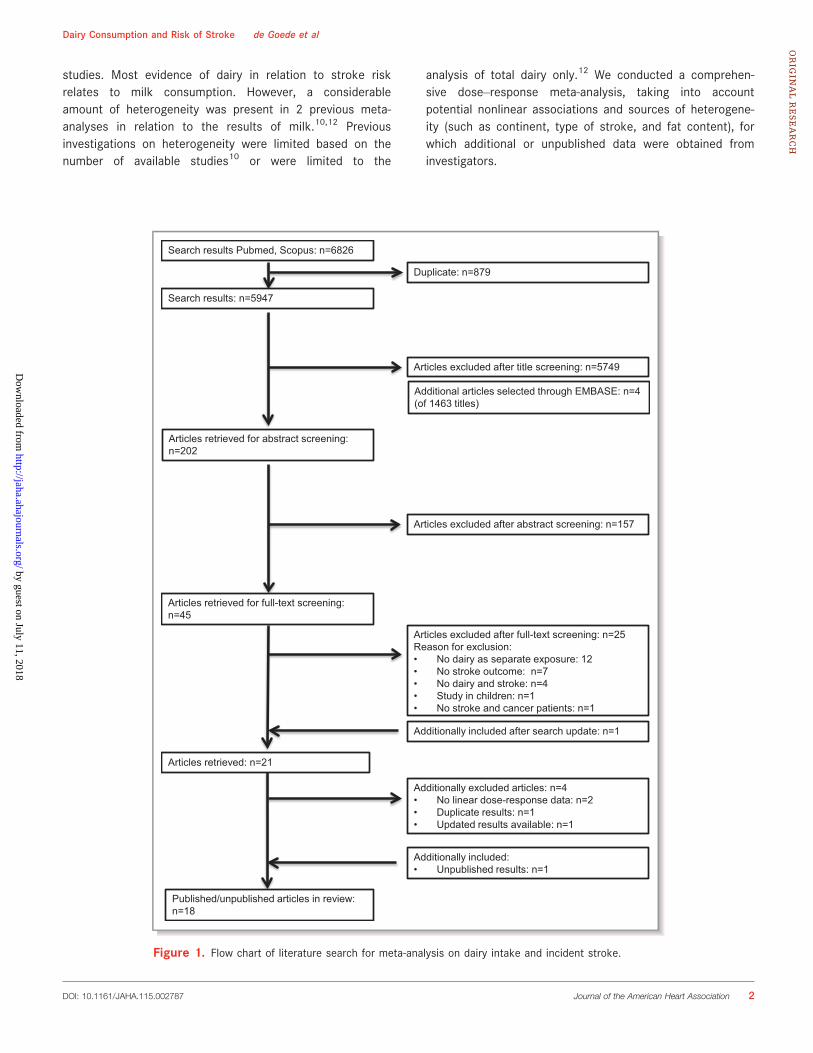
Articles excluded after full-text screening: n=25Reason for exclusion:• No dairy as separate exposure: 12• No stroke outcome: n=7• No dairy and stroke: n=4• Study in children: n=1• No stroke and cancer patients: n=1
Articles retrieved for abstract screening: n=202
Articles excluded after abstract screening: n=157
Additionally included:• Unpublished results: n=1
Search results Pubmed, Scopus: n=6826
Search results: n=5947
Duplicate: n=879
Articles excluded after title screening: n=5749
Articles retrieved for full-text screening: n=45
Articles retrieved: n=21
Published/unpublished articles in review: n=18
Additional articles selected through EMBASE: n=4 (of 1463 titles)
Additionally excluded articles: n=4• No linear dose-response data: n=2• Duplicate results: n=1• Updated results available: n=1
Additionally included after search update: n=1
Figure 1. Flow chart of literature search for meta-analysis on dairy intake and incident stroke.
DOI: 10.1161/JAHA.115.002787 Journal of the American Heart Association 2
Dairy Consumption and Risk of Stroke de Goede et alORIG
INALRESEARCH
by guest on July 11, 2018http://jaha.ahajournals.org/
Dow
nloaded from
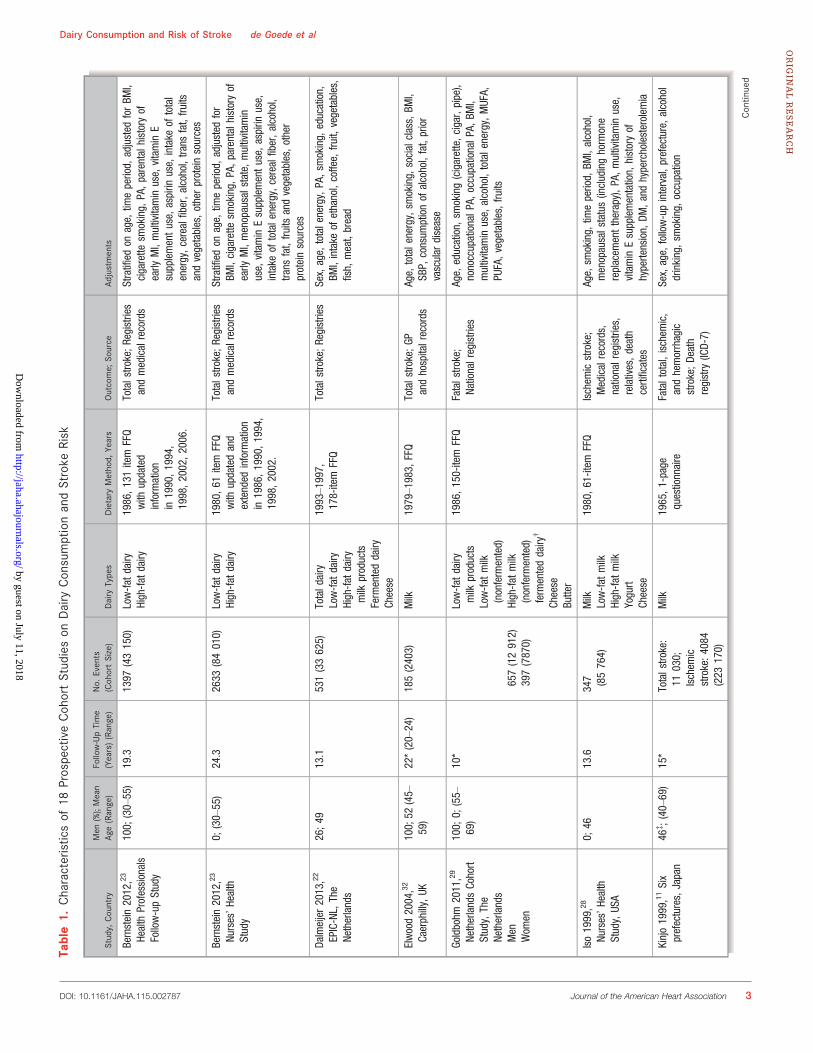
Table1.
Characteristicsof
18ProspectiveCohortStudieson
Dairy
ConsumptionandStroke
Risk
Study,
Country
Men
(%);Mean
Age(Range)
Follow-UpTime
(Years)(Range)
No.
Events
(CohortSize)
Dairy
Types
Dietary
Method,
Years
Outcome;
Source
Adjustments
Bernstein2012,23
Health
Professionals
Follow-upStudy
100;
(30–55)
19.3
1397
(43150)
Low-fat
dairy
High-fat
dairy
1986,131item
FFQ
with
updated
inform
ation
in1990,1994,
1998,2002,2006.
Totalstroke;Registries
andmedicalrecords
Stratifiedon
age,
timeperiod,
adjusted
forBM
I,cigarette
smoking,
PA,parentalhistoryof
early
MI,multivitaminuse,
vitaminE
supplementuse,
aspirin
use,
intake
oftotal
energy,cerealfiber,alcohol,trans
fat,fruits
andvegetables,otherproteinsources
Bernstein2012,23
Nurses’Health
Study
0;(30–55)
24.3
2633
(84010)
Low-fat
dairy
High-fat
dairy
1980,61
item
FFQ
with
updatedand
extended
inform
ation
in1986,1990,1994,
1998,2002.
Totalstroke;Registries
andmedicalrecords
Stratifiedon
age,
timeperiod,
adjusted
for
BMI,cigarette
smoking,
PA,parentalhistoryof
early
MI,menopausalstate,multivitamin
use,
vitaminEsupplementuse,
aspirin
use,
intake
oftotalenergy,cerealfiber,alcohol,
trans
fat,fruits
andvegetables,other
proteinsources
Dalmeijer2013,22
EPIC-NL,
The
Netherlands
26;49
13.1
531(33625)
Totaldairy
Low-fat
dairy
High-fat
dairy
milk
products
Ferm
enteddairy
Cheese
1993–1997,
178-item
FFQ
Totalstroke;Registries
Sex,age,
totalenergy,PA,sm
oking,
education,
BMI,intake
ofethanol,coffee,
fruit,
vegetables,
fish,
meat,bread
Elwood2004,32
Caerphilly,UK
100;52
(45–
59)
22*(20–24)
185(2403)
Milk
1979–1983,
FFQ
Totalstroke;GP
andhospitalrecords
Age,
totalenergy,sm
oking,
socialclass,BM
I,SB
P,consum
ptionof
alcohol,fat,prior
vascular
disease
Goldbohm
2011,29
NetherlandsCohort
Study,The
Netherlands
Men
Wom
en
100;
0;(55–
69)
10*
657(12912)
397(7870)
Low-fat
dairy
milk
products
Low-fat
milk
(nonferm
ented)
High-fat
milk
(nonferm
ented)
ferm
enteddairy
†
Cheese
Butter
1986,150-item
FFQ
Fatalstroke;
Nationalregistries
Age,
education,
smoking(cigarette,cigar,pipe),
nonoccupationalP
A,occupationalP
A,BM
I,multivitaminuse,
alcohol,totalenergy,MUFA,
PUFA,vegetables,fruits
Iso1999,28
Nurses’Health
Study,US
A
0;46
13.6
347 (85764)
Milk
Low-fat
milk
High-fat
milk
Yogurt
Cheese
1980,61-item
FFQ
Ischem
icstroke;
Medicalrecords,
nationalregistries,
relatives,death
certificates
Age,
smoking,
timeperiod,
BMI,alcohol,
menopausalstatus(includinghorm
one
replacem
enttherapy),PA,multivitaminuse,
vitaminEsupplementation,
historyof
hypertension,
DM,andhypercholesterolem
ia
Kinjo1999,11Six
prefectures,Japan
46‡;(40–69)
15*
Totalstroke:
11030;
Ischem
icstroke:4084
(223
170)
Milk
1965,1-page
questionnaire
Fataltotal,ischem
ic,
andhemorrhagic
stroke;Death
registry
(ICD-7)
Sex,age,
follow-upinterval,prefecture,alcohol
drinking,sm
oking,
occupation
Contin
ued
DOI: 10.1161/JAHA.115.002787 Journal of the American Heart Association 3
Dairy Consumption and Risk of Stroke de Goede et alORIG
INALRESEARCH
by guest on July 11, 2018http://jaha.ahajournals.org/
Dow
nloaded from
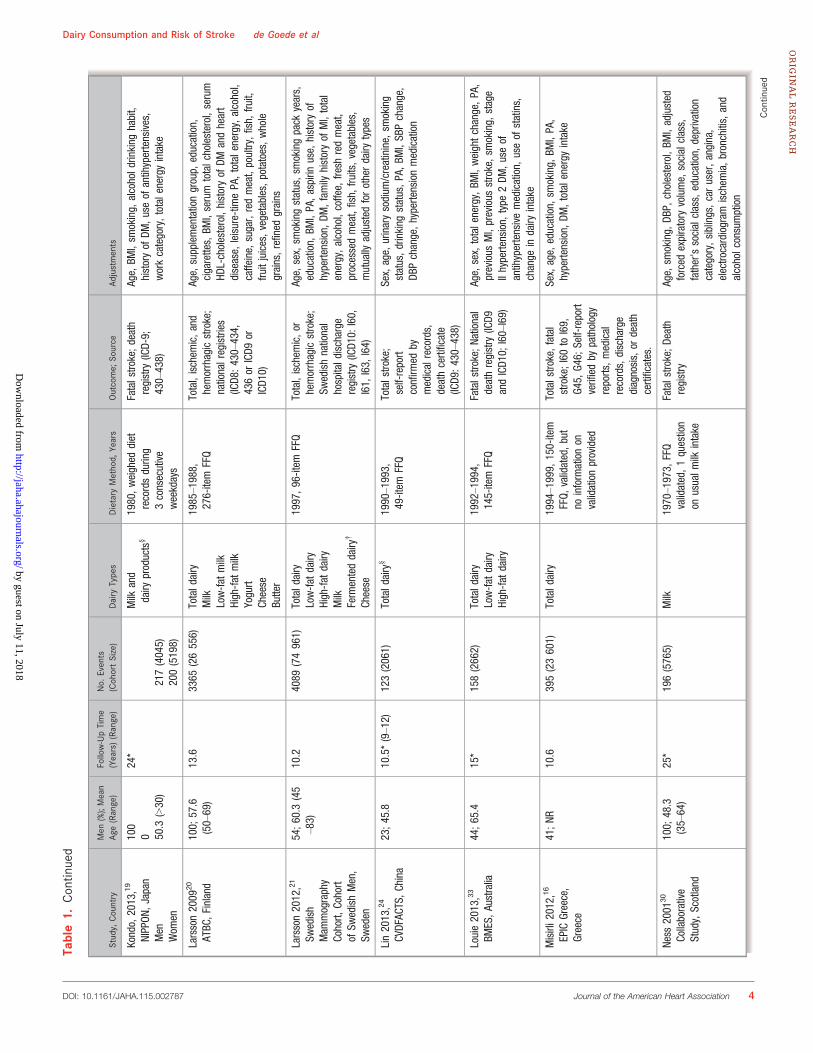
Table1.
Contin
ued
Study,
Country
Men
(%);Mean
Age(Range)
Follow-UpTime
(Years)(Range)
No.
Events
(CohortSize)
Dairy
Types
Dietary
Method,
Years
Outcome;
Source
Adjustments
Kondo,
2013,19
NIPPON
,Japan
Men
Wom
en
100
0 50.3
(>30)
24*
217(4045)
200(5198)
Milk
and
dairy
products§
1980,weighed
diet
recordsduring
3consecutive
weekdays
Fatalstroke;death
registry
(ICD-9;
430–438)
Age,
BMI,sm
oking,
alcoholdrinking
habit,
historyof
DM,useof
antihypertensives,
workcategory,totalenergyintake
Larsson2009
20
ATBC
,Finland
100;
57.6
(50–69)
13.6
3365
(26556)
Totaldairy
Milk
Low-fat
milk
High-fat
milk
Yogurt
Cheese
Butter
1985–1988,
276-item
FFQ
Total,ischem
ic,and
hemorrhagicstroke;
nationalregistries
(ICD8
:430–434,
436or
ICD9
orICD1
0)
Age,
supplementationgroup,
education,
cigarettes,BM
I,serum
totalcholesterol,serum
HDL-cholesterol,historyof
DMandheart
disease,
leisure-tim
ePA,totalenergy,alcohol,
caffeine,
sugar,redmeat,poultry,fish,
fruit,
fruitjuices,vegetables,potatoes,whole
grains,refined
grains
Larsson2012,21
Swedish
Mam
mography
Cohort,
Cohort
ofSw
edishMen,
Sweden
54;60.3
(45
–83)
10.2
4089
(74961)
Totaldairy
Low-fat
dairy
High-fat
dairy
Milk
Ferm
enteddairy
†
Cheese
1997,96-item
FFQ
Total,ischem
ic,or
hemorrhagicstroke;
Swedishnational
hospitaldischarge
registry
(ICD1
0:I60,
I61,
I63,
I64)
Age,
sex,sm
okingstatus,sm
okingpack
years,
education,
BMI,PA,aspirin
use,
historyof
hypertension,
DM,family
historyof
MI,total
energy,alcohol,coffee,
fresh
redmeat,
processedmeat,fish,
fruits,vegetables,
mutually
adjusted
forotherdairy
types
Lin2013,24
CVDFAC
TS,China
23;45.8
10.5*(9–12)
123(2061)
Totaldairy§
1990–1993,
49-item
FFQ
Totalstroke;
self-report
confirm
edby
medicalrecords,
deathcertificate
(ICD9
:430–438)
Sex,age,
urinarysodium
/creatinine,
smoking
status,drinking
status,PA,BM
I,SB
Pchange,
DBPchange,hypertensionmedication
Louie2013,33
BMES,Australia
44;65.4
15*
158(2662)
Totaldairy
Low-fat
dairy
High-fat
dairy
1992–1994,
145-item
FFQ
Fatalstroke;National
deathregistry
(ICD9
andICD1
0;I60–I69)
Age,
sex,totalenergy,BM
I,weightchange,PA,
previous
MI,previous
stroke,sm
oking,
stage
IIhypertension,
type
2DM
,useof
antihypertensivemedication,
useof
statins,
change
indairy
intake
Misirli2
012,16
EPIC
Greece,
Greece
41;NR
10.6
395(23601)
Totaldairy
1994–1999,
150-item
FFQ,
validated,but
noinform
ationon
validationprovided
Totalstroke,fatal
stroke;I60to
I69,
G45,
G46;
Self-report
verifiedby
pathology
reports,medical
records,discharge
diagnosis,or
death
certificates.
Sex,age,
education,
smoking,
BMI,PA,
hypertension,
DM,totalenergyintake
Ness
2001
30
Collaborative
Study,Scotland
100;
48.3
(35–64)
25*
196(5765)
Milk
1970–1973,
FFQ
validated,1question
onusualm
ilkintake
Fatalstroke;Death
registry
Age,
smoking,
DBP,
cholesterol,BM
I,adjusted
forced
expiratory
volume,
socialclass,
father’ssocialclass,education,
deprivation
category,siblings,caruser,angina,
electrocardiogram
ischem
ia,bronchitis,and
alcoholconsumption
Contin
ued
DOI: 10.1161/JAHA.115.002787 Journal of the American Heart Association 4
Dairy Consumption and Risk of Stroke de Goede et alORIG
INALRESEARCH
by guest on July 11, 2018http://jaha.ahajournals.org/
Dow
nloaded from
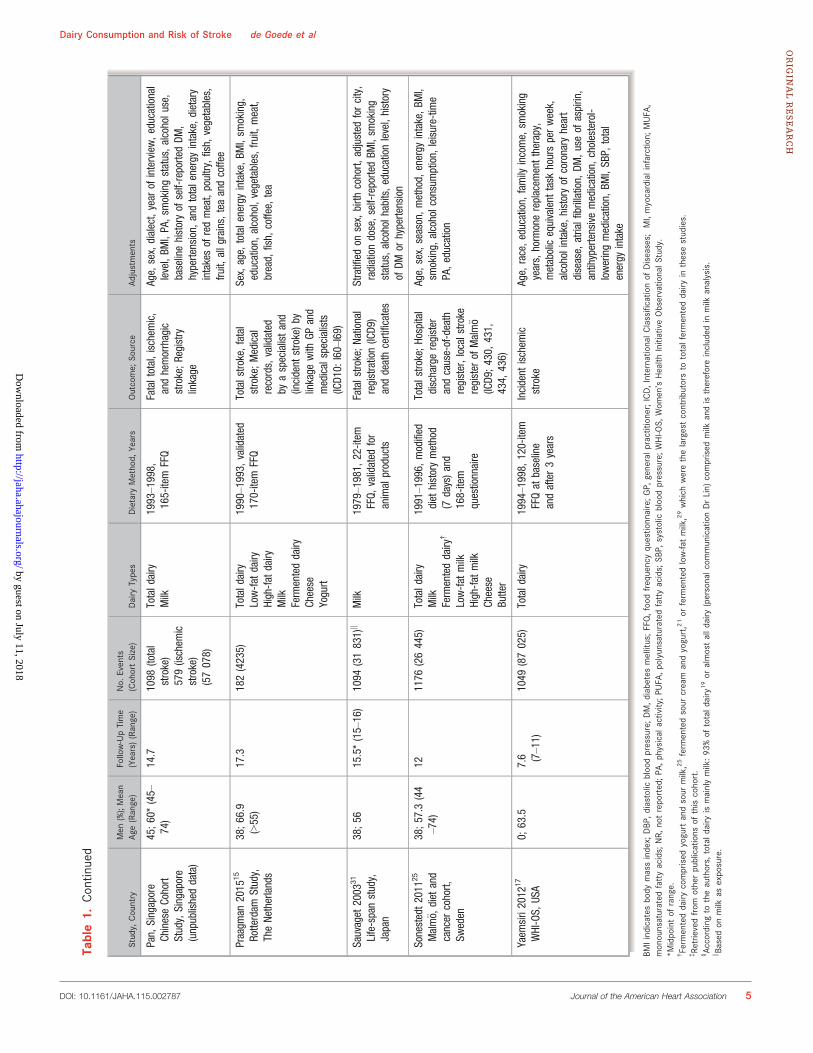
Table1.
Contin
ued
Study,
Country
Men
(%);Mean
Age(Range)
Follow-UpTime
(Years)(Range)
No.
Events
(CohortSize)
Dairy
Types
Dietary
Method,
Years
Outcome;
Source
Adjustments
Pan,
Singapore
ChineseCohort
Study,Singapore
(unpublisheddata)
45;60*(45–
74)
14.7
1098
(total
stroke)
579(ischem
icstroke)
(57078)
Totaldairy
Milk
1993–1998,
165-item
FFQ
Fataltotal,ischem
ic,
andhemorrhagic
stroke;Registry
linkage
Age,
sex,dialect,year
ofinterview,educational
level,BM
I,PA,sm
okingstatus,alcoholuse,
baselinehistoryof
self-reportedDM
,hypertension,
andtotalenergyintake,dietary
intakesof
redmeat,poultry,fish,
vegetables,
fruit,
allgrains,teaandcoffee
Praagm
an2015
15
Rotterdam
Study,
TheNetherlands
38;66.9
(>55)
17.3
182(4235)
Totaldairy
Low-fat
dairy
High-fat
dairy
Milk
Ferm
enteddairy
Cheese
Yogurt
1990–1993,
validated
170-item
FFQ
Totalstroke,fatal
stroke;Medical
records,validated
byaspecialistand
(incident
stroke)by
linkage
with
GPand
medicalspecialists
(ICD1
0:I60–I69)
Sex,age,
totalenergyintake,BM
I,sm
oking,
education,
alcohol,vegetables,fruit,
meat,
bread,
fish,
coffee,
tea
Sauvaget
2003
31
Life-spanstudy,
Japan
38;56
15.5*(15–16)
1094
(31831)k
Milk
1979–1981,
22-item
FFQ,
validated
for
animalproducts
Fatalstroke;National
registration(ICD9
)anddeathcertificates
Stratifiedon
sex,birth
cohort,
adjusted
forcity,
radiationdose,self-reportedBM
I,sm
oking
status,alcoholhabits,educationlevel,history
ofDM
orhypertension
Sonestedt2011
25
Malm€ o,
diet
and
cancer
cohort,
Sweden
38;57.3
(44
–74)
121176
(26445)
Totaldairy
Milk
Ferm
enteddairy
†
Low-fat
milk
High-fat
milk
Cheese
Butter
1991–1996,
modified
diet
historymethod
(7days)and
168-item
questionnaire
Totalstroke;Hospital
dischargeregister
andcause-of-death
register,localstroke
register
ofMalm€ o
(ICD9
;430,
431,
434,
436)
Age,
sex,season,method,
energy
intake,BM
I,sm
oking,
alcoholconsumption,
leisure-tim
ePA,education
Yaem
siri2012
17
WHI-OS,
USA
0;63.5
7.6 (7–11)
1049
(87025)
Totaldairy
1994–1998,
120-item
FFQat
baseline
andafter3years
Incident
ischem
icstroke
Age,
race,education,
family
income,
smoking
years,horm
onereplacem
enttherapy,
metabolicequivalent
task
hoursperweek,
alcoholintake,
historyof
coronary
heart
disease,
atrialfibrillation,
DM,useof
aspirin,
antihypertensivemedication,
cholesterol-
loweringmedication,
BMI,SB
P,total
energy
intake
BMIindicatesbody
massindex;
DBP
,diastolic
bloodpressure;DM,d
iabetesmellitus;FFQ,foodfrequencyquestio
nnaire;GP,
generalp
ractitioner;ICD,InternationalC
lassificatio
nof
Diseases;
MI,myocardialinfarction;
MUFA
,monounsaturated
fattyacids;
NR,
notreported;PA
,physicalactivity;P
UFA
,polyunsaturatedfattyacids;
SBP,
systolic
bloodpressure;WHI-O
S,Wom
en’sHealth
InitiativeObservatio
nalS
tudy.
*Midpointof
range.
†Ferm
enteddairy
comprised
yogurtandsour
milk,25ferm
entedsour
cream
andyogurt,21or
ferm
entedlow-fa
tmilk,29which
werethelargestcontrib
utorsto
totalfermenteddairy
inthesestudies.
‡Re
trievedfrom
otherpublications
ofthiscohort.
§Ac
cordingto
theauthors,
totald
airy
ismainlymilk:93
%of
totald
airy
19or
almostalld
airy
(personalc
ommunicationDrLin)
comprised
milk
andisthereforeincluded
inmilk
analysis.
k Based
onmilk
asexposure.
DOI: 10.1161/JAHA.115.002787 Journal of the American Heart Association 5
Dairy Consumption and Risk of Stroke de Goede et alORIG
INALRESEARCH
by guest on July 11, 2018http://jaha.ahajournals.org/
Dow
nloaded from
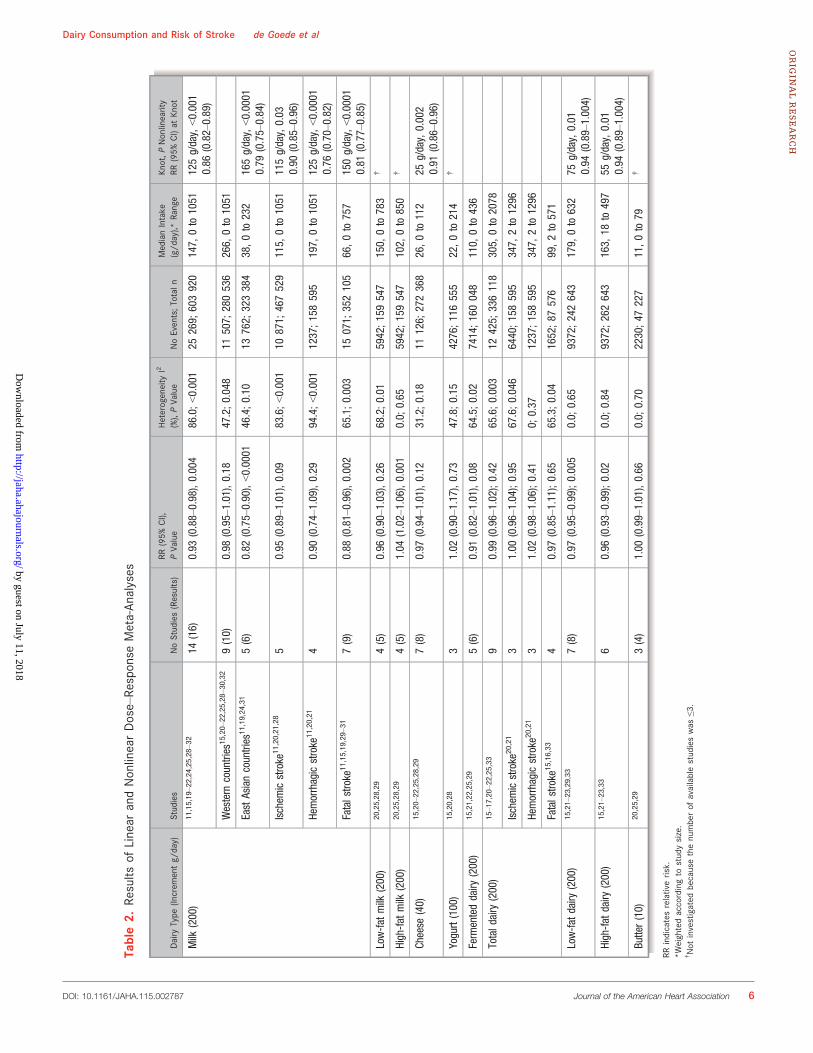
Table2.
Results
ofLinear
andNonlinearDose–Re
sponse
Meta-An
alyses
Dairy
Type
(Increm
entg/
day)
Studies
NoStudies(Results)
RR(95%
CI),
PVa
lue
Heterogeneity
I2
(%),PVa
lue
NoEvents;Totaln
MedianIntake
(g/d
ay),*
Range
Knot,P
Nonlinearity
RR(95%
CI)at
Knot
Milk
(200)
11,15,19–22,24,25,28–32
14(16)
0.93
(0.88–0.98),0.004
86.0;<0.001
25269;
603920
147,
0to
1051
125g/day,<0.001
0.86
(0.82–0.89)
Western
countries
15,20–22,25,28–30,32
9(10)
0.98
(0.95–1.01),0.18
47.2;0.048
11507;
280536
266,
0to
1051
EastAsiancountries
11,19,24,31
5(6)
0.82
(0.75–0.90),<0.0001
46.4;0.10
13762;
323384
38,0to
232
165g/day,<0.0001
0.79
(0.75–0.84)
Ischem
icstroke
11,20,21,28
50.95
(0.89–1.01),0.09
83.6;<0.001
10871;
467529
115,
0to
1051
115g/day,0.03
0.90
(0.85–0.96)
Hemorrhagicstroke
11,20,21
40.90
(0.74–1.09),0.29
94.4;<0.001
1237;158595
197,
0to
1051
125g/day,<0.0001
0.76
(0.70–0.82)
Fatalstroke
11,15,19,29–31
7(9)
0.88
(0.81–0.96),0.002
65.1;0.003
15071;
352105
66,0to
757
150g/day,<0.0001
0.81
(0.77–0.85)
Low-fat
milk
(200)
20,25,28,29
4(5)
0.96
(0.90–1.03),0.26
68.2;0.01
5942;159547
150,
0to
783
†
High-fat
milk
(200)
20,25,28,29
4(5)
1.04
(1.02–1.06),0.001
0.0;
0.65
5942;159547
102,
0to
850
†
Cheese
(40)
15,20–22,25,28,29
7(8)
0.97
(0.94–1.01),0.12
31.2;0.18
11126;
272368
26,0to
112
25g/day,0.002
0.91
(0.86–0.96)
Yogurt(100)
15,20,28
31.02
(0.90–1.17),0.73
47.8;0.15
4276;116555
22,0to
214
†
Ferm
enteddairy
(200)
15,21,22,25,29
5(6)
0.91
(0.82–1.01),0.08
64.5;0.02
7414;160048
110,
0to
436
Totaldairy
(200)
15–17,20–22,25,33
90.99
(0.96–1.02);0.42
65.6;0.003
12425;
336118
305,
0to
2078
Ischem
icstroke
20,21
31.00
(0.96–1.04);0.95
67.6;0.046
6440;158595
347,
2to
1296
Hemorrhagicstroke
20,21
31.02
(0.98–1.06);0.41
0;0.37
1237;158595
347,
2to
1296
Fatalstroke
15,16,33
40.97
(0.85–1.11);0.65
65.3;0.04
1652;87
576
99,2to
571
Low-fat
dairy
(200)
15,21–23,29,33
7(8)
0.97
(0.95–0.99);0.005
0.0;
0.65
9372;242643
179,
0to
632
75g/day,0.01
0.94
(0.89–1.004)
High-fat
dairy
(200)
15,21–23,33
60.96
(0.93–0.99);0.02
0.0;
0.84
9372;262643
163,
18to
497
55g/day,0.01
0.94
(0.89–1.004)
Butter(10)
20,25,29
3(4)
1.00
(0.99–1.01),0.66
0.0;
0.70
2230;47
227
11,0to
79†
RRindicatesrelativerisk.
*Weightedaccordingto
studysize.
†Not
investigated
becausethenumberof
availablestudieswas
≤3.
DOI: 10.1161/JAHA.115.002787 Journal of the American Heart Association 6
Dairy Consumption and Risk of Stroke de Goede et alORIG
INALRESEARCH
by guest on July 11, 2018http://jaha.ahajournals.org/
Dow
nloaded from
Methods
Literature Search and SelectionThis review was conducted in accordance with the Meta-analysis Of Observational Studies in Epidemiology (MOOSE)guidelines.18 Published articles, without language restric-tions, up to October 2015 were retrieved from PubMed,EMBASE, and SCOPUS (search strategy and MOOSE check-list are shown in Data S1), complemented by hand searchesof reference lists and correspondence with researchers inthe field. Based on titles and abstract, we excluded studieson animals, children aged <18 years, and patient popula-tions. Eligible studies were selected using predefined criteria(ie, prospective design and reported data on dairy consump-tion in relation to incident fatal or total stroke). For 21eligible articles, the full text was retrieved. Several authorsprovided additional information upon request.14,15,19–25 Oneof the authors (A.P.) additionally provided unpublished data
from the Singapore Chinese Health Study, a population-based cohort of 63 257 Chinese adults (A.P., unpublishedresults, 2015).
Two articles were excluded because the available data didnot allow dose–response calculations.15,18 In case of dupli-cate results,26,27 we included the most updated23 orcomprehensive27 results. For the Nurses’ Health Study weused 2 articles: 1 on low-fat and high-fat dairy23 and 1 onother types of dairy.28 One article provided results for 2studies (Nurses’ Health Study and the Health ProfessionalsFollow up Study)23 and 2 presented results for men andwomen separately,19,29 resulting in 18 studies (see flow chartin Figure 1).11,14–17,19–25,28–33
Data ExtractionThe selection and data extraction process was conducted bythe first author (J.G.) and checked by a coauthor (S.S.S.-M.)
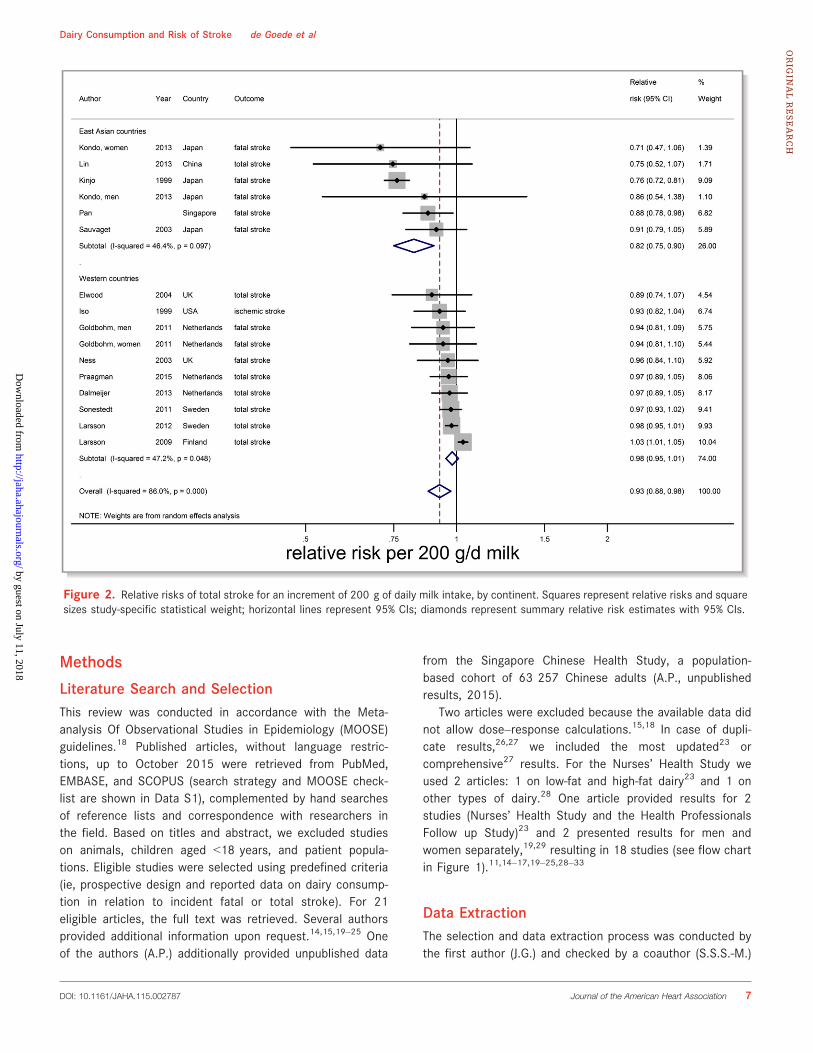
Figure 2. Relative risks of total stroke for an increment of 200 g of daily milk intake, by continent. Squares represent relative risks and squaresizes study-specific statistical weight; horizontal lines represent 95% CIs; diamonds represent summary relative risk estimates with 95% CIs.
DOI: 10.1161/JAHA.115.002787 Journal of the American Heart Association 7
Dairy Consumption and Risk of Stroke de Goede et alORIG
INALRESEARCH
by guest on July 11, 2018http://jaha.ahajournals.org/
Dow
nloaded from
using a structured extraction form. We extracted descriptivestudy data as well as ranges of intake, medians or midpoints,numbers of subjects and stroke events, person-years at risk,and RRs with the corresponding 95% CIs for each category ofdairy intake (ie, total dairy, low-fat dairy, high-fat dairy,fermented dairy, milk, low-fat milk, high-fat milk, cheese,yogurt, and butter).
If dairy intake was only reported in portions,11,23,28,31,33 weused portion sizes of 177 g for total, low-fat, and high-fatdairy; 244 g for total, low-fat, and high-fat milk; 244 g foryogurt; and 43 g for cheese to estimate grams per day34,35 orwe used previously reported serving sizes of the samecohort.23,28 For open-ended upper limits of intake, we appliedthe same width as the adjacent category, whereas for open-ended lowest categories a zero was assigned.
Categorization of dairy types was primarily based on thecategorization in the original studies (see Data S1). For themeta-analysis on fermented dairy we included studies thatcombined at least 2 of the products cheese, yogurt, and sourmilk. If results on total stroke (primary outcome) were notavailable, we used ischemic stroke.17,28 Two reviewers (J.G.and S.S.S.-M.) independently evaluated the quality of thestudies by using the Newcastle-Ottawa quality assessmentscale (Data S1).36 The rating system scores studies from 0(highest degree of bias) to 9 (lowest degree of bias).
Statistical AnalysisWe performed meta-analyses for dairy types reported upon by3 or more studies. If studies presented several statistical
models, we included the model that included mostconfounders. Median intakes for each dairy type wereestimated as the average of medians, midpoints, or meansper study, weighted by study size. For 4 or more studies,linearity of associations was investigated using splineanalysis and dose–response meta-regression (GeneralizedLeast-Square Trend). Three studies could not be used fornonlinear analyses, because they only provided linearresults.16,17,29
Splined variables were created using MKSPLINE in STATAin order to select the most appropriate knot points ofnonlinear associations based on goodness-of-fit tests and v2
statistics. Linear and nonlinear associations were furtheranalyzed using dose–response (Generalized Least-SquareTrend) meta-regression analysis. Random-effects meta-regression trend estimation of summarized dose–responsedata37 was used to derive the incremental dose–responseRRs.
.4.5
.6.7
.8.9
11.
11.
2R
elat
ive
Ris
k
0 100 200 300 400 500 600 700 800 900 1000 1100Milk intake − g/d
Milk intake and Risk of Stroke
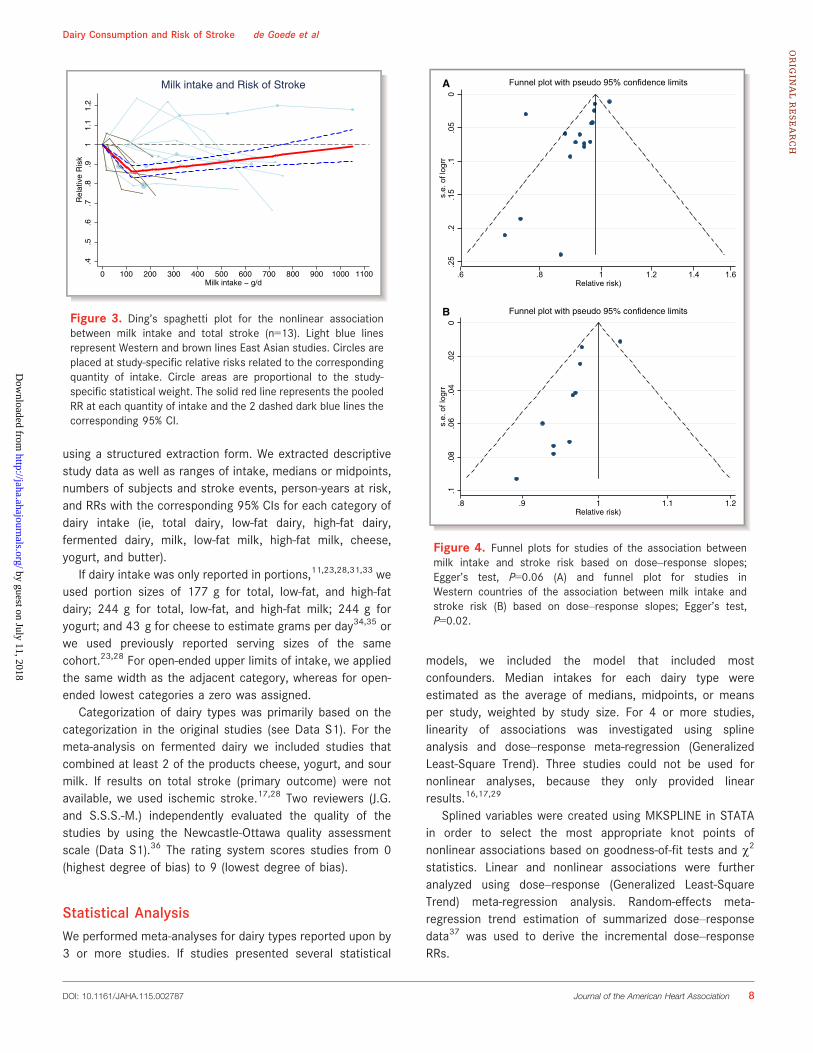
Figure 3. Ding’s spaghetti plot for the nonlinear associationbetween milk intake and total stroke (n=13). Light blue linesrepresent Western and brown lines East Asian studies. Circles areplaced at study-specific relative risks related to the correspondingquantity of intake. Circle areas are proportional to the study-specific statistical weight. The solid red line represents the pooledRR at each quantity of intake and the 2 dashed dark blue lines thecorresponding 95% CI.
0.0
5.1
.15
.2.2
5s.
e. o
f log
rr
.6 .8 1 1.2 1.4 1.6Relative risk)
Funnel plot with pseudo 95% confidence limits
0.0
2.0
4.0
6.0
8.1
s.e.
of l
ogrr
.8 .9 1 1.1 1.2Relative risk)
Funnel plot with pseudo 95% confidence limits
A
B
Figure 4. Funnel plots for studies of the association betweenmilk intake and stroke risk based on dose–response slopes;Egger’s test, P=0.06 (A) and funnel plot for studies inWestern countries of the association between milk intake andstroke risk (B) based on dose–response slopes; Egger’s test,P=0.02.
DOI: 10.1161/JAHA.115.002787 Journal of the American Heart Association 8
Dairy Consumption and Risk of Stroke de Goede et alORIG
INALRESEARCH
by guest on July 11, 2018http://jaha.ahajournals.org/
Dow
nloaded from
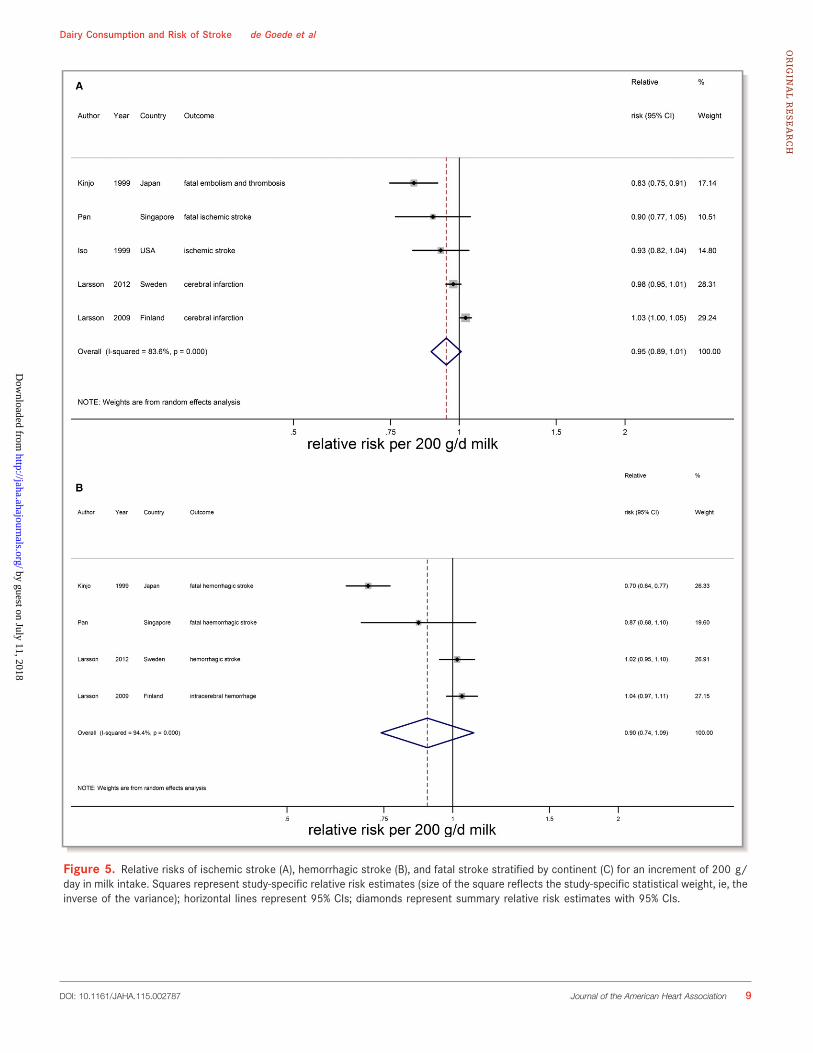
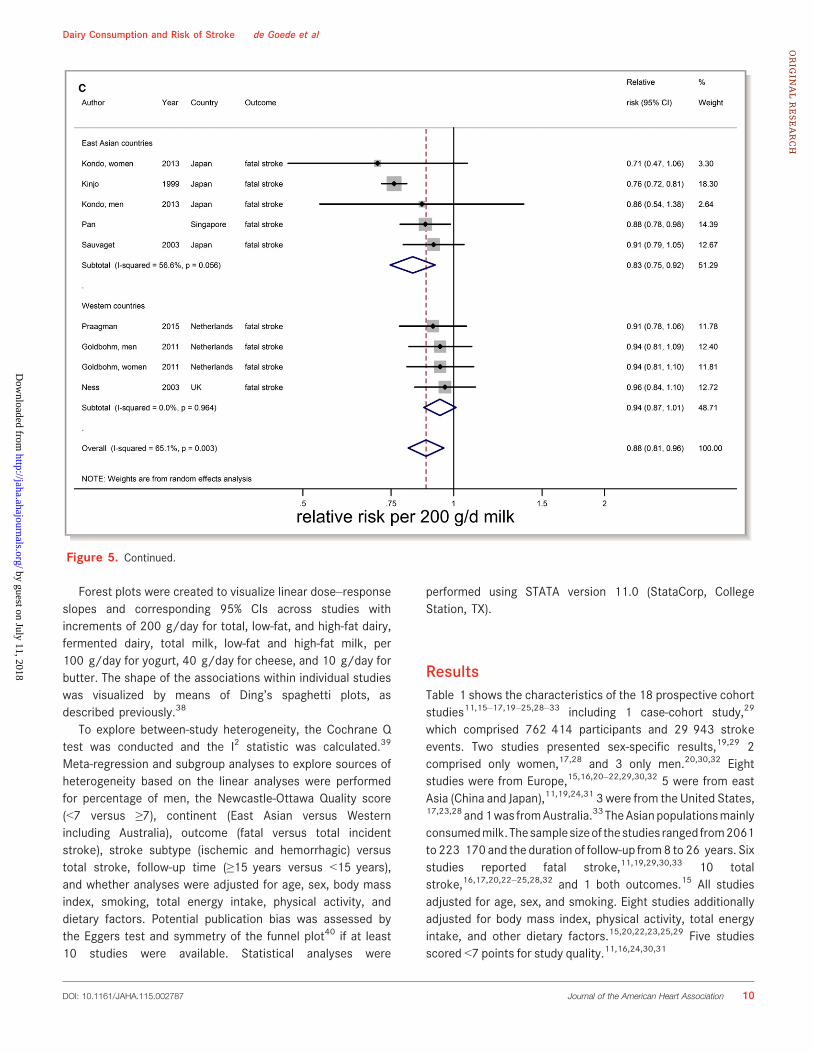
Figure 5. Relative risks of ischemic stroke (A), hemorrhagic stroke (B), and fatal stroke stratified by continent (C) for an increment of 200 g/day in milk intake. Squares represent study-specific relative risk estimates (size of the square reflects the study-specific statistical weight, ie, theinverse of the variance); horizontal lines represent 95% CIs; diamonds represent summary relative risk estimates with 95% CIs.
DOI: 10.1161/JAHA.115.002787 Journal of the American Heart Association 9
Dairy Consumption and Risk of Stroke de Goede et alORIG
INALRESEARCH
by guest on July 11, 2018http://jaha.ahajournals.org/
Dow
nloaded from
Forest plots were created to visualize linear dose–responseslopes and corresponding 95% CIs across studies withincrements of 200 g/day for total, low-fat, and high-fat dairy,fermented dairy, total milk, low-fat and high-fat milk, per100 g/day for yogurt, 40 g/day for cheese, and 10 g/day forbutter. The shape of the associations within individual studieswas visualized by means of Ding’s spaghetti plots, asdescribed previously.38
To explore between-study heterogeneity, the Cochrane Qtest was conducted and the I2 statistic was calculated.39
Meta-regression and subgroup analyses to explore sources ofheterogeneity based on the linear analyses were performedfor percentage of men, the Newcastle-Ottawa Quality score(<7 versus ≥7), continent (East Asian versus Westernincluding Australia), outcome (fatal versus total incidentstroke), stroke subtype (ischemic and hemorrhagic) versustotal stroke, follow-up time (≥15 years versus <15 years),and whether analyses were adjusted for age, sex, body massindex, smoking, total energy intake, physical activity, anddietary factors. Potential publication bias was assessed bythe Eggers test and symmetry of the funnel plot40 if at least10 studies were available. Statistical analyses were
performed using STATA version 11.0 (StataCorp, CollegeStation, TX).
ResultsTable 1 shows the characteristics of the 18 prospective cohortstudies11,15–17,19–25,28–33 including 1 case-cohort study,29
which comprised 762 414 participants and 29 943 strokeevents. Two studies presented sex-specific results,19,29 2comprised only women,17,28 and 3 only men.20,30,32 Eightstudies were from Europe,15,16,20–22,29,30,32 5 were from eastAsia (China and Japan),11,19,24,31 3 were from the United States,17,23,28 and1was fromAustralia.33 TheAsianpopulationsmainlyconsumedmilk.Thesamplesizeof thestudies ranged from2061to 223 170 and the duration of follow-up from8 to 26 years. Sixstudies reported fatal stroke,11,19,29,30,33 10 totalstroke,16,17,20,22–25,28,32 and 1 both outcomes.15 All studiesadjusted for age, sex, and smoking. Eight studies additionallyadjusted for body mass index, physical activity, total energyintake, and other dietary factors.15,20,22,23,25,29 Five studiesscored <7 points for study quality.11,16,24,30,31
Figure 5. Continued.
DOI: 10.1161/JAHA.115.002787 Journal of the American Heart Association 10
Dairy Consumption and Risk of Stroke de Goede et alORIG
INALRESEARCH
by guest on July 11, 2018http://jaha.ahajournals.org/
Dow
nloaded from
MilkAn increment of 200 g of daily milk intake was associatedwith a 7% lower risk of stroke (RR 0.93; 95% CI 0.88–0.98;n=14)* including 603 920 participants and 25 269 strokeevents (Table 2 and Figure 2). The median milk intake was147 g/day (range 0–1051 g/day). Considerable heterogene-ity was present (I2=86%, P<0.001), which could be partlyattributed to continent. The RR per 200 g/day milk was 0.82(95% CI 0.75–0.90, n=5) in Asian populations (median intake38 g/day) and 0.98 (95% CI 0.95–1.01; n=9) in Westernpopulations (median intake 266 g/day). Based on
multivariable meta-regression, degree of adjustment, studyquality, and outcome event also explained some heterogene-ity, but not significantly in addition to the continent variable.The association of milk with total stroke was nonlinear, withthe strongest inverse association around 125 g/day (RR 0.86;95% CI 0.82–0.89; n=13; Figure 3). For milk intake in therange of 125 to 750 g/day the inverse association remainedsignificant, but was attenuated.
There were indications of publication bias (small studyeffect) based on asymmetry of the funnel plot, especially inWestern countries (Eggers test, P=0.06 for all studies and0.02 for Western studies; Figure 4). However, removal of 2small studies19,24 did not change the results. For ischemicstroke, hemorrhagic stroke, and fatal stroke RRs were 0.95(95% CI 0.89–1.01; n=5), 0.90 (0.74–1.09; n=4), and 0.88
.4.5
.6.7
.8.9
11.
11.
2R
elat
ive
Ris
k
0 100 200 300 400Milk intake − g/d
Milk intake and Risk of Stroke in East Asian countries.4
.5.6
.7.8
.91
1.1
1.2
Rel
ativ
e R
isk
0 100 200 300 400 500 600 700 800 900 1000 1100Milk intake − g/d
Milk intake and Risk of Ischemic Stroke
.4.5
.6.7
.8.9
11.
11.
21.
31.
41.
5R
elat
ive
Ris
k
0 100 200 300 400 500 600 700 800 900 1000 1100Milk intake − g/d
Milk intake and Risk of Haemorrhagic Stroke
.4.5
.6.7
.8.9
11.
11.
2R
elat
ive
Ris
k
0 100 200 300 400 500 600 700 800Milk intake − grams/day
Milk intake and Risk of Fatal Stroke
A
B
C
D
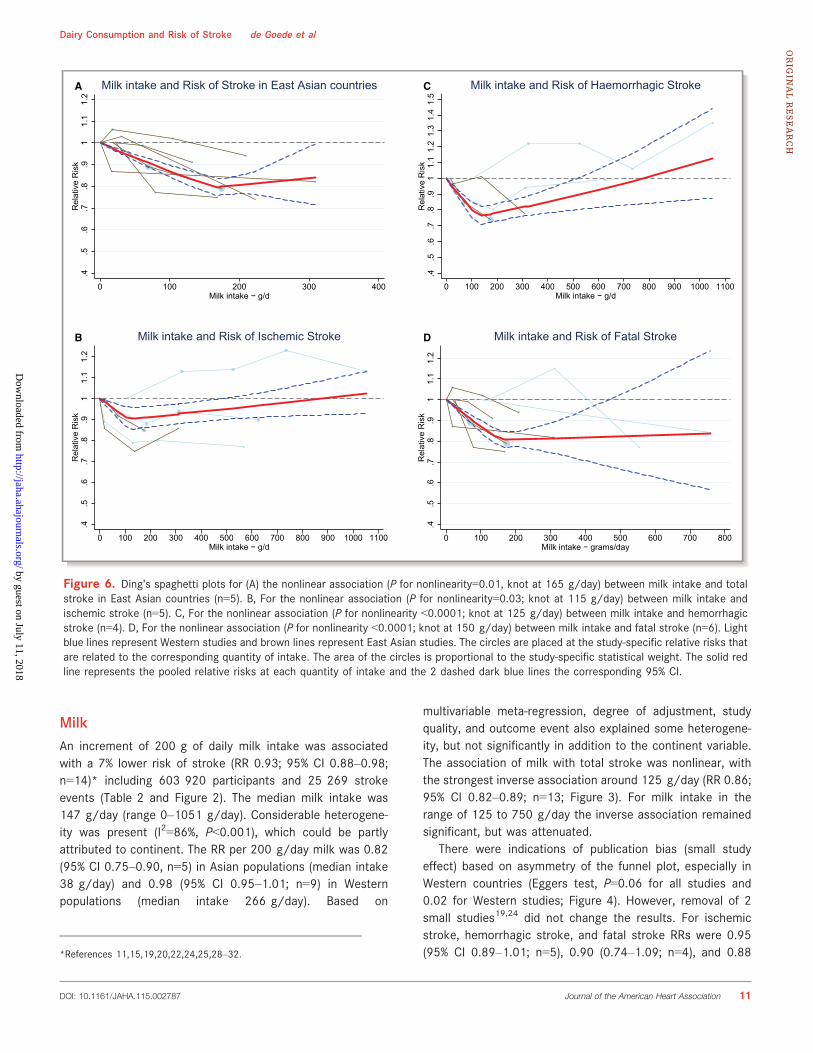
Figure 6. Ding’s spaghetti plots for (A) the nonlinear association (P for nonlinearity=0.01, knot at 165 g/day) between milk intake and totalstroke in East Asian countries (n=5). B, For the nonlinear association (P for nonlinearity=0.03; knot at 115 g/day) between milk intake andischemic stroke (n=5). C, For the nonlinear association (P for nonlinearity <0.0001; knot at 125 g/day) between milk intake and hemorrhagicstroke (n=4). D, For the nonlinear association (P for nonlinearity <0.0001; knot at 150 g/day) between milk intake and fatal stroke (n=6). Lightblue lines represent Western studies and brown lines represent East Asian studies. The circles are placed at the study-specific relative risks thatare related to the corresponding quantity of intake. The area of the circles is proportional to the study-specific statistical weight. The solid redline represents the pooled relative risks at each quantity of intake and the 2 dashed dark blue lines the corresponding 95% CI.
*References 11,15,19,20,22,24,25,28–32.
DOI: 10.1161/JAHA.115.002787 Journal of the American Heart Association 11
Dairy Consumption and Risk of Stroke de Goede et alORIG
INALRESEARCH
by guest on July 11, 2018http://jaha.ahajournals.org/
Dow
nloaded from
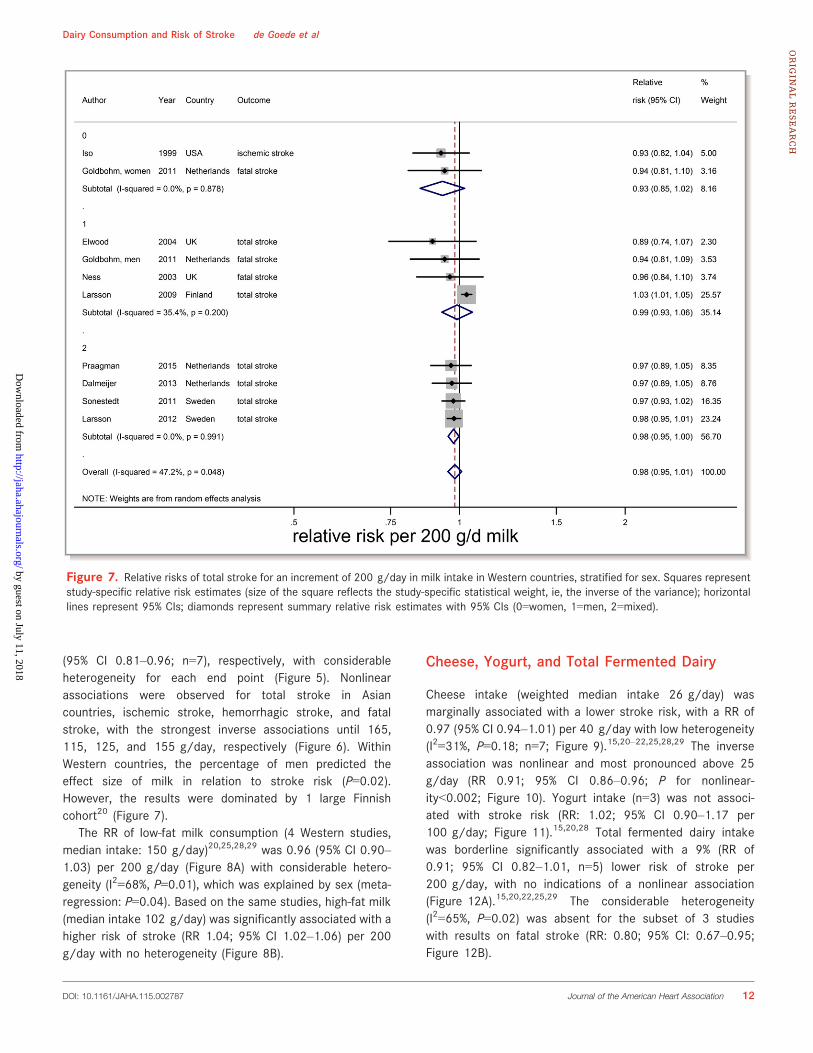
(95% CI 0.81–0.96; n=7), respectively, with considerableheterogeneity for each end point (Figure 5). Nonlinearassociations were observed for total stroke in Asiancountries, ischemic stroke, hemorrhagic stroke, and fatalstroke, with the strongest inverse associations until 165,115, 125, and 155 g/day, respectively (Figure 6). WithinWestern countries, the percentage of men predicted theeffect size of milk in relation to stroke risk (P=0.02).However, the results were dominated by 1 large Finnishcohort20 (Figure 7).
The RR of low-fat milk consumption (4 Western studies,median intake: 150 g/day)20,25,28,29 was 0.96 (95% CI 0.90–1.03) per 200 g/day (Figure 8A) with considerable hetero-geneity (I2=68%, P=0.01), which was explained by sex (meta-regression: P=0.04). Based on the same studies, high-fat milk(median intake 102 g/day) was significantly associated with ahigher risk of stroke (RR 1.04; 95% CI 1.02–1.06) per 200g/day with no heterogeneity (Figure 8B).
Cheese, Yogurt, and Total Fermented Dairy
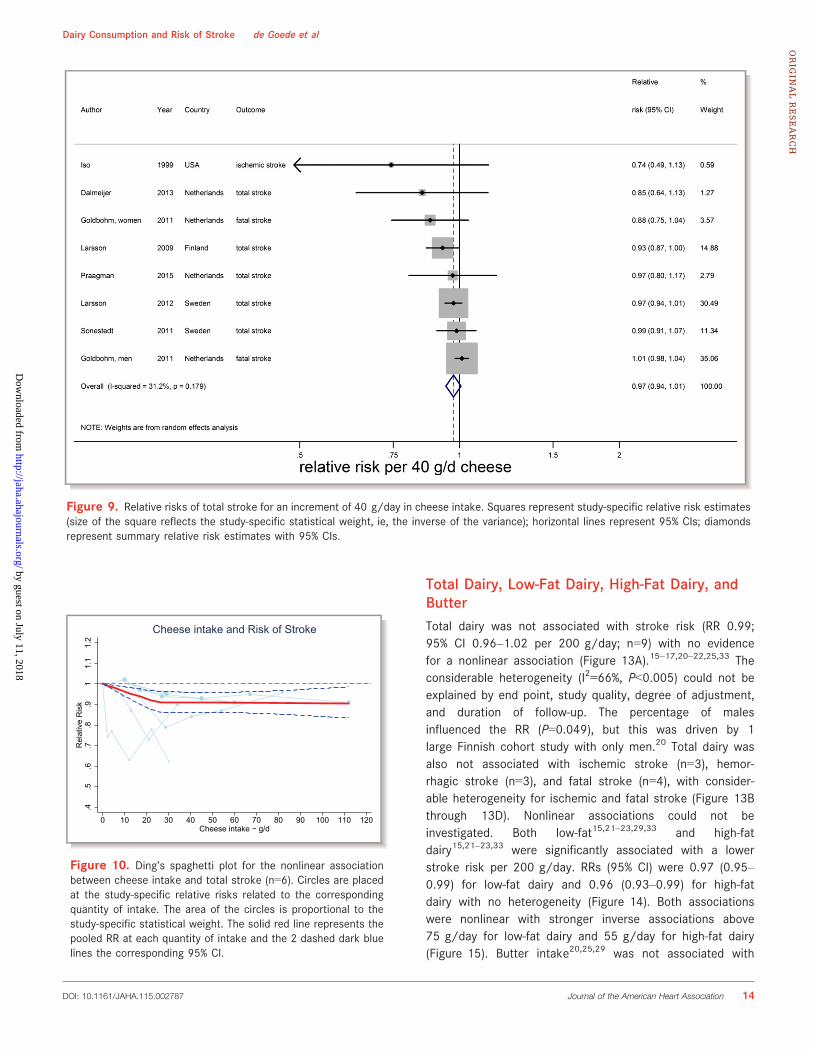
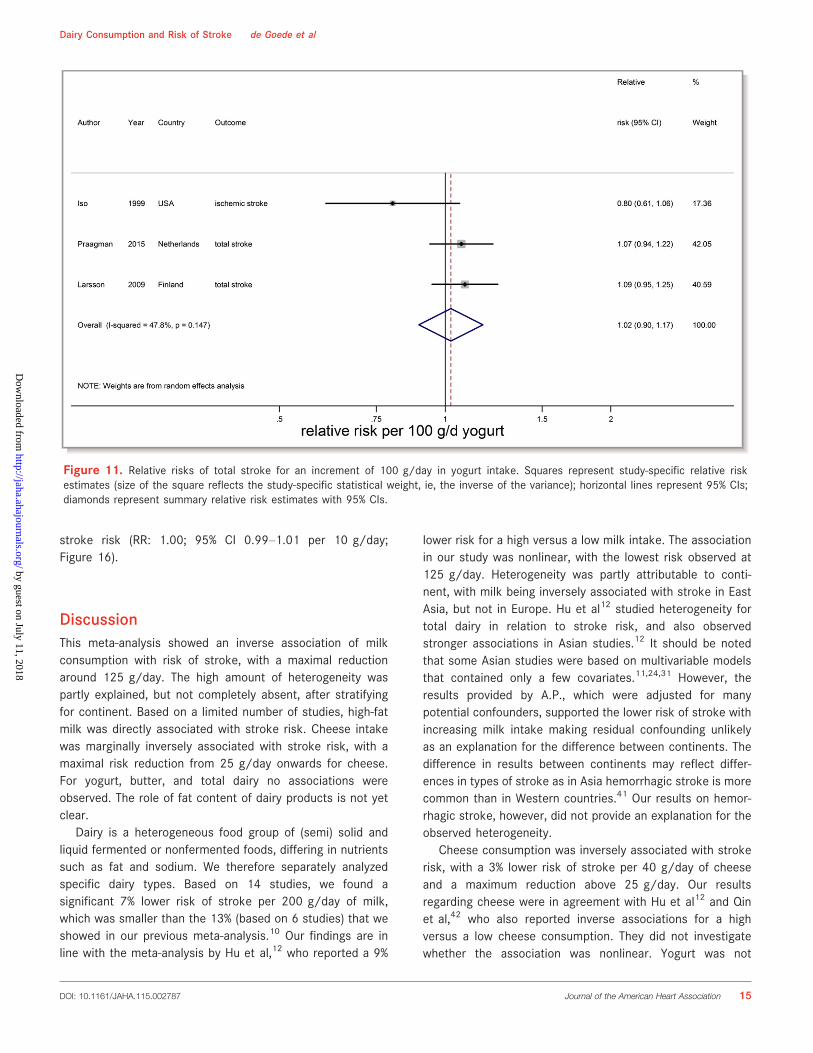
Cheese intake (weighted median intake 26 g/day) wasmarginally associated with a lower stroke risk, with a RR of0.97 (95% CI 0.94–1.01) per 40 g/day with low heterogeneity(I2=31%, P=0.18; n=7; Figure 9).15,20–22,25,28,29 The inverseassociation was nonlinear and most pronounced above 25g/day (RR 0.91; 95% CI 0.86–0.96; P for nonlinear-ity<0.002; Figure 10). Yogurt intake (n=3) was not associ-ated with stroke risk (RR: 1.02; 95% CI 0.90–1.17 per100 g/day; Figure 11).15,20,28 Total fermented dairy intakewas borderline significantly associated with a 9% (RR of0.91; 95% CI 0.82–1.01, n=5) lower risk of stroke per200 g/day, with no indications of a nonlinear association(Figure 12A).15,20,22,25,29 The considerable heterogeneity(I2=65%, P=0.02) was absent for the subset of 3 studieswith results on fatal stroke (RR: 0.80; 95% CI: 0.67–0.95;Figure 12B).
Figure 7. Relative risks of total stroke for an increment of 200 g/day in milk intake in Western countries, stratified for sex. Squares representstudy-specific relative risk estimates (size of the square reflects the study-specific statistical weight, ie, the inverse of the variance); horizontallines represent 95% CIs; diamonds represent summary relative risk estimates with 95% CIs (0=women, 1=men, 2=mixed).
DOI: 10.1161/JAHA.115.002787 Journal of the American Heart Association 12
Dairy Consumption and Risk of Stroke de Goede et alORIG
INALRESEARCH
by guest on July 11, 2018http://jaha.ahajournals.org/
Dow
nloaded from
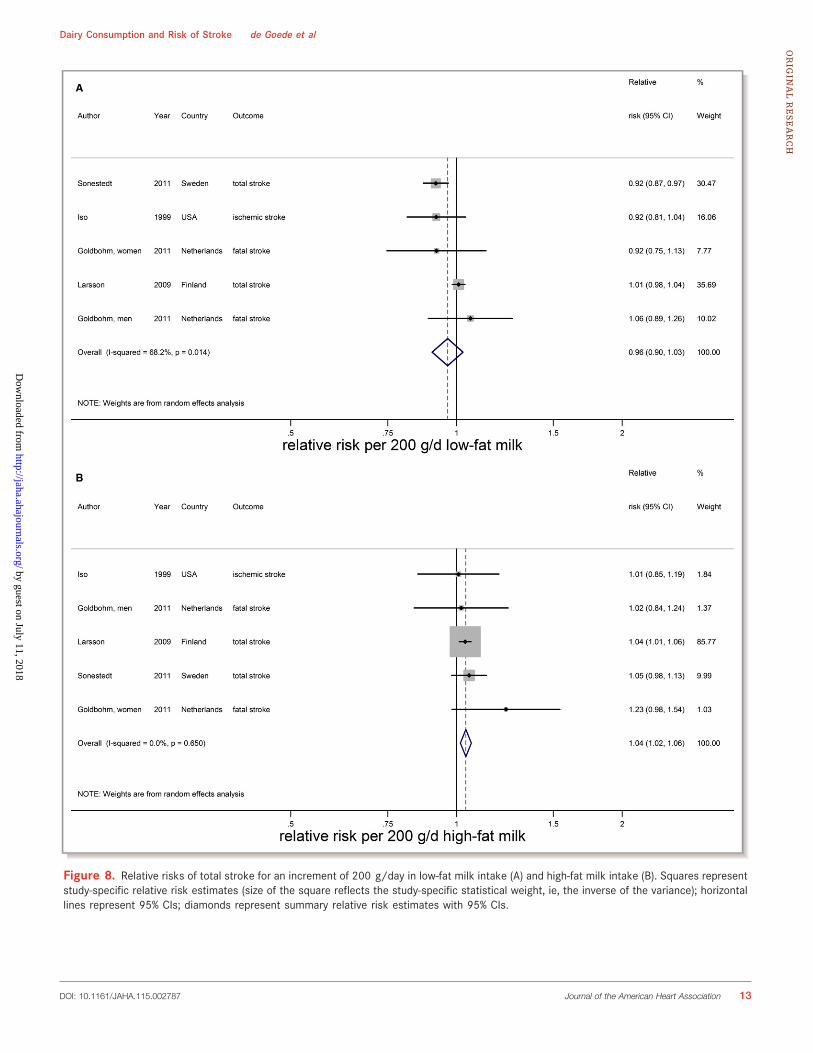
Figure 8. Relative risks of total stroke for an increment of 200 g/day in low-fat milk intake (A) and high-fat milk intake (B). Squares representstudy-specific relative risk estimates (size of the square reflects the study-specific statistical weight, ie, the inverse of the variance); horizontallines represent 95% CIs; diamonds represent summary relative risk estimates with 95% CIs.
DOI: 10.1161/JAHA.115.002787 Journal of the American Heart Association 13
Dairy Consumption and Risk of Stroke de Goede et alORIG
INALRESEARCH
by guest on July 11, 2018http://jaha.ahajournals.org/
Dow
nloaded from
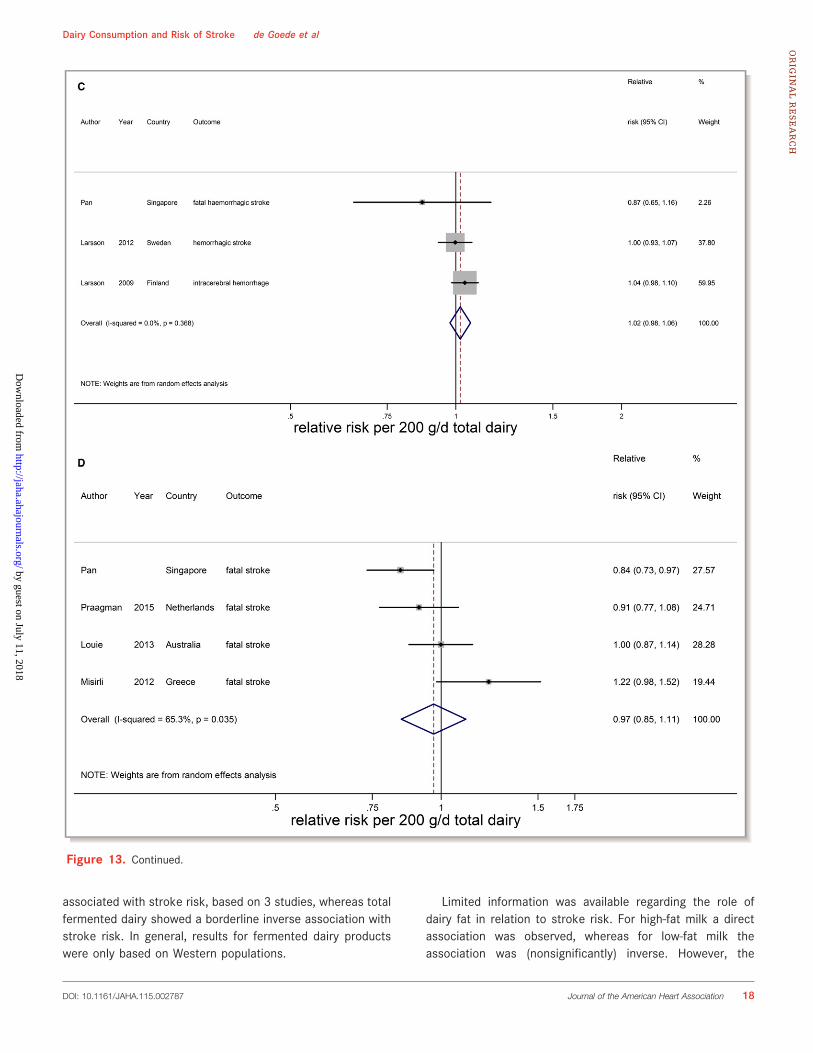
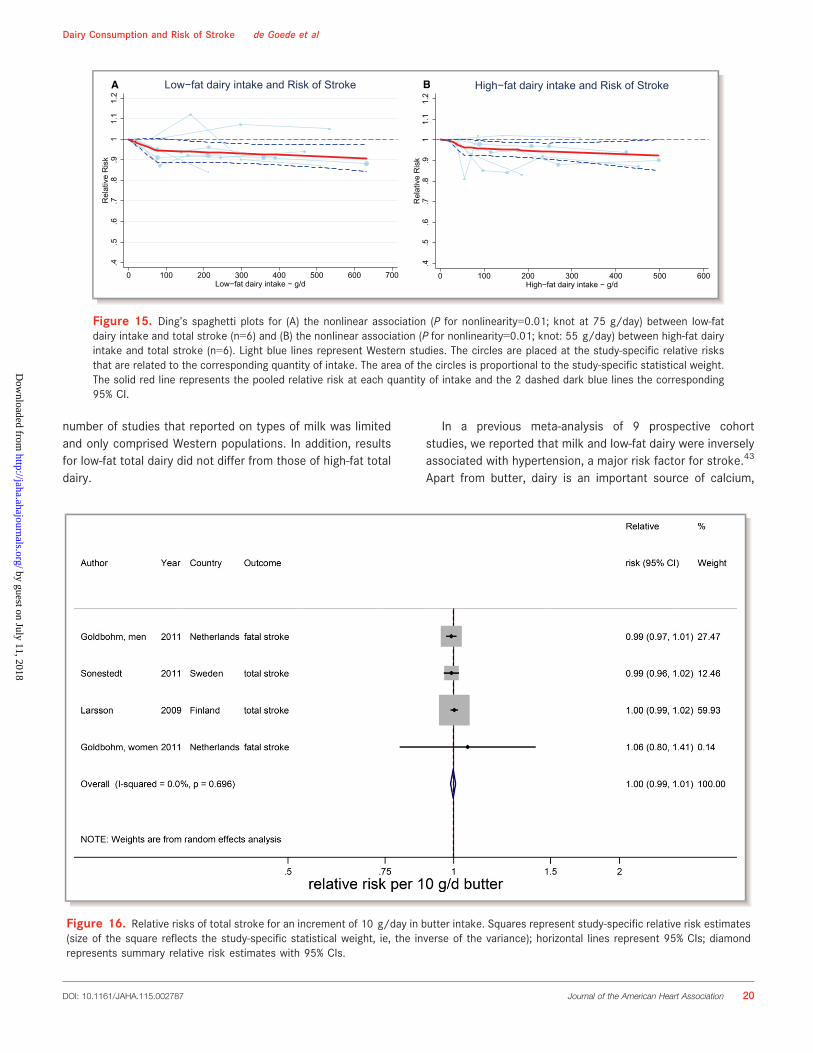
Total Dairy, Low-Fat Dairy, High-Fat Dairy, andButterTotal dairy was not associated with stroke risk (RR 0.99;95% CI 0.96–1.02 per 200 g/day; n=9) with no evidencefor a nonlinear association (Figure 13A).15–17,20–22,25,33 Theconsiderable heterogeneity (I2=66%, P<0.005) could not beexplained by end point, study quality, degree of adjustment,and duration of follow-up. The percentage of malesinfluenced the RR (P=0.049), but this was driven by 1large Finnish cohort study with only men.20 Total dairy wasalso not associated with ischemic stroke (n=3), hemor-rhagic stroke (n=3), and fatal stroke (n=4), with consider-able heterogeneity for ischemic and fatal stroke (Figure 13Bthrough 13D). Nonlinear associations could not beinvestigated. Both low-fat15,21–23,29,33 and high-fatdairy15,21–23,33 were significantly associated with a lowerstroke risk per 200 g/day. RRs (95% CI) were 0.97 (0.95–0.99) for low-fat dairy and 0.96 (0.93–0.99) for high-fatdairy with no heterogeneity (Figure 14). Both associationswere nonlinear with stronger inverse associations above75 g/day for low-fat dairy and 55 g/day for high-fat dairy(Figure 15). Butter intake20,25,29 was not associated with
Figure 9. Relative risks of total stroke for an increment of 40 g/day in cheese intake. Squares represent study-specific relative risk estimates(size of the square reflects the study-specific statistical weight, ie, the inverse of the variance); horizontal lines represent 95% CIs; diamondsrepresent summary relative risk estimates with 95% CIs.
.4.5
.6.7
.8.9
11.
11.
2R
elat
ive
Ris
k
0 10 20 30 40 50 60 70 80 90 100 110 120Cheese intake − g/d
Cheese intake and Risk of Stroke
Figure 10. Ding’s spaghetti plot for the nonlinear associationbetween cheese intake and total stroke (n=6). Circles are placedat the study-specific relative risks related to the correspondingquantity of intake. The area of the circles is proportional to thestudy-specific statistical weight. The solid red line represents thepooled RR at each quantity of intake and the 2 dashed dark bluelines the corresponding 95% CI.
DOI: 10.1161/JAHA.115.002787 Journal of the American Heart Association 14
Dairy Consumption and Risk of Stroke de Goede et alORIG
INALRESEARCH
by guest on July 11, 2018http://jaha.ahajournals.org/
Dow
nloaded from
stroke risk (RR: 1.00; 95% CI 0.99–1.01 per 10 g/day;Figure 16).
DiscussionThis meta-analysis showed an inverse association of milkconsumption with risk of stroke, with a maximal reductionaround 125 g/day. The high amount of heterogeneity waspartly explained, but not completely absent, after stratifyingfor continent. Based on a limited number of studies, high-fatmilk was directly associated with stroke risk. Cheese intakewas marginally inversely associated with stroke risk, with amaximal risk reduction from 25 g/day onwards for cheese.For yogurt, butter, and total dairy no associations wereobserved. The role of fat content of dairy products is not yetclear.
Dairy is a heterogeneous food group of (semi) solid andliquid fermented or nonfermented foods, differing in nutrientssuch as fat and sodium. We therefore separately analyzedspecific dairy types. Based on 14 studies, we found asignificant 7% lower risk of stroke per 200 g/day of milk,which was smaller than the 13% (based on 6 studies) that weshowed in our previous meta-analysis.10 Our findings are inline with the meta-analysis by Hu et al,12 who reported a 9%
lower risk for a high versus a low milk intake. The associationin our study was nonlinear, with the lowest risk observed at125 g/day. Heterogeneity was partly attributable to conti-nent, with milk being inversely associated with stroke in EastAsia, but not in Europe. Hu et al12 studied heterogeneity fortotal dairy in relation to stroke risk, and also observedstronger associations in Asian studies.12 It should be notedthat some Asian studies were based on multivariable modelsthat contained only a few covariates.11,24,31 However, theresults provided by A.P., which were adjusted for manypotential confounders, supported the lower risk of stroke withincreasing milk intake making residual confounding unlikelyas an explanation for the difference between continents. Thedifference in results between continents may reflect differ-ences in types of stroke as in Asia hemorrhagic stroke is morecommon than in Western countries.41 Our results on hemor-rhagic stroke, however, did not provide an explanation for theobserved heterogeneity.
Cheese consumption was inversely associated with strokerisk, with a 3% lower risk of stroke per 40 g/day of cheeseand a maximum reduction above 25 g/day. Our resultsregarding cheese were in agreement with Hu et al12 and Qinet al,42 who also reported inverse associations for a highversus a low cheese consumption. They did not investigatewhether the association was nonlinear. Yogurt was not
Figure 11. Relative risks of total stroke for an increment of 100 g/day in yogurt intake. Squares represent study-specific relative riskestimates (size of the square reflects the study-specific statistical weight, ie, the inverse of the variance); horizontal lines represent 95% CIs;diamonds represent summary relative risk estimates with 95% CIs.
DOI: 10.1161/JAHA.115.002787 Journal of the American Heart Association 15
Dairy Consumption and Risk of Stroke de Goede et al
by guest on July 11, 2018http://jaha.ahajournals.org/
Dow
nloaded from
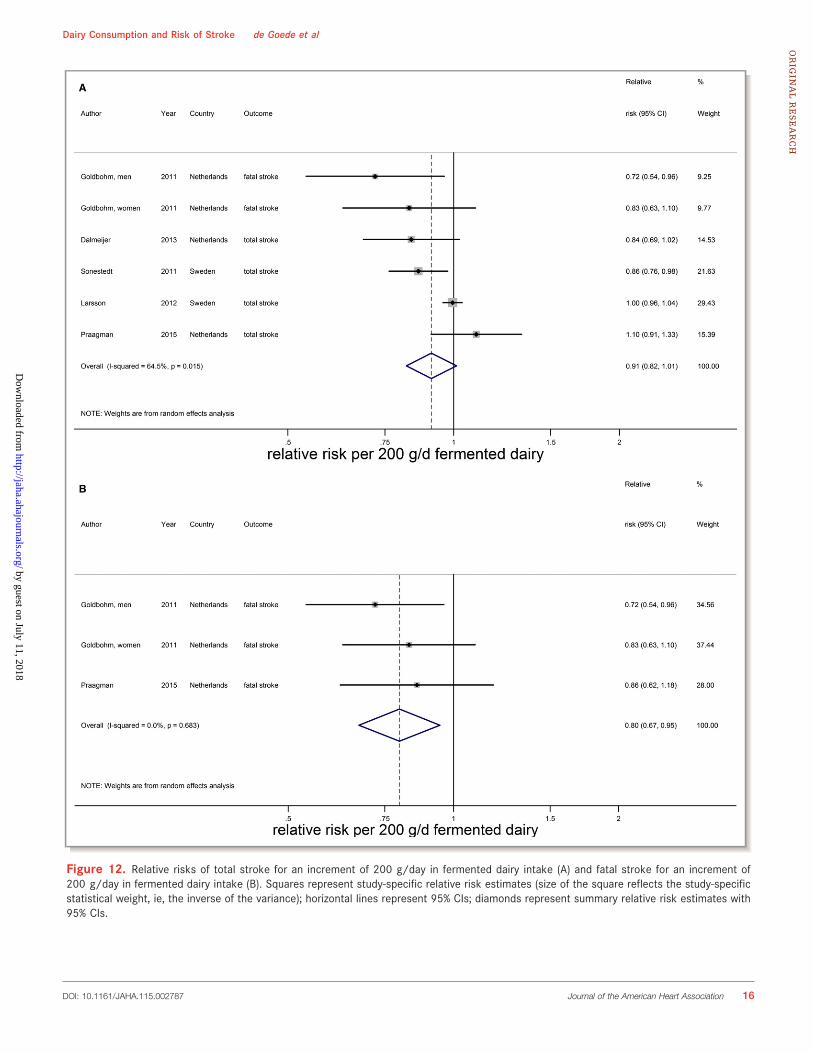
Figure 12. Relative risks of total stroke for an increment of 200 g/day in fermented dairy intake (A) and fatal stroke for an increment of200 g/day in fermented dairy intake (B). Squares represent study-specific relative risk estimates (size of the square reflects the study-specificstatistical weight, ie, the inverse of the variance); horizontal lines represent 95% CIs; diamonds represent summary relative risk estimates with95% CIs.
DOI: 10.1161/JAHA.115.002787 Journal of the American Heart Association 16
Dairy Consumption and Risk of Stroke de Goede et alORIG
INALRESEARCH
by guest on July 11, 2018http://jaha.ahajournals.org/
Dow
nloaded from
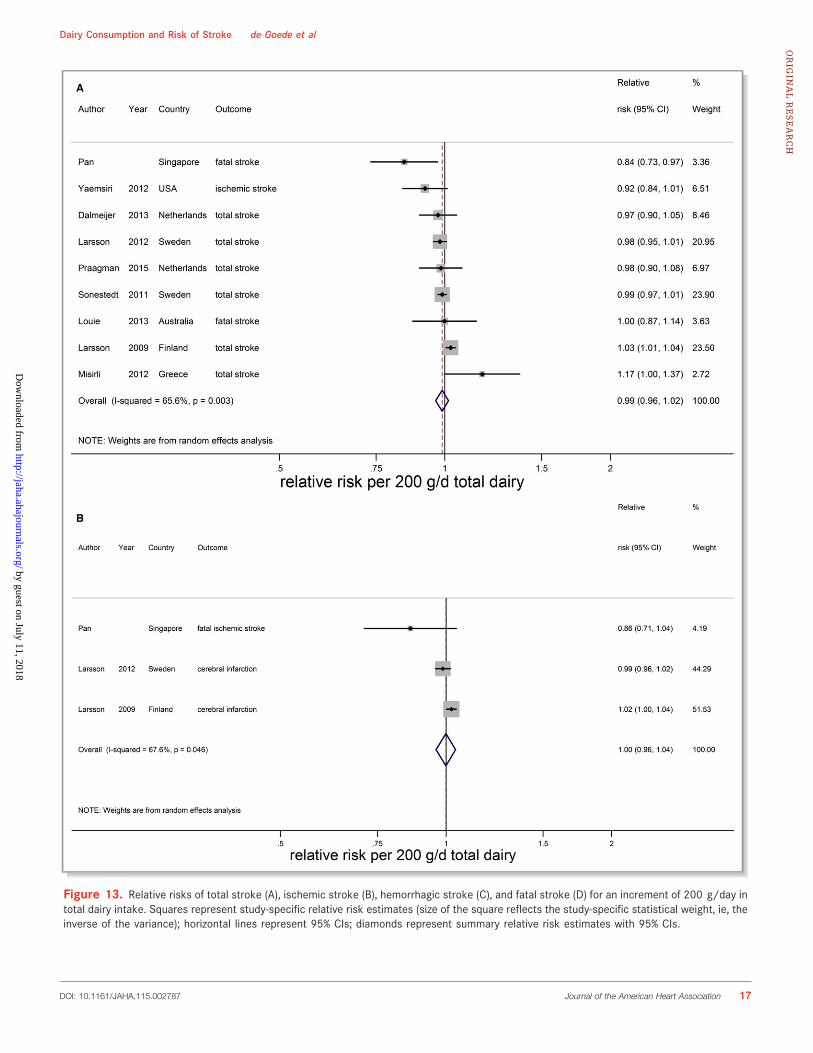
Figure 13. Relative risks of total stroke (A), ischemic stroke (B), hemorrhagic stroke (C), and fatal stroke (D) for an increment of 200 g/day intotal dairy intake. Squares represent study-specific relative risk estimates (size of the square reflects the study-specific statistical weight, ie, theinverse of the variance); horizontal lines represent 95% CIs; diamonds represent summary relative risk estimates with 95% CIs.
DOI: 10.1161/JAHA.115.002787 Journal of the American Heart Association 17
Dairy Consumption and Risk of Stroke de Goede et alORIG
INALRESEARCH
by guest on July 11, 2018http://jaha.ahajournals.org/
Dow
nloaded from
associated with stroke risk, based on 3 studies, whereas totalfermented dairy showed a borderline inverse association withstroke risk. In general, results for fermented dairy productswere only based on Western populations.
Limited information was available regarding the role ofdairy fat in relation to stroke risk. For high-fat milk a directassociation was observed, whereas for low-fat milk theassociation was (nonsignificantly) inverse. However, the
Figure 13. Continued.
DOI: 10.1161/JAHA.115.002787 Journal of the American Heart Association 18
Dairy Consumption and Risk of Stroke de Goede et alORIG
INALRESEARCH
by guest on July 11, 2018http://jaha.ahajournals.org/
Dow
nloaded from
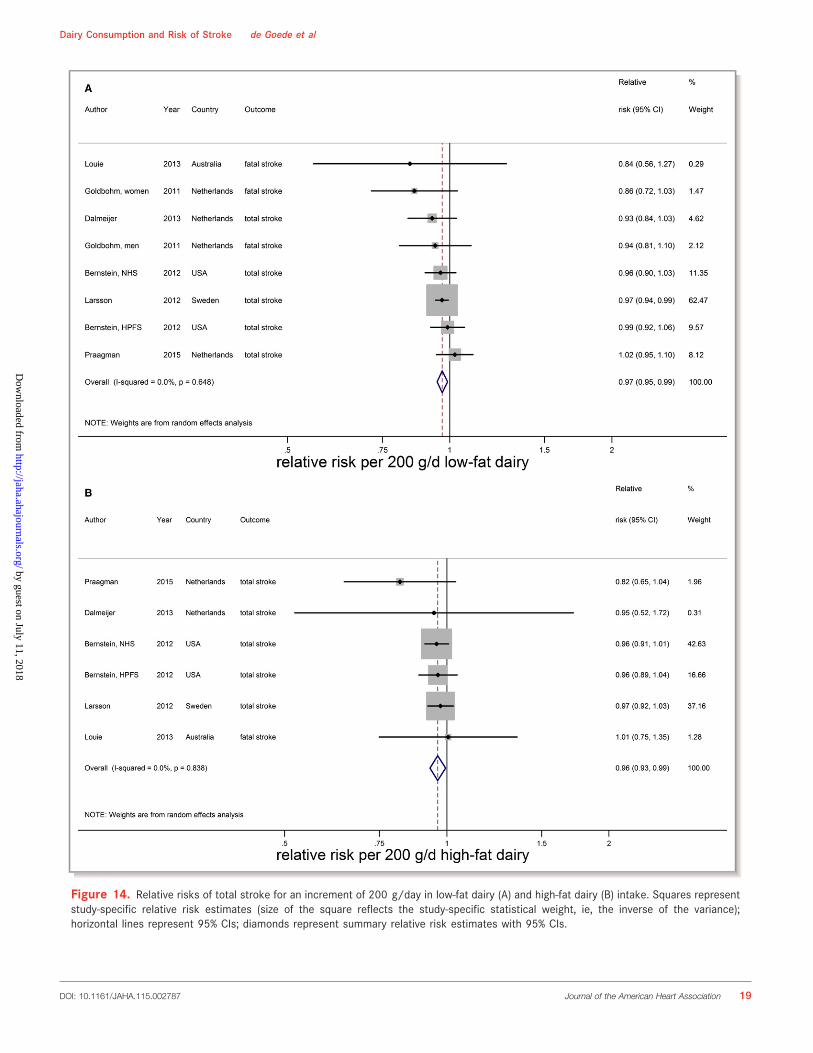
Figure 14. Relative risks of total stroke for an increment of 200 g/day in low-fat dairy (A) and high-fat dairy (B) intake. Squares representstudy-specific relative risk estimates (size of the square reflects the study-specific statistical weight, ie, the inverse of the variance);horizontal lines represent 95% CIs; diamonds represent summary relative risk estimates with 95% CIs.
DOI: 10.1161/JAHA.115.002787 Journal of the American Heart Association 19
Dairy Consumption and Risk of Stroke de Goede et al
by guest on July 11, 2018http://jaha.ahajournals.org/
Dow
nloaded from
number of studies that reported on types of milk was limitedand only comprised Western populations. In addition, resultsfor low-fat total dairy did not differ from those of high-fat totaldairy.
In a previous meta-analysis of 9 prospective cohortstudies, we reported that milk and low-fat dairy were inverselyassociated with hypertension, a major risk factor for stroke.43
Apart from butter, dairy is an important source of calcium,
.4.5
.6.7
.8.9
11.
11.
2R
elat
ive
Ris
k
0 100 200 300 400 500 600 700Low−fat dairy intake − g/d
Low−fat dairy intake and Risk of StrokeA
.4.5
.6.7
.8.9
11.
11.
2R
elat
ive
Ris
k
0 100 200 300 400 500 600High−fat dairy intake − g/d
High−fat dairy intake and Risk of StrokeB
Figure 15. Ding’s spaghetti plots for (A) the nonlinear association (P for nonlinearity=0.01; knot at 75 g/day) between low-fatdairy intake and total stroke (n=6) and (B) the nonlinear association (P for nonlinearity=0.01; knot: 55 g/day) between high-fat dairyintake and total stroke (n=6). Light blue lines represent Western studies. The circles are placed at the study-specific relative risksthat are related to the corresponding quantity of intake. The area of the circles is proportional to the study-specific statistical weight.The solid red line represents the pooled relative risk at each quantity of intake and the 2 dashed dark blue lines the corresponding95% CI.
Figure 16. Relative risks of total stroke for an increment of 10 g/day in butter intake. Squares represent study-specific relative risk estimates(size of the square reflects the study-specific statistical weight, ie, the inverse of the variance); horizontal lines represent 95% CIs; diamondrepresents summary relative risk estimates with 95% CIs.
DOI: 10.1161/JAHA.115.002787 Journal of the American Heart Association 20
Dairy Consumption and Risk of Stroke de Goede et al
by guest on July 11, 2018http://jaha.ahajournals.org/
Dow
nloaded from
which was inversely associated with stroke risk in a meta-analysis of 11 prospective cohort studies including popula-tions with low-to-moderate calcium intakes and Asian popu-lations.44 That meta-analysis also suggested protectiveeffects of dairy calcium rather than nondairy calcium againststroke.44 A recent update of these meta-analyses includingupdated results from the Nurses’ Health Study I and II,however, showed no association between dietary (dairy andother sources) calcium and stroke risk with a RR (95% CI) of0.98 (0.94–1.02) for a 300 mg/day increase of calciumintake.45 Calcium may play a role in the inverse association ofmilk and cheese with stroke risk. However, we only foundinverse associations for milk and cheese, and not for theother calcium-containing sources of dairy. Milk and dairy alsocontain other minerals, such as potassium and magnesium,which were also found to be inversely associated with strokerisk.45–47 On the other hand, cheese contains a lot of sodium,which is directly associated with hypertension. A meta-analysis of prospective cohort studies, however, did not showa relation of cheese consumption to hypertension.43 Themechanism of how dairy would protect against stroke istherefore not yet clear.
Strengths of our meta-analysis are our comprehensivedose–response analyses and the careful evaluation of nonlin-earity of the associations based on a large number of studiesfrom Asian and Western countries by contacting authors foradditional information and by contacting researchers in thefield for inclusion of additional cohorts. A limitation is that it isdifficult to disentangle the effects of the dosages of milkintake from Western compared to those of East Asiancountries, because consumption levels in East Asia wereconsiderably lower than those in Western countries. Inaddition, reported dairy types differed between studies, whichcomplicates direct comparison of results between dairy types.Another limitation was that the number of studies, except formilk intake, was rather low (n≤8). Therefore, options for meta-regression or subgroup analyses were limited for severalexposure categories. The quality of a meta-analysis isdependent on the quality of the included studies. The degreeof adjustment for confounders varied widely between studies.Regarding the results on milk, 3 of 6 Asian studies had a lowstudy quality score11,24,31 as opposed to 1 of 10 Westernstudies.30 Therefore, influences of study quality and continentcannot easily be separated. However, the (unpublished)results of Pan et al, which were fully adjusted for potentialconfounders, supported the inverse association that weobserved for other East Asian countries. We therefore believethat our results on milk consumption are not solely due toconfounding. Residual confounding will, as in any cohortstudy, always be of concern.
In conclusion, this meta-analysis of 18 prospective obser-vational studies indicates a possible role for milk and cheese
consumption in stroke prevention. Results should be placed inthe context of the observed heterogeneity. Future epidemi-ological studies should provide more details about types ofdairy, including fat content. In addition, the role of milk anddairy in Asian populations deserves further attention.
Sources of FundingThis meta-analysis was partly funded by an unrestricted grantfrom the Dutch Dairy Association.
DisclosuresSoedamah-Muthu received funding from the Global DairyPlatform, Dairy Research Institute, and Dairy Australia for ameta-analysis on cheese and blood lipids (2012) and a meta-analysis of dairy and mortality (2015). Gijsbers, Geleijnse,Pan, and de Goede reported no conflicts of interest. Thesponsors had no role in design and conduct of the study, datacollection and analysis, interpretation of the data, decision topublish, or preparation of the manuscript.
References1. Mozaffarian D, Benjamin EJ, Go AS, Arnett DK, Blaha MJ, Cushman M, de
Ferranti S, Despres JP, Fullerton HJ, Howard VJ, Huffman MD, Judd SE, KisselaBM, Lackland DT, Lichtman JH, Lisabeth LD, Liu S, Mackey RH, Matchar DB,McGuire DK, Mohler ER III, Moy CS, Muntner P, Mussolino ME, Nasir K,Neumar RW, Nichol G, Palaniappan L, Pandey DK, Reeves MJ, Rodriguez CJ,Sorlie PD, Stein J, Towfighi A, Turan TN, Virani SS, Willey JZ, Woo D, Yeh RW,Turner MB; American Heart Association Statistics C, Stroke Statistics S. Heartdisease and stroke statistics—2015 update: a report from the American HeartAssociation. Circulation. 2015;131:e29–e322.
2. Feigin VL, Lawes CM, Bennett DA, Anderson CS. Stroke epidemiology: a reviewof population-based studies of incidence, prevalence, and case-fatality in thelate 20th century. Lancet Neurol. 2003;2:43–53.
3. Hata J, Kiyohara Y. Epidemiology of stroke and coronary artery disease in Asia.Circ J. 2013;77:1923–1932.
4. Goldstein LB, Bushnell CD, Adams RJ, Appel LJ, Braun LT, Chaturvedi S,Creager MA, Culebras A, Eckel RH, Hart RG, Hinchey JA, Howard VJ, Jauch EC,Levine SR, Meschia JF, Moore WS, Nixon JV, Pearson TA. Guidelines for theprimary prevention of stroke: a guideline for healthcare professionals from theAmerican Heart Association/American Stroke Association. Stroke.2011;42:517–584.
5. Lichtenstein AH, Appel LJ, Brands M, Carnethon M, Daniels S, Franch HA,Franklin B, Kris-Etherton P, Harris WS, Howard B, Karanja N, Lefevre M, RudelL, Sacks F, Van Horn L, Winston M, Wylie-Rosett J. Diet and lifestyle recom-mendations revision 2006: a scientific statement from the American HeartAssociation Nutrition Committee. Circulation. 2006;114:82–96.
6. Dietary Guidelines for Americans, 2010. Washington, DC: US Department ofAgriculture and US Department of Health and Human Services; 2010.
7. U.S. Department of Health and Human Services and U.S. Department ofAgriculture 2015 – 2020 Dietary Guidelines for Americans. 8th ed. Available at:http://health.gov/dietaryguidelines/2015/guidelines/..
8. Ge K. The transition of Chinese dietary guidelines and food guide pagoda. AsiaPac J Clin Nutr. 2011;20:439–446.
9. Japanese food guide spinning top. Available at: http://www.mhlw.go.jp/bunya/kenkou/pdf/eiyou-syokuji4.pdf. Accessed July 1, 2015.
10. Soedamah-Muthu SS, Ding EL, Al-Delaimy WK, Hu FB, Engberink MF, WillettWC, Geleijnse JM. Milk and dairy consumption and incidence of cardiovasculardiseases and all-cause mortality: dose-response meta-analysis of prospectivecohort studies. Am J Clin Nutr. 2011;93:158–171.
11. Kinjo Y, Beral V, Akiba S, Key T, Mizuno S, Appleby P, Yamaguchi N, WatanabeS, Doll R. Possible protective effect of milk, meat and fish for cerebrovasculardisease mortality in Japan. J Epidemiol. 1999;9:268–274.
DOI: 10.1161/JAHA.115.002787 Journal of the American Heart Association 21
Dairy Consumption and Risk of Stroke de Goede et al
by guest on July 11, 2018http://jaha.ahajournals.org/
Dow
nloaded from
12. Hu D, Huang J, Wang Y, Zhang D, Qu Y. Dairy foods and risk of stroke: a meta-analysis of prospective cohort studies. Nutr Metab Cardiovasc Dis.2014;24:460–469.
13. van der Pols JC, Gunnell D, Williams GM, Holly JM, Bain C, Martin RM.Childhood dairy and calcium intake and cardiovascular mortality in adulthood:65-year follow-up of the Boyd Orr cohort. Heart. 2009;95:1600–1606.
14. Huang LY, Wahlqvist ML, Huang YC, Lee MS. Optimal dairy intake is predicatedon total, cardiovascular, and stroke mortalities in a Taiwanese cohort. J AmColl Nutr. 2014;33:426–436.
15. Praagman J, Franco OH, Ikram MA, Soedamah-Muthu SS, Engberink MF, vanRooij FJ, Hofman A, Geleijnse JM. Dairy products and the risk of stroke andcoronary heart disease: the Rotterdam Study. Eur J Nutr. 2015;54:981–990.
16. Misirli G, Benetou V, Lagiou P, Bamia C, Trichopoulos D, Trichopoulou A.Relation of the traditional Mediterranean diet to cerebrovascular disease in aMediterranean population. Am J Epidemiol. 2012;176:1185–1192.
17. Yaemsiri S, Sen S, Tinker L, Rosamond W, Wassertheil-Smoller S, He K. Transfat, aspirin, and ischemic stroke in postmenopausal women. Ann Neurol.2012;72:704–715.
18. Stroup DF, Berlin JA, Morton SC, Olkin I, Williamson GD, Rennie D, Moher D,Becker BJ, Sipe TA, Thacker SB. Meta-analysis of observational studies inepidemiology: a proposal for reporting. Meta-analysis Of Observational Studiesin Epidemiology (MOOSE) group. JAMA. 2000;283:2008–2012.
19. Kondo I, Ojima T, Nakamura M, Hayasaka S, Hozawa A, Saitoh S, Ohnishi H,Akasaka H, Hayakawa T, Murakami Y, Okuda N, Miura K, Okayama A, UeshimaH; Group NDR. Consumption of dairy products and death from cardiovasculardisease in the Japanese general population: the NIPPON DATA80. J Epidemiol.2013;23:47–54.
20. Larsson SC, Mannisto S, Virtanen MJ, Kontto J, Albanes D, Virtamo J. Dairyfoods and risk of stroke. Epidemiology. 2009;20:355–360.
21. Larsson SC, Virtamo J, Wolk A. Dairy consumption and risk of stroke inSwedish women and men. Stroke. 2012;43:1775–1780.
22. Dalmeijer GW, Struijk EA, van der Schouw YT, Soedamah-Muthu SS,Verschuren WM, Boer JM, Geleijnse JM, Beulens JW. Dairy intake and coronaryheart disease or stroke—a population-based cohort study. Int J Cardiol.2013;167:925–929.
23. Bernstein AM, Pan A, Rexrode KM, Stampfer M, Hu FB, Mozaffarian D, WillettWC. Dietary protein sources and the risk of stroke in men and women. Stroke.2012;43:637–644.
24. Lin PH, Yeh WT, Svetkey LP, Chuang SY, Chang YC, Wang C, Pan WH. Dietaryintakes consistent with the DASH dietary pattern reduce blood pressureincrease with age and risk for stroke in a Chinese population. Asia Pac J ClinNutr. 2013;22:482–491.
25. Sonestedt E, Wirfalt E, Wallstrom P, Gullberg B, Orho-Melander M, Hedblad B.Dairy products and its association with incidence of cardiovascular disease:the Malmo diet and cancer cohort. Eur J Epidemiol. 2011;26:609–618.
26. He K, Merchant A, Rimm EB, Rosner BA, Stampfer MJ, Willett WC, Ascherio A.Dietary fat intake and risk of stroke in male US healthcare professionals:14 year prospective cohort study. BMJ. 2003;327:777–782.
27. Elwood PC, Strain JJ, Robson PJ, Fehily AM, Hughes J, Pickering J, Ness A. Milkconsumption, stroke, and heart attack risk: evidence from the Caerphillycohort of older men. J Epidemiol Community Health. 2005;59:502–505.
28. Iso H, Stampfer MJ, Manson JE, Rexrode K, Hennekens CH, Colditz GA, SpeizerFE, Willett WC. Prospective study of calcium, potassium, and magnesiumintake and risk of stroke in women. Stroke. 1999;30:1772–1779.
29. Goldbohm RA, Chorus AM, Galindo Garre F, Schouten LJ, van den Brandt PA.Dairy consumption and 10-y total and cardiovascular mortality: a prospectivecohort study in the Netherlands. Am J Clin Nutr. 2011;93:615–627.
30. Ness AR, Smith GD, Hart C. Milk, coronary heart disease and mortality. JEpidemiol Community Health. 2001;55:379–382.
31. Sauvaget C, Nagano J, Allen N, Grant EJ, Beral V. Intake of animal products andstroke mortality in the Hiroshima/Nagasaki Life Span Study. Int J Epidemiol.2003;32:536–543.
32. Elwood PC, Pickering JE, Fehily AM, Hughes J, Ness AR. Milk drinking,ischaemic heart disease and ischaemic stroke I. Evidence from the Caerphillycohort. Eur J Clin Nutr. 2004;58:711–717.
33. Louie JC, Flood VM, Burlutsky G, Rangan AM, Gill TP, Mitchell P. Dairyconsumption and the risk of 15-year cardiovascular disease mortality in acohort of older Australians. Nutrients. 2013;5:441–454.
34. Bodner-Montville J, Ahuja JKC, Ingwersen LA, Haggerty ES, Enns CW, PerloffBP. USDA Food and Nutrient Database for Dietary Studies: released on theweb. J Food Compost Anal. 2006;19(suppl):S100–S107.
35. Food Portion Sizes. Norwich, London: TSO; 2005.
36. The Newcastle-Ottawa Scale (NOS) for assessing the quality of nonrandomisedstudies in meta-analyses. Available at: http://www.ohri.ca/programs/clini-cal_epidemiology/oxford.asp. Accessed July 1, 2015.
37. Greenland S, Longnecker MP. Methods for trend estimation from summarizeddose-response data, with applications to meta-analysis. Am J Epidemiol.1992;135:1301–1309.
38. Bauer SR, Hankinson SE, Bertone-Johnson ER, Ding EL. Plasma vitamin Dlevels, menopause, and risk of breast cancer: dose-response meta-analysis ofprospective studies. Medicine (Baltimore). 2013;92:123–131.
39. Higgins JP, Thompson SG. Quantifying heterogeneity in a meta-analysis. StatMed. 2002;21:1539–1558.
40. Egger M, Davey Smith G, Schneider M, Minder C. Bias in meta-analysisdetected by a simple, graphical test. BMJ. 1997;315:629–634.
41. Krishnamurthi RV, Moran AE, Forouzanfar MH, Bennett DA, Mensah GA, LawesCM, Barker-Collo S, Connor M, Roth GA, Sacco R, Ezzati M, Naghavi M, MurrayCJ, Feigin VL; Global Burden of Diseases I, Risk Factors Study Stroke Expert G.The global burden of hemorrhagic stroke: a summary of findings from the GBD2010 study. Glob Heart. 2014;9:101–106.
42. Qin LQ, Xu JY, Han SF, Zhang ZL, Zhao YY, Szeto IM. Dairy consumption andrisk of cardiovascular disease: an updated meta-analysis of prospective cohortstudies. Asia Pac J Clin Nutr. 2015;24:90–100.
43. Soedamah-Muthu SS, Verberne LD, Ding EL, Engberink MF, Geleijnse JM. Dairyconsumption and incidence of hypertension: a dose-response meta-analysis ofprospective cohort studies. Hypertension. 2012;60:1131–1137.
44. Larsson SC, Orsini N, Wolk A. Dietary calcium intake and risk of stroke: adose-response meta-analysis. Am J Clin Nutr. 2013;97:951–957.
45. Adebamowo SN, Spiegelman D, Willett WC, Rexrode KM. Association betweenintakes of magnesium, potassium, and calcium and risk of stroke: 2 cohortsof US women and updated meta-analyses. Am J Clin Nutr. 2015;101:1269–1277.
46. Larsson SC, Orsini N, Wolk A. Dietary potassium intake and risk of stroke: adose-response meta-analysis of prospective studies. Stroke. 2011;42:2746–2750.
47. Larsson SC, Orsini N, Wolk A. Dietary magnesium intake and risk of stroke: ameta-analysis of prospective studies. Am J Clin Nutr. 2012;95:362–366.
DOI: 10.1161/JAHA.115.002787 Journal of the American Heart Association 22
Dairy Consumption and Risk of Stroke de Goede et alORIG
INALRESEARCH
by guest on July 11, 2018http://jaha.ahajournals.org/
Dow
nloaded from
SUPPLEMENTAL MATERIAL
CONTENT
Supplemental methods
• Supplement I. MOOSE Checklist • Supplement II. Search strategy • Supplement III. Quality assessment of cohort studies on dairy intake and stroke risk. • Supplement IV: Definition of dairy foods as described in the individual cohort studies
included in the meta-analyses
by guest on July 11, 2018http://jaha.ahajournals.org/
Dow
nloaded from
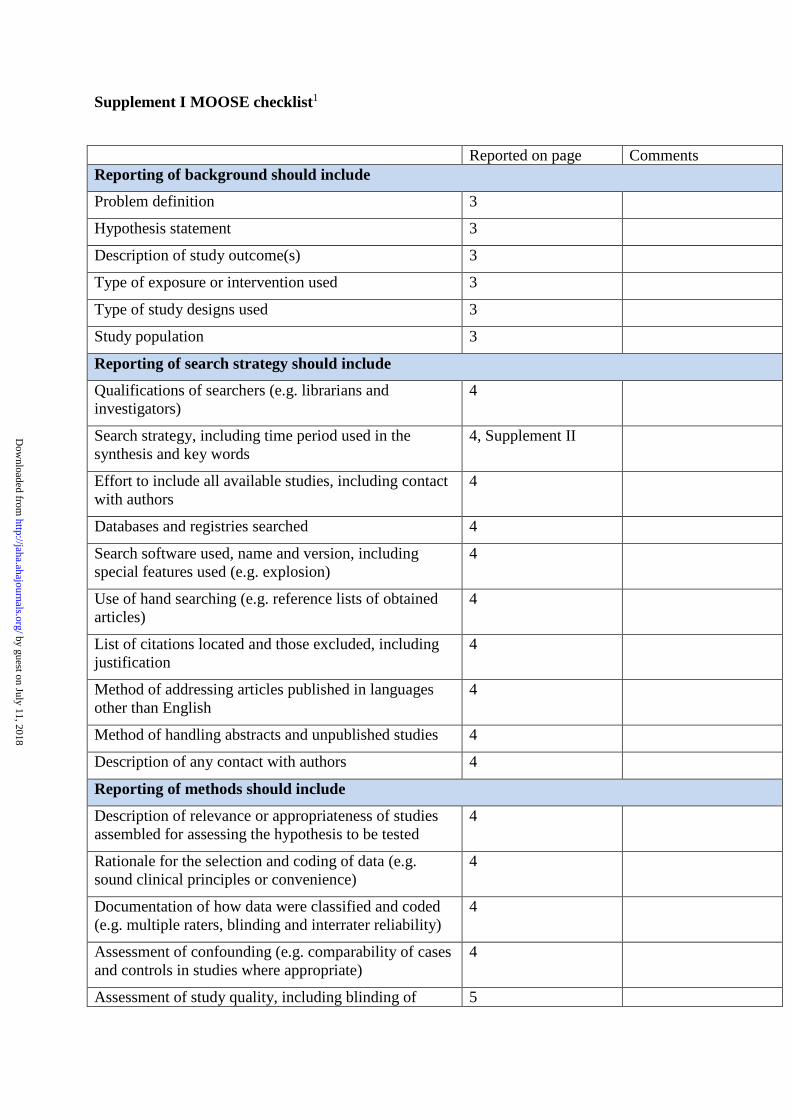
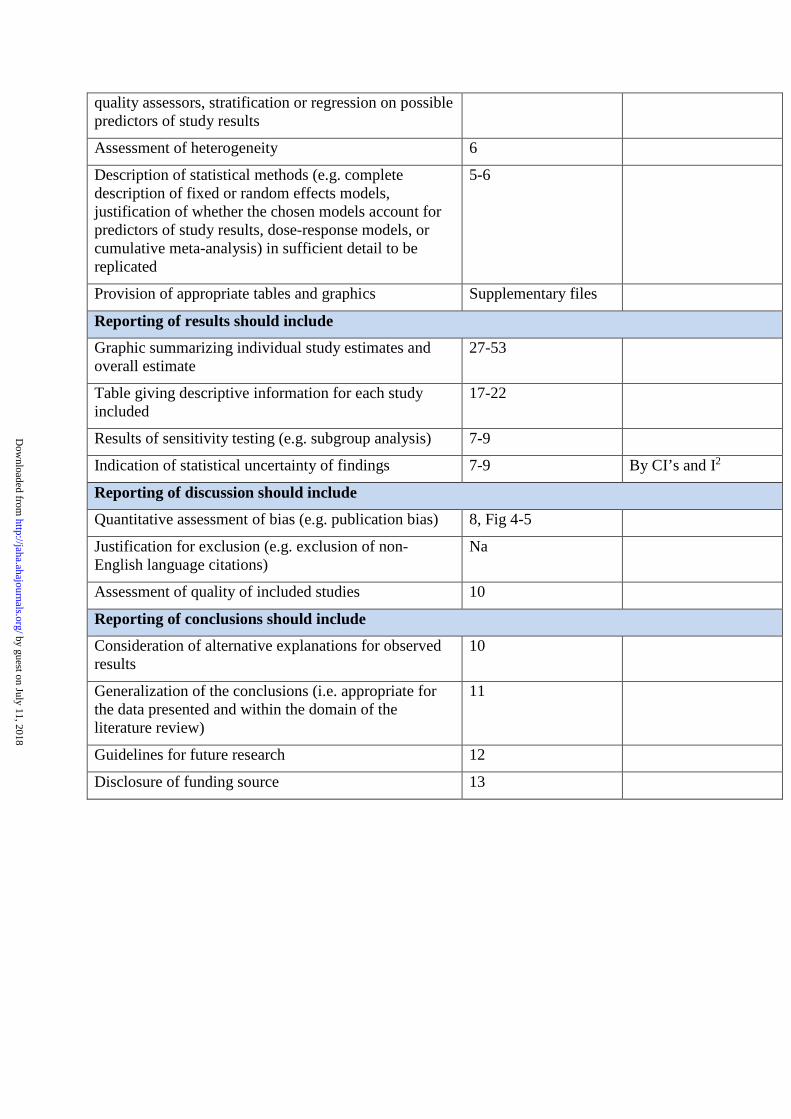
Supplement I MOOSE checklist1
Reported on page Comments Reporting of background should include
Problem definition 3
Hypothesis statement 3
Description of study outcome(s) 3
Type of exposure or intervention used 3
Type of study designs used 3
Study population 3
Reporting of search strategy should include
Qualifications of searchers (e.g. librarians and investigators)
4
Search strategy, including time period used in the synthesis and key words
4, Supplement II
Effort to include all available studies, including contact with authors
4
Databases and registries searched 4
Search software used, name and version, including special features used (e.g. explosion)
4
Use of hand searching (e.g. reference lists of obtained articles)
4
List of citations located and those excluded, including justification
4
Method of addressing articles published in languages other than English
4
Method of handling abstracts and unpublished studies 4
Description of any contact with authors 4
Reporting of methods should include
Description of relevance or appropriateness of studies assembled for assessing the hypothesis to be tested
4
Rationale for the selection and coding of data (e.g. sound clinical principles or convenience)
4
Documentation of how data were classified and coded (e.g. multiple raters, blinding and interrater reliability)
4
Assessment of confounding (e.g. comparability of cases and controls in studies where appropriate)
4
Assessment of study quality, including blinding of 5
by guest on July 11, 2018http://jaha.ahajournals.org/
Dow
nloaded from
quality assessors, stratification or regression on possible predictors of study results
Assessment of heterogeneity 6
Description of statistical methods (e.g. complete description of fixed or random effects models, justification of whether the chosen models account for predictors of study results, dose-response models, or cumulative meta-analysis) in sufficient detail to be replicated
5-6
Provision of appropriate tables and graphics Supplementary files
Reporting of results should include
Graphic summarizing individual study estimates and overall estimate
27-53
Table giving descriptive information for each study included
17-22
Results of sensitivity testing (e.g. subgroup analysis) 7-9
Indication of statistical uncertainty of findings 7-9 By CI’s and I2
Reporting of discussion should include
Quantitative assessment of bias (e.g. publication bias) 8, Fig 4-5
Justification for exclusion (e.g. exclusion of non-English language citations)
Na
Assessment of quality of included studies 10
Reporting of conclusions should include
Consideration of alternative explanations for observed results
10
Generalization of the conclusions (i.e. appropriate for the data presented and within the domain of the literature review)
11
Guidelines for future research 12
Disclosure of funding source 13
by guest on July 11, 2018http://jaha.ahajournals.org/
Dow
nloaded from
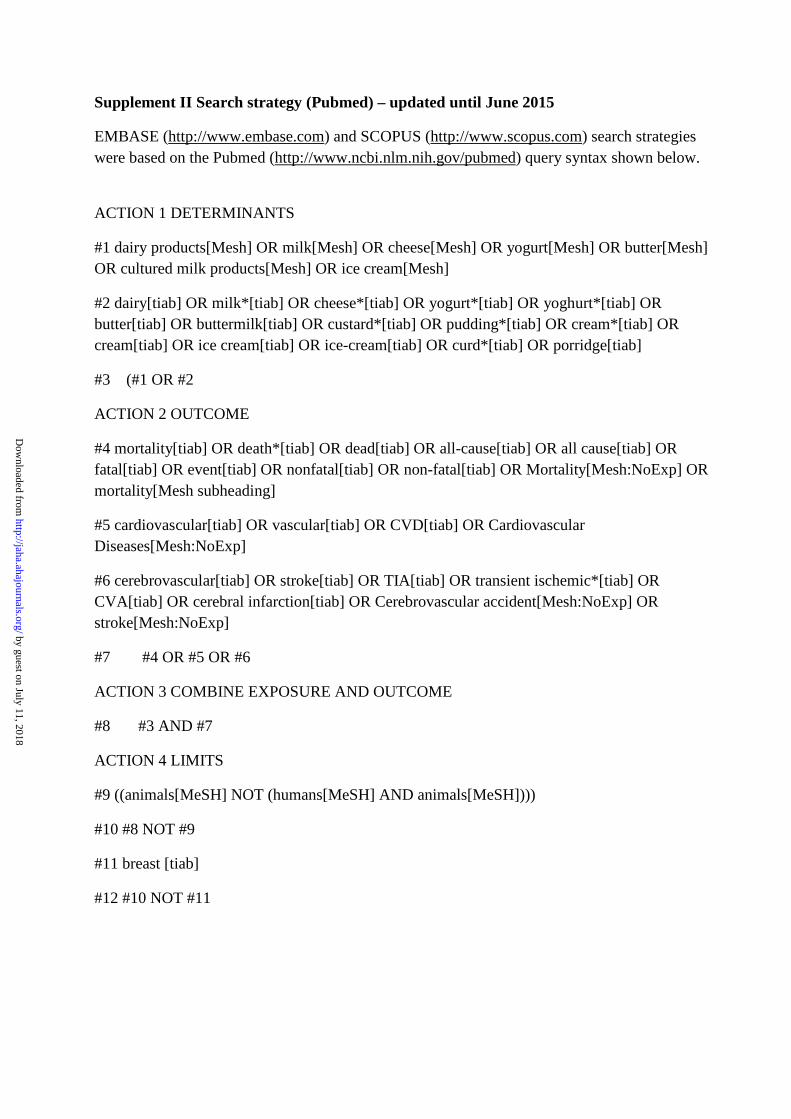
Supplement II Search strategy (Pubmed) – updated until June 2015
EMBASE (http://www.embase.com) and SCOPUS (http://www.scopus.com) search strategies were based on the Pubmed (http://www.ncbi.nlm.nih.gov/pubmed) query syntax shown below.
ACTION 1 DETERMINANTS
#1 dairy products[Mesh] OR milk[Mesh] OR cheese[Mesh] OR yogurt[Mesh] OR butter[Mesh] OR cultured milk products[Mesh] OR ice cream[Mesh]
#2 dairy[tiab] OR milk*[tiab] OR cheese*[tiab] OR yogurt*[tiab] OR yoghurt*[tiab] OR butter[tiab] OR buttermilk[tiab] OR custard*[tiab] OR pudding*[tiab] OR cream*[tiab] OR cream[tiab] OR ice cream[tiab] OR ice-cream[tiab] OR curd*[tiab] OR porridge[tiab]
#3 (#1 OR #2
ACTION 2 OUTCOME
#4 mortality[tiab] OR death*[tiab] OR dead[tiab] OR all-cause[tiab] OR all cause[tiab] OR fatal[tiab] OR event[tiab] OR nonfatal[tiab] OR non-fatal[tiab] OR Mortality[Mesh:NoExp] OR mortality[Mesh subheading]
#5 cardiovascular[tiab] OR vascular[tiab] OR CVD[tiab] OR Cardiovascular Diseases[Mesh:NoExp]
#6 cerebrovascular[tiab] OR stroke[tiab] OR TIA[tiab] OR transient ischemic*[tiab] OR CVA[tiab] OR cerebral infarction[tiab] OR Cerebrovascular accident[Mesh:NoExp] OR stroke[Mesh:NoExp]
#7 #4 OR #5 OR #6
ACTION 3 COMBINE EXPOSURE AND OUTCOME
#8 #3 AND #7
ACTION 4 LIMITS
#9 ((animals[MeSH] NOT (humans[MeSH] AND animals[MeSH])))
#10 #8 NOT #9
#11 breast [tiab]
#12 #10 NOT #11
by guest on July 11, 2018http://jaha.ahajournals.org/
Dow
nloaded from
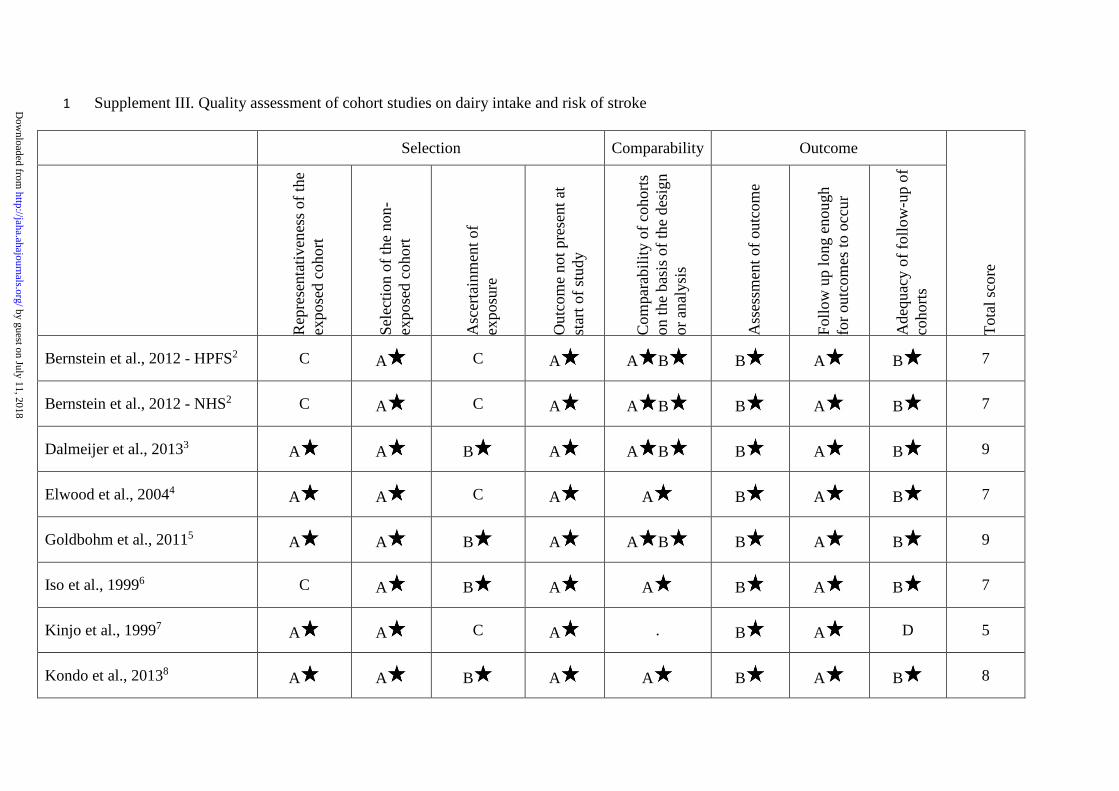
Supplement III. Quality assessment of cohort studies on dairy intake and risk of stroke 1
Selection Comparability Outcome
Tota
l sco
re
Rep
rese
ntat
iven
ess o
f the
ex
pose
d co
hort
Sele
ctio
n of
the
non-
expo
sed
coho
rt
Asc
erta
inm
ent o
f ex
posu
re
Out
com
e no
t pre
sent
at
star
t of s
tudy
Com
para
bilit
y of
coh
orts
on
the
basi
s of t
he d
esig
n or
ana
lysi
s
Ass
essm
ent o
f out
com
e
Follo
w u
p lo
ng e
noug
h fo
r out
com
es to
occ
ur
Ade
quac
y of
follo
w-u
p of
co
horts
Bernstein et al., 2012 - HPFS2 C A C A A B B A B 7
Bernstein et al., 2012 - NHS2 C A C A A B B A B 7
Dalmeijer et al., 20133 A A B A A B B A B 9
Elwood et al., 20044 A A C A A B A B 7
Goldbohm et al., 20115 A A B A A B B A B 9
Iso et al., 19996 C A B A A B A B 7
Kinjo et al., 19997 A A C A . B A D 5
Kondo et al., 20138 A A B A A B A B 8
by guest on July 11, 2018http://jaha.ahajournals.org/
Dow
nloaded from

Selection Comparability Outcome
Tota
l sco
re
R
epre
sent
ativ
enes
s of t
he
expo
sed
coho
rt
Sele
ctio
n of
the
non-
expo
sed
coho
rt
Asc
erta
inm
ent o
f ex
posu
re
Out
com
e no
t pre
sent
at
star
t of s
tudy
Com
para
bilit
y of
coh
orts
on
the
basi
s of t
he d
esig
n or
ana
lysi
s
Ass
essm
ent o
f out
com
e
Follo
w u
p lo
ng e
noug
h fo
r out
com
es to
occ
ur
Ade
quac
y of
follo
w-u
p of
co
horts
Larsson et al., 20099 C A B A A B B A D 7
Larsson et al., 201210 A A B A A B B A B 9
Lin 2013 et al., 201311 A A C A . A A A 6
Louie al., 201312 B A B A A B A A 8
Misirli et al., 201213 A A C A A B A D 6
Ness et al., 200114 C A D A . C A D 3
Pan et al., unpublished C A C A A B B A B 7
Praagman et al., 201515 A A B A A B A A D 8
Sauvaget et al., 200316 A A C A . B A B 6
by guest on July 11, 2018http://jaha.ahajournals.org/
Dow
nloaded from
Selection Comparability Outcome
Tota
l sco
re
R
epre
sent
ativ
enes
s of t
he
expo
sed
coho
rt
Sele
ctio
n of
the
non-
expo
sed
coho
rt
Asc
erta
inm
ent o
f ex
posu
re
Out
com
e no
t pre
sent
at
star
t of s
tudy
Com
para
bilit
y of
coh
orts
on
the
basi
s of t
he d
esig
n or
ana
lysi
s
Ass
essm
ent o
f out
com
e
Follo
w u
p lo
ng e
noug
h fo
r out
com
es to
occ
ur
Ade
quac
y of
follo
w-u
p of
co
horts
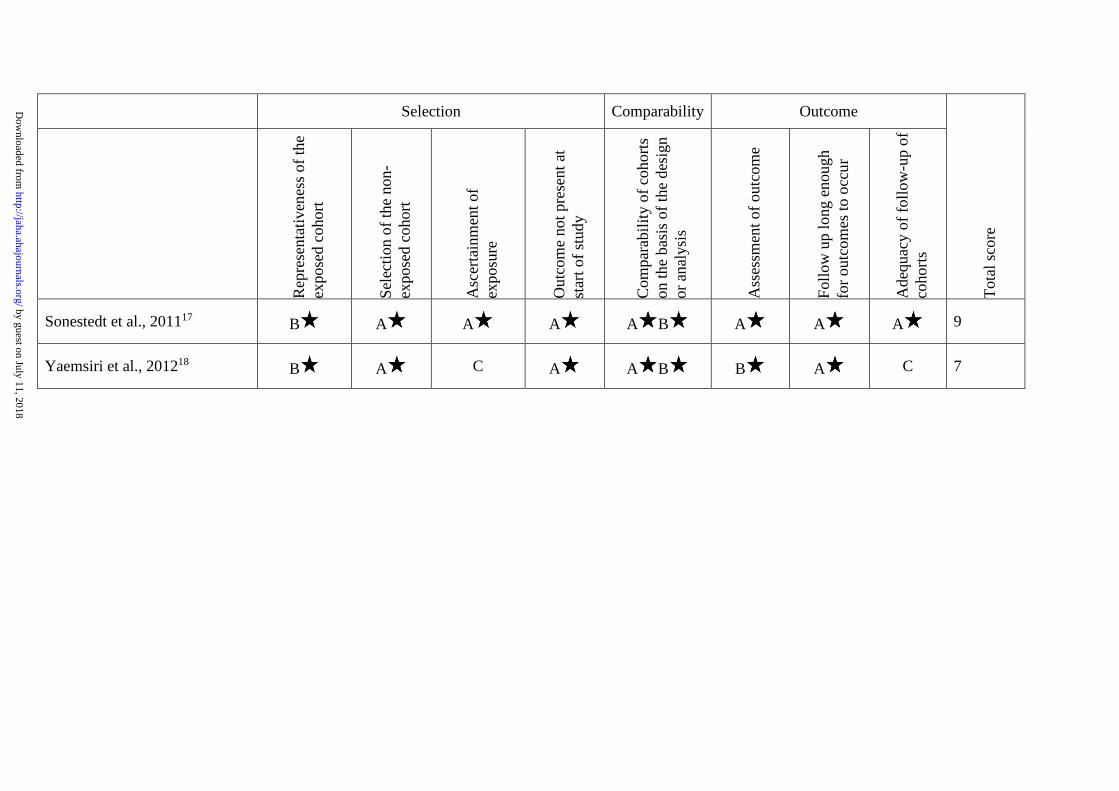
Sonestedt et al., 201117 B A A A A B A A A 9
Yaemsiri et al., 201218 B A C A A B B A C 7
by guest on July 11, 2018http://jaha.ahajournals.org/
Dow
nloaded from
NEWCASTLE – OTTAWA QUALITY ASSESSMENT SCALE COHORT STUDIES
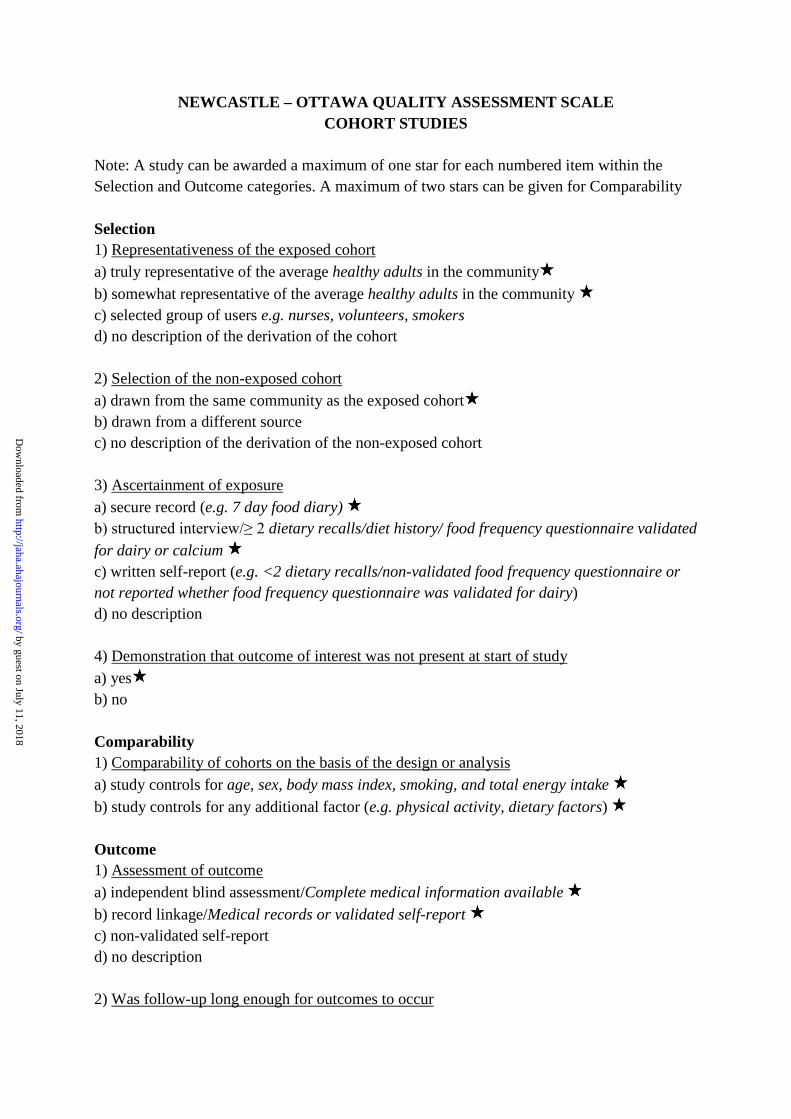
Note: A study can be awarded a maximum of one star for each numbered item within the Selection and Outcome categories. A maximum of two stars can be given for Comparability Selection 1) Representativeness of the exposed cohort a) truly representative of the average healthy adults in the community b) somewhat representative of the average healthy adults in the community c) selected group of users e.g. nurses, volunteers, smokers d) no description of the derivation of the cohort 2) Selection of the non-exposed cohort a) drawn from the same community as the exposed cohort b) drawn from a different source c) no description of the derivation of the non-exposed cohort 3) Ascertainment of exposure a) secure record (e.g. 7 day food diary) b) structured interview/≥ 2 dietary recalls/diet history/ food frequency questionnaire validated for dairy or calcium c) written self-report (e.g. <2 dietary recalls/non-validated food frequency questionnaire or not reported whether food frequency questionnaire was validated for dairy) d) no description 4) Demonstration that outcome of interest was not present at start of study a) yes b) no Comparability 1) Comparability of cohorts on the basis of the design or analysis a) study controls for age, sex, body mass index, smoking, and total energy intake b) study controls for any additional factor (e.g. physical activity, dietary factors) Outcome 1) Assessment of outcome a) independent blind assessment/Complete medical information available b) record linkage/Medical records or validated self-report c) non-validated self-report d) no description 2) Was follow-up long enough for outcomes to occur
by guest on July 11, 2018http://jaha.ahajournals.org/
Dow
nloaded from

a) yes b) no 3) Adequacy of follow up of cohorts a) complete follow up - all subjects accounted for b) subjects lost to follow up unlikely to introduce bias - small number lost ≤20% follow up, or description provided of those lost c) follow up rate <80% or no description of those lost d) no statement
by guest on July 11, 2018http://jaha.ahajournals.org/
Dow
nloaded from
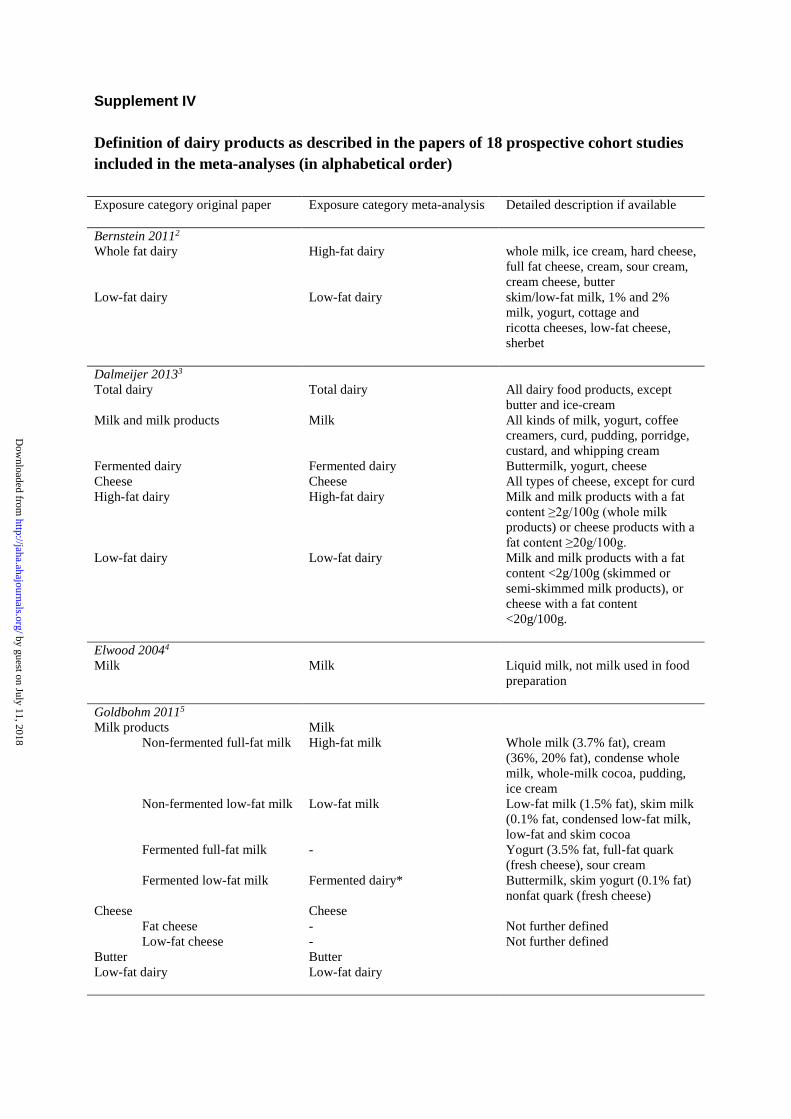
Supplement IV Definition of dairy products as described in the papers of 18 prospective cohort studies included in the meta-analyses (in alphabetical order) Exposure category original paper Exposure category meta-analysis Detailed description if available Bernstein 20112 Whole fat dairy High-fat dairy whole milk, ice cream, hard cheese,
full fat cheese, cream, sour cream, cream cheese, butter
Low-fat dairy Low-fat dairy skim/low-fat milk, 1% and 2% milk, yogurt, cottage and ricotta cheeses, low-fat cheese, sherbet
Dalmeijer 20133 Total dairy Total dairy All dairy food products, except
butter and ice-cream Milk and milk products Milk All kinds of milk, yogurt, coffee
creamers, curd, pudding, porridge, custard, and whipping cream
Fermented dairy Fermented dairy Buttermilk, yogurt, cheese Cheese Cheese All types of cheese, except for curd High-fat dairy High-fat dairy Milk and milk products with a fat
content ≥2g/100g (whole milk products) or cheese products with a fat content ≥20g/100g.
Low-fat dairy Low-fat dairy Milk and milk products with a fat content <2g/100g (skimmed or semi-skimmed milk products), or cheese with a fat content <20g/100g.
Elwood 20044 Milk Milk Liquid milk, not milk used in food
preparation Goldbohm 20115 Milk products Milk Non-fermented full-fat milk High-fat milk Whole milk (3.7% fat), cream
(36%, 20% fat), condense whole milk, whole-milk cocoa, pudding, ice cream
Non-fermented low-fat milk Low-fat milk Low-fat milk (1.5% fat), skim milk (0.1% fat, condensed low-fat milk, low-fat and skim cocoa
Fermented full-fat milk - Yogurt (3.5% fat, full-fat quark (fresh cheese), sour cream
Fermented low-fat milk Fermented dairy* Buttermilk, skim yogurt (0.1% fat) nonfat quark (fresh cheese)
Cheese Cheese Fat cheese - Not further defined Low-fat cheese - Not further defined Butter Butter Low-fat dairy Low-fat dairy
by guest on July 11, 2018http://jaha.ahajournals.org/
Dow
nloaded from
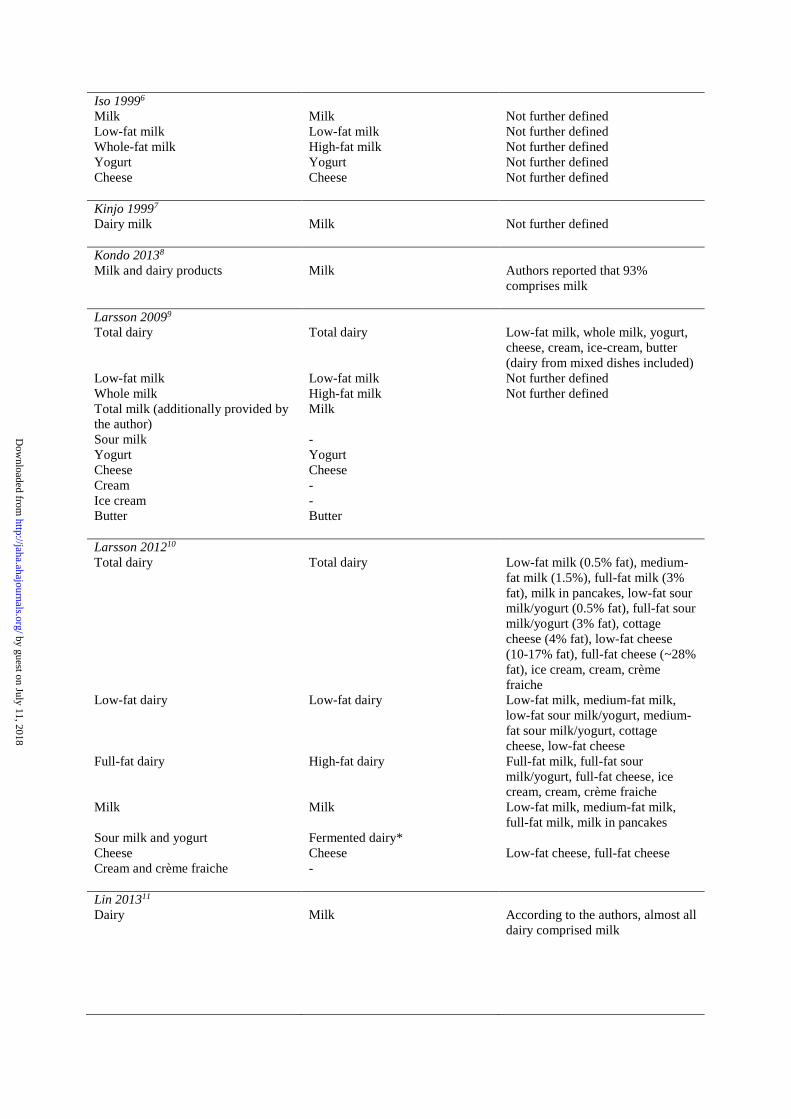
Iso 19996 Milk Milk Not further defined Low-fat milk Low-fat milk Not further defined Whole-fat milk High-fat milk Not further defined Yogurt Yogurt Not further defined Cheese Cheese Not further defined Kinjo 19997 Dairy milk Milk Not further defined Kondo 20138 Milk and dairy products Milk Authors reported that 93%
comprises milk Larsson 20099 Total dairy Total dairy Low-fat milk, whole milk, yogurt,
cheese, cream, ice-cream, butter (dairy from mixed dishes included)
Low-fat milk Low-fat milk Not further defined Whole milk High-fat milk Not further defined Total milk (additionally provided by the author)
Milk
Sour milk - Yogurt Yogurt Cheese Cheese Cream - Ice cream - Butter Butter Larsson 201210 Total dairy Total dairy Low-fat milk (0.5% fat), medium-
fat milk (1.5%), full-fat milk (3% fat), milk in pancakes, low-fat sour milk/yogurt (0.5% fat), full-fat sour milk/yogurt (3% fat), cottage cheese (4% fat), low-fat cheese (10-17% fat), full-fat cheese (~28% fat), ice cream, cream, crème fraiche
Low-fat dairy Low-fat dairy Low-fat milk, medium-fat milk, low-fat sour milk/yogurt, medium-fat sour milk/yogurt, cottage cheese, low-fat cheese
Full-fat dairy High-fat dairy Full-fat milk, full-fat sour milk/yogurt, full-fat cheese, ice cream, cream, crème fraiche
Milk Milk Low-fat milk, medium-fat milk, full-fat milk, milk in pancakes
Sour milk and yogurt Fermented dairy* Cheese Cheese Low-fat cheese, full-fat cheese Cream and crème fraiche - Lin 201311 Dairy Milk According to the authors, almost all
dairy comprised milk
by guest on July 11, 2018http://jaha.ahajournals.org/
Dow
nloaded from
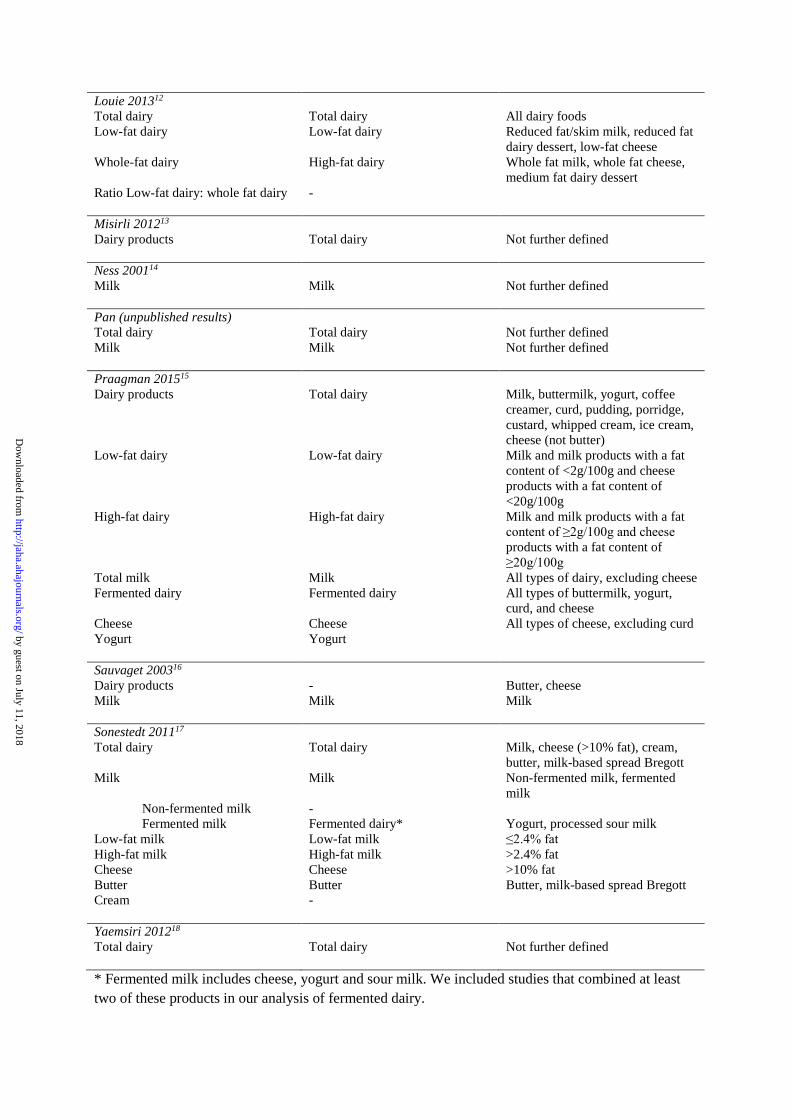
Louie 201312 Total dairy Total dairy All dairy foods Low-fat dairy Low-fat dairy Reduced fat/skim milk, reduced fat
dairy dessert, low-fat cheese Whole-fat dairy High-fat dairy Whole fat milk, whole fat cheese,
medium fat dairy dessert Ratio Low-fat dairy: whole fat dairy - Misirli 201213 Dairy products Total dairy Not further defined Ness 200114 Milk Milk Not further defined Pan (unpublished results) Total dairy Total dairy Not further defined Milk Milk Not further defined Praagman 201515 Dairy products Total dairy Milk, buttermilk, yogurt, coffee
creamer, curd, pudding, porridge, custard, whipped cream, ice cream, cheese (not butter)
Low-fat dairy Low-fat dairy Milk and milk products with a fat content of <2g/100g and cheese products with a fat content of <20g/100g
High-fat dairy High-fat dairy Milk and milk products with a fat content of ≥2g/100g and cheese products with a fat content of ≥20g/100g
Total milk Milk All types of dairy, excluding cheese Fermented dairy Fermented dairy All types of buttermilk, yogurt,
curd, and cheese Cheese Cheese All types of cheese, excluding curd Yogurt Yogurt Sauvaget 200316 Dairy products - Butter, cheese Milk Milk Milk Sonestedt 201117 Total dairy Total dairy Milk, cheese (>10% fat), cream,
butter, milk-based spread Bregott Milk Milk Non-fermented milk, fermented
milk Non-fermented milk - Fermented milk Fermented dairy* Yogurt, processed sour milk Low-fat milk Low-fat milk ≤2.4% fat High-fat milk High-fat milk >2.4% fat Cheese Cheese >10% fat Butter Butter Butter, milk-based spread Bregott Cream - Yaemsiri 201218 Total dairy Total dairy Not further defined * Fermented milk includes cheese, yogurt and sour milk. We included studies that combined at least two of these products in our analysis of fermented dairy.
by guest on July 11, 2018http://jaha.ahajournals.org/
Dow
nloaded from
References 1. Stroup DF, Berlin JA, Morton SC, Olkin I, Williamson GD, Rennie D, Moher D, Becker BJ, Sipe TA, Thacker SB. Meta-analysis of observational studies in epidemiology: a proposal for reporting. Meta-analysis Of Observational Studies in Epidemiology (MOOSE) group. JAMA. 2000;283:2008-2012. 2. Bernstein AM, Pan A, Rexrode KM, Stampfer M, Hu FB, Mozaffarian D, Willett WC. Dietary protein sources and the risk of stroke in men and women. Stroke. 2012;43:637-644. 3. Dalmeijer GW, Struijk EA, van der Schouw YT, Soedamah-Muthu SS, Verschuren WM, Boer JM, Geleijnse JM, Beulens JW. Dairy intake and coronary heart disease or stroke-A population-based cohort study. Int J Cardiol. 2012;167:925-929. 4. Elwood PC, Pickering JE, Fehily AM, Hughes J, Ness AR. Milk drinking, ischaemic heart disease and ischaemic stroke I. Evidence from the Caerphilly cohort. Eur J Clin Nutr. 2004;58:711-717. 5. Goldbohm RA, Chorus AM, Galindo Garre F, Schouten LJ, van den Brandt PA. Dairy consumption and 10-y total and cardiovascular mortality: a prospective cohort study in the Netherlands. Am J Clin Nutr. 2011;93:615-627. 6. Iso H, Stampfer MJ, Manson JE, Rexrode K, Hennekens CH, Colditz GA, Speizer FE, Willett WC. Prospective study of calcium, potassium, and magnesium intake and risk of stroke in women. Stroke. 1999;30:1772-1779. 7. Kinjo Y, Beral V, Akiba S, Key T, Mizuno S, Appleby P, Yamaguchi N, Watanabe S, Doll R. Possible protective effect of milk, meat and fish for cerebrovascular disease mortality in Japan. J Epidemiol. 1999;9:268-274. 8. Kondo I, Ojima T, Nakamura M, Hayasaka S, Hozawa A, Saitoh S, Ohnishi H, Akasaka H, Hayakawa T, Murakami Y, Okuda N, Miura K, Okayama A, Ueshima H, Group NDR. Consumption of dairy products and death from cardiovascular disease in the Japanese general population: the NIPPON DATA80. J Epidemiol. 2013;23:47-54. 9. Larsson SC, Mannisto S, Virtanen MJ, Kontto J, Albanes D, Virtamo J. Dairy foods and risk of stroke. Epidemiology. 2009;20:355-360. 10. Larsson SC, Virtamo J, Wolk A. Dairy consumption and risk of stroke in Swedish women and men. Stroke. 2012;43:1775-1780. 11. Lin PH, Yeh WT, Svetkey LP, Chuang SY, Chang YC, Wang C, Pan WH. Dietary intakes consistent with the DASH dietary pattern reduce blood pressure increase with age and risk for stroke in a Chinese population. Asia Pac J Clin Nutr. 2013;22:482-491. 12. Louie JC, Flood VM, Burlutsky G, Rangan AM, Gill TP, Mitchell P. Dairy consumption and the risk of 15-year cardiovascular disease mortality in a cohort of older Australians. Nutrients. 2013;5:441-454. 13. Misirli G, Benetou V, Lagiou P, Bamia C, Trichopoulos D, Trichopoulou A. Relation of the traditional Mediterranean diet to cerebrovascular disease in a Mediterranean population. Am J Epidemiol. 2012;176:1185-1192. 14. Ness AR, Smith GD, Hart C. Milk, coronary heart disease and mortality. J Epidemiol Community Health. 2001;55:379-382. 15. Praagman J, Franco OH, Ikram MA, Soedamah-Muthu SS, Engberink MF, van Rooij FJ, Hofman A, Geleijnse JM. Dairy products and the risk of stroke and coronary heart disease: the Rotterdam Study. Eur J Nutr. 2015;54:981-990. 16. Sauvaget C, Nagano J, Allen N, Grant EJ, Beral V. Intake of animal products and stroke mortality in the Hiroshima/Nagasaki Life Span Study. Int J Epidemiol. 2003;32:536-543. 17. Sonestedt E, Wirfalt E, Wallstrom P, Gullberg B, Orho-Melander M, Hedblad B. Dairy products and its association with incidence of cardiovascular disease: the Malmo diet and cancer cohort. Eur J Epidemiol. 2011;26:609-618. 18. Yaemsiri S, Sen S, Tinker L, Rosamond W, Wassertheil-Smoller S, He K. Trans fat, aspirin, and ischemic stroke in postmenopausal women. Ann Neurol. 2012;72:704-715.
by guest on July 11, 2018http://jaha.ahajournals.org/
Dow
nloaded from
Janette de Goede, Sabita S. Soedamah-Muthu, An Pan, Lieke Gijsbers and Johanna M. GeleijnseAnalysis of Prospective Cohort Studies−Meta
Response−Dairy Consumption and Risk of Stroke: A Systematic Review and Updated Dose
Online ISSN: 2047-9980 Dallas, TX 75231
is published by the American Heart Association, 7272 Greenville Avenue,Journal of the American Heart AssociationThe doi: 10.1161/JAHA.115.002787
2016;5:e002787; originally published May 20, 2016;J Am Heart Assoc.
http://jaha.ahajournals.org/content/5/5/e002787World Wide Web at:
The online version of this article, along with updated information and services, is located on the
for more information. http://jaha.ahajournals.orgAccess publication. Visit the Journal at
is an online only OpenJournal of the American Heart AssociationSubscriptions, Permissions, and Reprints: The
by guest on July 11, 2018http://jaha.ahajournals.org/
Dow
nloaded from